Impacts of Plastic in the Stone Town Harbor Area, Zanzibar
37
SIT Graduate Institute/SIT Study Abroad SIT Digital Collections Independent Study Project (ISP) Collection SIT Study Abroad Spring 2018 Let’s Talk Takataka: Impacts of Plastic in the Stone Town Harbor Area, Zanzibar CJ O’Brien SIT Study Abroad Follow this and additional works at: hps://digitalcollections.sit.edu/isp_collection Part of the African Studies Commons , Environmental Health and Protection Commons , and the Environmental Indicators and Impact Assessment Commons is Unpublished Paper is brought to you for free and open access by the SIT Study Abroad at SIT Digital Collections. It has been accepted for inclusion in Independent Study Project (ISP) Collection by an authorized administrator of SIT Digital Collections. For more information, please contact [email protected]. Recommended Citation O’Brien, CJ, "Let’s Talk Takataka: Impacts of Plastic in the Stone Town Harbor Area, Zanzibar" (2018). Independent Study Project (ISP) Collection. 2869. hps://digitalcollections.sit.edu/isp_collection/2869
-
Upload
khangminh22 -
Category
Documents
-
view
0 -
download
0
Transcript of Impacts of Plastic in the Stone Town Harbor Area, Zanzibar

SIT Graduate Institute/SIT Study AbroadSIT Digital Collections
Independent Study Project (ISP) Collection SIT Study Abroad
Spring 2018
Let’s Talk Takataka: Impacts of Plastic in the StoneTown Harbor Area, ZanzibarCJ O’BrienSIT Study Abroad
Follow this and additional works at: https://digitalcollections.sit.edu/isp_collection
Part of the African Studies Commons, Environmental Health and Protection Commons, and theEnvironmental Indicators and Impact Assessment Commons
This Unpublished Paper is brought to you for free and open access by the SIT Study Abroad at SIT Digital Collections. It has been accepted forinclusion in Independent Study Project (ISP) Collection by an authorized administrator of SIT Digital Collections. For more information, pleasecontact [email protected].
Recommended CitationO’Brien, CJ, "Let’s Talk Takataka: Impacts of Plastic in the Stone Town Harbor Area, Zanzibar" (2018). Independent Study Project(ISP) Collection. 2869.https://digitalcollections.sit.edu/isp_collection/2869

Let’s Talk Takataka:
Impacts of Plastic in the Stone Town Harbor Area, Zanzibar CJ O’Brien
Advisor: Dr. Narriman Jiddawi
Secondary Advisor: Barnabas Tarimo
Academic Director: Dr. Richard Walz
California Lutheran University
SIT Tanzania-Zanzibar, Spring 2018

2
Acknowledgements
This study could not have been completed without the help of many integral people. I
would like to thank those from the Institute of Marine Sciences, including Barnabas Tarimo, for
providing a plankton net, helping me to master plankton net methodologies and lab work, and for
serving as a mentor throughout this process. I want to thank Frank Jandiwa for assisting me in
lifting the heavy net from the sea and for providing encouragement for my project. I want to
thank Dr. Narriman for arranging plankton net use and advice as well as scientific expertise. I
want to thank my trusty research vessel “Mr. Bean”, owned by Miller and captained by Kassim,
for being reliable boat transportation. I would also like to thank Justin Mado with Zanrec Plastics
Limited, for allowing me to meet with him. I want to thank the SIT staff for their immense
support and for providing equipment and standing with me while I conducted beach surveys, and
giving advice, including Richard, Said, Zuleikha, and Ali. I also want to thank my fellow
classmates for their positivity and for our group message “chapati sisters” for making me laugh
during ISP. Lastly, I want to thank my parents because without them study abroad would not
have be possible.

3
Table of Contents: Abstract 1.0 Introduction 5 2.0 Background 6
2.1 What is plastic? 6 2.2 Plastic in Coastal Countries 6 2.3 Waste Management in Zanzibar 7 2.4 Plastic Pollution in the Stone Town Harbor Area 7 2.5 Wind Patterns/Ocean Surface Currents in Stone Town Harbor area 8 2.6 Study Area 8
2.7 Sites of Microplastic Sampling in the Aquatic Space of Harbor 9 2.8 Sites of Plastic Sampling in the Terrestrial Space of the Harbor 10 3.0 Methodology 12
3.1 Micro-plastic Sampling in the Aquatic Space of the Harbor 12 3.2 Micro-plastic Quantification 14 3.3 Plastic Sampling in the Terrestrial Space of the Harbor 14
4.0 Results 15 4.1 Micro-plastic Sampling in the Aquatic Space of the Harbor 15
4.2 Plastic Sampling in the Terrestrial Space of the Harbor 19 5.0 Discussion 22
5.1 Micro-plastic Sampling in the Aquatic Space of the Harbor 23 5.2 Plastic Sampling in the Terrestrial Space of the Harbor 25 5.3 Zanrecs Plastics Ltd. Interview 27 5.4 Study Limitations 29
6.0 Conclusion 30 7.0 Recommendations 31 7.1 Future Study Recommendations 31
7.2 Recommendations for Stone Town Harbor Area 32 7.3 Recommendations for Individuals 33

4
Abstract:
Plastic pollution has become an anthropogenic crisis worldwide. In the Stone Town Harbor area in particular, consumerism, population growth, tourism and a deficient municipal waste management system contribute to alarming amounts of mismanaged plastic that enter the ocean. This is devastating for the diverse marine ecosystem that provides valuable resources to its flora and fauna and to it human inhabitants. In this study, micro-plastic at the sea surface as well as plastic on coastal beaches was quantified to determine the effects of plastic pollution in the area by use of a standard plankton net methodology. This study contributed to the first set of baseline information regarding plastic at this location. It was determined that there are approximately 172,061.01 micro-plastic floating particles at the sea surface in the Stone Town Harbor area. Micro-plastic was found in 94% of sea surface samples and plastic was found in 64.76% of coastal beach survey quadrats. Results suggest that the population size in this coastal environment is proportional to the micro- and macro-plastic abundance in the area. Furthermore, if the population of Stone Town limited single-use plastic, it would greatly mitigate plastic waste concentration, including by up to 43%. This study will contribute to plastic waste awareness as well as offer recommendations for more successful waste management strategies the help conserve the marine ecosystem.
Ufupisho Wa Utafiti:
Uchafuzi wa plastiki umekuwa ni mgogoro mkubwa duniani kote unaosabaishwa na mwanadamu. Katika eneo la bandari ya mji mkongwe Zanzibar kwa ujumla kuna matumizi ya plastiki, ongezeko ya idadi ya watu, utalii na mfumo wa usimamizi wa ukuanyaji wa taka taka wa manispaa unakabiliwa na change moto mbali mbali, na kutishia baadhi plastiki kuingia baharini. Hali hii ni mbaya kwa mazingira ya baharini na mfumo mzima wa ekologia ya bahari. Bahari ambayo hutoa rasilimali muhimu wanyama na mimea ya baharini. Katika utafiti huu, “micro-plastiki” za juu ya bahari pamoja na plastiki za fukweni zote zilifanyiwa uchunguzi ili kujua athari za platiki katika mazingira kwa kutumia net maulum (standard plankton net) Utafiti huu umechangia kwenye msingi mkuu wa utafiti wa taka taka za plastiki Zanzibar . Inakisiwa kuna takriban 172,061.01 chembechembe za plastiki zinazozunguka katika eneo la bandari ya mji mkongwe. Micro-plastiki (Plastiki ndogo ndogo) zilizopatikana katika utafiti huu mdogo ni asilimia 94 ya sampuli za uso wa bahari na plastiki ilipatikana katika fukwe za mwambao wa bahari ni asilimia 64.76 ya “quadrats” ya utafiti wa pwani ya pwani. Matokeo yanaonyesha kwamba ongezeko la idadi ya watu katika mazingira ya pwani ni yanaenda sambamba na wingi wa micro na macro-plastiki katika eneo hili. Zaidi ya hayo, ikiwa wakazi wa mji mkongwe watapunguza matumizi ya plastiki kwa mara moja tu (single use) ingeweza kupunguza kiwango cha taka taka za plastiki kwa asilimia 43, Utafiti huu utachangia kuongeza ufahamu wa taka ya plastiki pamoja na kutoa mapendekezo kwa mikakati ya ufanisi zaidi ya usimamizi wa taka kwa matumaini ya kuongeza uhifadhi wa ikologia ya baharini.

5
1.0 Introduction
Global plastic production is proportional to the overwhelming increase in population. While
plastic has become a ubiquitous resource due to its durability and convenience, it has caused an
environmental catastrophe. The lifespan of plastic is infinite and the degradation process is
gradual, therefore, making it a persistent pollutant of concern. Plastic waste is particularly
apparent in developing coastal countries where solid waste awareness and proper practice are
insufficient. “It was calculated that 4.8 to 12.7 million metric tons of waste entered the ocean
generated by coastal countries in 2010” (Jambeck et al. 2015). This study quantified marine
microplastics at the sea surface (top quarter meter of the water column) and assessed the effects
of plastic along the coast of Unguja, a part of the Zanzibar Archipelago. Being the first of its
kind, this study is significant because it provides baseline knowledge that will in turn promote
marine conservation and mindfulness about solid waste in the marine ecosystem.
The accumulation of mismanaged plastic waste leads to the high amount of plastic that enters
the marine habitat, which has detrimental socioeconomic and ecological impacts. Plastic varies
in size within the marine environment. However, small pieces or micro-plastic have are
understood to be devastating. Macro- and micro-plastics can introduce toxic chemicals from
additives, monomers, and other chemical by-products (Teuten et al, 2009) or can be ingested by
marine organisms or cause entanglement and death (Gall and Thompson 2015). These impacts
have negative implications for fisheries, eco-tourism, food production, and human livelihoods in
the harbor. Many studies have been conducted quantifying marine plastic debris, but little is
known about marine plastic abundance along East Africa’s coastline. This study evaluated the
degree of plastic presence in the Stone Town Harbor area.

6
2.0 Background
The story of plastic pollution worldwide is complex. The tale is horrific and the solution
remains a mystery. What began as a synthetic polymer produced for human convenience has
become a material over-produced due to population increase. In areas such as the Stone Town
harbor the lack of waste awareness and proper disposal practices only amplify plastic in the
environment. It is now coming to attention in the scientific community that plastic never fully
degrades, but only reduces over time. The resultant micro-plastic has serious socioeconomic and
environmental impacts. Prior to understanding the quantitative data on micro- and macro-plastic
in this study, the topic must be contextualized.
2.1 What is plastic?
Plastic has become an omnipresent resource due to its cost efficiency, convenience,
durability and high demand. Plastic is defined as a synthetic organic polymer produced by
polymerization of monomers extracted from gas or oil (Derraik, 2002). For the past 50 years,
plastic production has continued to increase; 299 million tons of plastic were produced in 2013
alone (Gourmelon, 2015). The heightened production of plastic has allowed high quantities of
macro-plastics (>5mm) and micro-plastics (<5mm) to accumulate in coastal and marine
environments.
2.2 Plastic in Coastal Countries
Nearly 10% of annual production of plastics ends-up in the oceans (Barnes et al., 2009).
Plastic enters the ocean in many ways including littering, discarded fishing gear, drainage,
sewage outfalls, and illegal dumping (MCS, 2005; cited in Browne, 2010). It was calculated that
275 million metric tons (MT) of plastic waste was generated in 192 coastal countries in 2010,
with 4.8 to 12.7 million (MT) entering the ocean (Jambeck et al., 2015:768). Since macro-

7
plastics cannot be completely degraded, they break down by UV radiation, chemical degradation,
wave mechanics, and grazing marine life (Sebille et al., 2015). Commonly found micro-plastics
include fragments from larger debris and nearly microscopic particles that are used in cleaning
products, plastic powders, pellets, and synthetic fibers from textiles (Browne et al., 2011).
2.3 Waste Management in Zanzibar
Zanzibar Municipality is the primary urban setting on Unguja island, with a population
of about 230,000 citizens. Stone Town in particular generates about “120 tons per day of solid
waste of which only 40% is collected for disposal by the municipality facilities” (ZMC,
2000b:21; cited in Mohammed, 2002:204). Although there is one formal landfill called “Kibele”,
its infrastructure is inadequate. The solid waste component in Zanzibar Municipality is primarily
“biodegradable organics (86%) followed by recyclable materials or plastics (4%)” (ZMC, 2013;
cited in Biubwa et al., 2014:8). Even though plastic waste is a miniscule component of the waste
produced, plastic litter is very apparent on the beaches and in the streets. The only initiative
taken on plastic pollution in Zanzibar is the ban of plastic bags which, if violated, could result in
a fine or jail time. The management process of waste is poor and there is only one private
recycling company (Zanrec Plastics, Limited) that initiates the separation of plastics as well as
recycling.
2.4 Plastic Pollution in the Stone Town Harbor Area
Plastic could have amplified negative ecological and economic effects on Zanzibar due
to the government and population’s high dependency on coastal ecosystems. The Zanzibar
Archipelago contains diverse ecosystems including coral reefs, mangroves, sea grass beds,
beaches, estuaries, rocky shores, and coastal forests (Khamis et al., 2017). Even though this area
is a home to rich natural resources, these habitats continue to be plagued with human

8
degradation. Assuming no waste management infrastructure improvements are implemented, the
cumulative quantity of plastic waste available to enter the marine environment from land is
predicted to increase by an order of magnitude in 2025 (Jambeck et al., 2015). Without healthy
coastal environments, tourism, fisheries, and other socioeconomic activities will be impacted.
Marine ecosystem services account for 30% of GDP, 77% of investment, and a large amount of
foreign exchange and employment (Jiddawi and Glenn-Marie, 2009). If no plastic management
is implemented on Zanzibar in the near future, natural resources as well as the economy will face
decline.
2.5 Wind Patterns in the Stone Town Harbor
The fate and transport of plastic marine debris is governed by poorly understood
geophysical processes, such as ocean mixing within the surface boundary layer (Kukulka et al.,
2012). To understand how plastics move it is important to understand wind patterns in the Stone
Town Harbor area. The region faces a clockwise wind system over the Indian Ocean from April
to September and reverses during southern summer months (November to March). In addition,
the wind system has an almost clockwise ocean current system that changes according to the
winds. Southeast monsoon winds are from April to October (Mahondo, 2011). They are usually
strong and predominantly southerly (Iverson et al., 1984).
2.6 Study Area
This study was conducted in the Stone Town Harbor area, off of the primary urban
setting on the west side of Unguja Island in the Zanzibar Archipelago. The study area is
illustrated in Figure 1. The Zanzibar Archipelago is approximately 32 kilometers off the coast of
Tanzania, East Africa and includes Unguja and Pemba Islands. This harbor area is framed by
Unguja and many small islands, including but not limited to Pange Sandbar, Bawe Island, and

9
Changuu Island. This is an area with heavy boat traffic for shipment of cargo, fishing, and
tourism.
2.7 Sites of Microplastic Sampling in the Aquatic Space of the Harbor
Marine micro-plastic samples were taken at five locations within the harbor area depicted
by Figure 2. The first site is located along the immediate western coast of Stone Town on Unguja
Island. This coast is home to a dense urban setting. The second site is located along the northern
coast of Pange Sandbar. Pange Sandbar is 4 km southwest of Stone Town with a length of 800
m. It runs east to west. The third site is along the east coast of Bawe Island. Bawe Island is 10
km west of Stone Town with a length of 1 km. The fourth site is along the southern coast of
Changuu Island. Changuu Island is located 5.6 km northwest of Stone Town with a length of
Figure 1. Map of the Stone Town Harbor Area including Stone Town, Pange Sandbar, Bawe Island, and Changuu Island.

10
800m. The fifth site is located in the middle of the harbor. This location provided information on
plastic that gathered in the middle of the harbor area.
2.8 Sites of Plastic Sampling in the Terrestrial Space of the Harbor
Terrestrial plastic observations were taken at three beaches within the harbor area to
serve as a supplemental information in the study. Each site was selected based on its high
population or high tourist activity. The first site includes the northern side of the Pange Sandbar
shown in Figure 3. Even though this sandbar has no permanent residents, tourist vendor’s set-up
tents daily that produce substantial plastic pollution. The second site, as illustrated in Figure 4, is
on the western side of Stone Town, Unguja Island located in front of Tembo Hotel. The third
site, also in Figure 4, is on the western side of Stone Town but nearer to Forodhani Park. Being
Figure 2. Map of micro-plastic GPS waypoints taken at the study site.

11
the primary urban setting, having high tourism, and weak waste management, these beaches have
substantial plastic pollution.
Figure 3. Map of GPS waypoint taken at the first terrestrial plastic sampling site on Pange Sandbar.
Figure 4. Map of GPS waypoints taken at the second and third terrestrial plastic sampling sites on two beaches in Stone Town.

12
3.0 Methodology
For this study, two primary methods were employed to analyze the impacts of plastic in
the Stone Town Harbor area. The first method comprised two-thirds of the project schedule: the
quantification of marine micro-plastics at the sea surface. The second component covered one-
third of the project schedule: visual surveys of plastic on Pange Sandbar and Stone Town’s
coastline. Both methods contributed to an overall view of the abundance of plastic in the harbor.
This study was conducted between April 5 to May 2, during the southeast monsoon season of
heavy rainfall.
3.1 Micro-plastic Sampling in the Aquatic Space of the Harbor
Micro-plastic samples were taken at the sea surface because “plastic items are usually
found at the sea surface or washed up on the shoreline” (Barnes et al, 2009). The sea surface in
this study includes the top quarter
meter of the water column. Most
micro-plastic marine debris is
measured at the sea surface by
surface-towing plankton nets. In
previous studies net mesh
ranged from 150 µm to 300 µm
(Sebille et al. 2015:3). Net tows are primarily conducted at the sea surface for between 15-60
minutes outside the vessel’s wake to avoid down welling debris (Erikson et al. 2014:3). To
remain consistent with standardized methods, a plankton net (150 µm) was used. The net length
was 2.5m long and the diameter of the mouth opening was 50cm.
For this study, the plankton net was towed 11m behind the boat, on the outside of a boat’s
Figure 5. Photograph of plankton net (150 µm) used for micro-plastic sampling. Photograph taken by CJ O’Brien.
13
wake for 20 minutes at approximately 4.8 km/h in a straight line covering an average of 3km
linearly. A GPS waypoint path was recorded. Three transects were completed at each of the
following locations: Pange Sandbar, Bawe Island, Changuu Island, and the middle of the harbor.
Six transects were completed along the Stone Town coastline. All near shore transects hugged
the coast, subsequently moving approximately 20 meters towards the interior of the harbor to at
transect 2 and transect 3. All transects were conducted during high tide so transects could be
taken close to shore without entangling the plankton net on coral. Once transects were
completed, the net’s contents were dumped from the net’s cup collecting apparatus and placed
into a small labeled container. This process was repeated for each site. tide, weather conditions,
flow rate, and other observations were recorded as well.
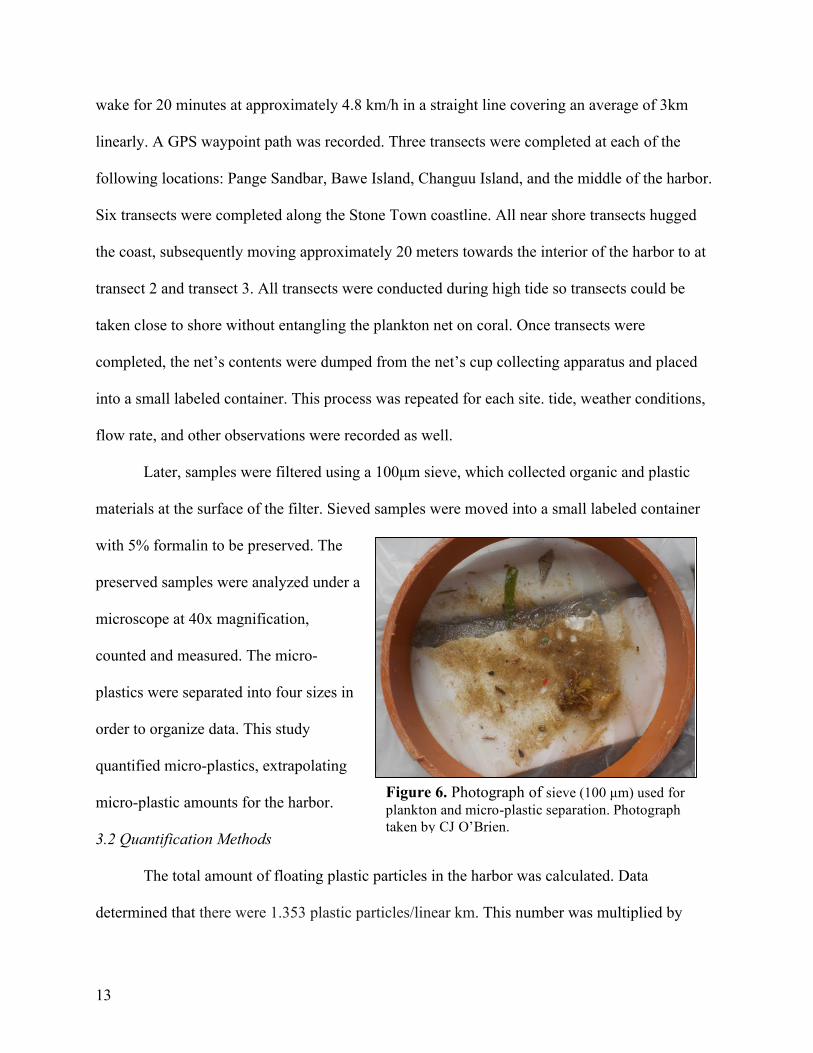
Later, samples were filtered using a 100µm sieve, which collected organic and plastic
materials at the surface of the filter. Sieved samples were moved into a small labeled container
with 5% formalin to be preserved. The
preserved samples were analyzed under a
microscope at 40x magnification,
counted and measured. The micro-
plastics were separated into four sizes in
order to organize data. This study
quantified micro-plastics, extrapolating
micro-plastic amounts for the harbor.
3.2 Quantification Methods
The total amount of floating plastic particles in the harbor was calculated. Data
determined that there were 1.353 plastic particles/linear km. This number was multiplied by
Figure 6. Photograph of sieve (100 µm) used for plankton and micro-plastic separation. Photograph taken by CJ O’Brien.

14
2000 to extrapolate km2 [net diameter (0.5m) determined transect width]. Thereafter, this
calculation was multiplied by the estimated harbor area:(πr2) = 63. 585km2. In total, it is
estimated that 172,061plastic particles are at the sea surface in the Stone Town Harbor area.
3.3 Plastic Sampling in the Terrestrial Space of the Harbor
Terrestrial visual plastic surveys were completed using standard line transects. Each
transect was deployed along the low, middle, and high tide lines of the site’s beach, where plastic
accumulates. All transects were conducted
during low tide. A 0.5 m square quadrat was
placed every 10m along the transect and
plastic presence and abundance was
determined. Plastics were counted,
measured, and their known uses recorded
(e.g. water bottle, clothing, or fork). The
plastic was separated into four size classes
to organize the data. The frequency of
plastic was quantified as well as its types.
Other observations, such as tide, weather
conditions, and human presence were also
recorded. This supplementary study
quantified plastic on human impacted islands. The total amount of plastics found on coastal
beaches was not extrapolated to the entire harbor coastline.
Figure 7. Photograph of quadrat (0.5m) used to quantify terrestrial plastic. Photograph taken by CJ O’Brien.
15
4.0 Results
Micro-plastic surveys produced quantitative data for overall floating plastic particle
estimations, while coastal terrestrial beach surveys produced supplementary data to strengthen
project interpretations. Additionally, the leader of an NGO seeking to reduce plastic waste in
Stone Town was interviewed to investigate potential plastic mitigation strategies. This interview
examined the challenges and successes. The three data sets contribute to a thorough preliminary
assessment of plastic in the Stone Town Harbor area.
4.1 Micro-plastic Sampling in the Aquatic Space of the Harbor
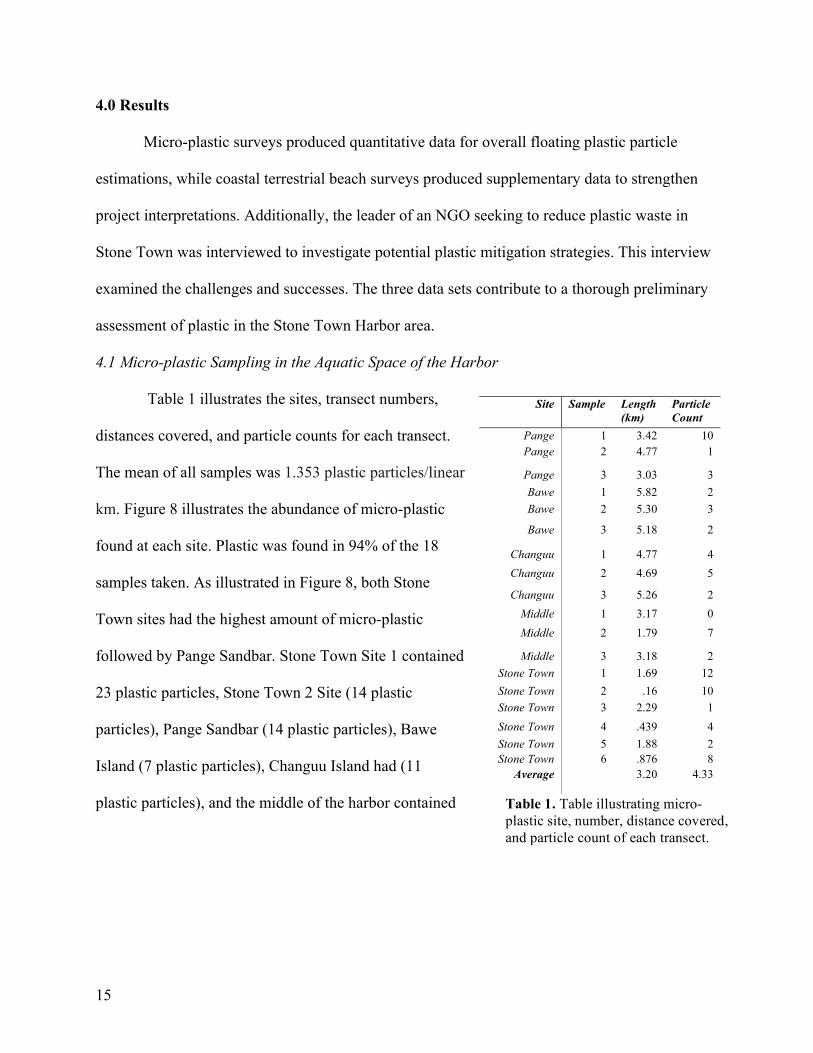
Table 1 illustrates the sites, transect numbers,
distances covered, and particle counts for each transect.
The mean of all samples was 1.353 plastic particles/linear
km. Figure 8 illustrates the abundance of micro-plastic
found at each site. Plastic was found in 94% of the 18
samples taken. As illustrated in Figure 8, both Stone
Town sites had the highest amount of micro-plastic
followed by Pange Sandbar. Stone Town Site 1 contained
23 plastic particles, Stone Town 2 Site (14 plastic
particles), Pange Sandbar (14 plastic particles), Bawe
Island (7 plastic particles), Changuu Island had (11
plastic particles), and the middle of the harbor contained
Site Sample Length (km)
Particle Count
Pange 1 3.42 10 Pange 2 4.77 1
Pange 3 3.03 3 Bawe 1 5.82 2 Bawe 2 5.30 3
Bawe 3 5.18 2
Changuu 1 4.77 4 Changuu 2 4.69 5
Changuu 3 5.26 2 Middle 1 3.17 0 Middle 2 1.79 7
Middle 3 3.18 2 Stone Town 1 1.69 12 Stone Town 2 .16 10 Stone Town 3 2.29 1 Stone Town 4 .439 4 Stone Town 5 1.88 2 Stone Town 6 .876 8
Average 3.20 4.33
Table 1. Table illustrating micro-plastic site, number, distance covered, and particle count of each transect.

16
9 plastic particles. Island (7 plastic particles), Changuu Island had (11 plastic particles), and the
middle of the harbor contained 9 plastic particles.
Figure 9 illustrates the size class distribution of plastic particles collected. Sizes ranged
from <0mm to >5.1mm. The size class ranging from 2mm-5.1mm was highest in abundance
(35%) followed by nearly microscopic plastic ranging from <0mm-0.5mm (27%). Particles
greater than 5mm considered macro-plastics consisted of 20% of plastics found, subsequently
particles ranging from 0.51mm-1.99mm consisted of 18%.
Figure 8. Color coated map illustrating micro-plastic abundance at each site.

17
A. B.
C. D.
<0mm-0.5mm27%
0.51mm-1.99mm
18%
2mm-5.1mm35%
>5.1mm20%
Size Distribution
<0mm-0.5mm 0.51mm-1.99mm 2mm-5.1mm >5.1mm
Figure 9. Graph illustrating size class distribution of micro-plastic particles found at the sea surface.
Table 2. Table illustrating various plastic particles under the microscope (40x magnification). A (2mm), B (0.5mm), C (1.8mm), D (4.1mm). Photographs taken by CJ O’Brien.

18
Table 2 illustrates various plastic sizes under the microscope. While some were
determined to be macro-plastics, most were micro-plastics. Pictures A, B, and D are plastic
fragments, while C is a fragment of plastic rope material.
Figure 10 illustrates the abundance of plastic in correlation to proximity of land in
samples. The samples taken in the middle of the harbor are not represented in from this figure
because no landmass was in proximity. Plastics that accumulated close to land consisted of
46.38%, 30.43% accumulated mid-distance from land, and 23.19% accumulated far from land.
Although a small sample size and lack of normal curve prevented a t-test, the bar graph indicates
a meaningful variance. There was a noteworthy difference in plastic abundance from samples
0.00%
10.00%
20.00%
30.00%
40.00%
50.00%
60.00%
70.00%
Close Mid Far
Perc
enta
ge
Proximity to Land
Proximity to Land
Figure 10. Graph illustrating the abundance of plastic in correlation with proximity to land. (+/- standard error bars are included)

19
close to land and samples mid-distance. However, there was an even greater difference of plastic
abundance in samples close to land compared to those farthest from land.
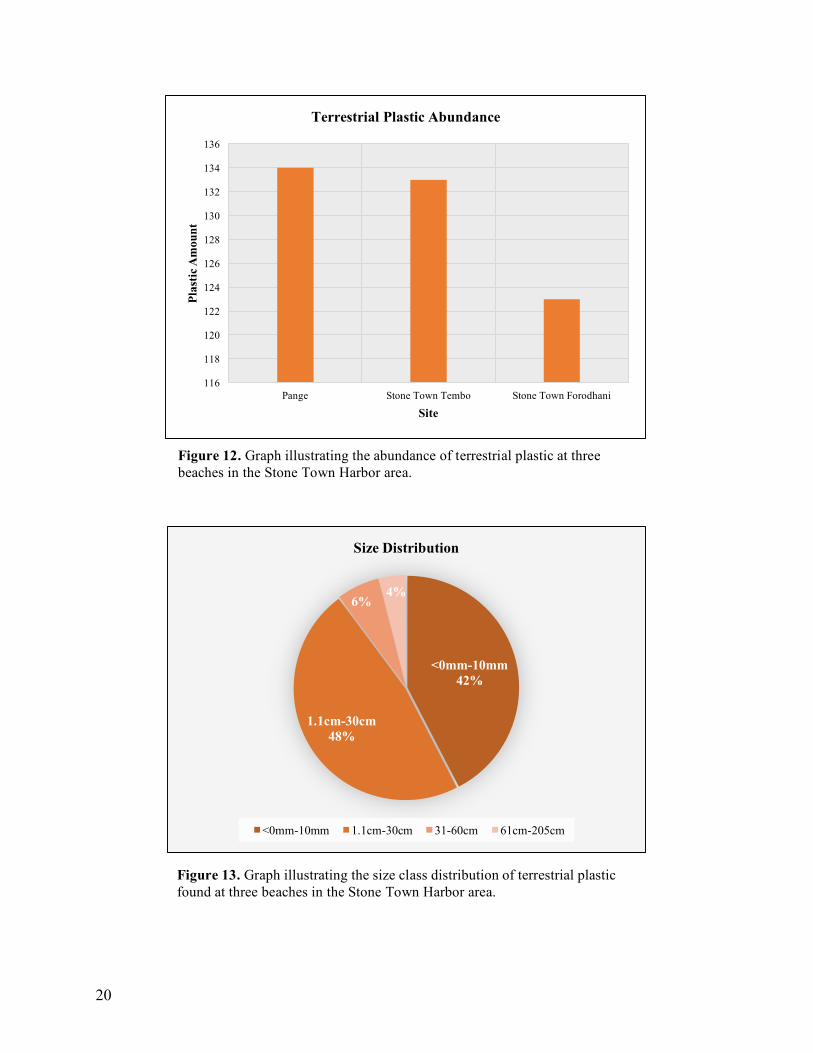
4.2 Plastic Sampling in the Terrestrial Space of the Harbor
Figure 12 illustrates the abundance of plastic at each site. Plastic was found in 100% of
sites but found in 64.76% of the 210 quadrats surveyed. As illustrated by figure 12, Pange
Sandbar and Stone Town Tembo site showed the greatest plastic pollution in terms of number of
pieces of plastic. Pange Sandbar contained 134 plastic particles, Stone Town Tembo site
contained 133 plastic particles, and Stone Town Forodhani site contained 123 plastic particles.
Figure 11. Photograph illustrating micro-plastic particles taken from the Stone Town Harbor area. Photograph taken by CJ O’Brien.
20
116
118
120
122
124
126
128
130
132
134
136
Pange Stone Town Tembo Stone Town Forodhani
Plas
tic
Am
ount
Site
Terrestrial Plastic Abundance
Figure 12. Graph illustrating the abundance of terrestrial plastic at three beaches in the Stone Town Harbor area.
<0mm-10mm42%
1.1cm-30cm48%
6%4%
Size Distribution
<0mm-10mm 1.1cm-30cm 31-60cm 61cm-205cm
Figure 13. Graph illustrating the size class distribution of terrestrial plastic found at three beaches in the Stone Town Harbor area.

21
Figure 13 illustrates the size class distribution of plastic particles collected. Sizes ranged
from <0mm-205cm including both micro-plastic and macro-plastic. The micro-plastic and small
macro-plastic size classes (<0mm-10mm and 1.1cm-30cm) were in highest abundance with 42%
and 48%, respectively. The large size classes (31-60cm and 61-205cm) yielded fewer plastics:
6% and 4%, respectively.
Figure 14 illustrates 26 specific categories, broken down into six classes.: Styrofoam
(33.19%), food/drink packaging (27.23%), fishing gear (22.13%), household items (9.36%),
plastic utensils (5.11%), and miscellaneous (2.98%). Figure 15 illustrates a comparison of single-
use to non-single-use items. The total amount of plastic within the three sites included 388
33%
5%
27%
10%
22%
3%
Plastic Characterization
Styrofoam Plastic utensils
Food/Drink Packaging Household items
Fishing Gear Miscellaneous
43.04%
56.19%
0.00%
10.00%
20.00%
30.00%
40.00%
50.00%
60.00%
Single-Use Non Single-Use
Single-Use vs. Non Single-Use
Figure 14. Graph illustrating the commonly found plastic types separated into six classes.
Figure 15. Graph comparing single-use and non-single-use plastic items.

22
plastic pieces, from which 170 single-use items were found. Single-use items constituted 43.81%
of plastic found, while non-single-use items comprised 56.19% of plastic found.
5.0 Discussion
This is the first study to quantify plastic in the Stone Town Harbor area. It is clear that
current waste management practices are insufficient. In support of hypotheses, data show a
consistent presence of plastic pollution in both marine and coastal environments. Micro-plastic
Figure 16. Photographs illustrating the three beaches surveyed. Left to right: Stone Town Forodhani Site, Stone Town Tembo
Site, and Pange Sandbar Site. Photographs taken by CJ O’Brien.

23
was found in 94% of sea surface samples and plastic was found in 64.76% of coastal beach
survey quadrats. There are many explanations for why an overwhelming amount of plastic
pollution concentrates in this area.
5.1 Micro-plastic Sampling in the Aquatic Space of the Harbor
It is calculated that there are 172,061 floating plastic particles at the sea surface in the
Stone Town Harbor area. However, this may be an underestimate due to many geophysical
factors, to wit: “Wind-driven mixing of the surface layer will drive particles downward, which
causes underestimations of plastic in the ocean if relying on surface sampling only.” (Erikson,
Marcus, et al. 2014). While it is only an estimation, the data show the magnitude of micro-plastic
presence and impact in this marine ecosystem. This many particles in the water column could
have serious health impacts on marine species in the area. Micro-plastic will only proliferate if
the population continues to increase without a change in disposal practices. In general, the
projected population in the municipality is 2.9 million by 2025 with municipal solid waste
generation per capita of 0.55kg/capita/day (World Bank, 2012 cited in Achankeng, 2003).
Micro-plastic has been thoroughly studied in recent years and the repercussions of its
effects are coming to the attention of states and citizens. It is known that plastic never fully
degrades. In fact, it only increases in influence due to “UV radiation, chemical degradation, wave
mechanics, and grazing marine life” (Sebille et al. 2015). The size class data in this study suggest
that most of the plastic within the harbor has been degraded. The size class that ranges from
2mm-5.1mm was in highest abundance (35%) followed by nearly microscopic plastic that ranges
from <0mm-0.5mm (27%). If the majority of plastic in the harbor is nearly microscopic, then
marine creatures are susceptible to ingesting plastics. Marine birds, mammals, invertebrates, and

24
fish species are all vulnerable to this pollutant. Plastic causes negative socioeconomic impacts as
well. If the marine animals consume plastic, so will humans that consume these resources. This
will in turn effect the livelihoods of artisanal fisherman and limit food resources for people who
rely on the harbor. Micro-plastic has become a “silent killer” due to its poorly known presence
(lack of visibility) and lethal effects.
Observations show that the most heavily populated sites had the highest micro-plastic
concentrations. Stone Town, with a population of about 100,000 people and about 300,000
foreign visitors a year, is the primary contributor to pollutants in the harbor area. Pange Sandbar
is the site with third highest concentration of plastics. Tourist vendors frequent the sandbar daily
providing guests with meals that use plastic utensils. Subsequently, Changuu Island, the site with
fourth highest concentration has a hotel, restaurant, and a tortoise exhibit that bring an influx of
visitors. The sites with lower plastic concentrations included Bawe Island and the middle of the
harbor. Bawe Island is a small island with few permanent residents. The data support the
hypothesis that human impacts are the leading causes of micro-plastic accumulation. Population
size in this coastal environment is proportional to the micro-plastic abundance in a localized
area.
While plastics are known to travel across the world’s oceans eventually aggregating in
ocean gyres, the plastic in the harbor area congregates near landmasses. It is believed that plastic
traveled using the SE monsoon winds and eventually stopped at a landmass. This projection is
supported by consistent high concentrations of plastics at landmasses. This is apparent in transect
1 at both Pange and Stone Town 1 sites, which contain 10 and 12 plastic particles, respectively.
Additionally, comparative analysis shows a difference between plastic abundance samples near
landmasses and those samples far from landmasses. Even though small sample size and lack of a

25
normal curve prevented a t-test, the bar graph (Figure 10) indicates a meaningful variance:
46.38% of plastics accumulated close to land, 30.43% accumulated mid-distance from land, and
23.19% accumulated far from land.
A previous SIT student studied water quality in Stone Town, “the fact that all of the
samples’ ENT means greatly exceeded 104 cfu/100 mL clearly demonstrates that Stone Town’s
waters are highly polluted and should not be used for recreational purposes.” While this
predominantly tested a sewage contamination, the results could have been influenced by high
plastic pollution that emitted toxins.
In addition, tide influxes could contribute to plastic movement within the harbor. Low
tide could cause plastic to accumulate toward the middle of the harbor, while high tide produces
plastic spread out along landmass edges. Since all of the samples were taken at high tide, this
could pose an important future study question.
An alternative conclusion, is that micro-plastic travels to the Stone Town harbor area
from other highly populated areas, such as Dar es Salaam especially during SE Monsoon winds
that flow south to north. It is more likely; however, that plastic would flow from Dar es Salaam
to southern Pemba. However, with a population of 4,364,541 it is likely that plastic waste from
Dar es Salaam also impacts Stone Town harbor. Plastic movement is determined by many
geophysical factors and it is not accurate to assume that no plastic in the harbor area is arriving
via alternative areas.
5.2 Plastic Sampling in the Terrestrial Space of the Harbor
Coastal terrestrial surveys showed a total of 390 plastic pieces. Plastic was found at 100%
of sites, but found in 64.76% of the 210 quadrats surveyed. These surveys were taken as
supplementary data to further prove micro-plastic hypotheses. Data show that highly populated

26
areas contain high plastic pollution. Pange Sandbar produced 134 pieces, Stone Town Tembo
site 133 pieces, and Stone Town Forodhani 123 pieces.
Although Pange Sandbar is not an island with permanent residents, data show that the
human impact is great at this location. Tides and weather conditions greatly impact plastic
presence on the sandbar. On days with high wind, plastic was scarce and during high tide, the
sandbar nearly vanished. This supports the hypotheses that pollution directly enters the ocean
due to poor plastic disposal. If citizens leave waste on the sandbar without returning it to Stone
Town, the waste will enter the ocean. This further explains why Pange Sandbar had such high
micro-plastic concentrations.
It is apparent from the coastal terrestrial surveys that Stone Town is plagued with plastic
pollution. Stone Town is the most heavily polluted area within the harbor. From observations, it
is theorized that there is a lack of awareness and lack of proper practices to prevent plastic
pollution. This supports the hypotheses that pollution is directly entering the ocean due to lack of
appropriate plastic disposal. If citizens and tourists litter or improperly dumb waste, it directly
enters the ocean or accumulates in urban areas.
The size class data taken on coastal beaches suggests that most of the plastics within the
harbor have been degraded. In agreement with micro-plastic data, the small size classes produced
the highest plastic concentrations. The micro-plastic and small macro-plastic size classes
(<0mm-10mm and 1.1cm-30cm) were in highest abundance: 42% and 48%, respectively.
Similarly, plastic fragments (unidentified pieces) were the most frequent category found on
coastal beaches. Fragments accounted for 48.07% of the total plastic types. Data show that large
plastic pollution is not being recycled but instead broken down into smaller plastic pieces.

27
Coastal terrestrial beach surveys were unique in that they illustrated the abundance of
specific plastic types. The known plastic usage was recorded for each plastic piece found. There
were 26 specific categories, broken down into six classes. Plastic fragments were omitted from
this statistic due to the lack of specific use identification. Styrofoam accounted for 33.19% of
plastic data. It is known that Styrofoam products never biodegrade and that the production
creates the largest carbon footprint among plastics. The high quantity of Styrofoam will increase
toxicity of coastal waters in the harbor area. Subsequently, food/drink packaging was the second
most common plastic type. If citizens and tourists reduced their use of packaged foods, it would
greatly mitigate plastic pollution, by up to 27% (based on findings). Similarly, eliminating plastic
utensils would reduce plastic waste by 5%. There are many steps that citizens and visitors could
implement to alleviate plastic abundance in Stone Town.
Single-use plastics are plastics that are only used once before being thrown away. These
items include plastic bags, straws, water bottles and most food packaging. The total amount of
plastic within the three sites included 388 plastic pieces and out of that total, 170 single-use
items were found. Single-use items in this study included plastic forks, plastic plates, plastic
bags, wrappers, bottle caps, plastic bottles, Styrofoam, plastic lollipop sticks, cap seals, and
plastic cups. Single-use items included 43.81% of plastics found while non single-use items
included 56.19% of plastics found. Based on data, if the population increased reusable items in
their everyday lives, it would eliminate plastic by 43.81%.
5.3 Zanrec Plastics Ltd. Interview
An interview with Zanrec Plastics Ltd was conducted on April 23. This interview was set
up by appointment with Justin Mado, an employee for the organization. Zanrec Plastics Ltd is a
private company that aims to introduce recycling education in Zanzibar and to reduce pollution

28
on the island. When asked about the source of the plastic pollution problem, Justin Mado
explained that it lies in weak infrastructure. The Zanzibar Municipality only works within Stone
Town and is overwhelmed by the amount of waste produced. He explained that most of the
plastic pollution comes from the tourism industry since local communities typically cannot
afford items such as filtered water in plastic water bottles.
Zanrec is doing the best it can to mitigate plastic waste, and claims to be the only
recycling center on the island. Zanrec trains hotels that become “Zanrec certified” on waste
separation techniques and in return acquires income through these contracts. Zanrec also reaches
out to local communities and villages. They visit schools to explain the importance of throwing
trash away properly and avoiding the use of plastic. They teach how to separate plastic, glass,
and organic waste so that there is no contamination. Once the waste is separated, it is brought to
a collection point where Zanrec gathers the trash to bring back to their facilities. However,
Zanrec faces many challenges. Their collection trucks are too expensive to reach Stone Town
and no formal landfills exist that are in close proximity. Zanrec works with 60 out of
approximately 400 hotels and 3 districts out of 11 total. At the moment, the transfer site does not
have electricity so the waste is bought by an agent who shreds the waste, and then sends the
recyclable materials to Dar es Salaam. This company feels as though its work has been
successful. Zanrec has noticed that informal dump sites in participating villages have decreased.
They plan to get electricity in the future so shredding can occur on site.
When asked about possible recommendations to reduce plastic waste, Justin Mado
explained that education as well as improved infrastructure is needed. He said that since most
people do not know about the longevity of plastic or how to separate waste, education programs

29
are needed so more people do their part. He explained that there should be more formal landfills,
different bins for separation, taxes on plastic products, and a fine for littering.
5.4 Study Limitations
Due to a short time period, methodology limitations, and weather there were many
influence that could have skewed results. Most microplastic studies state to tow the plankton net
on the side of the boat to avoid down welling debris. However, the type of boat used for this
study did not have an outrigger or pole to attach the rope to the side of the boat. Samples were
thus collected behind the boat. Although the net was positioned to the side of the wake while
being towed in the back, the results might have been improved if tows were done on the side.
The net used was picked due to accessibility. Some microplastic studies use mesh sizes as small
as 300µm. This study used a mesh size of 150µm, meaning that smaller particles could have
escaped the net while sampling. Additionally, GPS waypoints taken at micro-plastic sites could
have errors. Occasionally, waypoints were taken prematurely during times when the plankton net
was being set-up. This could produce transect lengths longer than estimated, impacting average
transect length data. This study was done using a standard microscope with no measuring scale
to measure microplastics less than 0mm. Instead, a size class was created for those objects too
small to measure. In addition, some microplastics could have been missed due to their extremely
small size which could have been seen with more advanced microscope equipment. Additionally,
this study was done during the rainy season which could contribute to the water logging floating
plastic, causing sinking to occur.

30
6.0 Conclusion
It is vital for the government and communities of Zanzibar that the coastal ecosystem
within the Stone Town harbor area is healthy for socioeconomic and ecological reasons.
Consequently, in a developing coastal city, such as Stone Town, where population,
consumerism, and urbanization continue to increase, so too will plastic pollution increase. An
absence of plastic waste awareness and proper mitigation strategies will cause mismanaged
plastic to directly enter the ocean in vast quantities. Once plastic enters the environment, it never
fully degrades, only decreasing in size. These small plastic particles or micro-plastics are a major
problem. If awareness about visible plastic is deficient, the dangers of pollutants that are unseen
is an environmental crisis. Micro-plastic could have negative implications for all marine life due
to involuntary ingestion. However, not only marine biota is unwillingly ingesting plastic. If
humans consume resources subjected to plastic, they become subjected as well. Nearly
microscopic contaminants could create a cascading relationship that damages fisheries, food
resources, eco-tourism and the livelihoods of people in the Stone Town Harbor area.
Based on quantitative data, there are approximately 172,061 floating micro-plastic
particles in the Stone Town Harbor area. Data shows a consistent presence of plastic pollution in
both marine and coastal environments. Micro-plastic was found in 94% of sea surface samples
and plastic was found in 64.76% of coastal beach survey quadrats. Furthermore, micro-plastic
was consistently found to accumulate in higher concentrations near landmasses. These data
indicate that plastic traveled via Southeast monsoon winds and eventually stopped when a
landmass was reached. However, there are many geophysical factors that govern how micro-
plastic travels in the ocean that were not assessed in detail in this study. Additionally, commonly
found plastic categories were analyzed, illustrating that eliminating single-use plastic would

31
decrease plastic in Stone Town by 43%. If proper waste separating strategies, recycling practices
and infrastructure development were implemented, plastic waste would diminish in the Stone
Town harbor area substantially. Nothing can be done without appropriate education. By
quantifying plastic amounts in the Stone Town harbor area this study provided crucial baseline
knowledge that will contribute to the conservation of natural resources and plastic waste
awareness.
7.0 Recommendations
The current plastic waste situation in the Stone Town Harbor area is deficient. In order
for plastic to be reduced, changes must be made. From observations, quantitative data, and
interviews with possible mitigation organizations, recommendations have been made. These
include future studies, recommendations for Stone Town Municipality, and recommendations for
individuals.
7.1 Future studies:
Since this study was a preliminary analysis, more baseline knowledge needs to be
completed in order to gain a more accurate depiction of plastic pollution in the harbor. Repeating
these methods during all tides, at more locations, and more transects may give a better
understanding of how plastic moves in the harbor and at what abundance. It would also be
crucial to perform this study during the dry season, in case water logged plastic caused
underestimations to be made. For more broad implications, this study could be performed on the
coast of Dar Es Salaam or southern Pemba to see how plastic is moving throughout the entirety
of the Zanzibar archipelago. Additionally, a holistic approach to marine debris is needed by
looking at microplastic effects of the physiology of marine life. This would include dissection of
fish species that are being consumed by the community, mussels used for aquaculture farms,

32
sponges used in sponge farms, and sea birds to analyze microplastic within their digestive tract
or tissues. For the future, these study recommendations would increase knowledge and raise
awareness of the negative impacts plastics have on marine life, thus causing negative impacts on
human health, economy, and resources.
7.2 Recommendations for Stone Town Harbor Area:
From my observations, plastic waste could be mitigated in Zanzibar by prioritizing,
educating, raising awareness, and getting started on proper infrastructure. Adding more waste
bins around Stone Town would be helpful. Sometimes waste bins are not seen for many
kilometers which in turn, promotes littering. Proper infrastructure requires money, which can be
collected by putting taxes on water bottles or other single-use plastic products. An example of
this would be to give 5% of water bottle revenue to create proper landfills, provide separation
bins, and hire waste management staff in the municipality. There could also be a fine for those
who litter in the streets instead of properly throwing trash away.
Education on proper separation techniques is crucial in the step towards recycling plastic
products. Bins given to communities labeled “plastic”, “organics”, and “glass” would help waste
collectors and recycling centers such as “Zanrec Plastics limited” dispose of plastics properly.
Since recycling centers are not easily accessible, using plastic to make alternative
resources is another way to mitigate plastic pollution. Organizations such as “Creative Solutions”
located in Mangapwani create art pieces and drinking cups from discard, while also providing
educational services about recycling. A fundi named Laurian Mchau, with “Windmill
Enterprises” in Dar Es Salaam, uses plastic buckets as pots to grow food resource crops in an
urban setting, plastic bottles to create water purification systems, and scrap metal to construct
windmills. A group at Mnarani Marine Turtle Conservation Pond uses plastic to create bricks for

33
building homes. Ideas like these implemented in Stone Town would help alleviate plastic
pollution. This problem can be addresses with innovation and approaches to sustainability. Waste
management as a whole must be thought of as an integrated problem that impacts the health of
natural systems as well as the people of Zanzibar. One overall initiative of importance would be
to “add waste management to the Integrated Coastal Area Management (ICAM) to provide the
best long-term plan and sustainable use of coastal resources without threatening its natural
environment through such adverse impacts as those posed by pollution” (Mohammed, 2002: 38).
It is known that while tourism adds to the economy in Stone Town, it also increases
the amount of plastic waste produced. Eco-tourism can be a successful business in the Stone
Town harbor area. If tourism companies were to capitalize on no-waste strategies, it could
potentially bring in more clients, thus increasing revenue. An example of this is Chumbe Island,
which successfully makes income from tourists who prioritize eco-friendly lodging. If hotels
worked hard to recycle plastic waste or become “Zanrec certified,” they could advertise this to
tourists who prefer sustainability. In regards to Pange Sandbar, tourism companies should not be
allowed to use plastic utensils to serve food on the island and instead should use reusable items.
This would show tourists the town’s commitment to sustainability while also decreasing plastic
on the sandbar. Education tents for tourists, explaining proper waste disposal could also be
implemented on beaches or sandbars throughout Stone Town.
7.3 Recommendations for Individuals:
Plastic waste can often times seem overwhelming. You may ask yourself, what can I do
individually to reduce plastic waste around the world? The main culprit of plastic waste is single-
use items such as straws, coffee cups, water bottles, and plastic bags. There are many steps that
you can take to reduce plastic waste. Politely refusing to use straws at restaurants is one strategy.

34
Using reusable water bottles, reusable mugs at coffee shops, or bringing reusable bags to the
grocery store reduces waste. You can also boycott micro-beads in beauty products by not using
them or educate your friends and family on the harm plastic has to the environment. Lastly, you
can recycle and participate in beach cleanups.

35
8.0 References:
Achankeng, Eric. "Globalization, urbanization and municipal solid waste management in Africa." Proceedings of the African Studies Association of Australasia and the Pacific 26th annual conference. 2003. Barnes, David KA, et al. "Accumulation and fragmentation of plastic debris in global environments." Philosophical Transactions of the Royal Society B: Biological Sciences 364.1526 (2009): 1985-1998. Biubwa, et al. “Municipal Solid Waste Management of Zanzibar: Current Practice, the Challenges and the Future.” International Journal of Current Research and Academic Review, no. 1, Oct. 2014, pp. 5–19. Browne, Mark Anthony, et al. "Accumulation of microplastic on shorelines worldwide: sources and sinks." Environmental science & technology 45.21 (2011): 9175-9179. Derraik, Jose GB. "The pollution of the marine environment by plastic debris: a review." Marine pollution bulletin 44.9 (2002): 842-852. Gall, S. C., and R. C. Thompson. "The impact of debris on marine life." Marine pollution bulletin 92.1-2 (2015): 170-179. Eriksen, Marcus, et al. "Plastic pollution in the world's oceans: more than 5 trillion plastic pieces weighing over 250,000 tons afloat at sea." PloS one 9.12 (2014): e111913. Gourmelon, Gaelle. "Global plastic production rises, recycling lags." New Worldwatch Institute analysis explores trends in global plastic consumption and recycling. Recuperado de http://www. worldwatch. org (2015). Jambeck, Jenna R., et al. "Plastic waste inputs from land into the ocean." Science 347.6223 (2015): 768-771. Kalin, Kajsa-Stina, and Johanna Skoog. "Assessment of the waste management system on Zanzibar-a case study on Jumbi landfill, Mwanakwerekwe dumpsite and Tunguu dumping area." LUTFD2/TFEM--12/5062--SE+(1-122) (2012). Khamis, Zukaria A., Risto Kalliola, and Niina Käyhkö. “Geographical characterization of the Zanzibar coastal zone and its management perspectives.” Ocean & Coastal Management 149 (2017): 116-134. Kukulka, T., et al. "The effect of wind mixing on the vertical distribution of buoyant plastic debris." Geophysical Research Letters 39.7 (2012).

36
Lange, Glenn-Marie, and Narriman Jiddawi. "Economic value of marine ecosystem services in Zanzibar: Implications for marine conservation and sustainable development." Ocean & Coastal Management 52.10 (2009): 521-532. Lopez, Socorro. "Pollution in Stone Town’s Coastal Waters: An Assessment of Environmental Influences on Fecal Contamination." (2014). Mohammed, S. M. "Pollution management in Zanzibar: the need for a new approach." Ocean & coastal management 45.4-5 (2002): 301-311. Teuten, Emma L., et al. "Transport and release of chemicals from plastics to the environment and to wildlife." Philosophical Transactions of the Royal Society of London B: Biological Sciences 364.1526 (2009): 2027-2045. Van Sebille, Erik, et al. "A global inventory of small floating plastic debris." Environmental Research Letters 10.12 (2015): 124006.
Zanzibar Sustainable Programme. Working Group Report: Water Supply, Waste Water, Flooding and Drainage, Zanzibar Municipality, 2000b. 21pp.


![1986-12-25 - Newport Harbor Ensign[Icon]](https://static.fdokumen.com/doc/165x107/631b1d25f6a8ee1ff700a4c5/1986-12-25-newport-harbor-ensignicon.jpg)