![1986-12-25 - Newport Harbor Ensign[Icon]](https://static.fdokumen.com/doc/165x107/631b1d25f6a8ee1ff700a4c5/1986-12-25-newport-harbor-ensignicon.jpg)
CITY OF OAK HARBOR
872
CITY OF OAK HARBOR ISLAND COUNTY, WASHINGTON WATER SYSTEM PLAN G&O #13404 SEPTEMBER 2014
-
Upload
khangminh22 -
Category
Documents
-
view
4 -
download
0
Transcript of CITY OF OAK HARBOR

CITY OF OAK HARBORISLAND COUNTY, WASHINGTON
WATER SYSTEM PLAN
G&O #13404SEPTEMBER 2014

CITY OF OAK HARBOR ISLAND COUNTY WASHINGTON
2013 WATER SYSTEM PLAN UPDATE
G&O #13404 SEPTEMBER 2014

i
TABLE OF CONTENTS EXECUTIVE SUMMARY CHAPTER 1 – DESCRIPTION OF WATER SYSTEM INTRODUCTION ................................................................................................................. 1-1 OWNERSHIP AND MANAGEMENT ...................................................................................... 1-1 SYSTEM HISTORY AND BACKGROUND .............................................................................. 1-2 EXISTING SYSTEM ............................................................................................................. 1-4
Service Area ......................................................................................................... 1-4 Retail Service Area .................................................................................. 1-4 Wholesale Service Area ........................................................................... 1-4 Future Service Area ................................................................................. 1-5
Transmission Mains ............................................................................................. 1-5 Water Source Supply ........................................................................................... 1-5
Primary Supply – City of Anacortes ........................................................ 1-5 Auxiliary Supply – Wells 8, 9 and 11 ...................................................... 1-6
Water Rights ........................................................................................................ 1-8 Water Service Agreement ........................................................................ 1-8
Reservoirs ............................................................................................................ 1-9 Eastside Reservoir .................................................................................... 1-9 Westside Reservoirs 1 and 2 .................................................................... 1-9 North Reservoir ........................................................................................ 1-9
Booster Stations ................................................................................................. 1-10 Ault Field Booster Station ..................................................................... 1-10 Heller Street Booster Station ................................................................. 1-11 Redwing Booster Station ....................................................................... 1-11
Pressure Zones ................................................................................................... 1-12 Pressure Reducing Valves.................................................................................. 1-14 Altitude Valves .................................................................................................. 1-14 Distribution System ........................................................................................... 1-14
GENERAL INFORMATION ................................................................................................. 1-15 Geographical Information .................................................................................. 1-15
Topography ............................................................................................ 1-15 Climate ................................................................................................... 1-16 Soil ......................................................................................................... 1-16 Sensitive Areas ....................................................................................... 1-17
SYSTEM INFORMATION ................................................................................................... 1-20 Interties .............................................................................................................. 1-20 Wholesale Customers......................................................................................... 1-20 Adjacent and Neighboring Purveyors ................................................................ 1-21
Bayview Estates Water Company .......................................................... 1-21 Bets Water System ................................................................................. 1-21 Crosswoods Water Company ................................................................. 1-22

ii
Evergreen Park ....................................................................................... 1-22 Fairway Estates, Inc. .............................................................................. 1-22 Fir Grove Mobile Park ........................................................................... 1-23 Forest Hills Park Community ................................................................ 1-23 Highland Trace Water Company, Inc. ................................................... 1-23 Hillcrest Village Water Company, Inc. .................................................. 1-23 Indian Ridge Water Company ............................................................... 1-24 Naval Air Station Whidbey Island ......................................................... 1-24 Parkwood Manor .................................................................................... 1-24 Pine Terrace Water Association ............................................................. 1-24 Suburban Hills Community Association ............................................... 1-25 Suburban Mobile Park ........................................................................... 1-25 Swantown Water District ....................................................................... 1-25 Valley High Park.................................................................................... 1-25 Waterloo Acres ...................................................................................... 1-26 West Ridge Water System ..................................................................... 1-26
Zoning and Land Use ......................................................................................... 1-27 RELATED PLANS AND DOCUMENTS ................................................................................ 1-32
Anacortes 2011 Water System Plan ................................................................... 1-32 Oak Harbor 2003 Water System Plan ................................................................ 1-32 Oak Harbor Comprehensive Plan ...................................................................... 1-32 Oak Harbor Municipal Code .............................................................................. 1-32 Island County Coordinated Water Supply Plan ................................................. 1-32 Island County Water Resource Management Plan ............................................ 1-33 Naval Air Station Whidbey Island Water System Plan ..................................... 1-33 City of Oak Harbor 2011 to 2016 Capital Improvement Plan ........................... 1-33 New Reservoir Project Predesign Report .......................................................... 1-33 Ault Field Booster Station Technical Memorandum ......................................... 1-34
SERVICE AREA POLICIES ................................................................................................. 1-34 DUTY TO SERVE .............................................................................................................. 1-37 SATELLITE MANAGEMENT .............................................................................................. 1-38 CONSUMER AND AGENCY INPUT ..................................................................................... 1-39
Regional Planning Consistency ......................................................................... 1-39 Local Agencies ................................................................................................... 1-39 Public Participation ............................................................................................ 1-39
CHAPTER 2 – BASIC PLANNING DATA INTRODUCTION ................................................................................................................. 2-1 HISTORICAL AND EXISTING SYSTEM INFORMATION .......................................................... 2-1
Population ............................................................................................................ 2-1 Service Connections ............................................................................................. 2-2
WATER PRODUCTION ........................................................................................................ 2-3 Average Day/Maximum Day Demand ................................................................ 2-5 Peak Hour Demand .............................................................................................. 2-6
WATER USE ...................................................................................................................... 2-7

iii
Water Consumption ............................................................................................. 2-7 Equivalent Residential Units ................................................................................ 2-9 Per Capita Demand ............................................................................................ 2-10 Distribution System Leakage ............................................................................. 2-11 Seasonal Variations ............................................................................................ 2-12 Large Water Users ............................................................................................. 2-13
PROJECTED SYSTEM INFORMATION ................................................................................ 2-14 Population .......................................................................................................... 2-14
SERVICE CONNECTIONS .................................................................................................. 2-16 WATER USE .................................................................................................................... 2-16
Water Consumption ........................................................................................... 2-16 Equivalent Residential Units .............................................................................. 2-18 Average Day/Maximum Day/Peak Hour Demand ............................................ 2-19
WATER PURCHASE AND WELL PRODUCTION .................................................................. 2-21 Source Information ............................................................................................ 2-21
CHAPTER 3 – SYSTEM ANALYSIS INTRODUCTION ................................................................................................................. 3-1 SYSTEM DESIGN STANDARDS ........................................................................................... 3-1 GENERAL FACILITY STANDARDS ...................................................................................... 3-1
Fire Flow .............................................................................................................. 3-3 WATER QUALITY STANDARDS AND ANALYSIS ................................................................. 3-4
Water Quality Standards ...................................................................................... 3-4 Testing Requirements .......................................................................................... 3-5 Bacteriological ..................................................................................................... 3-6 Inorganic Physical and Chemical Characteristics ................................................ 3-7 Volatile Organic Compounds and Synthetic Organic Compounds ..................... 3-8 Asbestos ............................................................................................................... 3-9 Lead and Copper ................................................................................................ 3-10 Radionuclides and Radon .................................................................................. 3-11 Disinfectants/Disinfection Byproducts (D/DBP) ............................................... 3-12 EPA Unregulated Contaminants ........................................................................ 3-12 Groundwater Rule .............................................................................................. 3-14 Fluoridation ........................................................................................................ 3-14 Chlorination ....................................................................................................... 3-14
WATER QUALITY MONITORING SCHEDULE .................................................................... 3-15 SYSTEM COMPONENT ANALYSIS .................................................................................... 3-16
Source of Supply Analysis ................................................................................. 3-16 Water Rights Analysis ....................................................................................... 3-16 Source Capacity Analysis .................................................................................. 3-16
Average Day Demand ............................................................................ 3-16 Maximum Day Demand ......................................................................... 3-19
Storage Analysis ................................................................................................ 3-21 Operational Storage ............................................................................... 3-21 Equalizing Storage ................................................................................. 3-22

iv
Standby Storage ..................................................................................... 3-23 Fire Suppression Storage ....................................................................... 3-24 Dead Storage .......................................................................................... 3-24
Booster Station Analysis .................................................................................... 3-25 Ault Field Booster Station ..................................................................... 3-26 Heller Street Booster Station ................................................................. 3-26 Redwing Booster Station ....................................................................... 3-27
Transmission Main and Distribution System Analysis ...................................... 3-28 SYSTEM DEFICIENCIES .................................................................................................... 3-29
Water Rights and Source of Supply ................................................................... 3-29 Storage ............................................................................................................... 3-29 Booster Stations ................................................................................................. 3-29 Distribution System ........................................................................................... 3-30 Treatment ........................................................................................................... 3-30
CHAPTER 4 – HYDRAULIC ANALYSIS INTRODUCTION ................................................................................................................. 4-1 HYDRAULIC MODELING PROGRAM ................................................................................... 4-1 MODEL LAYOUT AND CONSTRUCTION .............................................................................. 4-2
Source .................................................................................................................. 4-2 Service Domain .................................................................................................... 4-2 Storage ................................................................................................................. 4-2 Model Demands ................................................................................................... 4-3 Scenarios .............................................................................................................. 4-3
MODEL CALIBRATION ....................................................................................................... 4-3 MODEL SIMULATION AND RESULTS .................................................................................. 4-4
Peak Hour Demand .............................................................................................. 4-4 Available Fire Flow ............................................................................................. 4-4
SYSTEM RECOMMENDATIONS ........................................................................................... 4-7 CHAPTER 5 – WATER USE EFFICIENCY PROGRAM INTRODUCTION ................................................................................................................. 5-1 WATER USE EFFICIENCY................................................................................................... 5-1 PAST CONSERVATION PROGRAMS ..................................................................................... 5-2 PLANNING REQUIREMENTS ............................................................................................... 5-3
Data Collection and Reporting ............................................................................. 5-3 Demand Forecasting ............................................................................................ 5-4 Distribution System Leakage ............................................................................... 5-5
SELECTION AND EVALUATION OF WUE MEASURES ......................................................... 5-6 Goal 1: Maintain DSL Below 10 Percent ........................................................... 5-6 Goal 2: Maintain Single-Family Residential Use at or Below 64 gpcd .............. 5-6 Performance Monitoring ...................................................................................... 5-7 Water Use Efficiency Measures ........................................................................... 5-7 Mandatory Measures ............................................................................................ 5-7 Supplementary Measures ..................................................................................... 5-9

v
Implement Source Metering and Meter Calibration ................................ 5-7 Implement Service Metering and Meter Calibration ............................... 5-8 Implement Leak Detection and Water Accounting ................................. 5-8 Implement Customer Education .............................................................. 5-8 Evaluate and Implement Conservation Rate Structure ............................ 5-8 Evaluate Reclaimed Water Opportunities ................................................ 5-9
Supplementary Measures ..................................................................................... 5-9 Bills Showing Consumption History ....................................................... 5-9 Customer Leak Detection ........................................................................ 5-9 Purveyor Assistance ............................................................................... 5-10
Summary of WUE Measures ............................................................................. 5-10 WATER SAVINGS PROJECTIONS ....................................................................................... 5-10 CHAPTER 6 – SOURCE PROTECTION PROGRAM INTRODUCTION ................................................................................................................. 6-1 SUSCEPTIBILITY ASSESSMENT .......................................................................................... 6-2 WELLHEAD PROTECTION AREA DELINEATION .................................................................. 6-2
Method of Delineation ......................................................................................... 6-2 Calculated Fixed Radius Method ............................................................. 6-2 Analytical Models .................................................................................... 6-3 Numeric Method ...................................................................................... 6-3
Analysis................................................................................................................ 6-3 Well 8 ....................................................................................................... 6-3 Well 9 ....................................................................................................... 6-4 Well 11 ..................................................................................................... 6-4
CONTAMINANT SOURCE INVENTORY ................................................................................ 6-4 Potential Sources of Contamination ..................................................................... 6-4
Landfills ................................................................................................... 6-5 Commercial and Industrial Activity......................................................... 6-5 RCRA Generators .................................................................................... 6-6 Underground Storage Tanks .................................................................... 6-7 Confirmed or Suspected Contamination Sites ......................................... 6-8 Septic Systems ......................................................................................... 6-8 Improperly Sealed or Secured Wells ....................................................... 6-8 Accidental Spills ...................................................................................... 6-9
INVENTORY DATA SOURCES ............................................................................................. 6-9 SPILL/INCIDENT RESPONSE PROGRAM ............................................................................ 6-10 CONTINGENCY PLANNING ............................................................................................... 6-11 ACTIONS ......................................................................................................................... 6-12 CHAPTER 7 – OPERATION AND MAINTENANCE PROGRAM INTRODUCTION ................................................................................................................. 7-1 WATER SYSTEM MANAGEMENT AND PERSONNEL ............................................................ 7-1
Staffing.. ............................................................................................................... 7-1 Certification Requirements .................................................................................. 7-4

vi
Professional Growth............................................................................................. 7-5 WATER SYSTEM OPERATION AND CONTROL .................................................................... 7-5
Major System Components .................................................................................. 7-5 Source Operation and Control ................................................................. 7-6 Transmission Line Operation and Control ............................................... 7-7 Reservoir Operation and Control ............................................................. 7-7 Booster Station Operation and Control .................................................... 7-9 Distribution System Operation and Control .......................................... 7-11 Pressure Reducing Valve Operation and Control .................................. 7-11 Altitude Valve Operation and Control ................................................... 7-12
SAFETY PROGRAM .......................................................................................................... 7-12 RECORDKEEPING ............................................................................................................. 7-12
Maintenance ....................................................................................................... 7-12 Customer Complaints......................................................................................... 7-13
EXISTING WATER SYSTEM EQUIPMENT .......................................................................... 7-14 PREVENTIVE MAINTENANCE SCHEDULE ......................................................................... 7-14 EMERGENCY RESPONSE PROGRAM ................................................................................. 7-15
Emergency Phone Contacts ............................................................................... 7-16 Public Notification ............................................................................................. 7-17 Bacteriological Presence Detection Procedure .................................................. 7-18 IOC/VOC/SOC Detection Procedures ............................................................... 7-19 Unregulated Contaminant Detection Procedures ............................................... 7-20
EMERGENCY ACTION PLAN ............................................................................................ 7-20 VULNERABILITY ANALYSIS ............................................................................................ 7-21
Power Failure ..................................................................................................... 7-21 Earthquake ......................................................................................................... 7-22 Severe Snowstorm ............................................................................................. 7-24 Flooding ............................................................................................................. 7-25 Fire ..................................................................................................................... 7-26 Vandalism/Bioterrorism/Terrorism .................................................................... 7-28 Contamination of Water Supply ........................................................................ 7-28 Chemical Spill .................................................................................................... 7-31
CONTINGENCY OPERATIONAL PLAN ............................................................................... 7-31 Source of Supply ................................................................................................ 7-31 Storage Facilities ................................................................................................ 7-32 Booster Stations ................................................................................................. 7-32
Ault Field Booster Station ..................................................................... 7-32 Redwing Booster Station ....................................................................... 7-32 Heller Street Booster Station ................................................................. 7-32
Transmission Mains ........................................................................................... 7-33 Loss of 10-Inch Transmission Main ...................................................... 7-33 Loss of 24-Inch Transmission Main ...................................................... 7-33 Loss of 10-Inch and 24-Inch Transmission Main .................................. 7-34
CROSS-CONNECTION CONTROL ...................................................................................... 7-35 History................................................................................................................ 7-36

vii
Current Activity ................................................................................................. 7-36 CCC ORDINANCE AND PROGRAM ................................................................................... 7-37
CC Program Staffing and Training .................................................................... 7-37 Testing and Inspection ....................................................................................... 7-37
CHAPTER 8 – CAPITAL IMPROVEMENT PROGRAM INTRODUCTION ................................................................................................................. 8-1 RECOMMENDED IMPROVEMENTS ...................................................................................... 8-1
Water Rights and Source Capacity Projects ........................................................ 8-2 S-1: Well No. 9 Replacement ................................................................. 8-2 S-2: Emergency Supply Study ................................................................ 8-2 S-3: Eastside Reservoir Demolition ........................................................ 8-2 S-4: Emergency Supply Well .................................................................. 8-3
Transmission Line Projects .................................................................................. 8-3 T-1: Cross City Transmission Main ........................................................ 8-3 T-2: North-End Trunk Main: Phases 1 and 2......................................... 8-4 T-3: West 384 Zone Extension: Phase 1 ................................................ 8-4 T-4: 24-Inch Transmission Line Investigation ....................................... 8-5 T-5: Westside Water Main Extension ..................................................... 8-5 T-6: Campbell Lake Transmission Main Replacement .......................... 8-5
Booster Station ..................................................................................................... 8-6 BS-1: Ault Field Booster Station Surge Protection Analysis ................. 8-6 BS-2: Ault Field Booster Station Pump Replacement ............................ 8-7 BS-3: North Booster Pump Station ......................................................... 8-7
Distribution System ............................................................................................. 8-8 DS-1: NE Regatta Drive Pipeline ........................................................... 8-8 DS-2: Glencoe Street Fire Flow Improvements...................................... 8-8 DS-3: SW 10th Court Pipe Replacement ................................................. 8-8 DS-4: SW 11th Court Pipe Replacement ................................................. 8-8 DS-5: Erin Park Main Road Extension ................................................... 8-9 DS-6: Erin Park Road Tie-In .................................................................. 8-9 DS-7: Industrial Avenue Tie-In .............................................................. 8-9 DS-8: Heller Reservoir Extension .......................................................... 8-9 DS-9: Steel/AC Pipe Replacement ....................................................... 8-10
Pressure Zone ..................................................................................................... 8-11 PZ-1: O’Leary Way Water Main .......................................................... 8-11 PZ-2: South-End NASWI Connection .................................................. 8-11 PZ-3: East 384 Zone Development ....................................................... 8-11 PZ-4: West 384 Zone Development ..................................................... 8-12 PZ-5: 322 Zone Development ............................................................... 8-12
SUMMARY OF RECOMMENDED IMPROVEMENTS .............................................................. 8-13

viii
CHAPTER 9 – FINANCIAL PROGRAM INTRODUCTION ................................................................................................................. 9-1 EXISTING WATER UTILITY FINANCIAL STATUS ................................................................ 9-1
Current Water Rates ............................................................................................. 9-1 Current Connection Fees ...................................................................................... 9-2
In-City Connections ................................................................................. 9-2 Out-of-City Connections .......................................................................... 9-2
HISTORICAL REVENUES AND EXPENSES ............................................................................ 9-3 PROJECTED REVENUES AND EXPENSES ............................................................................. 9-5
Projected Growth ................................................................................................. 9-5 CAPITAL IMPROVEMENT PROJECT FUNDING SOURCE ALTERNATIVES .............................. 9-9
Grants ................................................................................................................... 9-9 Washington General Purpose Community Development Block
Grant (CDBG) .................................................................................... 9-9 US Economic Development Administration (US EDA) ....................... 9-10
Loans .................................................................................................................. 9-10 Public Works Trust Fund (PWTF) ......................................................... 9-10 Community Economic Revitalization Board (CERB) ........................... 9-12 Drinking Water State Revolving Fund (DWSRF) ................................. 9-13
Bonds ................................................................................................................. 9-14 Revenue Bonds ...................................................................................... 9-14 General Obligation Bonds...................................................................... 9-14
Other Funding Opportunities ............................................................................. 9-15 Utility Local Improvement Districts (ULIDs) ....................................... 9-15

ix
LIST OF TABLES No. Table Page 1-1 Groundwater Source Summary ............................................................................ 1-6 1-2 Water Rights Summary ........................................................................................ 1-8 1-3 Reservoir Summary ........................................................................................... 1-10 1-4 Booster Station Summary .................................................................................. 1-12 1-5 Pressure Reducing Valve Summary ................................................................... 1-14 1-6 Distribution System Piping Summary ............................................................... 1-15 1-7 Adjacent Purveyor Summary ............................................................................. 1-26 1-8 Existing Zoning Characterization ...................................................................... 1-30 1-9 County Defined Zoning Inventory Summary .................................................... 1-31 1-10 Service Area Policy Summary ........................................................................... 1-35 2-1 Historical Population Summary ........................................................................... 2-2 2-2 Historical Water System Connection Summary .................................................. 2-3 2-3 Historical Water Purchase and Production .......................................................... 2-4 2-4 Monthly Historical Source Production for 2012 .................................................. 2-4 2-5 Historical Average Day Demand and Maximum Day Demand .......................... 2-5 2-6 Historical Maximum Data and Calculated Peak Hour Demand .......................... 2-7 2-7 Historical Annual Water Consumption by Customer Class ................................ 2-8 2-8 Historical ERU Calculation summary ............................................................... 2-10 2-9 Historical ERU Summary .................................................................................. 2-10 2-10 Historical per Capita Water Use Summary ........................................................ 2-11 2-11 Historical Distribution system Leakage Summary ............................................ 2-12 2-12 Top City Water Users for 2012 .......................................................................... 2-14 2-13 Projected Population of Oak Harbor and Retail Service Area ........................... 2-15 2-14 Projected Water Consumption ........................................................................... 2-17 2-15 Projected Service Area ERUs ............................................................................ 2-19 2-16 Projected Service Area ADD, MDD, and PHD Consumption .......................... 2-20 2-17 Retail Service Area Projected Source Production ............................................. 2-21 3-1 General Facility Standards Summary .................................................................. 3-1 3-2 Minimum Fire Flow Requirements ...................................................................... 3-4 3-3 Drinking Water Regulations and Required Action Summary ............................. 3-5 3-4 Water Quality Standards for Inorganic Chemical Constituents ........................... 3-7 3-5 Water Quality Standards for Volatile Organic and Synthetic Organic
Chemical Constituents ................................................................................... 3-8 3-6 LCR Sample Results Summary ......................................................................... 3-11 3-7 Water Quality Standards for Radionuclides ...................................................... 3-11 3-8 Unregulated Contaminant Monitoring and Analysis Information ..................... 3-13 3-9 Water Quality Monitoring Requirements .......................................................... 3-15 3-10 2012 Source Production and Water Rights Summary ....................................... 3-16 3-11 Source ADD Capacity Analysis Summary ........................................................ 3-18 3-12 Service Area MDD Capacity Analysis Summary .............................................. 3-19 3-13 Retail Service Area and Seaplane Base MDD Capacity Analysis Summary .... 3-20

No. Table Page
x
3-14 Water System Storage Capacity Analysis .......................................................... 3-25 3-15 Ault Field Booster Station Capacity Analysis ................................................... 3-26 3-16 Heller Street Booster Station Capacity Analysis ............................................... 3-27 3-17 Redwing Booster Station Capacity Analysis ..................................................... 3-28 4-1 Model Storage Tank Information ......................................................................... 4-3 4-2 Model Calibration Data ........................................................................................ 4-4 4-3 Areas of Existing Fire Flow Deficiencies ............................................................ 4-6 5-1 Summary of Water Use Data Collection ............................................................. 5-3 5-2 Retail Service Area Projected Required Production ............................................ 5-4 5-3 Historical and Existing Distribution System Leakage Summary ........................ 5-5 5-4 Water Use Efficiency Measures ......................................................................... 5-10 5-5 WUE Program Savings Summary ..................................................................... 5-12 6-1 Zone of Contribution Groundwater Source Radii Summary ............................... 6-4 6-2 Chemicals Associated with Commercial and Industrial Activities ...................... 6-6 7-1 Water System Staffing and Responsibility Summary .......................................... 7-1 7-2 Water System Classification ................................................................................ 7-4 7-3 Minimum Education and Experience Requirements for Water Works
Operator Certifications ................................................................................... 7-4 7-4 Water System Staffing and Certification Level Summary .................................. 7-5 7-5 Westside Reservoirs Alarms and Controls .......................................................... 7-8 7-6 Eastside Reservoir Alarms and Controls ............................................................. 7-8 7-7 Ault Field Booster Station Control Set Points ................................................... 7-10 7-8 Heller Street Booster Station Control Set Points ............................................... 7-10 7-9 Redwing Booster Station Control Set Points ..................................................... 7-11 7-10 Required Data Acquisition and Recordkeeping Frequency ............................... 7-13 7-11 Water System Operation and Maintenance Equipment ..................................... 7-14 7-12 Water System Routine Maintenance Schedule .................................................. 7-15 7-13 Emergency Phone Contact List .......................................................................... 7-16 7-14 Bacteriological Presence Detection Procedure .................................................. 7-19 7-15 Emergency Response Procedures for Power Failure ......................................... 7-22 7-16 Emergency Response Procedures for an Earthquake ......................................... 7-23 7-17 Emergency Response Procedures for a Severe Snowstorm ............................... 7-24 7-18 Emergency Response Procedures for Flooding ................................................. 7-25 7-19 Emergency Response Procedures for Fire ......................................................... 7-26 7-20 Emergency Response Procedures for Contamination of the Water Supply ...... 7-29 8-1 Source-Related Capital Improvement Project Summary ..................................... 8-3 8-2 Transmission Main-Related Capital Improvement Project Summary ................. 8-6 8-3 Booster Station-Related Capital Improvement Project Summary ....................... 8-7 8-4 Distribution System-Related Capital Improvement Project Summary .............. 8-10 8-5 Pressure Zone-Related Capital Improvement Project Summary ....................... 8-13 8-6 Projected Capital Improvement Project Schedule ............................................. 8-13 9-1 Water Service Rates Through 2016 ..................................................................... 9-1 9-2 Historical Revenues and Expenditures for Water Fund 401 ................................ 9-4

No. Table Page
xi
9-3 Projected Revenues and Expenditures for Water Fund 401 ................................ 9-7 9-4 PWTF Loan Terms ............................................................................................ 9-11 9-5 DWSRF Loan Terms ......................................................................................... 9-14
LIST OF FIGURES No. Figure On or Follows Page 1-1 City of Oak Harbor Location Map ....................................................................... 1-2 1-2 Existing Facilities Schematic Diagram ................................................................ 1-4 1-3 Existing Facilities Map ........................................................................................ 1-4 1-4 Boundaries Map ................................................................................................... 1-4 1-5 Service Areas Map ............................................................................................... 1-4 1-6 Existing Pressure Zone Schematic ..................................................................... 1-14 1-7 Future Pressure Zone Schematic ........................................................................ 1-14 1-8 Topography Map ................................................................................................ 1-16 1-9 Historical Monthly Precipitation and Average Temperature ............................. 1-16 1-10 Soil Classification Map ...................................................................................... 1-16 1-11 Sensitive Areas Map .......................................................................................... 1-18 1-12 Critical Aquifer Recharge Areas Map ............................................................... 1-20 1-13 Adjacent Water Purveyor Map .......................................................................... 1-22 1-14 Existing Zone Map ............................................................................................. 1-28 1-15 County Define Zoning Map ............................................................................... 1-32 2-1 Historical Annual Water Consumption by Customer Class ................................ 2-9 2-2 Annual Water Use Seasonal Variations by Customer Class .............................. 2-13 2-3 Historical and Projected Service Area Annual Water Consumption ................. 2-18 3-1 Water System Storage Components................................................................... 3-22 4-1 Existing Available Fire Flow ............................................................................... 4-6 4-2 2033 Available Fire Flow with Existing System ................................................. 4-6 4-3 2033 Available Fire Flow with CIPs ................................................................... 4-6 5-1 WUE Program Required Production ................................................................. 5-13 6-1 Wellhead Protection Areas .................................................................................. 6-4 7-1 Water System Operation and Management Personnel Flow Chart ..................... 7-3 7-2 IOC/VOC/SOC Detection Procedure ................................................................ 7-20 8-1 CIP Project Map ................................................................................................... 8-2 9-1 Historical and Projected Revenues, Expenditures, and Surplus .......................... 9-8

xii
APPENDICES Appendix A – DOH Information and Water Facilities Inventory Appendix B – Water Service Agreements and Water Rights Appendix C – Ault Field Booster Station Technical Memorandum Appendix D – Unintended Discovery Protocol Appendix E – Oak Harbor Municipal Code Title 13 Appendix F – 2009 New Reservoir Project Predesign Report Appendix G – Cross-Connection Control Plan Appendix H – Design and Performance Standards Appendix I – Local Government Consistency Review Checklist Appendix J – Plan Review Comments and Correspondence Appendix K – Coliform and Nitrate Violation Letters and Notifications Appendix L – Coliform Monitoring Plan Appendix M – Water Quality Data Appendix N – Water Quality Monitoring Plan Appendix O – Hydraulic Model Results Appendix P – Water Conservation Program Appendix Q – Water Use Efficiency Program Information Appendix R – Wellhead Protection Program Appendix S – Emergency Response Manual Appendix T – Detailed Cost Estimates

LIST OF ABBREVIATIONS AAF average annual flow ac acre ACOE Army Corps of Engineers ADWF average dry weather flow AKART all known, available, and reasonable technologies avg. average BOD5 5-day biochemical oxygen demand BTU British thermal units CaCO3 calcium carbonate CBOD5 5-day carbonaceous biochemical oxygen demand CCWF Centennial Clean Water Fund cf cubic feet cfm cubic feet per minute CFR Code of Federal Regulations cfs cubic feet per second CFU colony-forming units CIP Capital Improvement Projects CM construction management CMU concrete masonry units COD chemical oxygen demand conc. concentration constr. construction CWA Clean Water Act cy cubic yards DMR discharge monitoring reports DNS determination of non-significance DO dissolved oxygen DOH Department of Health DT dry tons EA each EIS Environmental Impact Statement EPA Environmental Protection Agency ERU equivalent residential unit ESA Endangered Species Act FEMA Federal Emergency Management Agency FIRM Flood Insurance Rate Maps F/M food-to-microorganism ratio fps feet per second ft2 square feet FTE full-time equivalent gal. gallons gfd gallons per square foot per day GMA Growth Management Act

LIST OF ABBREVIATIONS
gpad gallons per acre per day gpcd gallons per capita per day gpd gallons per day gpd/ft2 gallons per day per square foot gph gallons per hour gpm gallons per minute gpm/ft2 gallons per minute per square foot HDPE high density polyethylene HMI Human-Machine Interface hp horsepower HPA Hydraulic Project Approval HRT hydraulic residence time HVAC heating, ventilation, and air conditioning I/I infiltration and inflow in. inches kVA kilovolt-amps kW kilowatt kWh kilowatt hour lb pounds lb/cap/d pounds per capita per day lb/d pounds per day lb/ft2/d pounds per square foot per day lf linear foot LS lump sum max. maximum MBR membrane bioreactor MDF maximum day flow mg milligrams MG million gallons mgd million gallons per day mg/L milligrams per liter misc. miscellaneous mJ/cm2 millijoules per square centimeter (UV dose measurement) ml milliliters MLSS mixed liquor suspended solids mm millimeter MM maximum month MMF maximum month flow MSL mean sea level N/A not applicable NEPA National Environmental Policy Act NH3 ammonia-nitrogen NMFS National Marine Fisheries Service NO3-N nitrate - nitrogen NPDES National Pollutant Discharge Elimination System

LIST OF ABBREVIATIONS
NR not reported NRCS National Resource Conservation Service NTU nephelometric turbidity units NWI National Wetlands Inventory OD outside diameter OFM Office of Financial Management O&M operation and maintenance PDF peak day flow PFRP process to further reduce pathogens pH negative log hydronium ion concentration PHF peak hour flow PHS priority habitat and species PLC Programmable Logic Controller PMAC plan to maintain adequate capacity P.S. pump station psi pounds per square inch PSRP process to significantly reduce pathogens PWTF Public Works Trust Fund Q flow rate RAS return activated sludge RCW Revised Code of Washington ROW right-of-way rpm revolutions per minute SBR sequencing batch reactor scfm standard cubic feet per minute SEPA State Environmental Policy Act SERP State Environment Review Process sf square feet S.F. safety factor SR State Route SRF State Revolving Fund SRT solids retention time SWD side water depth TBD to be determined TDH total dynamic head TKN total Kjehldahl nitrogen TMDL total maximum daily load TSS total suspended solids UGA Urban Growth Area USFWS United States Fish and Wildlife Service USGS United States Geologic Survey UV ultraviolet radiation V volts VFD variable frequency drive VOC volatile organic compounds

LIST OF ABBREVIATIONS
VS volatile solids VSS volatile suspended solids WAC Washington Administrative Code WAS waste activated sludge WDFW Washington State Department of Fish and Wildlife WT wet tons WWTP wastewater treatment plant µm micrometer (micron)

City of Oak Harbor E-1 2013 Water System Plan Update September 2014
EXECUTIVE SUMMARY The City of Oak Harbor Water System Plan provides a planning strategy for the City’s water utility over 6- and 20-year periods. The plan has been prepared consistent with Department of Health requirements as specified in the Washington Administrative Code (WAC) Chapter 246-290. The plan represents a commitment by the City to pursue and implement the Plan’s recommendations and capital improvements. PLAN SUMMARY This Plan is divided into chapters, each of which discusses different aspects of the City’s water system analysis. Individual chapter topics include:
• Chapters 1 and 2 Background data, including a description of existing facilities, service area, service area policies, and projections of population and water use.
• Chapter 3
Description of system design and water quality standards, and an analysis of water quality. This chapter also presents a source, storage, and booster station analysis.
• Chapter 4
Distribution system analysis including hydraulic modeling summary and the basis for identification of distribution system improvements.
• Chapter 5
Water use efficiency program which details conservation and efficient water use goals and measures.
• Chapter 6
Discussion and recommendations for the City’s Source Protection Plan.
• Chapter 7
Water system operation and maintenance procedures.

Gray & Osborne, Inc., Consulting Engineers
E-2 City of Oak Harbor September 2014 2013 Water System Plan Update
• Chapter 8 Capital Improvement Program
• Chapter 9
Financial analysis and financing options for the recommended improvements.
• Appendix
Supplementary and background documentation both required by DOH and used for the preparation of this Plan.
WATER SERVICE The City’s primary source of water is through the City of Anacortes, which extracts and treats water from the Skagit River. The City receives water through 24-inch and 10-inch transmission mains that extend from Sharpe’s Corner down Highway 20 to the City. The City maintains three pump stations (Ault Field, Heller Street, and Redwing) which fill reservoirs and provide appropriate service pressure to its customers. The City maintains three storage reservoirs and construction of a fourth reservoir at Gun Club Road is nearly complete. The City also maintains three groundwater sources (Well No. 8, No. 9, and No. 11) which are used sporadically and do not represent a significant source of water for the City. The City provides water to customers within the retail service area as well as to wholesale customers at Naval Air Station – Whidbey Island (NASWI), Deception Pass State Park, and the North Whidbey Water District. The City’s current (2013) retail service area population is approximately 18,778 people. The service area, which includes retail and wholesale customers, serves a total of 5,922 connections, which represents approximately 14,771 ERUs. The City anticipates a retail service area population of approximately 24,999 by 2033 and an estimated population of 31,074 at buildout. HISTORICAL AND PROJECTED WATER PRODUCTION The City maintains detailed records of water production and consumption and updates these files continuously. Since 2007, the City has reduced the overall water production and consumption. As the City’s population continues to grow however, more water will be consumed. Historical and projected required production and consumption is shown in Table E-1.

Gray & Osborne, Inc., Consulting Engineers
City of Oak Harbor E-3 2013 Water System Plan Update September 2014
TABLE E-1
Historical and Projected Water Production & Consumption
Year
Retail Service Area
Population
Retail Service
Area ERUs
Average Daily
Consumption DSL
Required Production Average
Daily (gpd)
Maximum Daily (gpd)
Peak Hour (gpm)
2013 18,778 8,700 1,305,000 80,030 1,385,000 2,493,000 2,839 2014 18,964 8,786 1,318,000 80,520 1,398,000 2,517,000 2,867 2015 19,952 9,244 1,387,000 83,110 1,470,000 2,645,000 3,012 2016 20,942 9,702 1,455,000 85,700 1,541,000 2,774,000 3,159 2017 21,933 10,162 1,524,000 88,300 1,613,000 2,903,000 3,306 2018 22,925 10,621 1,593,000 90,900 1,684,000 3,031,000 3,452 2019 23,920 11,082 1,662,000 93,500 1,756,000 3,160,000 3,599 2020 24,116 11,173 1,676,000 94,700 1,771,000 3,187,000 3,630 2021 24,313 11,265 1,690,000 95,910 1,786,000 3,214,000 3,660 2022 24,513 11,357 1,704,000 97,120 1,801,000 3,241,000 3,691 2023 24,714 11,450 1,717,000 98,330 1,816,000 3,268,000 3,722 2024 24,916 11,544 1,732,000 99,550 1,831,000 3,296,000 3,754 2025 25,121 11,639 1,746,000 100,800 1,847,000 3,324,000 3,786 2030 26,169 12,124 1,819,000 107,000 1,926,000 3,466,000 3,947 2033 26,819 12,425 1,864,000 110,700 1,975,000 3,554,000 4,048 2060 33,472 15,508 2,326,000 128,200 2,454,000 4,418,000 5,032
SYSTEM ANALYSIS The analysis of the City’s water system in this Plan evaluates whether the City’s existing water system facilities are adequate to provide the current and projected water demands of the City’s customers. Analysis in Chapter 3 – System Analysis concludes that:
• The City’s existing groundwater use is significantly below its allowable instantaneous and annual water right;
• With the completion of the new North Reservoir which is projected for early 2014, the City will have adequate storage capacity for the water system;
• All three of the City’s booster stations (Ault Field, Heller Street, and
Redwing) provide adequate annual average, maximum day, and peak hour demand capacity; and
• The City is in compliance with all water quality and testing requirements
and standards.

Gray & Osborne, Inc., Consulting Engineers
E-4 City of Oak Harbor September 2014 2013 Water System Plan Update
WATER USE EFFICIENCY The Plan includes the City’s Water Use Efficiency (WUE) program as required by the Water Use Efficiency Rule (WAC 246-290-800), which became active in 2007. The WUE rule requires additional planning, distribution leakage standards, and performance reporting aimed at conserving the State’s water resources. The Rule requires that distribution system leakage, which includes loss of water through leaky pipes or unauthorized usage, remain at or below 10 percent based on a 3-year rolling average. Since at least 2007, the City has maintained a rolling 3-year average for distribution system leakage of less than 10 percent. The City must also provide at least two quantifiable reduction goals in order to comply with the rule. The City’s goals are to maintain distribution system leakage below 10 percent and to maintain per-capita water use at or below 64 gallons per day. To achieve these goals, the City actively investigates and monitors leakage, and promotes water conservation through advertising, rate structure, distribution of various flow reducing products (aerators, showerheads), and various other methods. CAPITAL IMPROVEMENT PROGRAM This Water System Plan contains a list of projects for the City’s capital improvement plan through the 20-year planning period. A recommended schedule for projects within the 6-year planning period and estimated project costs are provided in Table E-2. More detailed project information is listed in Chapter 8 – Capital Improvement Program. These projects will help insure that the City is able to meet the short- and long-term water requirements for its customers.
TABLE E-2
Capital Improvement Project Summary
Construction Year
Project Number
Project Name
Estimated Cost (2013$)
Estimated Construction Cost
2014
T-1A Cross City Transmission Main $1,559,000 $1,559,000 BS-2 Ault Field Booster Station Pump Replacement $86,000 $86,000 DS-9 Steel/AC Pipe Replacement $1,000,000 $1,000,000 PZ-1 O’Leary Way Water Main $599,000 $599,000 PZ-2 North O’Leary Way Water Main $511,000 $511,000
2014 Subtotal $3,755,000 $3,755,000
2015 S-1 Well No. 9 Replacement $236,000 $243,000 BS-1 Ault Field Booster Station Surge Protection Analysis $208,000 $214,000
2015 Subtotal $444,000 $457,000
2016 S-4 Emergency Supply Well $301,000 $319,000
DS-9 Steel/AC Pipe Replacement $1,000,000 $1,000,000 PZ-4 West 384 Zone Development $326,000 $346,000

Gray & Osborne, Inc., Consulting Engineers
City of Oak Harbor E-5 2013 Water System Plan Update September 2014
TABLE E-2 – (continued)
Capital Improvement Project Summary
Construction Year
Project Number
Project Name
Estimated Cost (2013$)
Estimated Construction Cost
2016 Subtotal $1,627,000 $1,665,000
2017 S-3 Eastside Reservoir Demolition $100,000 $109,000 DS-1 NE Regatta Drive Pipeline $116,000 $127,000
2017 Subtotal $216,000 $236,000
2018 T-3 West 384 Zone Extension: Phase I $2,678,000 $3,014,000 DS-2 Glencoe Street Fire Flow Improvements $936,000 $1,053,000
2018 Subtotal $3,614,000 $4,067,000
2019 T-1B PRV Stations $2,000,000 $2,319,000 T-2 North-End Trunk Main: Phase I & II $1,767,000 $2,048,000
DS-9 Steel/AC Pipe Replacement $1,000,000 $1,000,000 2019 Subtotal $4,767,000 $5,367,000
>2019
T-5 Westside Water Main Extension $7,609,000 $9,086,000 T-6 Campbell Lake Main Replacement $1,970,000 $2,352,000
BS-3 North Booster Pump Station $2,398,000 $2,863,000 DS-3 SW 10th Court Pipe Replacement $188,000 $224,000 DS-4 SW 11th Court Pipe Replacement $188,000 $224,000 DS-5 Erin Park Main Road Extension $578,000 $690,000 DS-6 Erin Park Road Tie-In $50,000 $60,000 DS-7 Industrial Avenue Tie-In $50,000 $60,000 DS-8 Westside Reservoir Extension $696,000 $831,000 PZ-3 East 384 Zone Development $90,000 $107,000 PZ-5 322 Zone Development $485,000 $579,000
>2019 Subtotal $14,302,000 $17,076,000 6-Year Planning Period Total $14,423,000 $15,547,000 6-Year Planning Period Total (City Funded) $9,745,000 $10,214,000 20-Year Planning Period Total $28,725,000 $32,623,000 20-Year Planning Period Total (City Funded) $22,884,000 $25,901,000
FINANCIAL PROGRAM The Plan contains information on the water utility’s financial program, which suggest that the City is able to maintain sufficient cash flow to fund all of the projected and recommended CIP projects while maintaining adequate surplus funds. Table E-3 below summarizes the historical and projected financial information for the City’s water utility fund.

Gray & Osborne, Inc., Consulting Engineers
City of Oak Harbor E-6 2013 Water System Plan Update September 2014
TABLE E-3
Historical and Projected Financial Information
Parameter 2011 2013 2014 2015 2016 2017 2018 2019 Water Rates $4,344,050 $4,360,000 $4,578,000 $4,682,660 $4,907,810 $5,106,540 $5,319,090 $5,531,980 Total Revenues $4,564,807 $9,832,700 $4,677,700 $4,785,360 $5,013,580 $5,215,480 $5,431,290 $5,647,550 Professional Services $100,841 $4,000 $30,000 $47,000 $125,000 $43,000 $384,000 $349,000 Capital Outlay $1,701,063 $1,174,744 $1,500,000 $- $- $- $- $- System Improvements $6,450 $5,375,000 $30,000 $968,000 $1,189,000 $502,000 $173,000 $1,749,000 Total Expenditures $3,860,933 $9,072,661 $5,100,856 $4,660,180 $5,066,643 $4,408,337 $4,534,370 $6,192,833 Annual Surplus/(Deficit) $703,874 $760,039 ($423,156) $125,180 ($53,063) $807,143 $896,920 ($545,283) End of Year Balance $4,693,094 $4,016,055 $4,016,055 $4,141,235 $4,088,172 $4,895,315 $5,792,235 $5,246,952

City of Oak Harbor 1-1 2013 Water System Plan Update September 2014
CHAPTER 1
DESCRIPTION OF WATER SYSTEM INTRODUCTION In accordance with Washington Administrative Code (WAC) 246-290-100 and the Washington State Department of Health (DOH), water system plans need to be updated every 6 years or more frequently, if necessary, to reflect the current conditions of the water system. This Plan has been prepared to update the 2003 City of Oak Harbor Water System Plan, using the 2009 DOH Water System Design Manual and the 1997 DOH Water System Planning Handbook. Copies of the City’s Water Facilities Inventory form, as well as Washington State DOH Project Approval Application and Submittal Forms are included in Appendix A. This chapter includes background information and a brief system history, a summary of existing facilities, information on adjacent purveyors, service area agreements, summary of service area policies, and information on related planning documents used in the composition of this plan. OWNERSHIP AND MANAGEMENT The City of Oak Harbor (City) is a small, mostly residential community within Island County and located on Whidbey Island (Figure 1-1). The City operates a Group A municipal water system to deliver water to residential and commercial customers, as well as to the U.S. Naval facilities located north and east of the city limits. The City’s operating permit color is green (as of June 2013), which indicates that the system is currently in compliance with all requirements. The City’s water system is officially designated by DOH records as the City of Oak Harbor public water system number 62650C. The City is governed by a mayor and a seven-member city council. The City Administrator has ultimate responsibility for all water utility administration, engineering, operation and maintenance activities, and reports directly to the city council. Day-to-day operations are handled by the Operations Manager and the six-person water staff. Operation and maintenance of the water system is supervised by the Public Works Director, while engineering and administrative staff are supervised by the City Engineer. A more detailed discussion of water system responsibilities is included in Chapter 7 – Operation and Maintenance Program.

Gray & Osborne, Inc., Consulting Engineers
1-2 City of Oak Harbor September 2014 2013 Water System Plan Update
The City’s current mailing address and contact information is:
City of Oak Harbor 865 SE Barrington Drive Oak Harbor, Washington 98277 (360) 279-4500 (phone) (360) 279-4507 (fax)
SYSTEM HISTORY AND BACKGROUND The City of Oak Harbor was incorporated on May 14, 1915, and remained a small, agricultural community until the beginning of World War II in 1941. At that time, the U.S. Navy established Naval Air Station Whidbey Island (NASWI) adjoining the eastern city limits. The effect of the military installation significantly changed the nature of the community and increased the population of the City and adjacent areas on north Whidbey Island. The original water system consisted of two wells and a small distribution system. In 1928, a 60,000-gallon elevated reservoir was installed. The 130-foot-high storage tank remained in service until it was dismantled in 1971. In 1942, the U.S. Navy constructed a 10-inch transmission main from the City of Anacortes (Anacortes) pipeline at Sharpe’s Corner, which travels underneath the Deception Pass Bridge to the Ault Field facility to serve the then-growing needs of NASWI. In 1949, Well 4 was drilled and the Eastside Reservoir, with a capacity of 270,000 gallons, was constructed. In 1959, the capacity of this reservoir was increased to 540,000 gallons. During the 1950s, Well 5 was acquired from the Navy, and Wells 6 and 7 were drilled to further increase the City’s water supply. In 1963, Westside Reservoir 1 was constructed near Heller Street with a capacity of 585,000 gallons. Four additional wells (8, 9, 10, and 13) were added to the system during the 1960s. In 1970, Anacortes completed major improvements to their water supply and transmission system through construction of a new water treatment plant and 36-inch pipeline. Also, by 1970 the City’s population had increased to 9,167 as a result of the annexation of the NASWI Seaplane Base and married housing areas. In 1971, the City, Anacortes, and NASWI executed agreements for supply of water from Anacortes to the City and NASWI facilities. A new 24-inch transmission main was constructed (parallel to the existing 10-inch transmission main) jointly by the City and the U.S. Navy to convey water from Anacortes at Sharpe’s Corner. At that point in time,

CITY LOCATION
2013 WATER SYSTEM PLAN UPDATEFIGURE 1-1
LOCATION MAP
CITY OF OAK HARBOR
CRESCENT HARBOR
PUGETSOUND
W CRESCENT HARBOR RD
W WHIDBEY AVE
W TROXELL RD
TO ANACORTES
CAMANOISLAND
WHIDBEYISLAND
SKAGITCOUNTY
FIDALGOISLAND
20
0 10,000Feet
LEGEND:CITY LIMITS
M:\OAK HARBOR\13404 - WATER SYSTEM PLAN UPDATE\GIS\LOCATION.MXD

Gray & Osborne, Inc., Consulting Engineers
City of Oak Harbor 1-3 2013 Water System Plan Update September 2014
NASWI became a wholesale water customer of the City. At the time of construction of the 24-inch transmission main, the City planned on using groundwater from Wells 8, 9, and 11 as the primary source of water for City customers. Over time, however, the City’s operational strategy shifted toward using water from Anacortes as a primary supply and water from Wells 8, 9, and 11 as auxiliary supply. In 1973, the Navy granted a license to Oak Harbor to use the 10-inch transmission main in order to serve City customers as well as customers within the North Whidbey Water District (NWWD) and Deception Pass State Park (DPSP) facilities. The Ault Field Booster Station, which is owned and operated by the City and is located immediately north of the city limits at the termination of the 10-inch and 24-inch transmission mains, was constructed by the City in 1974. In 1976, the Navy transferred ownership of the 10-inch main to the City, which then permitted service connections to the main on Fidalgo Island. In 1979, the City renegotiated its contract with Anacortes and as a result transferred ownership of the 10-inch main from Sharpe’s Corner to the Deception Pass Bridge to Anacortes. In 1989, the City constructed the Heller Street Booster Station in order to boost domestic water pressure and provide necessary fire flows. In 1991, the City modified and expanded the Ault Field Booster Station, which included converting two existing pumps to variable-speed models and installing two 700 gpm constant-speed pumps with solid-state starters. In 2004, the City constructed the Redwing Booster Station in order to boost domestic water pressure and provide necessary fire flows. A timeline of important dates regarding the current water system is outlined below.
• 1942 – 10-inch transmission main constructed • 1949 – Eastside Reservoir constructed • 1959 – Eastside Reservoir expanded • 1963 – Westside Reservoir 1 constructed
Wells 8 and 9 drilled • 1970 – Anacortes 36-inch transmission main constructed • 1971 – 24-inch transmission main constructed • 1974 – Ault Field Booster Station constructed • 1976 – Westside Reservoir 2 constructed • 1977 – Well 11 drilled • 1989 – Heller Street Booster Station constructed • 1991 – Ault Field Booster Station expanded

Gray & Osborne, Inc., Consulting Engineers
1-4 City of Oak Harbor September 2014 2013 Water System Plan Update
• 2004 – Redwing Booster Station constructed • 2010 – NASWI Crescent Elementary pipeline constructed • 2012 – Gun Club Road Pipeline constructed • 2013 – North Reservoir constructed
EXISTING SYSTEM A schematic profile of the existing system components is shown on Figure 1-2 and a map showing the locations of existing water system features is shown on Figure 1-3. Each of the primary components of the existing water facilities is described in greater detail below. Political boundaries which include the current city limits and current UGA are shown on Figure 1-4. SERVICE AREA In 2003, the Washington State Legislature enacted the Municipal Water Law (MWL) in order to give municipal water suppliers more certainty and flexibility with current and future water rights. The MWL also required municipal suppliers to use water more efficiently and to take steps in goal setting and documenting efforts to reduce water use. Part of the MWL requires the definition of specific service areas. These service areas are shown on Figure 1-5 and are discussed below. Retail Service Area As part of the MWL, municipal water systems must define a retail service area. The retail service area is the specific area defined by the municipal water supplier where the municipal water supplier has a duty to provide service to all new service connections. This area must include the municipal water supplier’s existing service area and may also include areas where future water service is planned if the requirements of RCW 43.20.260 are met. For the purposes of this plan, both existing and future retail service areas have been identified. The existing retail service area includes a majority of the city limits and is shown on Figure 1-4. The Seaplane Base, although within the City limits as well as the UGA, will remain a wholesale water customer through the City’s wholesale water service agreement with NASWI. For the purposes of this plan, the future retail service area will be equal to the UGA. Wholesale Service Area The City’s wholesale service area includes the retail service areas shown on Figure 1-5 as well as its wholesale customers. The City’s current wholesale customers include NASWI

M:\O
ak H
arbo
r\13
404
- W
ater
Sys
tem
Pla
n U
pdat
e\FI
GU
RES\
Figu
re 1
-2.d
wg,
12/
12/2
013
9:04
:57
AM, D
WG
To
PDF.
pc3

LEGEND
M:\O
ak H
arbor\13404 - W
ater S
ystem
P
lan U
pdate\F
IG
UR
ES
\F
igure 1-3.dw
g, 2/27/2014 12:39:44 P
M, pm
arshall

CITY OF OAK HARBOR
2013 WATER SYSTEM PLAN UPDATEFIGURE 1-4
BOUNDARIES MAP
0 3,000 6,0001,500Feet
³
CRESCENT HARBOR
PUGETSOUND
State
Rte 2
0
E Sleeper Rd
W Ault Field Rd
E Crescent Harbor Rd
E Pioneer Way
Swantown Rd
SE Pioneer Way
W Sleeper Rd
E Whidbey Ave
E Fakkema Rd
Coral S
ea Ave
Pion
eer W
ay
W Waterloo Rd
W Whidbey Ave
Fort Nugent Rd SW Fort Nugent Ave
W Fakkema Rd
W Clover Valley Rd
W Crescent Harbor Rd
E Pioneer Way
LEGEND:CITY LIMITSURBAN GROWTH AREA (UGA)STREETS / ROADS
DATA SOURCE: DEPARTMENT OF AGRICULTURE (USDA)
M:\Oak Harbor\13404 - Water System Plan Update\GIS\AERIAL.mxd

CITY OF OAK HARBOR
2013 WATER SYSTEM PLAN UPDATEFIGURE 1-5
SERVICE AREAS MAP
0 6,000 12,0003,000Feet
³
LEGEND:CITY LIMITSEXISTING/RETAIL SERVICE AREASERVICE AREAFUTURE SERVICE AREA (UGA)
DATA SOURCE: DEPARTMENT OF AGRICULTURE (USDA)
M:\Oak Harbor\13404 - Water System Plan Update\GIS\AERIAL_FIG1-5.mxd
CRESCENT HARBOR
PUGETSOUND
NASWI SEAPLANEBASE
NASWI AULTFIELD
NORTH WHIDBEYWATER DISTRICT
DECEPTION PASSSTATE PARK
State
Rte 2
0
E Sleeper Rd
W Ault Field Rd
E Crescent Harbor Rd
E Pioneer Way
Swantown Rd
Fort Nugent Rd
SE Pioneer Way
W Sleeper Rd
E Whidbey Ave
E Fakkema Rd
Coral S
ea Ave
W Waterloo Rd
W Whidbey Ave
SW Fort Nugent Ave
W Fakkema RdW Clover Valley Rd
W Crescent Harbor Rd

Gray & Osborne, Inc., Consulting Engineers
City of Oak Harbor 1-5 2013 Water System Plan Update September 2014
Ault Field, NASWI Seaplane Base, Deception Pass State Park, and the North Whidbey Water District. There are currently no plans to expand the City’s wholesale service area, but the City is open to providing water service to communities in need, provided a beneficial agreement can be reached. Possible communities include Penn Cove, isolated water systems north of the City on Whidbey Island, and smaller water systems outside of the city limits. Some of these systems are described later in this chapter. Future Service Area Future service area is defined by DOH as the specific area where a municipal water supplier plans to serve. For the purposes of this planning effort, the future service area shall be defined as the future retail and wholesale service areas. TRANSMISSION MAINS The primary supply to the City’s water system is from Anacortes. Each of the two transmission mains that deliver water to the City connect to a 36-inch transmission main owned and operated by Anacortes at Sharpe’s Corner, which is located on Fidalgo Island. Water leaves the 36-inch transmission main and flows through a 12-inch meter owned and maintained by Anacortes into a 24-inch transmission main. The 24-inch main is ductile iron, generally follows Highway 20, and is owned, operated, and maintained by the City. As part of its water supply agreement with the U.S. Navy, however, the City is only responsible for 50 percent of the cost of major repairs or upgrades, while NASWI is responsible for the remaining half of the costs. The second transmission main is an older, 10-inch main that parallels the 24-inch transmission main along Highway 20. Both the 10- and 24-inch mains are approximately 12 miles in length. The City owns, operates, and maintains the entire 10-inch transmission main south of the meter located immediately north of the Deception Pass Bridge and up to the Ault Field Booster Station. Water from the 10-inch main is combined with the 24-inch main prior to entering the Ault Field Booster Station. The 10-inch transmission main is the primary service line for NWWD and DPSP, and also provides an alternative supply to the City as well as NASWI facilities. In recent years, because of its age as well as to address issues with water system service pressure, various sections of the 10-inch transmission main have been replaced with 16-inch transmission main piping. In total, approximately 7,000 linear feet of pipe have been upsized since 2006.

Gray & Osborne, Inc., Consulting Engineers
1-6 City of Oak Harbor September 2014 2013 Water System Plan Update
WATER SOURCE SUPPLY Primary Supply – City of Anacortes The City obtains approximately 99.7 percent of its potable water from Anacortes. The City is classified as a wholesale customer of the Anacortes water system and has a committed water volume (CWV) of 1 billion gallons (3,070 acre-feet) per year. Water is provided via the 24-inch and 10-inch transmission mains described above. Per the current water service agreement between the City and Anacortes, the water supply from Anacortes must be delivered to Sharpe’s Corner (24-inch transmission main) and the Deception Pass Bridge meter (10-inch transmission main). The current water service agreement also states the water from Anacortes must be delivered to the Sharpe’s Corner connection point at a minimum of 120 pounds per square inch (psi). Auxiliary Supply – Wells 8, 9, and 11 The City operates three wells, Wells 8, 9, and 11, which are controlled manually. The wells are operated as needed but are exercised monthly to ensure functionality and reliability. The City also has six other existing wells, Wells 4, 5, 6, 10, 12, and 13, which are no longer active. Water quality testing is performed on Wells 8, 9, and 11 according to DOH requirements. The active wells draw water from the same aquifer, but are not designated as a wellfield by DOH due to the lack of a common withdrawal point. The aquifer supplying the wells consists primarily of sand and gravel, interspersed with several thin lenses of clay. A single clay layer (confining layer) exceeding 30 feet thick is located immediately above the water-bearing strata. Active groundwater source information is summarized in Table 1-1.

Gray & Osborne, Inc., Consulting Engineers
City of Oak Harbor 1-7 2013 Water System Plan Update September 2014
TABLE 1-1
Groundwater Source Summary
Parameter Well 8 Well 9 Well 11 DOH ID S11 S12 S14 Drilling Date April 1961;
Rebuilt in 2004 October 1961; Rebuilt in 2005
March, 1977; Modified in 2007
Overall Depth (ft) 250 258 255 Pump Depth (ft) 209 207 207 Pump Type Byron Jackson
turbine pump; 25 hp; 12-stage
U.S. Electric submersible pump
motor; 25 hp; 13-stage
Grundfos submersible pump;
25 hp; 7-stage
Casing Diameter 8-inch 10-inch 8-inch Average Flow (gpm) 160 gpm 50 gpm 160 gpm Pumps To 307 Zone 307 Zone 307 Zone Well 8 Well 8 (DOH ID S11) was drilled in 1961 and was rebuilt in January 2004. The base of the well is at a depth of 250 feet below grade, while water is drawn from the aquifer at a depth of approximately 209 feet below grade. The well pump consists of a 25-horsepower Byron Jackson Model 7 (12-stage) turbine pump capable of delivering 190 gpm at 300 feet of total head. The pump is enclosed within an 8-inch diameter casing. The current production of Well 8 is 160 gpm. Overall, the City believes that Well 8 is in fair condition. In the event of an emergency, auxiliary power to Well 8 is provided by an 80-kilowatt diesel generator. This generator provides auxiliary power for Wells 8 and 9 as well as the Heller Street Booster Station. Well 9 Well 9 (DOH ID S12) was drilled in 1961 and was upgraded in October 2005. The base of the well is at a depth of 243 feet below grade and water is drawn from a depth of approximately 207 feet below grade. The well pump consists of a 25-horsepower U.S. Electric (13-stage) submersible pump capable of delivering 220 gpm at 300 feet of head. The pump is enclosed within a 10-inch diameter casing. The current production of Well 9 is 50 gpm. According to the City, this well is in poor condition and is scheduled for replacement in 2014. Auxiliary power for this well is provided by an 80-kilowatt diesel generator. Well 11 Well 11 (DOH ID S14) was drilled in 1977 and was upgraded in March 2007. The base of the well is at a depth of 255 feet below grade and water is drawn from a depth of

Gray & Osborne, Inc., Consulting Engineers
1-8 City of Oak Harbor September 2014 2013 Water System Plan Update
approximately 207 feet below grade. The well pump consists of a 25-horsepower Grundfos A15B70007 (7-stage) submersible pump capable of delivering 230 gpm at 294 feet of total dynamic head. The pump is encased within an 8-inch casing. The current production of Well 11 is 160 gpm. According to the City, this well is in good condition. Auxiliary power for this well is provided by a 200 Wacker 70-kilowatt trailer-mounted diesel generator. In the event of a power outage, the trailer is mobilized to the site and connected to provide power to the well pumping equipment. Inactive Groundwater Sources As mentioned previously, the City has six additional wells (4, 5, 6, 10, 12, and 13) which are no longer active. Inactive wells have been capped with a concrete slab. In order to reactivate these wells, new casings, screens, pumping equipment, and treatment systems would be required for each well brought back into service. WATER RIGHTS The City holds water rights for 11 wells under its control, although only Wells 8, 9, and 11 are regularly exercised. These wells serve as an auxiliary supply only. Water right information for the City is summarized in Table 1-2 and is also included in Appendix B. Information about the City of Anacortes water rights is also summarized in Appendix B.

Gray & Osborne, Inc., Consulting Engineers
City of Oak Harbor 1-9 2013 Water System Plan Update September 2014
TABLE 1-2
Water Rights Summary
Certificate Number Source Name
Priority Date
InstantaneousWithdrawal
(gpm)
Annual Withdrawal
(acre-feet/year)Active G1-05901CWRIS-04114 Well 8 (S11) 04/10/1961 200 320 G1-08370CWRIS-06201 Well 9 (S12) 10/27/1966 450 720 G1-05858CWRIS-03967 Well 11 (S14) 03/06/1961 200 320 Total — — 850 1,360Inactive 20916PWRIS Well 4 07/16/1973 160 256 G1-22778CWRIS (1) Well 5 12/27/1976 180 290 00101PWRIS Well 6 09/27/1971 400 640 20915PWRIS Well 10 07/16/1973 100 160 20913PWRIS Well 12 07/16/1973 500 800 20914PWRIS Well 13 07/16/1973 300 480 Total — — 1,640 2,626Claims G1-039420CL — 01/01/1942 — — (1) This source is classified as “active,” but is not regularly used so it is not included in the active
withdrawal total. Water Service Agreement The City’s primary source of supply is from Anacortes. The City’s most recent Water Supply Agreement with Anacortes took effect on January 1, 2008. The agreement states that it will remain viable until December 31, 2027, and that once annually either party can request an amendment to or a negotiation of the agreement. The two cities typically negotiate the agreement every 3 years and update the committed annual water volume during that renegotiation. The contract is currently being negotiated, and terms will remain similar to the existing contract. No deadline has been set for enactment of a new water services contract. The current water supply agreement includes delivering a CWV of 1 billion gallons per year to the connection points at Sharpe’s Corner (24-inch main) and Deception Pass (10-inch main). The agreement limits expansion of water service to 10 percent above the CWV without prior approval from Anacortes. Anacortes maintains water rights for the Skagit River, which is the original source for all water delivered to the City. Additional information regarding Anacortes water rights is available in the City of Anacortes Water System Plan (HDR, 2011). The City also has agreements to provide water to NASWI, DPSP, and to the NWWD. Copies of these agreements are included in Appendix B.

Gray & Osborne, Inc., Consulting Engineers
1-10 City of Oak Harbor September 2014 2013 Water System Plan Update
RESERVOIRS The City currently owns and operates three reservoirs that serve to distribute water to customers within the service area. The City recently completed construction of a fourth reservoir, which will be called the North Reservoir. Eastside Reservoir Eastside Reservoir is a steel standpipe with a height of 53 feet, a diameter of 41.5 feet, and a nominal storage volume of 540,000 gallons. Eastside Reservoir is in fair condition, but was constructed in 1949 without a foundation structure and sits directly on the soil beneath the tank. This design is unstable and does not meet current seismic design requirements. Retrofitting this tank to adhere to current seismic standards would be extremely expensive, and would reduce the maximum operating level to a point that would significantly reduce the functionality of the reservoir. Plans to address Eastside Reservoir are further discussed in Chapter 3 – System Analysis, and in Chapter 8 – Capital Improvement Program. After construction of the North Reservoir, the City plans to abandon the Eastside Reservoir. Abandonment of the Eastside Reservoir was recommended in the New Reservoir Project Predesign Report (Gray & Osborne, 2009) due to the extremely high cost of seismic retrofits that would be required to fortify it. Westside Reservoirs 1 and 2 Both Westside reservoirs are located along Heller Street just south of West Whidbey Avenue. Westside Reservoir 1 is in fair condition and is the smaller of the two steel design reservoirs with a storage volume of approximately 585,000 gallons. It has a height of 56.5 feet, a diameter of 42 feet, and was originally constructed in 1963. Westside Reservoir 2 is the larger of the two storage facilities and is also a steel reservoir design. The reservoir is in fair condition and is 56 feet high and with a diameter of 78 feet. The reservoir was constructed in 1976 and has a nominal storage volume of 2 million gallons. North Reservoir The City developed plans and specifications for the construction of a new reservoir to be located near the end of Gun Club Road. The reservoir has a height of 39 feet, a diameter of 150 feet, a capacity of 4 million gallons, and is a welded steel design. The new reservoir has been constructed to address existing supply and water pressure issues, and to accommodate future growth and/or expansion by the City. The reservoir is fully constructed, but awaiting painting, and will be fully completed in 2014. Existing reservoirs are summarized in Table 1-3.

Gray & Osborne, Inc., Consulting Engineers
City of Oak Harbor 1-11 2013 Water System Plan Update September 2014
TABLE 1-3
Reservoir Summary
Parameter Westside
Reservoir 1 Westside
Reservoir 2Eastside
Reservoir North
Reservoir Material of Construction Steel Steel Steel Welded SteelYear of Construction 1963 1976 1949 (1) 2014 Height (ft) 56.5 56.5 53 39 Diameter (ft) 42 78 41.5 150 Total Storage Volume (MG) 0.585 2 0.54 4 Gallons per Foot 10,354 35,398 10,189 102,564 Overflow Elevation 307.6 307.6 247.1 327 Base Elevation 251.1 251.1 194.1 295
(1) This reservoir was expanded to its current size in 1959. BOOSTER STATIONS Information regarding the City’s three existing pump stations is described fully below and is summarized in Table 1-4. Ault Field Booster Station The Ault Field Booster Station was originally constructed in 1974 but was expanded in 1991. The booster station is located within the Ault Field naval facility with restricted access. The booster station is in fair condition and has two 125-horsepower Aurora 6 x 8 x 18 Series 410 pumps equipped with variable-frequency drives (VFDs). The pumps are designed to deliver 1,380 gpm at 228 feet of head. The booster station also utilizes two 75-horsepower Worthington 5LR-15 constant-speed pumps which are designed to deliver 700 gpm at 228 feet of head. The pumps are currently controlled by the water level in Westside Reservoirs 1 and 2. As the water level in these reservoirs drops, one variable-speed pump is started. Additional pumps are called to run if the water level continues to drop. Presently, the two Worthington constant-speed pumps are not used to move water to the Westside reservoirs. City staff curtailed the use of these pumps shortly after construction because of high amperage. In 2011, tests conducted on these pumps demonstrated that at normal head conditions, the pumps were operating at 1,500 gpm and approximately 105 amps, which is well above the full-load amperage rating of 89 amps. In order to achieve the desired amperage, the pumps must be throttled to a flow of approximately 785 gpm. These inefficiencies led the City to cease operation of these two pumps and to investigate options for their replacement or modification. Replacement and modification alternatives, along with pump test results and other information, are discussed in the Ault

Gray & Osborne, Inc., Consulting Engineers
1-12 City of Oak Harbor September 2014 2013 Water System Plan Update
Field Booster Station Technical Memorandum (Gray & Osborne, 2011). This memorandum is available in Appendix C. The booster station uses Motorola MoScad RTU telemetry software to relay information about the booster station operation status. This software and telemetry package was installed in 2000. The booster station contains a dedicated 350-kilowatt diesel generator for auxiliary power. The generator is in good condition and is tested monthly for functionality. Heller Street Booster Station The Heller Street Booster Station was constructed in 1989 and is in fair condition. The station serves the 342 Zone (discussed later) and serves approximately 250 single-family equivalent residential units (ERUs) along the western edge of the city limits. The booster station has two 7.5-horsepower U.S. Electric motors connected to two Weinman 2.5 x 3 x 12B constant-speed pumps. These pumps are designed to deliver 215 gpm at 90 feet of head. One of the two pumps runs continuously and a second pump is called to run when discharge pressure falls below 50 psi. The booster station provides domestic pressure only. Fire flows are met by gravity flow from the 307 Zone. A check valve opens and provides flow from the 307 Zone if pressure in the 342 Zone falls below that of the 307 Zone. In 2000, a Motorola MoScad RTU telemetry system was installed. The current auxiliary power source comes from an 80-kilowatt diesel generator, which is also shared with Wells 8 and 9. The generator is in good condition and is tested monthly for functionality. Redwing Booster Station The Redwing Booster Station was constructed in 2004 and remains in good condition. The station serves approximately 215 single-family and multifamily ERUs along the northern edge of the City. The booster station pumps water from the 307 Zone up to the 335 Zone. The booster station has three 7.5-horsepower Aurora 341A Series domestic booster pumps, one 60-horsepower Aurora 360 Series pump used for fire flow, and one 2,200 gallon hydropneumatic pressure tank. The design flow for the domestic and fire flow pumps are 100 gpm at 112 feet of head and 1,800 gpm at 100 feet of head, respectively. The booster station also includes a 100-kilowatt diesel generator for auxiliary power capable of powering all three pumps and the entire facility. The generator comes online
Gray & Osborne, Inc., Consulting Engineers
City of Oak Harbor 1-13 2013 Water System Plan Update September 2014
automatically when power from the grid is interrupted. The generator is in good condition and is tested monthly for functionality. The station also uses Motorola MoScad RTU telemetry software to relay information about the booster station operation status.
TABLE 1-4
Booster Station Summary
Parameter Ault Field
Booster Station Heller Street
Booster Station Redwing
Booster Station Location Forrestal Avenue
(NASWI) SW Heller Street Near SW 2nd Way
1137 Kathleen Drive
Year Built 1974; Modified 1991 and 2000
1989 2004
Overall Condition
Fair Fair Good
Number of Pumps
2 constant-speed; 2 with VFD
2 constant-speed 3 domestic; 1 fire flow
Pump Brand Aurora 6 x 8 x 18 (VFD);Worthington 5LR-15
(constant)
Weinman 2.5 x 3 x 12B(U.S. Electric motors)
Aurora 341A (domestic);Aurora 360 (fire flow) (1)
Design Flow 1,380 gpm (VFD); 700 gpm (constant)
215 gpm 100 gpm (domestic); 1,800 gpm (fire flow)
Pumps To 307 Zone (2) 342 Zone 335 Zone Telemetry Motorola MoScad
RTUs w/Wonderware Motorola MoScad
RTUs w/Wonderware Motorola MoScad
RTUs w/Wonderware Auxiliary Power
350 kW Diesel Generator Set
80 kW Diesel Generator Set
100 kW Diesel Generator Set
(1) Redwing Booster Station also includes a 2,200-gallon hydropneumatic pressure tank. (2) When reservoir construction is completed in 2014, the Ault Field Booster Station will then pump
water to the North Reservoir. PRESSURE ZONES All the elevations listed throughout this plan are based on the NAVD 88 datum. Previous water system plans and water system construction documents prepared for the City are based on the NVGD 1929 datum plus 100 feet. Elevations based on the old datum can be converted to the current NAVD 88 datum by subtracting 96.24 feet. The existing distribution system includes four pressure zones which are shown schematically on Figure 1-6. The Mainland Zone (HGL 307) is supplied by the Ault Field Booster Station and Wells 8, 9, and 11. The hydraulic gradient in the 307 Zone is determined by Westside Reservoirs 1 and 2 with an overflow elevation of
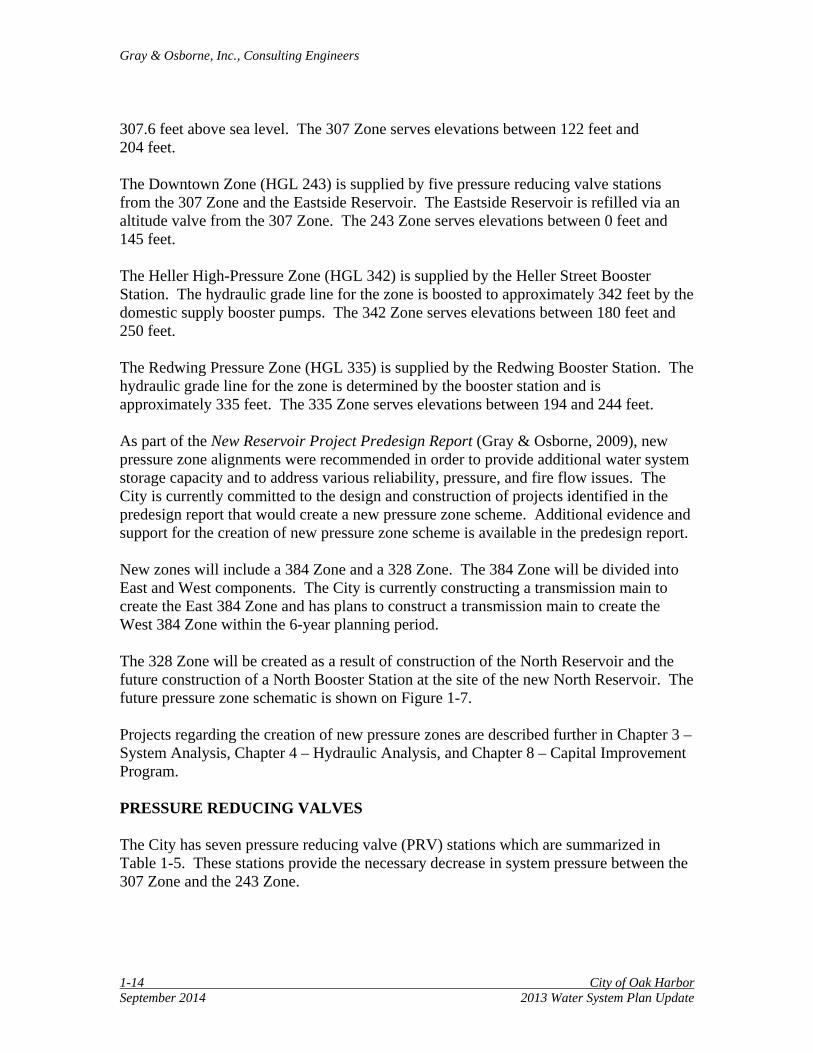
Gray & Osborne, Inc., Consulting Engineers
1-14 City of Oak Harbor September 2014 2013 Water System Plan Update
307.6 feet above sea level. The 307 Zone serves elevations between 122 feet and 204 feet. The Downtown Zone (HGL 243) is supplied by five pressure reducing valve stations from the 307 Zone and the Eastside Reservoir. The Eastside Reservoir is refilled via an altitude valve from the 307 Zone. The 243 Zone serves elevations between 0 feet and 145 feet. The Heller High-Pressure Zone (HGL 342) is supplied by the Heller Street Booster Station. The hydraulic grade line for the zone is boosted to approximately 342 feet by the domestic supply booster pumps. The 342 Zone serves elevations between 180 feet and 250 feet. The Redwing Pressure Zone (HGL 335) is supplied by the Redwing Booster Station. The hydraulic grade line for the zone is determined by the booster station and is approximately 335 feet. The 335 Zone serves elevations between 194 and 244 feet. As part of the New Reservoir Project Predesign Report (Gray & Osborne, 2009), new pressure zone alignments were recommended in order to provide additional water system storage capacity and to address various reliability, pressure, and fire flow issues. The City is currently committed to the design and construction of projects identified in the predesign report that would create a new pressure zone scheme. Additional evidence and support for the creation of new pressure zone scheme is available in the predesign report. New zones will include a 384 Zone and a 328 Zone. The 384 Zone will be divided into East and West components. The City is currently constructing a transmission main to create the East 384 Zone and has plans to construct a transmission main to create the West 384 Zone within the 6-year planning period. The 328 Zone will be created as a result of construction of the North Reservoir and the future construction of a North Booster Station at the site of the new North Reservoir. The future pressure zone schematic is shown on Figure 1-7. Projects regarding the creation of new pressure zones are described further in Chapter 3 – System Analysis, Chapter 4 – Hydraulic Analysis, and Chapter 8 – Capital Improvement Program. PRESSURE REDUCING VALVES The City has seven pressure reducing valve (PRV) stations which are summarized in Table 1-5. These stations provide the necessary decrease in system pressure between the 307 Zone and the 243 Zone.

LEGEND
INCOMING LINE
FROM CITY OF
ANACORTES
EASTSIDE
RESERVOIR NO. 1
REDWING BOOSTER
STATION
WESTSIDE
RESERVOIRS
1 & 2
HELLER
BOOSTER STATION
342
ZONE
335
ZONE
AULT FIELD
BOOSTER STATION
243
ZONE
307
ZONE
~
307
ZONE
M:\O
ak H
arbo
r\13
404
- W
ater
Sys
tem
Pla
n U
pdat
e\FI
GU
RES\
Figu
re 1
-6.d
wg,
12/
12/2
013
9:06
:55
AM, D
WG
To
PDF.
pc3

FUTURE NORTH
BOOSTER STATION
NORTH
RESERVOIRWESTSIDE
RESERVOIRS
1 & 2
LEGEND
WEST
384
ZONE
307
ZONE
322
ZONE
243
ZONE
EAST
384
ZONE
328
ZONE
INCOMING LINE
FROM CITY OF
ANACORTES
AULT FIELD
BOOSTER STATION
~
M:\O
ak H
arbo
r\13
404
- W
ater
Sys
tem
Pla
n U
pdat
e\FI
GU
RES\
Figu
re 1
-7 P
ropo
sed.
DW
G, 1
2/12
/201
3 9:
05:4
8 AM
, DW
G T
o PD
F.pc
3

Gray & Osborne, Inc., Consulting Engineers
City of Oak Harbor 1-15 2013 Water System Plan Update September 2014
TABLE 1-5
Pressure Reducing Valve Summary
PRV Station Location
PRV Elevation
(ft)
PRV Valve Size (in)
PRV Setting
(psi)
Resulting Downstream HGL
(ft) Divides 307 Zone and 243 Zone SW 3rd Avenue and Oak Harbor Street 71.2 8-inch 71 236
3-inch 76 247 SR 20 and SW Scenic Heights Street 84.3 8-inch 65 236
3-inch 70 247
SR 20 and SE Cabot 61 8-inch 76 236 4-inch 81 247
Midway and SE 4th Avenue 107.1 8-inch 56 236
3-inch 61 247 SW Barrington Drive and Fleet Street 94.9 6-inch 61 236
2-inch 66 247 Divides 384 Zone and 307 Zone
Goldie Road 133.8 10-inch 69 293 4-inch 74 305
Gun Club Road 132.8 10-inch 69 292 4-inch 74 304
ALTITUDE VALVES There is one 6-inch altitude valve at the Eastside Reservoir. The altitude valve is set at 240.4 feet (3 feet below the overflow). As the water level drops below this set point, the valve opens and fills the Eastside Reservoir from the 307 Zone. DISTRIBUTION SYSTEM The City currently maintains approximately 103 miles of distribution system piping. Pipe sizes range from 4 inches to 24 inches and are typically ductile iron, but some Class 900 PVC, Class 200 PVC, steel, and asbestos-cement pipes do exist. Water system distribution piping is summarized in Table 1-6.

Gray & Osborne, Inc., Consulting Engineers
1-16 City of Oak Harbor September 2014 2013 Water System Plan Update
TABLE 1-6
Distribution System Piping Summary
Parameter PVC C 900 Asbestos Cement Steel
DuctileIron
Cast Iron
Total (feet)
Total (miles)
Percent of Total
4-inch 1,364 767 8,171 4,223 0 0 14,525 2.8 3.1 6-inch 32,488 1,477 41,331 5,863 324 46 81,529 15.4 17.6 8-inch 50,896 136,067 24,749 1,535 35,559 291 249,097 47.2 53.9
10-inch (1) 6,371 17,319 8,298 850 3,687 2,299 38,824 7.4 8.4 12-inch 9,100 25,987 2,480 150 19,967 68 57,752 10.9 12.5 16-inch 0 1,450 0 0 10,788 0 12,238 2.3 2.6 18-inch 0 0 0 0 7,042 0 7,042 1.3 1.5
24-inch (2) 0 0 0 0 1,067 0 1,067 0.2 0.2 Total (feet) 100,219 183,067 85,029 12,621 78,434 2,704 462,074 87.5 —
Total (miles) 19.0 34.7 16.1 2.4 14.9 0.5 87.5 — —
Percent of Total 21.7 39.6 18.4 2.7 17.0 0.6 — — —
(1) The City also owns the 10-inch asbestos-cement transmission main south of Deception Pass Bridge. Total length under the City’s ownership is 32,208 feet (6.1 miles).
(2) The City also owns the 24-inch ductile iron transmission main south of Deception Pass Bridge. Total length under the City’s ownership is 32,208 feet (6.1 miles).
(3) The total length of each of the mains in (1) and (2) is 61,852 feet (11.7 miles). GENERAL INFORMATION The following section outlines general information regarding the City’s water system and characteristics that can impact water use or water system facilities. GEOGRAPHICAL INFORMATION An aerial map of the City showing the city limits and associated UGAs is shown on Figure 1-4. The U.S. Navy owns and operates several large land areas near the City as part of NASWI. NASWI facilities include air strips, flight support operations, military housing, and various training and operations buildings. Topography Figure 1-8 shows topographical relief for the central Whidbey Island region. In general, the area is slightly higher in the western parts of the City, with a maximum elevation of 260 feet. There are regions of the city limits with elevations as high as 440 feet, but these are located at the far eastern boundary and are located on land used by NASWI. The landscape generally slopes gently down to sea level along the shores of Puget Sound. Areas with significant local slopes and grades include the southern shoreline as well as regions on the Oak Harbor peninsula.

CITY OF OAK HARBOR
2013 WATER SYSTEM PLAN UPDATEFIGURE 1-8
TOPOGRAPHY MAP
0 3,000 6,0001,500Feet
³
CRESCENT HARBOR
PUGETSOUND
90
80
70
60
50
4030
20
10
110
120
130
140
150
160
100
170
180
190
200
210
220
230
240
250
260
270
280
290
300
310
320
330
340
350
360
370
380
390
400
410
420
430
440
450
460
470
160
210
350
440
20
130
360
220
170
200
360
140
440
220
370
200
10
10
420
10
160
140
10
190
410
200
370
90
390
80
130
380
30
180
440
120
40
150
130
400
120
60
70
140
400
340
200
20
160
410100
430
370
140
15090
260
150
180
160
80
130
100
130
410
200
320
160
230
50
360
430
90
150
390
160
70
120
190
200
170
70
140
20
120
80
150
440
10
160
260
190
210
80
120
210
20
70
230
200
80
70
50
90
210
190
190
360
220
390
160
20
90
170
350
13090
200
20
180
150
440
160
130
360
140
150
180
250
190
10
360
400
170
110
90
110
80
160
420
270
360
120
10
420
260
60
190
310
160
140
370
240
140
140
160
110
180
180
70
170
420
10
30
110
180
180
150
420
90
180
340
390
180
190
420
150
210
150
60
90
120
20
140
430
10
130
190
200
150
10
420
110
190
170
170
10
240
110
70
110
180
50
110
440
180
450
180
30
10
40
390
400
150
370
110
190
380
210
180
170
360
390
160
100
100
70
210
180
160
180
200
20
250
150
90
150
30
360
180
230
50
210
80
90
50
180
420
90
350
190
80
150
110
180
110
180
100
130
260
150
160
390
10
200
10
10
210
110
70
110
70
60
150
20110
110
150
90
220
340
200
430
60
200
140
150
290
10
240
140
110
340
140
200
360
190
130
260
210
40
410
390
60
110
190
200
10
130
110
90
100
360
110
270
310
340
170
390
170
420
130
90
30
200
50
60
40
180
100
200
30
390
400
400
150
150
170
50
150
180
110
80
440
10
220
80
10
150
110
430
40
70
350
390
200
90
130
110
180
30
170
380
230
170
270
170
110
270
300
10
170
420
160
220
240
60
10
170
390
240
320
360
180
130
350
170
10
140
430
300
240
40
160
130
30
170
190
190
380
230
180
280
110
370
110
160
140
440
1017
0
110
80
170
140
190
360
70
140
150
280
110
180
10
170
190
130
50
90
190 100
30
190
60
10
80
40
240
40
10
10
110
50
50
400
160
150
140
100
80
440
130
150
290
10
230
180
100
70
180
300
10
220
160
200
80130
190
80
210
90
90
140
140
50
190
150
140
170
10
140
90
250
40
440
340
180
230
40
230
90
10
440
70
34050
350
150
430
150
50
180
10
80
150
340
90
180
210
350
130
150
200
50
30
220
150
180
250
200
190
100
10
420
450
320
80
90
10
140
130
160
10
290
380
360
290
180
180
410
230
170
20
160
100
110
60
150
20
110
90
270
130
190
200
10
90
10
190
370
300
390
350
120
20
200
200
380
50
70
180
230
210
140
30
160
400
340
70
50
140
450
100
110
140
90
70
220
140
50
100
60
280
170
430
210
160
110
90
170
60
40
190
190
420
190
190
160
110
150
110
80
110
90
10
90
130
180
310
40
100
210
110
180
180
240
400
100
30
60
130 130
220
380
310
230
150
210
140
160
10
60
210
10
190
80
190
60
160
330
230
10020
0
90
10
10
300
90
180
10
10 140
160
410
210
390
210
380
10
200
160
60
210
120
10
200
110
90
30
140
40
10
200
90
80
290
220
350
10
70
10
80
90
50
290
110
140
50
300
330
50
10
40
130
370
420
150
180
120
410
170
220
370
State
Rte 2
0
E Sleeper Rd
W Ault Field Rd
E Crescent Harbor Rd
E Pioneer Way
Swantown Rd
SE Pioneer Way
W Sleeper Rd
E Fakkema Rd
Coral S
ea Ave
W Waterloo Rd
W Whidbey Ave
Fort Nugent Rd
W Clover Valley Rd
W Crescent Harbor Rd
E Pioneer Way
E Whidbey Ave
Pion
eer W
aySW Fort Nugent AveW Fort Nugent Rd
W Fakkema Rd
Clover Valley Rd
LEGEND:CITY LIMITSEXISTING/RETAIL SERVICE AREAFUTURE SERVICE AREA
M:\Oak Harbor\13404 - Water System Plan Update\GIS\TOPO.mxd

CITY OF OAK HARBOR
2013 WATER SYSTEM PLAN UPDATEFIGURE 1-10
SOIL CLASSIFICATION MAP
0 3,000 6,0001,500Feet
³
CRESCENT HARBOR
PUGETSOUND
3017
3017
3017
2019
30112013
3011
3017
3011
3011
3011
3017
3011
3011
996
2018
3017
30111055
997
1021
3019
3017
1022
3011
1021
3019
1022
3017
2010
2019
3017
1022
3024
2013
2012
2018
1006
2018
2019
2010
2019
3019
2010
2019
2012
994
2018
2012
2000
1022
3011
1018
3019
3011
2012
2023
1022
1017
2018
2019
1053
10221021
30192023
3019
1053
2023
2012
2023
2012
2012
10211017
2012
3019
1022
2023
1025
2012
3019
3017
3017
1023
2019
3024
3011
3019
1022
2054
1019
1018
3011
2010
2023
1022
1023
2019
2013
1005
2000
2019
2010
2019
1022
3024
2018
2012
995
3019
1021
2012
1018
2016
1022
1022
2012
1023
3017
3017
3011
3017
996
997
1022
2013
1023
1022
3011
1054
2019
1005
2019
2023
1018
1021
1006
1021
1006
2019
2012
1023
997
3011
3019
1021
2018
1016
1022
1006
2013 1025
1021
1025
3008
3008
3019
3011
2023
1017
2019
1023
3008
3017
1006
1022
3020
1025
1022
2010
3017
1017
1021
2019
1006
3018
1006
2019
3011
1022
1022
1005
3017
2013
1017
1022
1017
2000
2023
20231005
1022
1017
3017
999
2019
3020
2055
2013
1005
1021
3008
3017
2012
1020
1023
2012
1022
1005
3019
3017
1023
3011
2023
2013
3019
1022
1025
1005
1023
1006
996
1005
1018
2055
999
1022
3022
2023
2018
1006
2055
1006
1005
1005
3024
1022
1025
999
1027
1023
2019
2018997
1005
2010
2019
1026
3001
1023
State
Rte 2
0
E Sleeper Rd
W Ault Field Rd
E Crescent Harbor Rd
E Pioneer Way
Swantown Rd
SE Pioneer Way
W Sleeper Rd
E Whidbey Ave
E Fakkema Rd
Pion
eer W
ay
W Waterloo Rd
W Whidbey Ave
SW Fort Nugent Ave
W Fakkema Rd
W Crescent Harbor Rd
Clover Valley Rd
Cor
al S
ea A
ve
Fort Nugent RdW Fort Nugent Rd
W Clover Valley Rd
E Pioneer Way
LEGEND:CITY LIMITSEXISTING/RETAIL SERVICE AREAFUTURE SERVICE AREA
SOILS DESCRIPTION:3022 - Aquic Dystroxerepts-Oxyaquic Xerorthents complex, 15 to 70 percent slopes1025 - Beaches-Endoaquents, tidal-Xerorthents association, 0 to 5 percent slopes1023 - Coupeville loam, 0 to 3 percent slopes1027 - Coupeville loam, prairie, 0 to 3 percent slopes1018 - Coupeville-Mitchellbay, cool, complex, 0 to 5 percent slopes1022 - Coveland loam, cool, 0 to 5 percent slopes1026 - Coveland loam, prairie, 0 to 5 percent slopes1053 - Dugualla muck, 0 to 2 percent slopes996 - Dumps2012 - Elwha-Zylstra-Morancreek, cool, complex, 2 to 12 percent slopes3018 - Everett sandy loam, 15 to 40 percent slopes3011 - Everett-Alderwood complex, 0 to 5 percent slopes3019 - Everett-Alderwood complex, 15 to 40 percent slopes3017 - Everett-Alderwood complex, 3 to 15 percent slopes3001 - Hoypus sandy loam, 3 to 25 percent slopes3024 - Indianola loamy sand, 3 to 15 percent slopes3020 - Indianola loamy sand, 8 to 25 percent slopes2019 - Mitchellbay gravelly sandy loam, cool, 2 to 10 percent slopes1019 - Morancreek, cool-Limepoint complex, 0 to 5 percent slopes1016 - Orcas peat, 0 to 2 percent slopes997 - Pits, gravel1054 - Puget silty clay loam, 0 to 2 percent slopes1006 - Semiahmoo muck, 0 to 2 percent slopes1005 - Shalcar muck, 0 to 2 percent slopes1020 - Sholander, cool-Limepoint complex, 0 to 8 percent slopes1021 - Sholander, cool-Spieden complex, 0 to 5 percent slopes2018 - Sucia loamy sand, cool, 2 to 10 percent slopes2023 - Sucia-Sholander complex, cool, 2 to 15 percent slopes994 - Urban Land1055 - Urban Land-Coupeville-Coveland, cool, complex, 0 to 5 percent slopes995 - Water999 - Water, fresh2000 - Whidbey gravelly loam, 3 to 15 percent slopes2010 - Whidbey-Hoypus complex, 2 to 15 percent slope3008 - Xerorthents-Endoaquents, tidal association, 0 to 100 percent slopes2016 - Zylstra-Alderwood complex, 3 to 30 percent slopes1017 - Zylstra-Frostad complex, 0 to 3 percent slopes2013 - Zylstra-Frostad complex, 0 to 8 percent slopes2054 - Zylstra-Mitchellbay, cool, complex, 0 to 5 percent slopes2055 - Zylstra-Mitchellbay, cool, complex, 2 to 10 percent slopes
DATA SOURCE: DEPARTMENT OF AGRICULTURE (USDA)
M:\OAK HARBOR\13404 - WATER SYSTEM PLAN UPDATE\GIS\SOILS.MXD

Gray & Osborne, Inc., Consulting Engineers
City of Oak Harbor 1-17 2013 Water System Plan Update September 2014
Climate The City experiences relatively mild weather due to its proximity to the Pacific Ocean and its location within the rain shadow of the Olympic Mountains. Because of these moderate conditions, the City does not experience significant temperature extremes or high precipitation. This is important primarily because extreme temperatures, especially high temperatures in the summer, can lead to high water demand by residential and irrigation customers. Monthly average temperature and precipitation values are shown graphically on Figure 1-9.
0.0
10.0
20.0
30.0
40.0
50.0
60.0
70.0
Oct-06 Aug-07 Jun-08 Mar-09 Jan-10 Nov-10 Sep-11 Jul-12
Date
Tem
pera
ture
(deg
F)
0.00.51.01.52.02.53.03.54.04.55.05.56.06.57.0
Prec
ipita
tion
(in)
Temperature Average Precipitation
FIGURE 1-9
Historical Monthly Precipitation and Average Temperature Soil Figure 1-10 shows the approximate locations of various soil types within the City’s UGA and surrounding areas. The majority of the City’s service area is composed of loamy soils of the Coveland or Everett-Alderwood Complex, with slopes of less than 15 percent.

Gray & Osborne, Inc., Consulting Engineers
1-18 City of Oak Harbor September 2014 2013 Water System Plan Update
Sensitive Areas There are various types of sensitive areas within the City’s UGA. These are areas that would require special consideration in the case of new development for water system infrastructure. The sensitive areas most applicable to the City are described below. Erosion Hazard Areas Erosion hazard areas are areas which are highly susceptible to erosion when disturbed. As such, these are also areas that may not be suited for development or the installation of infrastructure components such as booster stations or water piping. Erosion hazard areas are combined with other similar sensitive areas as a group of geologically sensitive areas addressed in Chapter 20.28 of the Oak Harbor Municipal Code (OHMC). Within the City, these areas include shorelines and areas along the southern edges of the city limits. Landslide Hazard Areas Landslide hazard areas are areas prone to unstable behavior due to steep slopes, lack of vegetation, or unconsolidated soils, and include areas potentially subject to risk of land movement due to a combination of geologic, topographic, and hydrologic factors. Specific buffer regions and building setbacks apply to any development that abuts or contains these areas; however, setbacks may be reduced as the result of special studies. As with erosion hazard areas, landslide hazard areas are one of the geologically sensitive areas addressed in Chapter 20.28 of the OHMC. With regard to water systems, these development regulations can affect the amount of buildable area and/or reduce the potential risk for landslides and mass wasting that could impact water infrastructure and natural resources. Landslide areas for the City also include shorelines and areas along the southern edges of the city limits. Seismic Hazard Areas Seismic hazard areas are those with low-density soils that are more likely to experience greater damage due to seismic-induced subsidence, liquefaction, ground shaking, or landslides. Seismic hazard areas are regulated with regard to public safety and the potential mass wasting that might occur during an earthquake. Any water source, storage, or distribution facility within these areas must be designed to minimize risk of harm from earthquakes or other seismic activity. These areas are of particular concern for the City due to the presence of the Strawberry Point and Utsalady Faults that run from east to west across the north side of the City, and areas with a high potential for liquefaction such as the Oak Harbor peninsula. Seismic hazard areas are shown on Figure 1-11.

CITY OF OAK HARBOR
2013 WATER SYSTEM PLAN UPDATEFIGURE 1-11
SENSITIVE AREAS MAP
0 3,000 6,0001,500Feet
³
CRESCENT HARBOR
PUGETSOUND
State
Rte 2
0
E Sleeper Rd
W Ault Field Rd
E Crescent Harbor Rd
E Pioneer Way
Swantown Rd
SE Pioneer Way
W Sleeper Rd
E Whidbey Ave
E Fakkema Rd
Coral S
ea Ave
Pion
eer W
ay
W Waterloo Rd
W Whidbey Ave
Fort Nugent Rd SW Fort Nugent Ave
W Fakkema Rd
W Clover Valley Rd
W Crescent Harbor Rd
E Pioneer Way
LEGEND:CITY LIMITSEXISTING/RETAIL SERVICE AREAFUTURE SERVICE AREA
SEISMIC FAULTS:STRAWBERRY POINTUTSALADY POINTPARCELS
FISH & WILDLIFE HABITAT:FISH DISTRIBUTIONSTREAMS
POTENTIAL LIQUEFACTION AREAS:MODERATEHIGH
WETLANDS:ESTUARINE AND MARINE WETLANDFRESHWATER EMERGENT WETLANDFRESHWATER FORESTED/SHRUB WETLANDFRESHWATER PONDWATEROTHERRIVERINE
DATA SOURCE: DEPARTMENT OF NATURAL RESOURCES (DNR)
AREA INUNDATED BY 100 YEAR FLOODING, FOR WHICH NO BFE'S HAVE BEEN ESTABLISHED
FEMA FLOOD ZONES:
AREA INUNDATED BY 500 YEAR FLOODING; AN AREA INUNDATED BY 100-YEAR FLOODING WITH AVERAGE DEPTHS OF LESS THAN 1 FOOT ORWITH DRAINAGE AREAS LESS THAN 1SQUARE MILE; OR AN AREA PROTECTEDBY LEVEES FROM 100 YEAR FLOODING
M:\OAK HARBOR\13404 - WATER SYSTEM PLAN UPDATE\GIS\SENSITIVE.MXD

Gray & Osborne, Inc., Consulting Engineers
City of Oak Harbor 1-19 2013 Water System Plan Update September 2014
Flood Hazard Areas Flood hazard areas are regions adjacent to lakes, rivers, streams, or other water bodies prone to flooding during high rainfall and runoff periods. These areas require special attention due to the sensitive ecosystems associated with them and the potential damage to any buildings or other facilities built within the floodplain. Flooding information and flood hazard areas are addressed in Chapter 17 of the OHMC. Figure 1-11 shows the areas within Oak Harbor that are particularly susceptible to flooding. Wetlands Wetlands are defined in WAC 173-22-030(10) as areas that are inundated or saturated by surface or ground water for sufficient time to support vegetation typically adapted for life in saturated soils. The OHMC addresses wetlands in Chapter 20.24. These areas support valuable and complex ecosystems and consequently, development in these areas is highly restricted. The National Wetlands Inventory maps, as well as those on file with Island County identify several wetlands within and near the city limits. These areas are shown on Figure 1-11. There are specific buffers and allowable alterations for development within a designated wetland area. There are also requirements for special studies and determinations to be performed to identify and classify wetlands. In general, Island County does not allow development in regulated wetlands; however, if development and/or its impacts are unavoidable, then mitigation measures are required. Water Bodies Lakes, streams, and other water bodies are classified as sensitive areas due to the variety of plants and animals they support. These plants and animals can often be a source of income or livelihood for local economies, and protecting them is a high priority to both DOH as well as the Washington State Department of Ecology (Ecology). The City has designated corridor zones which are planning areas with variable width setbacks from the ordinary high-water mark elevation of the stream or water course, from the top of the bank or dike, if applicable. Figure 1-11 shows the sensitive water bodies surrounding the City. Fish and Wildlife Habitat Fish and wildlife habitat is defined as areas which meet the definition of a “Fish and Wildlife Habitat Critical Area” pursuant to WAC 365-190-080(5) as well as Chapter 20.25 of the OHMC. A proposed activity within 300 feet of these areas requires that a habitat assessment be prepared. This assessment is circulated to all appropriate agencies for review. After review, a Habitat Management Plan may be required to address the project’s potential impacts, provide background information on the affected species, and recommend protection and mitigation measures. After project

Gray & Osborne, Inc., Consulting Engineers
1-20 City of Oak Harbor September 2014 2013 Water System Plan Update
implementation, an assessment of the project’s success with regard to sustaining critical fish and wildlife species habitat is required. The City is home to a variety of protected and at-risk species, including bald eagle, harlequin duck, heron species, geoduck and other shellfish areas, as well as eelgrass beds. Some of these fish and wildlife habitat conservation areas are shown on Figure 1-11. Critical Aquifer Recharge Areas These areas are discussed in Chapter 20.32 of the OHMC. They are defined as areas which have a critical recharging effect on local aquifers used to supply potable water. These areas are regulated by the City and have limitations on the development and activities on land directly above the critical aquifer. Restricted activities typically involve hazardous chemical storage or other industrial use which may introduce harmful chemicals into the environment. Critical aquifer recharge areas (CARA) are shown on Figure 1-12. Archaeological Areas Whidbey Island and the area incorporated by the City are known to have been populated by southern Northwest Coast Salish people prior to arrival of European settlers. The City was an important site to these people and evidence of their lives and culture are continually present Section 106 of the National Historic Preservation Act requires federal agencies to take into account the effects of their undertakings on historic properties that are included in or meet the criteria for listing on the National Register of Historic Places. Historic properties may include archaeological sites, buildings, structures, districts, or other objects. Regulations implementing Section 106 encourage maximum coordination with the environmental review process required by the National Environmental Protection Act and with other statutes. Under the auspices of the National Historic Preservation Act, the City is required to consult with the Department of Archaeology and Historic Preservation, the Swinomish Indian Tribal Community, the Stillaguamish Tribes of Indians, Samish Indian Nation, the Tulalip Tribes, local governments, and members of the public to resolve potentially adverse effects from development activities. The City is also subject to relevant state laws addressing archaeological sites and Native American burials. The Archaeological Sites and Resources Act prohibits knowingly excavating or disturbing prehistoric and historic archaeological sites on public or private land. The Indian Graves and Records Act prohibits knowingly destroying American Indian graves and provides that inadvertent disturbance through construction or other activity requires re-interment under the supervision of the appropriate Indian Tribe. The Archaeological Site Public Disclosure Exemption ensures that records, maps, and other information identifying the location of archaeological sites are exempt from disclosure in order to prevent looting or depredation of cultural resources.

CRESCENT HARBOR
State
Rte 2
0
W Ault Field Rd
E Crescent Harbor Rd
E Pioneer Way
Swantown Rd
SE Pioneer Way
E Whidbey Ave
E Fakkema Rd
Coral S
ea AveFort Nugent Rd
Pion
eer W
ay
W Waterloo Rd
W Fort Nugent Rd
W Whidbey Ave
SW Fort Nugent Ave
W Fakkema Rd
W Clover Valley Rd
W Crescent Harbor Rd
E Pioneer Way
0 2,500 5,0001,250Feet
³
CITY OF OAK HARBOR
2013 WATER SYSTEM PLAN UPDATEFIGURE 1-12
CRITICAL AQUIFER RECHARGE AREAS MAP
DATA SOURCE: DEPARTMENT OF NATURAL RESOURCES (DNR)
LEGEND:CITY LIMITSEXISTING/RETAIL SERVICE AREAPARCELSFUTURE SERVICE AREA
AQUIFER SUSCEPTIBILITY:LOWMODERATEHIGH
M:\OAK HARBOR\13404 - WATER SYSTEM PLAN UPDATE\GIS\AQUIFER.MXD

Gray & Osborne, Inc., Consulting Engineers
City of Oak Harbor 1-21 2013 Water System Plan Update September 2014
As most water system infrastructure is buried underground, disturbing archaeological resources is possible any time excavation is done to maintain, repair or extend the City’s water facilities. The City has implemented several policies intended to prevent adverse effects on cultural resources by underground utility installation and maintenance. The first step is a staff review of development and utility permit applications. Applications for work that includes ground-disturbing activities in the public right-of-way are assessed by staff for risk of disturbance of resources. Some applicants are required to conduct archaeological surveys prior to excavating and may be required to employ an archaeologist to monitor excavation while it is occurring. All applicants are provided with a copy of the City’s Inadvertent Discovery Protocol (“Protocol”). The Protocol includes descriptions and photographs of common artifacts and instructions for contacting appropriate authorities and City staff should artifacts be found. A copy of the Protocol is included in Appendix D. SYSTEM INFORMATION INTERTIES The City currently has four interties with the NASWI water system. These interties provide added reliability for both water systems and are for emergency use only and there is no exchange of water during normal system operation. None of the interties contain check valves and flow may go to or from either the City or NASWI. The direction of flow would depend on the current hydraulic grade line, reservoir levels, and Ault Field Booster Station pump status. All interties are controlled by valves normally kept closed. Interties are located as follows:
• A 12-inch intertie along Goldie Street north of NE 16th Street, • A 10-inch intertie on Regatta Drive south of East Whidbey Street, • A 6-inch intertie at the Skagit Valley College campus, and • A 4-inch intertie near NASWI Building 197.
NASWI water use is recorded directly by meter readings at a facility adjacent to the Ault Field Booster Station (Figure 1-2). The City owns all piping, valves, and meters through the meter directly upstream of NASWI Tank 197 and Tank 2849, and NASWI owns and operates all piping and appurtenances on the downstream side of this meter. WHOLESALE CUSTOMERS The City provides wholesale water service to NASWI, which is a Group A community water system located both within and outside the city limits. According to DOH records, this water system currently has 1,900 connections. The water system operates two wells at depths of approximately 190 feet with capacities of 64 gpm and 100 gpm, but receives a majority of its potable water from the City as part of a wholesale customer agreement. Additional information on the NASWI water system is available in the 2008 NASWI Water System Plan (KPFF, 2008).

Gray & Osborne, Inc., Consulting Engineers
1-22 City of Oak Harbor September 2014 2013 Water System Plan Update
The City also provides water to the North Whidbey Water District (NWWD) via a direct connection to the 10-inch transmission main. The NWWD is a small Group A water system immediately south of Deception Pass along Highway 20 (Figure 1-1). The system maintains 22 of an approved 26 allowable connections. It is estimated that the District serves a population of 568 people, which is approximately 97 percent non-residential. The City provides water to the Washington State Parks Commission – Deception Pass State Park from a direct connection off the 10-inch transmission main immediately south of the Deception Pass Bridge (Figure 1-1). This park serves a small number of permanent residents who maintain the facilities, as well as a large number of seasonal State Park users. Facilities include showers, restrooms, drinking water faucets, and a visitor center for day- or overnight-use visitors. ADJACENT AND NEIGHBORING PURVEYORS The City is in close proximity to a number of small and medium Group A water systems that serve communities around the City. These water systems are briefly described below, are summarized in Table 1-7, and their approximate locations are shown on Figure 1-13. In general, the systems listed below are in adequate condition and do not exhibit any significant water quality issues. Although the City is not interested in proactively seeking system consolidation at this time, they are amenable to system consolidation, depending on financial and scheduling considerations. System consolidation based on a water quality need is often subject to extremely favorable financial terms for capital projects required to bring the system up to City design standards and the City may wish to work with DOH in the event that a system is in need of consolidation. Bayview Estates Water Company The Bayview Estates Water Company water system is a Group A community water system located on the eastern side of the City outside of the city limits and outside the UGA. This water system currently serves 81 of a possible 96 connections to an estimated population of 227 people. The water system operates two wells at a depth of approximately 380 feet, with capacities of 55 gpm and 58 gpm. The distribution capacity of this water system is 44,000 gallons and the system is treated with sodium hypochlorite. The Bayview Estates Water Company water system has no recent significant water quality issues; however, it has had issues with the presence of coliforms as recently as October 2008. Bets Water System The Bets water system is a Group A community water system located on the north side of the City outside of the city limits but within the UGA. This water system currently serves 29 connections to an estimated population of 50 people, but appears from land use

CITY OF OAK HARBOR
2013 WATER SYSTEM PLAN UPDATEFIGURE 1-13
ADJACENT WATER PURVEYOR MAP
0 3,000 6,0001,500Feet
³
CRESCENT HARBOR
PUGETSOUND
NASWI WATER SYSTEM
NASWI WATER SYSTEM
OAK HARBOR
BAYVIEW ESTATES WATER CO.
SWANTOWN WATER DISTRICT
HILLCREST VILLAGE WATER CO. INC.
WATERLOO ACRES COMMUNITY WATER
SYSTEM
CROSSWOODS WATER CO.
FAIRWAY ESTATES INC.
SUBURBAN MHP
SUBURBAN HILLS COMMUNITY ASSN.
WEST RIDGE WATER SYSTEM
PARKWOOD MANOR MHP
PINE TERRACE WATER ASSN.BETS WATER SYSTEM
INDIAN RIDGE WATER CO.
VALLEY HIGH POINT WATER ASSN.
HIGHLAND TRACE WATER CO. INC.
EVERGREEN PARK WATER SYSTEM
FIR GROVE MHP
State
Rte 2
0
E Sleeper Rd
W Ault Field Rd
E Crescent Harbor Rd
E Pioneer Way
Swantown Rd
SE Pioneer Way
W Sleeper Rd
E Whidbey Ave
E Fakkema Rd
Coral S
ea Ave
Pion
eer W
ay
W Waterloo Rd
Fort Nugent Rd
W Whidbey Ave
SW Fort Nugent Ave
W Fakkema Rd
W Clover Valley Rd
W Crescent Harbor Rd
E Pioneer Way
LEGEND:CITY LIMITSEXISTING/RETAIL SERVICE AREAFUTURE SERVICE AREAPARCELS
WATER PURVEYORS:BAYVIEW ESTATES WATER CO.BETS WATER SYSTEMCROSSWOODS WATER CO.EVERGREEN PARK WATER SYSTEMFAIRWAY ESTATES INC.FIR GROVE MHPHIGHLAND TRACE WATER CO. INC.HILLCREST VILLAGE WATER CO. INC.INDIAN RIDGE WATER CO.NASWI WATER SYSTEMPARKWOOD MANOR MHPPINE TERRACE WATER ASSN.SUBURBAN HILLS COMMUNITY ASSN.SUBURBAN MHPSWANTOWN WATER DISTRICTVALLEY HIGH POINT WATER ASSN.WATERLOO ACRES COMMUNITY WATER SYSTEMWEST RIDGE WATER SYSTEM
DATA SOURCE: ISLAND COUNTY
M:\Oak Harbor\13404 - Water System Plan Update\GIS\PURVEYORS.mxd

Gray & Osborne, Inc., Consulting Engineers
City of Oak Harbor 1-23 2013 Water System Plan Update September 2014
and aerial maps to be commercially based. The water system operates a single well at a depth of approximately 78 feet with a capacity of 30 gpm. The distribution capacity of this water system is unknown and the system does not treat its water. The Bets water system has no recent significant water quality issues. Crosswoods Water Company The Crosswoods Water Company is a Group A community water system located on the southwestern side of the City along Swantown Road outside the city limits but within the UGA. This water system currently serves 127 of a possible 130 connections to an estimated population of 420 people. The water system operates two wells with depths of 174 feet and capacities of 55 gpm and 65 gpm. The distribution capacity of this water system is 40,000 gallons and the system is disinfected with sodium hypochlorite. The Crosswoods Water Company water system has no recent significant water quality issues; however, it has had issues with the presence of coliforms as recently as October 2009. Evergreen Park The Evergreen Park water system is a Group A community water system located on the eastern side of the City within the city limits. This water system currently serves 18 connections to an estimated population of 32 people. The water system operates a single well at a depth of approximately 66 feet with a capacity of 50 gpm. The distribution capacity of this water system is unknown and the system does not treat its water. The Evergreen Park water system has no recent significant water quality issues; however, it has had serious issues with the presence of coliforms as recently as 2008. The Evergreen Park water system has historically had mechanical issues with their water system equipment. The water system has communicated with the City about connecting to the municipal system in the event of another significant mechanical problem. The system serves 18 connections, and has space for only two additional mobile home connections. Fairway Estates, Inc. The Fairway Estates, Inc. water system is a Group A community water system located on the western side of the City outside of the city limits but within the UGA. This water system currently serves 29 of a possible 25 connections to an estimated population of 100 people. The water system operates a single well with a depth of 206 feet and a capacity of 25 gpm. The distribution capacity of this water system is 21,000 gallons and the system is disinfected with sodium hypochlorite. The Fairway Estates, Inc. water system has no recent significant water quality issues.

Gray & Osborne, Inc., Consulting Engineers
1-24 City of Oak Harbor September 2014 2013 Water System Plan Update
Fir Grove Mobile Park The Fir Grove Mobile Home Park is a Group A community water system located on the southwestern side of the City outside of the city limits but within the UGA. This water system currently serves 19 connections to an estimated population of 65 people. The water system operates a single well at a depth of approximately 250 feet with a capacity of 18 gpm. The distribution capacity of this water system unknown and the system is disinfected with sodium hypochlorite. The Fir Grove water system has no recent significant water quality issues. Forest Hills Park Community The Forest Hills Park Community water system is a Group A community water system located on the west side of the City outside of the city limits and outside the UGA. This water system currently serves 23 of a possible 25 connections to an estimated population of 54 people. The water system operates a single well at a depth of 249 feet with a capacity of 25 gpm. The distribution capacity of this water system is 20,000 gallons and the system does not treat its water. The Forest Hills Park Community water system has had significant recent water quality issues, with the presence of coliforms as recently as June 2012. Highland Trace Water Company, Inc. The Highland Trace Water Company, Inc. water system is a Group A community water system located on the southwestern side of the City outside of the city limits but within the UGA. This water system currently serves 24 of a possible 25 connections to an estimated population of 62 people. The water system operates a single well at a depth of approximately 164 feet with a capacity of 25 gpm. A second, older well is no longer active. The distribution capacity of this water system is 22,000 gallons and the system does not treat its water. The Highland Trace Water Company, Inc. water system has no recent significant water quality issues; however, it has had serious issues with the presence of coliforms as recently as October 2011. Hillcrest Village Water Company, Inc. The Hillcrest Village Water Company, Inc. is a Group A community water system located on the western side of the City outside of the city limits but within the UGA. This water system currently serves 276 of a possible 300 connections to an estimated population of 770 people. The water system operates four wells with depths of 232, 217, 243, and 213 feet. The capacities for these wells are 40, 80, 110, and 80 gpm, respectively. A fifth well has been inactive since February 1998. The distribution capacity of this water system, which is a measure of the approximate total storage volume for the system, is 300,000 gallons and the system is disinfected with sodium hypochlorite. The Hillcrest Village Water Company, Inc. system has no recent significant water quality issues.

Gray & Osborne, Inc., Consulting Engineers
City of Oak Harbor 1-25 2013 Water System Plan Update September 2014
Indian Ridge Water Company The Indian Ridge Water Company is a Group A community water system located on the southwestern side of the City near Swantown Road outside of the city limits but within the UGA. This water system currently serves 40 of a possible 42 connections to an estimated population of 119 people. The water system operates a single well at a depth of approximately 203 feet with a capacity of 95 gpm. The distribution capacity of this water system is 13,500 gallons and the system does not currently treat its water. The Indian Ridge Water Company system has no recent significant water quality issues. Naval Air Station Whidbey Island The Naval Air Station Whidbey Island water system is a Group A community water system. This water system currently serves 1,900 connections to an estimated population of 5,100 people. The water system operates two wells at depths of approximately 190 feet with capacities of 64 gpm and 100 gpm. This water system also receives water from the City of Oak Harbor as part of a wholesale customer agreement which was discussed previously. That source is estimated at 2,000 gpm and is treated with sodium hypochlorite as well as sodium fluoride. NASWI owns a total of five storage tanks, but only four of these tanks are used. The distributed capacity of this water system is 6,900,000 gallons. The NASWI water system has no recent significant water quality issues; however, it did have one sample that exceeded the allowable limit for coliforms in September 2011. Parkwood Manor The Parkwood Manor Mobile Home Park is a Group A community water system located on the north side of the City within the city limits. This water system currently serves 198 of a possible 198 connections to an estimated population of 301 people. The water system operates two wells at a depth of approximately 195 feet, each with a capacity of 60 gpm. The distribution capacity of this water system is 73,000 gallons and the system is disinfected with sodium hypochlorite. The Parkwood Manor system has no recent significant water quality issues. Pine Terrace Water Association The Pine Terrace Water Association is a Group A community water system located on the north side of the City outside of the city limits but within the UGA. This water system currently serves 66 of a possible 74 connections to an estimated population of 180 people. The water system operates two wells at depths of 159 and 178 feet with capacities of 20 gpm and 200 gpm, respectively. The distribution capacity of this water system is 55,000 gallons and the system is disinfected with sodium hypochlorite. The Pine Terrace Water Association has had recent water quality issues with conductivity,

Gray & Osborne, Inc., Consulting Engineers
1-26 City of Oak Harbor September 2014 2013 Water System Plan Update
total trihalomethanes, and haloacetic acids in 2011 and 2012, as well as the presence of coliforms as recently as 2009. Suburban Hills Community Association The Suburban Hills Community Association is a Group A community water system located on the north side of the City outside of the city limits but within the UGA. This water system currently serves 15 of a possible 17 connections to an estimated population of 46 people. The water system operates a single well at a depth of approximately 208 feet with a capacity of 35 gpm. The distribution capacity of this water system is 20,000 gallons and the system does not currently treat its water. The Suburban Hills Community Association system has no recent significant water quality issues; however, has had serious issues with the presence of coliforms as recently as 2005. Suburban Mobile Park The Suburban Mobile Park is a Group A community water system located north of the City outside of the city limits and outside the UGA. This water system currently serves 26 of a possible 26 connections to an estimated population of 60 people. The water system operates two wells at depths of approximately 240 and 270 feet with capacities of 10 gpm each. The distribution capacity of this water system is 4,800 gallons and the system is treated with sodium hypochlorite. The Suburban Mobile Park system has no recent significant water quality issues; however, has had issues with excessive conductivity, which is related to solids concentration, as recently as 2012. Swantown Water District The Swantown Water District is a Group A community water system located on the western side of the City within the city limits. This water system currently serves 96 of a possible 130 connections to an estimated population of 318 people, which includes some non-residential population. The water system operates two wells at a depth of approximately 130 feet with capacities of 55 gpm and 75 gpm. The distribution capacity of this water system is 40,000 gallons and the system does not currently treat its water. The Swantown Water District system has no recent significant water quality issues. Valley High Park The Valley High Park community water system is a Group A community water system located on the north side of the City outside of the city limits but within the UGA. This water system currently serves 47 of a possible 47 connections to an estimated population of 141 people. The water system operates a single well at a depth of 199 feet with a capacity of 35 gpm. The distribution capacity of this water system is 40,000 gallons and the system is treated with sodium hypochlorite. The Valley High Park community water system has had no significant recent water quality issues.

Gray & Osborne, Inc., Consulting Engineers
City of Oak Harbor 1-27 2013 Water System Plan Update September 2014
Waterloo Acres The Waterloo Acres community water system is a Group A community water system located on the south end of the City outside of the city limits and outside the UGA. This water system currently serves 46 of a possible 48 connections to an estimated population of 125 people. The water system operates a single well at a depth of 185 feet with a capacity of 35 gpm. The distribution capacity of this water system is 40,000 gallons and the system is treated through aeration, catalytic media filtration, and permanganate addition. The Waterloo Acres community water system has had significant recent water quality issues with lead and copper rule compliance as well as the presence of coliforms as recently as 2012. West Ridge Water System The West Ridge Water System is a Group A community water system located on the southwestern side of the City outside of the city limits but within the UGA. This water system currently serves 90 of a possible 90 connections to an estimated population of 275 people. The water system operates two wells at a depth of approximately 264 feet with capacities of 58 gpm and 26 gpm. The distribution capacity of this water system is 43,500 gallons and the system is treated with sodium hypochlorite. The West Ridge Water System has no recent significant water quality issues.
TABLE 1-7
Adjacent Purveyor Summary(1)
System Name Group ID Number of
Connections(2) Population
Served Bayview Estate Water Company 4956 81/96 227 Bets Water System 39991 29 (3) 50 Crosswoods Water Company 16274 127/130 420 Evergreen Park 24153 19 (3) 32 Fairway Estates, Inc. 24524 29/25 100 Fir Grove Mobile Park 25137 19 (3) 65 Forest Hills Park Community 9871 23/25 54 Highland Trace Water Company, Inc. 32840 24/25 62 Hillcrest Village Water Company, Inc. 33150 276/300 770 Indian Ridge Water Company 35640 40/42 119 Parkwood Manor 66218 198/198 301 Pine Terrace Water Association 67600 66/74 180 Suburban Hills Community Association 37911 15/17 46 Suburban Mobile Park 84730 26/26 60 Swantown Water District 96042 96/130 318 Valley High Park 90976 47/47 141

Gray & Osborne, Inc., Consulting Engineers
1-28 City of Oak Harbor September 2014 2013 Water System Plan Update
TABLE 1-7 – (continued)
Adjacent Purveyor Summary(1)
System Name Group ID Number of
Connections(2) Population
Served Waterloo Acres 93580 46/48 125 West Ridge Water System 94942 90/90 275 Total — 1,251/1,340 3,345
(1) Data source: DOH Sentry Web site. Does not include NASWI water system. (2) Number of connections includes current connections/possible approved connections. (3) DOH lists these connections as unapproved. Assumed to be connected to the maximum extent
possible. ZONING AND LAND USE Development of accurate and realistic growth projections is essential in establishing future water demand requirements. Accurate projections allow the community to plan financially for needed infrastructure improvements and to establish appropriate facility capacities, locations, and implementation scheduling for water system improvements. The current and official zoning map for the City was adopted by the Mayor on May 1, 2012. A brief description of the map and other zoning-related data are listed below, but are also available in the City’s Comprehensive Plan (City of Oak Harbor, 2010). Figure 1-14 shows the City’s existing zoning designations. The zoning categories used for City purposes include:
• R-1 – Single Family Intended for low-density, urban, single-family uses with sufficient urban services. Densities range between 3 and 6 units per gross acre.
• R-2 – Limited Multifamily
Intended for medium-density, residential housing. Densities range between 3 and 12 units per gross acre and should have safe, convenient access to improved collector or arterial streets.
• R-3 – Multifamily
Intended to provide and protect areas for medium- to high-density multifamily residential development. Densities range from 6 to 16 units per gross acre.

CRESCENT HARBOR
Stat
e Rte
20
W Ault Field Rd
E Crescent Harbor Rd
E Pioneer Way
Swantown Rd
SE Pioneer Way
E Whidbey Ave
E Fakkema Rd
Coral S
ea Ave
Pion
eer W
ay
W Waterloo Rd
W Whidbey Ave
Fort Nugent Rd SW Fort Nugent Ave
W Fakkema RdW Clover Valley Rd
W Crescent Harbor Rd
E Pioneer Way
CITY OF OAK HARBOR
2013 WATER SYSTEM PLAN UPDATEFIGURE 1-14
EXISTING ZONING MAP
DATA SOURCE: CITY OF OAK HARBOR
M:\Oak Harbor\13404 - Water System Plan Update\GIS\ZONING.mxd
³0 2,500 5,0001,250
Feet
LEGEND:CITY LIMITS
EXISTING/RETAIL SERVICE AREA
FUTURE SERVICE AREA
PARCELS
CITY ZONING:R-1 - SINGLE FAMILY RESIDENTIAL
R-2 - LIMITED MULTI-FAMILY RESIDENTIAL
R-3 - MULTI-FAMILY RESIDENTIAL
R-4 - MULTI-FAMILY RESIDENTIAL
R-O - RESIDENTIAL OFFICE
C-1 - NEIGHBORHOOD COMMERCIAL
CBD - CENTRAL BUSINESS DISTRICT
CBD-1 - CENTRAL BUSINESS DISTRICT 1
CBD-2 - CENTRAL BUSINESS DISTRICT 2
C-3 - COMMUNITY COMMERCIAL
C-4 - HIGHWAY SERVICE COMMERCIAL
C-5 - HIGHWAY CORRIDOR COMMERCIAL
PBP - PLANNED BUSINESS PARK
I - INDUSTRIAL
PIP - PLANNED INDUSTRIAL PARK
PF - PUBLIC FACILITIES
OS - OPEN SPACE
FEDERAL
COUNTY ZONING:RURAL RESIDENTIAL
RURAL AGRICULTURE

Gray & Osborne, Inc., Consulting Engineers
City of Oak Harbor 1-29 2013 Water System Plan Update September 2014
• R-4 – Multifamily Intended to provide and protect areas for those who wish to live in an apartment environment. These areas must be adjacent to arterials and/or collector streets and range between 12 and 22 units per gross acre.
• R-O – Residential/Office
Intended for professional and administrative offices, to provide a buffer between urban and residential neighborhoods, and to include development standards that would be consistent with residential districts.
• C-1 – Neighborhood Commercial
Intended for limited commercial and residential/commercial uses to serve residents of a surrounding district. Scale of development should be consistent with residential district standards.
• C-3 – Community Commercial
Intended for services that heavily depend on location to serve patrons. Uses could include retail, wholesale, transportation, or other services.
• C-4 – Highway Service (Auto/Industrial) Commercial
Intended for services that rely on highway access or visibility, primarily for vehicle sales centers. Uses within this category must also be compatible with NASWI Air Installation Compatible Use Zones (AICUZ) recommendations.
• C-5 – Highway Corridor Commercial
Intended for uses that are regional in impact and should be located along the highway corridor.
• CBD – Central Business District
Intended for uses which preserve and enhance the harbor location, encourage pedestrian-friendly access, and encourage mixed-use development. Residential development is allowed on an individual case basis.
• PBP – Planned Business Park
Intended for large-scale master planned facilities related to office

Gray & Osborne, Inc., Consulting Engineers
1-30 City of Oak Harbor September 2014 2013 Water System Plan Update
complexes or manufacturing facilities. Environmental amenities and responsibility would be promoted and uses should encourage a campus or park-like environment.
• PIP – Planned Industrial Park
Same as PBP above.
• I – Industrial
Intended for facilities of an industrial nature that may have adverse impacts on adjoining residential or commercial uses. User requirements for clean, safe, and quiet operation are in place.
• Federal/Military
The NASWI facilities are located within the City limits and operations, land use, and development are governed by the U.S. Navy. Historically, the City and the U.S. Navy have worked cooperatively to ensure that development meets the needs for all parties involved.
• PF – Public Facilities
Intended for public facilities such as schools, parks, churches, government facilities, utilities, and hospitals. This category aids the City and the public in planning while minimizing conflicts between incompatible land uses.
• OS – Open Space, Recreation, and Agriculture
Intended to preserve special community resources such as golf courses, protected forest land, and to delay the timeframe for development of annexed areas.
Zoning designations for areas outside the city-adopted UGA, but inside the county-adopted UGA include:
• RR – Rural Residential Lands located within defined boundaries of residential areas or more intensive rural development that are intended for infill development and limited subdivision at the prevailing residential density in the defined area.

Gray & Osborne, Inc., Consulting Engineers
City of Oak Harbor 1-31 2013 Water System Plan Update September 2014
• RA – Rural Agricultural Lands where agricultural activities have been an important and valued use in the past and will continue to be in the future, but do not meet the criteria for inclusion as lands of long-term commercial significance.
Table 1-8 summarizes the current zoning within the city-adopted UGA. As with most similarly sized communities, residential and commercial land constitutes the bulk of the City’s acreage.
TABLE 1-8
Existing Zoning Characterization
Category
2013 Land Area
(acres)
2013 Percentage of City Land
Total C-1 – Neighborhood Commercial 6.3 0.2% C-3 – Community Commercial 174.6 4.9% C-4 – Highway Service Commercial 80.0 2.3% C-5 – Highway Corridor Commercial 69.0 2.0% CBD – Central Business District 21.6 0.6% CBD-1 – Central Business District 1 11.4 0.3% CBD-2 – Central Business District 2 7.1 0.2% I – Industrial 50.2 1.4% OS – Open Space 82.2 2.3% PBP – Planned Business Park 74.9 2.1% PF – Public Facilities 368.3 10.4% PIP – Planned Industrial Park 157.1 4.5% R-1 – Single-Family Residential 1,272.2 36.1% R-2 – Limited Multifamily 188.6 5.3% R-3 – Multifamily Residential 94.4 2.7% R-4 – Multifamily Residential 167.7 4.8% R-O – Residential Office 78.0 2.2% ROW – Right-of-Way 623.4 17.7% Seaplane Base 2,705.0 — Total Land Area 6,232.0 — Total City Land Area (1) 3,527.0 100.0% Total City Land Area w/o ROW 2,903.6 — (1) Does not include NASWI facilities (Seaplane Base).
Land use differs from zoning in that land use broadly defines the type of occupancy or use that will be allowed for a particular area. Land use is more commonly used for comprehensive and regional planning to ensure that UGAs are used appropriately. The

Gray & Osborne, Inc., Consulting Engineers
1-32 City of Oak Harbor September 2014 2013 Water System Plan Update
City has addressed projected land use in its most recent Comprehensive Plan, which used information from a 2002 land use inventory examination to define regions within the UGA. Areas outside of the city limits but within the UGA also contain land-use and zoning designations for their future development. Designations for these areas were obtained through Island County records and are included in Table 1-9 as well as on Figure 1-15.
TABLE 1-9
County Defined Zoning Inventory Summary
Land Use Land Area
(acres) Percentage of
City Land Total Auto/Industrial Commercial 113.1 2.3% Central Business District 40.5 0.8% Community Commercial 210.9 4.4% High Density Residential 151.5 3.1% Highway Corridor Commercial 75.4 1.6% Industrial 174.7 3.6% Low Density Residential 1,552.5 32.1% Maritime 2.1 0.0% Medium-High Density Residential 87.3 1.8% Medium Density Residential 208.1 4.3% Neighborhood Commercial 6.6 0.1% Open Space 288.1 6.0% Planned Business Park 129.4 2.7% Planned Industrial Park 345.0 7.1% Public Facilities 381.7 7.9% Residential Estate 72.4 1.5% Residential Office 91.5 1.9% ROW, Right-of-Way 728.2 15.0% Seaplane Base 2,705.0 — City Adopted UGA Area (1) 179.7 — Total Land Area (2) 7,543.7 — Total City Adopted UGA Land Area (3) 4,838.7 100.0% Total City Adopted UGA Land Area w/o ROW 3,930.8 — (1) Includes areas within the City’s adopted UGA but outside the UGA recognized by Island
County. Consists of 67.4 acres low-density residential and 112.3 acres special planning area. (2) Includes areas within the city limits and city-adopted UGA. (3) Does not include NASWI facilities (Seaplane Base).

CRESCENT HARBOR
State
Rte 2
0
W Ault Field Rd
E Crescent Harbor Rd
E Pioneer Way
Swantown Rd
SE Pioneer Way
E Whidbey Ave
E Fakkema Rd
Coral S
ea AveFort Nugent Rd
Pion
eer W
ay
W Waterloo Rd
W Fort Nugent Rd
W Whidbey Ave
SW Fort Nugent Ave
W Fakkema Rd
W Clover Valley Rd
W Crescent Harbor Rd
E Pioneer Way
LEGEND:CITY LIMITSEXISTING/RETAIL SERVICE AREAFUTURE SERVICE AREAPARCELS
COUNTY LANDUSE:LOW DENSITY RESIDENTIALMEDIUM DENSITY RESIDENTIALMEDIUM-HIGH DENSITY RESIDENTIALHIGH DENSITY RESIDENTIALRESIDENTIAL OFFICENEIGHBORHOOD COMMERCIALCENTRAL BUSINESS DISTRICTCOMMUNITY COMMERCIALAUTO/INDUSTRIAL COMMERCIALHIGHWAY CORRIDOR COMMERCIALPLANNED INDUSTRIAL PARKPLANNED BUSINESS PARKINDUSTRIALPUBLIC FACILITIESOPEN SPACEMARITIMEFEDERAL
CITY OF OAK HARBOR
2013 WATER SYSTEM PLAN UPDATEFIGURE 1-15
COUNTY DEFINED ZONING
DATA SOURCE: CITY OF OAK HARBOR
0 2,500 5,0001,250Feet
³
M:\OAK HARBOR\13404 - WATER SYSTEM PLAN UPDATE\GIS\LANDUSE.MXD

Gray & Osborne, Inc., Consulting Engineers
City of Oak Harbor 1-33 2013 Water System Plan Update September 2014
RELATED PLANS AND DOCUMENTS ANACORTES 2011 WATER SYSTEM PLAN The City obtains more than 99 percent of its water from Anacortes, which completed its most recent Water System Plan (WSP) in 2011. This City of Anacortes WSP is referenced frequently in this document and can be used to find additional information regarding water sources, water treatment, source capacity, and water quality. OAK HARBOR 2003 WATER SYSTEM PLAN The previous water system plan was completed in 2003 by Earth Tech Engineers. The plan describes the City’s water system and water service agreements, hydraulic model calibration and results, water use efficiency, operation and maintenance, and capital improvement recommendations. Where applicable, information from this plan was used as a starting point for the information presented in this plan update. OAK HARBOR COMPREHENSIVE PLAN The current Oak Harbor Comprehensive Plan was adopted in 1995 and revised in 1997, 1998, 2000, and in each of the years from 2002 through 2012. The plan identifies goals and policies to be used in shaping growth of the community within the UGA. The plan is divided into elements that cover such topics as land use, housing, development, and utilities. The plan briefly described the water system transmission line components and concludes that the current facilities have sufficient capacity to meet projected peak day demands for 2013. OAK HARBOR MUNICIPAL CODE The City has water service regulations which are established by City ordinances in the OHMC. Title 13 (Water), Title 18 (Planning), Title 19 (Zoning), and Title 21 (Subdivisions) all deal with water service issues. A copy of Title 13 is available in Appendix E, while the full OHMC is available through the City’s Web site at www.oakharbor.org. ISLAND COUNTY COORDINATED WATER SUPPLY PLAN The Island County Coordinated Water Supply Plan (CWSP) was completed in 1990. This plan is consistent with the CWSP contents. The CWSP guides water utilities throughout Island County so that water supply management and development can be accomplished through coordinated, rather than individual efforts. The CWSP assessed water demand forecasts and supply alternatives. Redistribution of groundwater was its highest priority recommendation.

Gray & Osborne, Inc., Consulting Engineers
1-34 City of Oak Harbor September 2014 2013 Water System Plan Update
ISLAND COUNTY WATER RESOURCE MANAGEMENT PLAN The 1998 legislature passed Chapter 90.82 RCW to set a framework for developing local solutions to watershed issues. Chapter 90.82 RCW states that “The legislature finds that the local development of watershed plans for managing water resources and for protecting existing water rights is vital to both state and local interests.” Through Ecology funds, Island County developed a Water Resource Management Plan (WRMP). The current WRMP, which was adopted by the Board of Island County Commissioners in June 2005, is a series of topic papers drafted by the Island County Water Resource Advisory Committee (WRAC). These topic papers were the basis of the WRMP and cover such topics as seawater intrusion, water supply alternatives, rainwater catchments, and water conservation, among others. The WRMP also discusses groundwater recharge, groundwater levels, population forecasts, drought conditions, water rights, water system coordination, alternative water supply sources, water conservation, and education and outreach. After completion of the WRMP, Ecology funded Island County to develop the Water Resource Detailed Implementation Plan. This working document was approved by the WRAC in December of 2006, and outlines specific watershed-related projects. Additional information on the County’s WRMP and related documents can be found through the County and on their Web site, www.islandcountyeh.org. NAVAL AIR STATION WHIDBEY ISLAND WATER SYSTEM PLAN The NASWI Water System Plan (KPFF, 2008) was used as a reference for information regarding water use and facilities and personnel data during the composition of this plan. Planning information, such as population and water demand projections, from the NASWI plan are corroborated with this document. CITY OF OAK HARBOR 2011 TO 2016 CAPITAL IMPROVEMENT PLAN The City’s Capital Improvement Plan was produced in December 2011 and outlines proposed projects and funding for City resources and infrastructure. Wastewater facilities, water system facilities, public facilities, and infrastructure projects such as roads and signage are summarized and discussed. The plan pulls information from the most recent individual service plans (water, wastewater, transportation, etc.) so that the City may efficiently and successfully prioritize required projects and ensure that they are funded appropriately. NEW RESERVOIR PROJECT PREDESIGN REPORT The New Reservoir Predesign Report (Gray & Osborne, 2009) investigated the status of the City’s water system and addresses water delivery zones, water pressure, system redundancy, and system resiliency. The report provides a site analysis for the new North

Gray & Osborne, Inc., Consulting Engineers
City of Oak Harbor 1-35 2013 Water System Plan Update September 2014
Reservoir and recommends twelve capital improvement projects meant to address water system issues listed above. The new North Reservoir is currently constructed and is awaiting painting (scheduled for 2014), with additional projects from the report slated for construction within the 6-year planning period. A copy of this report is available in Appendix F. Several projects recommended in this report have been developed to various stages. A pipeline along Gun Club Road has been constructed, and will serve the North Reservoir. Lastly, the City recently advertised design qualifications for the east-west pipeline from Gun Club Road across Highway 20. Each of these projects is meant to reorganize the water system operations and pressure zone scheme as recommended in the New Reservoir Predesign Report. AULT FIELD BOOSTER STATION TECHNICAL MEMORANDUM The Ault Field Booster Station Technical Memorandum (Gray & Osborne, 2011) addresses the existing constant-speed pumps at the Ault Field Booster Station. Currently, the constant-speed pumps are not utilized to move water to the 307 Zone; however, the City would like to use these two pumps as the primary pumps for the booster station. The technical memorandum examines alternative solutions for replacement/modification of the existing constant-speed pumps, and recommends a course of action based on capital cost, recurring maintenance costs, cost of power, and desires by the City staff. A copy of this technical memorandum is presented in Appendix C. SERVICE AREA POLICIES DOH has established a list of policies that should be addressed in a water system plan. Table 1-10 lists these policies, the required actions, and the City’s status regarding them. As part of the 2003 WSP, some changes were recommended to the OHMC to add clarity and to reflect more current conditions and practices. These changes included language changes for peak day demand, alterations to the standard designs and specifications, and service beyond city limits policy recommendations.

Gray & Osborne, Inc., Consulting Engineers
1-36 City of Oak Harbor September 2014 2013 Water System Plan Update
TABLE 1-10
Service Area Policy Summary
DOH Policy Policy Description Current City Policy Source Annexation Policy How City annexation
relates to the provision of water service.
The City, at its discretion, may choose not to allow water service unless the applicant is first annexed to the City.
Water System Plan
Connection Fee Policy
Fees relating to the installation of water service.
Fees for water service are determined by meter size, service location, and customer class designation.
OHMC Chapters 3.64.525 and 13.32.010
Cross-Connection Control Program
Policy on regulations of cross connections, including steps taken if a cross connection is discovered.
Water service shall be contingent on provision of cross-connection control deemed suitable by City officials. See Appendix G.
OHMC Chapter 13.13
Design and Performance Standards
Minimum design and performance standards for water infrastructure.
City of Oak Harbor Design Standards. See Appendix H.
Design and Performance Standards
Direct Connection and Remote System Policy
New developments directly connect to existing water system, or if satellite systems are allowable.
All proposed developments to be served by the City shall require direct connection to the City’s water system. The City does not provide Satellite System Management.
Water System Plan
Extension Policy Policy regarding extension of the system, including identification of the responsible party. Design standards and payment included in conditions of service.
Design standards are established in the City’s Developer Standards. See Appendix H. Complete developer standards are available at the City’s Public Works Department. They include provisions on items such as hydrostatic testing, disinfection, bacteriological testing, and installation. In general, all distribution mains will be located within the right-of-way or the acquisition of an easement will be required. Additionally, hydrostatic testing, disinfection, and bacteriological testing of new water utilities shall be as specified in WSDOT Standard Specifications. Separation of potable water piping and wastewater or reclaimed water piping shall be as recommended in the Criteria for Sewage Works Design (“Orange Book”, Ecology, 2008).
Design and Performance Standards

Gray & Osborne, Inc., Consulting Engineers
City of Oak Harbor 1-37 2013 Water System Plan Update September 2014
TABLE 1-10 – (continued)
Service Area Policy Summary
DOH Policy Policy Description Current City Policy Source Latecomer Agreements
Policy on allowing latecomer agreements for those who propose to extend the water system, and provisions of payback.
A property owner wishing to extend water service to their area may be required to extend of improve the municipal water supply system as a condition thereof, and to execute a developer’s agreement regarding the appointment of the costs thereof. These developer’s agreements may include provisions for recovery of a pro-rated share of the initial construction costs of the water service extensions from additional customers desiring to connect to such extensions.
OHMC Chapters 13.28 and 13.32
New Account Servicing Fees
Fees relating to the creation of a new water service account.
The City has a utility account initiation fee of $25 to begin the connection process. Connection fees are the actual costs of construction and payable prior to initiation of connection of water services.
OHMC Chapter 3.95.040 or 3.64.525
Surcharge for Outside Customers
City’s surcharge for customers outside of city limits.
Services outside of city limits are subject to a 1.5 rate differential. Deception Pass State Park is charged as if within city limits.
Ordinance 1587 and OHMC Chapter 13.24
Water Rates Rates charged to the City’s water service customers.
The City’s water rates are established by ordinance in the City’s taxes, rates, and fees schedule. Rates are based on meter size, usage, and customer class.
Ordinance 1587 and OHMC Chapter 13.32.025(2)
Water Rights Relinquishment/transfer of water rights within the water service area.
The City does not currently have an established water rights policy.
—
Wheeling of Water Conditions to be met for water wheeled to another system.
The City does not currently have an established wheeling of water policy.
—
Wholesaling of Water
Conditions that must be met to obtain a wholesale agreement.
The City does not currently have an established water system wholesaling policy. The City provides water to NASWI, NWWD, and DPSP through a water supply agreement.
—

Gray & Osborne, Inc., Consulting Engineers
1-38 City of Oak Harbor September 2014 2013 Water System Plan Update
DUTY TO SERVE Regarding a municipal water service providers requirement to provide water to residents within the retail service area, WAC 246-290-106 requires that the City provide retail water service to all new service connections within the retail service area if:
• It can be available in a timely and reasonable manner,
• There are sufficient water rights to provide water service,
• There is sufficient capacity to serve the water in a safe and reliable manner as determined by DOH, and
• It is consistent with the requirements of local plans and regulations, and
for water service by the water utility of a city or town, with the utility service extension ordinances of the city or town.
Additional requirements are that the supplier must provide a retail service area map and must meet the requirements of WAC 246-290-108 which state that:
Municipal water suppliers must provide documentation within a WSP describing how it has considered consistency with other local plans and regulations with regard to:
• Land use and zoning within the applicable service area, • Six-year growth projections used for demand forecasting, • Utility service extension ordinances, • Provisions of water service for new service connections, and • Other relevant elements related to water planning.
Should an inconsistency be found within the review period, DOH must be notified and appropriate steps shall be taken to remedy the inconsistency. Furthermore, the municipal water supplier may provide temporary water service to another water system if a written agreement with the water system is in place, and lastly, the municipal supplier may allow water service to be extended prior to meeting the requirements set forth in the WAC in order to resolve a significant public health and saftey concern. The City actively plans to provide retail water service in conformance with all state and local regulations and land use plans to all customers and customer classes throughout the existing retail service area. New customers may apply for water service through the permitting process established within OHMC Title 13. OHMC Chapter 13.24 details the conditions for providing water service beyond city limits and within the UGA.

Gray & Osborne, Inc., Consulting Engineers
City of Oak Harbor 1-39 2013 Water System Plan Update September 2014
Water service connection permits are reviewed by the City engineering staff according to workload and maximum allowable review periods. Conformance to these time lines creates a predictable process for provision of retail water service. SATELLITE MANAGEMENT The Growth Management Act restricts the City’s ability to provide domestic water service outside the UGA. This plan does not include consideration of water use outside the UGA, with the exception of the existing service to NWWD, NASWI, and DPSP. Adjacent water purveyors are summarized in Table 1-7 and are shown graphically on Figure 1-12. Requests to connect to the City’s municipal water system will be addressed on an individual basis and will be evaluated based on existing infrastructure, distance from mainline connection, water availability, economic considerations, as well as direction by DOH. If an adjacent purveyor wishes to connect to the City’s municipal water system, they are required to upgrade the water system facilities to meet City standards. If the area requesting service is adjacent to the city limits, annexation may be required. Furthermore, requests to the City for water service will be considered only if the City establishes the legality of service, secures a water allocation from Anacortes, and the party requesting service agrees to pay all costs of the following:
• Studies necessary to evaluate impacts of service,
• Legal fees,
• System development charges,
• Improvements or expansion of the City’s water system necessary for service,
• Improvement or expansion of the requesting entity water system to
comply with City’s design standards,
• Pumping costs,
• Annual maintenance and operation costs,
• Pro-rated share of Anacortes charges, and
• Pro-rated share of general system improvements.

Gray & Osborne, Inc., Consulting Engineers
1-40 City of Oak Harbor September 2014 2013 Water System Plan Update
CONSUMER AND AGENCY INPUT REGIONAL PLANNING CONSISTENCY Consistency with local plans and regulations applies to planning and engineering documents under WAC 246-290-106, 246-290-107, and 246-290-110(4)(b)(ii). These policies state that municipal water suppliers must include a consistency review and supporting documentation in its planning or engineering document describing how it has addressed consistency with local plans and regulations. This review must include specific elements of local plans and regulations, as they reasonably relate to water service as determined by DOH. This Plan was reviewed for its consistency with other regional planning documents and a signed checklist is included as Appendix I. LOCAL AGENCIES The draft WSP was made available to local government agencies to ensure consistency in watershed planning efforts. A complete copy of the plan was submitted to the Washington State Department of Health as well as the Island County Public Works Department. The Plan was also made available electronically to all adjacent water systems, each of the City’s wholesale customers (NASWI, NWWD and DPSP), and the Island County Water Resources Advisory Committee (WRAC). The WRAC is a special County committee of both appointed citizen members and designated staff representatives from both Island County Public Works and Island County Health. WRAC members have been assigned responsibility by the county commissioners to coordinate local water planning issues, including the watershed plan for WRIA 6. A copy of these notification letters, as well as any comments or correspondence received from them regarding the Plan is available in Appendix J. PUBLIC PARTICIPATION Per WAC 246-290, the City’s Water System Plan must be made available for public comment prior to acceptance. To fulfill these requirements, the City plans to make an electronic version of the WSP available through its website, and will also maintain at least one hard copy at the City’s Public Works Department Office. The City will then place discussion of the WSP on the agenda at both the Community Planning Department regularly scheduled meeting as well as the City Council workshop meeting, both of which are open to the public. Advertisements for these meetings will be on the City’s website, posted at the Public Works Building, and advertised in the Whidbey Times in accordance with State Law. A proposed newspaper announcement is available in Appendix J.

City of Oak Harbor 2-1 2013 Water System Plan Update September 2014
CHAPTER 2
BASIC PLANNING DATA INTRODUCTION This chapter includes basic planning data that is essential for the assessment of the City’s water demands. Information is included regarding historical and existing population data, historical and existing water production and consumption, and projected water production and demand. Projected population, service area connections, ERUs, water consumption, and required water production are also discussed. Information presented below is used to evaluate the condition of the existing water system and to determine future needs based on foreseeable demographic trends for the next 20 years. HISTORICAL AND EXISTING SYSTEM INFORMATION Information on connections, monthly water production and purchasing, and monthly water consumption was provided by the City. Data was extracted from water profile reports, metered data, and billing information records. For the tables, data, and analysis that follow, it is assumed that data are for the City’s service area only and do not include NASWI facilities unless otherwise noted. POPULATION Historical population within the City is summarized in Table 2-1. Historical population data was provided for the City’s service area by the Washington State Office of Financial Management (OFM) and the most recent U.S. Census.

Gray & Osborne, Inc., Consulting Engineers
2-2 City of Oak Harbor September 2014 2013 Water System Plan Update
TABLE 2-1
Historical Population Summary
Year City
Population UGA
Population(1)
City and UGA
Population(2)
Seaplane Base
Population(3)
Service Area
Population(4)
Retail Service Area Population(5)
1940 376 — — — — — 1950 1,193 — — — — — 1960 3,942 — — — — — 1970 9,167 — — — — — 1980 12,271 — — — — — 1990 17,176 — — — — — 2000 19,795 2,235 22,030 3,230 18,800 16,583 2001 19,914 2,234 22,148 3,230 18,918 16,989 2002 20,201 2,250 22,451 3,230 19,221 17,020 2003 20,232 2,248 22,480 3,230 19,250 17,250 2004 20,462 2,259 22,721 3,230 19,491 17,856 2005 21,068 2,285 23,353 3,230 20,123 18,243 2006 21,455 2,306 23,761 3,230 20,531 18,507 2007 21,719 2,320 24,039 3,230 20,809 18,664 2008 21,876 2,313 24,189 3,230 20,959 18,936 2009 22,148 2,302 24,450 3,230 21,220 18,773
2010(6) 22,075 2,280 24,355 3,320 21,035 18,898 2011 22,200 2,281 24,481 3,320 21,161 18,898
2012(7) 22,200 2,280 24,480 3,320 21,160 18,778 (1) Estimated from OFM and City records. (2) Calculated as the sum of City and UGA populations. (3) Estimated from City population data. (4) Calculated as difference between total population and Seaplane Base population. (5) Calculated as sum of City population, connections outside the City limits but inside the UGA,
minus the Seaplane Base population. (6) Data collected from the 2010 U.S. Census. (7) Data from Washington OFM and City records. The data show that from 2009 to 2010, the City population decreased from 23,360 to 22,075. This is fairly common in municipalities for years prior to an official U.S. Census. The population from 2009 is most likely an estimate based on locally available surveys or other information, and as such, differs from federal census data. SERVICE CONNECTIONS Data for the number of service connections were provided by the City’s annual water profiles. These annual water profiles include data on production, consumption, per capita use, system infrastructure, and other data. The City’s historical and existing water connections are summarized in Table 2-2.

Gray & Osborne, Inc., Consulting Engineers
City of Oak Harbor 2-3 2013 Water System Plan Update September 2014
TABLE 2-2
Historical Water System Connection Summary
Category 2007 2008 2009 2010 2011 2012 Residential 4,204 4,111 4,232 4,302 4,338 4,350 Multi-Residential 734 695 763 763 770 767 Commercial 407 312 339 327 310 320 Multi-Commercial 97 115 106 106 118 113 School 24 27 23 23 23 22 Hotel/Motel 10 10 9 9 9 9 Church 24 23 24 25 25 25 Sprinklers 103 109 111 112 113 114 Commercial/Residential 13 14 14 14 15 16 Irrigation 102 107 107 115 118 118 Hydrant Meters(1) — — — — — — NASWI(2) 1 1 1 1 1 9 Total 5,719 5,524 5,729 5,797 5,840 5,863
(1) Portable meter checked out by the City and used for construction or other flushing-type activity.
(2) NASWI connections are from the existing Old Goldie Road NASWI water main and represent residential connections to the City’s distribution system. Two additional connections are planned for 2016.
WATER PRODUCTION The City purchases approximately 99.7 percent of its water from the City of Anacortes. This water is conveyed to the City by a 24-inch-diameter and a 10-inch-diameter transmission mains. The small remaining percentage of water is pumped from Wells 8, 9 and 11. These wells serve as an auxiliary water source and are only exercised monthly in order to keep the pumps and wells and other equipment in good order. Table 2-3 summarizes the historical purchase and production of water for the City’s sources, while Table 2-4 lists the monthly production for the City sources. Monthly values from 2012 are representative of monthly totals since 2007.

Gray & Osborne, Inc., Consulting Engineers
2-4 City of Oak Harbor September 2014 2013 Water System Plan Update
TABLE 2-3
Historical Water Purchase and Production
Source 2007 2008 2009 2010 2011 2012
Percent of 2012 Total
Anacortes 877.028 806.231 862.262 753.064 772.883 744.607 99.73 Well 8 0.968 0.956 1.122 0.920 0.760 0.901 0.12 Well 9 1.076 0.885 1.026 0.201 0.243 0.268 0.04 Well 11 0.970 1.410 1.142 0.931 0.704 0.882 0.12 Total Well Production 3.014 3.251 3.290 2.052 1.707 2.051 0.27 Total Production and Purchase 880.042 809.483 865.552 755.116 774.590 746.658 —
TABLE 2-4
Monthly Historical Source Production for 2012
Month MG Gallons MG
Anacortes Well 8 Well 9 Well 11 Total January 55.326 53,731 17,019 55,054 55.451 February 50.794 76,187 24,561 75,031 50.969 March 52.689 90,321 28,080 89,936 52.897 April 57.622 61,858 17,739 53,517 57.755 May 59.733 159,876 49,140 154,322 60.096 June 62.600 94,771 22,612 88,045 62.806 July 75.443 37,042 10,887 36,183 75.527 August 75.450 42,626 12,934 43,534 75.549 September 83.446 168,076 47,774 152,950 83.815 October 66.338 45,996 16,610 57,254 66.458 November 50.802 26,616 6,900 25,868 50.861 December 54.365 43,833 13,404 50,676 54.473 Total 744.607 900,933 267,660 882,370 746.658 Average Daily Production 2.034 2,462 731 2,411 —
Overall, the total purchase and production of water has decreased since 2007. This is likely due to repair of previously leaky pipes/joints, replacement of old and aging pipelines, an increased focus on preventive maintenance by water operations staff, a sluggish local economy, and an increased focus on water conservation by water users. The data show several months with abnormally high production from the groundwater sources. One example of this is Well 11 in October of 2007. Production for this month was 423,926 gallons, which is significantly higher than the annual average of 121,261 gallons per month for Well 11.

Gray & Osborne, Inc., Consulting Engineers
City of Oak Harbor 2-5 2013 Water System Plan Update September 2014
These higher periods of well pumping typically occurred as a result of a temporary shutdown of the Anacortes water supply. Occasionally, the City will operate groundwater source pumps to ensure that they are still capable of handling the required pumping capacity for long periods in the event that the Anacortes water supply becomes unavailable. Higher groundwater source production also may occur as the result of planned maintenance or drawdown testing. AVERAGE DAY/MAXIMUM DAY DEMAND The average day demand (ADD) is defined as the total volume of water produced in one year divided by the number of days in the year. The maximum day demand (MDD) is determined by meter readings and is the largest single-day usage of water. Using water production data rather than consumption data gives an indication of the actual water required by the City, which includes distribution system leakage. Peak hour demand (PHD) is an estimate of the highest demand a water system experiences in a year and is based on the number of ERUs in the water system. Historical ADD and MDD for the City as well as NASWI are presented in Table 2-5. Average day demand values for NASWI were supplied by the City’s metering data.
TABLE 2-5
Historical Average Day Demand and Maximum Day Demand
Parameter 2007 2008 2009 2010 2011 2012 Average City of Oak Harbor(1) ADD (gpd) 1,535,166 1,426,790 1,455,223 1,370,034 1,381,016 1,476,198 1,440,738 MDD (gpd) 2,753,858 2,400,056 2,842,091 2,456,206 2,379,364 2,523,003 2,559,096 Date July 12 August 16 July 16 July 14 September 3 August 18 — MDD/ADD 1.79 1.68 1.95 1.79 1.72 1.71 1.8 NASWI ADD (gpd) 780,548 752,471 877,161 771,895 777,617 709,616 778,218 MDD (gpd) — — — 1,750,000 1,790,000 1,580,000 1,706,667 Date — — — August 2 March 13 August 8 — MDD/ADD — — — 2.27 2.30 2.23 2.3 Combined System ADD (gpd) 2,315,714 2,179,261 2,332,384 2,141,929 2,158,633 2,185,814 2,218,956 MDD (gpd) (2) — — — 4,169,034 3,580,000 4,103,003 3,950,679 MDD/ADD — — — 1.95 1.66 1.88 1.8 (1) Data also includes NWWD and DPSP. (2) Data does not include MDD values for NASWI. In general, both ADD and MDD have decreased slightly from 2007 though 2012. In each of the past 6 years, the MDD-to-ADD peaking factor remained below 2.00, which suggests that water conservation efforts by both City water customers as well as NASWI personnel have been successful. The MDD-to-ADD ratio for the retail service area decreased slightly from 2007 through 2012 and results in an average value of 1.78. This value is typically

Gray & Osborne, Inc., Consulting Engineers
2-6 City of Oak Harbor September 2014 2013 Water System Plan Update
referred to as the MDD peaking factor. For water use projections, a conservative peaking factor of 1.80 will be used for demand projections for the retail service area. NASWI data was obtained from daily City water meter readings for 2010 through 2012 in order to more accurately assess the MDD. The average MDD-to-ADD ratio for NASWI was 2.3, which is significantly higher than that for the City. This higher MDD-to-ADD ratio will be used for demand projections for NASWI facilities. PEAK HOUR DEMAND PHD is calculated according to the following formula, which is listed as Equation 5-1 in the DOH Water System Design Manual.
( )( )[ ] 18440,1
++= FNCMDDPHD
Where:
PHD = peak hour demand (gallons per minute) C = coefficient associated with ranges of ERUs N = number of ERUs F = coefficient associated with ranges of ERUs MDD = maximum day demand (gpd/ERU)
Table 2-6 summarizes historical and existing values for PHD for the City as well as NASWI. PHD for the City was calculated using the formula above. PHD for NASWI was calculated using the average PHD-to-MDD factor of 1.64 which was calculated from historical City data.

Gray & Osborne, Inc., Consulting Engineers
City of Oak Harbor 2-7 2013 Water System Plan Update September 2014
TABLE 2-6
Historical Maximum Data and Calculated Peak Hour Demand
Parameter 2007 2008 2009 2010 2011 2012 Average City of Oak Harbor MDD (gpd) 2,753,858 2,400,056 2,842,091 2,456,206 2,379,364 2,523,003 2,559,096 MDD (gpm) 1,912 1,667 1,974 1,706 1,652 1,752 1,777 PHD (gpm)(1) 3,124 2,728 3,226 2,790 2,703 2,865 2,906 PHD/MDD 1.63 1.64 1.63 1.64 1.64 1.64 1.64 NASWI MDD (gpd) — — — 1,750,000 1,790,000 1,580,000 1,706,667 MDD (gpm) — — — 1,215 1,243 1,097 1,185 PHD (gpm)(2) — — — 1,988 2,033 1,794 1,938 PHD/MDD — — — 1.64 1.64 1.64 1.64 Combined System MDD (gpm) — — — 2,895 2,486 2,849 2,744 PHD (gpm) — — — 4,735 4,066 4,659 4,487 PHD/MDD — — — 1.64 1.64 1.64 1.64
(1) From the DOH Water System Design Manual (Table 5-1) for systems with ERUs greater than 500. (2) Based off of the average PHD-to-MDD ratio of 1.64. Although annual fluctuations in water use are typical, overall, water consumption within the system has remained relatively consistent from 2007 through 2012. Fluctuations from year-to-year occur due to variations in weather patterns, summer temperatures, conservation efforts, and the local economy. WATER USE WATER CONSUMPTION Historical and existing water consumption by consumer class is presented in Table 2-7.

Gray & Osborne, Inc., Consulting Engineers
2-8 City of Oak Harbor September 2014 2013 Water System Plan Update
TABLE 2-7
Historical Annual Water Consumption by Customer Class
Category
Million Gallons Average % of Service
Area Total(1)
Average % of City
Total 2007 2008 2009 2010 2011 2012 Residential 232.1 228.0 245.3 222.6 225.7 219.2 30.2% 48.5% Multi-Residential(2) 121.2 118.2 118.2 114.9 116.9 116.0 15.8% 25.4% Commercial 60.4 48.4 51.2 48.7 46.9 44.9 6.2% 10.0% Multi-Commercial(3) 18.8 18.2 18.2 18.4 18.8 17.6 2.5% 4.0% School 19.6 12.8 8.7 11.2 18.4 11.4 2.0% 3.3% Hotel/Motel 10.6 10.4 10.2 9.9 9.9 11.2 1.4% 2.3% Church 2.7 2.4 2.8 2.3 2.7 2.3 0.3% 0.5% Sprinklers(4) 0.0 0.0 0.0 0.0 0.0 0.0 0.0% 0.0% Commercial/Residential 4.8 4.8 4.9 4.9 1.3 1.6 0.2% 0.3% Irrigation 36.5 27.7 41.4 23.5 25.9 24.9 3.4% 5.5% Hydrant Meters 1.0 1.6 0.1 2.8 0.6 0.7 0.1% 0.1% Total Retail Service Area Consumption 507.8 472.5 501.0 459.2 467.1 449.9 62.2%
N/A NASWI 284.9 275.4 320.2 281.7 283.8 259.7 36.9% Wholesale Users (5) 7.8 7.8 8.0 8.6 6.3 6.6 0.9% TOTAL Service Area Consumption 800.5 755.6 829.2 749.5 757.2 716.2 100.0%
(1) Average values are for 2011 and 2012 data only to more accurately reflect the current focus on conservation. Does not include NWWD or DPSP.
(2) Includes multifamily residential units of medium or high density. (3) Includes small commercial businesses located within larger commercial buildings (e.g., strip
malls). (4) For fire suppression, does not include irrigation. (5) Includes DPSP and NWWD. From the data, it is clear that NASWI facilities and residential connections constitute the majority of the water consumption within the City’s wholesale water system (83 percent). Commercial and irrigation are the next largest users (12 percent), while the remaining classes (which include DPSP and NWWD) make up a small portion of overall water consumption (5 percent). NASWI water consumption has remained relatively consistent from 2007 through 2012. Additional information on NASWI water consumption is available in the NAS Whidbey Island Water System Plan (KPFF, 2008). One of the main findings from this plan is that the Seaplane Base, which contains almost all of the residential and housing units for NASWI personnel, averaged approximately 45 percent of the total NASWI water consumption from 2007 through 2011. Water consumption for all customer classes other than NASWI is shown graphically on Figure 2-1.

Gray & Osborne, Inc., Consulting Engineers
City of Oak Harbor 2-9 2013 Water System Plan Update September 2014
0
50
100
150
200
250
300
2007 2008 2009 2010 2011 2012
Year
Wat
er C
onsu
mpt
ion
(MG
)Residential Multi. Residential Commercial Irrigation All others
FIGURE 2-1
Historical Annual Water Consumption by Customer Class Table 2-7 and Figure 2-1 show that water consumption has decreased slightly since 2007. This is likely due to a focus on conservation, continual preventive maintenance measures by the water system operations staff, and a relatively stable retail service area population. EQUIVALENT RESIDENTIAL UNITS An equivalent residential unit (ERU) represents the water consumption of a standard single-family residence and is calculated by dividing the average daily single-family residential (SFR) demand by the number of SFR connections. It is typically measured in gallons per day per ERU (gpd/ERU). Table 2-8 outlines the data and calculations used to estimate the consumption per ERU for the City. The average water demand for 2007 through 2012 is approximately 150 gpd/ERU. This value is within the typical range for a municipal water system of comparable size to Oak Harbor. By dividing this average consumption per ERU into the demand by other customer classes, estimates for the number of non-residential ERUs within the City’s service area are derived. This data is presented in Table 2-9.

Gray & Osborne, Inc., Consulting Engineers
2-10 City of Oak Harbor September 2014 2013 Water System Plan Update
TABLE 2-8
Historical ERU Calculation Summary
Parameter 2007 2008 2009 2010 2011 2012 AverageSFR Consumption (MG/year) 232.09 228.04 245.27 222.63 225.71 219.24 228.83 SFR Consumption (gpd) 635,860 624,762 671,960 609,933 618,379 600,665 626,927SFR Water Connections 4,204 4,111 4,232 4,302 4,338 4,350 4,256 SFR Water Use (gpd/ERU) 151 152 159 142 143 138 150
TABLE 2-9
Historical ERU Summary
Category
ERUs(1) Average % of
Total(2) ERUs per
Connection(3)2007 2008 2009 2010 2011 2012 Residential 4,204 4,111 4,232 4,302 4,338 4,350 30.3 1.0 Multi-Residential 2,196 2,125 2,039 2,220 2,247 2,296 15.8 3.0 Commercial 1,095 871 883 941 900 889 6.2 2.8 Multi-Commercial 340 327 314 356 361 348 2.5 3.1 School 355 230 151 217 354 226 2.0 10.3 Hotel/Motel 193 186 177 192 190 222 1.4 24.7 Church 49 42 48 44 52 46 0.3 1.8 Sprinklers 0 0 0 0 0 0 0.0 0.0 Commercial/Residential 88 86 85 94 25 31 0.2 1.9 Irrigation 661 498 714 454 498 492 3.4 4.2 Hydrant Meters — — — — — — 0.0 — Total Retail Service Area Consumption ERUs 9,180 8,476 8,643 8,819 8,966 8,899 62.2 —
NASWI 5,161 4,951 5,848 5,444 5,455 5,139 36.9 — Wholesale Users(4) 142 139 147 166 121 131 0.9 — DSL 1,440 968 627 108 333 602 3.3 — Total Service Area Consumption ERUs 14,483 13,567 14,637 14,430 14,542 14,169 100.0 —
(1) Based on annual ERU values found in Table 2-8. (2) Average values are for 2011 and 2012 only. (3) Data are for 2012 only. (4) Includes DPSP and NWWD. PER CAPITA DEMAND Per capita demand is an estimate of the daily amount of water used per service area customer. It is typically measured in gallons per capita per day (gpcd). A summary of per capita consumption for the City’s service area customers is presented in Table 2-10.

Gray & Osborne, Inc., Consulting Engineers
City of Oak Harbor 2-11 2013 Water System Plan Update September 2014
TABLE 2-10
Historical Per Capita Water Use Summary
Year
Retail Service Area Consumption (gallons/year)
Retail Service Area Population(1)
Per Capita WaterConsumption
(gpcd) 2007 507,808,260 18,507 75 2008 472,479,194 18,664 69 2009 501,020,368 18,936 72 2010 459,184,100 18,773 67 2011 467,098,909 18,898 68 2012 449,898,221 18,898 65
Average 476,248,175 18,779 69 (1) The decrease in population seen between 2009 and 2010 is due to the availability of
2010 U.S. Census data. The City’s average per capita consumption is 69 gpcd. As the demographic structure of the City is not projected to change significantly within the 6- and 20-year planning periods, this value will be used for water demand projections. The City’s historical average per capita water use rate of 69 gpcd is significantly lower than that of Washington State (102 gpcd, 2005) as well as the United States (101 gpcd, 2010). This is likely due to a focus on conservation, City demographics, and low water use for agriculture, among other factors. DISTRIBUTION SYSTEM LEAKAGE Distribution system leakage (DSL) is defined by DOH as the difference between total water produced and total authorized consumption and typically includes losses due to leaks, illegal service connections, accounting errors, inaccurate meter readings, and various other unmetered uses. Other authorized consumption that may not be included in consumption records might include water used for park irrigation, reservoir overflow, or City-sponsored construction projects. The City does account for all of these potential sources; however, so their contribution to DSL is estimated to be minimal. It is also occasionally referred to as unaccounted-for water; however, since this term has no standard definition, DOH recommends using only DSL in professional documents. The City monitors DSL on an annual basis, and typically has low DSL. DSL is defined according to the equation below from the DOH Water System Design Manual:
ACTPgallonsDSL −=)(
( ) %100)( ∗⎥⎦⎤
⎢⎣⎡ −
=TP
ACTPpercentDSL

Gray & Osborne, Inc., Consulting Engineers
2-12 City of Oak Harbor September 2014 2013 Water System Plan Update
Where:
DSL = distribution system leakage (gallons or percent) TP = total water produced and/or purchased (gallons/year) AC = authorized consumption (gallons/year)
Table 2-11 summarizes DSL for the City’s water system. DSL is related to the City’s Water Use Efficiency Program, which is discussed in Chapter 5 – Water Use Efficiency Program. State regulations have established a standard maximum allowable DSL of 10 percent based on a rolling 3-year average. The City’s DSL is well below this threshold, and as such, is in compliance with the Water Use Efficiency Rule and requires no further action other than continued monitoring and reporting. Should the 3-year rolling average percent DSL ever increase above 10, the City would be required to develop a water loss control action plan.
TABLE 2-11
Historical Distribution System Leakage Summary
Parameter 2007 2008 2009 2010 2011 2012 AverageTotal Source Production (MG)(1) 880.04 809.48 865.55 755.12 774.59 746.66 805.24 Authorized Consumption (MG)(2) 800.54 755.64 829.22 749.53 757.25 716.24 768.07 DSL (MG) 79.50 53.84 36.33 5.59 17.34 30.42 37.17 DSL (percent) 9.0% 6.7% 4.2% 0.7% 2.2% 4.1% 4.5% 3-year Rolling Average — — 6.6% 3.9% 2.4% 2.4% —
(1) Combined production from Anacortes and Wells 8, 9 and 11 from Table 2-3. (2) Total Service Area Consumption from Table 2-10. DSL is below the required 10 percent in each year from 2007 through 2012. In 2007, Anacortes recalibrated all source meters that measure the City’s water use. In addition, the City verified that all its meters were calibrated properly and replaced all inaccurate meters. The City completes regularly scheduled inspection and calibration of their source meters. Between 2008 and 2012, the annual average DSL was 3.9 percent. Leakage from 2007 was excluded because of inaccurate metering data. For source demand projections, a conservative annual DSL of 4.0 percent will be assumed. SEASONAL VARIATIONS Seasonal average day consumption by customer class for 2012 was analyzed and is shown on Figure 2-2. For simplicity, customer classes with low consumption were combined into a single data category. These classes included multi-commercial, school, hotel/motel, industrial/church, sprinklers, commercial/residential, and hydrant meters.

Gray & Osborne, Inc., Consulting Engineers
City of Oak Harbor 2-13 2013 Water System Plan Update September 2014
Analysis of seasonal demand by class can help to identify trends or important differences between indoor and outdoor residential and commercial demands and/or potential peaking factors. These data also help to visualize significant increases in water demand for a particular customer class during only part of the year. Knowledge of seasonal variations in water demand can help planning personnel better serve customers and maintain the water system.
0.0
10.0
20.0
30.0
40.0
50.0
60.0
70.0
80.0
90.0
RESIDENTIA
L
MULTI. RESID
.
COMMERCIAL
IRRIG
ATION
OTHER
NASWI
Customer Class
2012
Ave
. Sea
sona
l Con
sum
ptio
n (M
G)
Jan-Feb-Mar Apr-May-Jun July-Aug-Sept Oct-Nov-Dec
FIGURE 2-2
Annual Water Use Seasonal Variations by Customer Class Data from Figure 2-2 show that the highest seasonal use for all customer classes considered is during the summer months of July, August, and September. The multi-residential customer class shows very consistent water consumption throughout the entire year. Summer water use constitutes approximately 31 percent of the overall annual water use, while fall water use is the next largest seasonal use period at approximately 24 percent. This is typical for most municipalities, as irrigation requirements significantly increase due to warmer temperatures. The seasonal variation of water consumption within a particular customer class is not expected to change within the timeframe of this planning effort. LARGE WATER USERS Information regarding the ten largest consumers of City water is listed in Table 2-12.

Gray & Osborne, Inc., Consulting Engineers
2-14 City of Oak Harbor September 2014 2013 Water System Plan Update
TABLE 2-12
Top City Water Users for 2012
User Name
2012 Consumption
(gallons)
Average Consumption
(gpd) Customer Class ERUs(1) NASWI (2) 259,719,414 709,616 Wholesale 4,731 Western Village/Vito Ent, Ltd. 4,499,968 12,295 Commercial 89 State of Washington (DPSP) (2) (3) 3,993,572 10,911 Commercial 79 OHMP, LLC 3,934,480 10,750 Multi-Residential 78 Oak Bay Station Apartments 3,590,400 9,810 Multi-Residential 71 Woodside North 3,161,796 8,639 Multi-Residential 63 City Beach West Park Irrigation 3,012,944 8,232 Irrigation 60 Coachman Inn 2,933,656 8,015 Commercial 58 North Whidbey Water District (2) 2,628,472 7,182 Commercial 52 City RBC Sewer Treatment 2,569,380 7,020 Commercial 51 Summer Hill Assisted Living, LLC 2,496,824 6,822 Multi-Residential 49 Total 292,540,906 799,292 — 5,792 Retail Service Area Values 449,898,221 1,470,594 — 8,899 (1) Based on the 2012 value of 138 gpd/ERU. (2) Wholesale user. (3) DPSP = Deception Pass State Park facilities. Only one of the top ten users within the City’s service area are in the irrigation customer class, while the remaining users are considered commercial or multi-residential. ERUs were calculated by dividing the 2012 consumption by the 2012 ERU value of 138 gpd/ERU developed earlier in this chapter. Overall, the top ten users within the City represent approximately 7.2 percent of the overall City water consumption. Targeting these top ten water-consuming customers for conservation and efficient water use programs presents an opportunity for water use savings, which are discussed further in Chapter 5 – Water Use Efficiency Program. PROJECTED SYSTEM INFORMATION POPULATION Future water demands for the City’s retail service area were developed using population projections provided by the City and Island County planning departments, the Washington State OFM, and NASWI staff. The projected service area population is summarized in Table 2-13.

Gray & Osborne, Inc., Consulting Engineers
City of Oak Harbor 2-15 2013 Water System Plan Update September 2014
TABLE 2-13
Projected Population of Oak Harbor and Retail Service Area
Year City
Population(1) RSA in UGAPopulation(2)
Retail Service Area Population(3)
Service Area Population(4)
2013 22,080 18 18,778 27,444 2014 22,266 18 18,964 27,632 2015 22,454 18 19,952 28,621 2016 22,644 18 20,942 29,611 2017 22,835 18 21,933 30,603 2018 23,027 18 22,925 31,597 2019 23,222 18 23,920 32,593 2020 23,418 18 24,116 32,790 2021 23,615 18 24,313 32,989 2022 23,815 18 24,513 33,189 2023 24,016 18 24,714 33,391 2024 24,218 18 24,916 33,595 2025 24,423 18 25,121 33,801 2030 25,471 18 26,169 34,855 2033 26,121 18 26,819 35,510 2060 32,774 18 33,472 42,204 (1) Population within the city limits – which includes the Seaplane Base. (2) Population outside of the city limits, but within the City’s urban growth area and
retail service area. (3) City population plus population in UGA and retail service area minus NASWI
Seaplane Base personnel. Also includes projected population increase due to proposed NASWI squadron additions.
(4) Includes City population, NASWI Ault Field and Seaplane Base, as well as DPSP and NWWD population.
Growth rates used for projecting future populations are based on previous plan projections, current populations, current growth indicators, economic indicators, and an appropriate level of contingency. City population growth rates were assumed to be constant at 0.8 percent annually, while UGA population was assumed to increase at an annual rate of 0.17 percent due to City annexation of lands within the UGA. NASWI personnel is anticipated to increase by 4,000 persons (2,000 NASWI personnel and their dependents) within the 6-year planning period, but NASWI has no plans to expand housing at either Ault Field or the Seaplane Base. Consequently, these populations are projected to remain constant, and additional military personnel and their dependents are included in projections for the RSA and service area. DPSP population was estimated using annual water use and per capita consumption (65 gpcd) for the City in 2012, and NWWD population was estimated based on annual water use and 65 gpcd. These populations were assumed to increase 1 percent annually.

Gray & Osborne, Inc., Consulting Engineers
2-16 City of Oak Harbor September 2014 2013 Water System Plan Update
SERVICE CONNECTIONS The number of service connections in each customer class was estimated to increase at an annual rate of 1 percent. By doing this, the total estimated number of connections in 2019, 2033 and 2060 is 7,059, 8,111 and 10,609, respectively. The City is currently designing a project that will provide two metered interties between the City and the NASWI Seaplane Base. When this project is completed, water for the Seaplane Base facilities will be provided by the City’s distribution system through two connections located at the intersections of NE Regatta Drive and West Crescent Harbor Road, and also at NE Regatta Drive and East Whidbey Avenue. The U.S. Navy has requested 775 gpm for peak hour flow plus 2,500 gpm fire flow at the Crescent Harbor Road intertie, and 1,000 gpm peak hour flow at the Whidbey Avenue intertie. These projects are further described in Chapter 8 – Capital Improvement Program. WATER USE Water demand through the end of the planning period must be estimated to determine water system deficiencies. Distribution facilities are typically sized to supply the peak hour demands or maximum day plus fire flow demands. Major transmission, pumping, and storage facilities are typically sized using maximum day demand and a diurnal demand curve. The diurnal demand curve describes the demand variations throughout the day as a function of the total demand. WATER CONSUMPTION In general, water consumption by the City as well as by NASWI has decreased since 2007. As the population continues to increase, however, it is likely that the water demand by the water system customers will also increase. Table 2-14 summarizes the system wide projected consumption (in MG) through the 20-year planning period.

Gray & Osborne, Inc., Consulting Engineers
City of Oak Harbor 2-17 2013 Water System Plan Update September 2014
TABLE 2-14
Projected Water Consumption
Year
Million Gallons
Residential(1) Multi.
Residential(1) Commercial(1) Irrigation(1) All
Others(1)
Total Retail Service Area Consumption NASWI(2)
WholesaleUsers(3)
Total Service Area Consumption
2013 231.1 121.0 47.7 26.4 50.1 476.3 290.0 8.6 774.9 2014 233.4 122.2 48.2 26.6 50.6 481.0 290.0 8.6 779.7 2015 245.6 128.6 50.7 28.0 53.3 506.1 290.0 8.6 804.7 2016 258.5 135.3 53.3 29.5 56.1 532.7 290.8 8.6 832.1 2017 270.0 141.3 55.7 30.8 58.6 556.3 290.0 8.6 855.0 2018 282.2 147.7 58.2 32.2 61.2 581.5 290.0 8.6 880.1 2019 294.4 154.1 60.7 33.6 63.9 606.7 290.0 8.6 905.4 2020 297.6 155.8 61.4 34.0 64.6 613.4 297.5 8.6 919.5 2021 299.3 156.7 61.7 34.2 64.9 616.7 303.3 8.6 928.7 2022 301.7 158.0 62.2 34.4 65.4 621.8 310.0 8.6 940.4 2023 304.2 159.3 62.8 34.7 66.0 626.9 316.7 8.6 952.1 2024 307.5 161.0 63.4 35.1 66.7 633.8 324.2 8.6 966.6 2025 309.2 161.9 63.8 35.3 67.1 637.2 330.0 8.6 975.8 2030 322.1 168.6 66.4 36.8 69.9 663.8 363.3 8.6 1,035.7 2033 330.1 172.8 68.1 37.7 71.6 680.3 383.3 8.6 1,072.1 2060 413.1 216.3 85.2 47.2 89.6 851.4 384.3 8.6 1,244.3 (1) Based on projected population and 69 gpcd and system demand by class from Table 2-7. (2) Assumes constant NASWI population until 2020, then an average of 0.4 percent growth per year through 2060. (3) Assumed to remain constant.

Gray & Osborne, Inc., Consulting Engineers
2-18 City of Oak Harbor September 2014 2013 Water System Plan Update
Total water demand projections are ultimately based on the projected ADD. The ADD value was calculated by multiplying the assumed per capita water usage (69 gpd) by the projected service area population. Table 2-14 shows a steady increase in water demand until 2016, when an increase in demand is evident. Figure 2-3 shows the historical and projected water demands for the City, NASWI, as well as the total projected water demands. These projections do not include water use efficiency program savings, which are discussed further in Chapter 5 – Water Use Efficiency Program.
0100200300400500600700800900
1,0001,1001,2001,300
2005 2010 2015 2020 2025 2030 2035 2040 2045 2050 2055 2060
Year
Ann
ual C
onsu
mpt
ion
(MG
)
City NASWI Total
FIGURE 2-3
Historical and Projected Service Area Annual Water Consumption EQUIVALENT RESIDENTIAL UNITS Projections for the number of ERUs within the retail and wholesale service areas were also estimated. To project the number of service area ERUs, the total projected water consumption was divided by the ERU value of 150 gpd per ERU (Table 2-8). Results of this calculation are shown in Table 2-15. Although not shown below, ERUs by customer class can also be estimated using the percentage totals listed in Table 2-7.

Gray & Osborne, Inc., Consulting Engineers
City of Oak Harbor 2-19 2013 Water System Plan Update September 2014
TABLE 2-15
Projected Service Area ERUs
Year
Retail Service
Area ERUs(1)
Total NASWI ERUs(2)
SeaplaneBase
ERUs(3) Wholesale
ERUs(4)
Service Area
ERUs(5) 2013 9,233 5,297 2,384 5,454 14,821 2014 9,323 5,297 2,384 5,454 14,911 2015 9,798 5,297 2,384 5,454 15,391
2016(6) 10,274 5,297 2,384 5,454 15,871 2017 10,750 5,297 2,384 5,454 16,352 2018 11,227 5,297 2,384 5,454 16,833 2019 11,706 5,297 2,384 5,454 17,316 2020 11,804 5,419 2,438 5,576 17,538 2021 11,904 5,540 2,493 5,697 17,761 2022 12,004 5,662 2,548 5,819 17,985 2023 12,106 5,784 2,603 5,941 18,210 2024 12,208 5,905 2,657 6,062 18,436 2025 12,310 6,027 2,712 6,184 18,662 2030 12,837 6,635 2,986 6,792 19,808 2033 13,164 7,000 3,150 7,157 20,505 2060 16,362 7,000 3,150 7,157 23,733
(1) Includes City ERUs and ERUs inside the UGA within the retail service area. (2) Based on projected water consumption and ERU value of 150 gpd. Also
includes Seaplane Base ERUs. (3) Based on historical use of 45 percent of total NASWI consumption, projected
NASWI consumption, and ERU value of 150 gpd. (4) Includes NASWI, DPSP, and NWWD. (5) Includes retail and wholesale ERUs. (6) In 2016, Seaplane Base customers are expected to start being served by the City
distribution system. AVERAGE DAY/MAXIMUM DAY/PEAK HOUR DEMAND Projected ADD, MDD, and PHD were also estimated for planning purposes and are shown in Table 2-16. ADD was estimated by multiplying the projected service area population by the daily per capita water use value of 69 gpcd. Both the MDD and the PHD were estimated based on the historical MDD-to-ADD and PHD-to-MDD peaking factors, which are 1.80 (2.27 for NASWI), and 1.64, respectively.

Gray & Osborne, Inc., Consulting Engineers
2-20 City of Oak Harbor September 2014 2013 Water System Plan Update
TABLE 2-16
Projected Service Area ADD, MDD, and PHD Consumption
Year 2013 2014 2015 2016 2017 2018 2019 2020 2021 2022 2023 2024 2025 2030 2033 2060 Retail Service Area ADD (mgd) 1.305 1.318 1.387 1.455 1.524 1.593 1.662 1.676 1.690 1.704 1.717 1.732 1.746 1.819 1.864 2.326MDD (mgd) 2.349 2.372 2.496 2.620 2.744 2.868 2.992 3.017 3.041 3.066 3.091 3.117 3.142 3.274 3.355 4.187PHD (gpm) 2,675 2,702 2,843 2,983 3,125 3,266 3,408 3,436 3,464 3,492 3,521 3,550 3,579 3,728 3,821 4,769NASWI ADD (mgd) 0.795 0.795 0.795 0.795 0.795 0.795 0.795 0.813 0.831 0.849 0.868 0.886 0.904 0.995 1.050 1.050MDD (mgd) 1.827 1.827 1.827 1.827 1.827 1.827 1.827 1.869 1.911 1.953 1.995 2.037 2.079 2.289 2.415 2.415PHD (gpm) 2,081 2,081 2,081 2,081 2,081 2,081 2,081 2,129 2,177 2,225 2,272 2,320 2,368 2,607 2,750 2,750Combined System ADD (mgd) 2.100 2.112 2.181 2.250 2.319 2.388 2.457 2.489 2.521 2.553 2.585 2.617 2.650 2.814 2.914 3.376MDD (mgd) 4.176 4.200 4.323 4.447 4.571 4.695 4.820 4.886 4.953 5.020 5.087 5.154 5.222 5.563 5.770 6.602PHD (gpm) 4,757 4,783 4,924 5,065 5,206 5,347 5,489 5,565 5,641 5,717 5,793 5,870 5,947 6,335 6,571 7,519

Gray & Osborne, Inc., Consulting Engineers
City of Oak Harbor 2-21 2013 Water System Plan Update September 2014
WATER PURCHASE AND WELL PRODUCTION SOURCE INFORMATION As described previously, the City maintains a water purchase agreement with the City of Anacortes. The City of Anacortes water treatment plant, which treats water from the Skagit River, completed an expansion to 42 million gallons per day (rated capacity) in 2013. Table 2-17 summarizes the projected required source production for the 20-year planning period.
TABLE 2-17
Retail Service Area Projected Source Production
Year
Retail Service Area
Population
Retail Service
Area ERUs
Average Daily
Consumption(1) DSL(2)
Required Production Average
Daily (gpd)
Maximum Daily
(gpd)(3)
Peak Hour
(gpm)(4) 2013 18,778 8,700 1,305,000 80,030 1,385,000 2,493,000 2,839 2014 18,964 8,786 1,318,000 80,520 1,398,000 2,517,000 2,867 2015 19,952 9,244 1,387,000 83,110 1,470,000 2,645,000 3,012 2016 20,942 9,702 1,455,000 85,700 1,541,000 2,774,000 3,159 2017 21,933 10,162 1,524,000 88,300 1,613,000 2,903,000 3,306 2018 22,925 10,621 1,593,000 90,900 1,684,000 3,031,000 3,452 2019 23,920 11,082 1,662,000 93,500 1,756,000 3,160,000 3,599 2020 24,116 11,173 1,676,000 94,700 1,771,000 3,187,000 3,630 2021 24,313 11,265 1,690,000 95,910 1,786,000 3,214,000 3,660 2022 24,513 11,357 1,704,000 97,120 1,801,000 3,241,000 3,691 2023 24,714 11,450 1,717,000 98,330 1,816,000 3,268,000 3,722 2024 24,916 11,544 1,732,000 99,550 1,831,000 3,296,000 3,754 2025 25,121 11,639 1,746,000 100,800 1,847,000 3,324,000 3,786 2030 26,169 12,124 1,819,000 107,000 1,926,000 3,466,000 3,947 2033 26,819 12,425 1,864,000 110,700 1,975,000 3,554,000 4,048 2060 33,472 15,508 2,326,000 128,200 2,454,000 4,418,000 5,032
(1) Based on population projections and 69 gpcd. (2) Assumed to be 80 percent of the estimated DSL for the entire service area. (3) Estimated as 1.8 * ADD + DSL. (4) Estimated as 1.64 * required maximum daily production.

City of Oak Harbor 3-1 2013 Water System Plan Update September 2014
CHAPTER 3
SYSTEM ANALYSIS INTRODUCTION Water system planning is based on a careful analysis of a water utility’s ability to meet minimum level of service standards for existing and future customers. The City has adopted design standards, which identify criteria and standards for the water system. These standards can be used to evaluate and analyze the existing water system facilities and water quality. Based on these analyses, a summary of deficiencies and options to improve compliance with required standards can be identified. SYSTEM DESIGN STANDARDS Performance and design criteria typically address the sizing and reliability requirements for source, storage, distribution, and fire flow components of a water system. WAC 246-290 contains general criteria and standards that must be followed in development of public water systems. In addition, DOH has published its Water System Design Manual (“Design Manual”) that provides more specific guidance for water system design. The design recommendations for general facility standards and City policies and standards are compared below. GENERAL FACILITY STANDARDS Table 3-1 lists the suggested DOH Design Manual guidance as well as the City’s policies with regard to each standard for general facility requirements.
TABLE 3-1
General Facility Standards Summary
Standard DOH Design Manual City Standard Average Day and Maximum Day Demand
Average day demand should be determined from previous actual water use data. Maximum day demand (MDD) is estimated at approximately 2 times the average day demand if metered data is not available.
Average day demand is determined from historic production data. Maximum day demand is determined by examining maximum day production for the last 7 years.

Gray & Osborne, Inc., Consulting Engineers
3-2 City of Oak Harbor September 2014 2013 Water System Plan Update
TABLE 3-1 – (continued)
General Facility Standards Summary
Standard DOH Design Manual City Standard Peak Hour Demand Peak hour demand is determined
using DOH Design Manual Peak hour demand is determined by applying a peaking factor of 1.64 based upon the Design Manual.
PHD = (MDD/1440)[(C) (N)+F] +18C = Coefficient from DOH Table 5-1N = Number of ERUs F = Factor of range from Table 5-1
Source Capacity must be sufficient to meet MDD and replenish fire suppression storage in 72 hours.
Same as the Design Manual.
Storage The sum of: Same as the Design Manual. Operational Storage Equalizing Storage Standby Storage Fire Suppression Storage
Fire Flow Requirements
N/A Maximum required fire flow within the City is 3,500 gpm for 2 hours. All other requirements are as stated in the International Fire Code (2009). Minimum fire flow is 1,000 gpm for 2 hours.
Minimum System Pressure
The system should be designed to maintain a minimum of 30 psi in the distribution system during peak hour demand and 20 psi under fire flow conditions during MDD.
Same as the Design Manual.
Minimum Pipe Sizes
The minimum size for a transmission line shall be determined by hydraulic analysis and in accordance with Design Manual Section 8.1.2.
All pipe is designed to withstand a minimum internal pressure of 150 psi. (OHMC 13.28.040)

Gray & Osborne, Inc., Consulting Engineers
City of Oak Harbor 3-3 2013 Water System Plan Update September 2014
TABLE 3-1 – (continued)
General Facility Standards Summary
Standard DOH Design Manual City Standard Reliability Recommendations
Two or more sources capable of replenishing fire suppression storage within a 72-hour period.
Same as the Design Manual Chapter 5.
Sources must meet ADD with largest source out of service. Back-up power equipment for booster stations unless there are two independent public power sources. Provision of multiple storage tanks. Standby storage equivalent to 2 times ADD, with a minimum of 200 gpd/ERU. Low and high level storage alarms. Looping of distribution mains when feasible. Pipeline velocities not >8 fps at PHD and not >10 fps during fire flow. Flushing velocities of a minimum of 2.5 fps for all pipelines.
Valve and Hydrant Spacing
Sufficient valving should be placed to keep a minimum of customers out of service when water is turned off for maintenance or repair. Fire hydrants on laterals should be provided with their own auxiliary gate valve.
Valve and hydrant standards follow 2009 IFC.
FIRE FLOW During fires, a combination of supply, storage, and distribution capacity must be available to meet firefighting requirements. The primary purpose of the system is to provide water to a fire at the rate and duration required to extinguish it. To achieve this purpose, the following standards and criteria have been adopted: 5It is assumed that fire flow demand will occur during maximum day demand for
• It is assumed that fire flow demand will occur during maximum day demand for modeling purposes.
• The pressure at any point within the system during a fire must remain
above 20 psi.

Gray & Osborne, Inc., Consulting Engineers
3-4 City of Oak Harbor September 2014 2013 Water System Plan Update
System fire flows were established by the Oak Harbor Fire Department for the 1988 Water System Plan based on the grading schedule published in 1974 by the Insurance Services Office. These requirements have been updated and follow Section 507 and Appendix B of the International Fire Code published in 2009. Current minimum fire flow rates are shown in Table 3-2. Fire flows are also discussed with regard to the hydraulic model in Chapter 4 – Hydraulic Analysis.
TABLE 3-2
Minimum Fire Flow Requirements
Land Use Category Minimum Fire Flow
(gpm) Low-Density Residential 1,000 Medium-Density Multifamily 2,000 Small Business 2,000 High-Density Multifamily 3,000 Large Office 3,000 Industrial/Commercial 3,500 Large Assembly Occupancies 3,500
WATER QUALITY STANDARDS AND ANALYSIS WATER QUALITY STANDARDS Table 3-3 lists existing and future drinking water regulations and the status of each regulation. Existing state law contains regulations for bacteriological contaminants, inorganic chemicals and inorganic physical parameters (IOCs), volatile organic chemicals (VOCs), synthetic organic chemicals (SOCs), radionuclides, and trihalomethanes (THMs). Six drinking water regulations will become effective in the next 10 years that will define new regulatory requirements for sulfate, radionuclides, additional IOCs and SOCs, arsenic, additional disinfection byproducts, and bacteriological contaminants. Many of the regulations listed in Table 3-3 define treated source water quality standards and establish monitoring schedules. The implementation schedules for the proposed new regulations are subject to revision and the City will continue to stay informed regarding regulatory deadlines. It is also important to note that some of the required standards fall under the responsibility of the Anacortes water treatment system. Minimum standards for water quality are specified in terms of maximum contaminant levels (MCLs). Primary MCLs are based on chronic and/or acute human health effects while secondary MCLs are based on factors other than health effects, including aesthetics. MCLs are specified in WAC 246-290-310 and described further in the following pages and tables. The following sections discuss the applicable water quality regulations, analysis of the City’s compliance with these regulations, and a summary of

Gray & Osborne, Inc., Consulting Engineers
City of Oak Harbor 3-5 2013 Water System Plan Update September 2014
future regulations for each category. A water quality monitoring schedule is presented later in this chapter.
TABLE 3-3
Drinking Water Regulations and Required Action Summary
Regulation Affected
Contaminants City Action Bacteriological Coliform Monitoring Residual Disinfectant Total free chlorine Monitoring Consumer Confidence Report Reporting Reporting IOC and Physical Parameters IOCs Monitoring VOC/SOC VOCs, SOCs Monitoring Asbestos Asbestos Monitoring Lead and Copper Rule Lead, Copper Monitoring Radionuclide Rule Radionuclides Monitoring
Stage 2 DBP Rule TTHM, HAA5, Chlorite, Bromate Monitoring
Unregulated Contaminant Rule IOCs, VOCs, SOCs Planning and Monitoring Groundwater Rule Bacteriological N/A (1) Surface Water Treatment Rule Microbial N/A Information Collection Rule Bacteriological Reporting Filter/Backwash Rule Bacteriological N/A Interim Enhanced Surface Water Treatment Rule Bacteriological N/A
Long Term 1 Enhanced Surface Water Treatment Rule Bacteriological N/A
Long Term 2 Enhanced Surface Water Treatment Rule Bacteriological N/A
(1) N/A indicates that planning and monitoring requirements are the responsibility of the City of Anacortes.
TESTING REQUIREMENTS The City is required to comply with the DOH requirements for a Group A Public Water System. DOH defines the constituents required and their MCLs for water systems in WAC 246-290-300 and 246-290-310. Water from Wells 8, 9, and 11 is brought to the surface, tested according to DOH requirements prior to treatment, then finally treated with sodium hypochlorite prior to entering the distribution system. Water from Wells 8, 9, and 11 as well as the Anacortes Water Treatment Plant supply is also treated with sodium fluoride prior to entering the distribution system. A brief description of the testing required and the City’s current status with each test is described below.

Gray & Osborne, Inc., Consulting Engineers
3-6 City of Oak Harbor September 2014 2013 Water System Plan Update
Water quality data for water purchased from Anacortes is presented in the City of Anacortes Water System Plan (HDR, 2011); however, Anacortes source water samples did not exceed the primary MCL for any of the contaminants discussed below. BACTERIOLOGICAL Coliform bacteria describe a broad category of organisms routinely monitored in potable water supplies. Though not all coliform bacteria are pathogenic in nature, they are relatively easy to identify in laboratory analysis. If coliform bacteria are detected, then pathogenic organisms may also be present. Bacterial contamination in a water supply can cause a number of waterborne diseases, so these tests are strictly monitored and regulated by DOH. The Coliform Monitoring Rule specifies two types of violations, “non-acute MCLs” and “acute MCLs.” A purveyor is required to notify both the DOH and system consumers if either type of MCL violation occurs. Non-acute violations of bacteriological MCLs are as follows:
• Coliform is detected in two or more routine or repeat samples for systems collecting fewer than 40 samples per month
• Coliform detected in greater than 5 percent of samples during routine
sampling for systems that collect greater than 40 samples per month Acute violations of bacteriological MCLs are as follows:
• E. coli and/or fecal coliform presence in a repeat sample.
• Coliform presence in a set of repeat samples collected as a follow-up to a routine sample with fecal coliform or E. coli presence.
Public notification for an acute violation must be provided within 24 hours. Additional information is available in Chapter 7 – Operation and Maintenance Program. Sample letters and notifications are included in Appendix K. The City is required to collect 20 monthly samples for bacteriological analysis. Within the 6-year planning period, it is projected that the service area population will increase to a value that will require additional sampling. When the City’s service area population rises to 21,501 customers, a total of 25 bacteriological samples will be required. A copy of the routine sampling locations and repeat sample locations is included as part of the City’s Coliform Monitoring Plan, which is included in Appendix L. In the event that a coliform detection occurs, the routine sample sites, as well as upstream and downstream repeat samples sites listed in Appendix L will also be used to determine that the potable

Gray & Osborne, Inc., Consulting Engineers
City of Oak Harbor 3-7 2013 Water System Plan Update September 2014
water system is safe for public consumption. The City has not detected the presence of coliforms in source water samples since 2002. INORGANIC PHYSICAL AND CHEMICAL CHARACTERISTICS WAC 246-290 specifies primary and secondary MCLs for inorganic physical and chemical characteristics. Primary MCLs are based on potential impact to human health, while secondary MCLs are based on aesthetic factors such as taste, color, and odor which do not directly impact human health. Primary and secondary MCLs for inorganic chemical and physical characteristics are summarized in Table 3-4.
TABLE 3-4
Water Quality Standards for Inorganic Chemical Constituents
Chemical Primary MCL (mg/L) Antimony (Sb) 0.006 Arsenic (As) 0.01 Asbestos 7 million fibers/liter Barium (Ba) 2.0 Beryllium (Be) 0.004 Cadmium (Cd) 0.005 Chromium (Cr) 0.1 Cyanide (HCN) 0.2 Fluoride (F) 4.0 Mercury (Hg) 0.002 Nickel (Ni) 0.1 Nitrate (as N) 10.0 Nitrite (as N) 1.0 Selenium (Se) 0.05 Sodium (Na) None(1) Thallium (Tl) 0.002
Chemical Secondary MCL (mg/L) Chloride (Cl) 250 Fluoride (F) 2.0 Iron (Fe) 0.3 Manganese (Mn) 0.05 Silver (Ag) 0.1 Sulfate (SO4) 250 Zinc (Zn) 5.0 Color 15 color units Specific Conductivity 700 µmhos/cm Total Dissolved Solids (TDS) 500 mg/L
(1) Although an MCL has not been established for sodium, there is enough public health significance connected with sodium levels to require inclusion in inorganic chemical and physical monitoring.

Gray & Osborne, Inc., Consulting Engineers
3-8 City of Oak Harbor September 2014 2013 Water System Plan Update
Groundwater sources must be sampled for inorganics as well as nitrite once every 3 years, while nitrate samples are required annually. The City’s most recent IOC samples were taken from all sources in June 2011 and nitrate samples were taken in June 2012 and 2013. Results for these most recent IOC samples are presented in Appendix M. The City’s only exceedance was for manganese at 0.0520 mg/L (MCL 0.05 mg/L) from Well 11. VOLATILE ORGANIC COMPOUNDS AND SYNTHETIC ORGANIC COMPOUNDS Volatile organic chemicals (VOCs) are manufactured, carbon-based chemicals that vaporize quickly at normal temperatures and pressures. VOCs include many hydrocarbons associated with fuels, paint thinners, and solvents. This group does not include organic pesticides, which are regulated separately as synthetic organic chemicals (SOCs). There are currently 21 regulated VOCs and 30 regulated SOCs. A list of these compounds and their MCLs is included in Table 3-5. Per DOH requirements, VOCs must be sampled for once every 3 years unless a waiver is in place. Water samples from all the sources were most recently tested for VOCs in April 2013. VOCs were not detected in any of these tests. Sample results on file with DOH are presented in Appendix M.
TABLE 3-5
Water Quality Standards for Volatile Organic and Synthetic Organic Chemical Constituents
Volatile Organic Chemical
PrimaryMCL
(mg/L)(1) Synthetic Organic
Chemical
Primary MCL
(mg/L)(1) Vinyl Chloride 0.002 Arochlor 0.002 Benzene 0.005 Aldicarb 0.003 Carbon Tetrachloride 0.005 Aldicarb sulfone 0.003 1,2-Dichloroethane 0.005 Aldicarb sulfoxide 0.004 Trichloroethylene 0.005 Atrazine 0.003 Para-Dichlorobenzene 0.075 Carbofuran 0.04 1,1-dichloroethylene 0.007 Chlordane 0.002 1,1,1-Trichloroethane 0.2 Dibromochloro-propane 0.0002 cis-1,2-Dichloroethylene 0.07 2,4-D 0.07 1,2-Dichloropropane 0.005 Ethylene dibromide 0.00005 Ethylbenzene 0.7 Heptachlor 0.0004

Gray & Osborne, Inc., Consulting Engineers
City of Oak Harbor 3-9 2013 Water System Plan Update September 2014
TABLE 3-5 – (continued)
Water Quality Standards for Volatile Organic and Synthetic Organic Chemical Constituents
Volatile Organic Chemical
PrimaryMCL
(mg/L)(1) Synthetic Organic
Chemical
Primary MCL
(mg/L)(1) Monochlorobenzene 0.1 Heptachlor epoxide 0.0002 Ortho-Dichlorobenzene 0.6 Lindane 0.0002 Styrene 0.1 Methoxychlor 0.04 Tetrachloroethylene 0.005 Polychlorinated biphenyls (PCBs) 0.0005 Toluene 1 Pentachlorophenol 0.001 Trans-1,2-Dichloroethylene 0.1 Toxaphene 0.003 Xylenes (total) 10 2,4,5-TP 0.05 Dichloromethane 0.005 Benzo(a)pyrene 0.0002 1,2,4-Trichloro-benzene 0.07 Dalapon 0.2 1,1,2-Thrichloro-ethane 0.005 Di(2-ethylhexyl) adipate 0.4 — — Di(2-ethylhexyl) phthalate 0.006 — — Dinoseb 0.007 — — Diquat 0.02 — — Endothal 0.1 — — Endrin 0.002 — — Glyphosate 0.7 — — Hexachlorobenzene 0.001 — — Hexachlorocyclopentadiene 0.05 — — Oxamyl (vydate) 0.2 — — Picloram 0.5 — — Simazine 0.004 — — 2,3,7,8-TCDD (dioxin) 0.00000003
(1) Reflects most recent DOH guidelines. ASBESTOS Asbestos is the name for a group of naturally occurring, hydrated silicate minerals with fibrous morphology. Included in this group are chrysotile, corcidolite, amosite, and the fibrous varieties of anthophyllite, tremolite, and actinolite. Most commercially mined asbestos is chrysotile. Asbestos’ flexibility, strength, and chemical and heat resistance properties have adapted it to many uses including building insulation, brake linings, and water pipe. In recent years, there has been much concern with the health risks associated with asbestos. Several studies and case histories have documented the hazards to internal organs as a result of inhalation of asbestos fibers. Data is limited on the effects of

Gray & Osborne, Inc., Consulting Engineers
3-10 City of Oak Harbor September 2014 2013 Water System Plan Update
ingestion of asbestos fibers or on the effects of inhalation exposure from drinking water. Ingestion studies have not caused cancer in laboratory animals, although studies of asbestos workers have shown increased rates of gastrointestinal cancer. Asbestos is listed a primary inorganic contaminant; however, it is not routinely included in IOC samples for public water systems. Since the City’s water distribution system has greater than 10 percent asbestos-cement pipe installed, an asbestos sample must be collected from the distribution system at least once every 9 years. The most recent asbestos sample was collected in May 2013. Sample results on file with DOH are presented in Appendix M. LEAD AND COPPER In 1991, the EPA promulgated the federal Lead and Copper Rule. The State of Washington adopted this rule in 1995 with minimal changes. The Lead and Copper Rule (LCR) is intended to reduce the tap water concentrations of lead and copper that can occur when corrosive source water causes lead and copper to leach from water meters, piping, and other plumbing fixtures. Possible treatment techniques to reduce lead and copper leaching include aeration or the addition of caustic soda or soda ash to the source water prior to distribution. Both of these tactics effectively increase the pH of the water, which decreases the solubility of lead and copper found within pipes and fixtures. For compliance with the LCR, 90 percent of the distribution system lead samples collected according to the procedures outlined in WAC 246-290 must have concentrations below the “action level” of 0.015 mg/L. Similarly, 90 percent of the copper samples must have concentrations less than 1.3 mg/L. Systems with samples that exceed these action levels are required to provide public notification and implement a program for reducing lead and copper levels. In August 2010 and again in August 2013, the City performed routine lead and copper testing as required by DOH. The City took samples from specific sample locations throughout the City’s distribution system. Data from these samples is summarized in Table 3-6. Sample results on file with DOH are presented in Appendix M.

Gray & Osborne, Inc., Consulting Engineers
City of Oak Harbor 3-11 2013 Water System Plan Update September 2014
TABLE 3-6
LCR Sample Results Summary
Parameter 2010Lead
2013Lead
2010 Copper
2013 Copper
Maximum Value 0.020 0.005 0.135 0.289 Minimum Value 0.001 0.001 0.011 0.025 90th Percentile Value 0.009 0.003 0.000 0.193 Average (mg/L) 0.004 0.002 0.041 0.103 Samples Collected 30 27 30 27 Action Level (mg/L) 0.015 0.015 1.3 1.3 Samples Exceeding Action Level 3 0 0 0
RADIONUCLIDES AND RADON Radionuclides include radioactive substances occurring naturally in subsurface waters. Regulated substances include radium-226, radium-228, uranium, and gross alpha and beta particles. Table 3-7 summarizes radionuclide MCLs as defined by EPA’s Radionuclide Rule and Washington State Department of Health’s WAC 246-290.
TABLE 3-7
Water Quality Standards for Radionuclides
Parameter MCL
Radium-226 3 pCi/L Radium-228 20 pCi/L Combined Radium-226 and Radium-228 5 pCi/L Uranium 30 µg/L Gross Alpha Particle Activity, excluding Uranium 15 pCi/L Gross Beta Particle Activity 4 millirem/year
Though a radon MCL was included in the originally proposed Radionuclide Rule, it was determined that a radon MCL will now be issued as a separate rule. In November of 1999, EPA proposed a preliminary radon MCL of 300 pCi/L. EPA is considering an alternative MCL of 4,000 pCi/L if states or water purveyors implement a multimedia mitigation program aimed at reducing household indoor-air health risks from radon gas from soil as well as tap water. The final Radon Rule publication date is unknown. The City’s most recent radon/radionuclide samples were collected in July 2009. No radionuclides or radon were detected at significant levels for these samples. New samples should be collected by water system staff and submitted to DOH prior to the end of 2015. Sample results on file with DOH are presented in Appendix M.

Gray & Osborne, Inc., Consulting Engineers
3-12 City of Oak Harbor September 2014 2013 Water System Plan Update
DISINFECTANTS/DISINFECTION BYPRODUCTS (D/DBP) WAC 246-290-300(6) requires purveyors of public water systems that provide water treated with chemical disinfectants to monitor for disinfectants and disinfection byproducts (DBPs). The Disinfection/Disinfectants Byproduct Rule (D/DBP Rule) establishes minimum residual disinfectant concentrations and MCLs for DBPs. Trihalomethanes (THMs) and five haloacetic acids (HAA5) are a group of organic compounds that can be formed as a result of drinking water disinfection by chlorine and are, therefore, often referred to as disinfection byproducts. Total trihalomethanes (TTHMs) include the sum of the concentrations of four specific disinfection byproducts: chloroform, bromoform, bromodichloromethane, and dibromochloromethane. The Stage 1 D/DBP rule became effective in February 1999 and the City’s compliance deadline was December 2003. Under Stage 1 of the D/DBP Rule, the MCLs for TTHM and HAA5 are 80 μg/L and 60 μg/L, respectively, and are based on the running annual average of four quarterly samples. Systems are required to prepare and implement a DBP monitoring plan. For the City, the Stage 1 D/DBP Rule will remain in effect for compliance until October 1, 2013. Stage 2 of the D/DBP Rule was published in January 2006 and compliance with the new regulation began on October 1, 2013. Under Stage 2 of the D/DBP Rule, the MCLs for TTHM and HAA5 remain 80 μg/L and 60 μg/L, respectively. However, compliance with the MCL is based on the running annual average of each individual sample location (called a locational running annual average, or LRAA) instead of the running annual average of all samples combined. Since the City’s population is between 10,000 and 49,999 people, the City will be required to collect four samples each quarter. Sampling locations are based on results of the Initial Distribution System Evaluation (IDSE), which was completed by the City in July 2010. It is also possible to qualify for a reduced monitoring schedule depending on results from submitted samples. If results from City samples are below 40 μg/L for TTHM and 30 μg/L for HAA5, respectively, the City may reduce their sampling schedule. The City did not exceed the TTHM, HAA, or bromate MCL in its most recent DBP sampling event in August 2013. Although they did not exceed the MCL for TTHM or HAA5, they did not qualify for a reduced monitoring schedule as part of the Stage 2 D/DBP Rule. Sample results as well as the City’s Stage 2 Monitoring Plan are presented in Appendix M. EPA UNREGULATED CONTAMINANTS Starting in 2013, any public water system serving more than 10,000 customers is required to monitor the List 1 Contaminants for a period of 12 months between 2013 and 2015. This list includes analytes that the U.S. EPA is considering regulating in future years, and information collected on these analytes will be used to guide potential regulatory levels.

Gray & Osborne, Inc., Consulting Engineers
City of Oak Harbor 3-13 2013 Water System Plan Update September 2014
The City has provided the Safe Drinking Water Accession and Review System (SDWARS) with contact information, a proposed monitoring schedule, and proposed sampling locations. After October 1, 2012, any modifications to contact information, sampling location, or sampling schedule must be updated with SDWARS. The 21 unregulated contaminants that are required to be monitored are listed in Table 3-8. Once collected, samples must be submitted to an EPA-approved laboratory for analysis and the data should be submitted to SDWARS within 120 days of sample collection.
TABLE 3-8
Unregulated Contaminant Monitoring and Analysis Information
Contaminant Name
Minimum Reporting
Level (μg/L)
Analytical Method
1,2,3-trichloropropane 0.03
EPA 524.3
1,3-butadiene 0.1 chloromethane 0.2 1,1-dichloroethane 0.03 bromomethane 0.2 chlorodifluoromethane (HCFC-22) 0.08 bromochloromethane (Halon 1011) 0.06 1,4-dioxane 0.07 EPA 522 vanadium 0.2
EPA 200.8 Rev 5.4 ASTM D5673-10
SM 3125
molybdenum 1 cobalt 1 strontium 0.3 chromium-3 0.2 chromium-6 0.03
chlorate 20 EPA 300.1
ASTM D6581-08 SM 4110D
perfluorooctanesulfonic acid (PFOS) 0.04
EPA 537 Rev. 1.1
perfluorooctanoic acid (PFOA) 0.02 perfluorononanoic acid (PFNA) 0.02 perfluorohexanesulfonic acid (PFHxS) 0.03 perfluoroheptanoic acid (PFHpA) 0.01 perfluorobutanesulfonic acid (PFBS) 0.09

Gray & Osborne, Inc., Consulting Engineers
3-14 City of Oak Harbor September 2014 2013 Water System Plan Update
GROUNDWATER RULE The Groundwater Rule (GWR) is one of the requirements of the 1994 Amendments to the Safe Drinking Water Act. The final rule was published on November 8, 2006, revised on October 1, 2010, and applies to all water systems that use groundwater as a source of supply. Although the City does not use groundwater as a primary water source, these groundwater sources mix with water from the City of Anacortes, and as such, the City is subject to compliance with the Groundwater Rule. Guidance on compliance with the Groundwater Rule is provided in Appendix L. If any routine distribution system samples confirm the presence of total coliforms, a triggered source water sample for each groundwater source (pre-treatment) must be collected and tested for E. coli. If the source sample is discovered to contain E. Coli, then corrective action or additional testing will be required. After being notified of the presence of total coliforms, DOH will direct the City on a recommended course of action. FLUORIDATION The City has adopted a policy of fluoridating water using sodium fluoride at Wells 8, 9, and 11, and at the Ault Field Booster Station. Fluoride has been shown to have significant health benefits on oral health, and many water systems within the State of Washington add fluoride to their drinking water. Per WAC 246-290-460 the City determines fluoride concentration daily and has historically maintained the concentration between 0.8 mg/L and 1.3 mg/L. In January 2011, DOH requested that the fluoride levels be reduced to a goal of 0.7 mg/L. The City complied immediately with this request. In the future, the City will be evaluating the use of fluoride in the water supply. Both NASWI and City customers currently receive fluoridated water. As part of the project to create a new pressure scheme for the City and its customers, it is assumed that residents of the NASWI Seaplane Base will soon receive water directly from the City and not from NASWI facilities. At that point in time, both City and NASWI customers will receive fluorinated water. CHLORINATION Water from Anacortes is chlorinated at the Anacortes Water Treatment Plant prior to the 24-inch transmission piping. More information regarding Anacortes disinfection techniques is available in the Anacortes Water System Plan (HDR, 2011). Water extracted from Wells 8, 9, and 11 is disinfected using sodium hypochlorite. Disinfectant is added to groundwater through a solution tank and chemical metering pump that are linked to the submersible well pumps. When these well pumps are activated, the chemical meter pump adds disinfectant solution at a rate pre-adjusted by water system operation staff. Chlorine dosage, levels, and residuals are monitored daily at each well location and the Ault Field Booster Station to ensure sufficient residual

Gray & Osborne, Inc., Consulting Engineers
City of Oak Harbor 3-15 2013 Water System Plan Update September 2014
exists within the distribution system, and as a result, rechlorination of water from the Anacortes is not required. WATER QUALITY MONITORING SCHEDULE Water quality monitoring is required for regulatory compliance and to monitor water system conditions. The DOH prepares a Water Quality Monitoring Report each year that is distributed to each water purveyor. A copy of the water quality monitoring report is included in Appendix N. This report defines a monitoring schedule and provides sample locations. Table 3-9 provides a summary of source monitoring activity for the City.
TABLE 3-9
Water Quality Monitoring Requirements
Parameter Sample
Location(1) Sampling Frequency Notes Asbestos DS Once every 9 years Sampled in 1995 and 2013.
Bacteriological DS 20 per month Sampled in 2012. Continued sampling in 2013.
D/DBP DS 3 per year until Oct. 2014, then 4 per quarter Sampled in 2009 and 2013.
General Pesticides SO Two samples every 3 years at each source
No sampling required thru December 2013.
Herbicides SO Two samples every 3 years at each source
No sampling required thru December 2013.
IOC SO One sample every 3 years at each source
Sampled in 2011. No additional sampling required thru 2019.(2)
Insecticides SO Two samples every 3 years at each source
No sampling required through December 2013.
Lead and Copper DS 30 samples every three years Sampled in 2010 and 2013.
Nitrates SO One sample every year at each source Sampled in June 2012 and 2013.
Radionuclides SO One sample every 6 years at each source Sampled in 2009.
SOCs SO One sample every 3 years at each source Sampled in 2004 and 2009.(3)
VOCs SO One sample every 3 years at each source
Well 9 sampled in 2013 Well 8 and 11 sampled in 2009(4)
(1) Sample location code, DS = distribution system, SO = Wells 8, 9, and 11. (2) IOC waiver also requires that some analytes be sampled more frequently. (3) Sample will be collected from each source in 2014. (4) Wells 8 and 11 received waivers through 2013 for VOC analysis. The City will collect and submit
VOC samples for Wells 8 and 11 in 2014.

Gray & Osborne, Inc., Consulting Engineers
3-16 City of Oak Harbor September 2014 2013 Water System Plan Update
SYSTEM COMPONENT ANALYSIS SOURCE OF SUPPLY ANALYSIS A description of the City’s water sources was presented in Chapter 1 – System Description. According to the DOH Design Manual, source production capacity must be sufficient to supply the water supplier’s projected MDD. In addition, MDD and ADD must also comply with the maximum instantaneous and annual withdrawal limitations of the associated water rights. WATER RIGHTS ANALYSIS The City’s water rights are discussed in Chapter 1 – System Description and are summarized in Table 1-2. The City’s production for each groundwater source in 2012 is compared to the maximum annual and instantaneous withdrawal designated by its existing water rights in Table 3-10.
TABLE 3-10
2012 Source Production and Water Rights Summary
Developed Sources
Water Right 2012 Withdrawal 2012
Surplus/(Deficit) Qi
(gpm) Annual
(ac-ft/yr) Qi
(gpm) Annual
(ac-ft/yr) Qi
(gpm) Annual
(ac-ft/yr) Well 8 200 320 160 0.28 40 320 Well 9 450 720 160 0.08 290 720 Well 11 200 320 160 0.27 40 320 System Wide 850 1,360 480 0.63 370 1,359 Percentage of Annual Water Right Used 0.05%
The data show that the City pumps water from Wells 8, 9, and 11 at a level significantly below both the allowable instantaneous and annual water rights. These wells are exercised monthly for preventive maintenance, to supplement times of extremely high demand, and to provide an auxiliary source of water should the Anacortes water supply be interrupted. SOURCE CAPACITY ANALYSIS Average Day Demand In order to determine if total source capacity is able to meet projected ADD for the City and its wholesale customers, capacities for all existing sources were analyzed. This

Gray & Osborne, Inc., Consulting Engineers
City of Oak Harbor 3-17 2013 Water System Plan Update September 2014
includes water from Anacortes as well as the City’s three groundwater sources. The analysis includes three scenarios:
Existing Source Scenario • Anacortes annual CWV of 1,000 million gallons. Combined Total Sources Scenario • Anacortes annual CWV of 1,000 million gallons; and • 3,000,000 gallons based on historical groundwater source production. Water Right DOH Recommended Source Scenario • Anacortes annual CWV of 1,000 million gallons; and • Groundwater sources operated at the water right capacity (850 gpm) a
total of 18 hours per day as recommended by the DOH design manual. Installed Capacity Recommended Source Scenario • Anacortes annual CWV of 1,000 million gallons; and • Groundwater sources operated at the currently pumped value (370 gpm) a
total of 18 hours per day as recommended by the DOH design manual. Results for this analysis are summarized in Table 3-11.

Gray & Osborne, Inc., Consulting Engineers
3-18 City of Oak Harbor September 2014 2013 Water System Plan Update
TABLE 3-11
Source ADD Capacity Analysis Summary
Year ADD
(MG/year)(1)
Existing Source
Scenario (MG/year)(2)
Surplus/ (Deficit)
Combined Total
Sources (MG/year)(3)
Surplus/ (Deficit)
Water Right DOH
Recommended Source
Scenario (MG/year)(4)
Surplus/ (Deficit)
Installed Capacity
Recommended Source
Scenario (MG/year)(5)
Surplus/(Deficit)
2012 798 1,000 202 - - - - - - 2013 811
1,000
189
1,003
192
1,335
524
1,146
334 2014 816 184 187 519 329 2015 843 157 160 492 303 2016 871 129 132 464 275 2017 895 105 108 440 251 2018 922 78 81 413 224 2019 948 52 55 387 198 2020 963 37 40 372 183 2021 975 25 28 360 171 2022 987 13 16 348 158 2023 1,000 0 3 335 146 2024 1,012 -12 -9 323 134 2025 1,022 -22 -19 313 124 2030 1,084 -84 -81 251 61 2033 1,123 -123 -120 212 23 2060 1,299 -299 -296 36 -154
(1) Includes both retail service area and wholesale users. (2) Includes only the CWV from Anacortes. (3) Includes the CWV from Anacortes as well as 3,000,000 gallons to account for historical well production. (4) Includes the CWV from Anacortes as well as a well pumping time of 18 hours per day for the allowable water right of 850 gpm. Note:
additional pumping equipment would be required for the City to extract groundwater at this rate. (5) Includes the CWV from Anacortes as well as a well pumping time of 18 hours per day for the current pumping rate of 370 gpm.

Gray & Osborne, Inc., Consulting Engineers
City of Oak Harbor 3-19 2013 Water System Plan Update September 2014
Results of the source capacity analysis in Table 3-11 suggest that the City’s current arrangement with Anacortes will meet the projected ADD until approximately 2024 – regardless of whether or not water continues to be removed from Wells 8, 9 or 11 at the current rate. If the City were to maintain the current CWV with Anacortes as well as pump water from Wells 8, 9 and 11 at the maximum allowable rate based on currently installed pumping capacity (370 gpm), the City would have sufficient capacity to meet the projected ADD until approximately 2035. However, if the City were to maintain the CWV from Anacortes and remove water from Wells 8, 9, and 11 at the maximum allowable water right value of 850 gpm, the City would have sufficient capacity to meet the projected ADD through the year 2060. Without the CWV from Anacortes, the City does not maintain sufficient source capacity to meet current or projected ADD, and as such should develop contingency plans in the event that the Anacortes source in unavailable. The City should investigate the possibility of developing additional sources of water to be used in the event of an emergency. Maximum Day Demand The City must also be able to meet the MDD for its RSA and wholesale customers with its developed sources. Table 3-12 compares the required MDD with the capacity of the 24-inch transmission line while Table 3-13 compares the required MDD for the RSA and the Seaplane Base with the capacity of the Ault Field Booster Station. As mentioned in Chapter 1 – Description of Water System, and Chapter 2 – Basic Planning Data, the Seaplane Base is slated to be served through the City’s distribution system within the next 3 years.
TABLE 3-12
Service Area MDD Capacity Analysis Summary
Year Service Area MDD (gpm)(1)
Pipeline Capacity(gpm)(2)
Surplus/ (Deficit) Sufficient Capacity?
2012 2,849 14,099 11,250 Yes 2013 2,828 14,099 11,271 Yes 2014 2,845 14,099 11,254 Yes 2015 2,937 14,099 11,163 Yes 2016 3,028 14,099 11,071 Yes 2017 3,120 14,099 10,979 Yes 2018 3,212 14,099 10,887 Yes 2019 3,304 14,099 10,795 Yes 2020 3,347 14,099 10,753 Yes 2021 3,389 14,099 10,710 Yes 2022 3,432 14,099 10,668 Yes 2023 3,475 14,099 10,625 Yes

Gray & Osborne, Inc., Consulting Engineers
3-20 City of Oak Harbor September 2014 2013 Water System Plan Update
TABLE 3-12 – (continued)
Service Area MDD Capacity Analysis Summary
Year Service Area MDD (gpm)(1)
Pipeline Capacity(gpm)(2)
Surplus/ (Deficit) Sufficient Capacity?
2024 3,518 14,099 10,582 Yes 2025 3,561 14,099 10,538 Yes 2030 3,780 14,099 10,320 Yes 2033 3,913 14,099 10,187 Yes 2060 4,529 14,099 9,571 Yes
(1) Includes City, NASWI, NWWD, and DPSP facilities. (2) Assumes a nominal pipe velocity of 10 fps.
TABLE 3-13
Retail Service Area and Seaplane Base MDD Capacity Analysis Summary
Year
Retail Service Area & Seaplane Base MDD
(gpm) AFBS Capacity
(gpm)(1) Surplus/ (Deficit) Sufficient Capacity?
2012 1,752 2,760 1,008 Yes 2013 2,302 2,760 458 Yes 2014 2,319 4,380(2) 2,061 Yes 2015 2,408 4,380 1,972 Yes 2016 2,497 4,380 1,883 Yes 2017 2,587 4,380 1,793 Yes 2018 2,676 4,380 1,704 Yes 2019 2,766 4,380 1,614 Yes 2020 2,798 4,380 1,582 Yes 2021 2,829 4,380 1,551 Yes 2022 2,861 4,380 1,519 Yes 2023 2,893 4,380 1,487 Yes 2024 2,926 4,380 1,454 Yes 2025 2,958 4,380 1,422 Yes 2030 3,122 4,380 1,258 Yes 2033 3,223 4,380 1,157 Yes 2060 3,823 4,380 557 Yes (1) Includes both 1,380 gpm VFD-operated pumps, but does not include either 700 gpm pump. (2) Includes two new 1,500 gpm constant-speed pumps and single 1,380 gpm VFD-controlled
pump. Table 3-12 shows that the 24-inch transmission main contains adequate capacity to serve the service area MDD which includes the City and its wholesale customers.

Gray & Osborne, Inc., Consulting Engineers
City of Oak Harbor 3-21 2013 Water System Plan Update September 2014
Table 3-13 shows that Ault Field Booster Station contains adequate capacity to serve the required MDD for the RSA as well as the Seaplane Base. The increase in capacity seen in 2014 is the result of replacing two of the existing pumps with more efficient, appropriately sized models. This project is described further in Chapter 8 – Capital Improvement Program. STORAGE ANALYSIS Storage requirements for the City will be determined by applying recommendations from the DOH Design Manual. The storage recommended according to this manual is based on the sum of the following:
• Operational Storage (OS) • Equalizing Storage (ES) • Standby Storage (SB) • Fire Suppression Storage (FSS) • Dead Storage (DS), if any
The City currently has three storage tanks in its system including Westside Reservoirs 1 and 2, and the Eastside Reservoir. The City began constructing a new, 4 million gallon North Reservoir in 2013. North Reservoir was considered to be existing for the water system model. When construction of the new reservoir is complete, the Eastside Reservoir will be abandoned and the City will continue to operate a total of three reservoirs. Therefore, the Eastside Reservoir was considered for 2012 to 2013 analysis only. Figure 3-1 shows a schematic drawing of the various storage components and system pressure requirements. Operational Storage Operational storage is the volume of the reservoir devoted to supplying the water system while under normal operating conditions the source(s) of supply are in “off” status. This volume is dependent upon the sensitivity of the reservoir water level sensors and the tank configuration necessary to prevent excessive cycling of source pump motors. Operational storage is in addition to other storage components, thus providing a factor of safety for equalizing, standby, and fire suppression components. Operating storage for the City’s water system is summarized in Table 3-14. For the City, the operational storage varies since the supply from Anacortes is continuous, but the City has devised a method to maintain sufficient operational storage and adequate turn-over of the water supply. The West Reservoirs serve the 307 Zone downstream of the North Reservoir and the proposed 328 Zone and “float” on the system via a common inlet/outlet pipe.

Gray & Osborne, Inc., Consulting Engineers
3-22 City of Oak Harbor September 2014 2013 Water System Plan Update
Development of the 328 Zone will result in less pressure variation in the 307 zone, which is anticipated to reduce the daily water exchange in the West Reservoirs. To address this, a recurring valve closure scheme was developed to assure water exchange in the West Reservoirs. Two PRVs located at the intersection of Gun Club and Goldie Road divide the 307 Zone and 328 Zone and regulate the level of the West Reservoirs. Closing the smaller of the two PRVs when the West Reservoirs are full will allow the water level to drop until system pressure decreases to the point at which the larger PRVs begin to open. This operating scenario will drop the water level in the West reservoirs approximately 5 feet overnight and refill them during the day. The new North Reservoir is upstream of the Goldie and Gun Club PRV stations and does not undergo this cycle. For this analysis, operational storage was assumed to be 10 percent of the West Reservoir storage volume. If the level within the Reservoirs drops 5 feet each night, this would equal approximately 229,000 gallons, which is 9 percent of the Reservoir volume. Equalizing Storage Equalizing storage is typically used to meet diurnal demands that exceed the average day and maximum day demands. The volume of equalizing storage required depends on peak system demands, the magnitude of diurnal water system demand variations, the source production rate, and the mode of system operation. Sufficient equalizing storage must be provided in combination with available water sources and pumping facilities such that peak system demands can be satisfied. Equalizing storage is calculated using the following equation:
( )( )minutes150SES QPHDV −= Where:
VES = equalizing storage component (gallons) PHD = peak hourly demand (gpm) QS = total source of supply capacity, excluding emergency sources (gpm)
Equalizing storage was calculated using the City’s projected PHD and the CWV from Anacortes. Although there is not instantaneous withdrawal limitation for the Anacortes supply, the CWV is equivalent to approximately 1,900 gpm. This value was used for the total source of supply capacity in the equation above. Equalizing storage volumes are summarized in Table 3-14.

CITY OF OAK HARBOR 2013 WATER SYSTEM PLAN UPDATE
FIGURE 3-1
WATER SYSTEM STORAGE COMPONENTS

Gray & Osborne, Inc., Consulting Engineers
City of Oak Harbor 3-23 2013 Water System Plan Update September 2014
Standby Storage Standby storage is provided in order to meet demands in the event of a system failure such as a power outage, an interruption of supply, or break in a major transmission line. The amount of emergency storage should be based on the reliability of supply and pumping equipment, standby power sources, and the anticipated length of time the system could be out of service. Standby storage is calculated using the following equation:
( )( )( ) ( )LSmTMS QQtNADDdaysSB −−= 2 Where:
SBTMS = standby storage component for a multiple source system (gallons) ADD = average day demand for the system (gpd/ERU) N = number of ERUs tm = time the remaining sources are pumped on the day when the largest
source is not available (minutes) QS = sum of all installed and continuously available supply source
capacities, excluding emergency sources (gpm) QL = the largest capacity source available to the water system (gpm)
DOH Note: Although standby storage volumes are intended to satisfy the requirements imposed by system customers for unusual situations and are addressed by WAC 246-290-420, it is recommended that a standby storage volume not be less than 200 gallons/ERU. The estimated number of total ERUs within the retail service area in 2012 was 8,899. Using the DOH note above, which recommends a minimum of 200 gallons/ERU, standby storage for 2012 is estimated to be approximately 1.73 million gallons. Using the equation above with the values listed below results in a standby storage requirement of 1.37 million gallons. Since this value is less than the DOH recommendation, a value of 200 gallons/ERU will be assumed for standby storage.
ADD = 150 gpd/ERU (Table 2-8) N = ERUs (Table 2-9 and Table 2-15) tm = 1,440 minutes (maximum possible) QS = 2,750 gpm (water agreement plus well water rights) QL = 1,900 gpm (water agreement of 1,000 million gallons annually)
The standby storage volume for the City may be reduced since it is served by multiple sources (WAC 246-290-235). It is assumed that when the largest source is unavailable (Anacortes), the remaining sources will continue to operate (Wells 8, 9, and 11). Standby storage volumes are summarized in Table 3-14.

Gray & Osborne, Inc., Consulting Engineers
3-24 City of Oak Harbor September 2014 2013 Water System Plan Update
Fire Suppression Storage Fire suppression storage (FSS) is provided to ensure that the volume of water required for fighting fires is available when necessary. Fire suppression storage also reduces the impact of firefighting on distribution system water pressure. The amount of water required for firefighting purposes is specified in terms of rate of flow in gallons per minute (gpm) and an associated duration. Fire flow must be provided at a residual water system pressure of at least 20 pounds per square inch (psi). Fire suppression storage is calculated using the following equation:
( )( )mtFFFSS = Where:
FSS = required fire suppression storage component (gallons) FF = required fire flow rate, as specified by fire protection authority (gpm) tm = duration of FF rate, as specified by fire protection authority (minutes)
DOH Note: The standby storage component or the fire suppression storage component, whichever volume is smaller, can be excluded from a water system’s total storage requirement provided that such practice is not prohibited by: (1) a locally developed and adopted Coordinated Water System Plan, (2) local ordinance, or (3) the local fire protection authority or County Fire Marshal (reference WAC 246-290-235(4)). The largest fire flow required in the City is at the High School and has a requirement of 3,500 gpm for a duration of 2 hours. This results in a required fire suppression storage of 420,000 gallons. The City and the local fire authority have decided to allow nesting of fire suppression and standby storage. These values are listed in Table 3-14. Dead Storage Dead storage is the volume of stored water not available to all customers at the minimum design pressure in accordance with WAC 246-290-230(5) and (6). Dead storage is excluded from the volumes provided to meet the other storage requirements. WAC 246-290-230(5) and (6) require that a minimum of 30 psi be maintained system wide under peak hour demand conditions (equalization storage depleted) and that 20 psi be maintained system wide under maximum day demand plus fire flow conditions (equalization and fire suppression storage depleted). Using the definitions in the DOH Design Manual, Westside Reservoir 1 maintains a dead storage volume of approximately 321,000 gallons, while Westside Reservoir 2 maintains a dead storage volume of approximately 1,097,000 gallons. Eastside Reservoir 1 has no dead storage since it maintains a base elevation of 190.4 feet and a minimum static pressure of 101.6 feet and only serves customers in the Downtown

Gray & Osborne, Inc., Consulting Engineers
City of Oak Harbor 3-25 2013 Water System Plan Update September 2014
Zone. Dead storage volumes as well as a summary of other storage components are shown in Table 3-14.
TABLE 3-14
Water System Storage Capacity Analysis
Parameter 2013(1) 2019(2) 2033 2060 Gross Storage 3,125,000 6,585,000 6,585,000 6,585,000 Dead Storage 1,418,312 0(6) 0 0 Available Storage 1,706,688 6,585,000 6,585,000 6,585,000 Operational Storage(3) 278,877 658,500 1,145,521 1,145,521 Equalizing Storage 140,895 362,585 467,455 602,190 Fire Suppression Storage(4) 420,000 420,000 420,000 420,000 Standby Storage 1,739,988 2,079,295 2,316,400 2,879,391 Required Storage(5) 2,159,760 3,100,380 3,929,377 4,627,101 Storage Surplus/(Deficit) (453,072) 3,484,620 2,655,623 1,957,899 (1) Includes Eastside Reservoir and Westside Reservoirs 1 and 2. (2) Includes Westside Reservoirs 1 and 2, and North Reservoir. (3) North Reservoir OS assumed to be equal to 10 percent of total storage volume. (4) FSS is based on a maximum fire flow requirement of 3,500 gpm for 2 hours at Oak Harbor High
School. (5) The total required storage volume assumes nesting of fire suppression and standby storage. (6) Assumes that new West 384 Zone will be completed. Data in Table 3-14 show that the City has adequate storage capacity through both the 6- and 20-year planning periods. BOOSTER STATION ANALYSIS An open system is a pressure zone which is governed by an atmospheric storage tank, such as Westside Reservoirs 1 and 2, as well as the Eastside Reservoir 1 and the North Reservoir. These reservoirs serve both the 307 Zone as well as the 243 Zone. A closed system is a zone that is closed to the atmosphere in which pressures are controlled by a booster station. Both the 335 Zone and the 342 Zone are examples of closed systems. For open systems, WAC 246-290-230 requires that the booster station be designed to meet the MDD for the zone with all pumps in service and meet the ADD with the largest pump out of service. For closed systems, WAC 246-290-230 requires that the booster station be designed to meet the MDD and fire flow for the zone with the largest routinely used pump out of service. It is also recommended that peak hour demands can be met with a minimum pressure of 30 psi with the largest capacity pump out of service.

Gray & Osborne, Inc., Consulting Engineers
3-26 City of Oak Harbor September 2014 2013 Water System Plan Update
Ault Field Booster Station The Ault Field Booster Station is an open system and was described in Chapter 1 – System Description. The existing and projected population, ERUs, ADD, and MDD for the area served by this booster station are summarized in Table 3-15.
TABLE 3-15
Ault Field Booster Station Capacity Analysis
Parameter 2012 2013 2019 2033 2060 Population (1) 21,160 27,166 30,828 34,067 41,297ERUs (2) 8,899 8,700 10,396 11,582 14,397Total Capacity (gpm) (3) 2,760 2,760 4,380 4,380 4,380 Capacity with Largest Routinely Used Pump Out of Service (gpm) (3) 1,380 1,380 2,780 2,780 2,780
ADD (gpm) (4) 1,021 1,210 1,468 1,699 2,032 MDD (gpm) (5) 1,752 2,302 2,766 3,223 3,823 Sufficient MDD Capacity? Yes Yes Yes Yes Yes Sufficient ADD Capacity? Yes Yes Yes Yes Yes (1) Assumed to be equal to the existing service area. (2) ERUs assumed to be the total number of ERUs within the City service area. Does not include
NWWD or DPSP. Growth as described in Chapter 2 – Basic Planning Data. (3) For 2012 and 2013 assumes only two VFD pumps are operational. Beyond 2013 assumes that two
new constant-speed pumps and two VFD pumps are operational. (4) Calculated using projected required production for the RSA and Seaplane Base. (5) Calculated using projected data for the RSA and Seaplane Base. Data suggest that the Ault Field Booster Station has sufficient capacity to meet the service area MDD. The station also has sufficient capacity to meet the region’s ADD with the largest pump out of service. Heller Street Booster Station The Heller Street Booster Station is a closed system and was described in Chapter 1 – System Description. The existing and projected population, ERUs, ADD, MDD, and PHD for the area served by this booster station are summarized in Table 3-16.

Gray & Osborne, Inc., Consulting Engineers
City of Oak Harbor 3-27 2013 Water System Plan Update September 2014
TABLE 3-16
Heller Street Booster Station Capacity Analysis
Parameter 2012 2013 2019 2033 2060 Population(1) 613 613 613 613 613 Estimated ERUs(2) 245 245 245 245 245 Total Capacity (gpm) 430 430 430 430 430 Capacity with Largest Routinely Used Pump Out of Service (gpm) 215 215 215 215 215 ADD (gpm)(3) 26 26 26 26 26 MDD (gpm)(4) 46 46 46 46 46 PHD (gpm)(5) 124 124 124 124 124 Fire Flow (gpm)(6) 1,000 1,000 1,000 1,000 1,000Sufficient MDD and FF Capacity? No No No No No Sufficient PHD Capacity? Yes Yes Yes Yes Yes (1) Calculated based on 2.5 persons per household, 2010 U.S. Census. (2) ERUs were estimated from aerial photographs of region. Region included only single-family
residential properties. Area served by this booster station is fully developed and no additional services are anticipated/available at this time.
(3) Calculated using an average of 150 gpd per ERU. (4) Calculated using the MDD-to-ADD ratio of 1.95. (5) PHD was calculated using Equation 5-1 of DOH Design Manual. (6) For a duration of 2 hours, per City standards. Fire flow is not pumped to this zone, but instead
flows by gravity through a check valve downstream of the westside Reservoir No. 2. Data show that the Heller Street Booster Station does not have sufficient capacity to meet the projected MDD and fire flow requirements for the 342 Zone. As mentioned in Chapter 1 – System Description, the Heller Street Booster Station provides water service while fire flow is provided by Westside Reservoirs 1 and 2. Since fire flow is provided by the Westside Reservoirs, the Heller Street Booster Station does have sufficient capacity to meet both MDD and PHD with the largest pump out of service. Redwing Booster Station The Redwing Booster Station is a closed system and was described in Chapter 1 – System Description. The existing and projected population, ERUs, ADD, MDD, and PHD for the area served by this booster station are summarized in Table 3-17.

Gray & Osborne, Inc., Consulting Engineers
3-28 City of Oak Harbor September 2014 2013 Water System Plan Update
TABLE 3-17
Redwing Booster Station Capacity Analysis
Parameter 2012 2013 2019 2033 2060 Population(1) 568 573 608 700 915 Estimated ERUs(2) 227 229 243 280 366 Total Capacity (gpm) 2,100 2,100 2,100 2,100 2,100Capacity with Largest Routinely Used Pump Out of Service (gpm) 2,000 2,000 2,000 2,000 2,000
ADD (gpm)(3) 24 24 25 29 38 MDD (gpm)(4) 43 43 46 53 69 PHD (gpm)(5) 117 118 123 136 165 Fire Flow (gpm)(6) 2,000 2,000 2,000 2,000 2,000Sufficient MDD and FF Capacity? No No No No No Sufficient PHD Capacity? Yes Yes Yes Yes Yes (1) Calculated based on 2.5 persons per household, 2010 U.S. Census. (2) ERUs were estimated from aerial photographs or region. Region included 112 SFR ERUs and
115 ERUs as part of multifamily units. Units were assumed to have one, two, or four separate residences. Projected ERUs were assumed to increase at an annual rate of 1 percent.
(3) Calculated using an average of 150 gpd per ERU. (4) Calculated using the MDD-to-ADD ratio of 1.95. (5) PHD was calculated using Equation 5-1 of DOH Design Manual. (6) For a duration of 2 hours, per City standards. Data show that while very close, the Redwing Booster Station does not have sufficient capacity to meet the projected MDD and fire flows for the 335 Zone. The booster station does, however, have sufficient capacity to meet existing and projected PHD with the largest routinely used pump out of service. TRANSMISSION MAIN AND DISTRIBUTION SYSTEM ANALYSIS A description of the distribution system facilities was provided in Chapter 1 – System Description. Overall, the distribution system is in functional condition, but as with every domestic water system, there are areas that should be upgraded. Distribution system deficiencies that were identified as a part of this hydraulic analysis are discussed in both Chapter 4 – Hydraulic Analysis, as well as Chapter 8 – Capital Improvement Program. An analysis of the transmission mains is provided in Chapter 4 – Hydraulic Analysis. System. Overall, the transmission mains are in functional condition. The City has expressed an interest in proactively investigating the integrity of both the 10- and 24-inch transmission mains, and projects that address these interests are described in Chapter 8 – Capital Improvement Program. The 2009 Predesign Report (Appendix F) recommended a reconfiguration of the existing pressure zones for the City in order to address storage capacity shortcomings identified in

Gray & Osborne, Inc., Consulting Engineers
City of Oak Harbor 3-29 2013 Water System Plan Update September 2014
the report. Developing new pressure zones will include additional transmission mains, pressure-reducing valve stations, a booster station, and a reservoir. Some of these projects have been completed while others are in the design or planning stage. It is the City’s intention to reconfigure its existing pressure zone scheme in line with the recommendations from the Predesign Report and they have already taken steps to accomplish this transition. Projects associated with this reconfiguration are described throughout this report as well as in Chapter 8 – Capital Improvement Program. SYSTEM DEFICIENCIES Existing and future system deficiencies of the City’s water system are summarized below. WATER RIGHTS AND SOURCE OF SUPPLY The total volume of City sources, including the CWV from Anacortes and the annual water right for its three groundwater sources is able to meet the projected MDD through 2022. The City may extend this time period to 2030 by operating its groundwater sources continuously, but this operation method is not recommended by DOH. Additional discussion on specific projects to address issues with source supply is included in Chapter 8 – Capital Improvement Program. STORAGE The City does have adequate storage capacity for the 6- and 20-year planning periods. Completion of the North Reservoir will increase the available storage capacity to levels sufficient to provide reliable water service until beyond 2033. Construction of this reservoir began in 2013, and should be completed by early 2014. Additional storage capacity can be retained by keeping the Eastside Reservoir 1 in service, but design shortcomings and costs to refurbish or stabilized the foundation of the reservoir may pose an unnecessary safety risk and the City may instead wish to remove the reservoir from service. BOOSTER STATIONS The Ault Field Booster Station currently does not currently have sufficient capacity to meet projected MDD for the City through the 20-year planning period. The City plans to replace the existing constant-speed pumps in 2014 with larger, constant-speed models to address this deficiency. The Ault Field Booster Station will have sufficient capacity to meet the service area’s projected ADD with the largest routinely used pump out of service throughout the 20-year planning period. The Heller Street Booster Station does not exhibit any deficiencies at this time, and is able to meet the required ADD and MDD for the 342 Zone as long as sufficient fire flows are provided by Westside Reservoirs 1 and 2.

Gray & Osborne, Inc., Consulting Engineers
3-30 City of Oak Harbor September 2014 2013 Water System Plan Update
The Redwing Booster Station is not able to meet projected MDD and fire flows through the 20-year planning period. Immediate required capacity is 2,046 gpm, while the available capacity with the largest routinely used pump out of service is 2,000 gpm. The booster station is, however, able to meet projected PHD for the 335 Zone. The City maintains plans to restructure the booster station and pressure zone structure of its water system through completion of several different projects. These projects and proposed changes to the water system pressure scheme and booster station status are discussed further in Chapter 4 – Hydraulic Analysis and Chapter 8 – Capital Improvement Program. DISTRIBUTION SYSTEM Improvements to the City’s distribution system are discussed in Chapter 4 – Hydraulic Analysis, and Chapter 8 – Capital Improvement Program. TREATMENT Water treatment facilities are not required at this time. Future changes in the regulations and the water quality within the City’s system may require new facilities. As new regulations are promulgated, the City’s water supply should be evaluated and if treatment facilities are required, they should be implemented by the City.

City of Oak Harbor 4-1 2013 Water System Plan Update September 2014
CHAPTER 4
HYDRAULIC ANALYSIS INTRODUCTION This chapter presents information on the computer hydraulic model of the City’s water system and the results of hydraulic analyses. The purpose of the hydraulic analysis is to evaluate the existing and future capabilities of the water system. The operation of a municipal water system involves dynamic interactions between various water system components including source, storage, transmission, and distribution system facilities. These interactions and their effect on the level of service provided to the City’s customers are dependent on the distribution and magnitude of water demands within the system and the performance characteristics of the water system facilities. In addition, infrequent high water demand events, such as firefighting and other emergencies, can significantly alter the normal flow patterns and pressures in the municipal water system. These factors must be considered in analyzing the ability of a water system to provide for future demands, while maintaining an adequate level of water service to customers. The development of a computer hydraulic model, which can accurately and realistically simulate the response of a water system under a variety of conditions and scenarios, has become an increasingly important element in the planning, design, and analysis of municipal water systems. The Washington State Department of Health’s WAC 246-290 requires hydraulic modeling as a component of water system comprehensive plans. HYDRAULIC MODELING PROGRAM The City’s system was analyzed using MWHSoft’s H2ONet hydraulic modeling software which operates in a computer-aided design and drafting (AutoCAD) environment. The H2ONet model is configured with a graphical user interface. Each model element, including pipes, valves, pumps, and reservoirs, is assigned a unique graphical representation within the program. Each element is also assigned a number of attributes specific to its function. Element attributes include spatial coordinates, elevation, water demand, pipe length, diameter, and pipe status (open/closed), as well as pump, valve and reservoir characteristics. Model input is accomplished through the creation and manipulation of these objects and their attributes. The H2ONet software produces the model output in the form of flows and pressures throughout the simulated water system.

Gray & Osborne Inc., Consulting Engineers
4-2 City of Oak Harbor September 2014 2013 Water System Plan Update
MODEL LAYOUT AND CONSTRUCTION In order to create a realistic representation of the City’s water system, the model was created using the water system base map and information obtained through conversations with the city. A map detailing existing pipes and nodes is included in Appendix O. The Seaplane Base was not included in the hydraulic analysis because a value for pressure and flow requirements had not been finalized. Figures 4-2 and 4-3 include proposed CIP projects that would provide water service to the eastern edge of the City limits. SOURCE The only source included in the City’s model is the intertie with the City of Anacortes, which has been modeled as a fixed head reservoir and is controlled by the Ault Field Booster Station. SERVICE DOMAIN The model includes all City distribution mains, but does not include NASWI water mains. Model demands are assigned to nodes in all areas where services or facility demands actually exist. All demand nodes are modeled to maintain pressures of 20 psi under maximum day demands and fire flow conditions, and 30 psi under peak hour conditions as described in Chapter 3 – System Analysis. STORAGE In H2ONet, reservoirs are modeled as “tanks” with finite size using actual reservoir dimensions and elevations. The model includes Westside Reservoirs 1 and 2 as well as the new North Reservoir. Dimensions and critical elevations of the storage facilities are provided in Table 1-4. Per WAC 246-290-230(6), fire flows must be provided when equalizing storage (ES) and fire suppression storage (FSS) have been depleted from the reservoirs and while maintaining a system-wide minimum pressure of 20 psi. Similarly, peak hour demands must be met while maintaining a system-wide minimum pressure of 30 psi with equalizing storage depleted. To provide a more conservative analysis, operational storage has also been depleted from all reservoirs for all model scenarios. Table 4-1 summarizes reservoir levels used in the model and storage volumes depleted.

Gray & Osborne Inc., Consulting Engineers
City of Oak Harbor 4-3 2013 Water System Plan Update September 2014
TABLE 4-1
Model Storage Tank Information
Storage Component
Westside 1 Westside 2 North Total
(gallons) Volume (gallons)
Drawdown(ft)
Volume (gallons)
Drawdown(ft)
Volume (gallons)
Drawdown (ft)
2013 OS 58,500 5.7 200,000 5.7 400,000 3.2 658,500 2013 FSS 7,995 0.8 27,335 0.8 420,000 3.4 455,330 2013 ES 10,331 1.0 35,318 1.0 70,636 0.6 116,285 2013 Total 76,826 7.4 262,653 7.4 890,636 7.1 1,230,115 2019 OS 58,500 5.7 200,000 5.7 400,000 3.2 658,500 2019 FSS 7,995 0.8 27,335 0.8 420,000 3.4 455,330 2019 ES 17,282 1.7 59,085 1.7 118,170 0.9 194,537 2019 Total 83,778 8.1 286,420 8.1 938,170 7.5 1,308,368 2033 OS 58,500 5.7 200,000 5.7 400,000 3.2 658,500 2033 FSS 7,995 0.8 27,335 0.8 420,000 3.4 455,330 2033 ES 22,140 2.1 75,693 2.1 151,386 1.2 249,220 2033 Total 88,636 8.6 303,028 8.6 971,386 7.8 1,363,050
MODEL DEMANDS Existing system demands were determined for the City’s service area from existing production data. Future demands are based on growth assumptions as described in Chapter 2 – Basic Planning Data. SCENARIOS The H2ONet modeling software allows the user to input a variety of demands and scenarios. For the purpose of this plan, the following sets of demands were developed in the hydraulic model:
• 2013, 2019, and 2033 Maximum Day Demand: These demands were used to evaluate the system’s ability to meet the required fire flows for the DOH minimum requirement of 20 psi.
• 2013, 2019, and 2033 Peak Hour Demand: These demands were used to
verify that the system is capable of meeting DOH standards to supply domestic water at a minimum system-wide pressure of 30 psi.
These six scenarios were used to determine the improvements required to meet the current and projected expansion of the City’s water system. MODEL CALIBRATION Model calibration was not performed as part of the water system plan modeling. Calibration information was taken from the New Reservoir Predesign Report

Gray & Osborne Inc., Consulting Engineers
4-4 City of Oak Harbor September 2014 2013 Water System Plan Update
(Gray & Osborne, 2009) and incorporated into the current water system model. The results from previous model calibration tests are all within the acceptable limits set forth within the DOH planning guidelines. Table 4-2 summarizes calibration data.
TABLE 4-2
Model Calibration Data
Zone Location Flow Node
PressureNode
Static (psi) Residual (psi) Flow(gpm)Field Model Field Model
247 SE City Beach Street and SE Bayshore Drive 116 456 98 100 76 76 2,253
247 SW Erie Street north of SR 20 758 92 86 89 58 57 2,094
307 SW Cooper Way 50 52 72 73 46 43 1,797
307 SW Waterloo Avenue and SW Balda Street 848 219 93 96 61 60 1,891
307 NW Cherry Hill Loop and NW Almond Loop 666 665 76 75 51 51 1,921
307 NE Regatta Dr north of NE 16th Avenue 600 588 52 53 33 33 1,580
MODEL SIMULATION AND RESULTS Full model results and data output tables are presented in Appendix O. PEAK HOUR DEMAND According to DOH waterworks standards and WAC 246-290-230, a water system must maintain a minimum pressure of 30 psi in the distribution system under peak hour demand conditions. The City’s existing distribution system was modeled under current 2013 and projected 2019 and 2033 peak hour demand conditions. All services are above 30 psi during 2013, 2019, and 2033 peak hour demand conditions with the exception of those in Parkwood Manor Mobile Home Park. This community is located along NW Crobsy Road between Kathleen Drive and NW Elwha Street. While the surrounding neighborhoods are part of the Redwing Zone (HGL 335), the mobile home park is served by a private water system not associated with the City’s distribution system. The City does, however, provide fire flow to the mobile home park at the required 20 psi pressures. There are four dead-end mains extending through the park. AVAILABLE FIRE FLOW WAC 246-290-230 states, “If fire flow is to be provided, the distribution system shall also provide MDD plus the required fire flow at a pressure of at least 20 psi at all points throughout the distribution system, and under the condition where the designed volume
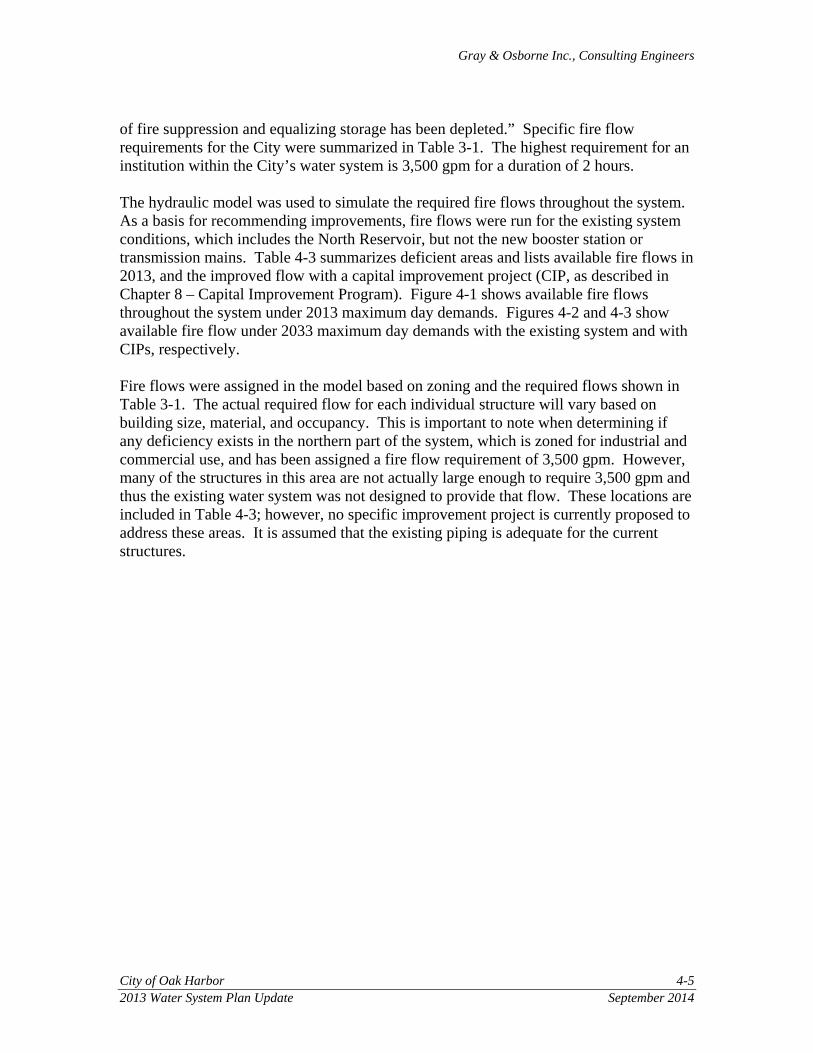
Gray & Osborne Inc., Consulting Engineers
City of Oak Harbor 4-5 2013 Water System Plan Update September 2014
of fire suppression and equalizing storage has been depleted.” Specific fire flow requirements for the City were summarized in Table 3-1. The highest requirement for an institution within the City’s water system is 3,500 gpm for a duration of 2 hours. The hydraulic model was used to simulate the required fire flows throughout the system. As a basis for recommending improvements, fire flows were run for the existing system conditions, which includes the North Reservoir, but not the new booster station or transmission mains. Table 4-3 summarizes deficient areas and lists available fire flows in 2013, and the improved flow with a capital improvement project (CIP, as described in Chapter 8 – Capital Improvement Program). Figure 4-1 shows available fire flows throughout the system under 2013 maximum day demands. Figures 4-2 and 4-3 show available fire flow under 2033 maximum day demands with the existing system and with CIPs, respectively. Fire flows were assigned in the model based on zoning and the required flows shown in Table 3-1. The actual required flow for each individual structure will vary based on building size, material, and occupancy. This is important to note when determining if any deficiency exists in the northern part of the system, which is zoned for industrial and commercial use, and has been assigned a fire flow requirement of 3,500 gpm. However, many of the structures in this area are not actually large enough to require 3,500 gpm and thus the existing water system was not designed to provide that flow. These locations are included in Table 4-3; however, no specific improvement project is currently proposed to address these areas. It is assumed that the existing piping is adequate for the current structures.

Gray & Osborne Inc., Consulting Engineers
4-6 City of Oak Harbor September 2014 2013 Water System Plan Update
TABLE 4-3
Areas of Existing Fire Flow Deficiencies
ID Location
Min. Required Fire Flow
(gpm)
Existing/ Future Zone
2013 Available
Flow (gpm)(1)
2033 Available Flow with
CIPs (gpm) CIP Project(s) 614, 810 SE Glencoe Street from SE 2nd Place to 90° bend 1,000 245 560-740 2,410-2,690 DS-5 315, 316 SW Judson Drive from SW 4th Avenue to dead end 1,000 307/370 W 680-940 1,260-2,330 370 W Zone
919 SW Periwinkle Lane 1,000 342/370 W 820 1,270 370 W Zone 728 SW Kingma Court 1,000 307/370 W 980 1,450 370 W Zone 838 SE 4th Avenue between SE Midway Boulevard and SE Jerome Street 2,000 245 1,375 >5,000 DS-2
576, 577, 102 Technical Drive from Goldie Road to dead end 3,500 328 1,420-2,240 1,580-3,510 None (2) 602, 862 8-inch water main serving 33575 SR 20 (west of SR 20, north of NE 16th Avenue) 3,500 307/370 E 1,580-1,830 >4,000 370 E Zone
575 Goldie Road between Technical Drive and Oak Street 3,500 328 2,370 4,090 DS-13 693 NW 9th Place east of NW Prow Street 2,000 307/370 W 1,750 2,580 370 W Zone
570, 571, 573 Erin Park Road 3,500 328 2,280-2,470 >4,000 DS-11 555 Ault Field Road and Colin Lane 3,500 328 2,400 >4,000 T-2
568, 569, 572, 574 Oak Street from Goldie Road to dead end 3,500 328 2,440-2,470 >4,000 DS-5, DS-6 599-601, 841 NE Regatta Drive north of NE 16th Avenue 3,500 307/370 E 2,440-2,660 3,660 370 E Zone
840, 598 SR 20 north of NE 16th Avenue 3,500 307/370 E 2,660-2,850 >4,000 370 E Zone 579-583, 551, 839 Loop northeast of 16th and Goldie Way 3,500 307 2,660-3,445 1,940-4,000 None (2) 340, 407, 768-771 Area of SW Swantown Avenue, SW Kimball Drive, and SR 20/w Pioneer Way 3,000 307/322 2,725-2,790 >3,400 322 Zone
931 SW 19th Court west of SW Scenic Heights Street 3,000 307/322 2,745 3,490 322 Zone 251, 926 8-inch water main west of NE Goldie Street, north of NE Easy Street 3,500 307 2,945-3,480 3,060-4,920 T-2, DS-5 927, 928 Colin Road south of Ault Field Road 3,500 328 2,980 3,120 T-2, DS-7
564, 565 8-inch looped water main serving property at Ault Field Road and N Oak Harbor Road 3,500 328 3,030-3,410 3,010-3,540 None (2)
538, 539 NE Midway Boulevard and NE 8th Avenue 3,500 307 3,470 >4,000 T-2 (1) Available flow as limited by system pressure of 20 psi. (2) No specific project planned, existing system assumed sufficient to meet actual fire flow requirements and development will drive any improvements to the
area.
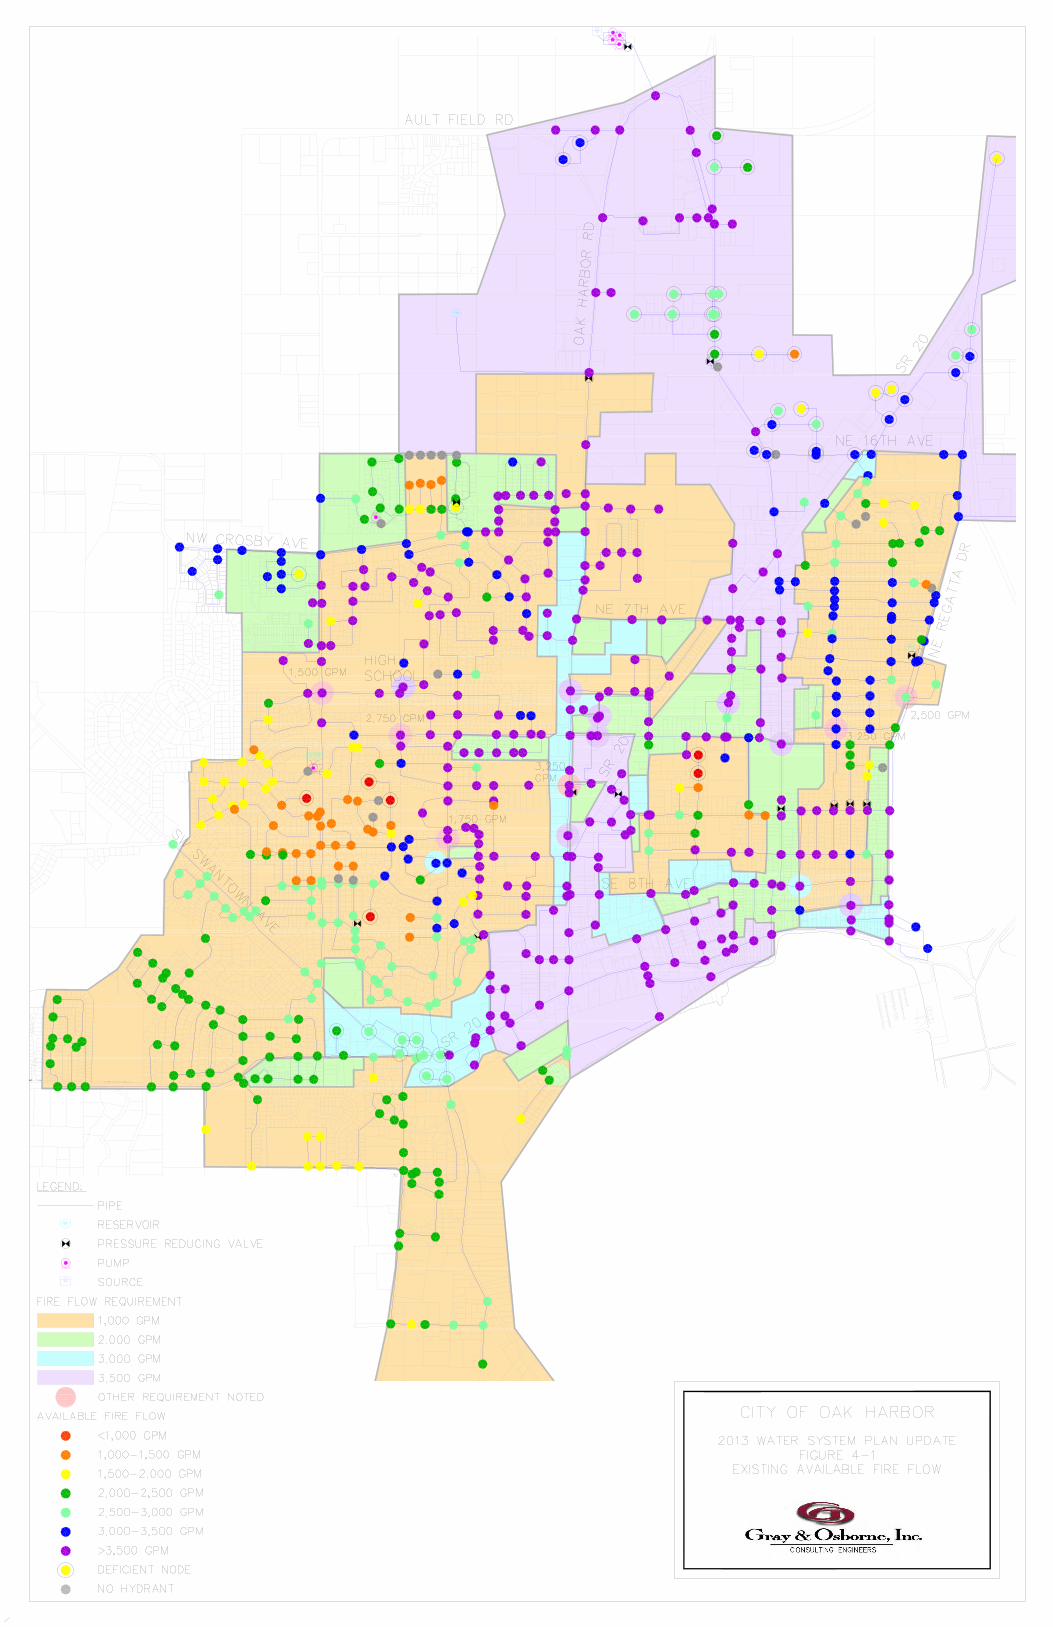


Gray & Osborne Inc., Consulting Engineers
City of Oak Harbor 4-7 2013 Water System Plan Update September 2014
SYSTEM RECOMMENDATIONS Based on results from the hydraulic model, the north booster station and new pressure zones will address many of the existing deficiencies. The remaining CIPs generally replace undersized pipe within the distribution system. These projects are described in Chapter 8 – Capital Improvement Program.

City of Oak Harbor 5-1 2013 Water System Plan Update September 2014
CHAPTER 5
WATER USE EFFICIENCY PROGRAM INTRODUCTION The following chapter presents the City’s Water Use Efficiency (WUE) Program and information on program development and implementation, recommended measures and level of implementation, regional conservation programs, reclaimed water opportunities, and compliance with the Municipal Water Law (MWL). WATER USE EFFICIENCY A viable water use efficiency plan is a requirement of water system planning per WAC 246-290. Public awareness and participation are necessary for the City to develop an active and beneficial water use efficiency plan. The Washington Legislature passed the Water Use Efficiency Act of 1989 (43.20.230 RCW) which directs DOH to develop procedures and guidelines relating to water use efficiency. In response to this mandate, Ecology, the Washington Water Utilities Council, and DOH jointly published a document titled Conservation Planning Requirements (RCW 90.46) in 1994. In 2003, the Municipal Water Supply – Efficiency Requirements Act (Municipal Water Law) was passed and amended RCW 90.46 to require additional conservation measures. The MWL, among other things, directed DOH to develop the Water Use Efficiency Rule (WUE Rule), which became effective January 22, 2007, and is outlined in the Water Use Efficiency Guidebook (DOH, 2011). These documents provide guidelines and requirements regarding the development and implementation of conservation and efficiency programs for public water systems. Conservation and efficiency programs developed in compliance with these documents are required by DOH as part of water system planning documents and by Ecology as part of a public water system water right application. Conservation must be evaluated and implemented as an alternate source of supply before state agencies approve applications for new or expanded water rights. The WUE Rule sets more stringent guidelines for public water purveyors. The three fundamental elements that comprise the WUE Rule are:
1. Planning Requirements, 2. Distribution Leakage Standards, and 3. Goal Setting and Performance Reporting.

Gray & Osborne, Inc., Consulting Engineers
5-2 City of Oak Harbor September 2014 2013 Water System Plan Update
PAST CONSERVATION PROGRAMS The City adopted a conservation program as part of the 2003 Water System Plan. A copy of this conservation program is included in Appendix P. Through the development of this program, the City sought to meet the following goals and objectives:
• Maintain the current level of service while increasing water use efficiency,
• Protect water resources as valuable commodities,
• Reduce per capita water consumption,
• Meet current and long-term utility growth requirements,
• Maintain water system capacity for current and future system users,
• Adapt a regional approach to water quality and conservation,
• Reduce residential and/or irrigation water consumption,
• Develop a program for public education and awareness. To meet these goals, the City implemented measures which included:
• Preventive replacement and installation of new water metering equipment,
• Implementation of monthly billing statement to more clearly show water use and water use trends,
• Modification of water rates to encourage conservation measures, and
• Consistent and regular source meter monitoring.
A variety of external measures targeted for consumers were also implemented and included:
• Distribution of free or cost-reduced conservation kits,
• Promotion of plants and vegetation that are adapted to the City’s climate zone, and
• Public conservation education and outreach.

Gray & Osborne, Inc., Consulting Engineers
City of Oak Harbor 5-3 2013 Water System Plan Update September 2014
PLANNING REQUIREMENTS Under the WUE Rule, water systems are required to implement planning methods to project future demands and determine necessary measures to reduce usage and demand. Elements of the planning requirements include:
• Data Collection and Reporting, • Demand Forecasting, and • Selection and Evaluation of WUE Measures.
DATA COLLECTION AND REPORTING The WUE Rule requires regular collection of production and consumption data. Data must be reported in the City’s planning documents and annual performance report to DOH. Water use data is used by the City to:
• Calculate leakage, • Forecast demand for future water needs, • Identify areas for more efficient water use, • Evaluate the success of the City’s WUE Program, • Describe water supply characteristics, and • Assist with water management decision-making.
Table 5-1 summarizes the water use data collection requirements, which must be accomplished through source and service meter monitoring. The MWL states that all water system connections must have active service meters on or before January 22, 2017.
TABLE 5-1
Summary of Water Use Data Collection
Data Type Includes Source of Supply Meter Data Monthly and annual totals of water produced,
purchased from another water system, and/or supplied to other water systems through interties.
Service Meter Data Total annual water consumed, annual water consumed by each customer class, and customer class seasonal variations.
These data are needed to meet the planning and performance reporting requirements and to check compliance with the distribution system leakage standard of the WUE Rule. The City collects and tabulates monthly production and consumption data and separates these uses over 12 unique customer classes.

Gray & Osborne, Inc., Consulting Engineers
5-4 City of Oak Harbor September 2014 2013 Water System Plan Update
DEMAND FORECASTING Demand forecasting is an essential element of water system planning. It provides a basis for comparison for growth and usage, and also helps in scheduling system improvements. For the purposes of the WUE Rule, forecasting is used in goal setting and measuring the success of the WUE program. Demand forecasting is meant to consider factors such as:
• Population (Current and Future), • Historic Water Use Patterns, • Local Land Use Plans and Zoning Restrictions, • Water Rate Structure and Its Impact on Consumption, • Employment (Economic Development and Employment Trends), and • Projected WUE Savings.
Complete demand projections are provided in Chapter 2 – Basic Planning Information of this Plan, however, a summary is included in Table 5-2. These forecasts do not include anticipated reductions in use from conservation and efficient water use efforts, but do include an estimate of distribution system leakage of 4 percent. Demand projections that include WUE Program savings are discussed later in this chapter.
TABLE 5-2
Retail Service Area Projected Required Production
Year
Retail Service Area
Population
Retail Service Area ERUs
Average DailyConsumption(1) DSL(2)
Required Production Average
Daily (gpd)
Maximum Daily
(gpd)(3)
Peak Hour
(gpm)(4)
2013 18,778 8,700 1,305,000 80,030 1,385,000 2,493,000 2,839 2014 19,419 8,997 1,350,000 81,710 1,431,000 2,576,000 2,934 2015 19,835 9,190 1,378,000 82,800 1,461,000 2,630,000 2,995 2016 21,326 9,880 1,482,000 86,710 1,569,000 2,824,000 3,216 2017 22,053 10,217 1,533,000 88,610 1,621,000 2,918,000 3,323 2018 22,245 10,306 1,546,000 89,120 1,635,000 2,943,000 3,352 2019 22,440 10,396 1,559,000 89,630 1,649,000 2,968,000 3,380 2020 22,470 10,410 1,562,000 90,390 1,652,000 2,974,000 3,387 2021 22,667 10,502 1,575,000 91,600 1,667,000 3,000,000 3,417 2022 22,867 10,594 1,589,000 92,810 1,682,000 3,027,000 3,447 2023 23,068 10,687 1,603,000 94,020 1,697,000 3,055,000 3,479 2024 23,270 10,781 1,617,000 95,240 1,712,000 3,082,000 3,510 2025 23,475 10,876 1,631,000 96,460 1,728,000 3,110,000 3,542

Gray & Osborne, Inc., Consulting Engineers
City of Oak Harbor 5-5 2013 Water System Plan Update September 2014
TABLE 5-2 – (continued)
Retail Service Area Projected Required Production
Year
Retail Service Area
Population
Retail Service Area ERUs
Average DailyConsumption(1) DSL(2)
Required Production Average
Daily (gpd)
Maximum Daily
(gpd)(3)
Peak Hour
(gpm)(4)
2030 24,348 11,281 1,692,000 102,200 1,794,000 3,230,000 3,679 2033 24,999 11,582 1,737,000 106,000 1,843,000 3,318,000 3,779 2060 31,074 14,397 2,160,000 121,900 2,281,000 4,107,000 4,677 (1) Based on population projections and 69 gpcd. (2) Assumes that only 80 percent of total DSL is due to City connections and facilities, while
remaining losses are assumed to be from transmission mains and other facilities. (3) Estimated as 1.8 * ADD + DSL. (4) Estimated as 1.64 * required maximum daily production. DISTRIBUTION SYSTEM LEAKAGE The WUE Rule requires that water distribution systems have a leakage rate less than 10 percent of finished water production based on a 3-year rolling average. The deadline for the City to meet the 3-year rolling average was July 1, 2010. Distribution system leakage (DSL) equals the difference between treated or purchased supply volume and volume measured at the customers’ meters plus any other credibly estimated usage. Since 2008 the annual distribution system leakage has ranged from 53.8 million gallons to 5.6 million gallons at a rate between 6.7 percent and 0.7 percent of total treated supply. DSL from 2007 through 2012 is summarized in Table 5-3.
TABLE 5-3
Historical and Existing Distribution System Leakage Summary
Parameter 2007 2008 2009 2010 2011 2012 AverageTotal Source Production (MG)(1) 880.04 809.48 865.55 755.12 774.59 746.66 805.24 Authorized Consumption (MG)(2) 800.54 755.64 829.22 749.53 757.25 716.24 768.07 DSL (MG) 79.50 53.84 36.33 5.59 17.34 30.42 37.17 DSL (percent) 9.0% 6.7% 4.2% 0.7% 2.2% 4.1% 4.5% 3-year Rolling Average - - 6.6% 3.9% 2.4% 2.4% -
(1) Combined production from Anacortes and Wells 8, 9 and 11. (2) Total Service Area Consumption from Table 2-10. As shown in Table 5-3, the City’s DSL has fluctuated since 2008, but has remained below 10 percent of total source production. Furthermore, since 2007, the 3-year rolling average DSL has also remained well below 10 percent. As such, the City is not required to prepare a water loss control action plan nor implement additional measures to reduce

Gray & Osborne, Inc., Consulting Engineers
5-6 City of Oak Harbor September 2014 2013 Water System Plan Update
DSL; however, the City will strive to maintain or reduce DSL to the maximum extent possible. SELECTION AND EVALUATION OF WUE MEASURES Under the WUE Rule, the City must set water use efficiency goals and measure progress each year toward meeting these goals. Goals must include a measurable outcome, address water supply or demand characteristics, and include an implementation schedule. The City must also evaluate or implement efficiency measures to help meet these goals. GOAL 1: MAINTAIN DSL BELOW 10 PERCENT The first goal of the City’s WUE Program is to maintain DSL at a 3-year rolling average of less than 10 percent. In 2012, the City’s three year rolling average DSL was 2.7 percent. Since 2007, the City’s average annual DSL has been 4.8 percent. The City plans to maintain its achievement of this goal through:
• Water meter accuracy testing, • Leak detection and repair, • Preventive maintenance replacement of old or leaking water mains, and • Continued installation of new automated meter reading (AMR) equipment.
GOAL 2: MAINTAIN SINGLE-FAMILY RESIDENTIAL USE AT OR BELOW 64 GPCD The second goal of the City’s WUE Program is to maintain family household use at or below 64 gpcd based on a 3-year average. A secondary goal is to reduce irrigation usage. Based on historical data, the current 3-year average single-family residence water usage within the retail service area is 67 gpcd. Furthermore, since 2009, the City has reduced its irrigation usage by approximately 39 percent, from 41.3 million gallons to 24.8 million gallons in 2012. The City plans to continue to achieve this goal through:
• Consumer education and awareness,
• Leak detection and repair,
• Appropriate summer watering through customer education and voluntary participation (watering at dawn or dusk, and on even or odd days of the month), and

Gray & Osborne, Inc., Consulting Engineers
City of Oak Harbor 5-7 2013 Water System Plan Update September 2014
• Encouraging low-impact development measures. PERFORMANCE REPORTING The City must report progress toward water use efficiency goals annually and this report must include:
• Total source production,
• Distribution system leakage in percentage and volume, and
• Goal description, schedule, and quantitative progress toward meeting goals.
The City’s annual reports for 2009 through 2012 are included in Appendix Q. WATER USE EFFICIENCY MEASURES The WUE Rule requires the evaluation and implementation of water use efficiency measures to help meet the WUE goals. The WUE Guidebook lists several measures that must be implemented or evaluated and also provides a list of measures that can be counted as additional measures in the WUE program. WAC 246-290-810 identifies the minimum number of water use efficiency measures that must be evaluated based on system size. Because the City serves between 10,000 and 49,999 customers, they are required to evaluate or implement a minimum of nine supplementary water use efficiency measures. The following sections describe both the mandatory and supplementary water use efficiency measures evaluated, and indicate which have been, or will be implemented by the City. MANDATORY MEASURES Implement Source Metering and Meter Calibration Source meters have been installed at all active sources and are evaluated and calibrated at least every 2 years. Current source meters were installed at Ault Field Booster Station in 2012, at Wells 8, 9 and 11 in 2004, and at NASWI in 2013. The meters remain in good condition and are compared monthly against data collected from Anacortes at the Sharpe’s Corner meter.

Gray & Osborne, Inc., Consulting Engineers
5-8 City of Oak Harbor September 2014 2013 Water System Plan Update
Implement Service Metering and Meter Calibration All water users including public and city facilities have individual service meters. Service meters vary in size according to the needs of the individual customer, and all new service connections are installed according to the City’s developer standards. Meters are inspected regularly as part of the City’s preventive maintenance program and replaced as necessary. The City recently completed installation of new Automated Meter Reading (AMR) equipment as part of its meter replacement program, which began in 2005. AMR equipment electronically relay water consumption data to water and billing staff which increases meter reading efficiency, increases the availability and manipulability of consumption information, and allows staff to review an individual connection’s water use history. This capability leads to more accurate leak detection and analysis of consumption patterns. Since the replacement program’s inception in 2005 over 5,776 standard service meters have been replaced with AMR equipment. The City has completed the replacement of a majority of service meters within the retail service area. Implement Leak Detection and Water Accounting The City maintains a rolling three-year average DSL of approximately 3 percent, which is well below the regulatory threshold of 10 percent. As such, the City has not conducted a leak detection survey since 2007. However, the City staff does track unbilled water, such as water used for water main and tank flushing, street cleaning, or other maintenance uses. Implement Customer Education The City has several different brochures regarding conservation and efficient water use available on its website and also available in hard copy at City Hall. The City staffs educational booths at selected fairs and gatherings, and advertises conservation tips on local cable Channel 10. Evaluate and Implement Conservation Rate Structure The City recently completed the Water Cost of Service Study (HDR, 2010) which recommended a new inclined block water service rate structure to fund water system improvements and system maintenance. The City adopted the recommendations of the Study and will adjust future water service rates accordingly. These rates are tiered so that water service fees are assessed based on the amount of water consumed. This new rate structure is being implemented across seven different customer classes, and therefore, counts as seven water use efficiency measures.

Gray & Osborne, Inc., Consulting Engineers
City of Oak Harbor 5-9 2013 Water System Plan Update September 2014
Evaluate Reclaimed Water Opportunities The City currently operates two wastewater treatment operations. The first is a rotating biological contactor (RBC) facility located near WindJammer Park, and the second is a lagoon treatment facility located along East Pioneer Way within the NASWI Seaplane Base. Neither of these facilities are currently capable of producing reclaimed water suitable for public non-potable use. The City is currently in the design phase of constructing a new membrane bioreactor (MBR) facility near the location of the existing WindJammer Park WWTP. If constructed and equipped appropriately, the new MBR facility would be capable of producing Class A reclaimed water which could potentially be used for irrigation, heating and cooling, toilet flushing, and other non-potable uses. The Water Reclamation and Reuse Standards manual published in 1997 by DOH and Ecology outlines uses and standards governing the production and use of reclaimed water. The City plans to further investigate uses of reclaimed both during and after construction of the new MBR wastewater treatment facility, and these uses will be implemented as time, schedule, and funding allows. There are more than 30 parks owned and operated by the City that encompass more than 150 acres. Once reclaimed water is produced, these City parks will be primary candidates for water reuse and other applications may follow in future years. SUPPLEMENTARY MEASURES The City has been implementing many of the following measures since 2003, when a conservation plan was adopted as part of the 2003 WSP. Since these measures proved effective in reducing overall demand, the City will continue to implement them. Bills Showing Consumption History The City includes consumption history on all bills to its customers. The City currently bills on a monthly basis and uses Eden billing software, which has the capability to include historic water use on billing statements. Currently, water use graphs for the most recent 12-month period, as well as the water usage and water consumption rate are indicated on customer billing statements. Customer Leak Detection The City’s billing department monitors customers’ water bills for abnormally high water use volumes. When a measurement occurs that is outside the range of normal use, the customer is notified of a potential leak on their side of the water meter. This detection and monitoring capability is also bolstered through the use of AMR equipment, which allows for nearly real-time monitoring of water consumption.

Gray & Osborne, Inc., Consulting Engineers
5-10 City of Oak Harbor September 2014 2013 Water System Plan Update
Purveyor Assistance The City provides wholesale water to NASWI, Deception Pass State Park facilities, as well as to the North Whidbey Water District. Conservation and efficient water use efforts made by the City intended for residential customers will be extended to the connections in these systems as well and will begin with educational outreach and support. SUMMARY OF WUE MEASURES Based on their number of connections, the City must implement or evaluate a minimum of nine conservation measures (WAC 246-290-810). However, the City has chosen to implement or evaluate all mandatory and supplementary measures discussed above. Table 5-4 provides a summary of these measures and their impact to various customer classes and shows that the City meets the minimum measure requirements of the MWL.
TABLE 5-4
Water Use Efficiency Measures
Measure for Implementation Customer Classes Affected Bills Showing Consumption History 7 Customer Leak Detection 7 Implement Conservation Rate Structure 7 Purveyor Assistance 1 Total 22
WATER SAVINGS PROJECTIONS An estimation of the WUE program water demand savings is listed in Table 5-5. Because DSL is already exceptionally low, the projections assume no additional savings from maintaining DSL below 10 percent. Residential/irrigation savings are projected to increase 0.5 percent per year through the 6-year planning period, and are projected to remain constant through the 20-year planning period The demand forecasts listed in Table 5-2 and those listed in Chapter 2 – Basic Planning Information do not include projected WUE program water savings. WAC 246-290-100(4) requires systems with more than 1,000 service connections to consider demand forecasts that include projected WUE program water savings, as well as projected demands if all WUE program measures deemed cost-effective were implemented. Table 5-5 compares the projected production forecast for the City with and without WUE program savings. Figure 5-1 shows the same information graphically. DSL savings was assumed to be zero based on the City’s goal to maintain their current average annual DSL of 4 percent. The City plans to maintain DSL at 4 percent by

Gray & Osborne, Inc., Consulting Engineers
City of Oak Harbor 5-11 2013 Water System Plan Update September 2014
continuing their regular calibration of source meters as well as the regular maintenance and inspection of all source and service meters within the system. The City’s billing software will also help notify them of abnormal water usage, which can be addressed to reduce inefficient water usage. Residential and irrigation savings were assumed to increase 0.5 percent annually through the 6-year planning period and then remain at 3.0 percent of the total projected production through buildout. The City plans to achieve this reduction through consumer education, continued preventive maintenance, and utilization of the AMR and electronic billing system. The savings from DSL and residential and irrigation consumption reduction were then combined to estimate the average day and maximum day savings if the WUE measures and goals listed above are achieved. Only measures that were deemed cost-effective were included for water savings.

Gray & Osborne, Inc., Consulting Engineers
5-12 City of Oak Harbor September 2014 2013 Water System Plan Update
TABLE 5-5
WUE Program Savings Summary
Year
Service Area
Population ERUs
DSL Savings
(gpd)
Residential/Irrigation Savings (gpd)
Production Without WUE Savings
Production With WUE Savings Average
Day Savings
(gpd)
MaximumDay
Savings (gpd)
AverageDay
(gpd)
MaximumDay
(gpd)
AverageDay
(gpd)
MaximumDay
(gpd) 2013 18,778 8,700 0 3,530 1,385,000 2,493,000 1,381,000 2,485,800 4,000 7,200 2014 18,964 8,786 0 7,120 1,398,000 2,517,000 1,391,000 2,503,800 7,000 13,200 2015 19,952 9,244 0 11,200 1,470,000 2,645,000 1,459,000 2,626,200 11,000 18,800 2016 20,942 9,702 0 15,800 1,541,000 2,774,000 1,525,000 2,745,000 16,000 29,000 2017 21,933 10,162 0 20,600 1,613,000 2,903,000 1,592,000 2,865,600 21,000 37,400 2018 22,925 10,621 0 25,800 1,684,000 3,031,000 1,658,000 2,984,400 26,000 46,600 2019 23,920 11,082 0 27,000 1,756,000 3,160,000 1,729,000 3,112,200 27,000 47,800 2020 24,116 11,173 0 27,300 1,771,000 3,187,000 1,744,000 3,139,200 27,000 47,800 2025 25,121 11,639 0 28,300 1,847,000 3,324,000 1,819,000 3,274,200 28,000 49,800 2030 26,169 12,124 0 29,500 1,926,000 3,466,000 1,897,000 3,414,600 29,000 51,400 2033 26,819 12,425 0 30,200 1,975,000 3,554,000 1,945,000 3,501,000 30,000 53,000 2060 33,472 15,508 0 37,800 2,454,000 4,418,000 2,416,000 4,348,800 38,000 69,200

Gray & Osborne, Inc., Consulting Engineers
City of Oak Harbor 5-13 2013 Water System Plan Update September 2014
1,000,000
1,100,000
1,200,000
1,300,000
1,400,000
1,500,000
1,600,000
1,700,000
1,800,000
1,900,000
2,000,000
2,100,000
2,200,000
2013 2014 2015 2016 2017 2018 2019 2020 2025 2030 2033
Year
Proj
ecte
d A
DD
(gpd
)Projected AD Production W/O WUE Savings Projected AD Production W/WUE Savings
FIGURE 5-1
WUE Program Required Production

City of Oak Harbor 6-1 2013 Water System Plan Update September 2014
CHAPTER 6
SOURCE PROTECTION PROGRAM INTRODUCTION This chapter only discusses sources within the City’s control, namely Wells 8, 9 and 11. A source protection plan was also developed by Anacortes for its groundwater sources as well as its primary source, the Skagit River. More information on the protection plan for these sources is available in the Anacortes Water System Plan (HDR, 2011). Groundwater supplies can be susceptible to contamination from surface sources such as underground storage tanks (UST), pesticides, industrial and commercial activity, accidental spills, and nitrates from septic systems or leaky sewer pipes. In an effort to protect these groundwater resources, the EPA as well as DOH require all Group A water systems to develop a source protection plan as part of their Water System Plan. The purpose of a source protection program is to provide local utilities with a proactive program for preventing groundwater contamination. A successful source protection program consists of a number of components that must be developed before the plan can be approved or fully implemented. The major components of the plan are described below and form the basis of the following chapter.
• A susceptibility assessment that determines the potential for contamination.
• A delineated wellhead protection area (WHPA) that is based on all
reasonably available hydrogeologic information, including the Susceptibility Assessment.
• An inventory within each wellhead protection area of potential sources of
contamination.
• A spill response plan for each wellhead protection area containing documentation for coordination with local first responders.
• Contingency plans for providing alternate sources of drinking water in the
event that contamination does occur. The contingency plan will include management recommendations to reduce the likelihood that potential contaminant sources will pollute the drinking water supply.
The City’s previous Wellhead Protection Plan was developed in 1998 in accordance with DOH requirements and a copy of the Plan is included in Appendix R. This chapter provides updated information based on new and current DOH regulations. Critical

Gray & Osborne Inc., Consulting Engineers
6-2 City of Oak Harbor September 2014 2013 Water System Plan Update
aquifer recharge areas (CARA) are also formally defined in the OHMC and are shown on Figure 1-12. SUSCEPTIBILITY ASSESSMENT Susceptibility assessments are an important initial step in selecting appropriate delineation methods to define the wellhead protection area boundaries. Drinking water supplies vary as to their susceptibility to contaminants discharged at the surface. Wells that have been poorly constructed or have been improperly cased have a higher susceptibility to contamination. In addition, sources located in an unconfined aquifer with no confining layer (layer of low permeability) between the aquifer and surface have a much higher susceptibility. Drawing water from confined aquifers deep below the ground surface provides the best source of protection. Susceptibility assessments for the City’s wells have been submitted to DOH. Copies of these susceptibility assessments are included with the Wellhead Protection Plan in Appendix R. All three active wells within the City’s control maintain a low susceptibility rating. WELLHEAD PROTECTION AREA DELINEATION The first step in developing a wellhead protection program is to identify the land area around each well from which groundwater may be flowing to the source. These areas are the most likely to contribute pollutants to groundwater and are referred to as zones of contribution (ZOCs). Zones of contribution require proper land use management to minimize the risk for contaminants to enter the groundwater system. Also related to the wellhead protection plan and groundwater protection is the delineation of Critical Aquifer Recharge Areas (CARAs). CARAs are those areas with a critical recharging effect on aquifers used for potable water and have prevailing geologic conditions associated with infiltration rates that create a high potential for contamination of ground water resources. CARAs are described in Chapter 1 – System Description, are defined in the OHMC (Chapter 20.32), and are shown on Figure 1-12. METHODS OF DELINEATION The most commonly accepted methods for delineating wellhead protection zones are the calculated fixed radius method, analytical models, and numerical models. Calculated Fixed Radius Method The simplest groundwater model is the calculated fixed radius (CFR) method. In this method, ZOCs are delineated by concentric areas around each well. In the CFR method, the delineation is calculated based on pumping data and known or assumed aquifer and geologic characteristics.

Gray & Osborne Inc., Consulting Engineers
City of Oak Harbor 6-3 2013 Water System Plan Update September 2014
Analytical Models The analytical model requires the incorporation of basic hydrological information and certain physical characteristics of the aquifer and source. Major assumptions and simplifications to the hydrogeologic regime occur in analytical modeling. However, the incorporation of the hydraulic gradient and hydrogeologic boundaries allows for a more realistic representation of the groundwater flow regime than in the CFR method. Numeric Method In numeric modeling, a grid is superimposed over the study area. Each square in the grid, called a cell, is characterized by physical parameters that are estimated from data collected from a variety of sources. The sources may include well logs, geologic and hydrogeologic maps, geophysical data, groundwater elevation data, stream flow discharge, and meteorological data. The numeric method requires significantly more data than either the CFR method or analytical modeling. The numeric method generates more accurate results than the CFR or analytical method, but is very costly to develop. Consequently, numeric models are most commonly used by large utilities with complex aquifers that have the resources to collect the extensive model input required. As in past Planning efforts, this WSP utilizes the CFR method to define ZOCs for the City’s groundwater sources. ANALYSIS A WHPA is designated in order to protect groundwater sources from potential contamination, and to inform water system staff of any entities that represent potential sources of contamination. WHPAs are delineated based on existing and proposed development in the immediate vicinity of the source, and geographical, hydro-geologic, and geomorphologic data. WHPAs are typically broken into four distinct ZOCs based on the estimated amount of time it would take for water to travel through the aquifer and be pumped to the City’s storage facilities. The 6-month, 1-year, 5-year, and 10-year ZOCs for Wells 8, 9, and 11 are shown on Figure 6-1. Well 8 Well 8 is located near the intersection of SW Heller Street and SW 2nd Way. The 10-year ZOC, which is the largest area of potential impact, includes only residential housing. All of the housing units within this ZOC are connected to the City wastewater collection system and do not contain any of the potential contaminant sources discussed later in this chapter.

Gray & Osborne Inc., Consulting Engineers
6-4 City of Oak Harbor September 2014 2013 Water System Plan Update
Well 9 Well 9 is located near the intersection of SW Heller Street and SW 6th Avenue. The 10-year ZOC includes only residential housing and does not contain any of the potential contaminant sources discussed later in this chapter. Well 11 Well 11 is located near the intersection of SW Heller Street and SW Barrington Drive. The 10-year ZOC includes only residential housing and does not contain any of the potential contaminant sources discussed later in this chapter. The radii for the ZOCs for Wells 8, 9, and 11 are very similar and are summarized in Table 6-1 below.
TABLE 6-1
Zone of Contribution Groundwater Source Radii Summary
Well Number 6-month
ZOC (feet)12-month
ZOC (feet)5-year
ZOC (feet)10-year
ZOC (feet) Well 8 100 140 310 440 Well 9 100 140 310 440 Well 11 140 200 440 620
CONTAMINANT SOURCE INVENTORY An essential element of source protection is an inventory of all potential sources of groundwater contamination in and around the delineated protection areas. The purpose of the inventory is to identify past, present, and proposed activities that may pose a threat to the source or surrounding area. The inventory can also help establish management strategies and compile a mailing list of businesses and/or residences located within the source protection areas. POTENTIAL SOURCES OF CONTAMINATION Within a source protection zone, there are many diverse activities that can contaminate an aquifer. A discussion of these activities, their potential effects on groundwater, and the regulatory requirements that may apply are included in the following sections. There are no potential sources of contamination within the ZOCs for Wells 8, 9, or 11. The following sections describe types of sites classified as potential sources of contamination. The City should monitor development within the 10-year ZOC to ensure that any potential contamination source activities are notified of their presence within the source protection area.

CITY OF OAK HARBOR
2013 WATER SYSTEM PLAN UPDATEFIGURE 6-1
WELLHEAD PROTECTION AREA
0 400 800200Feet
³
&Ø
&Ø
&Ø
Hel
ler S
t
Fairh
aven
Dr
SW
Hel
ler S
t
Erie
St
SW
Fai
rhav
en D
r
SW
Erie
St
SW 6th Ave
W Whidbey Ave
SW 8th Ave
SW
Hel
ler R
d
SW Putnam Dr
Robertson Dr
Juds
on D
r
SW Loerland Dr
SW 3rd Ave
SW Loerland Ln
SW Robertson Dr
SW
Reg
ency
Dr
SW 2nd Ave
SW
Jud
son
Dr
1200
W
Fleet St
SW Swantown Ave
Muz
zall
St
Liberty Ln
SW 7th Ave
Swantown Rd
Lope
z D
r
Leschi Dr
SW 4th Ave
SW
Orc
as S
t
SW Castilian Dr
Lato Dr
SW F
leet S
t
SW 1st Ave
SW
McC
roha
n S
t
Col
onia
l Way
Lond
on T
er
N A
viat
or L
n
SW 10th Ave
6th Ave
SW
Roo
dzan
t St
SW
Muz
zall
St
SW 9th Ave
Ponste
en Dr
SW 13th Ct
N Colonial Way
Kalama Loop
600 Ave W
SW
Bar
ringt
on D
r
SW Lopez Dr
Puf
fin S
t
SW Leschi Dr
W Lato Dr
SW 13th Ave
Thorn
berry
Dr
Qui
naul
t St
SW
Stro
ops
Dr
SW
Lan
sdal
e S
tS
W L
ondo
n Te
r
Heritage W
ay
170
St N
W
Crossroads Cir
Nor
man
Dr
SW
Jib
St
SW Kalama Loop
SW Ponsteen Dr
SW Sunnyside Ave
Otte
rcre
st S
t
SW 11th Ct
Oly
mpi
c D
r E
SW Quin
ault S
t
SW 10th Ct
SW 25th Ave
575 Ave W
SW
Fou
nder
s S
t
SW Kingma Ct
SW F
ound
ers Dr
Hem
enw
ay P
l
SW Harrier Cir
650th Ave W
Periwinkle Ln
SW Thornberry D
r
SW S
ilver
berry
St
Loerland Ln
Kirk
Ln
NW
Roe
der D
r
Erie
Cir
N C
ross
woo
ds C
ir
Look
ing
Gla
ss L
oop
SW
Qui
lcen
e Ln
Kittitas Ct
Echo Loop
Patriot Way
SW
Tou
rist S
t
Tulip Ln
Swantown Ave
Klick
itat T
er
Harrier St
SW Echo Loop
SW
Erie
Cir
Franklin Ct
SW 4th Ct
NW
Jib
St
Cas
hmer
e Pl
SW
Ingl
ewoo
d Ln
W Logan Dr
Fairvue Pl
Bern
ard W
ay
SW
Est
on C
t
Lany
ard
Loop
SW 12th Ct
SW
Ove
rway
St
SW
Ingl
esid
e C
t
Independence Ct
Swantown Ave
SW 4th Ave
SW 10th Ave
SW B
arrin
gton Dr
Thornberry Dr
WELL #8
WELL #9
WELL #11
SW
Puf
fin S
t
SW 2nd Ct
SW
Roeder D
r
N H
emen
way
Pl
SW
Otte
rcre
st S
t
700th Ave W
700th Ave W
SW Periwinkle Ln
W Loerland Dr
SW Looking Glass Loop
Outrigger Loop
SW
Kitt
itas
Ct
SW
Kirk
Ln
W Tulip Ct
W Tulip Ln
SW K
lickit
at Te
r
SW
Qui
nalt
St
SW Quinalt S
t
NW Outrigger Loop
SW H
arrier St
SW 2nd Way
Juniper Ct
Hel
ler R
d
SW Franklin Ct
W Cashmere Pl
N Ber
nard
Way
SW
Fes
tival
Ct
NW
Fai
rhav
en D
r
NW
Hel
ler S
t
SW
Qui
lcen
e S
t
NW
Hel
ler R
d
NW
Lanyard Loop
NW
Lan
yard
Loo
p
Firesid
e Ln
W Independence Way
SW Kale
eton Loo
p
300th Ave W
Kaleeton Loop
SW 6th Ave
SW Swantown Ave
SW 8th Ave
SW 6th Ave
SW 2nd Ave
SW Thornb
erry D
r
LEGEND:CITY LIMITSEXISTING/RETAIL SERVICE AREA
&Ø WELLS
ZONES OF CONTRIBUTION:6 MONTH ZOC1 YEAR ZOC5 YEAR ZOC10 YEAR ZOC
DATA SOURCE: CITY OF OAK HARBOR
M:\Oak Harbor\13404 - Water System Plan Update\GIS\WELLHEAD.mxd

Gray & Osborne Inc., Consulting Engineers
City of Oak Harbor 6-5 2013 Water System Plan Update September 2014
Landfills A landfill is a disposal facility in which solid waste is permanently placed. Minimum functional standards for solid waste hauling are regulated by the Ecology under WAC 173-304. These regulations set siting and closure criteria, performance standards, and operating requirements for landfills. Abandoned and improperly maintained landfills and dumpsites are often a major source of groundwater contamination. Leachate from landfills poses a threat to groundwater quality should it migrate to the water table. Ecology is responsible for mitigating dumpsite cleanup when potentially hazardous leachates are present. Both the City and NASWI have landfill sites in the NE part of Oak Harbor. The City’s landfill site is located within both the city limits and the UGA, while the NASWI landfill facility is located outside both the city limits and UGA. Both landfill sites have been closed for many years but still contain waste. The City landfill accepted standard municipal solid waste, but it is not known whether leachate from the facility has entered the aquifer or groundwater under the site. The NASWI landfill was formerly an industrial waste disposal site where spent solvents were deposited in pits. Volatile organic contaminants from the site such as trichloroethene, 1,1-dichloroethene, 1,2-dichloroethene, and vinyl chloride have contaminated groundwater and migrated off site. The NASWI landfill facility is an EPA Superfund Cleanup Site (EPA ID: WA5170090059) and since 1992 has been using a “pump and treat” system to remove contaminants from groundwater. The contaminants listed above are being effectively reduced by the existing treatment system. One contaminant of concern, 1,4-dioxane, has not been successfully remediated using the existing treatment system. 1,4-dioxane has persisted in groundwater and has subsequently migrated off site in a southeasterly direction. The U.S. Navy is in the process of selecting new treatment methods in order to remove 1,4-dioxane from the groundwater. Local geography and the discontinuous nature of aquifers on Whidbey Island make it unlikely that the aquifer zone that the wells are finished in is hydraulically connected to that underlying the landfill sites however this possibility has not been investigated to date. There are no active landfills within the ZOCs for Wells 8, 9 or 11. The City’s waste is consolidated at the Island County Transfer Station in Coupeville, Washington. Commercial and Industrial Activity Areas of commercial and industrial land use are located within most wellhead protection boundaries. Businesses that may contribute contaminants to the groundwater include dry cleaners, gas stations and other businesses with fuel storage tanks, auto repair shops, metal plating facilities, asphalt and concrete facilities, and machine shops. Wastes generated at these businesses include substances such as petroleum products, solvents,

Gray & Osborne Inc., Consulting Engineers
6-6 City of Oak Harbor September 2014 2013 Water System Plan Update
surfactants, heavy metals, and other organic materials. These wastes can potentially enter the groundwater system through inadequate disposal practices or accidental spills. Table 6-2 presents typical commercial and industrial activities and the potentially hazardous chemicals that may be associated with them.
TABLE 6-2
Chemicals Associated with Commercial and Industrial Activities
Commercial/Industrial Activity Contaminants
Automobile/Truck Service Waste oils, solvents, acids, paints, soaps Dry Cleaners Solvents (perchloroethelyene, petroleum solvents, Freon)
Spotting chemicals (trichloroethane, methylchloroform, ammonia, peroxides, hydrochloric acid, rust removers, amyl acetate)
Cemeteries Fertilizers, pesticides Country Clubs/Golf Courses Fertilizers, herbicides, pesticides, swimming pool
chemicals, automotive wastes Electric/Electronic Equipment Manufacturers
Nitric, hydrochloric and sulfuric acid, heavy metal sludges, ammonium persulfate, cutting oil and degreasing solvent, corrosive soldering flux, waste plating solution, cyanide, methylene chloride, perchloroetheylene, trichloroethane, acetone methanol
Furniture/Wood Manufacturing
Paints, solvents, degreasing and solvent recovery sludge
Metal Plating Shops Sodium and hydrogen cyanide, metallic salts, alkaline solutions, acids, solvents, heavy metal-contaminated wastewater/sludge
Lawns and Gardens Fertilizers, herbicides, pesticides Painters, Publishers Solvents, inks, dyes, oils, miscellaneous organics,
photographic chemicals Sand and Gravel Mining Diesel fuel, motor oil, hydraulic fluids Scrap, Salvage and Junkyards
Used oil, gasoline, antifreeze, PCB-contaminated oil, lead acid batteries
The 10-year ZOCs for Wells 8, 9, and 11 do not contain any commercial or industrial activity. Commercial and industrial activity is concentrated east and north of the WHPA near Ault Field Road and Highway 20. RCRA Generators The siting and operation of facilities which treat, store, or dispose of hazardous waste are subject to the requirements of the Resource Conservation and Recovery Act (RCRA), Subtitle C. In Washington State, Ecology regulates facilities which generate more than

Gray & Osborne Inc., Consulting Engineers
City of Oak Harbor 6-7 2013 Water System Plan Update September 2014
220 pounds of hazardous waste per month under WAC 173-303. The regulations are significant in that they establish a number of requirements for these facilities including surveillance and monitoring, recordkeeping, performance and design criteria, and siting and closure procedures. Ecology divides the facilities into three levels of hazardous waste accumulation:
• Level 1 facilities generate at least 2,200 pounds of waste per month; • Level 2 facilities generate between 220 and 2,200 pounds per month; and • Level 3 facilities generate less than 220 pounds per month.
Level 3 generators are exempt from the regulations. All Level 1 and 2 facilities must file an initial report of their activities with Ecology and update those reports annually. A summary of these activities are published by Ecology, thereby allowing water purveyors the opportunity to determine the types of activities present within their wellhead protection area. Information available on Ecology’s website and City zoning analysis show that the 10-year ZOCs Wells 8, 9, and 11 do not contain any known RCRA generators. Underground Storage Tanks Underground storage tanks (USTs) and leaking underground storage tanks (LUSTs) can be a major threat to groundwater quality. Petroleum products that may contain impurities that are mobile in the groundwater system are the most commonly stored substances in USTs. The EPA estimates that 35 percent of all USTs may be leaking. The most common causes of leaks are structural failure, corrosion, improper fittings, and improper installation. Ecology regulates underground storage tanks in Washington State under WAC 173-360. The regulations require that owners and operators of underground storage tanks comply with the following regulations:
• Notification, reporting, and recordkeeping; • Performance standards and operating closure requirements; • Registration and licensing; and • Financial responsibility.
As of July 1, 1991, owners and operators of all existing nonexempt underground storage tanks must have a permit from Ecology. A valid permit is a requirement for delivery of regulated substances. The permit must be updated annually. Underground storage tank inspections are performed by Ecology primarily through the information developed in the permitting process. Ecology maintains a file on all permitted USTs in Washington State, as required by RCRA Subtitle 1. The file provides the site name and address, tank identification number, date of installation, size, tank

Gray & Osborne Inc., Consulting Engineers
6-8 City of Oak Harbor September 2014 2013 Water System Plan Update
status, and the substance stored at the site. Results on file with Ecology indicate that there are 52 USTs within the City’s UGA, all of which are related to fueling stations. The 10-year ZOC for Wells 8, 9, and 11 do not contain any known USTs or suspected LUSTs. Confirmed or Suspected Contamination Sites Under the Model Toxics Control Act cleanup regulation, WAC 173-340, Ecology is responsible for ensuring that all hazardous waste sites are properly remediated. Confirmed and suspected sites of contamination include leaking underground storage tanks (LUSTs). A separate inventory for each LUST, including the status of cleanup efforts, is maintained by Ecology. Ecology conducts an initial site investigation within 90 days of learning of a potentially contaminated site. If this investigation shows that remediation action is required, the site will appear on the Confirmed and Suspected Contaminated Sites Report. The sites are also given a Washington Ranking Mode BIN number between 1 and 5. A rank of 1 indicates the greatest assessed risk to human health and the environment. The contaminant type and the affected media, such as groundwater, are also noted. Once the remedial action has been completed, Ecology’s Toxics Cleanup Program determines if the site can be removed from the list. There are no confirmed contamination sites within the City’s WHPA. Ecology lists 24 confirmed contamination sites within the UGA that are either being cleaned or awaiting remediation. These sites are located far east or north of the WHPA. Septic Systems Island County is responsible for regulating and permitting residential and small commercial on-site sewage disposal systems within the County, excluding federal facilities. Contaminants associated with septic tank effluent include pathogenic organisms, toxic substances, and nitrogen compounds. Ammonia and nitrate nitrogen are highly soluble in water. The City will send a letter to current septic system owners within the source protection zone to notify them of the possible influence of their septic systems on the aquifer, and will also continue to monitor nitrates according to DOH requirements. All residences within the WHPA for Wells 8, 9, and 11 are connected to the City sewer lines. There are no known active or inactive septic systems within the 10-year ZOC for Wells 8, 9, or 11. Improperly Sealed or Secured Wells Improperly sealed or secured wells can act as direct conduits for contaminants to reach groundwater. The City maintains water rights over six wells that have been abandoned in
Gray & Osborne Inc., Consulting Engineers
City of Oak Harbor 6-9 2013 Water System Plan Update September 2014
recent years. Two of these wells, Wells 10 and 12 are within or near the 10-year ZOC of Wells 8 and 11, respectively. The City has sent written correspondence to homeowners within the WHPA notifying them of the risk for contamination to the groundwater supply. Accidental Spills Under the Model Toxics Control Act cleanup regulation, WAC 173-340, Ecology is responsible for ensuring all hazardous waste sites are properly remediated. Confirmed and suspected sites of contamination, such as accidental spills or releases of contaminants, can potentially impact groundwater supplies. Potential sources of spills and leaks can originate from underground storage tanks, accidents, and poor disposal practices. The City will notify the local fire department of the zones of contribution for the groundwater supply. The local authorities who are responsible for cleanup and containment of these spills can properly prepare for the possibility of a spill in the area. INVENTORY DATA SOURCES Agencies such as Ecology and EPA maintain contaminant databases that list businesses that handle and store potential contaminants. The following databases were used to create the inventory for the City’s WHPA:
• Underground Storage Tank Report, April 2011. This version of the Underground Storage Tanks Report was obtained from Ecology’s Toxics Cleanup Program. This list was used to locate the facilities that contain underground storage tanks and verifies facilities located by field surveys in the wellhead protection areas.
• Leaking Underground Storage Tank Report, April 2011. This version of
the Leaking Underground Storage Tank (LUST) Report was also obtained from the Ecology Toxics Cleanup Program. The LUST report lists the site name, address, age, volume, and status of sites that contain leaking underground storage tanks.
• Dangerous Waste and Materials Generators. The EPA’s RCRA program
has been taken over by Ecology within the State of Washington and is regulated under the Dangerous Waste Regulations (173-303 WAC).
• Title III Facilities. Title III facilities are identified as those facilities that
generate, treat, store, or dispose of hazardous materials in sufficient quantity to pose a threat to the community. There are several different types of Title III facilities depending upon the quantity and the nature of the material handled. All companies that are designated as Title III facilities must report to the County on an annual basis. This reporting was

Gray & Osborne Inc., Consulting Engineers
6-10 City of Oak Harbor September 2014 2013 Water System Plan Update
a result of the 1986 Superfund Amendments and Reauthorization Act. Title III of the act was subsequently renamed to the Emergency Planning and Community Right to Know Act (EPCRA).
• Confirmed and Suspected Contaminated Sites Report, May 2011. Ecology
maintains the Confirmed and Suspected Contamination Sites Report. The list is updated as new information becomes available. Each site is given a site status code indicating the status of the cleanup process.
SPILL/INCIDENT RESPONSE PROGRAM Spill response planning is an important aspect of both an emergency management plan and a wellhead protection program. Specific response procedures for WHPAs must be in place prior to the occurrence of a contamination incident. The information obtained as a result of the susceptibility assessment and the wellhead protection area inventory can be used to determine what types of spill response measures are necessary for the protection of drinking water sources. In order to be accepted by local emergency responders, spill response procedures for wellhead protection areas must be realistic and feasible. In order for spill response procedures to be effectively executed, coordination, cooperation, and communication among the responding agencies, organizations, and individuals is imperative. In Washington State, depending on the magnitude and type of the release, any of the following organizations may be involved in a spill response for a wellhead protection area:
• Department of Ecology (Ecology): Ecology’s Spill Response Team is responsible for determining the source and cause of the release and responsible party. If the responsible party is unknown, Ecology will investigate to determine who is responsible and ensure that containment, cleanup, and disposal proceedings begin. Ecology’s 24-Hour Spill Response Team can be contacted at (360) 753-2353.
• Department of Health (DOH): The Department of Health, in conjunction
with organizations such as Ecology’s Spill Operations Section and the Association of Fire Chiefs, is developing a set of standard operating procedures that first responders can use in wellhead protection areas, critical aquifer recharge areas, and other sensitive groundwater areas. If necessary to the cleanup effort, DOH also provides assistance through laboratory support and services.
• Department of Transportation (DOT): The Washington State DOT can
provide spill response assistance through traffic control, equipment, and personnel for non-hazardous cleanup activities on state and interstate highways.

Gray & Osborne Inc., Consulting Engineers
City of Oak Harbor 6-11 2013 Water System Plan Update September 2014
• Washington State Patrol: The state patrol is responsible for managing spills on interstate and state highways.
• Oak Harbor Fire Department: Initial response to a hazardous spill would
most likely come from the fire department that serves the City of Oak Harbor. The Fire Department will be notified of the wellhead protection area boundaries.
The City maintains a current spill/incident response program as part of the operations and maintenance program emergency procedures. More information on this topic is available in Chapter 7 – Operation and Maintenance Program. CONTINGENCY PLANNING Contingency planning is an important component of a wellhead protection program. In the event that any of the City’s sources must be taken offline due to contamination, a contingency plan would provide immediate mitigation. A properly prepared and updated contingency plan helps ensure the water system and local officials are prepared to respond to emergency situations. Contingency planning also includes provision of alternative sources of drinking water. The following steps are necessary for the development of an effective contingency plan:
1. Identify maximum capacities of the existing system as to source, distribution system, and water rights restrictions. Assume loss of source and re-evaluate. The City has three separate groundwater sources in addition to the primary source from Anacortes. In the event that Well 8, 9, or 11 becomes contaminated, the City may rely on source water from Anacortes to provide average and peak demands for a sustained period.
2. Evaluate the expansion options of the existing system’s capacities relative
to existing water rights. Anacortes currently supplies sufficient water to meet the average and peak demands of the City. If all three groundwater sources were to become contaminated, the City may wish to employ cautionary voluntary water conservation measures, especially during warmer summer months. The City has an additional 110 gpm available from Well 9, and approximately 1,000 gpm available from currently inactive groundwater sources. These sources would require redevelopment in order to provide reliable drinking water to the City’s customers.

Gray & Osborne Inc., Consulting Engineers
6-12 City of Oak Harbor September 2014 2013 Water System Plan Update
ACTIONS The City will take the following steps to protect its existing sources from contamination.
1. Notify commercial businesses, hazardous waste generators, homeowners, and septic system owners of their presence within the City’s WHPA.
2. Monitor for nitrates annually.
Contaminants associated with septic tank effluent include pathogenic organisms, toxic substances, and nitrogen compounds. The City will remain aware of non-compliance with MCLs for nitrates as well as trends of increased nitrate levels over time. Increasing nitrate levels could be an indication of source contamination.
3. Utilize management strategies provided by the Island County Coordinated
Water System Plan and the Island County Water Resources Management Plan. These plans were described fully in Chapter 1 – System Description, and outline the results of source water studies, outline factors that affect source water, and highlight methods of protecting and maintaining responsible use of all available water resources.

City of Oak Harbor 7-1 2013 Water System Plan Update September 2014
CHAPTER 7
OPERATION AND MAINTENANCE PROGRAM INTRODUCTION It is extremely important for public water systems to have a program in place that ensures successful operation of the water infrastructure components. To address this need, the City maintains an operations and maintenance program for its water system. This program includes information on staffing, maintenance techniques, job duties, emergency procedures, and other activities that help the utility run efficiently. This chapter reviews the City’s water system management, personnel, operator certification, routine operating procedures, preventative maintenance, record keeping, and water quality sampling procedures. Emergency response and coliform detection procedures are also outlined. WATER SYSTEM MANAGEMENT AND PERSONNEL STAFFING A brief description of the City’s organization is given in Chapter 1 – System Description. The water system organization chart is shown on Figure 7-1, while Table 7-1 summarizes these staff positions and gives a brief description of major duties and the number of water system staff assigned. Current full-time equivalent (FTE) values are based on the amount of time spent on water system activities.
TABLE 7-1
Water System Staffing and Responsibility Summary
Title Water System Responsibilities Current
Staff Name Mayor Budget coordination, water system policy
and planning N/A Scott Dudley
City Administrator Coordination of multiple City utility services, water system planning N/A Larry Cort
Finance Director Supervises Finance Department, organizes planning, coordination, budgeting and utility functions for the City
N/A Doug Merriman
Utilities Manager Maintains accurate billing records and data management, coordinates with multiple utility activities
0.25 FTE
-(1)

Gray & Osborne, Inc., Consulting Engineers
7-2 City of Oak Harbor September 2014 2013 Water System Plan Update
TABLE 7-1 – (continued)
Water System Staffing and Responsibility Summary
Title Water System Responsibilities Current
Staff Name Public Works Director
Supervises PW Dept., organizes planning, coordination, and utility functions for the City
0.25 FTE
Cathy Rosen
Public Works Admin. Assistant
Supports the Director N/A Debbie Mueller
Budget/Purchasing Specialist
Supervises ordering and budgeting of equipment purchases for utility divisions N/A Sandra Place
City Engineer Coordinates engineering division, develops design and construction standards
0.25 FTE
Joe Stowell
Engineering Admin. Assistant
Supports the City Engineer N/A Wendy Hobert
Project Engineer Develops and reviews plans, system projection planning, supports city engineer
0.25 FTE
Arnie Peterschmidt,John Piccone
Civil Engineer Develops and reviews plans, system project planning, supports City Engineer
0.25 FTE
Brad Gluth
Construction Inspector
Provides field observation and adherence to City standards 0.5 FTE Jack Smith
Engineering Technician
Reviews plans, drafts drawings, supports civil engineer
0.25 FTE
Craig Taylor
Utility Operations Manager
Supervises and coordinates City water and streets divisions 1 FTE Rich Tyhuis
Lead Water Specialist
Coordinates with water system staff on operational procedures 1 FTE Tim Shelley
Water Specialist II Performs troubleshooting, maintenance, installation/repair work for water system equipment, performs routine water sampling
3 FTE Kyle Biddle, Chris Price,
Will Jennings Water Specialist I Supports Lead Water Specialist 1 FTE Tim Jupin Water Utility Total 8 FTE -
(1) Currently vacant.

Gray & Osborne, Inc., Consulting Engineers
City of Oak Harbor 7-3 2013 Water System Plan Update September 2014
FIGURE 7-1
Water System Operation and Management Personnel Flow Chart
PUBLIC WORKS DIRECTOR
CITY ADMINISTRATO
MAYOR
CITY ENGINEER
FINANCE
WATER
WATER
LEAD WATER SPECIALIST
ENGINEERING TECHNICIAN
CONSTRUCTION INSPECTOR
CIVIL ENGINEER
UTILITIES PUBLIC WORKS ADMIN. ASST.
BUDGET / PURCHASING SPECIALIST
OPERATIONS MANAGER
ENGINEERING ADMIN. ASST.
PROJECT

Gray & Osborne, Inc., Consulting Engineers
7-4 City of Oak Harbor September 2014 2013 Water System Plan Update
CERTIFICATION REQUIREMENTS Water Works Operator Certification, required under WAC 246-292-060, mandates large Washington State public water systems retain in their employment individuals who are certified, by examination, as competent in water supply operation and management. DOH determines the required level and number of certified positions based on the population and complexity of the water system. The public water system classification provided in WAC 246-292-040 is listed in Table 7-2.
TABLE 7-2
Water System Classification
Classification Population Served Operator Certification Requirement Group 1 251 – 1,501 Level 1 Group 2 1,501 – 15,000 Level 2 Group 3 15,001 – 50,000 Level 3 Group 4 Greater than 50,000 Level 4
The City is classified as a Group 3 system, which corresponds to a specific required level of certification. The various certification levels and their minimum education and experience requirements are summarized in Table 7-3.
TABLE 7-3
Minimum Education and Experience Requirements for Water Works Operator Certifications
Water Works Operator Classification
Certification Level Operator in
Training Level One
Level Two
Level Three
Level Four
Water Distribution Manager (WDM)
Education 12 years 12 years 12 years 14 years 16 years Experience 3 months 1 year 3 years 4 years 4 years
Water Treatment Plant Operator (WTPO)
Education 12 years 12 years 12 years 14 years 16 years Experience 3 months 1 year 3 years 4 years 4 years
Water Distribution Specialist (WDS)
Education 12 years 12 years 12 years NA NA Experience 3 months 1 year 3 years Cross-Connection Control Specialist (CCS)
Education NA 12 years 12 years NA NA Experience 3 months 3 years Backflow Assembly Tester (BAT) NA NA NA NA NA Basic Treatment Operator (BTO) NA NA NA NA NA Because the City does not operate a certified water treatment plant, they are not required to maintain a certified WTPO on staff. Table 7-4 below summarizes the title and certification level of current water system staff members.

Gray & Osborne, Inc., Consulting Engineers
City of Oak Harbor 7-5 2013 Water System Plan Update September 2014
TABLE 7-4
Water System Staffing and Certification Level Summary
Name Title Certifications
Rich Tyhuis Operations Manager WDS, WDM3, CCS Tim Shelley Lead Water Specialist WDS, WDM3, CCS Kyle Biddle Water Specialist II WDS, WDM3, CCS Chris Price Water Specialist II BTO, WDM2, CCS, WTPO2
Will Jennings Water Specialist II BTO, WDM2 Tim Jupin Water Specialist I CCS, WDM IT
PROFESSIONAL GROWTH In order to promote and maintain expertise for the various grades of operator certification, Washington State requires that all certified operators meet professional growth requirements by completing no less than three continuing education units (CEU) within each three year period. Programs sponsored by both Washington Environmental Training Resources Center (WETRC) and the American Water Works Association (AWWA) Pacific Northwest Subsection are the most popular source of CEUs for certified operators in Washington State. The professional growth requirement may also be met by advancement by examination or certification by examination in a different classification. The City’s public works personnel have traditionally been active in operator training programs. All of the certifications listed in Table 7-4 are current with respect to CEU requirements. WATER SYSTEM OPERATION AND CONTROL MAJOR SYSTEM COMPONENTS The locations of the major system components are shown on Figure 1-3. The City maintains a thorough operation and maintenance (O&M) manual, which is updated continually, but a synopsis of equipment operational parameters is given for each component below. The water system is monitored continually by a telemetry system located at the municipal shops facility. The supervisory control and data acquisition (SCADA) system calls water system personnel in the event of water system malfunctions including, but not limited to, pump failure, high or low water pressures, and high or low reservoir levels. System data is collected and stored electronically and all SCADA information is copied to a tape drive every 24 hours.

Gray & Osborne, Inc., Consulting Engineers
7-6 City of Oak Harbor September 2014 2013 Water System Plan Update
Source Operation and Control City of Anacortes The City of Anacortes provides approximately 99.7 percent of the City’s water demand. Water is provided to the City via a 24-inch and 10-inch diameter pressure mains, which are described below. The original source for water delivered by Anacortes is the Skagit River. Water extracted from the Skagit River is transported to the City of Anacortes Water Treatment Plant for purification and chlorination prior to transport to the 24-inch pipeline at Sharpe’s Corner on Fidalgo Island. Anacortes is contractually required to deliver water to the Sharpe’s Corner intersection at a minimum pressure of 120 psi. Water is supplied through 12-inch Panametric meter and a 10-inch Sensus turbo meter that are owned and maintained by the City of Anacortes. Wells 8, 9 and 11 These three City wells draw water from the same aquifer, but they are not designated as a wellfield by DOH. Since the wells serve as an auxiliary supply to the primary supply received from Anacortes, they are only exercised monthly to ensure functionality of the equipment should the primary supply somehow be interrupted or become unavailable. Well pumps are activated manually at each well house, and flows are monitored via magnetic flow meters. The wells are fully described in Chapter 1 – System Description. Chlorine solution is added to water from each of the three wells in order to disinfect the well water and provide a disinfectant residual in the distribution system. A diaphragm injection pump is located at each well and operates concurrently with the well pumps. These injector pumps are adjusted manually to match the desired chemical dosage. Chlorine dosage is calculated manually based on the flow rate from the wells, and a graduated solution tank is used to dispense the calculated dosage of 5.25 percent Chlorox solution. Sampling locations immediately downstream of the chemical injection point, as well as in the distribution system are available to confirm the chemical dosage and residual. Equipment associated with Well 8 and Well 11 also include diaphragm injection pumps and chemical saturators in order to inject fluoride solution into the well water. These injection pumps are adjusted manually based on the desired target concentration (0.7 to 1.0 mg/L), and include meters to determine the daily fluoride usage. Well 9 uses a chemical solution tank and a peristaltic injection pump to inject fluoride into the well water. Fluoride dosage is calculated by weight of the chemical storage tank before and after well operation. Well 9 has very low production, and is scheduled to be abandoned and redrilled in 2014. If production from the new well matches that from Well 8 or Well 11, saturators and chemical meters similar to those at these locations will also be installed at the new Well 9. As with chlorine disinfection, fluoride sampling locations are

Gray & Osborne, Inc., Consulting Engineers
City of Oak Harbor 7-7 2013 Water System Plan Update September 2014
located immediately downstream of the chemical injection point as well as in the distribution system. The City does not maintain backup systems for chemical injection to its well water, but since each well is operated manually, chemical injection malfunctions are addressed at the time of well pump operation. Transmission Line Operation and Control There are two major transmission lines from Anacortes to the City. The first is a 24-inch ductile iron pipe that extends from Sharpe’s Corner to the Ault Field Booster Station. The second is a 10-inch asbestos-cement line that also stretches from Sharpe’s Corner to the Ault Field Booster Station. Both the 10-inch and 24-inch pipelines generally follow Highway 20. The 10-inch water pipe is metered directly north of the Deception Pass State Park Bridge, while the 24-inch main is metered directly south of the Sharpe’s Corner connection point. Both pipelines contain air release and vacuum valves as well as blow-off valves at regular, appropriate locations along the pipe alignment. Under normal operating condition, the 24-inch line continuously supplies water to the Ault Field Booster Station, which in turn supplies the City with water service. The 10-inch line provides water service to Deception Pass State Park, and the North Whidbey Water District upstream, then continues south to the Ault Field Booster Station. The City maintains ownership of the 10-inch pipeline south of the meter at Deception Pass State Park Bridge, as well as the 24-inch pipeline south of the Sharpe’s Corner connection point. Reservoir Operation and Control Each of the City’s four existing reservoirs are described in Chapter 1 – System Description, and in Table 1-3. Additional information regarding individual tank set points which are used to call various pumps within the City water system is provided in the City’s O&M manual. Westside Reservoirs 1 and 2 These reservoirs serve the 307 Zone and receive water directly from the Ault Field Booster Station. The reservoirs are filled through the distribution system by pressure form Anacortes during seasonal low demand periods, and are filled from the Ault Field Booster Station during seasonal high demand periods. Reservoir levels also depend on the Anacortes hydraulic gradeline. Ault Field Booster Pumps are controlled by water levels in the Westside Reservoirs. Table 7-5 summarizes the elevations and associated controls for the Westside Reservoirs 1 and 2. Both Westside reservoirs have shutoff valves that prevent water from either entering or leaving the reservoirs in case of an emergency. These are exercised occasionally to ensure successful operation. For both

Gray & Osborne, Inc., Consulting Engineers
7-8 City of Oak Harbor September 2014 2013 Water System Plan Update
Westside Reservoirs, a key distribution valve is closed during periods of low demand (typically in winter) to encourage draw-down of the reservoir levels and water circulation.
TABLE 7-5
Westside Reservoirs Alarms and Controls
Parameter Setting(1) High-High Water Alarm 55 High Water Alarm 53.5 Low Water Alarm 45 Low-Low Water Alarm 42
(1) Values are measured in feet from the base elevation of 253 feet. Eastside Reservoir The Eastside Reservoir serves the 243 Zone. The reservoir is filled through an altitude valve from the 307 Zone. The altitude valve opens when the reservoir water surface elevation has dropped approximately two feet. The reservoir contains two separate shutoff valves. One controls inflow from the upstream altitude valve, and the second controls inflow and outflow to or from the reservoir itself. These valves are exercised occasionally to ensure successful operation. Under normal operation, the Eastside Reservoir is filled when the water level drops to an elevation of 241 feet. Table 7-6 summarizes the elevations and associated controls for the Eastside Reservoir. As is discussed in Chapter 1 – System Description, the City plans to abandon use of the Eastside Reservoir after construction is completed on the North Reservoir, and the impending North Booster Station and transmission main projects. These two projects will be designed and completed after completion of the North Reservoir and are part of the new pressure zone scheme for the City.
TABLE 7-6
Eastside Reservoir Alarms and Controls
Parameter Setting(1) High-High Water Alarm 50 High Water Alarm 49.8 Low Water Alarm 35 Low-Low Water Alarm 30 Altitude Valve: Open 47(2) Altitude Valve: Close 49 (1) Values are measured in feet from the base elevation of 190 feet. (2) Controlled by the HGL of the 307 Zone.

Gray & Osborne, Inc., Consulting Engineers
City of Oak Harbor 7-9 2013 Water System Plan Update September 2014
North Reservoir This reservoir is currently under construction and is slated for completion in early 2014. The reservoir is a major component in restructuring the water zone designation of the City. The New Reservoir Project Predesign Report (Gray & Osborne, 2009) describes this zone designation in greater detail. Briefly, the proposed restructured zone system will divide the City into five distinct pressure zones instead of the current four pressure zones. These new zones will address water supply and pressure issues as well as allow for greater water system reliability, coverage, and adaptability for future service connections in the western half of the City. The water level in the new reservoir will be controlled by demand within the City. Level is controlled by a pressure transducer and contains level floats for redundancy. Control points are not set at this point in time, and will be finalized once construction of the reservoir is complete and the facility is connected to the water system. Booster Station Operation and Control Ault Field Booster Station The Ault Field Booster Station boosts water from the incoming 24-inch transmission line from Anacortes. The booster station fills both Westside Reservoirs which in turn provide water to the 307 Zone. The station utilizes two 125-horsepower Aurora 6 x 8 x 18 Series 410 variable-speed pumps as well as two 75-horsepower Worthington 5LR-15 constant-speed pumps. Under normal operating conditions, the water level in the Westside Reservoir 2 controls pump operation and variable pump speed is adjusted in response to changing water demand. The constant speed pumps provide redundancy and are not typically used to supply water to the Mainland Zone. Table 7-7 summarizes the control set points at the Ault Field Booster Station.

Gray & Osborne, Inc., Consulting Engineers
7-10 City of Oak Harbor September 2014 2013 Water System Plan Update
TABLE 7-7
Ault Field Booster Station Control Set Points
Parameter Setting High-High Pressure Alarm 170 psi High Pressure Alarm 160 psi Low Pressure Alarm 20 psi Low-Low Pressure Alarm 10 psi High Chlorine Alarm 0.5 mg/L Low Chlorine Alarm 0.2 mg/L High Fluoride Alarm 1.3 mg/L Low Fluoride Alarm 0.7 mg/L Lead VFD Start(1) 48 feet (21 psi) Lead VFD Stop(1) 52 feet (23 psi) Lag VFD Start(1) 46 feet (20 psi) Lag VFD Stop(1) 50 feet (22 psi) (1) Data refer to the Westside Reservoir levels.
Heller Street Booster Station The Heller Street Booster Station serves approximately 245 single-family water connections in the 342 Zone. The station consists of two Weinman 2.5 x 3 x 12B constant-speed pumps that supply domestic water pressure from both Westside Reservoirs to the Heller Booster Zone. Under normal operation, one of the pumps runs continuously to supply water at the appropriate pressure. When demand is high, the second pump is called to supply additional water at the correct pressure. When demand is low, pump impellers are trimmed to maintain a constant system pressure. Fire flows bypass the pump station through a check valve from the 307 Zone and both Westside Reservoirs. Table 7-8 summarizes the control set points at the Heller Street Booster Station.
TABLE 7-8
Heller Street Booster Station Control Set Points
Parameter Setting Lead Pump 60 psi(1) Lag Pump Start 50 psi Lag Pump Stop 57 psi (1) Operates continuously.

Gray & Osborne, Inc., Consulting Engineers
City of Oak Harbor 7-11 2013 Water System Plan Update September 2014
Redwing Booster Station The Redwing Booster Station services approximately 215 single-family and multi-family residential water connections in the 335 Zone. The booster station has three 7.5-horsepower Aurora domestic booster pumps and one 60-horsepower Aurora fire flow pump. There is a 2,200 gallon hydropneumatic pressure tank in the building that feeds the 335 Zone through a pressure reducing valve set at 68 psi. The Redwing Booster Station receives water from the 307 Zone, which is served by both Westside Reservoirs. Pump cycles and hydropneumatic pressure tank volumes are controlled by the demand within the area served by the booster station. Table 7-9 summarizes the control set points at the Redwing Booster Station.
TABLE 7-9
Redwing Booster Station Control Set Points
Parameter Setting High Suction Alarm 60 psi Low Suction Alarm 20 psi High System Pressure Alarm 70 psi Low System Pressure Alarm 55 psi High Tank Pressure Alarm 100 psi Low Tank Pressure Alarm 75 psi Lead Pump Start 39 psi Lead Pump Stop 48 psi Lag 1 Pump Start 36 psi Lag 1 Pump Stop 45 psi Lag 2 Pump Start 33 psi Lag 2 Pump Stop 42 psi Fire Flow Pump Start 50 psi(1)
(1) Discharge pressure reading. Distribution System Operation and Control The City’s distribution system is summarized in Table 1-6. The pipes are inspected as part of the City’s preventive maintenance program. Isolation valves are located throughout the distribution system and their locations are shown on the water system maps kept in the City Public Works Office and on Figure 1-3. Pressure Reducing Valve Operation and Control There are seven pressure reducing valve (PRV) stations in the system. All seven stations reduce the water pressure as it moves from the 307 Zone to the 243 Zone. Locations and

Gray & Osborne, Inc., Consulting Engineers
7-12 City of Oak Harbor September 2014 2013 Water System Plan Update
set points for the PRVs are summarized in Table 1-5. There are also three 3/4-inch PRVs which act to circulate water from three dead end mains between the 307 Zone and the 243 Zone. Altitude Valve Operation and Control A single altitude valve is located between the 307 Zone and the Eastside Reservoir. When the water elevation in the Eastside reservoir drops to an elevation of 241.4 feet, the altitude valve engages and water from the 307 Zone fills the Eastside Reservoir. SAFETY PROGRAM An important consideration of any successful operation and maintenance program is the safety of the employees. The City’s safety program is in compliance with the Occupational Safety and Health Administration (OSHA) and the Washington State Department of Labor and Industries (L&I). The safety program addresses the situations that employees may encounter during the performance of O&M tasks. The City’s primary safety document is its Accident Prevention Manual. Each utility division maintains a hard copy of the manual as well as other supporting documents such as material safety data sheets (MSDS) sheets and chemical safety bulletins. The Accident Prevention Manual is updated continually by the City safety committee as a result of monthly safety committee meetings. A Safety Management Committee, made up of representative employees from each operating department, assists in the development of safety programs, coordination of interdepartmental safety practices, and maintenance of a loss control and safety program. All water system staff receives regular training in basic first aid and CPR, confined space entry, forklift operation, and traffic flagging, among other topics. RECORDKEEPING MAINTENANCE The City has a work order form which is used to document maintenance and repair work which must be approved by the water superintendent prior to beginning work. This allows the water department to track maintenance work and adjust budgets accordingly. The operations manager evaluates and maintains all records associated with the operation and maintenance of the water system. The operations manager keeps records of all scheduled and unscheduled maintenance tasks for the water system, which are stored electronically. These files and records are backed up on a daily basis. Hard copies and electronic copies of completed files are filed and stored by category and date. The City maintains historical records for at least 7 years and only authorized City staff and

Gray & Osborne, Inc., Consulting Engineers
City of Oak Harbor 7-13 2013 Water System Plan Update September 2014
administrators have access to the records. Records involved with consumer consumption and billing are retained by the City’s finance department. The engineering staff is responsible for maintaining a current inventory of the water system infrastructure. One of the engineering department’s tasks is to maintain a current map of the City showing the location of all mains, valves and hydrants. Construction drawings of new developments, system improvements, and system expansions showing the location of all utilities are also maintained. Specific data that are collected and maintained as well as the frequency with which they are collected are summarized in Table 7-10.
TABLE 7-10
Required Data Acquisition and Recordkeeping Frequency
Parameter Reading/Recording Frequency Service Meters Monthly Transmission Meters Monthly (24-inch), Monthly (10-inch) Well Meters Daily NASWI Meters Daily Fluoride Dosage Daily Fluoride Chemical Level Daily Chorine Residual Daily Water Quality Monthly and as required pH Daily Temperature Daily Other Repairs/Maintenance As required
CUSTOMER COMPLAINTS Complaints are logged on a complaint form by the maintenance department staff. Hard copies of each complaint are tracked, investigated, and resolved in the order they are received and with consideration of priority and or risks to system safety and reliability. Resolved complaint forms are scanned and electronically stored in a publicly accessible computer drive. After hours issues are routed through the Island County Emergency Communication Center (I-COM) to the appropriate utility personnel. The City typically receives less than one complaint per month on average. Some of the most common water system customer complaints and the most typical responses or solutions are listed below.
• High Water Bill Meter reading is cross-checked with billing information. Consumption

Gray & Osborne, Inc., Consulting Engineers
7-14 City of Oak Harbor September 2014 2013 Water System Plan Update
history at that address is analyzed. If applicable, conservation materials and information is provided.
• High/Low Water Pressure
Water pressure at the service line is tested. If high, customer is encouraged to install a PRV upstream of the service meter. If low, SCADA and water system data is analyzed to try to isolate systemic causes for low pressure at the specific location.
• Air in Line
Lines are flushed to remove the air.
EXISTING WATER SYSTEM EQUIPMENT Table 7-11 lists the equipment used to regularly maintain the water system.
TABLE 7-11
Water System Operation and Maintenance Equipment
Description Equipment Number Model Year International Service Truck 4015 2000 Ford Ranger Pickup 4017 2008 Ford F350 Pickup 4019 1999 Ford Ranger Pickup 4003 2003 Ford F250 Pickup 4049 2005 Chevy S-15 Utility Vehicle 4048 2005 Vactor Truck 4081 1990 Dodge Pickup 4087 1999
PREVENTIVE MAINTENANCE SCHEDULE Preventive maintenance actions are performed by water system operations staff in order to maintain functionality of the equipment, provide a high level of customer service, and decrease overall repair and maintenance costs. For this, the staff has developed a routine maintenance schedule. A summary of this schedule is listed in Table 7-12.

Gray & Osborne, Inc., Consulting Engineers
City of Oak Harbor 7-15 2013 Water System Plan Update September 2014
TABLE 7-12
Water System Routine Maintenance Schedule
Equipment Description Activity Frequency
Reservoirs
All Inspect general operation Daily All Interior and exterior cleaning Every 5 years All Exterior painting Every 15 years All Interior painting Every 15 years
Booster Stations Ault Field Inspect general operation Daily Redwing Inspect general operation Daily
Heller Street Inspect general operation Daily
Wells 8 Inspect general operation Monthly 9 Inspect general operation Monthly 11 Inspect general operation Monthly
Transmission Mains
24-inch Inspect general operation and condition
Annually, or as needed
10-inch Inspect general operation and condition
Annually, or as needed
Transmission Main Valves All Inspect general operation, exercise Annually,
or as needed Distribution System Valves All Inspect general operation, exercise Biennially
Hydrants All Inspect and test Annually, or as needed
Chemical Equipment Inspect general operation Daily
EMERGENCY RESPONSE PROGRAM The operation of the water system under emergency conditions is an important responsibility of City public works personnel. Emergency response procedures are rehearsed and reviewed by personnel. The City has developed an Emergency Response Manual to provide Public Works personnel responding to an emergency situation with enough information to assess the situation, make decisions, and take action to control the situation. A copy of the Emergency Response Manual is provided in Appendix S. If an emergency occurs, the 24-hour Duty Utility Person can be reached by telephone. Island County Emergency Services Communication Center (I-COM) has a duty roster showing who is on call at any given time, and can notify the 24-hour Duty Utility Person if a call is made to 911.

Gray & Osborne, Inc., Consulting Engineers
7-16 City of Oak Harbor September 2014 2013 Water System Plan Update
Once aware of an emergency, the 24-hour Duty Utility person evaluates the situation and takes corrective action if applicable. If additional assistance is needed, the following personnel are contacted, in order:
• Utility Operations Manager • Public Works Superintendent • City Administrator
The next section lists the phone numbers of personnel who could be contacted in the event of an emergency. EMERGENCY PHONE CONTACTS An updated emergency phone list is shown in Table 7-13. This list will be kept on file and visible at city hall, the public works building, and the fire and police departments for use in the event of an emergency. It is also present in the Emergency Response Program document kept by water system personnel.
TABLE 7-13
Emergency Phone Contact List
Title/Entity Name Phone Number Emergency Services Fire/Police/Medical — 911 Oak Harbor Fire Department — 360-279-4700 Oak Harbor Police Department — 360-279-4600 Whidbey General Hospital — 360-678-5151 Water System Personnel Utility Operations Manager Rich Tyhuis 360-914-7251 Lead Water Specialist Tim Shelley 360-914-7233 Water Specialist II Kyle Biddle 360-914-7978 Water Specialist II Chris Price 360-914-7262 Water Specialist II Will Jennings 360-914-7999 Water Specialist I Tim Jupin 360-914-7240 Utility Services 24-hour Mobile Phone — 360-914-7246 City Administrative Personnel Mayor Scott Dudley 360-279-4503 City Administrator Larry Cort 360-279-4501 Engineers Office Joe Stowell 360-720-8796 Public Works Superintendent Cathy Rosen 360-914-7266

Gray & Osborne, Inc., Consulting Engineers
City of Oak Harbor 7-17 2013 Water System Plan Update September 2014
TABLE 7-13 – (continued)
Emergency Phone Contact List
Title/Entity Name Phone Number Service Providers
Cascade Natural Gas Ted McCammant 360-675-6641 360-708-4689
Puget Power and Light (after hours) — 888-225-5773 NASWI - Utility pager — 360-720-6953 NASWI - Trouble desk — 360-257-3358 Controls, Flow meters, Recorders TSI 425-678-4770
SCADA Tim Hecox 425-678-4152 TSI 425-678-4770
Electrical Wayne McAninch, A Electrical 360-675-2203 General Contracting QDEC 360-675-8888
Pipe/Fitting Suppliers HD Fowler Inc. 360-734-8400 C. Johnson Construction 360-675-4848
Testing Laboratory Edge Analytical 360-757-1400 Engineering, Gray & Osborne Russell Porter, P.E. 206-284-0860
Utility Location - Statewide 1-Call — 800-424-5555 811
State Authorities WA Department of Health — 877-481-4901 Drinking water emergency WA Department of Health, NWRO Jennifer Kropack 253-395-6750 WA Department of Ecology, — 360-407-6300 Spill Response Island County Public Health Office — 360-679-7350 Island County Public Works Office — 360-679-7331 News Entities KWDB Radio, Oak Harbor — 360-675-7320 KOMO TV, Seattle — 206-404-4000 KING TV, Seattle — 448-352-1206 KIRO TV, Seattle — 800-777-5476 Whidbey News Times — 360-675-6611 PUBLIC NOTIFICATION There may be instances in which the general public must be informed of a water system related emergency. The primary method to notify the public of a drinking water emergency would be through radio and the local cable channel, Channel 10. Additional notification procedures are as follows:

Gray & Osborne, Inc., Consulting Engineers
7-18 City of Oak Harbor September 2014 2013 Water System Plan Update
• Newspaper notice to water system users within 14 days of violation
• Direct mail notice or hand delivery to all consumers served by the system within 45 days of the violation. The DOH may waive the City’s mail or hand delivery if the violation is corrected within 45 days. The waiver shall be in writing and made within the 45-day period
• Notice to radio and television stations serving the area within 24 hours of
violation of an acute coliform MCL, a nitrate MCL, occurrence of a waterborne disease outbreak or other acute violations.
• Repeat mail or hand delivery every 3 months until the violation is
corrected. Where notification to system users is required the notification shall conform to WAC 246-290-71002 and shall include the following:
• A clear, concise and simple explanation of the violation;
• A discussion of potential adverse health effects and any segments of the population that may be at higher risk;
• Potential health effects information;
• A list of steps the City has taken or is planning to take to remedy the
situation;
• A list of steps the consumer should take, including advice on seeking an alternative water supply if necessary; and
• Water department contact name and telephone number.
Additional specific procedures for bacteriological and IOC/VOC/SOC detections are outlined below. BACTERIOLOGICAL PRESENCE DETECTION PROCEDURE Notification procedures for notifying system customers, the local health department, and DOH of water quality emergencies are an important component of an emergency response program. Many public water systems will occasionally detect positive coliform samples, mainly as a result of minor contamination in distribution mains or sample taps, or improper bacteriological sampling procedures. However, the persistent detection of coliforms in the water supply, particularly E. coli or fecal bacteria, may require issuing a public boil water notice to ensure the health and safety of the water customers. Emergencies such as floods, earthquakes, and other disasters can affect water quality as a

Gray & Osborne, Inc., Consulting Engineers
City of Oak Harbor 7-19 2013 Water System Plan Update September 2014
result of damage to water system facilities, thereby warranting a boil water order in advance of testing and confirmation of contamination. WAC 246-290-320 requires water utilities to follow specific procedures in the event coliform bacteria are detected in the water system. These procedures are outlined in Table 7-14.
TABLE 7-14
Bacteriological Presence Detection Procedures
Routine #1 Routine #2 Repeat
#1 Repeat
#2 Repeat
#3 Violation Required Action(2) Coliform
detected, No E.coli/Fecal
None detected None detected No
Violation No Required Notification
Coliform detected, No E.coli/Fecal
Coliform detected, No E.coli/Fecal
None detected Non Acute
Public Notification as soon as practical (required by 30
days)(3)
Coliform detected, No E.coli/Fecal
None detected
Coliform detected - No E.coli/Fecal in 1, 2, or 3
of the samples
Non Acute
Public Notification as soon as practical (required by 30
days), Certification form within 10 days(3)
Coliform detected,
E.coli/Fecal detected(1)
None detected
Coliform detected - No E.coli/Fecal in 1, 2, or 3
of the samples Acute
Public Notification Within 24 Hours, Boil Water
Advisory, Certification form within 10 days(3)
Coliform detected, No E.coli/Fecal
None detected
Coliform detected - E.coli/Fecal detected in
1, 2, or 3 of the samples(1)
Acute
Public Notification Within 24 Hours, Boil Water
Advisory, Certification form within 10 days(3)
Coliform detected,
E.coli/Fecal detected(1)
None detected None detected No
Violation
No Required Notification, Contact DOH after
Routine Results
Coliform detected,
E.coli/Fecal detected(1)
Coliform detected,
E.coli/Fecal detected(1)
None detected Non Acute
Public Notification as soon as practical (required by 30 days), Recommended Boil
Water Advisory(3) (1) Contact DOH immediately after receiving a sample testing positive for Fecal or E. coli Presence. (2) The required action following detection of ANY type of coliform is to increase monitoring the
following month to five routine samples. (3) Notification forms are available from DOH. IOC/VOC/SOC DETECTION PROCEDURES A procedure to comply with DOH requirements in the event of an inorganic chemical/physical property, volatile organic chemical or synthetic organic chemical detection is presented on Figure 7-2.

Gray & Osborne, Inc., Consulting Engineers
7-20 City of Oak Harbor September 2014 2013 Water System Plan Update
Although nitrate and nitrite are classified as inorganic constituents, they are subject to a unique process of action should a violation of the nitrate or nitrite MCL occur. If the nitrate or nitrite MCL (10.0 mg/L) is exceeded, a confirmation sample is required as soon as possible. Compliance actions will then be based on the average of the routine and confirmation samples. Quarterly monitoring would be required if the average result is greater than 5.0 mg/L. In any event, DOH should be notified of the violation, and can provide guidance on subsequent steps. UNREGULATED CONTAMINANT DETECTION PROCEDURES No formal detection procedure exists at this time. Contaminants are not currently regulated, and no formal public announcement or other notification would be required should any of the 21 unregulated contaminants be detected in the City’s groundwater sources. Data must be reported to the EPA, and should a serious issue arise with contamination, the City should work with the EPA and State Health officials to develop an appropriate plan of action. In the event that unregulated contaminants are found in the City’s drinking water supplies, these results should be included in the next published consumer confidence report. EMERGENCY ACTION PLAN The following is a brief overview of the City’s water emergency response plan detailing how the water system should be operated under a variety of emergency situations. Resolution 2001-08 passed by the city council provides for water shortage response to drought conditions or emergency water shortages. The general goals of the water system emergency operation are as follows:
• Maintain as much potable water in storage as possible
• Restore water service to critical facilities such as medical care facilities, emergency services and residences
• Provide assistance and support to adjacent service areas
In general, these goals will be achieved by the following:
• Protect water supply from contamination
• Treat contaminated water by chlorination

* Nitrate and Nitrite represent acute contaminants and have a
separate violation process. See WSP text.
IOC / VOC / SOC
MCL Exceedance*
Primary MCL
Violation
Collect
Confirmation
Sample(s)
Increase
Monitoring to
Quarterly
Report Violation to DOH
within 48 Hours*
WAC 246-290-320,-480
DOH Determines Violation
Does Not Pose Acute
Health Effect(s)
DOH Determines Violation
Poses Acute Health
Effect(s)*
Purveyor Provides Notice
of Violation to Local Radio
and TV Stations within
24 Hours of the Violation
(Tier 1 Public Notice)
Purveyor Provides
Newspaper Notice to All
Water Customers within
30 Days of the Violation
(Tier 2 Public Notice)
If Exceedance >
4 times MCL
(Other than
Nitrate/Nitrite)
If Running
Annual Average
> MCL
If Running
Annual Average
< MCL
If Exceedance <
4 times MCL
(Other than
Nitrate/Nitrite)
No MCL
Violation
Continue Monitoring
as instructed by DOH
Secondary MCL
Violation
Notify DOH and
Take Action as
Directed
DOH: Washington State Department of Health
WAC: Washington Administrative Code
Take Action as
Directed by DOH
Take Action as
Directed by DOH
CITY OF OAK HARBOR 2013 WATER SYSTEM PLAN UPDATE
FIGURE 7-2
IOC/VOC/SOC DETECTION PROCEDURE

Gray & Osborne, Inc., Consulting Engineers
City of Oak Harbor 7-21 2013 Water System Plan Update September 2014
• Restore to operation damaged distribution, transmission and storage facilities
• Locate alternate sources of supply
The City’s Emergency Response Manual provides guidelines for the general assessment of an emergency situation. The first order of business is to assess whether or not an Emergency Operations Center (EOC) should be established. An EOC is most likely not necessary under the following conditions.
• A single event has occurred • A small number of similar events have occurred • The event has already peaked or ended
Establishing an EOC should be considered under the following conditions.
• Multiple events have occurred • Several system outages • Severity or length of event is increasing • Communications are down or failing • Event is regional
Once a general assessment of the situation has been completed, the Manual outlines procedures for emergency situations such as distribution line breaks and low water levels in reservoirs. VULNERABILITY ANALYSIS It is important to estimate the degree in which system facilities may be vulnerable to various types of emergency situations in order to identify system weaknesses. The following sections provide information regarding which facilities would be vulnerable to various types of emergency situations and recommended actions that Public Works personnel could take to mitigate the problem. POWER FAILURE Various types of weather can cause loss of power. Table 7-15 presents the potential effects of a power failure on the water system components.

Gray & Osborne, Inc., Consulting Engineers
7-22 City of Oak Harbor September 2014 2013 Water System Plan Update
TABLE 7-15
Emergency Response Procedures for Power Failure
Water System Component Potential Effect Response
Transmission Mains
Electrically operated valves would be inoperable. (However, the City maintains no electronically operated valves.)
• Contact power supplier. • Restore power as quickly as
possible. • If no electrically operated
valves, no action required. • If electric valves exist, operate
manually if required. • Mobilize auxiliary generator.
Booster Stations Pumps would be inoperable.
• Contact power supplier. • Restore power as quickly as
possible. • Confirm auxiliary generator
operation. • Mobilize auxiliary generator if
necessary. Reservoirs Telemetry may be
inoperable. • Check reservoir levels
manually and continue to monitor.
Wells Well pumps would be inoperable. Disinfection equipment inoperable.
• Contact power supplier. • Restore power as quickly as
possible. • Confirm auxiliary generator
operation. • Mobilize auxiliary generator if
necessary. Distribution System
No effect. • Contact power supplier. • Restore power as quickly as
possible. EARTHQUAKE A severe earthquake may have a substantial impact on the City’s water system. An earthquake could cause damage to the distribution system and water system facilities. In addition, communication and transportation systems may be interrupted. The Puget Sound is a seismically active region and the Strawberry Point and Utsalady faults could impact the City’s water system components. The City should review and evaluate its earthquake response procedures annually. Table 7-16 presents potential effects of a severe earthquake on water system components.
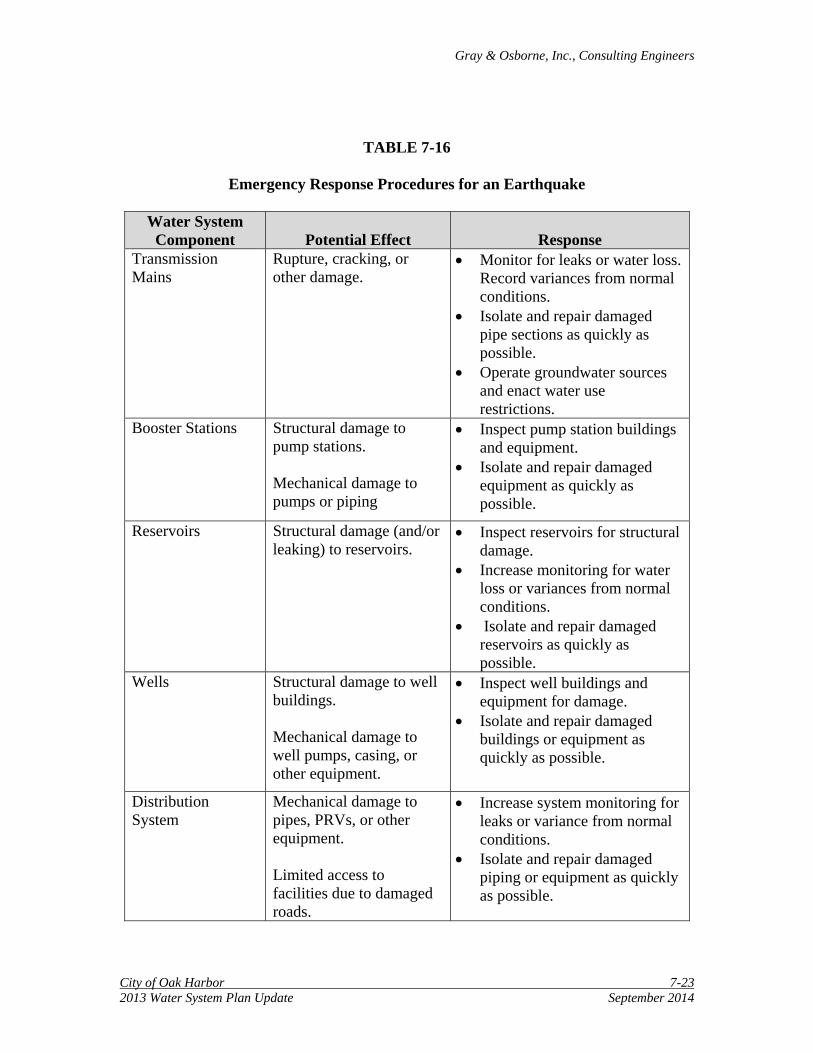
Gray & Osborne, Inc., Consulting Engineers
City of Oak Harbor 7-23 2013 Water System Plan Update September 2014
TABLE 7-16
Emergency Response Procedures for an Earthquake
Water System
Component Potential Effect Response Transmission Mains
Rupture, cracking, or other damage.
• Monitor for leaks or water loss. Record variances from normal conditions.
• Isolate and repair damaged pipe sections as quickly as possible.
• Operate groundwater sources and enact water use restrictions.
Booster Stations Structural damage to pump stations. Mechanical damage to pumps or piping
• Inspect pump station buildings and equipment.
• Isolate and repair damaged equipment as quickly as possible.
Reservoirs Structural damage (and/or leaking) to reservoirs.
• Inspect reservoirs for structural damage.
• Increase monitoring for water loss or variances from normal conditions.
• Isolate and repair damaged reservoirs as quickly as possible.
Wells Structural damage to well buildings. Mechanical damage to well pumps, casing, or other equipment.
• Inspect well buildings and equipment for damage.
• Isolate and repair damaged buildings or equipment as quickly as possible.
Distribution System
Mechanical damage to pipes, PRVs, or other equipment. Limited access to facilities due to damaged roads.
• Increase system monitoring for leaks or variance from normal conditions.
• Isolate and repair damaged piping or equipment as quickly as possible.

Gray & Osborne, Inc., Consulting Engineers
7-24 City of Oak Harbor September 2014 2013 Water System Plan Update
SEVERE SNOWSTORM A severe snowstorm will limit motor vehicle transportation, including the transportation of Public Works personnel. Table 7-17 provides the emergency response procedures for a severe snowstorm.
TABLE 7-17
Emergency Response Procedures for a Severe Snowstorm
Water System Component Potential Effect Response
Transmission Mains
Limited access to facilities.
• Clear access to facilities at earliest opportunity.
Booster Stations Limited access to facilities.
• Clear access to facilities as quickly as possible.
• Inspect facilities for structural or mechanical damage.
• Isolate and repair damaged equipment as quickly as possible.
Reservoirs Limited access to facilities. Structural damage to roof structures due to ice and snow buildup.
• Clear access to facilities as quickly as possible.
• Inspect reservoirs for structural damage.
• Increase monitoring for water loss or variances from normal conditions.
• Isolate and repair damaged reservoirs as quickly as possible.
Wells Limited access to facilities. Structural damage to roof structures due to ice and snow buildup.
• Clear access to facilities as quickly as possible.
• Inspect facilities for structural or mechanical damage.
• Increase monitoring for water loss or variances from normal conditions.
• Isolate and repair damaged reservoirs as quickly as possible.

Gray & Osborne, Inc., Consulting Engineers
City of Oak Harbor 7-25 2013 Water System Plan Update September 2014
TABLE 7-17 – (continued)
Emergency Response Procedures for a Severe Snowstorm
Water System Component Potential Effect Response
Distribution System
Limited access to facilities. Freezing of pipes and/or valves or other controls.
• Prepare vehicles with necessary snow equipment (sand, shovels, chains, etc.).
• Prepare and distribute listing of current valve locations in maintenance vehicles.
• Monitor pipes and equipment in exposed areas or areas of low water use.
• Contact WSDOT personnel to expedite clearing of important access points.
PRV Vaults Vault lid freezing • Keep ice-breaking materials in maintenance vehicles.
• Inspect and de-ice vault lids as required.
FLOODING Although relatively protected by Oak Harbor, its proximity to Puget Sound makes the potential for flooding by waves a possibility. Because of its location within the Puget Sound/Olympic Peninsula rain shadow, flooding from high rains is unlikely, however, localized flooding from rainfall and stormwater collection may occur. Table 7-18 presents the emergency response procedures for flooding.
TABLE 7-18
Emergency Response Procedures for Flooding
Water System Component Potential Effect Response
Transmission Mains
Limited access to facilities.
• Develop access plan for transmission main route from Sharpe’s corner.
Booster Stations Limited access to facilities.
• Develop alternate access routes.
Reservoirs Limited access to facilities.
• Develop alternate access routes.

Gray & Osborne, Inc., Consulting Engineers
7-26 City of Oak Harbor September 2014 2013 Water System Plan Update
TABLE 7-18 – (continued)
Emergency Response Procedures for Flooding
Water System Component Potential Effect Response
Wells Limited access to facilities.
• Develop alternate access routes. • Implement water diversion
tactics if necessary. Distribution System
Limited access to facilities.
• Develop alternate access routes to high-profile locations.
• Increase bacteriological testing frequency to ensure water safety.
PRV Vaults Limited access to facilities. Vault flooding. Vault sump pump overloading.
• Remove debris from sump. • Install additional temporary
sump pump. • Use sandbags to block inflow.
FIRE An extensive fire may result in low distribution system pressures and drawing down of City reservoirs. Table 7-19 presents the emergency response procedures for a fire.
TABLE 7-19
Emergency Response Procedures for Fire
Water System Component Potential Effect Response
Transmission Mains
Limited access to facilities.
• Develop alternate access routes.
Booster Stations Structural damage to pump stations. Mechanical damage to pumps or piping. Limited access to facilities. Additional water demand may be required to combat fires
• Develop alternate access routes. • Inspect building and equipment
for damage. • Isolate and repair damaged
equipment as quickly as possible.
• Initiate alternatives to provide additional water pressure / flow.

Gray & Osborne, Inc., Consulting Engineers
City of Oak Harbor 7-27 2013 Water System Plan Update September 2014
TABLE 7-19 – (continued)
Emergency Response Procedures for Fire
Water System Component Potential Effect Response
Reservoirs Structural damage to reservoirs. Mechanical damage to valves or piping. Limited access to facilities. Additional water demand may be required to combat fires
• Develop alternate access routes. • Inspect building and equipment
for damage. • Isolate and repair damaged
equipment as quickly as possible.
• Initiate alternatives to provide additional water pressure / flow.
Wells Structural damage to well facilities. Mechanical damage to pumps or piping. Limited access to facilities. Additional water demand may be required to combat fires
• Develop alternate access routes. • Inspect building and equipment
for damage. • Isolate and repair damaged
equipment as quickly as possible.
• Initiate alternatives to provide additional water pressure / flow.
Distribution System
Limited access to facilities. Low system pressure.
• Develop alternate access routes. • Inspect high profile locations for
damage. • Isolate and repair damaged
equipment as quickly as possible.
• Monitor available system pressures and flows.
• Consider enacting water use restrictions.

Gray & Osborne, Inc., Consulting Engineers
7-28 City of Oak Harbor September 2014 2013 Water System Plan Update
VANDALISM/BIOTERRORISM/TERRORISM Many potential terrorist attacks would resemble other emergencies in effect. Such attacks may cause infrastructure damage like an earthquake or fire, or may contaminate the water as would happen in an accidental spill or main break. Private and government agencies are working to help prevent and respond to terrorist attacks. The agencies that will be useful to the City for updated information and strategies include:
• Environmental Protection Agency • Center for Disease Control and Prevention • Department of Defense • Federal Emergency Management Agency • American Water Works Association • Association of Metropolitan Water Agencies
The City has many security measures in place; all the reservoirs are covered and the wells and booster stations are housed in locked structures. Operators, maintenance staff, or the general public should report any suspicious persons or findings to the local police department. CONTAMINATION OF WATER SUPPLY Contamination of the water supply may occur due to main breaks, pollution from an isolated source, or from a deliberate act of vandalism or terrorism. Table 7-20 presents the emergency response procedures for contamination of the water supply.

Gray & Osborne, Inc., Consulting Engineers
City of Oak Harbor 7-29 2013 Water System Plan Update September 2014
TABLE 7-20
Emergency Response Procedures for Contamination of the Water Supply
Water System Component Potential Effect Response
Transmission Mains
Contamination of pump stations, reservoirs, and/or distribution system. Human health hazard.
• Notify the City of Anacortes. • Notify DOH if necessary. • Notify DOE if necessary. • Isolate water system
components from source of contamination.
• Increase groundwater production.
• Clean up source of contamination.
• Decontaminate water facilities. Initiate water quality compliance and safety testing.
Booster Stations Contamination of pump stations, reservoirs, and/or distribution system. Human health hazard.
• Notify DOH if necessary. • Notify DOE if necessary. • Isolate water system
components from source of contamination.
• Increase groundwater production.
• Clean up source of contamination.
• Decontaminate water facilities. • Initiate water quality compliance
and safety testing.

Gray & Osborne, Inc., Consulting Engineers
7-30 City of Oak Harbor September 2014 2013 Water System Plan Update
TABLE 7-20 – (continued)
Emergency Response Procedures for Contamination of the Water Supply
Water System Component Potential Effect Response
Reservoirs Contamination of reservoirs and/or distribution system. Human health hazard.
• Notify DOH if necessary. • Notify DOE if necessary • Isolate water system components
from source of contamination. • Clean up source of
contamination. • Decontaminate water facilities in
accordance with AWWA standards (consider draining, cleaning, and disinfecting reservoir if water is deemed unsuitable for consumption).
• Initiate water quality compliance and safety testing.
Wells Contamination of wells and/or distribution system. Human health hazard.
• Notify DOH if necessary. • Notify DOE if necessary. • Isolate water system components
from source of contamination. • Clean up source of
contamination. • Decontaminate water facilities
(flush thoroughly). • Initiate water quality compliance
and safety testing. Distribution System
Contamination of distribution system. Human health hazard.
• Notify DOH if necessary. • Notify DOE if necessary. • Isolate water system components
from source of contamination. • Notify affected water system
customers. • Clean up source of
contamination. • Decontaminate affected areas
(flush thoroughly). • Initiate water quality compliance
and safety testing.

Gray & Osborne, Inc., Consulting Engineers
City of Oak Harbor 7-31 2013 Water System Plan Update September 2014
CHEMICAL SPILL Chemical spills of toxic or hazardous chemicals may result from accidents, traffic accidents, industrial processes, or other commercial activities and have the potential to negatively affect the City’s ground water sources. Emergency procedures for chemical spills are identical to those listed in Table 7-20 for contamination of the water system components. The City has had only two significant chemical spills within the last 5 years. Both spills were less than 200 gallons. The first spill was diesel fuel from a vehicle parked at a local business. The fuel was contained in a storm drain detention system and cleaned without further downstream contamination. The second spill was mineral oil from an electrical transformer. The oil traveled through the stormwater detention system and contaminated downstream soils and surface water. Cleanup of this oil is nearly complete. CONTINGENCY OPERATIONAL PLAN A contingency operational plan is necessary for operation of the system when normal operating procedures are not appropriate. The following sections provide information regarding alternate modes of operation of the system facilities. SOURCE OF SUPPLY Although the City has several sources of water supply, over 99 percent of water used by the City comes from water supplied by the City of Anacortes. Booster stations, altitude valves, and PRVs allow water from all sources to be used throughout the water system. In the event of a significant interruption or reduction in water supply from the City of Anacortes, the City is prepared to implement the following water conservation measures, if necessary:
• Limit outdoor water use for lawn sprinkling to alternating days
• Eliminate outdoor water use
• Restrict all water use by imposing mandatory water use reduction with a maximum water use per equivalent residential unit
• Restrict water use by commercial/industrial water customers • Activate City wells
The City will notify the local radio stations and television entities, will notify customers door to door, and will mail a postcard notice of water use restrictions to each water user.

Gray & Osborne, Inc., Consulting Engineers
7-32 City of Oak Harbor September 2014 2013 Water System Plan Update
STORAGE FACILITIES Westside Reservoirs 1 and 2 serve the Mainland Zone, which can provide water to the City’s entire water system if necessary. Water from the City of Anacortes is, however, directly routed to the Mainland Zone and could continue to serve the City’s customers if either of the Westside Reservoirs should become unavailable. If the Eastside Reservoir should become unavailable, the Downtown Zone is served by the Mainland Zone through any of the five PRVs located within the distribution system. System redundancy and flexibility will increase when the proposed North Reservoir is constructed in early 2014. Should this proposed reservoir be unavailable, the remaining pressure zones can be served directly from the incoming supply from the City of Anacortes through the installed PRVs. BOOSTER STATIONS Ault Field Booster Station The Ault Field Booster Station serves the Mainland Zone and responds to water levels within the Westside Reservoirs. Should this booster station become unavailable, the Westside Reservoirs would fill via the supplied source pressure from the City of Anacortes during periods of low demand. During periods of high demand, standby storage and equalizing storage would be required to serve the City’s water customers. This booster station contains two constant-speed and two variable-speed pumps for redundancy. Redwing Booster Station The Redwing Booster Station is the only station serving the small service area on the north end of the City. The Redwing Booster Station does contain two pumps for redundancy, but if both pumps were unavailable, customers within the Redwing service area would experience low domestic water pressures, and lower than required fire flows until the pumps were returned to service. These customers are served by water within the Westside Reservoirs, so would not be completely without water service. Heller Street Booster Station The Heller Street Booster Station is the only station serving the small service area on the west end of the City. The Heller Street Booster Station contains two pumps for redundancy, but if both pumps were unavailable, customers within the Heller Street service area would experience low water pressures until the pumps were returned to service. These customers would be served by water within the Westside Reservoirs, so would not be completely without water service.

Gray & Osborne, Inc., Consulting Engineers
City of Oak Harbor 7-33 2013 Water System Plan Update September 2014
TRANSMISSION MAINS In the event of transmission main failure along Highway 20, the series of actions below should maintain appropriate capacity for the City until a determination can be made on how to proceed. Loss of 10-inch Transmission Main Possible Causes A break in line, temporary shut down for construction or maintenance, loss of supply from the City of Anacortes, vandalism or other accidental disruption are all possible causes for the loss of the 10-inch transmission main. Results The 24-inch transmission line has adequate capacity to provide water to the City’s water service customers as well as the City’s wholesale customers. Response Action Immediately notify the City of Anacortes, open interties as needed, repair disruption in the pipeline, disinfect and/or flush as appropriate, and coordinate with Anacortes to restore supply. Provide additional water supply using three available groundwater sources. A public notification or news briefing may also be in order. Water use restrictions may be necessary if the problem is not able to be resolved quickly.
Loss of 24-inch Transmission Main Possible Causes A break in line, temporary shut down for construction or maintenance, loss of supply from the Anacortes, vandalism or other accidental disruption are all possible causes for the loss of the 24-inch transmission main. Results The 10-inch transmission line from Anacortes has a capacity of approximately 1 mgd. Wells 8, 9, and 11 have an additional production of approximately 0.62 mgd. With mandatory water conservation measures in place, the City’s wells and the 10-inch transmission line have adequate capacity to temporarily serve the City’s water system and wholesale customers for a short duration of time.

Gray & Osborne, Inc., Consulting Engineers
7-34 City of Oak Harbor September 2014 2013 Water System Plan Update
Response Action Upon noticing a disruption in the 24-inch transmission main, the City should immediately notify Anacortes, activate City wells as applicable, open interties as needed, request residents and NASWI to reduce water consumption, evaluate the need for potential water rationing measures, repair the disruption in the pipeline, disinfect and flush the line as required, and coordinate with Anacortes to restore supply. Provide additional water supply using three available groundwater sources. Implementation of the water shortage response plan outlined in Resolution 2001-08 may be required (Appendix P). Loss of 10-inch and 24-inch Transmission Mains Possible Causes A break in line, temporary shut down for construction or maintenance, loss of supply from the City of Anacortes, vandalism or other accidental disruption are all possible causes for the loss of the transmission mains. Results This is the situation when no water is available from Anacortes. Wells 8, 9, and 11 produce approximately 0.62 mgd. With water rationing measures enacted, these wells should be sufficient to temporarily supply water to the City’s water system customers. Wholesale water customers such as NASWI would not receive water from the City and must rely on other sources. Response Action Upon noticing a disruption in the transmission mains, the City should immediately notify Anacortes, activate City wells as applicable, enact Resolution 2001-08 water use restrictions, inform the City’s wholesale water customers of the disturbance, repair the disruption in the pipeline, disinfect and flush the line as required, and coordinate with the Anacortes to restore supply. The City of Anacortes maintains ownership of a reverse osmosis package water treatment plant for use in the case of an emergency. If the City’s water supplies reach significantly low levels, or the disruption in service is anticipated to last at least 7 days, the City should request use of the package water treatment plant until normal service is resumed. Also, there are two interties between the City’s water system and NASWI. These interties may be opened to allow a sharing of City and NASWI water resources. The City has an agreement and policy in place for the activation of the City/NASWI interties.
Gray & Osborne, Inc., Consulting Engineers
City of Oak Harbor 7-35 2013 Water System Plan Update September 2014
Auxiliary Supply The City is interested in expanding its auxiliary water production capability in the event that either the 24-inch transmission main, or both the 10-inch and 24-inch transmission mains become unavailable. This auxiliary supply would likely come from additional groundwater sources. The City is currently investigating the feasibility of acquiring additional water supplies (~1,000 gpm) that could serve both the City and NASWI in the event of an emergency. CROSS-CONNECTION CONTROL As required by WAC 246-290-490, Cross-Connection Control, utilities have the responsibility to protect customers from water contamination due to cross-connections. A cross-connection is any physical arrangement where the potable water supply is connected, directly or indirectly, to any liquid of unknown or unsafe quality that may contaminate the public water supply through backflow. The regulation also requires utilities to develop and implement a comprehensive program to control cross-connections within the system. An acceptable cross-connection control program must address the following elements:
• Adoption of the appropriate ordinance, code, or rule-of-service for the purveyor to establish local authority to implement the cross-connection control program.
• Written procedures for implementing the cross-connection control
program.
• Identification of staff positions delegated the responsibility for the organization and implementation of the cross-connection control program.
• Establishment of the qualifications necessary for the personnel working in
the cross-connection control program. Detailed procedures for conducting surveys of new and existing facilities to identify all existing and potential cross-connections that could result in contamination of the distribution system.
• Requirements that only approved backflow assemblies shall be installed at
locations where cross-connection protection is required.
• A procedure or system for testing all backflow prevention assemblies upon installation.
• An adequate record keeping system.

Gray & Osborne, Inc., Consulting Engineers
7-36 City of Oak Harbor September 2014 2013 Water System Plan Update
• Customer information and public education regarding the cross-connection control program.
HISTORY The City adopted its original cross-connection control ordinance to comply with the Washington Administrative Code (WAC). The State has since adopted revised cross-connection control (CCC) regulation (WAC 246-290-490) that includes additional detail and clarification on the requirements of a cross-connection control program. In April 2006 the City adopted a revised CCC ordinance (No. 1456). Historically, the City water system staff has administered the CCC with little involvement from outside entities. The water system staff is deemed responsible for water service to the customer all the way to the inside plumbing, thus creating a conflict with the local plumbing official’s authority. The new regulations encourage the purveyor and the local plumbing authority to coordinate with a joint CCC program that combines the use of cross-connection regulations with provisions of the Uniform Plumbing Code to control cross-connections inside and outside the customer’s premises. CURRENT ACTIVITY The City currently administers an active CCC program through the City’s Municipal Code (Title 13.13). Enforcement of the program is established in the OHMC and compliance is required to maintain water service. The City maintains a database of all known backflow prevention devices. Annual test notices are sent to owners, and results are recorded in the database. The following records are included in the City’s CCC database:
• Date of inspection
• Results of inspection
• Recommended protection
• List of approved assemblies
• Test and maintenance reports
• List of certified testers
• Customer account number, billing address, service address, device details and history, and maintenance records

Gray & Osborne, Inc., Consulting Engineers
City of Oak Harbor 7-37 2013 Water System Plan Update September 2014
CCC ORDINANCE AND PROGRAM The current version of the City’s CCCP is included as Appendix G, and was approved by DOH in 2006. CCC PROGRAM STAFFING AND TRAINING Currently, the City’s CCC program is conducted in a joint venture between water system staff and the City’s building department. Staffing for CCC related activities require 0.5 water system full-time employees (FTEs) in addition to 0.25 FTEs from the building department. Future staffing level will depend on the number of enforcement actions required, the level of cooperation by property owners, and actual growth of the City’s water system. The State of Washington requires that anyone who manages a CCC program must maintain certification as a Cross-Connection Control Specialist (CCS). The water system staff currently employs five certified cross-connection control specialists. Building department employees are trained in cross-connection control, but are ineligible for CCS certification because they are not water system utility employees. TESTING AND INSPECTION There are five City staff members certified for cross connection inspections. These personnel conduct initial cross connection surveys on new commercial services or when there is a change in use, a change in the plumbing system, or scheduled re-evaluations. The water system staff works with the building department in a joint program. The water system staff and building departments rely on premise and in-premise protection from cross connection hazards to protect the public water system. The building department inspects residential services upon construction and forwards any issues of special concern to the water system staff. All backflow prevention assemblies are inspected and tested upon installation, repair, after a backflow incident, reinstallation, relocation, or replumbing, and annually thereafter, or on a more frequent basis as deemed appropriate by the City. All backflow assembly test reports are managed and kept on file using backflow prevention database software.

City of Oak Harbor 8-1 2013 Water System Plan Update September 2014
CHAPTER 8
CAPITAL IMPROVEMENT PROGRAM INTRODUCTION This chapter presents a Capital Improvement Program (CIP) in accordance with the requirements of WAC 246-290. Planned water system improvements, associated costs, and scheduling are presented in the following sections. These improvements are based on deficiencies identified in the City’s 2003 Water System Plan and Chapters 3 – System Analysis, and Chapter 4 – Hydraulic Modeling of this Plan. Financing of these improvements is discussed in Chapter 9 – Financial Planning. In the future, other projects may arise that are not identified as part of the City’s water system CIP. Such projects may be deemed necessary for ensuring water quality, preserving emergency water supply, accommodating transportation improvements proposed by other agencies, or addressing unforeseen problems with the City’s water system. Due to budgetary constraints, the completion of these projects may require that the proposed completion date for the projects in the CIP be rescheduled. The City retains the flexibility to reschedule proposed projects and to expand or reduce the scope of proposed projects, as best determined by the City when new information becomes available for evaluation. The CIP is categorized into five categories:
• Source/Supply Projects (S) • Transmission Projects (T) • Booster Station Projects (BS), • Distribution System Projects (DS), and • Pressure Zone Projects (PZ).
Each category is further divided into a detailed list of projects presented chronologically over the 6-year and 20-year planning periods. Projects required or recommended after the 6-year planning period are described, and a budgetary cost estimate is provided, but projects are not scheduled for a specific year. Figure 8-1 highlights the locations of all capital improvement projects. RECOMMENDED IMPROVEMENTS Recommended capital improvement projects are listed below. Cost estimates include state taxes (8.7 percent), contingency (20 percent), archaeological mitigation (variable, 10, 15, 20 or 25 percent) and engineering and administrative costs (25 percent). Archaeological mitigation values were assigned based on the potential to negatively impact cultural artifacts. Detailed cost estimates are provided in Appendix T. Cost

Gray & Osborne Inc., Consulting Engineers
8-2 City of Oak Harbor September 2014 2013 Water System Plan Update
estimates are based on 2013 dollars and were developed with an Engineering News Record Construction Cost Index value of 10,143. For projects that offer benefit to the NASWI water supply system, it is anticipated that NASWI will provide financial assistance to the City for financing a particular project. Specific details regarding the amount and form of assistance are not known at this time, and must be negotiated upon project acceptance and prior to construction. WATER RIGHTS AND SOURCE CAPACITY PROJECTS S-1: Well No. 9 Replacement Estimated Project Cost: $236,000 Proposed Design Year: 2015 Proposed Construction Year: 2016
Project Description: This project includes removing the pumping equipment from the existing Well 9. The existing casing and screen will be abandoned in place. A new 10-inch-diameter well will be drilled directly adjacent to the existing well location and new casing and screen will be installed. The existing pumping equipment and building will be inspected and reused if possible.
S-2: Emergency Supply Study Estimated Cost: $100,000 Proposed Year: 2014 Project Description:
Investigate the potential for additional groundwater sources to be used as emergency supply (~1,000 gpm). It is anticipated that the investigation will determine the feasibility and potential locations of new emergency supply wells. This project is not a specific capital improvement, and as such is not included in subsequent budgeting tables. It is included here for informational purposes only.
S-3: Eastside Reservoir Demolition Estimated Cost: $100,000 Proposed Design Year: 2017 Proposed Construction Year: 2018
Project Description: This project includes decommissioning and demolition of the existing Eastside Reservoir. The reservoir was constructed in 1949 and does not have a foundation structure. Retrofitting this reservoir or modifications to meet current seismic requirements are not cost-effective.

d
ÍB
d
UT
ÍB
"ª!
"ª!"ª!
ÍB
"ª!
"ª!
&(
&(
&(UTUTd
ÍB
UT
h
h
ÍÎ
$
h
ÍÎ
$
ÍÎ
$
ÍÎ
$
ÍÎ
$
ÍÎ
$
CRESCENT HARBOR
OAK HARBORSta
te Rte
20
W Ault Field Rd
E Crescent Harbor Rd
E Pioneer Way
Swantown Rd
SE Pioneer Way
E Whidbey Ave
E Fakkema Rd
Coral S
ea Ave
Pion
eer W
ay
W Waterloo Rd
W Whidbey Ave
Fort Nugent Rd SW Fort Nugent Ave
W Fakkema Rd
W Clover Valley Rd
W Crescent Harbor Rd
E Pioneer Way
WESTSIDERESERVOIRS 1&2
T2
DS7
DS5
PZ1
PZ3
DS2DS4DS3
T1
T3
PZ4
BS3
T5
PZ5
PZ2
PZ5
NORTHRESERVOIR
T3
HELLER STREETBOOSTER STATION
PZ4
LEGEND:d EXISTING BOOSTER STATION
h CHECK VALVE
ÍB INTERTIE
"ª! EXISTING PRV
ÍÎ
$
NEW PRV
UT RESERVOIR
&( WELL
WATERLINES
CITY LIMITS
DISTRIBUTION SYSTEM PROJECT
TRANSMISSION MAIN PROJECT
EXISTING RETAIL SERVICE AREA
URBAN GROWTH AREA
PARCELS
³0 2,000 4,0001,000
Feet
2013 WATER SYSTEM PLAN UPDATEFIGURE 8-1
CIP PROJECT MAP
DATA SOURCE: CITY OF OAK HARBOR
M:\Oak Harbor\13404 - Water System Plan Update\GIS\CIP.mxd

Gray & Osborne, Inc., Consulting Engineers
City of Oak Harbor 8-3 2013 Water System Plan Update September 2014
S-4: Emergency Supply Well Estimated Cost: $301,000 Proposed Design Year: 2016 Proposed Construction Year: 2017
Project Description: It is anticipated that a new well and associated peripheral items will be necessary to provide the required volume of groundwater for emergency supply for the City and its customers. The exact location, sizing, and details for the new emergency well will be finalized from the emergency supply study (S-2) prior to initiation of this project.
TABLE 8-1
Source Related Capital Improvement Project Summary
Project Design
Year Construction
Year Estimated
Cost (2013 $) No. Title Description S-1 Well 9
Replacement Pump, casing, and piping replacement
2015 2016 $236,000
S-2 Emergency Supply Study
Emergency groundwater supply feasibility study
2014 2014 N/A
S-3 Eastside Reservoir Demolition
Remove and wastehaul existing Eastside reservoir
2017 2018 $100,000
S-4 Emergency Supply Well
Drill and equip a new emergency supply well
2016 2017 $301,000
Source Project Subtotal $637,000 TRANSMISSION LINE PROJECTS T-1: Cross City Transmission Main Estimated Project Cost: $3,559,000 Proposed Design Year: 2014 and 2019 Proposed Construction Year: 2015 and 2020
Project T-1 is further split into two projects, T-1A and T-1B. In total, Project T-1 is required to create the East 384 pressure zone and will include the installation of approximately 8,200 linear feet of 18-inch ductile iron water pipe, and 100 feet of 8-inch-diameter ductile iron pipe between the North Reservoir and West Crescent Harbor Road. Project Description: Project T-1A will connect to the existing transmission main at the intersection of Gun Club Road and N Oak Harbor Road and will head east along Gun Club Road Road, south along NE Goldie Road and terminate at the intersection of NE Goldie

Gray & Osborne Inc., Consulting Engineers
8-4 City of Oak Harbor September 2014 2013 Water System Plan Update
Road and NE 16th Street. This portion of project T-1 would be designed starting in 2014.
Project T-1B will provide an additional connection point that will allow the City to serve the NASWI Seaplane Base facilities. This project will extend the 18-inch main described in T-1A east along NE 16th Street and south along NE Regatta Drive to the intersection of NE Regatta Drive and West Crescent Harbor Road. This portion of T-1 would be designed starting in 2019 or later.
T-2: North-End Trunk Main: Phases 1 and 2 Estimated Project Cost: $1,767,000 Proposed Design Year: 2019 Proposed Construction Year: >2019
Project Description: This project will provide an alternate connection between the Ault Field Pump Station and the City’s distribution system. The project will occur in two phases. Phase 1 will include a tie-in connection to the existing 18-inch pipe at the intersection of West Ault Field Road and NE Goldie Street. Approximately 500 feet of 12-inch-diameter ductile iron pipe will be installed along West Ault Field Road to the intersection with Old Goldie Road. Approximately 2,000 feet of new 18-inch-diameter ductile iron pipe will head north to the termination of Old GEREF HYPERLIN
Phase 2 of the North-End trunk main project, which will complete the alternate connection between the Ault Field Pump Station and the City’s distribution system, includes the installation of approximately 2,000 feet of 18-inch ductile iron water main from the northern terminus of Old Goldie Road west through undeveloped property, and will cross North Charles Porter Road prior to final connection with the Ault Field Booster Station. This pipeline will be installed by the City but will cross NASWI property and will involve review, coordination, and cooperation by both parties.
T-3: West 384 Zone Extension: Phase 1 Estimated Project Cost: $2,678,000 Proposed Design Year: 2018 Proposed Construction Year: 2019
Project Description: This project includes piping and appurtenances that would help create the West 384 pressure zone. The project includes approximately 5,300 feet of 24-inch ductile iron transmission main from the new North Reservoir across undeveloped land west of the termination of Gun Club Road to North Heller Road. The pipe would then continue south to the intersection of NW Heller Street and NW Crosby Avenue.

Gray & Osborne, Inc., Consulting Engineers
City of Oak Harbor 8-5 2013 Water System Plan Update September 2014
T-4: 24-Inch Transmission Line Investigation Estimated Project Cost: $150,000 Proposed Year: 2017
Project Description: Fully investigate the soundness of the 24-inch transmission from Sharpe’s Corner along Highway 20 to the Ault Field Pump Station. This investigation would likely include a technical memorandum, geotechnical evaluation, pothole investigations at several locations along the transmission main, corrosive soil sampling, and a structural examination of the crossing at the Deception Pass Bridge. Based on this investigation and their results, provide recommendations for replacement and/or modifications.
This project is not a specific capital improvement, and as such is not included in subsequent budgeting tables. It is included here for informational purposes only.
T-5: Westside Water Main Extension Estimated Project Cost: $7,609,000 Proposed Year: >2019
Project Description: This project is intended to accommodate future growth to the west and south of the existing urbanized area and to provide service, pressure and fire flows to the area. This project is not required within the 20-year planning window, but could become necessary if development in this area requires additional flow and connections. This project will likely be developer funded. The project includes up to 16,000 feet of 18-inch ductile iron water main, and would likely be divided up into three of four phases to be completed as development occurs within sections of the region. The final alignment for this project will be determined at a later date prior in conjunction with development in the area and projected needs for City water customers.
T-6: Campbell Lake Transmission Main Replacement Estimated Project Cost: $1,786,000 Proposed Design Year: 2018 Proposed Construction Year: >2019
Project Description: This project will replace approximately 3,100 feet of 24-inch ductile iron transmission main with 24-inch HDPE pipe along the eastern shores of Lake Campbell. A corrosion survey in 2007 revealed that mildly corrosive soils along the shore of Lake Campbell on Fidalgo Island have begun to damage the transmission main. The existing ductile iron pipe is located under the northbound traffic lane of Highway 20. Ideally, the new HDPE pipe will be located within a

Gray & Osborne Inc., Consulting Engineers
8-6 City of Oak Harbor September 2014 2013 Water System Plan Update
new utility easement adjacent to the existing right-of-way. This project will require the acquisition of necessary permits and easements required to install new pipe in this location.
TABLE 8-2
Transmission Main Related Capital Improvement Project Summary
Project DesignYear
Construction Year
Estimated Cost (2013 $)
No. Title Description T-1 Cross City
Transmission Main(1) 8,200 lf of 18-inch pipe and new PRV station
2014 2015 $3,559,000
T-2 North-End Trunk Main: Phases 1 and 2(1)
4,000 lf of 18-inch pipe 2019 >2019 $1,767,000
T-3 West 384 Zone Extension: Phase 1
5,300 lf of 24-inch pipe from North Reservoir
2018 2019 $2,678,000
T-4 24-Inch Transmission Line Investigation
Transmission line reliability & soundness study
2017 2017 N/A
T-5 Westside Water Main Extension
16,500 lf of 16- or 18-inch pipe
>2019 >2019 $7,609,000
T-6 Campbell Lake Main Replacement
3,100 lf of HDPE pipe along east shores of Lake Campbell
>2019 >2019 $1,970,000
Transmission Main Project Subtotal $17,583,000 (1) This project is a joint City/NASWI project and final cost sharing has not been determined. Project
timing and scope may change depending on the level of NASWI financial contribution. BOOSTER STATION BS-1: Ault Field Booster Station Surge Protection Analysis Estimated Project Cost: $208,000 Proposed Design Year: 2015 Proposed Construction Year: 2016
Project Description: The previous Water System Plan recommended installing an 800 cubic foot capacity surge protection unit upstream of the Ault Field water pumps. As part of this project, a new surge suppression analysis will be completed. If necessary, a new surge suppression device will be installed and connected to protect the Ault Field Pump Station equipment.
ۀ

Gray & Osborne, Inc., Consulting Engineers
City of Oak Harbor 8-7 2013 Water System Plan Update September 2014
BS-2: Ault Field Booster Station Pump Replacement Estimated Project Cost: $86,000 Proposed Design Year: 2014 Proposed Construction Year: 2015
Project Description: This project will replace two of the existing pumps at the Ault Field Pump Station. The existing pumps were not sized correctly and will be replaced with appropriately sized, higher efficiency units.
BS-3: North Booster Pump Station Estimated Project Cost: $2,398,000 Proposed Design Year: >2019
Project Description: This project includes construction of a new booster station at the location of the new North Reservoir. The booster station will pump water from the North Reservoir to the eastern portion of the City near the intersection of NE Regatta Drive and West Crescent Harbor Road. The booster station will include a new concrete masonry unit (CMU) building that will house horizontal split case pumps to handle the City’s projected water demands to the proposed East 384, West 384, and 322 pressure zones. Space and electrical connections will be provided for two additional pumps to be installed as system demands increase. This project will provide pressure and flow necessary to serve the NASWI Seaplane Base portion of the U.S. Navy water distribution system.
TABLE 8-3
Booster Station Related Capital Improvement Project Summary
Project Design
Year Construction
Year Estimated
Cost (2013 $)No. Title Description BS-1 Ault Field Booster Station
Surge Protection Analysis 800 cubic foot hydropneumatic surge arrestor
2015 2016 $208,000
BS-2 Ault Field Booster Station Pump Replacement
Existing Ault Field Booster pump replacement
2014 2014 $86,000
BS-3 North Booster Pump Station(1)
Construct new north booster station and pumps
>2019 >2019 $2,398,000
Booster/Pump Station Subtotal $2,692,000 (1) This project is a joint City/NASWI project and final cost sharing has not been determined. Project
timing and scope may change depending on the level of NASWI financial contribution.

Gray & Osborne Inc., Consulting Engineers
8-8 City of Oak Harbor September 2014 2013 Water System Plan Update
DISTRIBUTION SYSTEM DS-1: NE Regatta Drive Pipeline Estimated Cost: $116,000 Proposed Design Year: 2017 Proposed Construction Year: 2018
Project Description: This project includes installation of 300 feet of 8-inch DI pipe to replace the existing 6-inch asbestos cement pipe between East Whidbey Avenue and NE 1st Avenue. This project is part of the City’s regular pipe replacement schedule and will improve local pressures and fire flow in the area surrounding the project.
DS-2: Glencoe Street Fire Flow Improvements Estimated Cost: $936,000 Proposed Design Year: 2018 Proposed Construction Year: 2019
Project Description: This project will replace 4-inch-diameter asbestos-cement pipe on SE Glencoe Street with new 8-inch-diameter ductile iron pipe. This project includes installation of approximately 2,400 feet of 8-inch ductile iron pipe along SE 4th Avenue between SE Midway Boulevard and SE Glencoe Street, and along SE Glencoe Street between 4th Avenue and 40th NW Street. This project will increase available fire flow in the immediate vicinity to levels above the required 1,000 gpm.
DS-3: SW 10th Court Pipe Replacement Estimated Cost: $188,000 Proposed Design Year: >2019
Project Description: This project includes replacement of the existing 6-inch PVC pipe along the full extent of SW 10th Court with approximately 480 feet of 8-inch ductile iron pipe.
DS-4: SW 11th Court Pipe Replacement Estimated Cost: $188,000 Proposed Design Year: >2019
Project Description: This project includes replacement of the existing 6-inch PVC pipe along the full extent of SW 11th Court with approximately 480 feet of 8-inch ductile iron pipe.

Gray & Osborne, Inc., Consulting Engineers
City of Oak Harbor 8-9 2013 Water System Plan Update September 2014
DS-5: Erin Park Main Road Extension Estimated Cost: $578,000 Proposed Design Year: >2019
Project Description: This project includes the installation of approximately 1,100 feet of 12-inch water pipe along West Erin Park Road between North Painters Way and North Oak Harbor Road. It also includes approximately 350 feet of new 12-inch pipe from the end of West Oak Street to the new main along West Erin Park Road. This project will provide adequate fire flow to meet the 3,500 gpm requirement for businesses in this region of the City.
DS-6: Erin Park Road Tie-In Estimated Cost: $50,000 Proposed Design Year: >2019
Project Description: This project includes a tie-in connection between the 12-inch ductile iron pipe in the North Goldie Road right-of-way to the existing 8-inch C900 parallel line at West Erin Park Road. This project will help provide adequate fire flow to meet the 3,500 gpm requirement for businesses in this region of the City.
DS-7: Industrial Avenue Tie-In Estimated Cost: $50,000 Proposed Design Year: >2019
Project Description: This project includes a tie-in connection between the 12-inch ductile iron pipe in the Goldie Road right-of-way to the existing 8-inch PVC parallel line at Industrial Avenue. This project will help provide adequate fire flow to meet the 3,500 gpm requirement for businesses in this region of the City.
DS-8: Heller Reservoir Extension Estimated Cost: $696,000 Proposed Design Year: >2019
Project Description: This project includes the installation of a dedicated water pipe between the Heller Street Reservoirs and the Mainland Zone along West Whidbey Avenue to allow it to be isolated from the West 384 Zone. Approximately 2,000 feet of 16-inch ductile iron water main will be installed from the Westside Reservoirs north along SW Heller Street and east along West Whidbey Avenue to the intersection of West Whidbey Avenue and SW Jib Street.

Gray & Osborne Inc., Consulting Engineers
8-10 City of Oak Harbor September 2014 2013 Water System Plan Update
DS-9: Steel/AC Pipe Replacement Estimated Cost: $1,000,000 Proposed Construction Year: Bi-annually
Project Description: This project will systematically replace the existing steel and asbestos-cement (AC) water pipes located throughout the City’s distribution system. The City currently has approximately 100,000 linear feet of old steel and AC pipes, where are typically undersized. Steel and AC pipe deteriorate over time and constitute a major fraction of the City’s distribution system leakage. These pipes also have higher regular maintenance requirements than currently specified ductile iron pipes. In this project, design for replacement of a portion of the City’s AC pipe will occur one year, and will be followed the next year by construction of the design replacement. The design/construction process will then be repeated.
TABLE 8-4
Distribution System Related Capital Improvement Project Summary
Project Design Year
Construction Year Estimated
Cost (2013 $)No. Title Description DS-1 NE Regatta Drive
Pipeline 300 lf f 8-inch pipe 2017 2018 $116,000
DS-2 Glencoe Street Fire Flow Improvements
2,400 lf of 8-inch pipe 2018 2019 $936,000
DS-3 SW 10th Court Pipe Replacement
480 lf of 8-inch pipe >2019 >2019 $188,000
DS-4 SW 11th Court Pipe Replacement
480 lf of 8-inch pipe >2019 >2019 $188,000
DS-5 Erin Park Main Road Extension
1,450 lf of 12-inch pipe >2019 >2019 $578,000
DS-6 Erin Park Road Tie-In Existing 8-inch pipe and proposed 12-inch pipe tie-in
>2019 >2019 $50,000
DS-7 Industrial Avenue Tie-In Existing 8-inch pipe and proposed 12-inch pipe tie-in
>2019 >2019 $50,000
DS-8 Heller Reservoir Extension
2,000 lf of 16-inch pipe >2019 >2019 $696,000
DS-9 Steel/AC Pipe Replacement
Replace existing small diameter steel and AC pipe
Bi-annually Bi-annually $500,000(1)
Distribution System Subtotal $5,802,000 (1) Costs were assumed to occur through 2019 (6 years), and the total ($3,000,000) is added to the
distribution system subtotal cost during the year of construction.

Gray & Osborne, Inc., Consulting Engineers
City of Oak Harbor 8-11 2013 Water System Plan Update September 2014
PRESSURE ZONE
PZ-1: O’Leary Way Water Main Estimated Cost: $599,000 Proposed Design Year: 2014 Proposed Construction Year: 2015
Project Description: This project would further develop the East 384 Zone and provide adequate service and fire flows to the area. The project includes installation of approximately 1,900 feet of 8-inch ductile iron pipe along O’Leary Way between NE 5th Avenue and NE 11th Avenue. New pipe would be installed parallel to the existing 6-inch buried pipe and would include tie-ins to the existing system.
PZ-2: North O’Leary Way Main Extension Estimated Cost: $511,000 Proposed Design Year: 2014 Proposed Construction Year: 2015
Project Description: This project would completely develop the East 384 Zone and provide adequate service and fire flows to the area. The project includes installation of approximately 1,200 feet of 8-inch ductile iron pipe along O’Leary Way north of NE 11th Avenue across NE Narrows Way to the end of the cul-de-sac. This new pipe would replace the existing 6-inch diameter asbestos-cement water pipe.
PZ-3: South-End NASWI Connection Estimated Cost: $904,000 Proposed Design Year: >2019
Project Description: Project PZ-3 will provide an additional connection point that will allow the City to better serve NASWI connections within the Seaplane Base. The project includes the construction of a new PRV station near the intersection of NE Regatta Drive and East Whidbey Avenue. It also includes the installation of approximately 1,200 LF of 12-inch ductile iron pipe along NE Regatta Drive between E. Whidbey Avenue and NE 5th Avenue.

Gray & Osborne Inc., Consulting Engineers
8-12 City of Oak Harbor September 2014 2013 Water System Plan Update
PZ-4: West 384 Zone Development Estimated Cost: $326,000 Proposed Design Year: 2016 Proposed Construction Year: 2017
Project Description: These two small projects are part of a larger project that will help fully develop the West 384 Zone. The first is the installation of a 6-inch PRV station along SW 6th Avenue between SW Judson Drive and SW Harrier Street. The second is includes approximately 780 feet of new 8-inch-diameter ductile iron water pipe will replace the existing 6-inch asbestos-cement water pipe and connect SW Barrington Drive and SW London Terrace. A new PRV station will also be included at this location. This project also includes installation of an 8-inch check valve between the future west 384 Zone and the existing 307 Zone (Mainland Zone) break to provide additional fire flow to Oak Harbor High School from the 307 Zone. The valve will be installed near the intersection of NW 2nd Avenue and SW Jib Street and will include a vault.
PZ-5: 322 Zone Development Estimated Cost: $485,000 Proposed Design Year: >2019
Project Description: These two small projects are part of a larger project that will help fully develop the 322 Zone. The first is the installation of a 6-inch PRV station along SW Quinalt Street between SW Swantown Road and SW 10th Avenue. The second includes a new PRV station along SW Heller Street immediately north of SW Swantown Road. This project also includes installation of an 8-inch check valve between the future 322 Zone and existing 307 Zone (Mainland Zone) break to provide additional fire flow to Walmart and other large businesses from the 307 Zone. The valve will be installed near the intersection of SW Barrington Drive and Highway 20 and will include a vault.

Gray & Osborne, Inc., Consulting Engineers
City of Oak Harbor 8-13 2013 Water System Plan Update September 2014
TABLE 8-5
Pressure Zone Related Capital Improvement Project Summary
Project Design Year
Construction Year
Estimated Cost (2013 $) No. Title Description
PZ-1 O’Leary Way Water Main
1,900 lf of 8-inch pipe 2014 2015 $599,000
PZ-2 North O'Leary Way Water Main
1,200 lf of 8-inch pipe 2014 2015 $511,000
PZ-3 East 384 Zone Development(1)
2 PRV installations >2019 >2019 $904,000
PZ-4 West 384 Zone Development
780 lf of 8-inch pipe and new 6-inch PRV station
2016 2017 $326,000
PZ-5 322 Zone Development Two separate 6-inch PRV stations and fire flow check valve
>2019 >2019 $485,000
Pressure Zone Subtotal $2,825,000 (1) This project is a joint City/NASWI project and final cost sharing has not been determined. Project
timing and scope may change depending on the level of NASWI financial contribution. SUMMARY OF RECOMMENDED IMPROVEMENTS A proposed schedule and cost summary for the recommended capital improvements is shown in Table 8-5. Estimated construction costs have been adjusted for inflation and are increased at annual rate of 3 percent. Detailed cost estimates for the City’s improvement projects are included in Appendix T. A water system facility map that shows the locations of the proposed improvements is included as Figure 8-1.
TABLE 8-6
Projected Capital Improvement Project Schedule
Construction Year
Project Number
Project Name
Estimated Cost
(2013$)(1)
Estimated Construction
Cost(2)
2014
T-1A Cross City Transmission Main(3) $1,559,000 $1,559,000
BS-2 Ault Field Booster Station Pump Replacement $86,000 $86,000
DS-9 Steel/AC Pipe Replacement $1,000,000 $1,000,000 PZ-1 O’Leary Way Water Main $599,000 $599,000 PZ-2 North O’Leary Way Water Main $511,000 $511,000
2014 Subtotal $3,755,000 $3,755,000
2015 S-1 Well No. 9 Replacement $236,000 $243,000
BS-1 Ault Field Booster Station Surge Protection Analysis $208,000 $214,000 2015 Subtotal $444,000 $457,000

Gray & Osborne Inc., Consulting Engineers
8-14 City of Oak Harbor September 2014 2013 Water System Plan Update
TABLE 8-6 – (continued)
Projected Capital Improvement Project Schedule
Construction Year
Project Number
Project Name
Estimated Cost
(2013$)(1)
Estimated Construction
Cost(2)
2016 S-4 Emergency Supply Well $301,000 $319,000
DS-9 Steel/AC Pipe Replacement $1,000,000 $1,000,000 PZ-4 West 384 Zone Development $326,000 $346,000
2016 Subtotal $1,627,000 $1,665,000
2017 S-3 Eastside Reservoir Demolition $100,000 $109,000 DS-1 NE Regatta Drive Pipeline $116,000 $127,000
2017 Subtotal $216,000 $236,000
2018 T-3 West 384 Zone Extension: Phase I(5) $2,678,000 $3,014,000 DS-2 Glencoe Street Fire Flow Improvements $936,000 $1,053,000
2018 Subtotal $3,614,000 $4,067,000
2019 T-1B PRV Stations(5) $2,000,000 $2,319,000 T-2 North-End Trunk Main: Phase I & II(3) $1,767,000 $2,048,000
DS-9 Steel/AC Pipe Replacement $1,000,000 $1,000,000 2019 Subtotal $4,767,000 $5,367,000
>2019(4)
T-5 Westside Water Main Extension $7,609,000 $9,086,000 T-6 Campbell Lake Main Replacement $1,970,000 $2,352,000
BS-3 North Booster Pump Station(6) $2,398,000 $2,863,000 DS-3 SW 10th Court Pipe Replacement $188,000 $224,000 DS-4 SW 11th Court Pipe Replacement $188,000 $224,000 DS-5 Erin Park Main Road Extension(5) $578,000 $690,000 DS-6 Erin Park Road Tie-In(5) $50,000 $60,000 DS-7 Industrial Avenue Tie-In(5) $50,000 $60,000 DS-8 Westside Reservoir Extension $696,000 $831,000 PZ-3 East 384 Zone Development(3) $904,000 $1,079,000 PZ-5 322 Zone Development(5) $485,000 $579,000
>2019 Subtotal $15,116,000 $18,048,000 6-Year Planning Period Total $14,423,000 $15,547,000 6-Year Planning Period Total (City Funded) $9,745,000 $10,214,000 20-Year Planning Period Total $29,539,000 $33,595,000 20-Year Planning Period Total (City Funded) $23,698,000 $26,873,000 (1) Values given are in 2013 dollars and represent project costs including archaeological mitigation,
contingency, tax, and engineering/administrative services. (2) Values given are estimated project costs and include items listed in (1) above. (3) This project is a joint City/NASWI project and final cost sharing has not been determined. Project
timing and scope may change depending on the level of NASWI financial contribution. (4) Costs for these years are assumed to be 2020 dollars. (5) Provided through developer funds and is not counted against the City’s projected CIP
expenditures. (6) Will be constructed using City and private developer funds. Full construction cost is allocated to
the City for planning purposes.

City of Oak Harbor 9-1 2013 Water System Plan Update September 2014
CHAPTER 9
FINANCIAL PROGRAM INTRODUCTION This chapter contains an analysis of the City’s ability to fund water system improvements outlined in Chapter 8 – Capital Improvement Program. Potential funding sources, financial status of the water utility, funding required to finance the scheduled improvements, and the impact of water system improvements on water rates are presented. EXISTING WATER UTILITY FINANCIAL STATUS CURRENT WATER RATES The City’s water rates are defined in Ordinance 1587 and outline the costs for water service through the year 2016. These rates were adopted in response to the Water Cost of Service Study (HDR, 2010). Rates through the year 2016 are summarized in Table 9-1.
TABLE 9-1
Water Service Rates Through 2016(1)
Parameter 2012 2013 2014 2015 2016 Monthly Base Rate Residential, Residential/Commercial, School, and Irrigation
5/8" or 3/4" $23.50 $24.25 $25.00 $25.50 $26.25 1" $32.30 $36.40 $40.65 $44.65 $47.80
1 1/2" $64.65 $72.75 $81.25 $89.20 $95.65 2" $103.40 $116.40 $130.00 $142.80 $153.00 3" $193.90 $218.25 $243.75 $267.75 $2,868.90 4" $323.15 $363.75 $406.25 $446.25 $478.15 6" $387.75 $400.15 $412.50 $420.75 $433.15 8" $620.40 $640.20 $660.00 $673.20 $693.00
Multi-Family, Multi-Commercial Per Base unit rate $19.95 $20.60 $21.25 $21.70 $22.30
Additional Consumption Charges Single-Family and Multi-Family (per unit)
0 - 3 CCF $1.75 $2.10 $2.35 $2.60 $2.85 4 - 6 CCF $2.55 $2.80 $3.15 $3.75 $4.30 > 7 CCF $4.80 $5.45 $5.95 $6.35 $6.75

Gray & Osborne Inc., Consulting Engineers
9-2 City of Oak Harbor September 2014 2013 Water System Plan Update
TABLE 9-1 – (continued)
Water Service Rates Through 2016(1)
Parameter 2012 2013 2014 2015 2016 Commercial (per unit), Schools, and Churches (2)
0 - 10 CCF $4.20 $4.25 $3.75 $3.45 $3.50 11 - 20 CCF $3.80 $4.00 $3.75 $3.70 $3.75
> 21 CCF $2.60 $3.15 $3.75 $3.95 $4.10 Irrigation
0 - 10 CCF $4.50 $4.50 $4.20 $4.20 $4.45 > 11 CCF $3.00 $3.60 $4.20 $5.00 $5.50
(1) Prices listed are for connections within city limits. Connections outside of city limits are subject to a 1.5 rate differential.
(2) Commercial laundromats will receive a 10 percent reduction in the water consumption rate to accommodate for evapotranspiration that occurs during drying.
As previously mentioned, the City maintains three primary wholesale customers and billing for these three customers varies slightly. Currently, NASWI is billed as a wholesale customer based on the agreements between the two entities. North Whidbey Water District is billed as a commercial entity outside of the city limits and as such is subject to 1.5 times the in-city billing rate. Lastly, Deception Pass State Park is billed as an in-city commercial customer. CURRENT CONNECTION FEES In-City Connections A connection charge shall be levied upon any customer prior to connection with city water service. The connection charge shall be the actual cost of installation. An initial sum, based on the cost estimated by the water superintendent, or their designee, must be paid in advance of service installation. Upon completion of the connection, the actual cost will be determined and if this amount is greater than the initial estimate, the customer will be billed for the balance. If the actual cost is less than estimated, the overpayment will be refunded to the customer. The actual cost of an installation shall include all labor, equipment and material, plus a charge for overhead as set in the utility rate ordinance. Out-of-City Connections For water connections outside the city limits of Oak Harbor, a surcharge of 50 percent is added to the charges specified above for the extra costs involved in working beyond the normal service area.

Gray & Osborne Inc., Consulting Engineers
City of Oak Harbor 9-3 2013 Water System Plan Update September 2014
HISTORICAL REVENUES AND EXPENSES The City maintains a single Water Fund 401. Historical revenues and expenditures for Water Fund 401 are shown in Table 9-2. The City accounts for the water utility as a self-supporting enterprise fund with revenues, expenses, debt and reserves specified for water services. Monthly water sales are the primary source of revenue for maintenance and operations. New customers pay a combination of a one-time system development charge, meter installation and initiation fees. The City primarily pays for capital improvements on a pay-as-you-go basis. There is no outstanding long-term debt for the water utility. The Public Works Department prepares biennial budgets along with the City’s Finance Department. Most activity for the water utility takes place within Water Fund 401, including operations (including indirect costs) and capital outlay for improvement projects. Through the biennial budget process, the City balances the water needs with the stream of revenue and planned capital projects. With each update of the Water System Plan, the City adjusts its 6-year outlook and planned budget.

Gray & Osborne Inc., Consulting Engineers
9-4 City of Oak Harbor September 2014 2013 Water System Plan Update
TABLE 9-2
Historical Revenues and Expenditures for Water Fund 401
Parameter 2008 2009 2010 2011 2012 2013(1) Revenues Start of Year Balance $3,144,753 $3,948,780 $2,660,542 $3,356,221 $4,546,673 $4,015,855 Charges for Service - Residential $3,392,311 $3,814,910 $3,822,303 $3,987,138 $4,253,119 $4,000,000 Charges for Service - NASWI $318,170 $380,918 $399,206 $356,912 $486,973 $360,000 Connection, Admin., and Other Fees(1) $66,624 $33,473 $34,448 $54,167 $40,260 $31,200 Miscellaneous Revenues(2) $58,967 $42,830 $72,886 $161,398 $74,613 $64,500 Military Capital Contributions $570,364 $- $- $- $- $- Revenue Bond Proceeds $- $- $- $- $- $3,000,000 Transfers $399,927 $- $- $- $- $2,373,000 Insurance $- $12,033 $2,728 $- $1,262 $- NASWI Meter & Maintenance Revenues $3,000 $3,000 $5,806 $5,192 $5,340 $4,000 Total Revenues $4,809,363 $4,287,164 $4,337,377 $4,564,807 $4,861,567 $9,832,700 Expenditures Salaries, Wages, and Benefits $542,810 $615,945 $601,630 $519,802 $514,215 $537,194 Operating Supplies and Equipment $96,392 $215,202 $142,233 $41,711 $72,277 $128,250 Administrative Costs $16,225 $15,411 $18,601 $24,686 $20,944 $27,000 Professional Services $19,850 $40,640 $23,582 $27,243 $24,110 $40,000 Equipment and Supplies for Resale $859,552 $738,636 $979,086 $1,043,079 $1,146,947 $1,136,265 Insurance, Services, and Taxes $439,581 $522,628 $517,663 $539,895 $550,643 $540,453 Interfund Expenditures $228,753 $403,289 $445,390 $562,246 $551,645 $659,675 Operating Transfers $577,587 $397,955 $390,987 $261,942 $307,950 $224,000 Public Works Trust Fund Expenditures $736,493 $864,366 $60,177 $55,336 $55,079 $54,824 Capital Outlay $763,734 $- $989,177 $738,965 $1,254,037 $5,373,000 System Improvements $17,459 $975,761 $29,909 $1,138 $24,386 $30,000 Miscellaneous $44,721 $38,723 $53,289 $44,890 $43,591 $322,000 Total Expenditures $4,343,157 $4,828,556 $4,251,724 $3,860,933 $4,565,824 $9,072,661 Annual Surplus/(Deficit) $466,206 ($541,392) $85,653 $703,874 $295,743 $760,039 Year-End Fund Balance $3,020,821 $2,963,586 $3,095,494 $4,693,094 $4,525,551 $4,016,055
(1) Values for 2013 are not finalized, but were approved by City Council in 2012. (2) Line items shown are a combination of City line items. Items for similar categories were combined for clarity and planning purposes.

Gray & Osborne Inc., Consulting Engineers
City of Oak Harbor 9-5 2013 Water System Plan Update September 2014
PROJECTED REVENUES AND EXPENSES PROJECTED GROWTH Estimates of the number of future customers and the demand they will place on the water system are required in order to estimate future revenues and expenditures. Chapter 2 – Basic Planning Data, provides detailed population and water demand projections. Projected revenues and expenditures are listed in Table 9-3. Revenue projections for the year 2013 and 2014 were provided by the City and were approved by the City Council in late 2012. Water service charges for City connections are based on the historical cost ($/ccf) of water from 2009-2012. This base cost was multiplied by the water consumption projections formulated in Chapter 2 – Basic Planning Data. Projected revenues for NASWI water service are also based on the historical cost of water consumed by NASWI from 2009-2012 and their projected usage until 2020. Revenues from connection/admin/other fees, miscellaneous revenues, and NASWI meter and maintenance revenues were assumed to increase with inflation at an annual rate of 3 percent. Professional service expenditures included engineering and administrative services costs shown in the detailed cost estimates in Appendix T. Capital outlay expenditures were assumed to be actual construction costs for selected new large-scale projects associated with system expansion such as booster stations or transmission main replacements outlined in Chapter 8 – Capital Improvement Program. System improvement expenditures were assumed to include smaller scale pipe replacement projects, ongoing maintenance replacement projects, and water quality projects outlined in Chapter 8 – Capital Improvement Program. Projected revenues and expenditures are also shown graphically in Figure 9-1. Projected expenditures for 2013 and 2014 were provided by the City and also approved by the City Council in late 2012. Projected expenditures for 2015-2020 are based on values for 2014 and adjusted for inflation at an annual rate of 3 percent. PWTF expenditures were taken from the City’s planned payment schedule to Troxell Construction and Quiet Cove Construction. These payments occur in July of each year until year 2025 for Troxell Construction, and year 2026 for Quiet Cove Construction. Capital outlay and system improvement expenditures are based on estimated costs for the capital improvement projects described in Chapter 8 – Capital Improvement Program. Table 9-3 shows that, given the proposed capital improvements and their estimated costs, the City would operate an annual surplus through the majority of the 6-year planning period. Figure 9-1 shows slowly increasing the expenditures, with revenues rising accordingly. The start-of-year fund balance also increases slightly through the 6-year planning period. Annual operating surpluses are stable through 2019 and should provide the City with the necessary financial flexibility to continue their projected improvement schedule as well as providing funding for emergency projects, should the need arise.

Gray & Osborne Inc., Consulting Engineers
9-6 City of Oak Harbor September 2014 2013 Water System Plan Update
Costs included in Table 9-3 include the full cost of proposed projects. Several of these projects provide mutual benefit to both the City and NASWI water systems. Cost sharing of the improvements serving both systems is anticipated to either significantly reduce capital costs paid by the City or increase water rate revenue sufficiently to repay financing that would otherwise be necessary. Break down of cost sharing will be determined on an individual project basis. The scope, cost share and schedule for capital projects will be adjusted as necessary to fit within the financial and managerial capacities of the City.

Gray & Osborne Inc., Consulting Engineers
City of Oak Harbor 9-7 2013 Water System Plan Update September 2014
TABLE 9-3
Projected Revenues and Expenditures for Water Fund 401
Parameter 2014(1) 2015 2016 2017 2018 2019 Revenues Start of Year Balance $4,016,055 $4,016,055 $4,141,235 $4,088,172 $4,895,315 $5,792,235 Charges for Service - Residential $4,200,000 $4,271,480 $4,495,510 $4,695,360 $4,907,910 $5,120,800 Charges for Service - NASWI $378,000 $411,180 $412,300 $411,180 $411,180 $411,180 Connection, Admin., and Other Fees $31,200 $32,140 $33,100 $34,090 $35,110 $36,160 Miscellaneous Revenues $64,500 $66,440 $68,430 $70,480 $72,590 $74,770 Military Capital Contributions(2) $- $- $- $- $- $- Revenue Bond Proceeds $- $- $- $- $- $- Transfers $- $- $- $- $- $- Insurance $- $- $- $- $- $- NASWI Meter & Maintenance Revenues $4,000 $4,120 $4,240 $4,370 $4,500 $4,640 Total Revenues $4,677,700 $4,785,360 $5,013,580 $5,215,480 $5,431,290 $5,647,550 Expenditures Salaries, Wages, and Benefits $193,491 $199,300 $205,280 $211,440 $217,780 $224,310 Operating Supplies and Equipment $151,832 $156,390 $161,080 $165,910 $170,890 $176,020 Administrative Costs $2,000 $2,060 $2,120 $2,180 $2,250 $2,320 Professional Services(3) $30,000 $47,000 $125,000 $43,000 $384,000 $349,000 Equipment and Supplies for Resale $1,376,265 $1,417,550 $1,460,080 $1,503,880 $1,549,000 $1,595,470 Insurance, Services, and Taxes $568,041 $585,080 $602,630 $620,710 $639,330 $658,510 Interfund Expenditures $637,859 $656,990 $676,700 $697,000 $717,910 $739,450 Operating Transfers $224,000 $230,720 $237,640 $244,770 $252,110 $259,670 Public Works Trust Fund Expenditures $54,568 $54,310 $54,053 $53,797 $53,540 $53,283 Capital Outlay(4) $1,500,000 $- $- $- $- $- System Improvements(5) $30,000 $968,000 $1,189,000 $502,000 $173,000 $1,749,000 Miscellaneous $332,800 $342,780 $353,060 $363,650 $374,560 $385,800 Total Expenditures $5,100,856 $4,660,180 $5,066,643 $4,408,337 $4,534,370 $6,192,833 Surplus / (Deficit) ($423,156) $125,180 ($53,063) $807,143 $896,920 ($545,283) Year-End Fund Balance $4,016,055 $4,141,235 $4,088,172 $4,895,315 $5,792,235 $5,246,952
(1) Values for 2014 are not finalized, but were approved by City Council in 2012. (2) Level of NASWI contribution, if any has not been determined at this time. NASWI financial contributions to CIP projects will significantly affect
overall annual surplus/deficit levels, as well as the year end fund balance. (3) Professional services include anticipated design fees for individual CIP projects. Does not include developer funded projects. (4) Capital Outlay includes new large scale CIP projects required for system expansion. (5) System Improvements includes continual maintenance and pipe replacement, and general pipe replacement or expansion projects.

Gray & Osborne Inc., Consulting Engineers
9-8 City of Oak Harbor September 2014 2013 Water System Plan Update
FIGURE 9-1
Historical and Projected Revenues, Expenditures, and Surplus

Gray & Osborne Inc., Consulting Engineers
City of Oak Harbor 9-9 2013 Water System Plan Update September 2014
CAPITAL IMPROVEMENT PROJECT FUNDING SOURCE ALTERNATIVES In addition to the pay-as-you-go method of financing capital improvements, seeking grants and selling revenue bonds, the City may also consider low-interest loans from the Public Works Trust Fund (PWTF) or the Drinking Water State Revolving Fund (DWSRF). These funds are available for eligible municipalities with system improvement projects that meet their listed criteria. A variety of capital improvement funding sources are briefly discussed below. Grants: Island County Community Development Block Grant (CDBG) US Economic Development Administration (US EDA) Loans: Public Works Trust Fund (PWTF) Community Economic Revitalization Board (CERB) Drinking Water State Revolving Fund (DWSRF) USDA Rural Development (RD) Bonds: Revenue Bonds General Obligation Bonds Other: Utility Local Improvement Districts GRANTS Grant funding is a good source of capital funding because the money does not have to be repaid. Some of the grants that may be available to the City are Federal grants, the Clean Water State Revolving Fund (CWSRF), the Drinking Water State Revolving Fund (DWSRF), and Performance Partnership grants (PPG). The City should continue to pursue grants when appropriate, considering matching requirements, and availability. Washington General Purpose Community Development Block Grant (CDBG) The CDBG program is a competitive source of federal funding for a broad range of community development projects. A primary requirement of the CDBG program is that the project must principally benefit at least 51 percent of the low-to-moderate income residents of the project area. CDBG has two programs including General Purpose and Planning Only. The General Purpose program provides grant funds for the design, construction, or reconstruction of water and sewer (among others) systems up to the amount of $750,000. The Planning Only program includes projects such as comprehensive plans, community development plans, capital improvement plans, and other plans such as land use and urban environmental design, economic development, floodplain and wetlands management, transportation, and utilities. Planning Only grants are limited to $24,000 for a single applicant or $40,000 for a joint applicant.

Gray & Osborne Inc., Consulting Engineers
9-10 City of Oak Harbor September 2014 2013 Water System Plan Update
Eligible applicants for the CDBG programs include cities and towns with less than 50,000 people or counties with populations less than 200,000. US Economic Development Administration (US EDA) US EDA offers competitive grants up to $1 million for projects within Region 10. Projects are selected locally by an economic development district and submitted to Congress for competitive selection among other regions in the US. Similar to CERB, applicants must have an industrial partner ready to proceed or a feasibility study to provide evidence that the proposed project establishes realistic job creation. LOANS Public Works Trust Fund (PWTF) The PWTF is a revolving loan fund designed to help local governments finance public works projects through low-interest loans and technical assistance. The PWTF, established in 1985 by legislative action, offers loans substantially below market rates, payable over periods ranging up to 20 years. To be eligible for the PWTF programs, an applicant must be a local government such as a city, county, or utility district. PWTF has four loan programs including Construction, Preconstruction, Planning, and Emergency. PWTF loan terms are summarized in Table 9-4.

Gray & Osborne Inc., Consulting Engineers
City of Oak Harbor 9-11 2013 Water System Plan Update September 2014
TABLE 9-4
PWTF Loan Terms
Local Match Interest Rate Term Loan Limit Construction
15% 0.5% 20 $10,000,000 10% 1.0% 20
5% 2.0% 20 Preconstruction(1)
15% 0.5% 5 $1,000,000 10% 1.0% 5
5% 2.0% 5 Emergency(2)
0%(3) 3.0% 20 $500,000 (4) Energy and Water Efficiency(5)
0%(3) 0.5% < 5 $1,000,000 0%(3) 1.0% 5-10 $1,000,000 0%(3) 1.5% 11-20 $1,000,000
(1) Preconstruction loans can be refinanced to a 20-year term if the applicant obtains a subsequent PWTF construction loan.
(2) At the Board’s discretion, the loan amount may be increased to a maximum of $1 million per biennium with an interest rate as low as 0.5 percent interest for those jurisdictions located in distressed counties with projects stemming from a Governor, Federal, or other locally declared natural disaster.
(3) While a match is not required, it is recommended. (4) Per jurisdiction, per biennium. (5) Funding requests for projects costing $250,000 or more must be
accompanied by a completed audit (per the Department of Enterprise Services’ Energy Savings Performance Contracting Guidelines) that is no more than three years old and contains revised costs for capital upgrades if applicable.* Funding requests for projects costing less than $250,000 must be accompanied by a document signed by a system appropriate licensed engineer attesting to the anticipated energy savings. The document must be less than three years of age and contain revised costs for capital upgrades if applicable. The cost of an investment grade audit may be a retroactively reimbursable expense.
The Construction Program accepts applications once per year in the spring, and the money becomes available approximately one year later. The Preconstruction and Planning programs are open on a year-round basis and must be submitted to the Public Works Board prior the 15th of the month to be reviewed at the next Board meeting. These funds become available shortly after the Public Works Board makes their final decision as to the award. Emergency projects must have a locally declared emergency and are applied for on an open cycle depending on the availability of funds. Project expenditures are reimbursable from the date of the declared emergency.

Gray & Osborne Inc., Consulting Engineers
9-12 City of Oak Harbor September 2014 2013 Water System Plan Update
An applicant must have a long-term plan for financing its public works needs. If the applicant is a county or city, it must adopt the 1/4 percent real estate excise tax that is dedicated to public works construction projects. Eligible public works projects include streets and roads, bridges, storm sewers, sanitary sewer collection and treatment systems, and domestic water. Loans are presently offered only for purposes of repair, replacement, rehabilitation, reconstruction, or improvement of existing eligible public works systems. Eligible project costs can include expenses related to serving 20-year forecasted growth as identified in a growth management comprehensive plan. Since substantially more trust fund dollars are requested than are available, local jurisdictions must compete for the available funds. The applications are carefully evaluated, and the Public Works Boards submits a prioritized list of those projects to the Legislature that are recommended to receive low-interest financing. The Legislature reviews the list and indicates its approval through the passage of an appropriation from the Public Works Assistance Account to cover the cost of the proposed loans. Once the Governor has signed the appropriation bill into law (an action that usually occurs by the following April), those local governments recommended to receive loans are offered a formal loan agreement with appropriate interest rates and terms as determined by the Public Works Board. The 2014 allocation for the PWTF has been re-directed into the Washington State General Fund and no funds are currently available. The next tentative construction application cycle is scheduled to begin in spring 2014 with funds to be awarded in 2015. This schedule is subject to approval by the State Legislature. Upon reinstatement, it is possible that the State Legislature will revamp the program in order to bring interest rates closer to current market values and more clearly defined the fund to benefit community based infrastructure projects. Community Economic Revitalization Board (CERB) The Community Economic Revitalization Board’s prime mission is to partner with business and industry and local governments to maintain and create jobs. Established by the Legislature in 1982, CERB provides low-interest loans or, in unique circumstances, grants to help finance local public infrastructure necessary to develop or retain stable business and industrial activities. Projects eligible for funding include roads, domestic and industrial waters systems, sanitary and storm sewers, port facilities, and general-purpose industrial buildings. Typically, CERB provides loans in the amount of $1 million and, where applicable, grants in the amount of $300,000. The interest rate is tied to the current cost of a 10-year bond and a local match of 10 percent is required. Eligible applicants include Washington State subdivisions in partnership with private enterprise. If there is no economic partner, a local government can produce a feasibility study that documents realistic job retention or creation. Applications must be submitted

Gray & Osborne Inc., Consulting Engineers
City of Oak Harbor 9-13 2013 Water System Plan Update September 2014
45 days prior to a regularly scheduled CERB Meeting, which typically occur in January, March, July, and November Drinking Water State Revolving Fund (DWSRF) In 1996, Congress established the DWSRF through the reauthorization of the federal Safe Drinking Water Act. The program is managed by both DOH and the Washington State Public Works Board. The purpose of the program is to provide low-interest loans to assist publicly- and privately-owed water systems improve drinking water and protect public health. Eligible publicly owned water systems include city and county governments, public utility districts, and special purpose districts. Privately owned systems are eligible as long as they are Group A systems. Eligible projects include the following:
• Water systems that exceed health standards; • Replacement of aging infrastructure; • Acquisition of real property; • Planning and design costs; • Water conservation projects; • Reservoirs (clear wells) that are part of a treatment process; • Distribution reservoirs (finished water); • Existing systems who chose to connect to a municipal system; • Upgrade to or creation of a Group A system.
Maximum award per single water system is $12,000,000 and for combining systems an award of $24,000,000 is available. These loans are often allowed a high level of forgiveness if the system is consolidated due to water quality issues. A summary of interest rates and loan terms is summarized in Table 9-5.

Gray & Osborne Inc., Consulting Engineers
9-14 City of Oak Harbor September 2014 2013 Water System Plan Update
TABLE 9-5
DWSRF Loan Terms
Applicant’s Income Level Interest Rate(1)
Principal Forgiveness
Loan Fee
Repayment period(2)
Water system is not economically disadvantaged. 1.5% - 1.0% 20 years Water system with an affordability index between 1.5 percent and 2.0 percent. 1.0% - 1.0% 20 years
Water system with an affordability index between 2.01 percent and 3.5 percent. 1.0% 30.0% - 20 years
Water system with an affordability index greater than 3.5 percent. 1.0% 50.0% - 20 years
Eligible restructuring/consolidation projects proposed for municipal Group A water systems. Projects must result in a change in ownership prior to signing the funding contract.
1.0% 50.0% - 20 years
(1) Interest rates are fixed. (2) Payment period shall be 20 years or the life of the project, whichever is shorter. BONDS The City has the authority to sell several types of bonds that would be appropriate for capital projects: revenue, general obligation, limited general obligation and local improvement district bonds. In general, bonds are a more costly form of funding capital projects than grants and low-interest loans from the State, but the timing is controlled by the City. No federal environmental documentation associated with the national Environmental Policy Act, Endangered Species Act, or National Historic Presentation Act is required. Revenue Bonds The most common source of funds for construction of major utility improvements is the sale of revenue bonds. Thessee are tax-free bonds issued by a city. The major source of funds for debt service on revenue bonds is from monthly sewer service charges. In order to qualify to sell revenue bonds marketable to investors, the bonds typically contain contractual provisions for the city to meet debt coverage requirements. The City must show that its annual net operating income (gross income less operation and maintenance expenses) is equal to or greater than a factor, typically 1.2 to 1.4 times the annual debt service on all debt. If a coverage factor has not been specified it will be determined at the time of any future bond issues. General Obligation Bonds A city may by council action or special election issue general obligation bonds to finance almost any projects of general benefit to the city. The bonds are repaid by tax

Gray & Osborne Inc., Consulting Engineers
City of Oak Harbor 9-15 2013 Water System Plan Update September 2014
assessments levied against all privately owned properties within the city. This includes vacant property that would not otherwise contribute to the cost of the specific improvements. This type of bond issue is usually reserved for municipal improvements that are of general benefit to the public, such as arterial streets, bridges, lighting, municipal buildings, firefighting equipment, parks, and water and wastewater facilities. General obligation bonds are the most attractive bonds to investors because they are backed by the municipality’s full taxing authority and carry the lowest rate of interest of any type of bond that a city may issue. Disadvantages of general obligation bonds include the following:
• Voter approval is often required. The city will incur the legal costs of drafting a ballot measure and pay for the cost of holding a special election. There is also the additional cost of investing staff time in public education of the need for the project, yet there is always uncertainty to the outcome of elections.
• There are legal, as well as practical limits on the amount of general
obligation debt a city can issue. Financing capital improvements through general obligation debt reduces the ability of the city to issue additional general obligation debt, which is often the only source of outside financing for many general government facilities.
OTHER FUNDING OPPORTUNITIES UTILITY LOCAL IMPROVEMENT DISTRICTS (ULIDS) Another potential source of funds for improvements can be obtained through the formation of ULIDs involving a special assessment made against properties benefiting by the improvements. ULID bonds are further backed by a legal claim to the revenues generated by the utility, similar to revenue bonds. Typically, ULIDs are formed by the city at the written request (by petition) of the property owners within a specific section of the city’s service area. Upon receipt of a sufficient number of signatures or petitions, and acceptance by the city council, the local improvement area is formed. Each separate property in the ULID is assessed in accordance with the special benefits the property receives from the water system improvements. A citywide ULID could form part of a financing package for large-scale capital projects that benefit all residents in the service area. The assessment places a lien on the property that must be paid in full upon sale of the property. ULID participants have the option of paying their assessment immediately upon receipt, thereby reducing the portion of the costs financed by the ULID bonds.

Gray & Osborne Inc., Consulting Engineers
9-16 City of Oak Harbor September 2014 2013 Water System Plan Update
The advantages of ULID financing, as opposed to rate financing, to the property owner include:
• The ability to avoid interest costs by early payment of assessments. • If the ULID assessment is paid in installments, it may be eligible to be
deducted from federal income taxes. • Low-income senior citizens may be able to defer assessment payments
until the property is sold. • Some Community Block Grant funds are available to property owners
with incomes near or below poverty level. Funds are available only to reduce assessments.
The major disadvantage to the ULID process is that it may be politically difficult to approve formation. The ULID process may be stopped if 40 percent of the property owners protest its formation. Also, there are significant legal and administrative costs associated with the ULID process, which increases total project costs by approximately 30 percent over other financing options.

APPENDIX A
DOH INFORMATION AND WATER FACILITIES INVENTORY

Water System Plan Submittal Form
This form must be completed and submitted along with the Water System Plan (WSP). It will expedite review and approval of your WSP. All water systems should contact their regional planner before developing any planning document for submittal.
OAK HARBOR, CITY OF 62650 CITY OF OAK HARBOR
1. Water System Name PWS ID# or Owner ID# System Owner Name ARNOLD PETERSCHMIDT, P.E. ENGINEER
Contact Name for Utility Phone Number Title 865 SE BARRINGTON DR. OAK HARBOR WA, 98277
Contact Address City State Zip RUSSELL PORTER, P.E. (206) 284-0860 PRINCIPAL
2. Project Engineer Phone Number Title 701 DEXTER AVE N. SUITE 200
SEATTLE WA, 98109
Project Engineer Address City State Zip
3. Billing Contact Name (required if not the same as #4) Billing Phone Number Billing Fax Number
Billing Address City State Zip
4. How many services are presently connected to the system? ~5,863
5. Is the system expanding? (seeking to extend service area or increase number of approved connections) Yes No
6. If number of services is expected to increase, how many new connections are proposed in the next six years? > 500
7. If the system is private-for-profit, is it regulated by the State Utilities and Transportation Commission? Yes No
8. Is the system located in a Critical Water Supply Service Area (i.e., have a Coordinated Water System Plan)? Yes No
9. Is the system a customer of a wholesale water purveyor? Yes No
10. Will the system be pursuing additional water rights from the State Department of Ecology in the next twenty years? Yes No
11. Is the system proposing a new intertie? Yes No
12. Do you have projects currently under review by the Department of Health? Yes No
13. Are you requesting distribution main project report and construction document submittal exception, and if so, does the WSP contain standard construction specifications for distribution mains? Yes No
14. Are you requesting distribution related project report and construction document submittal exception, and if so, does the WSP contain distribution facilities design and construction standards, including internal engineering review procedures? Yes No
15. The purveyor is responsible for sending a copy of the WSP to adjacent utilities for review or a letter notifying them that a copy of the WSP is available for their review and where the review copy is located. Has this been completed? Yes No
16. The purveyor is responsible for sending a copy of the WSP to all local governments within the service area. (County and City Planning Departments, etc). Has this been completed? Yes No
17. Are you proposing a change in the place of use of your water right? Yes No
If answer to questions 7, 8, 11, 15and/or 16 is “yes,” list who you sent the WSP to: Island County, Island County Water Resources Advisory Council Is this plan: an Initial Submittal a Revised Submittal
Please enclose the following number of copies of the WSP: 3 copies for Northwest and Southwest Regional Offices OR 2 copies for Eastern Regional Office (We will send one copy to Ecology) 1 additional copy if you answered “yes” to question 7. 3 Total copies attached
Please return completed form to the Office of Drinking Water regional office checked below.
Northwest Drinking Water Operations Department of Health
20425 72nd Avenue South, Suite 310 Kent, WA 98032-2358
(253) 395-6750
Southwest Drinking Water Operations Department of Health
PO Box 47823 Olympia, WA 98504-7823
(360) 236-3030
Eastern Drinking Water Operations Department of Health
16201 East Indiana Avenue Suite 1500 Spokane Valley, WA 99216
(509) 329-2100
If you need this publication in an alternate format, call (800) 525-0127. For TTY/TDD, call (800) 833-6388. DOH Form 331-397 (Revised 11/11)

April 2008 Version 1
Water System Plan (WSP) Pre-Plan Agenda
City of Oak Harbor August, 2013
Required Content Description WSP Page #
Chapter 1 Description of Water System ( ) Ownership and management 1-1
( ) System history and background 1-2
( ) Inventory of existing facilities 1-3
( ) Related plans / Coordinated Water System Plan (CWSP) 1-30
( ) Information & Maps: Service area, identify retail service area(WAC 106), designated land use & zoning, future comprehensive plan request for changes to land use, agreements (interlocal, etc.)
Chapter 1
( ) Policies: Service area, SMA, conditions of service, annexation 1-32
( ) Duty to serve (WAC 106): identify process, timeframes, conditions, appeals 1-35
( ) Consistency from local planning (WAC 108) agency 1-36
( ? ) Consistency from local watershed planning group (Ecology comments) 1-36
Chapter 2 Basic Planning Data ( ) Current water use: Population, service connections, & ERUs and data reporting 2-1
( )
( )
Consecutive 6 & 20th year projections: Population, service connections, & ERUs Consecutive 6 & 20th year: Demand forecasts: w/ & w/o efficiency savings
2-13
( ) Total water loss percent and volume for Distribution System Leakage Standard 2-10
( )
( ) ( ? )
Monthly and annual production. Totals per source. Water supply characteristics. Annual usage by customer class. Demand characteristics. Annual usage for water supplied to other systems Historical total water loss (DSL) – percent and volumes
2-3
( ) >1000, seasonal variations in consumption by customer class 2-11
Chapter 3 System Analysis ( ) Capacity analysis with water right self assessment (cc to DOH per MOU) 3-16
( ) System design standards 3-1
( ) Water quality analysis 3-4
( )
( )
( )
( )
( )
System inventory, description and analysis Source Treatment Storage Distribution system/hydraulics
3-16
( ) Summary of system deficiencies 3-28
( ) Analysis of possible improvement projects 3-28
Chapter 5 Water Use Efficiency Program and Water Rights ( ) Water Use Efficiency Program-WAC 246-290-810 - describe program, goal(s),
public process, measures. Evaluate DSL, transmission leakage, Budget line item 5-1

April 2008 Version 2
Required Content Description WSP Page #
for measures. > 1,000 – Estimate past 6 years of water savings
( ) Source & Service Meters / or schedule w/activities to minimize leakage 5-7
( ) Water right self assessment for existing and 20-year projections App. B
( ) Water supply & demand characteristics, describe & discuss water use effect 5-10
( ? ) Source of supply analysis and evaluation of supply alternatives ( ? ) Interties
( ) ≥1,000 connections evaluate reclaimed water opportunities
Chapter 6 Source Water Protection (Check One or Both) ( ) Wellhead protection program 6-1
( ) Watershed control program
Chapter 7 Operation and Maintenance Program ( ) Water system management and personnel 7-1
( ) Operator certification 7-5
( ) Routine operating procedures and preventive maintenance 7-5
( ) Water quality sampling procedures & program – Identify WQ PN Requirements
( ) Coliform monitoring plan. Add groundwater rule narrative.
( ) Emergency program, water shortage plan, service reliability per WAC 246-290-420 7-15
Address sanitary survey findings
( ) Cross-connection control program. Summarize next actions to address. 7-33
( ) Recordkeeping, reporting, and customer complaint program 7-12
( ) Summary of O&M deficiencies
Chapter 7 Distribution Facilities Design & Construction Standards ( ? ) Standard construction specification for distribution mains App. H
Chapter 8 Improvement Program ( ) Capital improvement schedule for 6 and 20 years 8-1
Chapter 9 Financial Program ( ) ≥1000 connections – Balanced 1-year budget
( ) <1000 connections – Balanced 6-year budget, w/ Financial Viability-Feasibility 9-5
( ) Revenue and cash flow stability to fund capital and emergency improvements 9-5
( ) Evaluation of implementing rate structure that encourages water demand efficiency
9-2
APPEND. Miscellaneous Documents ( ) Meeting with consumers (date & description). Approval by EGB prior to DOH
approval (New MWL Change 1-37, App. J
( ) County/Adjacent Utility Correspondence 1-37, App. J
( ) ≥1000 connections - State Environmental Policy Act (SEPA) Determination ( ? ) Agreements (intertie, service area, franchise, etc.) ( ? ) Satellite Management Program


Table 1 WATER SYSTEM PLAN
WATER RIGHTS SELF ASSESSMENT EXISTING STATUS
PERMIT CERTIFICATE OR CLAIM #
NAME ON DOCUMENT
PRIORITY DATE
(List oldest first)
SOURCE NAME/
NUMBER
ANY PORTION
SUPPLEMENTAL?
(If yes, explain in footnote)
EXISTING WATER RIGHTS
EXISTING CONSUMPTION
CURRENT WATER RIGHT STATUS
(Excess/Deficiency)
Maximum Instantaneous
Flow Rate (Qi)
Maximum Annual
Volume (Qa)
Maximum Instantaneous
Flow Rate (Qi)
Maximum Annual
Volume (Qa)
Maximum Instantaneous
Flow Rate (Qi)
Maximum Annual
Volume (Qa)
G1-05858CWRIS City of Oak Harbor
3/6/1961 SO11 Well No.8 No 200 gpm 320 acre-ft 160 gpm 3 acre-ft 40 gpm 317 acre-ft
G1-05901CWRIS City of Oak Harbor
3/6/1961 SO12 Well No. 9 No 200 gpm 320acre-ft 50 gpm 1 acre-ft 150 gpm 319 acre-ft
G1-22778CWRIS City of Oak Harbor
12/27/1976 SO14 Well No. 11 No 180 gpm 290 acre-ft 160 gpm 3 acre-ft 20 gpm 287 acre-ft
TOTAL ************* ********* ********* ************* 580 gpm 930 acre-ft 370 gpm 7 acre-ft 210 gpm 923 acre-ft
INTERTIE NAME/ IDENTIFIER
NAME OF PURVEYOR PROVIDING WATER
EXISTING LIMITS ON INTERTIE USE
EXISTING CONSUMPTION
THROUGH INTERTIE
CURRENT INTERTIE SUPPLY STATUS (Excess/Deficiency)
Maximum Instantaneous
Flow Rate (Qi)
Maximum Annual
Volume (Qa)
Maximum Instantaneous
Flow Rate (Qi)
Maximum Annual
Volume (Qa)
Maximum Instantaneous
Flow Rate (Qi)
Maximum Annual
Volume (Qa)
1. 02200CANACORTES City of Anacortes - 3,068 acre-ft - 2,198 acre-ft - 870 acre-ft TOTAL ***************************************
****
PENDING WATER RIGHT APPLICATION (New/Change) NAME ON APPLICATION DATE
SUBMITTED
ANY PORTION SUPPLEMENTAL? (If yes,
explain in footnote)
PENDING WATER RIGHTS Maximum Instantaneous Flow
Rate (Qi) Requested Maximum Annual Volume (Qa)
Requested 1. 2. 3. 4.
If you need this publication in an alternate format, call (800) 525-0127. For TTY/TDD call (800) 833-6388.
DOH Form 331-371 (Updated 08/10)
To return form, please see reverse side.

Please return completed form to the Office of Drinking Water regional office checked below.
Northwest Drinking Water Department of Health
20425 72nd Ave S, Suite 310 Kent, WA 98032-2358 Phone: (253) 395-6750
Fax: (253) 395-6760
Southwest Drinking Water Department of Health
PO Box 47823 Olympia, WA 98504-7823
Phone: (360) 236-3030 Fax: (360) 664-8058
Eastern Drinking Water Department of Health
16201 E Indiana Ave, Suite 1500 Spokane Valley, WA 99216
Phone: (509) 329-2100 Fax: (509) 329-2104

Table 2
WATER SYSTEM PLAN
WATER RIGHTS SELF ASSESSMENT 6 YEAR FORECAST
PERMIT CERTIFICATE OR CLAIM #
NAME ON DOCUMENT
PRIORITY DATE
(List oldest first)
SOURCE NAME/
NUMBER
ANY PORTION SUPPLEMENTAL?
(If yes, explain in footnote)
EXISTING WATER RIGHTS
FORECASTED WATER USE FROM SOURCES (6-year Demand)
FORECASTED WATER RIGHT STATUS
(Excess/Deficiency) Maximum
Instantaneous Flow Rate
(Qi)
Maximum Annual
Volume (Qa)
Maximum Instantaneous
Flow Rate (Qi)
Maximum Annual Volume
(Qa)
Maximum Instantaneo
us Flow Rate (Qi)
Maximum Annual
Volume (Qa)
G1-05858CWRIS City of Oak Harbor
3/6/1961 SO11 Well No.8 No 200 gpm 320 acre-ft 160 gpm 3 acre-ft 40 gpm 317 acre-ft
G1-05901CWRIS City of Oak Harbor
3/6/1961 SO12 Well No. 9 No 200 gpm 320acre-ft 50 gpm 1 acre-ft 150 gpm 319 acre-ft
G1-22778CWRIS City of Oak Harbor
12/27/1976 SO14 Well No. 11 No 180 gpm 290 acre-ft 160 gpm 3 acre-ft 20 gpm 287 acre-ft
TOTAL ************** ********* ********* **************** 580 gpm 930 acre-ft 370 acre-ft 7 acre-ft 210 acre-ft 923 acre-ft
INTERTIE NAME/ IDENTIFIER
NAME OF PURVEYOR PROVIDING WATER
EXISTING LIMITS ON INTERTIE USE
FORECASTED CONSUMPTION THROUGH
INTERTIE
FORECASTED INTERTIE SUPPLY STATUS
(Excess/Deficiency)
Maximum Instantaneous Flow Rate (Qi)
Maximum Annual
Volume (Qa)
Maximum Instantaneous Flow Rate (Qi)
Maximum Annual Volume
(Qa)
Maximum Instantaneo
us Flow Rate (Qi)
Maximum Annual Volume
(Qa)
1. 02200C/ANACORTES City of Anacortes - 3,068 acre-ft - 2,777 acre-ft - 291 acre-ft TOTAL ********************************************
PENDING WATER RIGHT APPLICATION (New/Change)
NAME ON APPLICATION DATE
SUBMITTED
ANY PORTION SUPPLEMENTAL? (If yes,
explain in footnote)
PENDING WATER RIGHTS
Maximum Instantaneous Flow Rate (Qi) Requested
Maximum Annual Volume (Qa) Requested
1.
2.
3.
4.
If you need this publication in an alternate format, call (800) 525-0127. For TTY/TDD call (800) 833-6388.
DOH Form 331-372 (Updated 08/10) To return form, please see reverse side.

Please return completed form to the Office of Drinking Water regional office checked below.
Northwest Drinking Water Department of Health
20425 72nd Ave S, Suite 310 Kent, WA 98032-2358 Phone: (253) 395-6750
Fax: (253) 395-6760
Southwest Drinking Water Department of Health
PO Box 47823 Olympia, WA 98504-7823
Phone (360) 236-3030 Fax: (360) 664-8058
Eastern Drinking Water Department of Health
16201 E Indiana Ave, Suite 1500 Spokane Valley, WA 99216
Phone: (509) 329-2100 Fax: (509) 329-2104

Table 3
WATER SYSTEM PLAN
WATER RIGHTS SELF ASSESSMENT 20 YEAR FORECAST
PERMIT CERTIFICATE OR CLAIM #
NAME ON DOCUMENT
PRIORITY DATE
(List oldest first)
SOURCE NAME/
NUMBER
ANY PORTION SUPPLEMENTAL?
(If yes, explain in footnote)
EXISTING WATER RIGHTS
FORECASTED WATER USE FROM SOURCES
(20-year Demand)
FORECASTED WATER RIGHT STATUS
(Excess/Deficiency)
Maximum Instantaneous Flow Rate (Qi)
Maximum Annual
Volume (Qa)
Maximum Instantaneous Flow Rate (Qi)
Maximum Annual
Volume (Qa)
Maximum Instantaneous Flow Rate (Qi)
Maximum Annual
Volume (Qa)
G1-05858CWRIS City of Oak Harbor
3/6/1961 SO11 Well No.8 No 200 gpm 320 acre-ft 160 gpm 3 acre-ft 40 gpm 317 acre-ft
G1-05901CWRIS City of Oak Harbor
3/6/1961 SO12 Well No. 9 No 200 gpm 320acre-ft 50 gpm 1 acre-ft 150 gpm 319 acre-ft
G1-22778CWRIS City of Oak Harbor
12/27/1976 SO14 Well No. 11 No 180 gpm 290 acre-ft 160 gpm 3 acre-ft 20 gpm 287 acre-ft
TOTAL ************** ********* ********* **************** 580 gpm 930 acre-ft 370 acre-ft 7 acre-ft 210 acre-ft 923 acre-ft
INTERTIE NAME/ IDENTIFIER
NAME OF PURVEYOR PROVIDING WATER
EXISTING LIMITS ON INTERTIE USE
FORECASTED CONSUMPTION
THROUGH INTERTIE
FORECASTED INTERTIE SUPPLY
STATUS (Excess/Deficiency)
Maximum Instantaneous Flow Rate (Qi)
Maximum Annual
Volume (Qa)
Maximum Instantaneous Flow Rate (Qi)
Maximum Annual
Volume (Qa)
Maximum Instantaneous Flow Rate (Qi)
Maximum Annual
Volume (Qa)
1. 02200C/ANACORTES City of Anacortes - 3,068 acre-ft - 3,289 acre-ft - (221) acre-ft (1)
TOTAL ********************************************
PENDING WATER RIGHT APPLICATION (New/Change)
NAME ON APPLICATION DATE
SUBMITTED
ANY PORTION SUPPLEMENTAL? (If yes,
explain in footnote)
PENDING WATER RIGHTS
Maximum Instantaneous Flow Rate (Qi) Requested
Maximum Annual Volume (Qa) Requested
1.
2.
3.
4.
(1) The water agreement between the City of Oak Harbor and the City of Anacortes is renegotiated at least every three years. It is presumed that the contract will be amended prior to 2033 (20-year planning period) to provide adequate water for the City of Oak Harbor.
If you need this publication in an alternate format, call (800) 525-0127. For TTY/TDD call (800) 833-6388.
DOH Form 331-373 (Updated 08/10) To return form, please see reverse side.

Please return completed form to the Office of Drinking Water regional office checked below.
Northwest Drinking Water Department of Health
20425 72nd Ave S, Suite 310 Kent, WA 98032-2358 Phone: (253) 395-6750
Fax: (253) 395-6760
Southwest Drinking Water Department of Health
PO Box 47823 Olympia, WA 98504-7823
Phone (360) 236-3030 Fax: (360) 664-8058
Eastern Drinking Water Department of Health
16201 E Indiana Ave, Suite 1500 Spokane Valley, WA 99216
Phone: (509) 329-2100 Fax: (509) 329-2104

WAC 197-11-960 Environmental checklist.
ENVIRONMENTAL CHECKLIST Purpose of checklist: The State Environmental Policy Act (SEPA), chapter 43.21C RCW, requires all governmental agencies to consider the environmental impacts of a proposal before making decisions. An environmental impact statement (EIS) must be prepared for all proposals with probable significant adverse impacts on the quality of the environment. The purpose of this checklist is to provide information to help you and the agency identify impacts from your proposal (and to reduce or avoid impacts from the proposal, if it can be done) and to help the agency decide whether an EIS is required. Instructions for applicants: This environmental checklist asks you to describe some basic information about your proposal. Governmental agencies use this checklist to determine whether the environmental impacts of your proposal are significant, requiring preparation of an EIS. Answer the questions briefly, with the most precise information known, or give the best description you can. You must answer each question accurately and carefully, to the best of your knowledge. In most cases, you should be able to answer the questions from your own observations or project plans without the need to hire experts. If you really do not know the answer, or if a question does not apply to your proposal, write "do not know" or "does not apply." Complete answers to the questions now may avoid unnecessary delays later. Some questions ask about governmental regulations, such as zoning, shoreline, and landmark designations. Answer these questions if you can. If you have problems, the governmental agencies can assist you. The checklist questions apply to all parts of your proposal, even if you plan to do them over a period of time or on different parcels of land. Attach any additional information that will help describe your proposal or its environmental effects. The agency to which you submit this checklist may ask you to explain your answers or provide additional information reasonably related to determining if there may be significant adverse impact. Use of checklist for nonproject proposals: Complete this checklist for nonproject proposals, even though questions may be answered "does not apply." IN ADDITION, complete the SUPPLEMENTAL SHEET FOR NONPROJECT ACTIONS (part D). For nonproject actions, the references in the checklist to the words "project," "applicant," and "property or site" should be read as "proposal," "proposer," and "affected geographic area," respectively. A. BACKGROUND 1. Name of proposed project, if applicable:
City of Oak Harbor Water System Plan 2. Name of applicant:
City of Oak Harbor 3. Address and phone number of applicant and contact person:
Mr. Arnold Peterschmidt P.E. City of Oak Harbor Project Engineer 865 SE Barrington Drive Oak Harbor, WA 98277
(360) 279-4520 4. Date checklist prepared:
February 27, 2014 5. Agency requesting checklist:
City of Oak Harbor 6. Proposed timing or schedule (including phasing, if applicable):

2
Water System Plan to obtain regulatory approval and adoption by the City in the spring of 2014. Projects are identified for construction over 6-and 20-year planning periods. Separate project specific SEPA checklists will be prepared for projects included in the Plan prior to construction.
7. Do you have any plans for future additions, expansion, or further activity related to or connected with this proposal? If yes, explain. None at this time. 8. List any environmental information you know about that has been prepared, or will be prepared, directly related to this proposal.
Chapter 1 of the Plan evaluates the sensitive areas, including groundwater, within the City. 9. Do you know whether applications are pending for governmental approvals of other proposals directly affecting the property covered by your proposal? If yes, explain.
None at this time. 10. List any government approvals or permits that will be needed for your proposal, if known.
Washington State Department of Health approval will be required for certain projects as defined by DOH guidelines. Ecology approval will be required for projects affecting groundwater or buried aquifer disturbance. Project specific permits may include federal, state, local, and/or construction permits, which will be obtained prior to construction.
11. Give brief, complete description of your proposal, including the proposed uses and the size of the project and site. There are several questions later in this checklist that ask you to describe certain aspects of your proposal. You do not need to repeat those answers on this page. (Lead agencies may modify this form to include additional specific information on project description.)
The City’s Water System Plan is a planning document describing the location and types of facilities needed to provide water service to the study area in order to meet projected needs for at least the 20-year planning period. The proposal provides a method of implementation of the various prioritized components, each of which will require environmental evaluations and assessments as the projects are designed and implemented in their various phases.
12. Location of the proposal. Give sufficient information for a person to understand the precise location of your proposed project, including a street address, if any, and section, township, and range, if known. If a proposal would occur over a range of area, provide the range or boundaries of the site(s). Provide a legal description, site plan, vicinity map, and topographic map, if reasonably available. While you should submit any plans required by the agency, you are not required to duplicate maps or detailed plans submitted with any permit applications related to this checklist.
The City is located in central Whidbey Island along Highway 20 and borders both Oak Harbor and Crescent Harbor. The City is located in Townships 32N and 33N, Ranges 1E and 2E, with Sections varying by location.

3
B. ENVIRONMENTAL ELEMENTS 1. Earth a. General description of the site (circle one): Flat, rolling, hilly, steep slopes, mountainous, other . . . . . .
The general description of the City is flat and rolling. b. What is the steepest slope on the site (approximate percent slope)?
The steepest slope is approximately 15 percent. c. What general types of soils are found on the site (for example, clay, sand, gravel, peat, muck)? If you know the
classification of agricultural soils, specify them and note any prime farmland. A majority of the soils present in the area are of the Everett Alderwood Complex or Whidbey-Hoypus Complex with select regions of Coveland loam. Figure 1-10 shows a full soil classification map of the region.
d. Are there surface indications or history of unstable soils in the immediate vicinity? If so, describe.
None associated with the Plan. Project specific soil stability analyses will be completed prior to project construction. e. Describe the purpose, type, and approximate quantities of any filling or grading proposed. Indicate source of fill. No filling or grading of any significance is associated with the Plan. f. Could erosion occur as a result of clearing, construction, or use? If so, generally describe.
No erosion is associated with the Plan. Project construction work identified in the Plan will include protective measures and current best management practices for possible minor erosion problems.
g. About what percent of the site will be covered with impervious surfaces after project construction (for example, asphalt
or buildings)? An individual SEPA review will be performed for individual proposed construction projects. h. Proposed measures to reduce or control erosion, or other impacts to the earth, if any: Individual project construction specifications will address additional erosion control measures. 2. Air a. What types of emissions to the air would result from the proposal (i.e., dust, automobile, odors, industrial wood smoke)
during construction and when the project is completed? If any, generally describe and give approximate quantities if known.
No impacts to air are associated with preparation of the Plan. b. Are there any off-site sources of emissions or odor that may affect your proposal? If so, generally describe.
No off-site emission sources are associated with the Plan. c. Proposed measures to reduce or control emissions or other impacts to air, if any:
Not applicable.

4
3. Water a. Surface:
1) Is there any surface water body on or in the immediate vicinity of the site (including year-round and seasonal streams, saltwater, lakes, ponds, wetlands)? If yes, describe type and provide names. If appropriate, state what stream or river it flows into. The City is located on Whidbey Island and is influenced by the waters in Puget Sound. The City immediately borders both Oak Harbor and Crescent Harbor. The Island has had some minor issues with saltwater intrusion to groundwater in locations, but currently, the City obtains a vast majority of its drinking water from the City of Anacortes.
2) Will the project require any work over, in, or adjacent to (within 200 feet) the described waters? If yes, please describe and attach available plans. No work associated with the Plan is associated with the above-listed water bodies. It is possible that select construction projects will take place near the above described waters. The impact to nearby water bodies for individual projects described in the Plan will be determined on a project specific basis through the appropriate permitting process. Shoreline permitting consistent with the City’s master plan will be obtained for construction projects identified in the Plan that will occur within 200 feet of Puget Sound.
3) Estimate the amount of fill and dredge material that would be placed in or removed from surface water or wetlands and indicate the area of the site that would be affected. Indicate the source of fill material. No dredging or filling is associated with preparation of the Plan.
4) Will the proposal require surface water withdrawals or diversions? Give general description, purpose, and approximate quantities if known. No withdrawals or diversions are associated with preparation of the Plan.
5) Does the proposal lie within a 100-year floodplain? If so, note location on the site plan. It is possible that select projects will take place in a flood plain. Each of these projects and their location relative to the 100-year floodplain are described in the Plan and will be determined on a project specific basis.
6) Does the proposal involve any discharges of waste materials to surface waters? If so, describe the type of waste
and anticipated volume of discharge. The Plan identifies construction projects and measures the City will take to maintain compliance with its green operating permit and classification as a Type A water system. No waste discharges to surface waters are proposed.
b. Ground:
1) Will ground water be withdrawn, or will water be discharged to ground water? Give general description, purpose, and approximate quantities if known.
No groundwater impacts are associated with preparation of the Plan.
2) Describe waste material that will be discharged into the ground from septic tanks or other sources, if any (for example: Domestic sewage; industrial, containing the following chemicals. . . ; agricultural; etc.). Describe the general size of the system, the number of such systems, the number of houses to be served (if applicable), or the number of animals or humans the system(s) are expected to serve. No waste is generated in preparation of the Plan. A vast majority of the City’s residents are connected to the City sanitary system and do not rely on septic tanks. Sanitary waste is treated at the City’s wastewater treatment plant.
c. Water runoff (including stormwater):

5
1) Describe the source of runoff (including storm water) and method of collection and disposal, if any (include quantities, if known). Where will this water flow? Will this water flow into other waters? If so, describe. No stormwater impacts are associated with preparation of the Plan. Methods of collection, treatment (if applicable) and disposal of stormwater will be determined for projects identified in the Plan on a project specific basis.
2) Could waste materials enter ground or surface waters? If so, generally describe.
Waste materials could enter groundwater through one of the City’s three wells. These wells are kept under surveillance, and clearly marked. There are no industrial activities or entities within the 10-year ZOCs for any of the three wells. Residents living within the 10-year ZOC have been notified through written correspondence that their actions may affect groundwater quality. Additional information is provided in Chapter 6 of the Plan.
d. Proposed measures to reduce or control surface, ground, and runoff water impacts, if any:
In general, best management practices will be employed to limit water impacts, but the specific measures to reduce and control surface, ground, or storm water will be project specific.
4. Plants a. Check or circle types of vegetation found on the site: X deciduous tree: red alder, big-leaf maple, willow, garry oak X evergreen tree: Douglas fir, Western red cedar, hemlock, Grand fir X shrubs: ocean spray, salmonberry, Oregon grape, snowberry X grass: colonial bentgrass, orchard grass, tall fescue X pasture: alfalfa, barley _ crop or grain: X wet soil plants: reed canyongrass, soft rush, salmonberry X water plants: water parsley, lesser duck weed X other types of vegetation b. What kind and amount of vegetation will be removed or altered? No vegetation was removed or altered as a result of the Plan. Affected vegetation will vary depending on the specific project. c. List threatened or endangered species known to be on or near the site. None known. d. Proposed landscaping, use of native plants, or other measures to preserve or enhance
vegetation on the site, if any: Vegetation will vary depending on the specific project.
5. Animals a. Circle any birds and animals which have been observed on or near the site or are known to be on or near the site: The following animals are present within the City:
birds: hawk, eagle, ducks, songbirds, geese mammals: deer, coyote, rabbits, rodents reptiles: snakes, alligator lizards amphibians: frogs, salamanders

6
fish: salmon, trout b. List any threatened or endangered species known to be on or near the site.
Puget Sound chinook salmon, steelhead, and bulltrout are listed as “threatened” under the Endangered Species Act. Several Puget Sound rockfish are listed as “threatened” or “endangered” in the Strait of Juan de Fuca. ORCA resident southern pod is listed as “endangered”.
c. Is the site part of a migration route? If so, explain.
Waterfowl, shorebirds, and neotropical migrants pass through the area. In addition, waterfowl and wintering raptors may occur within the water system area.
d. Proposed measures to preserve or enhance wildlife, if any:
SEPA reviews will be performed on each proposed construction project identified in the Plan as required. Projects identified in the Plan will observe critical area setbacks to protect sensitive fish and wildlife habitat.
6. Energy and natural resources a. What kinds of energy (electric, natural gas, oil, wood stove, solar) will be used to meet the completed project's energy
needs? Describe whether it will be used for heating, manufacturing, etc. No energy needs were associated with preparation of the Plan.
b. Would your project affect the potential use of solar energy by adjacent properties? If so, generally describe.
No. c. What kinds of energy conservation features are included in the plans of this proposal? List other proposed measures
to reduce or control energy impacts, if any: High efficiency pumps and energy efficient building materials will be used where applicable. Construction activities will be streamlined to minimize fossil fuel use where possible.
7. Environmental health a. Are there any environmental health hazards, including exposure to toxic chemicals, risk of fire and explosion, spill, or
hazardous waste, that could occur as a result of this proposal? If so, describe. No hazards are associated with preparation of the Plan.
1) Describe special emergency services that might be required. None anticipated.
2) Proposed measures to reduce or control environmental health hazards, if any: All industrial safety standards associated with design, construction, and operation of facilities identified in the Plan will be observed.
b. Noise
1) What types of noise exist in the area which may affect your project (for example: traffic, equipment, operation, other)?
Ambient noise is primarily from traffic and is not anticipated to affect the projects listed in the Plan.

7
2) What types and levels of noise would be created by or associated with the project on a short-term or a long-term basis (for example: traffic, construction, operation, other)? Indicate what hours noise would come from the site. No noise was associated with preparation of the Plan. During construction of any of the proposed projects, noise from equipment will be generated from the site. Construction work will typically occur between the hours of 7:00 AM (PST) and 6:00 PM (PST) from Monday through Friday.
3) Proposed measures to reduce or control noise impacts, if any:
For construction projects identified in the Plan, noise reduction methods will be based on individual project requirements, but will generally include proper operation of noise reduction technology for pumps and motors, and limiting work and special construction traffic hours between 7:00 AM and 5:00 PM, Monday through Friday.
8. Land and shoreline use a. What is the current use of the site and adjacent properties?
Land use in the City’s service area includes residential, commercial, military, and agricultural activities. b. Has the site been used for agriculture? If so, describe.
Not applicable to development of the Plan, no significantly producing agricultural areas exist within the service area. c. Describe any structures on the site.
Existing distribution system projects and associated structures are described in Chapter 1, and proposed facilities are discussed in Chapter 8 of the Plan.
d. Will any structures be demolished? If so, what?
No structures were demolished in preparation of the Plan. The Eastside Reservoir is schedule for demolition in either 2014 or 2015. Additional details for this project are given in Chapter 1 and Chapter 8 of the Plan.
e. What is the current zoning classification of the site?
Zoning of the individual project sites is variable. A combination of areas zoned residential, commercial, and mixed-use contain individual projects. .
f. What is the current comprehensive plan designation of the site?
The comprehensive plan designation for areas containing system projects will be determined on an individual project basis. SEPA reviews will be performed on each proposed project as required.
g. If applicable, what is the current shoreline master program designation of the site? SEPA, shoreline, and master plan consistency reviews will be performed on each proposed project identified in the Plan. h. Has any part of the site been classified as an "environmentally sensitive" area? If so, specify.
SEPA reviews will be performed on each proposed project as required. The City’s service area includes sensitive areas, but none associated with preparation of the Plan.
i. Approximately how many people would reside or work in the completed project? This number will be determined by the individual project. The population of the City’s retail service area is approximately 18,800.

8
j. Approximately how many people would the completed project displace? None. k. Proposed measures to avoid or reduce displacement impacts, if any: None. l. Proposed measures to ensure the proposal is compatible with existing and projected land uses and plans, if any:
The Plan will be reviewed by all applicable land use authorities for compatibility. 9. Housing a. Approximately how many units would be provided, if any? Indicate whether high, middle, or low-income housing. Not applicable. b. Approximately how many units, if any, would be eliminated? Indicate whether high, middle, or low-income housing. Not applicable. c. Proposed measures to reduce or control housing impacts, if any: Not applicable. 10. Aesthetics a. What is the tallest height of any proposed structure(s), not including antennas; what is the principal exterior building
material(s) proposed? No proposed structures are associated with preparation of the Plan. SEPA reviews will be performed on each proposed construction project identified in the Plan as required.
b. What views in the immediate vicinity would be altered or obstructed? No views were impacted during preparation of the Plan. c. Proposed measures to reduce or control aesthetic impacts, if any:
Sites disturbed by construction activities identified in the Plan will be restored to their original condition as much as possible. 11. Light and glare a. What type of light or glare will the proposal produce? What time of day would it mainly occur?
No light or glare was associated with the preparation of the Plan. No light or glare issues are anticipated for the individual construction projects, but impacts from light and/or glare will be assessed at the time of construction.
b. Could light or glare from the finished project be a safety hazard or interfere with views?
No impacts are associated with preparation of the Plan. Light or glare impacts are not anticipated with any of the proposed construction projects.
c. What existing off-site sources of light or glare may affect your proposal? None anticipated.

9
d. Proposed measures to reduce or control light and glare impacts, if any: None anticipated. 12. Recreation a. What designated and informal recreational opportunities are in the immediate vicinity?
Recreational opportunities in the area include boating, hiking, diving, fishing, hunting, and bird watching, among others. b. Would the proposed project displace any existing recreational uses? If so, describe.
Preparation of the Plan did not displace any recreational activities. Impacts to activities from proposed construction projects will be evaluated on an individual project basis.
c. Proposed measures to reduce or control impacts on recreation, including recreation opportunities to be provided by
the project or applicant, if any: None measures required for preparation of the Plan. Proposed construction projects will be designed to minimize the impact to recreational activities.
13. Historic and cultural preservation a. Are there any places or objects listed on, or proposed for, national, state, or local preservation registers known to be
on or next to the site? If so, generally describe. None known or anticipated in association with preparing this Plan.
b. Generally describe any landmarks or evidence of historic, archaeological, scientific, or cultural importance known to
be on or next to the site. None known or anticipated. Archaeological resources are known to exist within the retail service area of the City of Oak Harbor. c. Proposed measures to reduce or control impacts, if any:
No impacts are associated with preparation of the Plan. Proposed construction projects in the Plan will undergo either an NHPA Section 106 Consultation or Governors EO05-05 review prior to construction. The City has established an Unintended Discovery Protocol that will be enacted in the event any culturally sensitive materials are discovered. The City has also included contingency funds in each CIP project to deal with any unexpected discoveries.
14. Transportation a. Identify public streets and highways serving the site, and describe proposed access to the existing street system. Show
on site plans, if any. Distribution system projects identified in the Plan must be considered on an individual project basis.
b. Is site currently served by public transit? If not, what is the approximate distance to the nearest transit stop? Transit access will be considered on an individual project basis. The City is served by Island Transit. c. How many parking spaces would the completed project have? How many would the project eliminate?
Impacts to parking are not associated with preparation of the Plan. Parking will be considered on an individual project basis. d. Will the proposal require any new roads or streets, or improvements to existing roads or streets, not including
driveways? If so, generally describe (indicate whether public or private). The proposed projects included in the Plan do not anticipate the need for new roads or streets.


11
D. SUPPLEMENTAL SHEET FOR NONPROJECT ACTIONS
Do not use this sheet for project actions. Because these questions are very general, it may be helpful to read them in conjunction
with the list of the elements of the environment. When answering these questions, be aware of the extent the proposal, or the types of
activities likely to result from the proposal, would affect the item at a greater intensity or at a faster rate than if the proposal were not implemented. Respond briefly and in general terms.
1. How would the proposal be likely to increase discharge to water; emissions to air; production, storage, or release of
toxic or hazardous substances; or production of noise? The proposal will allow development within the retail service area per the City of Oak Harbor and Island County land use plans. Use or involvement with hazardous substances is not anticipated. Temporary increases in air and/or noise emissions during construction of projects described in the Plan are expected to occur, but their impacts are not expected to be significant.
Proposed measures to avoid or reduce such increases are:
Minimizing machinery operations and vehicle idling during construction and project planning with City and construction personnel should limit the impact of noise and air emissions. Construction best management practices for the control of erosion will be implemented to minimize impacts to surface and groundwater.
2. How would the proposal be likely to affect plants, animals, fish, or marine life?
Storm water runoff, dust, and noise pollution could occur during construction activities. Their impact will be controlled implementation of current best management practices (BMPs) and is expected to be minimal.
Proposed measures to protect or conserve plants, animals, fish, or marine life are:
Comprehensive sediment and erosion control planning for construction projects should limit the effect, if any, of dust and stormwater runoff.
3. How would the proposal be likely to deplete energy or natural resources?
New pumps, pumping facilities, or water reclamation facility modifications would require electrical power. Additionally, vehicles associated with construction would consume fossil fuels.
Proposed measures to protect or conserve energy and natural resources are:
New pumps and/or motors will be designed to be as efficient as possible, and construction activities will be thoroughly planned and coordinated to minimize vehicle usage. Proposed conveyance and treatment systems will be designed to flow by gravity as much as possible, and new, energy efficient pump and blower models will be specified.
4. How would the proposal be likely to use or affect environmentally sensitive areas or
areas designated (or eligible or under study) for governmental protection; such as parks, wilderness, wild and scenic rivers, threatened or endangered species habitat, historic or cultural sites, wetlands, floodplains, or prime farmlands?
The proposed Plan is consistent with applicable land use plans, which address environmentally sensitive areas such as those listed above.
Proposed measures to protect such resources or to avoid or reduce impacts are:

12
1. The City will coordinate with its cultural liaison and local tribal authorities prior to individual project initiation. Critical area setbacks will be observed during planning and construction of projects identified in the Plan.
5. How would the proposal be likely to affect land and shoreline use, including whether it
would allow or encourage land or shoreline uses incompatible with existing plans? The proposal is consistent with applicable land use plans, which address shoreline areas. The projects identified in the Plan will support existing land uses and planned development within the service area through the 6- and 20-year planning period but do not encourage uses incompatible with existing plans.
Proposed measures to avoid or reduce shoreline and land use impacts are: Projects identified in the Plan will undergo shoreline and critical area land-use reviews as required by state and local regulations.
6. How would the proposal be likely to increase demands on transportation or public
services and utilities? The proposal addresses the provision of water delivery and distribution system development to serve future growth within the service area. Future development most likely will increase demands on transportation and public services and utilities.
Proposed measures to reduce or respond to such demand(s) are:
Construction projects identified in the Plan will include provisions for traffic control to minimize impacts or increases in demand on public transportation during construction.
7. Identify, if possible, whether the proposal may conflict with local, state, or federal laws or requirements for the
protection of the environment.
The proposal will be consistent with laws or requirements for environmental protection. All construction projects will undergo SEPA review (and NEPA review, if required) and will be reviewed by the appropriate federal, state, and local jurisdictions.

APPENDIX B
WATER SERVICE AGREEMENTS AND WATER RIGHTS

Wate
r R
ight
Tra
ckin
g S
yste
m
Depart
ment
of
Ecolo
gy
WR
Docum
ent
Lis
t S
ort
ed B
y P
riority
Date
Report
Report
ed B
y:
AR
HA
461
Report
Date
: 12/4
/2013
Fil
e #
Cert
#P
ers
on
Sta
tD
oc
Pri
ori
ty D
tP
urp
ose
Qi
UO
MQ
aIr
Acre
sW
RIA
Co
un
tyT
RS
/QS
rc's
1stS
rc
G1-*
05858C
WR
IS3967
Oak H
arb
or
City
AC
ert
3/6
/1961
MU
200
GP
M320
6IS
LA
ND
32.0
N 0
1.0
E 0
3
NE
/NW
1
WE
LL
G1-*
05901C
WR
IS4114
Oak H
arb
or
City
AC
ert
4/1
0/1
961
MU
200
GP
M320
6IS
LA
ND
32.0
N 0
1.0
E 0
3
1W
ELL
G1-*
08370C
WR
IS6201
Oak H
arb
or
City
AC
ert
10/2
7/1
966
MU
450
GP
M720
6IS
LA
ND
33.0
N 0
1.0
E 2
6
SW
/SE
1
WE
LL
G1-2
2778C
WR
IS
Oak H
arb
or
City
AC
ert
12/2
7/1
976
MU
180
GP
M290
6IS
LA
ND
32.0
N 0
1.0
E 0
3
SE
/NW
1
WE
LL
G1-0
0101P
WR
IS
Oak H
arb
or
City
IP
mt
9/2
7/1
971
MU
400
GP
M640
6IS
LA
ND
33.0
N 0
1.0
E 3
4
1W
ELL
G1-2
0913P
WR
IS
Oak H
arb
or
City
IP
mt
7/1
6/1
973
MU
500
GP
M800
6IS
LA
ND
33.0
N 0
1.0
E 3
6
1W
ELL
G1-2
0914P
WR
IS
Oak H
arb
or
City
IP
mt
7/1
6/1
973
MU
300
GP
M480
6IS
LA
ND
33.0
N 0
1.0
E 3
6
1W
ELL
G1-2
0915P
WR
IS
Oak H
arb
or
City
IP
mt
7/1
6/1
973
MU
100
GP
M160
6IS
LA
ND
33.0
N 0
1.0
E 3
5
1W
ELL
G1-2
0916P
WR
IS
Oak H
arb
or
City
IP
mt
7/1
6/1
973
MU
160
GP
M256
6IS
LA
ND
32.0
N 0
1.0
E 0
3
1W
ELL
TO
TA
L R
EC
OR
DS
: 9
SE
LE
CT
ION
CR
ITE
RIA
Regio
nN
ort
hw
est
Pers
on
%O
ak H
arb
or
City%
Role
Prim
ary
This
data
may
not be c
om
ple
te o
r accura
te.V
alid
ity
of
wate
r rights
docum
ente
d b
y sta
tem
ents
of
cla
ims c
an o
nly
be d
ete
rmin
ed in S
uperior
Court
. E
colo
gy
cannot guara
nte
e the v
alid
ity
of
the w
ate
r rights
docum
ente
d b
y P
erm
its a
nd C
ert
ific
ate
s1

Wate
r R
ight
Tra
ckin
g S
yste
m
Depart
ment
of
Ecolo
gy
WR
Docum
ent
Lis
t S
ort
ed B
y P
riority
Date
Report
Report
ed B
y:
AR
HA
461
Report
Date
: 12/4
/2013
Fil
e #
Cert
#P
ers
on
Sta
tD
oc
Pri
ori
ty D
tP
urp
ose
Qi
UO
MQ
aIr
Acre
sW
RIA
Co
un
tyT
RS
/QS
rc's
1stS
rc
S1-*
01034A
WR
IS
Anacort
es C
ity
IN
ew
App
1/2
8/1
924
MU
6C
FS
3S
KA
GIT
35.0
N 0
1.0
E 1
8
1LA
KE
CA
MP
BE
LL
S1-*
01268C
WR
IS2187
Anacort
es C
ity
AC
ert
3/2
/1925
MU
,CI
4C
FS
3S
KA
GIT
34.0
N 0
2.0
E 0
7
1LA
KE
CA
MP
BE
LL
R1-*
01269C
WR
IS2188
Anacort
es C
ity
AC
ert
3/2
/1925
MU
CF
S1000
3S
KA
GIT
34.0
N 0
1.0
E 1
3
1LA
KE
ER
IE
S1-*
03012A
WR
IS
Anacort
es C
ity
IN
ew
App
6/1
9/1
930
MU
5C
FS
3S
KA
GIT
34.0
N 0
1.0
E 1
2
1LA
KE
ER
IE
S1-*
03031A
LC
01161A
Anacort
es C
ity
IC
ert
7/2
/1930
MU
15
CF
S0
3S
KA
GIT
34.0
N 0
3.0
E 1
3
2S
KA
GIT
RIV
ER
G1-*
03767C
3959
Anacort
es C
ity
AC
ert
9/1
3/1
954
MU
14500
GP
M23200
3S
KA
GIT
34.0
N 0
3.0
E 1
3
2W
ELL
S1-0
0709C
WR
IS
Anacort
es C
ity
AC
ert
2/1
4/1
963
MU
70
CF
S50680
3S
KA
GIT
34.0
N 0
3.0
E 1
3
SW
/NW
1
SK
AG
IT R
IVE
R
CG
1-*
03767C
A
nacort
es C
ity
AC
hng/R
OE
4/1
1/1
985
MU
1453
GP
M23200
3S
KA
GIT
34.0
N 0
3.0
E 1
3
SW
/NW
1
SK
AG
IT R
IVE
R
CS
1-*
03031A
LC
A
nacort
es C
ity
IC
hgA
pp
2/2
7/1
995
15
CF
S0
3S
KA
GIT
34.0
N 0
3.0
E 1
2
2S
KA
GIT
RIV
ER
TO
TA
L R
EC
OR
DS
: 9
SE
LE
CT
ION
CR
ITE
RIA
Role
Prim
ary
Regio
nN
ort
hw
est
Pers
on
%A
nacort
es C
ity%
This
data
may
not be c
om
ple
te o
r accura
te.V
alid
ity
of
wate
r rights
docum
ente
d b
y sta
tem
ents
of
cla
ims c
an o
nly
be d
ete
rmin
ed in S
uperior
Court
. E
colo
gy
cannot guara
nte
e the v
alid
ity
of
the w
ate
r rights
docum
ente
d b
y P
erm
its a
nd C
ert
ific
ate
s1


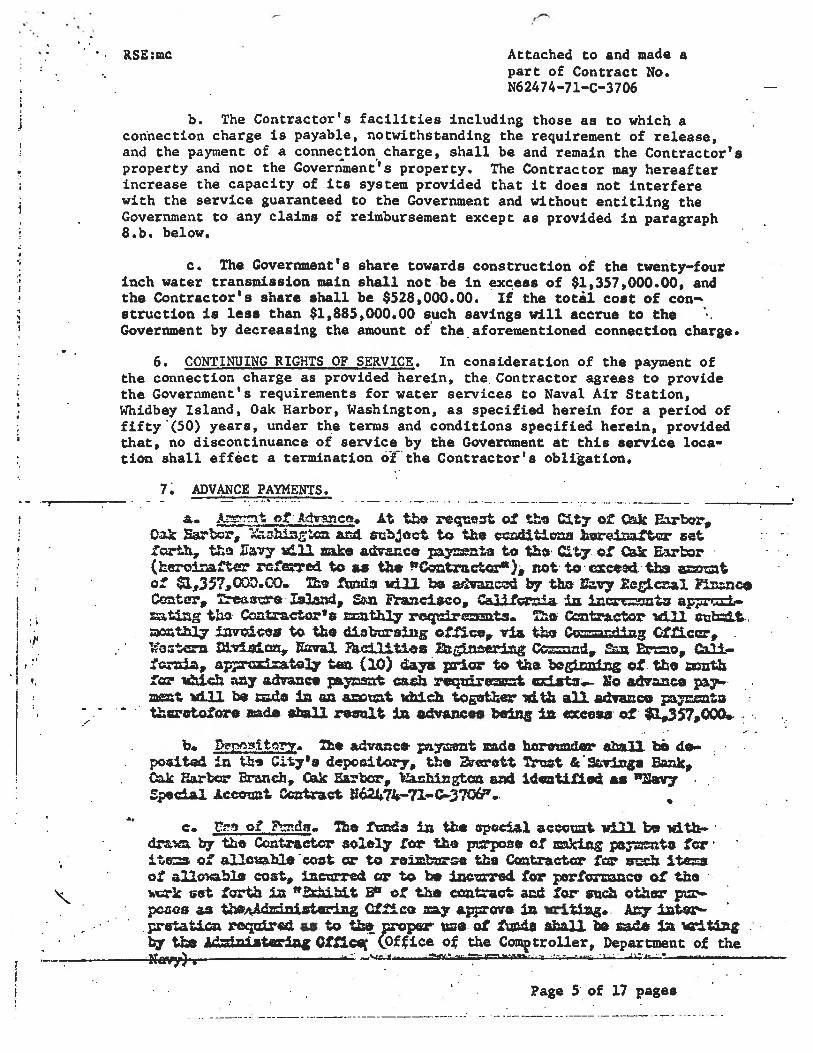


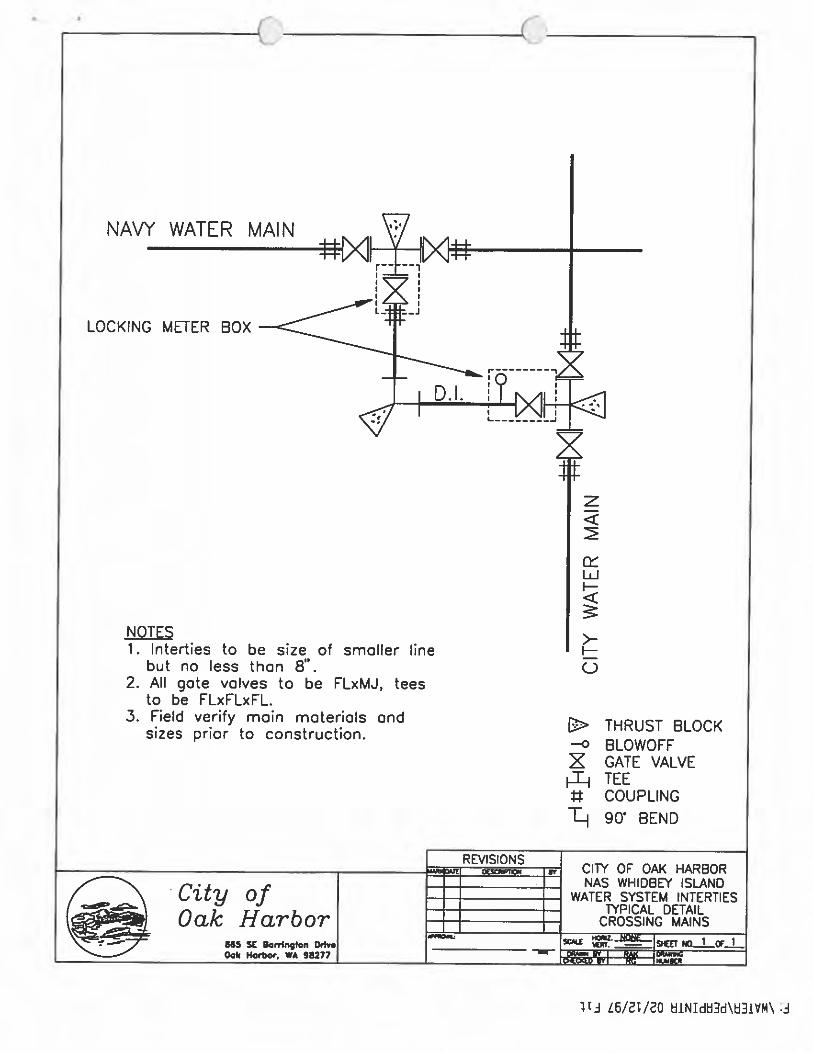


APPENDIX C
AULT FIELD BOOSTER STATION TECHNICAL MEMORANDUM
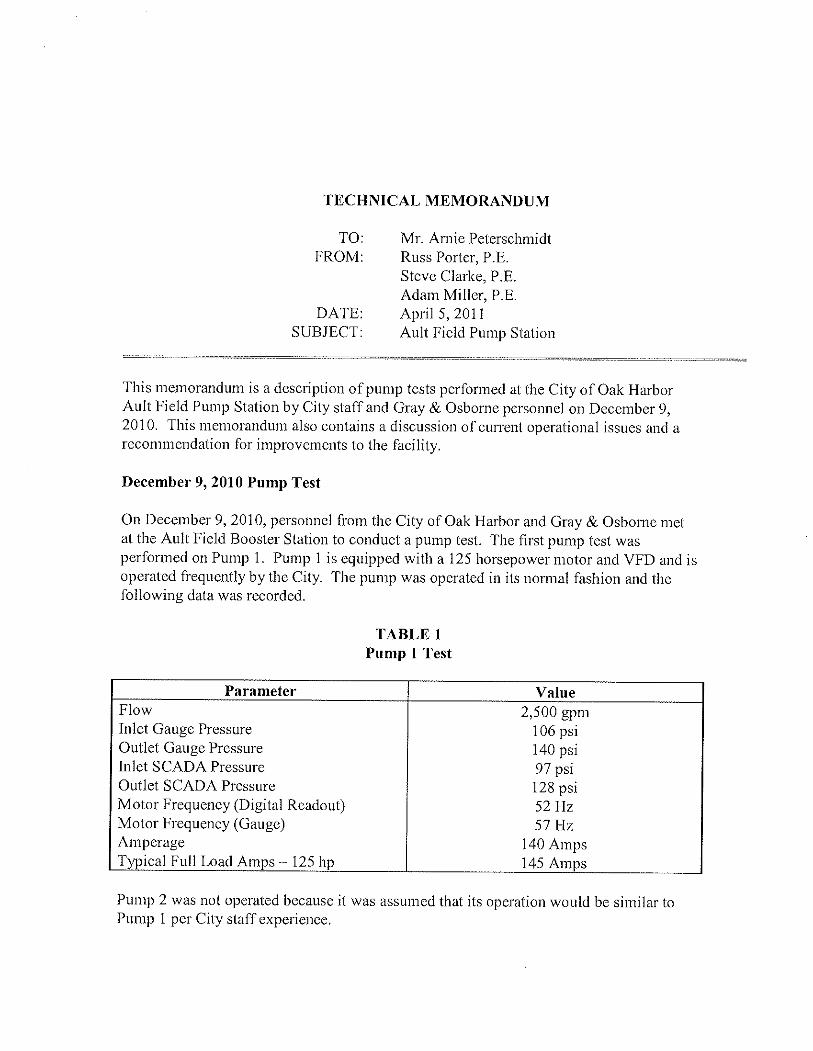


APPENDIX D
UNINTENDED DISCOVERY PROTOCOL


APPENDIX E
OAK HARBOR MUNICIPAL CODE TITLE 13

Title 13 WATER
Chapters:
13.04 Definitions
13.08 General Provisions
13.10 Water Conservation
13.12 Prohibited Use of Water System
13.13 Cross-Connections
13.16 Mains and Service Generally
13.20 Service Connections
13.24 Service Beyond City Limits
13.28 Main Construction
13.32 Rates and Charges
13.36 Fire Protection Systems
13.40 Violations
Chapter 13.04 DEFINITIONS
Sections:
13.04.010 Generally.
13.04.020 City.
13.04.025 City water system.
13.04.030 Council.
13.04.040 Facilities tap fee.
13.04.050 Mains.
13.04.060 Mains, standard or permanent.
13.04.070 Mains, substandard or temporary.
13.04.080 Meter, master.
13.04.090 Peak daily demand.
13.04.100 Person, customer, owner, occupant, and agent.
13.04.110 Premises.

13.04.120 Service connection.
13.04.130 Standard specifications.
13.04.140 Superintendent.
13.04.150 Supervisor, city.
13.04.160 Water service limits.
13.04.010 Generally.
For purposes of this title, the words or phrases defined in this chapter shall have the meanings set out in
this chapter. (Ord. 438 § 1, 1976; Ord. 403 § 1, 1975).
13.04.020 City.
“City” means the city of Oak Harbor, Washington, or as indicated by the context, it may mean the water
department, public works superintendent, clerk, treasurer, city supervisor, or other city employee or agent
representing the city in the discharge of his duties. (Ord. 438 § 1, 1976; Ord. 403 § 1(a), 1975).
13.04.025 City water system.
“City water system” is the interconnected wells, reservoirs, pipes, mains, pump stations, pressure pump
stations, monitoring gauges, valves, water gates and other appurtenances which are owned by the city of
Oak Harbor and used or capable of being used for the collection, treatment and transmission of water for
human use and for fire suppression or irrigation purposes or part thereof. (Ord. 1393 § 9, 2004).
13.04.030 Council.
“Council” means the city council of the city of Oak Harbor. (Ord. 438 § 1, 1976; Ord. 403 § 1(b), 1975).
13.04.040 Facilities tap fee.
“Facilities tap fee” means a connection fee for customers beyond the city limits of Oak Harbor, based on
the size of meter requested, is established, and is intended to represent the benefited property’s
proportionate share of the net value of the city’s water system. (Ord. 438 § 1, 1976; Ord. 403 § 1, 1975).
13.04.050 Mains.
“Mains” means water lines designed or used to serve more than one premises. (Ord. 438 § 1, 1976; Ord.
403 § 1(g), 1975).
13.04.060 Mains, standard or permanent.
“Standard or permanent mains” means mains conforming to the standard specifications of the city of Oak
Harbor with respect to materials and minimum diameter. (Ord. 438 § 1, 1976; Ord. 403 § 1(h), 1975).
13.04.070 Mains, substandard or temporary.
“Substandard or temporary mains” means water mains which do not conform to the minimum standards
as defined in this chapter. (Ord. 438 § 1, 1976; Ord. 403 § 1(i), 1975).
13.04.080 Meter, master.
“Master meter” means a meter installed to supply an area outside the city’s water service limits. (Ord. 438
§ 1, 1976; Ord. 403 § 1(l), 1975).

13.04.090 Peak daily demand.
“Peak daily demand,” for the purposes of this title, shall be determined by multiplying the estimated
maximum population to be served in an area by 300 gallons. (Ord. 438 § 1, 1976; Ord. 403 § 1(n), 1975).
13.04.100 Person, customer, owner, occupant, and agent.
“Person,” “customer,” “owner,” “occupant,” and “agent,” wherever used in this title, include natural persons
of either sex, associations, copartnerships and corporations whether acting by themselves or by a
servant, agent or employee. The singular number includes the plural and the masculine pronoun includes
the feminine. (Ord. 438 § 1, 1976; Ord. 403 § 1(f), 1975).
13.04.110 Premises.
“Premises” means a continuous tract of land, building or group of adjacent buildings under a single
control with respect to use of water and responsibility for payment therefor. Subdivisions of such use or
responsibility constitute a division into separate premises as defined in this section. (Ord. 438 § 1, 1976;
Ord. 403 § 1(e), 1975).
13.04.120 Service connection.
“Service connection” means that portion of the city water system connecting the water supply system on a
premises to the city water main. This includes the tap into the main, the water meter, the service line from
the main to the meter and from the meter to the property line. Service connections include connections for
fire protection. (Ord. 438 § 1, 1976; Ord. 403 § 1(k), 1975).
13.04.130 Standard specifications.
“Standard specifications” means those standard specifications for public works construction as prepared
by the Washington Chapter of the American Public Works Association which have been adopted by the
city council of the city of Oak Harbor. (Ord. 438 § 1, 1976; Ord. 403 § 1(j), 1975).
13.04.140 Superintendent.
“Superintendent” means the public works superintendent of the city of Oak Harbor. Any act in this title
required or authorized to be done by the superintendent may be done on behalf of the superintendent by
an authorized employee of the public works department. (Ord. 438 § 1, 1976; Ord. 403 § 1(d), 1975).
13.04.150 Supervisor, city.
The “city supervisor” means the supervisor of the city of Oak Harbor. Any act in this title required or
authorized to be done by the city supervisor may be done on behalf of the city supervisor by an
authorized employee. (Ord. 438 § 1, 1976; Ord. 403 § 1(c), 1975).
13.04.160 Water service limits.
“Water service limits” means an area comprising the existing city limits of Oak Harbor plus adjacent
county area as may be designated by the city council by resolution. (Ord. 403 § 1(m), 1975).

Chapter 13.08 GENERAL PROVISIONS
Sections:
13.08.020 Comprehensive water system plan.
13.08.030 Displacement of waterworks appurtenances – Notice – Liability.
13.08.040 Access to premises for inspection.
13.08.050 Addition of fluoride – Administration.
13.08.020 Comprehensive water system plan.
The city supervisor is directed to prepare a comprehensive plan for the city of Oak Harbor water supply
and distribution system. A copy of the plan shall be available to the public at the utility office. The plan
shall include:
(1) Minimum main sizes allowable on all city streets;
(2) Minimum main sizes and the planned distribution system in the water service area;
(3) The location of all existing facilities;
(4) Such other information as the council may require. (Ord. 403 § 3, 1975).
13.08.030 Displacement of waterworks appurtenances – Notice – Liability.
Any person, contractor, corporation, or any municipal department performing construction work in or on
any street or utility right-of-way shall give the superintendent two days’ written notice in the event it
becomes necessary to remove or change any water mains, pipes or appurtenances. Damage to any part
of the water system shall make such person, contractor, corporation, or agency liable to the water
department for the cost of necessary repairs and replacements. (Ord. 403 § 11, 1975).
13.08.040 Access to premises for inspection.
Authorized employees of the water department, properly identified, shall have access at reasonable hours
of the day to all premises and parts thereof to which water is served from the city water system.
If an authorized city employee is refused admittance to make an inspection, water service may be
discontinued immediately. (Ord. 403 § 12, 1975).
13.08.050 Addition of fluoride – Administration.
A source of fluoridation approved by the State Department of Health shall be added to the water supply of
the city of Oak Harbor under the rules and regulations of the Washington State Board of Health, such
addition to be administered in a manner approved by the State Director of Public Health. (Ord. 403 § 27,
1975).

Chapter 13.10 WATER CONSERVATION
Sections:
13.10.010 Findings and purpose.
13.10.020 Limitation on water use.
13.10.030 Water restrictions – Powers of the city.
13.10.040 Water restrictions – Surcharge.
13.10.050 Enforcement.
13.10.060 Severability clause.
13.10.010 Findings and purpose.
(1) The city’s water supply is subject to weather conditions, water contamination, interruption of supply
and other emergencies and, therefore, usage reductions may be required to assure an adequate supply
for essential needs; and
(2) The city is supplied water in part by the city of Anacortes water department, and this water supplier
has requested that the city of Oak Harbor provide for measures and authority to impose emergency water
restrictions and sanctions to conserve water consumption during such emergency in accordance with a
water shortage response plan; and
(3) The unrestricted water use for non-essential purposes during water emergencies will endanger the
adequacy of the water supply for essential needs; and
(4) Compliance with said restrictions will be encouraged by imposition of additional charges for water
usage in excess of authorized usage during an emergency; and
(5) The city council recognizes the critical importance of an immediate response by the city in the event of
any water supply emergency; and to provide this response, the mayor or his/her designee, shall be
granted authority to implement the water shortage response plan, hereinafter referred to as the plan; and
(6) This chapter is necessary for the health, safety and welfare of the city of Oak Harbor. (Ord. 1263 § 2,
2001).
13.10.020 Limitation on water use.
In the event that a supplier notifies the city of a shortage of water or the mayor reasonably determines
such a shortage or emergency to be imminent, the mayor or his/her designee is authorized to implement
the plan, according to drought condition levels identified in the plan, in order to efficiently safeguard the
safety and health of the general public or to provide for the public convenience. The use of water in the
city or in any portion thereof, for irrigation, cooling, sprinkling, washing of motor vehicles or outdoor
surfaces, or other uses may be forbidden, restricted, or regulated and such regulations may be made
effective as to all customers or as to particular classes of customers. Rationing may be imposed during
any shortage of water, either in lieu of or in addition to other measures hereby authorized.

(1) Upon receiving notification from a water supplier of an impending water emergency or in the event of
transmission and/or distribution system failure, the water division will notify the mayor within 24 hours or
on the next business day that a water emergency/shortage will be or has been declared.
(2) The mayor or his/her designee will issue a public notification of the declaration of water emergency
and imposition of restrictions.
(3) Restrictions will be in effect immediately upon issuance of the public notification. Restrictions and the
amount of surcharge for violations of mandatory restrictions will be posted and published as outlined in
the plan.
(4) Notice of emergency rationing shall be delivered in whatever means available to inform both residents
and businesses. Delivery could include posting at businesses, library, newspapers, radio, television, or
door-to-door. However, lack of said personal notice shall not relieve a water customer from the duty to
abide by the emergency regulation. (Ord. 1263 § 3, 2001).
13.10.030 Water restrictions – Powers of the city.
The mayor or his/her designee shall conduct public education efforts regarding the benefits and necessity
of conservation by the public, and is authorized, to promulgate such rules and regulations as may be
necessary to implement water use restriction. The regulations will be on file with the city clerk, and the
rules and regulations and any amendment thereto shall be effective five days after said filing with the city
clerk. The mayor or his/her designee is further authorized to make exceptions to such restrictions in
specific cases as he/she finds reasonable which may in the mayor’s discretion include, but not be limited
to, watering newly seeded or sodded lawns, food sources, landscape ornamental plantings required by
the city, when necessary to alleviate unnecessary economic hardship to commercial or industrial
activities, or to prevent possible damage to health, safety or welfare. (Ord. 1263 § 4, 2001).
13.10.040 Water restrictions – Surcharge.
It is unlawful for any person to violate water use and restrictions and violation of these provisions shall be
a misdemeanor punishable under the general penalty provisions of this code. In addition to other lawful
remedies, the mayor or his/her designee is authorized to impose a surcharge for the first occurrence after
a documented warning notice and each subsequent violation in which a customer’s water usage practices
exceed water conservation restrictions as provided for in this chapter. Said surcharge will be added to
and become a part of the water bill for the customer in addition to any service rate amounts. Prior to the
imposition of the first surcharge, a public works department representative shall deliver in person or post
a notice at the service address advising of the customer’s water usage practices in excess of mandatory
water shortage restrictions and advising that a surcharge may be imposed for any further violations. A
copy of the violation notice shall also be mailed to the owner and/or occupant. The mayor shall
promulgate regulations providing for appeal of any notice of violation. Appeals must be received within
five working days of delivery of notice of violation.
(1) Surcharges for violations of water restrictions in effect until thereafter adjusted shall be $25.00 for first
violation, $50.00 for a second violation, and $250.00 for a third or subsequent violation.

(2) Surcharges for all customer classes will be reviewed annually based on actual or projected expenses
of the water division necessary to maintain a water supply during an emergency. (Ord. 1263 § 5, 2001).
13.10.050 Enforcement.
(1) The mayor or his/her designee, including any employee of the city of Oak Harbor public works
division, or field personnel, or police officer of the city, shall have the authority to enforce the provisions of
this chapter.
(2) In addition to the surcharges provided, the mayor or his/her designee may cause water service to be
terminated for subsequent or continuing violation of water conservation restrictions. (Ord. 1263 § 6,
2001).
13.10.060 Severability clause.
If any section, subsection, sentence, clause, phrase, part or portion of this chapter is for any reason held
to be invalid or unconstitutional by any court of competent jurisdiction, such decision shall not affect the
validity of the remaining portions of this chapter. (Ord. 1263 § 7, 2001).
Chapter 13.12 PROHIBITED USE OF WATER SYSTEM
Sections:
13.12.010 Unlawful water use.
13.12.020 Damaging or interfering with water system prohibited.
13.12.030 Electrical grounding.
13.12.040 Sprinkling during fire prohibited.
13.12.060 Unauthorized connection and turning off prohibited.
13.12.010 Unlawful water use.
It is unlawful for any person supplied with water from the city water system to use the water for any other
purpose than those named in the application for service, or to use the water in violation of any of the
provisions of this title. (Ord. 1393 § 2, 2004; Ord. 438 § 3, 1976; Ord. 403 § 5, 1975).
13.12.020 Damaging or interfering with water system prohibited.
(1) It is unlawful for any person to willfully disturb, break, deface, or damage any portion of the city water
system including, but not limited to, any fire hydrant, water meter, gate valve, water pipe, water main,
pump station, holding tank or other waterworks appurtenances including buildings, grounds and
improvements belonging to or part of the city’s water system.
(2) It is unlawful for any person to open, close, turn or interfere with, or connect to any fire hydrant, valve,
or pipe belonging to the city unless authorized by the superintendent or his/her designee in writing. This
section shall not apply to members of a fire department acting in their official capacity. (Ord. 1393 § 3,
2004; Ord. 403 § 6, 1975).

13.12.030 Electrical grounding.
It is unlawful to connect or attach any wire conveying ground current or other electrical current to any
water pipe, or water main attached to or forming a part of the city water system. (Ord. 1393 § 4, 2004;
Ord. 438 § 4, 1976; Ord. 403 § 7, 1975).
13.12.040 Sprinkling during fire prohibited.
It is unlawful for any person to knowingly use water from the city water system for lawn or garden
sprinkling or irrigating purposes on any premises when instructed to cease such use because the water is
needed to fight a fire or when a conservation directive has been put into effect by directive of the city
council. (Ord. 1393 § 5, 2004; Ord. 403 § 8, 1975).
13.12.060 Unauthorized connection and turning off prohibited.
It is unlawful for any person to connect any pipe to the city mains or to turn water on or off at any
premises without the consent of the superintendent or his/her designee. (Ord. 1393 § 6, 2004; Ord. 403 §
26, 1975).
Chapter 13.13 CROSS-CONNECTIONS
Sections:
13.13.001 Findings.
13.13.005 Definitions.
13.13.010 Cross-connections – Prohibitions.
13.13.020 Backflow prevention device.
13.13.030 Compliance required.
13.13.040 Backflow prevention devices – Testing.
13.13.050 Regulations.
13.13.055 Prevention of contamination.
13.13.056 Conditions for providing service.
13.13.057 Enforcement measures.
13.13.060 Nuisances declared – Abatement.
13.13.001 Findings.
(1) It is a requirement of the Washington State Department of Health (WA DOH) for the city to establish a
cross-connection control program satisfactory to the Department of Health; and
(2) Cross-connections within the customer’s plumbing system pose a potential source for the
contamination of the public water supply system; and
(3) A safe supply of drinking water is of the highest health, welfare and safety concern for the city. (Ord.
1456 § 1, 2006).

13.13.005 Definitions.
(1) “Administrator” means the public works superintendent or such other person designated to administer
the cross-connection program adopted and/or authorized by this chapter.
(2) “Backflow” means the flow other than the intended direction of flow of any foreign liquids, gases or
substances into the distribution system of a public water supply.
(3) “Backflow prevention device” means a WA DOH-approved device to counteract back pressure or
prevent back-siphonage.
(4) “Cross-connection” means any physical arrangement whereby a public water supply is connected,
directly or indirectly, with any other water supply system, sewer drain, conduit, pool, storage reservoir,
plumbing fixture or other device which contains or may contain contaminated water, sewage, or other
waste or liquids of unknown or unsafe quality which may be capable of imparting contamination to the
public water supply as a result of backflow.
(5) “Purveyor” means the city of Oak Harbor water division. (Ord. 1456 § 2, 2006; Ord. 579 § 1, 1981).
13.13.010 Cross-connections – Prohibitions.
The installation or maintenance of a cross-connection which in the opinion of the administrator will
endanger the water quality of the potable water supply of the city is unlawful. (Ord. 1456 § 3, 2006; Ord.
579 § 1, 1981).
13.13.020 Backflow prevention device.
Backflow prevention devices shall be required to be installed and maintained by the service customer on
any service connection to the Oak Harbor water supply system where, in the opinion of the administrator,
the backflow prevention devices are necessary for the protection of the city water supply from backflow.
(Ord. 1456 § 4, 2006; Ord. 579 § 1, 1981).
13.13.030 Compliance required.
Use or operating of a private water supply system contrary to the provisions of the ordinances of the city
or the laws of the state or the rules and regulations of the State Board of Health regarding public water
supplies, where the private system is served by the city public water supply, is unlawful. (Ord. 1456 § 5,
2006; Ord. 579 § 1, 1981).
13.13.040 Backflow prevention devices – Testing.
All backflow prevention devices including reduced pressure backflow devices and factory-assembled
double check-valve assemblies installed under this chapter shall be inspected and tested after installation
and annually, or more often where successive inspections indicate repeated failure. The devices shall be
repaired, overhauled or replaced whenever they are found to be defective. Inspections, tests, and repairs
and records thereof shall be certified in writing to the administrator. The administrator shall maintain a list
of certified backflow prevention device testing personnel qualified to do testing. The city shall maintain
copies of all testing required. (Ord. 1456 § 6, 2006; Ord. 579 § 1, 1981).

13.13.050 Regulations.
Rules and regulations of the State Board of Health identified as Definitions and Cross Connection Control
regulation in Washington State under WAC 246-290-010 and 246-290-490 are adopted by reference as
now or hereafter amended, deleted from or added to. A current copy of such regulations will be on file
with the city clerk’s office. (Ord. 1456 § 7, 2006; Ord. 579 § 1, 1981).
13.13.055 Prevention of contamination.
The customer’s plumbing system, starting from the termination of the city’s water service pipe, shall be
considered a potential high health hazard requiring the isolation of the customer’s premises by a city/WA
DOH-approved, customer-installed and -maintained air gap (AG), reduced pressure backflow assembly
(RPBA) or detector derivative thereof. The RPBA shall be located at the end of the city’s water service
pipe (i.e., immediately downstream of the meter). Water shall only be supplied to the customer through a
city-approved and customer-installed and -maintained RPBA. The purveyor will require premises isolation
for a customer that is of the high-hazard type or category requiring “mandatory premises isolation”
established by the WA DOH regulations (Table 9, WAC 246-290-490).
It is provided, however, the city, upon an assessment of the risk of contamination posed by the
customer’s plumbing system and use of water, may allow:
(1) A single-family or multiresidential customer to connect directly to the water service pipe, i.e., without a
city-approved DCVA or RPBA.
(2) Any customer other than a single-family or multiresidential customer, as a minimum, to be supplied
through a city/WA DOH-approved, customer-installed and -maintained double check valve assembly
(DCVA) or double check detector assembly (DCDA).
(3) Any customer, other than a single-family or duplex residential customer, to connect directly to the
water service pipe (i.e., without a purveyor-approved DCVA or RPBA); provided, that the customer installs
and maintains backflow preventers, at the point of hazard, that are commensurate with the degree of
hazard assessed by the purveyor. (Ord. 1456 § 8, 2006).
13.13.056 Conditions for providing service.
Water service is provided based on the following terms and conditions:
(1) The customer shall take all measures necessary to prevent the contamination of the plumbing system
within his/her premises and the city’s distribution system that may occur from backflow through a cross-
connection. These measures shall include the prevention of backflow under any back pressure or back
siphonage condition, including the disruption of supply from the city’s system that may occur by reason of
routine system maintenance or during emergency conditions, such as a water main break.
(2) The customer shall install, operate and maintain at all times his/her plumbing system in compliance
with the current edition of the plumbing code having jurisdiction as it pertains to the prevention of

contamination and protection from thermal expansion due to a closed system that could occur with the
present or future installation of backflow preventers on the customer’s service and/or at plumbing fixtures.
(3) Where a city/WA DOH-approved reduced pressure backflow assembly is not provided, and for cross-
connection control or other public health related surveys, the customer shall provide access for the
employees or agents of the city to all parts of the premises during reasonable working hours of the day for
routine surveys, and at all times during emergencies unless the provisions of subsection (4) of this
section are followed.
(4) Where agreement for access for the city’s survey is denied, water service may be supplied by the city,
provided premises isolation is provided through a city/WA DOH-approved RPBA.
(5) The customer shall:
(a) Have tested upon installation, annually thereafter or when requested by the city, after repair and
after relocation his/her RPBA or DCVA installed to protect the city’s distribution system;
(b) Have all testing done by a city-approved backflow assembly tester (BAT) currently certified by
WA DOH;
(c) Have the RPBA or DCVA tested following the procedures approved by WA DOH with the
recommended additional procedures in the “Cross Connection Control Manual, Accepted
Procedures and Practice,” Sixth Edition, December 1995, or latest edition thereof (a copy of which
is on file with the city clerk and by this reference is made a part of this chapter); and
(d) Submit to the city the results of the test(s) on the city-supplied test report form within the time
period specified by the city.
The customer shall bear all costs for the installation, testing, repair, maintenance and replacement of the
RPBA, DCVA or derivative thereof installed to protect the city’s distribution system.
(6) At the time of application for service, if required, the customer shall submit plumbing plans and/or a
cross-connection control survey of the premises by a city-approved and WA DOH-certified cross-
connection control specialist (CCS).
The survey shall assess the cross-connection hazards and list the backflow prevention provided within
the premises. The results of the survey shall be submitted prior to the city turning on water service to a
new customer. The cost of the survey shall be borne by the customer.
(7) For classes of customers other than single-family residential, when required by the city, the customer
shall submit a cross-connection control resurvey of the premises by the persons described above. The
city may require the resurvey to be performed in response to changes in customer’s plumbing, or
performed periodically (annual or less frequent) where the city considers the customer’s plumbing system

to be complex or subject to frequent changes in water use. The cost of the resurvey shall be borne by the
customer.
(8) Within 30 days of a request by the city, a residential customer shall complete and submit to the city a
“Water Use Questionnaire” for the purpose of surveying the health hazard posed by the customer’s
plumbing system on the city’s distribution system. Further, the residential customer agrees to provide
within 30 days of a request by the city a cross-connection control survey of the premises by a city-
approved and WA DOH-certified cross-connection control specialist (CCS).
(9) The customer shall obtain the prior approval from the city for all changes in water use, and alterations
and additions to the plumbing system, and shall comply with any additional requirements imposed by the
city for cross-connection control.
(10) The customer shall immediately notify the city and the local public health inspection jurisdiction of
any backflow incident occurring within the premises (i.e., entry into the potable water of any contaminant
or pollutant), and shall cooperate fully with the city to determine the reason for the incident.
(11) As a condition of service, the customer shall agree to indemnify and hold harmless the city for all
contamination of the customer’s plumbing system or the city’s distribution system that results from an
unprotected or inadequately protected cross-connection within his/her premises. This indemnification
shall pertain to all backflow conditions that may arise from the city’s suspension of water supply or
reduction of water pressure, recognizing that the air gap separation otherwise required would require the
customer to provide adequate facilities to collect, store and pump water for his/her premises.
(12) The customer shall agree that, in the event legal action is required and commenced between the city
and the customer to enforce the terms and conditions herein, the substantially prevailing party shall be
entitled to reimbursement of all its costs and expenses including, but not limited to, reasonable attorney’s
fees as determined by the court.
(13) The city’s survey of a customer’s premises is for the sole purpose of establishing the city’s minimum
requirements for the protection of the public water supply system, commensurate with the city’s
assessment of the degree of hazard.
(14) The city, in keeping with changes to state regulations, industry standards, or the city’s risk
management policies, may impose retroactive requirements for additional cross-connection control
measures.
(15) Where the purveyor imposes mandatory premises isolation in compliance with WA DOH regulations,
or agrees to the customer’s voluntary premises isolation through the installation of an AG or RPBA
immediately downstream of the purveyor’s water meter and before any branch connection, the customer
acknowledges his obligation to comply with the other cross-connection control regulations having
jurisdiction (i.e., Uniform Plumbing Code). Although the purveyor’s requirements for installation, testing,
and repair or backflow assemblies may be limited to the RPBAs used for premises isolation, the customer

agrees to the other terms herein as a condition of allowing a direct connection to the purveyor’s service
pipe.
(16) It shall not be assumed by the customer or any regulatory agency that the purveyor’s survey,
requirements for the installation of backflow prevention assemblies, lack of requirements for the
installation of backflow prevention assemblies, or other actions by the purveyor’s personnel constitute an
approval of the customer’s plumbing system or an assurance to the customer of the absence of cross-
connections therein.
The conditions of this section shall be included in any agreement with the customer for water utility
service. (Ord. 1456 § 9, 2006).
13.13.057 Enforcement measures.
(1) The city may discontinue water supply within 72 hours of giving notice, or a lesser period of time if
required to protect the public health, if the customers fail to cooperate with the city in the survey of
premises, in the installation, maintenance, repair, inspection or testing of backflow prevention assemblies
or air gaps required by the city, or in the city’s effort to contain a contaminant or pollutant that is detected
in the customer’s system.
(2) Without limiting the generality of the foregoing, in lieu of discontinuing water service, the city may
install a reduced pressure backflow assembly (RPBA) on its service pipe to provide premises isolation,
and recover all of its costs for the installation and subsequent maintenance and repair of the assembly,
appurtenances and enclosure from the customer as fees and charges for water. The failure of the
customer to pay these fees and charges may result in termination of service in accordance with the city’s
water billing policies. There shall be a five percent surcharge on all water usage billings after city
installation for maintenance and monitoring the same. (Ord. 1456 § 10, 2006).
13.13.060 Nuisances declared – Abatement.
Unlawful cross-connections now existing or hereafter installed, services requiring backflow prevention
devices and unlawful use or operation of a private water supply system served by the city public water
supply system are declared to be a public nuisance, and any measures authorized by law for the
abatement of nuisances may be taken at the direction of the administrator. (Ord. 1456 § 11, 2006; Ord.
579 § 1, 1981).
Chapter 13.16 MAINS AND SERVICE GENERALLY
Sections:
13.16.010 Application for service.
13.16.020 Emergency interruption of service.
13.16.030 Mains and service connections – Work by authorized personnel only.
13.16.040 Mains and services – Distance from sanitary sewers.
13.16.050 Mains and service connections – Ownership.

13.16.010 Application for service.
All applications for water service shall be made at the office of the utility department or such other place
designated by the city supervisor. The application shall be made by the owner or an agent of the owner of
the property to be served. The applicant shall state the purposes for which the water is to be used. The
applicant must agree to abide by the rules and regulations which may be established from time to time.
The applicant must agree that the city shall have the right at any time, without notice, to shut off the water
supply for repairs, extension, or nonpayment of rates, and the city shall not be responsible for any
damage whatever resulting directly or indirectly from the shutting off of the water. (Ord. 403 § 4, 1975).
13.16.020 Emergency interruption of service.
In case of an emergency, or whenever the public health, safety or equitable distribution of water so
demands, the superintendent may reduce or limit the time for, or temporarily discontinue, the use of
water. Water service may be temporarily discontinued for purposes of making repairs, extensions, or
doing other necessary work. Before so changing, reducing, limiting, or discontinuing the use of water, the
superintendent shall notify, insofar as practicable, all water consumers affected. The city shall not be
responsible for any damage resulting from interruption, change, or failure of the water supply. (Ord. 403 §
10, 1975).
13.16.030 Mains and service connections – Work by authorized personnel only.
Only employees of the water department or contractors authorized by the superintendent or the city
supervisor shall be allowed to do any work on the city mains or service connections. (Ord. 403 § 13,
1975).
13.16.040 Mains and services – Distance from sanitary sewers.
All water mains, service lines and other waterworks appurtenances which carry water shall be located a
sufficient distance to prevent contamination, both horizontally and vertically, from any sanitary sewer. All
water installations are subject to the approval of the superintendent. (Ord. 403 § 14, 1975).
13.16.050 Mains and service connections – Ownership.
The ownership of all water mains, and all appurtenances thereto located within the city of Oak Harbor’s
water service area must be vested in the city’s water department. Any developer, person, firm or
corporation who has constructed any water mains because of platting and/or other requirements must
relinquish all ownership interest in that part of the system that he has constructed before any water
service connection will be supplied water from the city mains. (Ord. 403 § 15, 1975)
Chapter 13.20 SERVICE CONNECTIONS
Sections:
13.20.010 Adjacent main required.
13.20.020 When made – Ownership and maintenance.
13.20.030 Separate meter required.

13.20.040 Additional connections – Installation and billing.
13.20.050 Materials and plumbing.
13.20.060 Temporary connections for construction and earth settling – Rates.
13.20.070 Use of water from fire hydrants – Equipment – Charge.
13.20.010 Adjacent main required.
Except as provided in OHMC 13.24.030, a premises shall not be connected to the water system of the
city unless there is adjacent to the property a main owned by and under the exclusive control of the city.
(Ord. 438 § 6, 1976; Ord. 403 § 16, 1975).
13.20.020 When made – Ownership and maintenance.
When a permit has been issued for the installation of a water service, the superintendent shall cause the
premises to be connected with the water system. The service connection shall be the property of the city
and maintained by the city. (Ord. 438 § 6, 1976; Ord. 403 § 16, 1975).
13.20.030 Separate meter required.
Except as provided in OHMC 13.24.030, every premises supplied with city water must have its own
separate meter. Premises so supplied will not be allowed to supply water to any other premises. The city
supervisor may require individual buildings on any premises to be separately metered. This applies to
existing as well as new installations. (Ord. 438 § 6, 1976; Ord. 403 § 16, 1975).
13.20.040 Additional connections – Installation and billing.
When additional water service connections are required for any premises, all water service to such
premises shall be metered, installed, and billed at the applicable rate. (Ord. 438 § 6, 1976; Ord. 403 § 16,
1975).
13.20.050 Materials and plumbing.
All persons connecting to the city’s water system may only use materials conforming to the standard
specifications. Plumbing on premises shall conform to the uniform plumbing code of the city of Oak
Harbor. (Ord. 438 § 6, 1976; Ord. 403 § 16, 1975).
13.20.060 Temporary connections for construction and earth settling – Rates.
(1) The use of water for construction purposes or earth settling may be allowed. Application shall be
made to the water department, and a cash deposit shall be made in an amount so determined by the
superintendent. Water used as set forth in this section or for any other temporary use, if it is impracticable
in the opinion of the superintendent to meter the water, shall be charged for at a rate fixed by the
superintendent.
(2) The charge for earthwork settling for each lineal foot of trench shall be two cents. (Ord. 403 § 17,
1975).

13.20.070 Use of water from fire hydrants – Equipment – Charge.
When water service is supplied for any purpose through the fire hydrants, other than to the city, the water
department will furnish the necessary equipment required for such service. A charge computed on the full
cost of the service including maintenance, operating and testing, together with the cost of the rental of the
equipment furnished by the water department, shall be calculated and collected by the water department.
The minimum charge shall not be less than $10.00. This shall be in addition to any charge for water. (Ord.
403 § 17, 1975).
Chapter 13.24 SERVICE BEYOND CITY LIMITS1
Sections:
13.24.005 Preannexation agreements.
13.24.010 Categories.
13.24.015 Water service area.
13.24.020 Within water service area – Terms and conditions.
13.24.030 Beyond water service area – Conditions.
13.24.040 Beyond water service area – Application.
13.24.050 Consideration of NAS Whidbey Island Air Installation Compatible Use Zones latest
edition.
13.24.060 Fire hydrant.
13.24.070 Interruptability.
13.24.080 Draw down.
13.24.090 Design standards – Backflow prevention.
13.24.100 Disconnection.
13.24.110 Penalty.
13.24.005 Preannexation agreements.
(1) The city council establishes as a policy and directs that within the currently established zone of
influence and the urban growth area no water connection to or expansion of a water connection already
existing to the Oak Harbor water system shall be allowed unless the property owners and the underlying
lien holders agree that the city is authorized to proceed with annexation of the property and further agree
not to contest the annexation of the property.
(2) If water is to be supplied to a new subdivision or development within the urban growth area, all new or
subsequent water systems development within that subdivision or development shall be to city standards.
(3) If any person claims that this condition for water connection is unduly burdensome or that there is no
likelihood that the property will be annexed within 10 years after connection, they may petition the council
to be relieved of this obligation. The council in reaching its decision on this issue shall take into
consideration the burdens created, the need to promote orderly growth, land use and the likelihood that

the property will be annexed to the city within 10 years of the date of the agreement. (Ord. 1252 § 1,
2001; Ord. 954 § 1, 1993).
13.24.010 Categories.
(1) Water service beyond the city limits shall fall into two categories:
(a) Outside the city limits but within the city’s water service area;
(b) Outside the city limits and beyond the city’s water service area.
(2) OHMC 13.24.050 through 13.24.100 shall apply to both categories. (Ord. 879 § 1, 1991).
13.24.015 Water service area.
The water service area of the city of Oak Harbor is defined by resolution. (Ord. 1036 § 1, 1996).
13.24.020 Within water service area – Terms and conditions.
Water service to premises shall be subject to the following terms and conditions:
(1) Water service to premises within the city’s water service area will be subject to all the rules and
regulations of this title that pertain to premises within the city limits.
(2) All rates for water service beyond the city limits, but within the city’s water service area, will be
established by ordinance for this class of service.
(3) System development charges in the water service area outside city limits shall be at the same rate as
the system development charge for three-quarter-inch meters times the maximum number of expected
equivalent residential units to be provided from the system. It is further provided that this fee may be
reduced by agreement when the applicant installs system improvements as specified under Chapter
13.48 OHMC as now in effect or hereafter amended.
(4) Plans for water systems must be approved by the city engineer and the public works superintendent
or his or her designee.
(5) The city shall own all lines and systems up to and including the meter. Such lines and system
elements shall be located in easements given to the city or in public rights-of-way. (Ord. 1166 § 8, 1999;
Ord. 879 § 1, 1991).
13.24.030 Beyond water service area – Conditions.
The city council may, at its discretion, supply water to areas beyond the city’s water service limits on the
following conditions:
(1) All sales of water beyond the water service limits of the city will be made only to another municipal or
governmental unit such as Island County, a water district organized according to state law, another city,
etc.

(2) There must be a finding by the city council that the city has an excess water supply available for the
service requested.
(3) Sales, at the discretion of the city, will be through a master meter.
(4) Meters will be allowed only at points and of sizes approved by the public works superintendent or
other person designated by the public works superintendent to be in charge of the water utility. The
applicant will pay full costs of providing services to the designated area. Master meters shall be a
minimum of two inches in diameter.
(5) System development charges for areas outside the water service area shall be at the same rate as the
system development charge for three-quarter-inch meters times the maximum number of expected
equivalent residential units consumption to be provided by the water services; provided, that this fee may
be reduced by agreement when the applicant installs storage capacity which significantly reduces the
impact on peak demand times.
(6) Adequate storage at least equal to the estimated peak daily demand for the area to be served shall be
provided by the applicant. The method for meeting this requirement shall be established in the agreement
authorizing the connection to the Oak Harbor water system.
(7) Ownership of the water system beyond the meter shall be vested in the applicant and the operation,
repair, expansion and renewal of the system beyond this point shall be the responsibility of the applicant.
The city’s responsibility shall terminate at the master meter.
(8) Each system served by a master meter shall have a licensed system operator.
(9) All costs associated with connecting to the city’s system shall be paid by the applicant. (Ord. 1166 § 9,
1999; Ord. 879 § 1, 1991).
13.24.040 Beyond water service area – Application.
Application for water service, as in OHMC 13.24.030, shall be made to the city council. The application
shall include a detailed description of the area to be served, the name of the body which will be
responsible for the service charges, the estimated maximum daily amount of water required, an estimate
of system development charges and such other information as the council may deem necessary. Service
to additional areas not included in the original application shall require a separate application and
approval. Each year after acceptance, an update of the information shall be provided to the city engineer.
(Ord. 879 § 1, 1991).
13.24.050 Consideration of NAS Whidbey Island Air Installation Compatible Use Zones latest
edition.
NAS Whidbey Island Air Installation Compatible Use Zones shall be considered by the council in making
its decision on the granting or denying of water service beyond the water service area. If amelioration

measures are required to bring the development in compliance, the applicant shall pay for all costs to
assure such compliance. (Ord. 879 § 1, 1991).
13.24.060 Fire hydrant.
The charge for connecting a fire hydrant to a city line outside city limits shall be $1,500. (Ord. 879 § 1,
1991).
13.24.070 Interruptability.
The city may sever connection to a water service customer when:
(1) Supplies of water are inadequate to handle the city requirements of customers inside the city limits or
U.S. Navy;
(2) Temporary water shortage; and
(3) Emergency conditions requiring full water supply to the city of Oak Harbor. (Ord. 879 § 1, 1991).
13.24.080 Draw down.
A customer outside the city limits may not draw water out of the mains in such a way as to impair water
service to the city of Oak Harbor. (Ord. 879 § 1, 1991).
13.24.090 Design standards – Backflow prevention.
(1)(a) The design standards for any water system beyond a master meter shall meet or exceed the
Washington State Department of Health’s minimum standards for public water supplies. All materials
used in the system shall be AWWA approved.
(b) A backflow prevention valve shall be required in conjunction with each master meter.
(c) Current systems using master meters shall install backflow prevention valves within one year
from the date of the ordinance codified in this chapter.
(2) Applicant and their successor’s interest shall be responsible to assure that all systems are in
compliance with county and state standards. (Ord. 879 § 1, 1991).
13.24.100 Disconnection.
Any violation of the requirements of this chapter may be cause for discontinuance of service to the
system by the city council. Unless an emergency condition exists, any such action would be taken only
after the customer had been advised in writing of the violation before hearing on the matter. (Ord. 879 §
1, 1991).
13.24.110 Penalty.
It is hereby declared a gross misdemeanor punishable by a fine of up to $5,000 or one year in jail or both
such fine and jail time to make an unpermitted connection to the city water system. (Ord. 879 § 1, 1991).

1
Prior legislation: Ords. 403 and 438.
Chapter 13.28 MAIN CONSTRUCTION
Sections:
13.28.010 Charge – Assessment.
13.28.020 Service connection – No main in street.
13.28.030 Special charge – Property not previously assessed or costs unpaid.
13.28.040 Specifications for standard water mains.
13.28.010 Charge – Assessment.
Each parcel of property to be served within the water service limits shall be assessed its proportionate
share of the cost of construction of a standard main abutting or serving the property. Prior to approval of
an application for water service, the city supervisor shall ascertain if the property in question has
previously contributed or been assessed its proportionate share of the construction costs. Property
abutting a standard main, but not previously assessed or not having previously contributed its
proportionate share of construction costs for such standard main may be connected to such standard
main upon payment of a special construction charge as described in OHMC 13.28.030. The special
construction charge is in addition to any other charges levied by this title. (Ord. 403 § 22, 1975).
13.28.020 Service connection – No main in street.
(1) Whenever an applicant requests water service to premises that do not have a standard main adjacent
to the premises, a standard main must be installed as a prerequisite to connection to the city water
system. The standard main must conform with the comprehensive water system plan of the city water
system and must be installed along the complete street frontage of the premises to be served.
(2) A standard main may be installed by any of the following methods:
(a) The main may be installed at the property owner’s expense by a contractor under the
supervision and approval of the city supervisor. The city may contract with the owner to provide for
the reimbursement of such owner and his assigns for return of construction expense for a period of
up to 10 years. The city will agree to charge any person who subsequently taps on to the main for
service a pro rata share of the cost of construction of the main and will reimburse the property
owner. Assessments after the expiration of contract period shall revert directly to the city.
(b) If the premises lies within the corporate limits of the city of Oak Harbor, the owner may elect to
have the main installed by making payment to the city of the main assessment as provided in
OHMC 13.28.030(2); provided, however, that the availability of this option is contingent upon
whether or not, in the opinion of a majority of the city council, sufficient money is available in the

current water department budget to provide the necessary funds for the extension. Upon payment
of the assessments designated in this section, the city will undertake to have the main installed.
There will be no reimbursement to the original applicant for subsequent connection to the main.
(c) If the premises lies within the water service area of the city of Oak Harbor, the owner may also
petition to have the main installed by the formation of a local improvement district as prescribed by
state law and the ordinances of the city.
(d) If adequate money is available in the water department fund, the city shall pay the material cost
difference in cases where the comprehensive water plan calls for a main size larger than eight
inches. (Ord. 438 § 10, 1976; Ord. 403 § 23, 1975).
13.28.030 Special charge – Property not previously assessed or costs unpaid.
For owners of property not previously assessed or not having contributed their proportionate share of
construction costs for the water main, a special construction charge will be paid as follows:
(1) If the property in question abuts a main covered by a “late-comer’s agreement” as provided for in
OHMC 13.28.020(2)(a), the special construction charge will be as provided in said agreement.
(2) If a standard main does not exist across the frontage of the premises requesting a service connection,
the superintendent may prepare an estimate of the cost to install the required standard main to serve said
premises. Payment of this estimate will exempt the property for which such payment was made from a
subsequent local improvement district assessment for the installation of a standard main.
(3) If the property in question is not covered by a “late-comer’s agreement” then the special connection
charge will be computed as follows:
(a) The number of units of property frontage to be served by the water main, determined in the
manner prescribed in RCW 35.44.030 and 35.44.040 for determining assessable units of frontage
or by such other method or combination of methods of computing assessments which may be
deemed to more fairly reflect the special benefits to the property being assessed as authorized by
RCW 35.44.047, shall be multiplied by the local improvement assessment per unit of frontage or
developer extension construction costs for the water main involved.
(b) If construction costs are not available for the specific water line for which the connection is being
requested, the city engineer is authorized to compute and establish the average local improvement
assessment cost paid by property owners or average costs for developer extensions for water
mains completed and accepted by the city during that year, which average assessment or
developer extension cost shall be used by him in computing the special connection charge imposed
by OHMC 13.28.010. (Ord. 599 § 1, 1981; Ord. 403 § 24, 1975).

13.28.040 Specifications for standard water mains.
(1) Standard water mains shall not be less than six-inch diameter pipe. Pipes of smaller size may be used
when the city supervisor determines that maximum fire rating could be maintained and the line in question
cannot be extended.
(2) All pipe shall be designed to withstand a minimum internal water pressure of 150 pounds per square
inch and shall conform to the latest adopted standards of the American Water Works Association. All
design standards, quality standards and pipe sizes shall conform to the latest Fire Underwriters
Standards and requirements.
(3) Water mains shall be asbestos cement, cast iron, ductile iron or approved equivalent material. (Ord.
403 § 25, 1975).
Chapter 13.32 RATES AND CHARGES*
Sections:
13.32.005 Water utility fund.
13.32.010 Connection charge.
13.32.025 Water rate – Inside the city limits and state park facilities.
13.32.030 Billing and collection procedures.
13.32.060 Monthly rate – Naval Air Station.
13.32.075 Water rate – Premises beyond city limits.
13.32.083 Master meter connections (water utility district charges).
13.32.085 Construction.
13.32.115 Certificate of occupancy.
*Prior legislation: Ords. 403, 495, 515, 522, 570, 622, 721, 803, 812 and 941.
13.32.005 Water utility fund.
Fund #401, Water Fund, is hereby denominated the water utility fund, which is to be used in the operation
of the water utility. All water service and water connection charges shall be deposited in this fund, to be
used only for the purpose of paying all or any part of the cost and expense of providing water utility
services, or to pay or secure the payment of all or any portion of any issue of general obligation or
revenue bond issued for such purpose. The water service charges shall be established by ordinance.
(Ord. 1584 § 1, 2010).
13.32.010 Connection charge.
(1) A connection charge shall be levied upon any customer prior to connection with city water service.
The connection charge shall be the actual cost of installation. An initial sum, based on the cost estimated
by the water superintendent, or his or her designee, must be paid in advance of service installation. Upon
completion of the connection, the actual cost will be determined and if this amount is greater than the
initial estimate, the customer will be billed for the balance. If the actual cost is less than estimated, the

overpayment will be refunded to the customer. The actual cost of an installation shall include all labor,
equipment and material, plus a charge for overhead as set in the utility rate ordinance.
(2) For water connections outside the city limits of Oak Harbor, a surcharge of 50 percent will be added to
the charges specified above for the extra costs involved in working beyond the normal service area. (Ord.
1584 § 1, 2010; Ord. 973 § 1, 1994).
13.32.025 Water rate – Inside the city limits and state park facilities.
(1) Water Service Charge. A water service charge shall be levied on all water customers. The water
service charge shall consist of an administrative charge for service, also termed a “monthly ready to serve
charge,” a consumption charge for actual use, and a monthly charge for sprinkler systems, if any.
(a) Administrative Charge. The administrative charge for water supplied by the city to single-family
residential, commercial and industrial customers inside the city limits and state park facilities shall
be based on the number and size of the meter(s) serving the customer. A multifamily residential
administrative charge shall apply to each meter serving a premises authorized for two or more
dwelling units pursuant to a certificate of occupancy. The administrative charge for service to a
multifamily residential meter shall be based upon the number of dwelling units served by the meter
less a factor reflecting administrative savings due to single meter usage.
(b) Consumption Charge. The consumption charge shall be based on the quantity of water used
and shall increase according to a schedule established by the utility rate ordinance.
(c) Sprinkler System Charge. The monthly charge for sprinkler systems, if any, shall be a flat rate
based upon the cost of service of sprinkler systems to the water utility.
(2) Rates to Be Set in the Utility Rate Ordinance. The water service charge shall be set in accordance
with the policies and requirements of this chapter in the utility rate ordinance. The utility rate ordinance
should be reviewed annually to ensure that it properly reflects the costs of service, operation,
maintenance and construction of the water utility services. (Ord. 1584 § 1, 2010; Ord. 1529 § 1, 2008;
Ord. 1492 § 1, 2007; Ord. 1452 § 1, 2006; Ord. 1418 § 1, 2005; Ord. 1306 § 1, 2002; Ord. 1292 § 1,
2001; Ord. 1258 § 1, 2001; Ord. 1240 § 1, 2000; Ord. 1228 § 1, 2000; Ord. 1201 § 1, 1999; Ord. 1192 §
1, 1999; Ord. 1130 § 1, 1998).
13.32.030 Billing and collection procedures.
Billing and collection procedures for the utility shall be as provided in this title and OHMC Title 3 and
under state law as now in effect or hereafter amended. (Ord. 1584 § 1, 2010; Ord. 1348 § 21, 2003).
13.32.060 Monthly rate – Naval Air Station.
(1) The charge for water consumed by the Naval Air Station shall be determined by agreement between
the city and the U.S. Navy and shall be reflected in the utility rate ordinance. (Ord. 1584 § 1, 2010; Ord.
973 § 1, 1994).

13.32.075 Water rate – Premises beyond city limits.
The water service charge for customers residing outside the city limits shall be one and one-half times the
rate charged for the similar water service established by the utility rate ordinance. (Ord. 1584 § 1, 2010;
Ord. 1130 § 2, 1998).
13.32.083 Master meter connections (water utility district charges).
(1) The administrative charge for master meter connections (water service connections to water districts)
shall be based upon meter size.
(2) The administrative charge and water usage will be charged at one and one-half times the rate for in-
city non-single-family residential customers for equivalent water usage. (Ord. 1584 § 1, 2010; Ord. 1130 §
3, 1998).
13.32.085 Construction.
During the construction of any building and before water is installed as provided in this title, as amended,
the contractor so constructing such building may be permitted to use the city water supply by making
application therefor pursuant to OHMC 3.95.040 and paying the charges prescribed by the utility rate
ordinance. (Ord. 1584 § 1, 2010; Ord. 1130 § 6, 1998; Ord. 973 § 1, 1994).
13.32.115 Certificate of occupancy.
No water shall be turned on for service in any premises for which a certificate of occupancy has not been
obtained, in advance, from the city building department; provided, that water may be turned on for
construction work in unfinished buildings, subject to the provisions of OHMC 13.32.085. (Ord. 1584 § 1,
2010; Ord. 973 § 1, 1994).
Chapter 13.36 FIRE PROTECTION SYSTEMS
Sections:
13.36.010 Installation permitted – Rate – Billings.
13.36.020 Private systems – Approval required – Standards – Application.
13.36.030 Connection lines – Separation from water supply – Prohibited acts.
13.36.040 Installation – Permit required – Requirements.
13.36.050 Damage liability.
13.36.010 Installation permitted – Rate – Billings.
Fire protection systems may be installed in the city of Oak Harbor. The rate therefor shall be $12.72 per
month, plus $1.79 per inch of the diameter of the fire service pipe over eight inches in diameter at the city
main. Billings shall be part of the water utility bill. (Ord. 1306 § 3, 2002; Ord. 1292 § 3, 2001; Ord. 1258 §
3, 2001; Ord. 1240 § 1, 2000; Ord. 1228 § 3, 2000; Ord. 1201 § 3, 1999; Ord. 1192 § 4, 1999; Ord. 1130
§ 4, 1998; Ord. 403 § 36(a), 1975).

13.36.020 Private systems – Approval required – Standards – Application.
Private fire protection systems must be approved by the city supervisor. They may include automatic
sprinkler heads, standpipes, hose racks and connections, inside and outside fire hose outlets, hydrants
and such other appurtenances. Automatic sprinkler system installations shall comply with the 1972
Edition of the National Fire Protection Association Pamphlet No. 13. Before any system is installed,
application shall be made to the city supervisor and a diagram of the installation shall be submitted. The
diagram shall contain a list of all material to be used, valve locations and service line pipe size. (Ord. 403
§ 36(b), 1975).
13.36.030 Connection lines – Separation from water supply – Prohibited acts.
Fire connection lines shall be separate from the regular water supply. No water may be withdrawn from
the lines except for fire. It is unlawful for any person or firm who has a water connection for fire protection
purposes to add any other connection or let water be used off the premises for which the connection is
made. (Ord. 403 § 36(c), 1975).
13.36.040 Installation – Permit required – Requirements.
No installation may be made until a permit has been issued and the installation shall only be done
according to plans approved by the city supervisor. The city of Oak Harbor must be notified before any
work is done in the street right-of-way or on the water use detection system. The city of Oak Harbor will
have an inspector on the site while work is being done in the city street or where the water main is being
tapped. The applicant will pay all installation costs of the fire protection system, including all costs of
inspection. (Ord. 403 § 36(d), 1975).
13.36.050 Damage liability.
The city will not be responsible nor liable for any personal injury or property damage or any loss due to
fire or otherwise by reason of an insufficient quantity of water and/or insufficient water pressure for any
reason whatsoever. Rates established for service connections of this type are conditioned upon the
premise that no liability of any nature whatsoever shall attach to the water department by reason of failure
of water quantity or water pressure. (Ord. 403 § 36(e), 1975).
Chapter 13.40 VIOLATIONS
Sections:
13.40.010 Penalty.
13.40.010 Penalty.
(1) Any person, firm, association or corporation found guilty of violating OHMC 13.12.020, Damaging or
interfering with water system prohibited, or OHMC 13.12.060, Unauthorized connection and turning off
prohibited, shall be punishable as a gross misdemeanor and may be fined up to $5,000 or imprisoned up
to 365 days in jail or both such fine and jail time.

(2) Reckless or intentional interruption of service to a customer of the water utility which is the result of a
prohibited act under Chapter 13.12 OHMC shall be a gross misdemeanor punishable by a fine of up to
$5,000 or a year in jail or both such fine and jail time. Interruption of service to each customer affected by
an interruption, in violation of Chapter 13.12 OHMC, shall be a separate offense.
(3) Any person, firm or corporation found guilty of intentionally or recklessly violating the terms of this title
(except as specified in subsections (1) and (2) of this section) shall be guilty of a misdemeanor and may
be fined up to a sum of $1,000 or imprisoned up to 90 days in jail, or both such fine and jail time.
(4) Other violations of this chapter are civil infractions punishable by a fine of up to $250.00 under
procedures set out in Chapter 1.20 OHMC, as now in effect or hereafter amended.
(5) Each day of continued violation shall be a separate offense. (Ord. 1393 § 8, 2004; Ord. 1014 § 10,
1995; Ord. 403 § 41, 1975).

APPENDIX F
2009 NEW RESERVOIR PROJECT PREDESIGN REPORT

CITY OF OAK HARBOR ISLAND COUNTY WASHINGTON
NEW RESERVOIR PROJECT PREDESIGN REPORT
G&O NO. 08426 AUGUST 2009

CITY OF OAK HARBOR ISLAND COUNTY WASHINGTON
NEW RESERVOIR PROJECT PREDESIGN REPORT
G&O NO. 08426 AUGUST 2009

i
TABLE OF CONTENTS EXECUTIVE SUMMARY ..........................................................................................................1
Reservoir Siting Analysis And System Modeling Results ......................................1 Reservoir Capacity Analysis Results .......................................................................2
EXISTING STORAGE FACILITIES ............................................................................................3 The Heller Road Facility ..........................................................................................3 The Eastside Reservoir ............................................................................................3
COORDINATION WITH NAVAL AIR STATION WHIDBEY ISLAND ............................................3 CONCLUSIONS AND RECOMMENDATIONS ..............................................................................4 PROJECT DESCRIPTION AND OBJECTIVES ..............................................................................6 GENERALIZED DESCRIPTION OF THE OAK HARBOR WATER SYSTEM ....................................7
Sources Of Supply ...................................................................................................7 Transmission Mains .................................................................................................7 Distribution System .................................................................................................8
The Mainland Zone – HGL 405 ...................................................................8 The Downtown Zone – HGL 335 ................................................................9 The Heller Booster Zone – HGL 440 ..........................................................9 The Redwing Pressure Zone – HGL 433 .....................................................9
Storage Facilities ......................................................................................................9 The Heller Road Facility ............................................................................10 The East Side Standpipe ............................................................................10
RESERVOIR SITING ANALYSIS .............................................................................................11 Initial Model Analysis – Focus And Findings .......................................................12
RESERVOIR CAPACITY ANALYSES ......................................................................................14 LOCATION SITE SELECTION CONSIDERATIONS FOR THE NEW RESERVOIRS ........................21
Ft. Nugent Park Site ...............................................................................................22 Heller Road Site .....................................................................................................22 East Side Reservoir Site .........................................................................................23 The Highway 20 Site .............................................................................................24 Gun Club Road Site ...............................................................................................25 The Recommended Site .........................................................................................27
DISTRIBUTION SYSTEM TRANSMISSION CAPACITY IMPROVEMENTS ...................................27 Delivery To The Gun Club Road Site ....................................................................27 The Extension To The 480 West Zone ..................................................................29 The Extension To The 480 East Zone ....................................................................29
OVERALL PROGRAM OF IMPROVEMENTS ............................................................................30 CONCLUSIONS AND RECOMMENDATIONS ............................................................................30

ii
LIST OF TABLES No. Table Page 1 Current (2009) and Future Build-Out ERUs and System Demands by
Existing Zones - Based on Demand .................................................................15 2 Future (2029) ERUs and System Demands by Existing Zones .............................16 3 Current (2009) System Storage Analysis By Current Zones .................................16 4 Future (2029) System Storage Analysis by Current Zones ...................................17 5 Future (2029) ERUs and System Demands by Future Zones ................................18 6 Future (Build-Out) ERUs and System Demands by Future Zones ........................18 7 Future (2029) System Storage Analysis by Future Zones .....................................19 8 Future (Build-Out) System Storage Analysis by New Zones ................................20 9 Ft. Nugent Park Site Pros and Cons .......................................................................22 10 Heller Road Site Pros and Cons .............................................................................23 11 East Side Reservoir Site Pros and Cons .................................................................24 12 Highway 20 Site Pros and Cons.............................................................................25 13 Gun Club Road Site Pros and Cons .......................................................................26
LIST OF FIGURES No. Figures Follows Page 1 Existing Water System with Transmission Mains ...................................................8 2 Existing Water System with Pressure Zones ...........................................................8 3 Existing Water System with Pressure Zone Schematic ...........................................8 4 Proposed Water System .........................................................................................20 5 Proposed Water System Pressure Zone Schematic ................................................20 6 Proposed Water System Capital Improvement Projects ........................................28
APPENDICES Appendix A – System Modeling, Calibration, and Initial Analysis Appendix B – Updated System Data for 2001 – 2008 from City Records Appendix C – Pipeline Cost Estimates

City Of Oak Harbor 1 New Reservoir Predesign Report August 2009
EXECUTIVE SUMMARY The City of Oak Harbor (City) engaged Gray & Osborne, Inc. (G&O) to provide engineering services to assist in determining the best location for a new reservoir and to provide the design for a new reservoir on the selected site. The scope of work included updating the computerized water system model developed by the engineering fire that wrote the City’s 2003 Water System Plan, and an independent analysis of the total reservoir capacity needed by the City. RESERVOIR SITING ANALYSIS AND SYSTEM MODELING RESULTS The City desired that five pre-identified sites be considered in the siting analysis, as each of the sites is either owned by, or readily available to, the City. Gray & Osborne reviewed the identified sites that were under consideration with regard to their attributes, relationships to the existing pressure zones, and distribution system transmission capability. This process showed that: 1) The lack of transmission capacity within the distribution system was a major factor in siting of the reservoir; and 2) one or more new, higher hydraulic grade line (HGL) pressure zone(s) would be required to address identified low pressure areas within the system. The following comments summarize Gray & Osborne’s findings.
• The Ft. Nugent Park site in the southwest corner initially appeared to be the logical location, since the future growth is anticipated to be to the southwest. The limited capacity to move incoming water to the southwest, the need for a higher local HGL to improve local system pressures, and the inability to address pressure issues in other portions of the system ultimately ruled this site out.
• The Eastside Reservoir site is not large enough for the size of reservoir
needed. It would also require pumping all of the water delivered from it, and would require significant transmission line construction throughout the City to deliver water to the future growth areas. This site was ruled out based on the size of the site, even before the transmission issues were considered.
• The SR 20 site in the northeast section of the system is large, but would
require pumping of all water delivered from the reservoir, as well as significant transmission line construction to deliver water to the southwest.
• The Heller Road site is not large enough for the sizes of reservoirs needed,
unless the existing reservoirs were removed, which would mean paying for the replacement volume as well. If taller reservoirs were used, the height would require that all incoming water be pumped into the reservoirs, and the water at the lower levels of the reservoirs would need to be pumped out as well. Transmission capacity to deliver water to the

City Of Oak Harbor 2 New Reservoir Predesign Report August 2009
reservoirs and from the reservoirs to the areas of higher elevation in the southwest and northeast areas would need to be provided. This site was thus eliminated from consideration for additional storage.
• The Gun Club Road Site initially appeared to be far from the anticipated
growth area, although its location and elevation were both favorable to receiving incoming water form Anacortes and for delivery of water by gravity to a large portion of the existing system. Since a booster pump station (BPS) will be needed to deliver water to the west and southwest at a higher hydraulic grade line (HGL), this station could also provide higher pressure to the current low pressure area in the northeast, if transmission capacity were built to serve that area. Installing the transmission line to the east from the reservoir to serve the northeast area will also eliminate the need to build a much longer, and thus more expensive, line that was planned to move water into the area. With facilities at the Gun Club Road site, the high areas near the Heller Road Reservoirs and Redwing Park area in the northwest could also be served at the higher HGL, allowing removal of the two existing booster pump stations that serve them, thus concentrating essentially all of the new storage and pumping functions for the system into a single facility. And from this location, much of the transmission line construction to the southwest area can be built over time through developer extensions as growth occurs, or constructed by the City through connection fees collected as development occurs.
• Other Sites – With the Gun Club Road site being City property located on
one of the highest points in the local area, relatively near the incoming supply line from Anacortes, and recognizing the size of parcel that might be needed for multiple reservoirs and a booster pump station, no other sites were sought out.
RESERVOIR CAPACITY ANALYSIS RESULTS Gray & Osborne prepared an analysis of the overall system storage needs based on Washington State Department of Health guidelines. While the project originally envisioned a 3.0 MG of additional storage, Gray & Osborne found the long-term built out system will need a total of approximately 7.0 MG of additional storage, including replacement of the storage volume provided by existing 0.54-MG Eastside Reservoir, recommended for replacement due to its age and lack of a proper foundation. The available system storage capacity is marginally adequate for only the very near-term. Even minor growth will cause the system to become storage deficit. In addition, the planned system improvements to address pressure and fire flow issues by creation of new pressures zones will cause the system be become storage deficient. With these changes and anticipated growth, the system will require an additional 4.0 MG of storage by 2029.

City Of Oak Harbor 3 New Reservoir Predesign Report August 2009
EXISTING STORAGE FACILITIES Three storage reservoirs, two at the Heller Road Reservoir site, and one at the East Side Reservoir site located at Regatta Drive and NE 5th, serve the City’s water system. THE HELLER ROAD FACILITY The primary storage facility is the Heller Road Storage Facility has two reservoirs with a total capacity of 2.54 MG. The large reservoir was constructed in 1976. The smaller was constructed in 1963. These reservoirs are in generally good condition. Both reservoirs “float” on the distribution system, meaning that water moves into and out of the reservoirs as needed, in combination with incoming flow from Anacortes, to meet the demands within the system. These reservoirs also supply water to the Downtown Zone, the Heller Booster Zone and the Redwing Pressure Zone. THE EASTSIDE RESERVOIR The Eastside Reservoir is constructed of steel and provides approximately 540,000 gallons of storage. The Reservoir was originally constructed in 1949 and expanded in 1959. This Reservoir is located on Regatta Drive, and is fed from the Mainland Zone distribution system. The water level in the Reservoir is controlled by an inlet altitude valve, which opens to allow water to enter the Reservoir when the level drops below an established level. The discharge line allows water in the Reservoir to float on the Downtown Zone to establish the HGL for the Zone. The Downtown Zone is also served by five pressure-reducing valves (PRVs). These PRVs begin opening when the Reservoir level drops a few feet below the overflow level and, as a result, the lower three quarters of the storage volume provided by the Reservoir is essentially unused. The combination of these PRVs has more than adequate flow capacity to serve all the needs in the downtown Zone. This reservoir has no foundation and rests directly upon the soil beneath it. With no foundation, the seismic stability of the reservoir is highly suspect. The investment needed to retrofit the reservoir for seismic stability, combined with the cost of recoating both the interior and exterior of the reservoir, would be substantial. A seismic retrofit would also call for a reduced maximum operating level that would reduce the effective storage volume provided by this reservoir. This combination of costs versus benefits has lead Gray & Osborne to recommend to City staff that this reservoir be considered for abandonment. COORDINATION WITH NAVAL AIR STATION WHIDBEY ISLAND The staff at Naval Air Station Whidbey Island (NAS) has been planning to install a transmission main from the NAS base to the existing school and a proposed future

City Of Oak Harbor 4 New Reservoir Predesign Report August 2009
housing development of 300 to 400 housing units to be located east of the City. The required fire flow was indicated as being 3,500 gpm. Addressing the low-pressure issues in the northeast portion of the system with the reservoirs and booster pump station at the Gun Club Road site by installing the needed transmission line to the east, also provides the opportunity to coordinate with NAS to serve their needs. This proposed new alignment would result in substantial savings to both NAS and the City when compared to previous plans. City staff has contacted NAS and there is interest in partnering on the project to both eliminate a duplication of facilities and realize these potential savings. CONCLUSIONS AND RECOMMENDATIONS Based on the findings of the system analyses performed using the updated computer model, Gray & Osborne’s reviews of each of the pre-identified reservoir sites, the updated reservoir capacity analysis, and the recently identified coordination potential for serving the NAS school east of the City, Gray & Osborne drew the following conclusions:
• The Oak Harbor water system currently lacks the transmission capacity to adequately deliver high flow rates to the future growth area southwest and west of the City and still maintain the minimum required system pressures.
• Any of the preidentified sites considered for locating one or more
reservoirs will require construction of at least one additional booster pump station to facilitate the movement of the required fire flows within the system, and one additional booster pump station to address the low pressure area in the northeast portion of the City. With the recommended location and system reconfiguration, one booster pump station can serve both purposes, as well as eliminate two existing small booster pump stations used to boost pressures for small areas.
• The current total reservoir capacity in the system will be deficient in
storage volume under DOH guidelines when the needed system reconfiguration is undertaken to address system pressure and fire flow issues. The needed additional storage capacity, including replacing the Eastside Reservoir capacity, is approximately 4.0 MG to address projected growth over the next 20 years. The exact time at which a second reservoir will be needed for build out is dependent upon the rate of growth in the area.
• Even the projected volume of needed additional storage does not relieve
the City’s vulnerability to a potential longer-term interruption of the incoming supply line from the City of Anacortes system, as it provides such a high proportion of the total system supply. There are few opportunities for development of sufficient local supply to offset this

City Of Oak Harbor 5 New Reservoir Predesign Report August 2009
vulnerability unless consideration is given to a very expensive backup capacity that might be provided from a desalination plant.
• By establishing the firm, schematic concept for development of the
ultimate transmission conveyance system to serve the southwest portion of the City and its future growth area, and then managing the development of that area in relation to the provision of water service, the City should have the capability to develop sufficient financial capacity to develop the needed system through connection charges and requiring developers to participate in, or install, segments of the new pipe lines. This may present some limitations on the sequence of areas that can be developed and served; however, the orderly development of the various areas may also be enhanced.
Gray & Osborne recommends the City of Oak Harbor proceed with the overall program of system upgrades in the following manner:
• Project No. 1 – Construct the 18-inch inflow and outflow lines between the point of connection to the existing system in Oak Harbor Road and the Gun Club Road Reservoir Site, a total of approximately 5,800 LF of pipe line, and install the PRV station at Oak Harbor Road to allow readjustment of the incoming line pressure to meet the current Mainland Zone HGL. Estimated Cost - $2,306,000.
• Project No. 2 – Construct a new 4.0-MG reservoir at the Gun Club Road
Site. The size will be approximately 150 feet in diameter and 30-feet high with a high water operating elevation of 425 feet. Estimated Cost - $3,100,000.
• Project No. 3 – Modify the pumping configuration of the Ault Field
facility to boost the incoming HGL from Anacortes in order to allow filling of the new reservoir. This would be an interim step that could be omitted if either the booster pump station at the Gun Club Road Site or the new station at Sharps Corner were built first. Estimated Cost- $300,000.
• Project No. 4 – Construct the new booster pump station at the new
reservoir site in preparation for extension of the west to east transmission line to serve the NAS need for fire flow supply at the east edge of the City. This station will include the capability to boost incoming water to the overflow elevation of the reservoir, so, if the Ault Field facility was modified, it could be taken off line when this is complete. Estimated Cost - $1,900,000.

City Of Oak Harbor 6 New Reservoir Predesign Report August 2009
• Project No. 5 – Construct the west to east transmission line to create the new 480 East Zone and raise the HGL for the low pressure areas in the northeast portion of the City. Estimated Cost - $3,160,000
• Project No. 6 – Construct the remaining portion of the needed
transmission improvements, PRV stations and isolation valving, to extend the extent of the 480 East Zone and deliver 3,500 gpm to NAS. Estimated Cost - $852,000.
• Project No. 7 – Construct the dedicated line between the Heller Road
Reservoir site and the mainland Zone to allow it to be isolated from the new 480 West Zone. Estimated Cost - $780,000.
• Project Nos. 8 thru 12 – Construct the various segments of 16-inch
transmission lines in sequence to extend the new 480 West Zone to the southwest portion of the system. Combined Estimated Cost - $9,615,000.
PROJECT DESCRIPTION AND OBJECTIVES The City of Oak Harbor (City) engaged Gray & Osborne, Inc. (G&O) to provide engineering services to assist in selecting the location for a new reservoir and to provide the design for a new reservoir on the selected site. The scope of work included updating the computerized water system model developed by Earth Tech, Inc., the engineering firm that prepared the City’s 2003 Water System Plan (03-WSP), and provided to Gray & Osborne by the City, and an independent analysis of the total reservoir capacity needed by the City. The first phase of the project scope of work was to update the computer model and reestablish calibration of the model. Following that, an analysis of the system was to be undertaken to assist in determining the most advantageous location for the reservoir. Factors considered in reviewing reservoir locations included: Current system operations; future system expansion; the capability to allow phased installation of future improvements in a coordinated manner; and the water transmission capabilities within the distribution system. The City had preidentified five potential sites for the reservoir facility, and desired that each site be considered and evaluated during the site selection process. Special consideration was to be given to the fact that each of these sites is either owned by the City or readily available to the City. The third portion of the project was to provide an independent analysis of the near-term and long-term system storage capacity needs. The objective of this analysis was to verify that the size of the reservoir being considered would be adequate to serve the City for a reasonable period of time before additional capacity might be needed.

City Of Oak Harbor 7 New Reservoir Predesign Report August 2009
The last portion of the first phase of the project is to provide 30 percent design documents for the reservoir project. GENERALIZED DESCRIPTION OF THE OAK HARBOR WATER SYSTEM The City of Oak Harbor owns and operates the water system that serves the community and also provides water to the Naval Air Station – Whidbey Island (NAS) facility located to the north of the City. The following sections provide a general description of the system and those components that influence the location and sizing of the proposed reservoir. The system, its zones, the pre-identified potential reservoir sites and existing distribution lines larger than 10-inch diameter are shown in Figure 1. Information upon which the descriptions below are based include the 2003 Water System Plan (03-WSP), prepared by Earth Tech, Inc., discussion with City staff, and discussions with City of Anacortes staff pertaining to operational characteristics of the Anacortes system. SOURCES OF SUPPLY The City’s primary water source is a wholesale purchase agreement with the City of Anacortes. Under this agreement, Anacortes delivers treated water to the City at Sharpe’s Corner, located approximately 12 miles north of the City on US Highway 20. The quantity of water available from Anacortes is open to periodic renegotiation when the City needs additional water. The water supply agreement specifies that the minimum hydraulic grade line (HGL) at Sharpe’s Corner will be at elevation 302, although the normal operating HGL is on the order of 323 feet.
NOTE: The HGL elevations stated in the supply agreement are based upon NGVD ‘29 elevations. The City’s datum is based upon NGVD ‘29 plus 100 feet. The corresponding HGL at Sharpe’s Corner are approximately 402 and 423 feet, respectively when referring to the City datum. All references to elevation in the remainder of this Report are based upon the City’s datum.
In addition to the Anacortes supply, the City has three operating well sources, Wells 8, 9 and 11, with a combined production capacity of 430 gpm. These wells are located within the City just east of Heller Road. (See Figure 1.) TRANSMISSION MAINS The City owns a 24-inch waterline that runs approximately 12 miles from the metering station at Sharpe’s Corner south, across the Deception Pass Bridge, to the Ault Field Pump Station (Ault Field) facility in the northerly portion of the City’s service area. The City also owns a 10-inch waterline from a metering station near the north end of the

City Of Oak Harbor 8 New Reservoir Predesign Report August 2009
Deception Pass Bridge, across the Bridge, to the Ault Field facility. The 10-inch line is fed from the Anacortes distribution system that serves portions of the Fidalgo Island community north of Deception Pass. The only current limitation to the Anacortes supply is related to low pressure in the 24-inch transmission line at the high points in the transmission line between Sharpe’s Corner and the Ault Field facility. Low pressure can be the result of either head losses (hydraulic friction losses) during periods of high flow or low supply HGL from Anacortes, or a combination of the two factors. Under current normal operating conditions, the incoming HGL is more than sufficient to allow flow directly into the distribution system. The Ault Field facility allows water to bypass the pumping facilities and flow directly to the distribution system under most operating conditions. This facility was intended to boost the incoming HGL to move water into the distribution system during periods of reduced supply HGL. This has rarely been needed, however. It is anticipated that future system demands will require the City to invest in a pumping station at Sharpe’s Corner to boost the supply HGL sufficiently to avoid the low transmission line pressures and overcome the head losses in the transmission line as the demand grows. This facility is not part of the proposed Reservoir project, and the cost of the facility is not included in the later listing of proposed system improvements. From the Ault Field facility south into the distribution system, the only large diameter line that would be considered a transmission main runs within Oak Harbor Road from the Ault Field facility to approximately Gun Club Road. The remainder of the “transmission” function through the system is in the distribution system, which has a few 12-inch mains along major corridors and smaller diameter distribution piping of primarily 8-inch pipes. See Figure 1.) DISTRIBUTION SYSTEM The City’s distribution system is currently composed of four pressure zones, referred to as the Mainland Zone (into which the incoming water from Anacortes flows), the Downtown Zone, the Heller Booster Zone to the west, and the Redwing Pressure Zone in the northwest portion of the City. Figures 1, 2 and 3 show the City’s service area and the existing pressure zones within it, with Figure 3 providing a three dimensional perspective of the system. The Mainland Zone – HGL 405 The Mainland Zone serves the major portion of the City’s service area. The 03-WSP indicates this zone had approximately 5,790 services in 2003, which correlates to an average daily demand (ADD) of approximately 1.17 million gallons per day (mgd). The HGL in the zone is established by the combination of the water surface in the Heller Road Reservoirs and the incoming flow from Anacortes through the Ault Field facility. Under normal operation, the inflow from Anacortes flows directly into the Mainland Zone distribution system and fills the two Heller Road Reservoirs. The HGL in the

City Of Oak Harbor 9 New Reservoir Predesign Report August 2009
Mainland Zone is impacted slightly during periods when the NAS system is drawing water from the City’s system near the Ault Field facility. This impact causes water to be drawn from the Heller Road Reservoirs. During periods when the NAS is not drawing water, the HGL in the system again rises to fill the Heller Road Reservoirs. Observations of system time-lapse records of this inflow/outflow situation indicate this cyclical pattern, and Staff has discussed the need to close or partially close some valves near the Heller Road facilities in order to induce some head losses to prevent overflowing the Reservoirs. The Downtown Zone – HGL 335 The Downtown Zone serves the lower portions of the City that are a combination of the older residential neighborhoods and the original business district that is known as being the downtown area. The southerly portion of this area is along the shore of the body of water known as Oak Harbor. The 03-WSP indicates this zone had approximately 1,450 services in 2003, which correlates to an average daily demand (ADD) of approximately 0.29 million gallons per day (mgd). The HGL for the Downtown Zone is established by the East Side Reservoir and a combination of five reducing valve (PRV) stations. The PRVs are set to become active when the Reservoir is drawn down approximately 11 feet. The Heller Booster Zone – HGL 440 The Heller Booster Zone is a “closed” pressure zone (meaning that it has no reservoir open to the atmosphere) that is fed by a booster pump station located at the Heller Road Reservoir facility. The Zone encompasses the high ground surrounding the facility. The Redwing Pressure Zone – HGL 433 Similar to the Heller Booster Zone, the Redwing Pressure Zone is a closed zone fed by a booster pump station, including a fire flow pump, that draws water from the distribution system and raises the HGL sufficiently to serve a limited area in the northwest portion of the City. STORAGE FACILITIES Three storage reservoirs, two at the Heller Road Reservoir site, and one at the East Side Reservoir site, serve the City’s water system. As a point of clarification, the term “reservoir” is used both as a generic, all-inclusive term referring to water storage facilities of any type or configuration. When referring to steel reservoirs, those that are taller than their diameters are typically referred to as standpipes. This distinction will be observed when appropriate in this Report. In addition, the heights of reservoirs are typically referring to the height of the overflow level above the reservoir base.

City Of Oak Harbor 10 New Reservoir Predesign Report August 2009
The Heller Road Facility The primary storage facility is the Heller Road Storage Facility with one reservoir and one standpipe. The large reservoir at this site, a 2.0-million gallon (MG) steel reservoir, is approximately 78 feet in diameter, 56.5 feet high and was constructed in 1976. The smaller, a 585,000 gallon steel standpipe is approximately 42 feet in diameter, 56.5 feet high and was constructed in 1963. These reservoirs are in generally good condition. Both reservoirs “float” on the distribution system, meaning that water moves into and out of the reservoirs as needed, in combination with incoming flow from Anacortes, to meet the demands within the zone. These reservoirs also supply water to the Downtown Zone, the Heller Booster Zone and the Redwing Pressure Zone. The East Side Standpipe The East Side Standpipe is constructed of steel and provides approximately 540,000 gallons of storage. The Standpipe is approximately 41.5 feet in diameter, 53 feet in height and was constructed in 1949 and expanded in 1959. This Standpipe is located just west of Regatta Drive, and is fed from the Mainland Zone distribution system. The water level in the Standpipe is controlled by an inlet altitude valve, which opens to allow water to enter the Standpipe when the level drops below an established level. The discharge line allows water in the Standpipe to float on the Downtown Zone to establish the HGL for the Zone. The Downtown Zone is also served by five PRVs with ample flow capacity to serve the Zone. In order to ensure sufficient pressure to the Downtown Zone, these PRVs begin opening within a few feet (indicated to be 11 feet) below the overflow level of the Standpipe in order to have the full capacity of each be effective when needed. As a result, the lower three quarters of the storage volume provided by the Standpipe is essentially unusable in coordination with the PRVs feeding into the Zone because they provide more than adequate capacity to supply the highest fire flow in the Zone, and then refill the reservoir to the HGL corresponding with their corresponding closing set points. This reservoir has no foundation and rests directly upon the soil beneath it. With no foundation, the seismic stability of the reservoir is highly suspect. The investment needed to retrofit the reservoir for seismic stability, combined with the cost of recoating both the interior and exterior of the reservoir, would be substantial. A seismic retrofit would also call for a reduced maximum operating level that would reduce the effective storage volume provided by this reservoir. This combination of costs versus benefits has lead Gray & Osborne to recommend to City staff that this reservoir be considered for abandonment whenever an investment in prolonging its life, such as recoating, is considered necessary.

City Of Oak Harbor 11 New Reservoir Predesign Report August 2009
RESERVOIR SITING ANALYSIS The City identified five locations it had considered as potential sites for a new reservoir facility. Each site was reviewed preliminarily during a drive-by orientation to the City’s system. City staff provided a brief discussion of each site. Discussions also covered future growth potential over the mid-term (10 to 15 years) and long-term (build out). It was understood that a large portion of the system growth (65%+) would be served by system extensions to the southwest of the City, beyond the existing service area. Initially City staff indicated that a 1,000-gpm to 1,500-gpm fire flow should be considered in the growth areas. After further discussions, a 2,500-gpm fire flow was adopted for use in the analysis in anticipation of potentially larger homes (the International Fire Code requires single or two family residential structures of 3,600 sq. ft. or more to have a minimum of 1,500-gpm fire flow available) and small community type commercial developments such as convenience stores, churches and schools. An important set of factors to understand are the requirements for service pressures that must be considered in siting and designing water system improvements. The applicable pressure criteria are established by Washington State Department of Health (DOH) standards contained in WAC 246-290-230, which states in Sections (5) and (6) that:
“New public water systems or additions to existing systems shall be designed with the capacity to deliver the design (peak hour demand) PHD quantity of water at 30 psi (210 kPa) under PHD flow conditions measured at all existing and proposed service water meters or along property lines adjacent to mains if no meter exists, and under the condition where all equalizing storage has been depleted.”
“If fire flow is to be provided, the distribution system shall also provide maximum day demand (MDD) plus the required fire flow at a pressure of at least 20 psi (140 kPa) at all points throughout the distribution system and under the condition where the designed volume of fire suppression and equalizing storage has been depleted.”
As points of reference regarding the pressures stated above, the 30 psi requirement means that any water stored less than 69 feet (30 psi X 2.31 ft/psi) above the highest water service, or potential service, cannot be considered to be available to serve the domestic demands in the system unless the pressure is reliably boosted to the appropriate HGL corresponding to that service pressure and elevation. To the 69 feet, additional consideration must be given to any head losses within the system leading to that service. Similarly, any water stored less than 46 feet (20 psi X 2.31 ft/psi) plus an additional height to reflect any head losses within the system, above the highest service cannot be considered to be available to provide emergency water supply during system outages, or for fire suppression purposes. These criteria can be met through the placement of the reservoir(s) at elevations that provide the needed height above the service(s), or by using

City Of Oak Harbor 12 New Reservoir Predesign Report August 2009
pumping systems, with the proviso that redundant pumping capacity and power supply must be available to ensure availability of the required flows and pressures under the specified conditions. INITIAL MODEL ANALYSIS – FOCUS AND FINDINGS The distribution system expansion referred to in the 03-WSP was reflected in the original model as a skeletal system beyond the existing distribution system. Most of the future system growth was projected to be to the southwest. This assumption was therefore used as the starting point for our analysis. Initial consideration focused on the Ft. Nugent Park site for the proposed reservoir and a booster pump station (BPS). With the 03-WSP recommendations focused on this site and the knowledge that most of the future growth would be in this general area and to the west of this site, this became the “obvious choice” for siting the proposed reservoir. One of the limitations for the Ft. Nugent Site discussed during our orientation tour was the height of a reservoir that could be built there: A tall standpipe would not be acceptable on this site, as it was an important recreational resource for the community. This limitation would therefore require the installation of a BPS to pump water from a low level, or even underground, reservoir on this site to an HGL high enough to provide sufficient pressures within the southwest growth area to be served by the reservoir, as well as PRVs to drop water from this new zone back into the 405 Zone. A fixed head reservoir was used in the model to represent a reservoir and BPS at the Ft. Nugent Park site to serve the southwest growth area and supplement the supply to the 405 Zone in that area. The intent was that flow into the new reservoir would occur during off-peak periods of normal operating conditions, and flow would be restricted when pressures in the 405 Zone could not be sustained by the existing system and required water to be supplied by the new BPS. With this basic assumption on supplying water to the new reservoir, the analysis of the capability of the existing water system to serve both the existing system and the future growth expected in the southwest portions of the service area was begun. The initial findings were surprising, showing that even under normal MDD operating conditions, the 405 Zone could not supply flow to replenish a new reservoir at the Ft. Nugent site while also serving those portions of the southwest service area that were developing and not intended to be in the new, higher HGL zone. The result was unacceptable reductions in pressures in the areas south of and around the Heller Road storage facilities that were not in the Heller Booster Zone. The observed results were a demonstration of the insufficient transmission capacity into the southwest area. One solution would be for the size of the new reservoir and the capacity of the new BPS to be sufficient to provide the total fire flow plus MDD flow needs of the areas to be served, and a dedicated supply line added from the Heller Road Storage to reduce the influence the added flow was having on the 405 Zone. The alternative was to pursue a significant amount of water main replacement to improve hydraulic characteristics in the area.
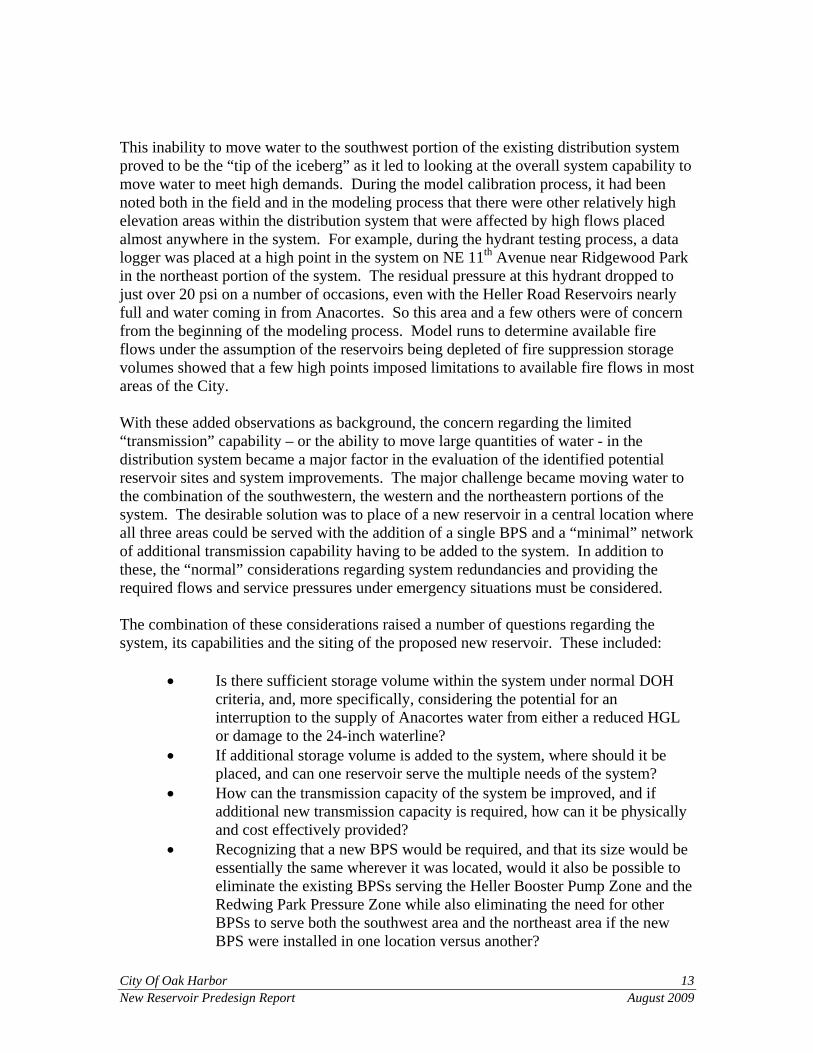
City Of Oak Harbor 13 New Reservoir Predesign Report August 2009
This inability to move water to the southwest portion of the existing distribution system proved to be the “tip of the iceberg” as it led to looking at the overall system capability to move water to meet high demands. During the model calibration process, it had been noted both in the field and in the modeling process that there were other relatively high elevation areas within the distribution system that were affected by high flows placed almost anywhere in the system. For example, during the hydrant testing process, a data logger was placed at a high point in the system on NE 11th Avenue near Ridgewood Park in the northeast portion of the system. The residual pressure at this hydrant dropped to just over 20 psi on a number of occasions, even with the Heller Road Reservoirs nearly full and water coming in from Anacortes. So this area and a few others were of concern from the beginning of the modeling process. Model runs to determine available fire flows under the assumption of the reservoirs being depleted of fire suppression storage volumes showed that a few high points imposed limitations to available fire flows in most areas of the City. With these added observations as background, the concern regarding the limited “transmission” capability – or the ability to move large quantities of water - in the distribution system became a major factor in the evaluation of the identified potential reservoir sites and system improvements. The major challenge became moving water to the combination of the southwestern, the western and the northeastern portions of the system. The desirable solution was to place of a new reservoir in a central location where all three areas could be served with the addition of a single BPS and a “minimal” network of additional transmission capability having to be added to the system. In addition to these, the “normal” considerations regarding system redundancies and providing the required flows and service pressures under emergency situations must be considered. The combination of these considerations raised a number of questions regarding the system, its capabilities and the siting of the proposed new reservoir. These included:
• Is there sufficient storage volume within the system under normal DOH criteria, and, more specifically, considering the potential for an interruption to the supply of Anacortes water from either a reduced HGL or damage to the 24-inch waterline?
• If additional storage volume is added to the system, where should it be placed, and can one reservoir serve the multiple needs of the system?
• How can the transmission capacity of the system be improved, and if additional new transmission capacity is required, how can it be physically and cost effectively provided?
• Recognizing that a new BPS would be required, and that its size would be essentially the same wherever it was located, would it also be possible to eliminate the existing BPSs serving the Heller Booster Pump Zone and the Redwing Park Pressure Zone while also eliminating the need for other BPSs to serve both the southwest area and the northeast area if the new BPS were installed in one location versus another?

City Of Oak Harbor 14 New Reservoir Predesign Report August 2009
RESERVOIR CAPACITY ANALYSES The scope of the project was to prepare the design for a 3.0 MG reservoir, with selection of the site to be determined based upon analyses of available sites and considerations of the benefits available from siting of the facilities. The 03-WSP discussion on reservoir capacity was reviewed and found to indicate that approximately 3 MG of additional storage is needed by 2023. The analysis presented did not consider the future needs at build out, nor did it identify the dead storage component of the Heller Road Reservoirs. With this as background, the independent storage volume analysis under current, 2029 and build out scenarios began. While the recommended volume of the storage components differ somewhat, the dead storage component (omitted in the 03-WSP document) in the existing reservoirs must be considered due to the local topography. Dead storage is the volume of storage below the level that can provide 20 psi throughout the distribution system. The 03-WSP (p 1-4) indicates the Mainland Zone serves elevations up to 340 ft. City staff has provided a correction to this elevation with the highest service being at 310 ft. elevation. The theoretical minimum usable elevation in the Heller Road Reservoirs is therefore 310+(20 X 2.31) = 356 ft. As a result, the lower 7 feet of these reservoirs would be considered as dead storage, which represents a volume of 0.32 MG. In practical terms, this volume is actually larger, as there are always some head losses within the distribution system that would reduce the available pressure at any given service by some amount. Since the 03-WSP is now dated, population projections and system production and usage data were updated to reflect 2009 as the base year and 2029 as the end of the typical 20-year planning period. Tables 1 through 4 present our storage analyses based on the last five years of system data from 2004 through 2008 that was provided by the City, with projections extrapolated to the near-term future (2029) and long-term future (build-out) projection time frames assuming the system zone configuration as it exists now. (Appendix B contains the City provided data.) The system projections based upon the recommended system reconfigured pressure zones with the new reservoir(s) and BPS as developed through the modeling process, are shown in Tables 5 through 8, and the physical configuration is shown in Figures 4 and Figure 5. All of these tables assume:
• The Anacortes supply is interrupted for two days duration of the standby period;
• The recommended abandonment of the East Side Reservoir has taken
place; • All three wells are functional with standby power at each; • The fire suppression storage volume for the Mainland and Downtown
Zones will be provided or supplemented by the new reservoir(s); and

City Of Oak Harbor 15 New Reservoir Predesign Report August 2009
• The fire suppression storage volume is “nested” with the standby storage
in the new reservoirs. The analyses use a 1.77 peaking factor (based on system data for 2004 through 2008) for calculation of the MDD, the 160.3 gpd/equivalent residential unit (ERU) (based on system data for 2004 through 2008) adjusted to include system water losses in order to reflect the actual system demand per ERU value rather than the consumption value. This results in a system demand of 170.5 gpd/ERU [Calculated as (160.3 gpd/ERU) X (1.0597 to represent 5.97% losses based on 2004 through 2008 system data)]. Please note that in each case the volume of standby storage reflects the DOH design criteria of at least two days of average daily demand to allow component replacement and power restoration. For the 2029 period, it also includes an additional volume to provide a minimum of 3.5 MG of standby storage. This volume assumes the Anacortes supply is interrupted, but does not begin to fully address vulnerability to a longer-term interruption of the Anacortes supply, such as a failure of the pipeline at the Deception Pass Bridge. Also, the fire flow durations under future conditions has been adjusted to three hours to reflect the current International Fire Code Requirement.
TABLE 1
Current (2009) and Future Build-Out ERUs and System Demands by Existing Zones - Based on Demand
Zone
Existing Connections
(ERUs)
Potential Additional
Connections At Build Out
(ERUs)
Total Potential
Connections (ERUs)
Existing ADD(SD)
(gpd)
Potential Additional
ADD(SD) (gpd)
Total Potential ADD(SD)
(gpd) Mainland Zone 7212 14036 21,248 1,229,484 2,392,822 3,622,306
Downtown Zone 1802 350 2,152 307,200 59,667 366,868
Total 9,014 14,386 23,400 1,536,684 2,452,489 3,989,174

City Of Oak Harbor 16 New Reservoir Predesign Report August 2009
TABLE 2
Future (2029) ERUs and System Demands by Existing Zones
Zone
2029 Connections
(ERUs)
Potential Additional
Navy Housing Connections
(ERUs)
Total Potential Connections
(ERUs)
Existing ADD(SD)
(gpd)
Potential Additional
ADD(SD) (gpd)
Total Potential ADD(SD)
(gpd) Mainland Zone 12646 400 13,046 2,155,859 68,191 2,224,050
Downtown Zone 3161 3,161 538,879 0 538,879
Total 15,807 400 16,207 2,694,738 68,191 2,762,929
TABLE 3
Current (2009) System Storage Analysis By Current Zones
Storage Component (gallon) Mainland
Zone Downtown
Zone System As a
Whole
Diam/Equiv Diam of Res 90.35 42.00 99.64 90.35 is equivalent diameter for the 80 ft. and 42 ft. Reservoirs
Feet of OS 5 5 5 Operational Storage (OS)(1) 239,900 51,900 291,700 No. ERUs 7,212 1,802 9,014 Inflow from Anacortes w/ 423
HGL @ Sharps Corner, Res @ 398 Normal Inflow 2,150 250 2,400
Equalizing Storage (ES) 30,700 50,800 81,500
Reliable Inflow 265 165 430 Assume Anacortes out & 3
wells function - 165 flows to downtown from PRVs
Standby Storage (SB) - Flows 1,695,800 139,300 1,835,000
Standby Storage (SB) - 200 G/ERU 1,442,400 360,400 1,802,800
Standby Storage (SB) - 1,695,800 360,400 1,835,000 Reqd Fire Flow - GPM 3,500 3,500 3,500 Fire Flow Duration - Hrs 3 3 3 Duration reflect IFC Fire Suppression Storage (FSS) 630,000 0 630,000 All Fire Suppression from
Mainland Zone Total Required Storage 1,966,400 463,100 2,838,200 Existing Storage Volume 2,565,950 549,245 3,115,195 Dead Storage (DS) 326,200 20,800 347,000 Total Available Storage 2,239,750 528,445 2,768,195 Storage Surplus (Deficit) 273,350 65,345 338,695

City Of Oak Harbor 17 New Reservoir Predesign Report August 2009
TABLE 4
Future (2029) System Storage Analysis by Current Zones
Storage
Component (gallon)
Mainland Zone
Downtown Zone
System As a Whole
Diam/Equiv Diam of Res 90.35 0.00 90.35
Assume Downtown served by PRVs and East Res. Abandoned
Feet of OS 5 5 5 Operational Storage (OS)(1) 239,900 0 239,900
No. ERUs 16,207 0 16,207 Normal Inflow 2,400 0 2,400 Equalizing Storage (ES)(2) 421,900 0 421,900 Flow from Mainland
Zone Reliable Inflow 430 0 430 Standby Storage (SB) - Flows 4,287,500 0 4,287,500
Standby Storage (SB) - 200 G/ERU
3,241,400 0 3,241,400
Standby Storage (SB) - 4,287,500 0 4,287,500
Reqd Fire Flow - gpm 3,500 3,500 3,500
Fire Flow Duration - Hrs 3 0 3 Duration changed to
reflect IFC Fire Suppression Storage (FSS) 630,000 0 630,000
Total Required Storage 5,579,300 0 5,579,300
Storage Volume 2,565,950 0 2,565,950 Dead Storage (DS)(6) 326,200 0 326,200
Total Available Storage(7) 2,239,750 0 2,239,750
Storage Surplus (Deficit)(8) (3,339,550) 0 (3,339,550)
System Requires Additional Storage Volume

City Of Oak Harbor 18 New Reservoir Predesign Report August 2009
TABLE 5
Future (2029) ERUs and System Demands by Future Zones
Zone
2029 Connections
(ERUs)
Potential Additional
Navy Housing Connections
(ERUs)
Total Potential Connections
(ERUs)
Existing ADD(SD)
(gpd)
Potential Additional
ADD(SD) (gpd)
Total Potential ADD(SD)
(gpd) Mainland & Downtown Zones
5350 5,350 912,055 0 912,055
480 Zone – Incl. New 420 Zone 10857 400 11,257 1,850,874 68,191 1,919,065
Total 16,207 400 16,607 2,762,929 68,191 2,831,120
TABLE 6
Future (Build-Out) ERUs and System Demands by Future Zones
Zone
Build Out Connections
(ERUs)
Potential Additional
Navy Housing Connections
(ERUs)
Total Potential Connections
(ERUs)
Existing ADD(SD)
(gpd)
Potential Additional
ADD(SD) (gpd)
Total Potential ADD(SD)
(gpd) Mainland & Downtown Zones
6065 6,065 1,033,946 0 1,033,946
480 Zone – Incl. New 420 Zone 16935 400 17,335 2,887,037 68,191 2,955,228
Total 23,000 400 23,400 3,920,983 68,191 3,989,174

City Of Oak Harbor 19 New Reservoir Predesign Report August 2009
TABLE 7
Future (2029) System Storage Analysis by Future Zones
Storage Component
(gallon)
Mainland & Downtown
Zones 480 & 420 ZonesSystem As a
Whole Diam/Equiv Diam of Res 90.35 150.00 175.11 Includes New 4.0 MG
Reservoir In 480 Zone Feet of OS 4 6 2 Operational Storage (OS)(1) 191,900 793,100 360,300
No. ERUs 5,350 11,657 17,007
Normal Inflow 0 5,400 5,400
Inflow of 5,400 gpm from Anacortes as 2023 approaches will require boosting delivery pressure at Sharp's Corner
Equalizing Storage (ES) 257,900 0 257,900
Reliable Inflow 35 395 430 Assume Anacortes out & 3 wells function and pump into 480 Zone
Standby Storage (SB) - Flows 1,723,400 2,837,000 4,560,400
Standby Storage (SB) - 200 G/ERU 1,070,000 2,331,400 3,401,400
Standby Storage (SB) 1,723,400 2,837,000 4,560,400
Reqd Fire Flow - gpm 3,500 3,500 3,500
Fire Flow Duration - Hrs 3 3 3 Revised to reflect latest
IFC duration
Fire Suppression Storage (FSS) 630,000 630,000 1,260,000
Fire Flow for Mainland also available in new Reservoirs @ Gun Club Rd. Site
Total Required Storage 2,173,200 3,630,100 5,803,300
Existing Storage Volume 2,565,950 3,965,475 6,531,426
Dead Storage (DS) 326,200 264,400 590,600 Total Available Storage 2,239,750 3,701,075 5,940,826
Storage Surplus (Deficit) 66,550 70,975 137,526 Allows For Limited
Additional Growth

City Of Oak Harbor 20 New Reservoir Predesign Report August 2009
TABLE 8
Future (Build-Out) System Storage Analysis by New Zones
Storage Component
(gallon)
Mainland & Downtown
Zones 480 & 420 Zones System As a Whole Diam/Equiv Diam of Res 90.35 199.15 218.69 Includes 2 Reservoirs
w/7 MG In 480 Zone Feet of OS 8 4.5 2 Operational Storage (OS)(1) 383,700 1,048,500 562,000
No. ERUs 6,065 17,735 23,800
Normal Inflow 1,950 2,850 4,800
Inflow of 4,800 gpm from Anacortes will require boosting delivery pressure at Sharp’s Corner
Equalizing Storage (ES) 0 422,600 422,600
Reliable Inflow 75 355 430 Assume Anacortes out & 3 wells function and pump into 480 Zone
Standby Storage (SB) - Flows 1,851,900 5,024,500 6,876,400
Standby Storage (SB) - 200 G/ERU 1,213,000 3,547,000 4,760,000
Standby Storage (SB) - 1,851,900 5,024,500 6,876,400
Reqd Fire Flow - gpm 3,500 3,500 3,500
Fire Flow Duration - Hrs 3 3 3 Revised to reflect latest
IFC duration
Fire Suppression Storage (FSS) 630,000 630,000 1,260,000
Fire Flow for Mainland also available in new Reservoirs @ Gun Club Rd. Site
Total Required Storage 2,235,600 6,495,600 8,731,200
Existing Storage Volume 2,565,950 6,989,987 9,555,938
Assumes new reservoirs provide all fire suppression storage .
Dead Storage (DS) 326,200 466,000 792,200 Total Available Storage 2,239,750 6,523,987 8,763,738
Storage Surplus (Deficit) 4,150 28,387 32,538 Storage Adequate for
Projected Growth
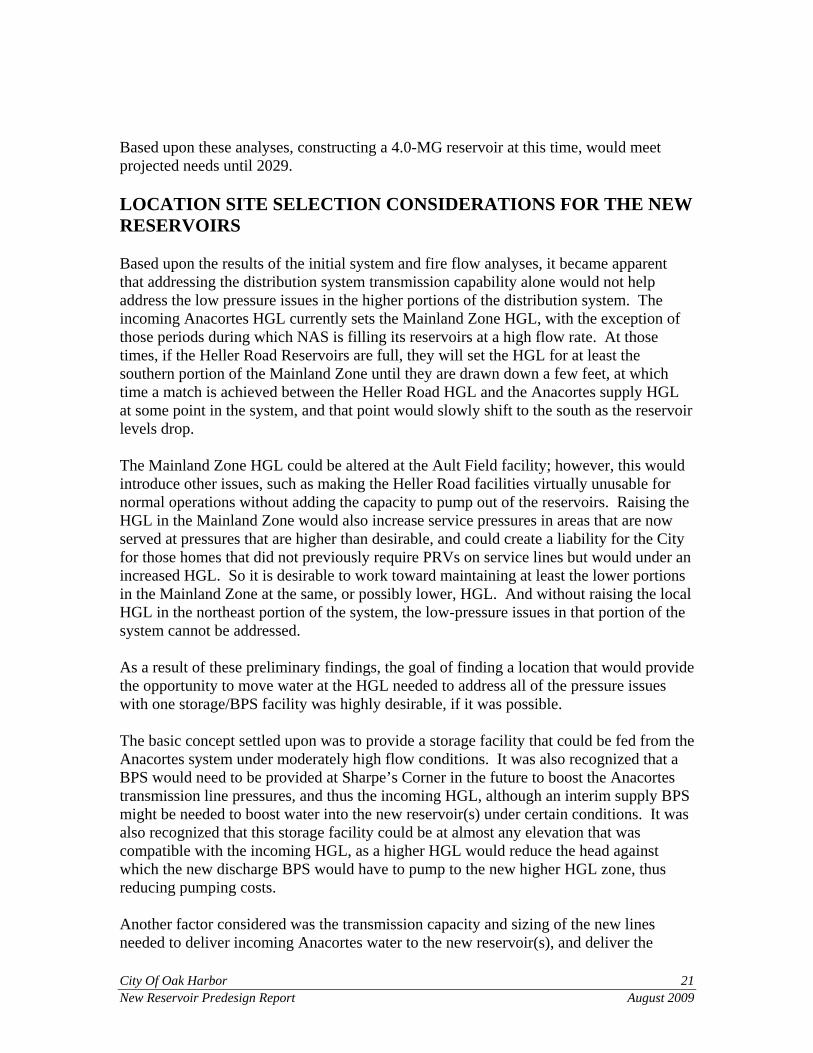
City Of Oak Harbor 21 New Reservoir Predesign Report August 2009
Based upon these analyses, constructing a 4.0-MG reservoir at this time, would meet projected needs until 2029. LOCATION SITE SELECTION CONSIDERATIONS FOR THE NEW RESERVOIRS Based upon the results of the initial system and fire flow analyses, it became apparent that addressing the distribution system transmission capability alone would not help address the low pressure issues in the higher portions of the distribution system. The incoming Anacortes HGL currently sets the Mainland Zone HGL, with the exception of those periods during which NAS is filling its reservoirs at a high flow rate. At those times, if the Heller Road Reservoirs are full, they will set the HGL for at least the southern portion of the Mainland Zone until they are drawn down a few feet, at which time a match is achieved between the Heller Road HGL and the Anacortes supply HGL at some point in the system, and that point would slowly shift to the south as the reservoir levels drop. The Mainland Zone HGL could be altered at the Ault Field facility; however, this would introduce other issues, such as making the Heller Road facilities virtually unusable for normal operations without adding the capacity to pump out of the reservoirs. Raising the HGL in the Mainland Zone would also increase service pressures in areas that are now served at pressures that are higher than desirable, and could create a liability for the City for those homes that did not previously require PRVs on service lines but would under an increased HGL. So it is desirable to work toward maintaining at least the lower portions in the Mainland Zone at the same, or possibly lower, HGL. And without raising the local HGL in the northeast portion of the system, the low-pressure issues in that portion of the system cannot be addressed. As a result of these preliminary findings, the goal of finding a location that would provide the opportunity to move water at the HGL needed to address all of the pressure issues with one storage/BPS facility was highly desirable, if it was possible. The basic concept settled upon was to provide a storage facility that could be fed from the Anacortes system under moderately high flow conditions. It was also recognized that a BPS would need to be provided at Sharpe’s Corner in the future to boost the Anacortes transmission line pressures, and thus the incoming HGL, although an interim supply BPS might be needed to boost water into the new reservoir(s) under certain conditions. It was also recognized that this storage facility could be at almost any elevation that was compatible with the incoming HGL, as a higher HGL would reduce the head against which the new discharge BPS would have to pump to the new higher HGL zone, thus reducing pumping costs. Another factor considered was the transmission capacity and sizing of the new lines needed to deliver incoming Anacortes water to the new reservoir(s), and deliver the

City Of Oak Harbor 22 New Reservoir Predesign Report August 2009
pumped discharge water to the areas in the new HGL zone that would improve system pressures in these higher areas and also deliver water effectively to the future growth area in the southwest. Recognizing the need for additional storage capacity in the future, locating the future storage facility on the same site as the first new reservoir would allow a single BPS to serve both current and future needs. With these factors in mind, each of the five locations, preidentified by the City, were reviewed to judge how each would fit into the “ideal” mold of the desirable site. The following comments summarize the findings. FT. NUGENT PARK SITE The Ft. Nugent Park site initially looked like the obvious place upon which to focus. The realities associated with this site quickly came to light, however, and led a shift of focus away from this site. Table 9 presents the pros and cons that apply to the Ft. Nugent Park site.
TABLE 9
Ft. Nugent Park Site Pros and Cons
Pros Cons Serves the projected primary growth area.
Does not directly address or improve transmission capacity of the system either locally or system wide.
Site is owned by the City and available to use.
Without addressing transmission capacity, this site creates low-pressure issues along the Heller Road ridge area during high flows to the southwest area.
Cannot provide flow to any other portion of the system. Site development would be restricted in terms of
reservoir size, and BPS siting. Would not readily facilitate installation of additional
future storage, as water could not be delivered to other portions of the City.
Based on these factors, the Ft. Nugent Park site was discounted from further consideration. HELLER ROAD SITE The Heller Road site has an advantage over the Ft. Nugent Park site based upon its higher elevation, and the co-location with the existing reservoirs. Table 10 presents the pros and cons that apply to the Heller Road site.

City Of Oak Harbor 23 New Reservoir Predesign Report August 2009
TABLE 10
Heller Road Site Pros and Cons
Pros Cons Could serve the projected growth area to the southwest.
Does not directly address or improve transmission capacity of the system.
Site is owned by the City and available to use.
The site is too small to allow construction of a suitably large reservoir for the current project, and cannot accommodate an additional future reservoir. A new facility would require removal of the existing reservoirs and incurring the replacement cost to regain that needed volume of storage.
This site does not address low-pressure issues in the northeast portion of the service area.
This site would require retaining the present Heller BPS to serve the immediate area, as well as the Redwing BPS to serve the northwest area.
Usability of water within the reservoirs on this site would remain the same as presently occurs due to the small normal HGL fluctuation in the Anacortes supply.
The effectiveness of a BPS at this site to address the above issues would require replacements of long segments of smaller lines, or parallel lines running at a higher HGL to move water from east to west, from west to east, and to the northeast.
Based upon these findings, the Heller Road site was eliminated from further consideration. EAST SIDE RESERVOIR SITE The East Side Reservoir site was considered only briefly due to its size, location and elevation. Table 11 presents the pros and cons that apply to the East Side Reservoir site.

City Of Oak Harbor 24 New Reservoir Predesign Report August 2009
TABLE 11
East Side Reservoir Site Pros and Cons
Pros Cons The city owns the property. Does not directly address or improve transmission
capacity of the system. To the contrary, moving high flows into a reservoir at this site would exacerbate existing issues.
Could not serve the projected growth area to the southwest.
Would require major transmission main construction and a BPS to deliver water to any point in the current Mainland Zone of the distribution system, and direct transmission capacity to any other zones, unless additional BPSs were installed.
The site is too small for the currently needed reservoir, and there is no room for additional facilities in the future.
Based upon these findings, the East Side Reservoir site was eliminated from further consideration. THE HIGHWAY 20 SITE The Highway 20 Site (the former Boyer property located at Highway 20 and Fakkema Road) is located well north of the distribution system and at an elevation below that which could be designed to “float on the existing system at the incoming Anacortes HGL. Table 12 presents the pros and cons that apply to the Highway 20 site.

City Of Oak Harbor 25 New Reservoir Predesign Report August 2009
TABLE 12
Highway 20 Site Pros and Cons
Pros Cons The city owns the property, outright or in conjunction with Island County.
Does not directly address or improve transmission capacity within the distribution system, most of which is well south of the site.
The site is quite large and could handle future installation of additional storage facilities.
Would require a new BPS facility and transmission main to deliver water back into the Mainland Zone, and the existing BPS facilities to remain as well as the construction of an additional BPS to serve the northeast area, although the latter could be incorporated into this site with the addition of a substantial length of additional transmission main.
Could not serve the projected growth area to the southwest directly.
The property cannot be developed for other uses due to the use restrictions associated with NAS flight patterns.
Based upon the above analysis, the Highway 20 Site was dropped from further consideration. GUN CLUB ROAD SITE Initial thoughts on the Gun Club Road site were mixed. The area was not well defined initially, so any advantages of the site were not obvious. Additional information obtained from the City and outside sources quickly added to the credibility of the site, particularly when considering the multiple factors identified during the initial analyses. It was also found that by creating a new, higher, 480 feet HGL pressure zone in the northwest portion of the system and along the Heller Road ridge with a BPS at this site, the bulk of the low pressure issues along the ridge can be eliminated, the two existing BPS facilities can be eliminated, and the extension of a transmission line to the southwest area would allow serving the primary growth area as well. This same HGL could be used to serve the northeast area by adding a west to east transmission line to deliver water to the area and isolating that area from the Mainland Zone. This meant that a single BPS at this site could be used to address all of identified deficiencies once the new transmission lines were constructed, and each of the transmission lines would also serve multiple purposes and areas. After initial discussions with City staff regarding serving the northeast portion of the system from this site, staff asked if it would be possible to serve the NAS need for 3,500 gpm at a location and HGL that would allow delivering that flow to an existing school and future housing area east of the City. This possibility was reviewed and it was found that with the extension of the 480 East Zone to the south along the east edge of the

City Of Oak Harbor 26 New Reservoir Predesign Report August 2009
City, delivery of this flow was, indeed, possible, although it will require extending a 12-inch line along the western edge of the new Zone to isolate it from the Mainland Zone and allow taking advantage of the multiple existing smaller lines in the local distribution system to deliver water from west to east while also maintaining fire flows along those residential streets. Based on this finding, direction was received to include this extension in the planning process. Table 13 presents the pros and cons that apply to the Gun Club Road site:
TABLE 13
Gun Club Road Site Pros and Cons
Pros Cons The City owns the 5-acre parcel, large enough for two reservoirs, and the BPS .
Transmission lines will be required to move water around and through the proposed new higher pressure zone and to the southwest.
The elevation allows placement of the reservoirs and BPS without substantial excavation quantities.
Sizes of proposed transmission lines need to be large enough to minimize head losses over the long distances involved. The total length needed is minimized by locating facilities at this site.
The site is “relatively” close to the existing transmission line between the Ault Field facility and the distribution system.
Creating a higher-pressure zone along the Heller Road ridge will require construction of a new 12-inch waterline to link the Heller Road Reservoirs directly to the Mainland Zone in order to allow it to float on the zone. Without this line, water would have to be pumped out of the reservoirs.
The site can accommodate the incoming Anacortes HGL and the reservoir(s) could “float” partially full on the Mainland Zone.
The new, higher HGL pressure zone would be sufficiently high to serve the northeast portion of the service area at less cost than currently planned.
The request from the NAS to provide 3,500 gpm to the east boundary of the service area becomes feasible with the addition of a 12-inch line extension to help move water to that area.

City Of Oak Harbor 27 New Reservoir Predesign Report August 2009
TABLE 13 – (continued)
Gun Club Road Site Pros and Cons
Pros Cons Once the reservoir is built on this site and linked to the incoming main in Oak Harbor Street, the other facilities could be phased to meet the needs of the City and developers.
The construction of portions of the lines to serve the southwest area can be passed on to developers, since that specific need is based upon future growth in that area and directly to the west, as well.
THE RECOMMENDED SITE Based upon the above findings, the Gun Club Road site is recommended as the preferred site. It meets all of the needs of the project and affords the City the basis for improvements in water service pressures to major portions of the system as well as allowing the provision of service to the remaining growth areas. DISTRIBUTION SYSTEM TRANSMISSION CAPACITY IMPROVEMENTS Having identified the water system’s limited distribution capability to deliver water from north to south, from east to west and from west to east, the challenge became one of identifying what was needed to improve the capacity of the system and a strategy to accomplish the improvements. The keys to the solution were the identification of the Gun Club Road Reservoir Site as the selected alternative, and the understanding of the deficiencies that was developed during the system analysis modeling. DELIVERY TO THE GUN CLUB ROAD SITE The Gun Club Road Site is currently not served with water. The City owned property is adjacent to a proposed development that is currently under review by the City. The final routing of the transmission lines to and from the reservoirs will be within the existing easements that are an extension of the Gun Club Road to the west side of the “namesake” Gun Club site adjacent to the property and will ultimately become a right-of-way, and it could either turn north along in the easement adjacent to the west edge of the Gun Club property, or enter the proposed development and run within the proposed roadways to the actual reservoir site. Final routing will be determined at the time of final design and will

City Of Oak Harbor 28 New Reservoir Predesign Report August 2009
depend upon the status of the proposed development. Either routing can be accommodated, although initial planning has focused on utilizing the easement route. The locations of these lines and the other proposed transmission improvements are shown in Figure 6. The flows to be accommodated by the transmission mains that deliver water to and from the reservoir and BPS site must consider the delivery of maximum day demand (MDD) into, and the larger of peak hour demand (PHD) or MDD plus fire flows out of the site. The projected MDD inflow is anticipated to be approximately 4,800 gpm. This rate of flow will require development of a source BPS in the Sharp’s Corner area to boost the pressure under high flow conditions to maintain transmission line pressure above the applicable lower pressure limit. In the interim the Ault Field facility will be modified to boost water to the 425-foot HGL of the new reservoir(s). When the new BPS is built at the Gun Club Site, the Ault Field facility may not be needed. Once the Sharp’s Corner BPS comes on line to boost the incoming HGL, water will flow directly into the reservoir(s) without further boosting. It is anticipated that boosting the HGL of the incoming water may not be needed under winter operating conditions if the head losses between Oak Harbor Road and the reservoir(s) can be held to a minimum. The design outflow between the BPS and the end of the combined outflow line delivering water to both the 480 West Zone (which includes supplying the new 420 Zone) and 480 East Zones plus 400 NAS units will be the worst-case combination of the PHD for both areas or the combined MDDs plus the 3,500-gpm fire flow. In this case, the worst case demand would be the total of the system wide MDDs plus the 3,500-gpm fire flow, or 8,400 gpm, based upon the assumption that the new facilities are serving the entire system with the Heller Road facilities off line for some reason. The highest flow to the 480 East Zone plus 400 NAS units is the MDD of approximately 450 gpm plus 3,500-gpm fire flow, or approximately 4,000 gpm. For the 480 West Zone, the maximum flow is approximately 3,300 gpm plus 2,500 gpm fire flow, or 5,800 gpm. With this in mind, the proposed sizes of the incoming line is 18-inches, with class 52 ductile iron pipe. The outlet line between the BPS and the last common point of the lines to the 480 West and East Zones will be 24-inch to reduce the pipeline velocity to approximately 6.0 feet per second. The pipe line to the West 480 Zone, with a flow of 5,800 gpm, will be 18-inch down to a point just north of the Heller Road Site in order to reduce head losses and maintain the HGL of the 480 West Zone under higher flows. The line to the 480 East Zone will be 18-inch out to the Oak Harbor Road PRV Station, recognizing that this line is pumped from the reservoirs and additional head could be provided, if necessary. Beyond the Oak Harbor Road PRV Station, this line will be 16 inch. The installation of the new line to the Gun Club Site will include cutting in tees to the 16-inch line in Oak Harbor Road, and installation of a PRV station on the outlet line. The PRV Station will have two PRVs on the 16-inch Oak Harbor Road line to reduce pressure to the Mainland Zone, and one from the outlet line to the Oak Harbor Road line

City Of Oak Harbor 29 New Reservoir Predesign Report August 2009
to allow the 480 Zone to supply water to the Mainland Zone under normal operation, but also to allow serving it by gravity from the new reservoir in the interim period until the new BPS is installed. THE EXTENSION TO THE 480 WEST ZONE The extension to the 480 West Zone will cross the proposed development in which the new reservoirs are to be located either in new rights-of-way, or in the existing easements along the periphery of the property, to the point that the future lines are installed in existing rights-of-way to reach the intersection of Heller Road and NW 2nd Avenue. Once the connection to the 12-inch line in Heller Road can be made, the initial portion of the new 480 West Zone will be created by isolating it from the Mainland Zone by closing valves and the installation of PRV stations in strategic locations to supplement fire flows in neighborhood areas. With this initial creation of the 480 West Zone, operation of the two existing BPSs can be discontinued. It will also be possible to begin creating the new 420 Zone, located south of the 480 West Zone and fed from it, by closing valves and installation of PRV stations to isolate it from the Mainland Zone that feeds it now. The PRV stations that intersect with Mainland Zone pipes will be set to allow backflow into the 420 Zone in case of fire flows for the interim period until the full length of the 16-inch transmission line in the 480 West Zone is completed. The proposed location of the new 16-inch line and the 420 Zone are shown schematically in Figure 2. The major portion of the 480 West Zone transmission line from Heller Road and NW 2nd Avenue will be installed under developer extension agreements as future development occurs. The capacity of the 12-inch line in Heller Road to deliver flow to the southern portion of the 480 West Zone is limited, so even a relatively small level of development will begin taxing its capacity. And since placing the 16-inch line parallel to the existing 12-inch line in Heller Road would not address the projected growth to the west, and is not needed or necessarily desirable when the future 16-inch is installed to the west, the installation of this line will become one of the controlling factors on the order of development to the west and southwest of the City. THE EXTENSION TO THE 480 EAST ZONE The extension to the 480 East Zone will be 16-inch beyond the Oak Harbor Road PRV station and will cross from west to the east on the extension of Gun Club Road. An alternative routing is possible, however, this is the favored routing as part of the purpose of the new zone is to address the low-pressure issues in the northeast portion of the City. Once this line is installed, the northeast portion of the City, and the area along the eastern portion of the City will be isolated from the Mainland Zone with the extension of a 12-inch line along the east side of NE O’Leary Street to deliver water to the east-west lines in the residential streets, addressing both the fire flows on those streets and developing the distributed transmission capacity to deliver water to the NAS connection

City Of Oak Harbor 30 New Reservoir Predesign Report August 2009
that will allow delivery of fire flows to the school and housing units east of the City. The locations of these lines are shown in Figure 2. OVERALL PROGRAM OF IMPROVEMENTS The series of individual projects included in the program of system improvements to ultimately create the new system configuration is shown under the following section, CONCLUSIONS AND RECOMMENDATIONS. The project prioritization has been established by City staff. The linear foot cost for various pipe sizes were established for purposes of creating this estimated total program cost through a process of estimating the cost of design, construction, sales tax, and contingency for 1,000-linear foot segments of ductile iron pipe of each size. The bases of the cost estimates for the various pipe line sizes is provided in Appendix C. The cost of the reservoir, BPS and PRV stations have been based on recent experience on bids received. These costs do not, however, attempt to quantify or adjust for the very recent bidding climate that has resulted from the current economic downturn, as this is likely a short term phenomenon, and to plan based on these results is not considered prudent. CONCLUSIONS AND RECOMMENDATIONS Based on the findings of the system analyses performed using the updated computer model, our reviews of each of the pre-identified reservoir sites, the updated reservoir capacity analysis, and the recently identified coordination potential for serving the NAS school and community east of the City, the following conclusions are drawn:
• The Oak Harbor water system currently lacks the transmission capacity to adequately deliver high flow rates to the future growth areas southwest and west of the City and still maintain the minimum required system pressures.
• Any of the preidentified sites considered for locating one or more
reservoirs will require construction of at least one additional booster pump station to facilitate the movement of the required fire flows within the system, and one additional booster pump station to address the low pressure area in the northeast portion of the City. With the recommended location and system reconfiguration, one booster pump station can serve both purposes, as well as eliminate two small booster pump stations used to boost pressures for small areas.
• The current total reservoir capacity in the system is marginally sufficient
in under DOH guidelines. With the reconfiguration of the system to create higher HGL zones in the west and east, the existing capacity will be deficient. The needed additional storage capacity, including replacing the Eastside Reservoir capacity, is approximately 4.0 MG over the period through 2029 and 7.0 MG at build out. The exact time at which the

City Of Oak Harbor 31 New Reservoir Predesign Report August 2009
second reservoir will be needed is dependent upon the rate of growth in the area. Even this volume of additional storage does not relieve the City’s vulnerability to a potential longer term interruption of the incoming supply line from the City of Anacortes system, as it provides such a high proportion of the total system demand, and there are few opportunities for development of sufficient local supply to offset this vulnerability unless consideration is given to a very expensive backup capacity that might be provided from a desalination plant.
• By establishing the firm, schematic concept for development of the
ultimate transmission conveyance system to serve the southwest portion of the City and its future growth area, and then managing the development of that area in relation to the provision of water service, the City should have the capability to develop sufficient financial capacity to develop the needed system through connection charges and requiring developers to participate in, or install, segments of the new pipe lines. This may present some limitations on the sequence of areas that can be developed and served, however, the orderly development of the various areas may also be enhanced.
It is recommended that the City of Oak Harbor proceed with the overall program of system upgrades in the following manner:
• Project No. 1 – Construct the 18-inch inflow and outflow lines between the point of connection to the existing system in Oak Harbor Road and the Gun Club Road Reservoir Site, a total of approximately 5,800 LF of pipe line, and install the PRV station at Oak Harbor Road to allow readjustment of the incoming line pressure to meet the current Mainland Zone HGL. Estimated Cost - $2,306,000.
• Project No. 2 – Construct a new 4.0-MG reservoir at the Gun Club Road
Site. The size will be approximately 150 feet in diameter and 30-feet high with a high water operating elevation of 425 feet. Estimated Cost - $3,100,000.
• Project No. 3 – Modify the pumping configuration of the Ault Field
facility to boost the incoming HGL from Anacortes in order to allow filling of the new reservoir. This would be an interim step that could be omitted if either the booster pump station at the Gun Club Road Site or the new station at Sharps Corner were built first. Estimated Cost- $300,000.
• Project No. 4 – Construct the new booster pump station at the new
reservoir site in preparation for extension of the west to east transmission line to serve the NAS needs for domestic and fire flow supply at the east edge of the City. This station will include the capability to boost incoming

City Of Oak Harbor 32 New Reservoir Predesign Report August 2009
water to the overflow elevation of the reservoir, so, if the Ault Field facility was modified, it could be taken off line when this is complete. Estimated Cost - $1,900,000.
• Project No. 5 – Construct the west to east transmission line to create the
new 480 East Zone and raise the HGL for the low pressure areas in the northeast portion of the City. Estimated Cost - $3,160,000
• Project No. 6 – Construct the remaining portion of the needed
transmission improvements, PRV stations and isolation valving, to extend the extent of the 480 East Zone and deliver 3,500 gpm to NAS. Estimated Cost - $852,000.
• Project No. 7 – Construct the dedicated line between the Heller Road
Reservoir site and the mainland Zone to allow it to be isolated from the new 480 West Zone. Estimated Cost - $780,000.
• Project Nos. 8 thru 12 – Construct the various segments of 16-inch
transmission lines in sequence to extend the new 480 West Zone to the southwest portion of the system. Combined Estimated Cost - $9,615,000.

City Of Oak Harbor 1 New Reservoir Predesign Report August 2009

APPENDIX A
SYSTEM MODELING, CALIBRATION, AND INITIAL ANALYSIS

City Of Oak Harbor A-1 New Reservoir Predesign Report May 2009
APPENDIX A
SYSTEM MODELING, CALIBRATION, AND INITIAL ANALYSIS
In order to determine the preferred location for the proposed reservoir, an analysis of the City’s water system was necessary to identify the overall capabilities of the system to effectively utilize the additional storage under both current and future demands. This effort was comprised of a series of analyses performed using a computerized model of the system, with individual system components identified and represented by salient characteristics, such as sizes and lengths of pipes, locations and types of control valves, sizes and configuration of reservoirs, and pump characteristics. The City’s engineer of record for the 03-WSP, Earth Tech, Inc. had utilized a model using WaterCAD software to analyze the system’s capabilities and forecast needed system improvements as part of the process of preparing the 03-WSP. The model used by Earth Tech contained a number of scenarios representing the system at various stages of build out from the current (2003) system to ultimate build out. The need for additional storage was identified in the WSP, and the recommended location was in the south end of the City at Ft. Nugent Park. WATER MODEL USED AND CONVERSION BETWEEN SOFTWARE SYSTEMS The City supplied G&O with the electronic files of the computer model used by Earth Tech. The current modeling was performed using H2Onet software, and G&O selected Earth Tech’s ultimate build out scenario as the basis for converting the water system model from WaterCAD to H2Onet software. The actual conversion was performed by MWH Soft, Inc., the developers of H2Onet software. The build out scenario was selected for the conversion because it included the future waterlines envisioned by Earth Tech to serve future growth of the system, and distributed future growth in system demands to reflect the City’s vision of future growth. With this as a base scenario, the model was easily reconfigured to represent the current system by closure of proposed future lines and elimination of future demands within a new scenario reflective of current conditions. UPDATING AND CALIBRATING THE MODEL Once the model conversion was completed, the model was reviewed to compare the model content to information provided by the City, including system maps, updates of system improvements, and sizes and dimensions of reservoirs and major water mains. Once the model was believed to substantially represent the system, model calibration was undertaken. Model calibration is a process designed to ensure the computer model reflects the actual operating characteristics of the system in the field. This is typically accomplished by releasing large flows from fire hydrants while simultaneously measuring the hydrant flow rate, the residual water pressure at an adjacent point in the system, the current reservoir

City Of Oak Harbor A-2 New Reservoir Predesign Report May 2009
levels and all incoming flows, in this case the flow coming in from Anacortes. This real world data was then used to make adjustments to the model to cause the model results to reflect the conditions measured in the field under the numerous flow tests that are run as part of the calibration runs. Once the model is calibrated to yield acceptable results, the model can be used to predict how the water system will function at other locations and under other conditions. These results can be based upon the current system, or, with the addition of information on future improvements and demands, the future system. In order to attain model calibration with reliable results and to ease inputs, a few modifications to the model input were necessary. REDWING PARK PRESSURE ZONE The Redwing Park Pressure Zone was originally modeled as a high pressure zone with what appeared to be a fire flow pump pumping into this zone. A PRV with pressures sustaining feature drops water from this pressure zone into the Mainland Zone, however, the PRV was not set to function. The model did not have a jockey pump to feed the zone, and there were no demands in the model in this zone. The fire flow pump was on and operating at 1,219 gpm. We turned the fire flow pump off and substituted a fixed head reservoir with a 1,000-gpm pump that feeds into the zone in order to ensure that adequate residential fire flow will be available in the zone. The model settings and levels for the Redwing Park Booster Station are as follows;
TABLE A-1
Redwing Park Pressure Zone Supply – Model Settings
Reservoir 898 Type Fixed Head Reservoir
Hydraulic Grade Line 366 – This setting was in the original model, however this reservoir was inactive.
Pump 905 Design Flow 1,000 gpm @ 67' Head Actual Flow 1,219 gpm @ 56' Head Downstream elev 325' Downstream HGL 420' Downstream pressure 41 psi
HELLER ROAD RESERVOIRS The Heller Road Reservoirs had been modeled as one reservoir instead of two. The reservoir volume and levels appeared to be accurate, and were accepted as adequately representing the facility. The model settings and levels for the Heller Road Reservoir are as follows;

City Of Oak Harbor A-3 New Reservoir Predesign Report May 2009
TABLE A-2
Heller Road Reservoirs – Model Settings
Tank 902 Max. Level 56.5 Min. Level 0 Initial Level 46.5 Base Elev. 349.2 Diameter 88.25 Max Volume 2,585,052 Max Water Elevation 406 Initial Volume 2,127,521 Initial Water Elevation 395.7
HELLER BOOSTER ZONE The Heller booster zone is modeled as a small pressure zone that is served by a jockey pump outside of the Heller Road Reservoirs. The booster zone has a check valve that allows flow into the booster zone from just outside of the reservoir if the pressure in the zone drops. The model settings and operating conditions of the Heller Booster Station are as follows;
TABLE A-3
Heller Pressure Zone Supply – Model Settings
Pump 904 Flow 75 gpm @ 101.5' Head
EAST SIDE RESERVOIR The East Side Reservoir was originally modeled as a reservoir that feeds the downtown pressure zone. The reservoir is filled from the Mainland Zone, with water flowing into the reservoir through a PRV that keeps it from overflowing. The PRV was not active in the original model, so we set the PRV level to 1 foot below the tank overflow level. The tank size was corrected to reflect the actual tank diameter and levels. The revised model settings and levels for the East Side Reservoir are as follows;
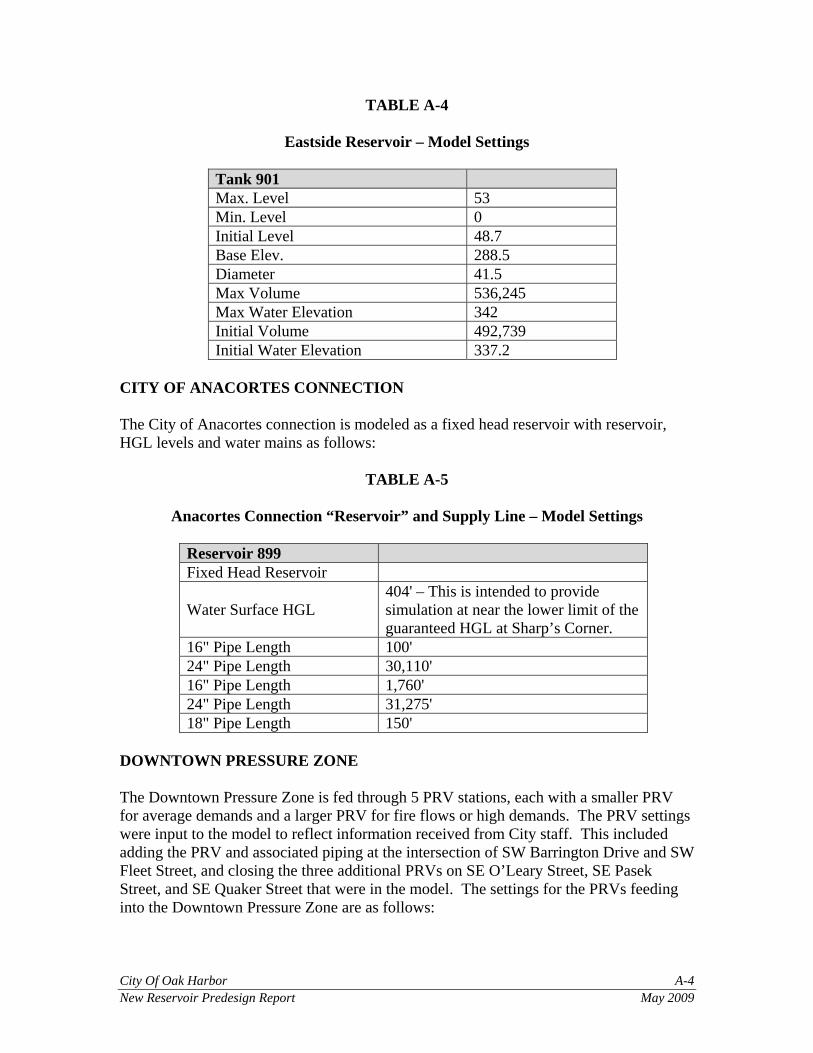
City Of Oak Harbor A-4 New Reservoir Predesign Report May 2009
TABLE A-4
Eastside Reservoir – Model Settings
Tank 901 Max. Level 53 Min. Level 0 Initial Level 48.7 Base Elev. 288.5 Diameter 41.5 Max Volume 536,245 Max Water Elevation 342 Initial Volume 492,739 Initial Water Elevation 337.2
CITY OF ANACORTES CONNECTION The City of Anacortes connection is modeled as a fixed head reservoir with reservoir, HGL levels and water mains as follows:
TABLE A-5
Anacortes Connection “Reservoir” and Supply Line – Model Settings
Reservoir 899 Fixed Head Reservoir
Water Surface HGL 404' – This is intended to provide simulation at near the lower limit of the guaranteed HGL at Sharp’s Corner.
16" Pipe Length 100' 24" Pipe Length 30,110' 16" Pipe Length 1,760' 24" Pipe Length 31,275' 18" Pipe Length 150'
DOWNTOWN PRESSURE ZONE The Downtown Pressure Zone is fed through 5 PRV stations, each with a smaller PRV for average demands and a larger PRV for fire flows or high demands. The PRV settings were input to the model to reflect information received from City staff. This included adding the PRV and associated piping at the intersection of SW Barrington Drive and SW Fleet Street, and closing the three additional PRVs on SE O’Leary Street, SE Pasek Street, and SE Quaker Street that were in the model. The settings for the PRVs feeding into the Downtown Pressure Zone are as follows:

City Of Oak Harbor A-5 New Reservoir Predesign Report May 2009
Table A-6 – Downtown Zone PRV Supplies - Model Settings
PRV Location
PRV Size (in) Elev.
Upstream Pressure
(psi) Upstream HGL (ft)
Downstream Pressure
(psi) Downstream
HGL (ft) SE Midway/SE 4th Avenue 8 196 88 399 53 318 SE Midway/SE 4th Avenue 3 196 88 399 58 330 SE Cabot Drive/SR 20 8 145 109 397 75 318 SE Cabot Drive/SR 20 4 145 109 397 80 330 South Oak Harbor Street/SW 3rd Avenue 8 156 105 398 69 315 South Oak Harbor Street/SW 3rd Avenue 3 156 105 398 74 327 SW Barrington Drive/SW Fleet Street 8 188 91 398 54 313 SW Barrington Drive/SW Fleet Street 2 188 91 398 59 324 SR 20/SW Scenic Heights 8 167 96 389 68 324 SR 20/SW Scenic Heights 3 167 96 389 73 335
DISTRIBUTION SYSTEM UPDATES AND MODIFICATIONS We updated the system piping in the model to reflect information from City staff and the water system base map. These changes include the piping for the Home Depot development off of SE Atlas Street, closing a portion of the failing water main on Oak Harbor Street, adding the piping for the Fairway Point PRD and the Fireside Developments on the SW side of the water system. We did not incorporate any specific additional demands from these new developments, however, as they are assumed to be reflected in the “gross” added demands utilized to project future demands on the system.

APPENDIX B
UPDATED SYSTEM DATA FOR 2001 – 2008 FROM CITY RECORDS

City Of Oak Harbor B-1 New Reservoir Predesign Report May 2009
APPENDIX B
UPDATED SYSTEM DATA FOR 2001 – 2008 FROM CITY RECORDS
The following data was received from the City of Oak Harbor. The information was used to update information on the value of the ERU and to establish the total ERU demand for the system, the percentage of water losses and to then make projections of future use. The Value of the ERU has dropped from that established in the 03-WSP, and the reduction in consumption has reduced the size of the required reservoir sizes.

City Of Oak Harbor B-2 New Reservoir Predesign Report May 2009
City of Oak Harbor: Water System Profile For The Year 2001 A SERVICE CHARACTERISTICS Number 1 Estimated service population 16,698 2 Estimated service area (square miles) 4.8 square miles 3 Miles of mains 87.75 miles 4 Fire Hydrants 655 5 Water Storage 3,125,000 gallons
6 Number of separate water systems serving 3
7 Interconnection with other systems 3
B ANNUAL WATER SUPPLY Annual volume
Gallons
Number of intakes or
source points Percent metered
7 Groundwater 1,594,900 3 100% 8 Purchased: treated 823,420,100 2 100% 9 Total annual water supply 825,015,000 C SERVICE CONNECTIONS Connections Percent metered 10 Residential, single-family 3418 100% 11 Residential, multi-family 603 100% 12 Commercial 530 100% 13 Multi-commercial 97 100% 14 Schools 25 100% 15 Hotel/Motel 11 100% 16 Ind/Church 20 100% 17 Com/Res 14 100% 18 Irrigation 79 100% 19 Fire Sprinkler 81 20 Navy 6 100% 21 Total connections 4884 98%
D WATER DEMAND Annual volume
Gallons Percent of
total Gallons per connection
19 Residential sales 231,853,396 47% 6,783 20 Multi-residential sales 137,848,647 28% 22,860 21 Commercial 55,296,560 11% 104,333 22 Multi-commercial 16,604,080 3% 171,176 23 Schools 10,082,892 2% 403,315 24 Hotel/Motel 9,242,776 2% 840,252 25 Ind/Church 2,426,836 .02% 121,341

City Of Oak Harbor B-3 New Reservoir Predesign Report May 2009
26 Com/Res 598,480 .01% 42,748 27 Irrigation 22,574,666 5% 285,755 29 UNACCOUNTED WATER 20,061,117 2.01% 30 City total system demand (total use) 490,806,715 59.49% 31 Navy total system demand (total use) 314,147,168 38.36%
32 Navy and City total system demand (total use) including Navy 825,015,000
E AVERAGE & PEAK DEMAND Volume
Total supply
capacity Percent of total
capacity 33 City average-day demand 1,399,638 3,000,000 47% 34 Average-day demand including Navy 2,260,315 35 City highest daily use (August 11) 2,127,000 3000,000 71% 36 City average-day demand per capita 60

City Of Oak Harbor B-4 New Reservoir Predesign Report May 2009
City of Oak Harbor: Water System Profile For The Year 2002 A SERVICE CHARACTERISTICS Number 1 Estimated service population 18,880 2 Estimated service area (square miles) 4.8 square miles 3 Miles of mains 89.75 miles 4 Fire Hydrants 683 5 Water Storage 3,125,000 gallons
6 Number of separate water systems serving 3
7 Interconnection with other systems 3
B ANNUAL WATER SUPPLY Annual volume
Gallons
Number of intakes or
source points Percent metered
7 Groundwater 1,116,500 3 100% 8 Purchased: treated 839,867,100 2 100% 9 Total annual water supply 840,983,600 C SERVICE CONNECTIONS Connections Percent metered 10 Residential, single-family 3567 100% 11 Residential, multi-family 617 100% 12 Commercial 624 100% 13 Multi-commercial 96 100% 14 Schools 23 100% 15 Hotel/Motel 11 100% 16 Ind/Church 20 100% 17 Com/Res 14 100% 18 Irrigation 81 100% 19 Fire Sprinkler 85 20 Navy 6 100% 21 Total connections 5144 100%
D WATER DEMAND Annual volume
Gallons Percent of
total Gallons per connection
19 Residential sales 235,678,432 46% 68,421 20 Multi-residential sales 136,152,704 26% 220,679 21 Commercial 55,610,762 11% 891,209 22 Multi-commercial 17,566,884 3% 182,988 23 Schools 1,487,824 2% 499,471 24 Hotel/Motel 11,086,094 2% 1,007,827 25 Ind/Church 2,212,880 .02% 110,644

City Of Oak Harbor B-5 New Reservoir Predesign Report May 2009
26 Com/Res 4,744,450 .01% 338,889 27 Irrigation 25,591,753 5% 315,948 29 UNACCOUNTED WATER 37,289,870 4.3% 30 City total system demand (total use) 515,867,000 59.49% 31 Navy total system demand (total use) 339,331,200 39.7%
32 Navy and City total system demand (total use) including Navy 855,198,200 100%
E AVERAGE & PEAK DEMAND Volume
Total supply
capacity Percent of total
capacity 33 City average-day demand 1,366,000 3,125,000 44% 34 Average-day demand including Navy 2,295,845 35 City highest daily use (June 14) 2,540,000 3,125,000 81% 36 Residential City gpcd 64 37 Commercial City gped 52

City Of Oak Harbor B-6 New Reservoir Predesign Report May 2009
City of Oak Harbor: Water System Profile for the Year 2003 A SERVICE CHARACTERISTICS Number 1 Estimated population 20,570 2 Estimated Navy population 3,229 3 Estimated City population 17,341 4 Estimated service area (square miles) 4.8 square miles 5 Miles of mains 90.23 miles 6 Fire Hydrants 721 7 Approved backflow prevention device 474 8 Water valves 2,139 9 Water Storage 3,125,000 gallons
10 Number of separate water systems serving 3
11 Interconnection with other systems 3
B ANNUAL WATER SUPPLY Annual volume
gallons
Number of intakes or source
points Percent metered 12 Groundwater 1,815,500 3 100% 13 Purchased: treated 930,335,456 2 100% 14 Total annual water supply 932,150,956 15 Total annual metered consumption 901,327,371 16 Total gallons loss 30,823,585 17 Unaccounted water 3.3% C SERVICE CONNECTIONS Connections Percent metered 18 Residential, single-family 3709 100% 19 Residential, multi-family 623 100% 20 Total residential connections 4332 21 Commercial 760 100% 22 Multi-commercial 95 100% 23 Schools 23 100% 24 Hotel/Motel 11 100% 25 Ind/Church 20 100%
26 Com/Res 14 100%
27 Irrigation 81 100% 28 Fire Sprinkler 85 29 Navy 6 100% 30 Total commercial connection 1095

City Of Oak Harbor B-7 New Reservoir Predesign Report May 2009
31 Total connections 5427 100%
D WATER DEMAND Annual volume
gallons Percent of
total 32 Residential demand 253,774,223 47.9% 33 Multi-residential demand 132,985,997 25.1% 34 Total residential demand 386,760,220 73% 35 Commercial 60,281,150 11.4% 36 Multi-commercial 17,118,772 3.2% 37 Schools 12,745,380 2.4% 38 Hotel/Motel 10,284,131 1.9% 39 Ind/Church 2,415,615 .05% 40 Com/Res 5,285,327 .01% 41 Irrigation 34,613,091 6.5% 42 Total commercial demand 142,743,466 25.5% 43 City total system demand (total use) 529,503,684 56.9% 44 Navy total system demand (total use) 384,059,000 41.3%
45 Navy and City total system demand (total use) 930,721,700 100%
E AVERAGE & PEAK DEMAND Volume gallons
Total supply
capacity Percent of total capacity46 City average-day demand 1,450,695 3,125,000 46% 47 Average-day demand including Navy 2,549,922 48 City highest daily use (July 21,2003) 2,900,000 3,125,000 93% 49 Residential City gpcd 61
50 Commercial City gped (population/employees 7,260 ) 54

City Of Oak Harbor B-8 New Reservoir Predesign Report May 2009
City of Oak Harbor: Water System Profile for the Year 2004 A SERVICE CHARACTERISTICS Number 1 Estimated population 20,890 2 Estimated Navy population 4,827 3 Estimated City population 17,341 4 Estimated service area (square miles) 4.8 square miles 5 Miles of mains 90.23 miles 6 Fire Hydrants 721 7 Approved backflow prevention device 540 8 Water valves 2,139 9 Water Storage 3,125,000 gallons
10 Number of separate water systems serving 3
11 Interconnection with other systems 3
B ANNUAL WATER SUPPLY Annual volume
gallons
Number of intakes or source
points Percent metered 12 Groundwater 1,621,500 3 100% 13 Purchased: treated 907,106,400 2 100% 14 Total annual water supply 908,727,900 15 Total annual metered consumption 881,977,788 16 Total gallons loss 26,750,112 17 Unaccounted water 3% C SERVICE CONNECTIONS Connections Percent metered 18 Residential, single-family 3854 100% 19 Residential, multi-family 683 100% 20 Total residential connections 4537 21 Commercial 717 100% 22 Multi-commercial 97 100% 23 Schools 23 100% 24 Hotel/Motel 11 100% 25 Ind/Church 22 100%
26 Com/Res 14 100%
27 Irrigation 88 100% 28 Fire Sprinkler 90 29 Navy 6 100% 30 Total commercial connection 1068

City Of Oak Harbor B-9 New Reservoir Predesign Report May 2009
31 Total connections 5605 100%
D WATER DEMAND Annual volume
gallons Percent of
total 32 Residential demand 266,348,287 50.3% 33 Multi-residential demand 129,673,410 24.4% 34 Total residential demand 396,021,697 74.7% 35 Commercial 62,696,017 11.8 % 36 Multi-commercial 17,018,527 3.2% 37 Schools 10,780,869 2.4% 38 Hotel/Motel 9,332,548 1.9% 39 Ind/Church 2,565,983 .05% 40 Com/Res 4,842,451 .01% 41 Irrigation 30,764,116 6.5% 42 Total commercial demand 142,141,994 26.9% 43 City total system demand (total use) 535,750,296 56.9% 44 Navy total system demand (total use) 346,205,787 41.3%
45 Navy and City total system demand (total use) 881,956,083 100%
E AVERAGE & PEAK DEMAND Volume gallons
Total supply
capacity Percent of total capacity46 City average-day demand 1,450,695 3,125,000 46% 47 Average-day demand including Navy 2,549,922 48 City highest daily use (July 21,2003) 2,900,000 3,125,000 93% 49 Residential City gpcd 61
50 Commercial City gped (population/employees 7,260 ) 54

City Of Oak Harbor B-10 New Reservoir Predesign Report May 2009
City of Oak Harbor: Water System Profile for the Year 2005 A SERVICE CHARACTERISTICS Number 1 Estimated population 21,720 2 Estimated Navy population 4,827 3 Estimated City population 17,341 4 Estimated service area (square miles) 4.851 square miles 5 Miles of mains 94.70 miles 6 Fire Hydrants 755 7 Approved backflow prevention device 600 8 Water valves 2,239 9 Water Storage 3,150,000 gallons
10 Number of separate water systems serving 3
11 Interconnection with other systems 3
B ANNUAL WATER SUPPLY Annual volume
gallons
Number of intakes or source
points Percent metered 12 Groundwater 1,987,378 3 100% 13 Purchased: treated 860,793,958 2 100% 14 Total annual water supply 862,781,336 15 Total annual metered consumption 872,413,374 16 Total gallons loss -9,632,038 17 Unaccounted water -1.12% C SERVICE CONNECTIONS Connections Percent metered 18 Residential, single-family 4030 100% 19 Residential, multi-family 784 100% 20 Total residential connections 4814 21 Commercial 567 100% 22 Multi-commercial 95 100% 23 Schools 23 100% 24 Hotel/Motel 11 100% 25 Ind/Church 22 100%
26 Com/Res 14 100%
27 Irrigation 95 100% 28 Fire Sprinkler 91 29 Navy 6 100% 30 Total commercial connection 920

City Of Oak Harbor B-11 New Reservoir Predesign Report May 2009
31 Total connections 5738 100%
D WATER DEMAND Annual volume
gallons 32 Residential demand 249,374,646 33 Multi-residential demand 152,169,525 34 Total residential demand 401,544,171 35 Commercial 75,585,780 36 Multi-commercial 18,998,748 37 Schools 12,562,095 38 Hotel/Motel 9,420,823 39 Ind/Church 2,609,373 40 Com/Res 4,671,885 41 Irrigation 30,945,905 42 Total commercial demand 154,794,609 43 City total system demand (total use) 556,471,828 44 Navy total system demand (total use) 315,941,546
45 Navy and City total system demand (total use) 872,413,374
E AVERAGE & PEAK DEMAND Volume gallons
Total supply
capacity Percent of total capacity46 City average-day demand 1,528,410 3,150,000 46% 47 Average-day demand including Navy 2,628,410 48 City highest daily use (July 21,2003) 2,665,564 3,150,000 93% 49 Residential City gpcd 61
50 Commercial City gped (population/employees 7,260 ) 54

City Of Oak Harbor B-12 New Reservoir Predesign Report May 2009
City of Oak Harbor: Water System Profile for the Year 2006 A SERVICE CHARACTERISTICS Number 1 Estimated population 22,309 2 Estimated Navy population 4,900 3 Estimated City population 17,390
4 Estimated service area (square miles) 4.874 square miles
5 Miles of mains 98.73 miles 6 Fire Hydrants 791
7 Approved backflow prevention device 717
8 Water valves 2,239 9 Water Storage 3,150,000 gallons
10 Number of separate water systems serving 3
11 Interconnection with other systems 3
B ANNUAL WATER SUPPLY Annual volume
gallons
Number of intakes or source
points Percent metered 12 Groundwater 4,328,349 3 100% 13 Purchased: treated 868,328,688 2 100% 14 Total annual water supply 872,657,037 15 Total annual metered consumption 761,613,841 16 Total gallons loss 111,043,196 17 Unaccounted water 12.72% C SERVICE CONNECTIONS Connections Percent metered 18 Residential, single-family 4100 100% 19 Residential, multi-family 724 100% 20 Total residential connections 4824 21 Commercial 474 100% 22 Multi-commercial 97 100% 23 Schools 24 100% 24 Hotel/Motel 11 100% 25 Ind/Church 23 100%
26 Com/Res 14 100%
27 Irrigation 99 100% 28 Fire Sprinkler 94 29 Navy 100%

City Of Oak Harbor B-13 New Reservoir Predesign Report May 2009
30 Total commercial connection 842 31 Total connections 5,666 100%
D WATER DEMAND Annual volume
gallons 32 Residential demand 212,402,048 33 Multi-residential demand 120,233,884 34 Total residential demand 332,635,932 35 Commercial 60,468,923 36 Multi-commercial 18,036,691 37 Schools 8,661,502 38 Hotel/Motel 10,203,336 39 Ind/Church 3,061,973 40 Com/Res 5,110,271 41 Irrigation 33,870,228 42 Total commercial demand 139,412,924 43 City total system demand (total use) 477,539,311
44 Navy total system demand (total use) 284,074,530
45 Navy and City total system demand (total use) 761,613,841
E AVERAGE & PEAK DEMAND Volume gallons
Total supply
capacity Percent of total capacity46 City average-day demand 1,566,677 3,150,000 46%
47 Average-day demand including Navy 2,390,841
48 City highest daily use (July 21,2003) 2,869,733 3,150,000 93%
49 Residential City gpcd 61
50 Commercial City gped (population/employees 7,260 ) 54

City Of Oak Harbor B-14 New Reservoir Predesign Report May 2009
City of Oak Harbor: Water System Profile for the Year 2007 A SERVICE CHARACTERISTICS Number 1 Estimated population 22,290 2 Estimated Navy population 4,900 3 Estimated City population 17,390
4 Estimated service area (square miles) 4.874 square miles
5 Miles of mains 97.98 miles 6 Fire Hydrants 807
7 Approved backflow prevention device 749
8 Water valves 2,239 9 Water Storage 3,150,000 gallons
10 Number of separate water systems serving 3
11 Interconnection with other systems 3
B ANNUAL WATER SUPPLY Annual volume
gallons
Number of intakes or source
points Percent metered 12 Groundwater 3,013,797 3 100% 13 Purchased: treated 877,027,880 2 100% 14 Total annual water supply 880,041,677 15 Total annual metered consumption 895,467,867 16 Total gallons loss -15,426,120 17 Unaccounted water -1.75% C SERVICE CONNECTIONS Connections Percent metered 18 Residential, single-family 4204 100% 19 Residential, multi-family 734 100% 20 Total residential connections 4938 21 Commercial 407 100% 22 Multi-commercial 97 100% 23 Schools 24 100% 24 Hotel/Motel 10 100% 25 Ind/Church 24 100%
26 Com/Res 13 100%
27 Irrigation 102 100% 28 Fire Sprinkler 103 29 Navy 1 100%

City Of Oak Harbor B-15 New Reservoir Predesign Report May 2009
30 Total commercial connection 781 31 Total connections 5,719 100%
D WATER DEMAND Annual volume
gallons 32 Residential demand 232,089,048 33 Multi-residential demand 121,225,116 34 Total residential demand 353,314,164 35 Commercial 68,273,102 36 Multi-commercial 18,794,516 37 Schools 19,575,533 38 Hotel/Motel 10,634,242 39 Ind/Church 2,728,321 40 Com/Res 4,838,711 41 Irrigation 36,495,310 42 Total commercial demand 161,339,735 43 City total system demand (total use) 613,470,428
44 Navy total system demand (total use) 281,997,439
45 Navy and City total system demand (total use) 895,467,867
E AVERAGE & PEAK DEMAND Volume gallons
Total supply
capacity Percent of total capacity46 City average-day demand 1,680,741 3,150,000
47 Average-day demand including Navy 2,453,337
48 City highest daily use (July 12,2007) 2,753,858 3,150,000
49 Residential City gpcd 61
50 Commercial City gped (population/employees 7,260 ) 54

City Of Oak Harbor B-16 New Reservoir Predesign Report May 2009
City of Oak Harbor: Water System Profile for the Year 2008 A SERVICE CHARACTERISTICS Number 1 Estimated population 22,980 2 Estimated Navy population 4,900 3 Estimated City population 18,080
4 Estimated service area (square miles) 4.889 square miles
5 Miles of mains 99.44 miles 6 Fire Hydrants 836
7 Approved backflow prevention device 820
8 Water valves 2,239 9 Water Storage 3,150,000 gallons
10 Number of separate water systems serving 3
11 Interconnection with other systems 3
B ANNUAL WATER SUPPLY Annual volume
gallons
Number of intakes or source
points Percent metered 12 Groundwater 3,251,138 3 100% 13 Purchased: treated 806,231,456 2 100% 14 Total annual water supply 809,482,594 15 Total annual metered consumption 752,827,466 16 Total gallons loss 56,655,128 17 Unaccounted water 7.00% C SERVICE CONNECTIONS Connections Percent metered 18 Residential, single-family 4160 100% 19 Residential, multi-family 752 100% 20 Total residential connections 4,912 21 Commercial 367 100% 22 Multi-commercial 96 100% 23 Schools 24 100% 24 Hotel/Motel 10 100% 25 Ind/Church 23 100%
26 Com/Res 14 100%
27 Irrigation 107 100% 28 Fire Sprinkler 107 29 Navy 1 100%

City Of Oak Harbor B-17 New Reservoir Predesign Report May 2009
30 Total commercial connection 749 31 Total connections 5,661 100%
D WATER DEMAND Annual volume
gallons 32 Residential demand 228,038,086 33 Multi-residential demand 118,202,044 34 Total residential demand 346,240,130 35 Commercial 56,196,524 36 Multi-commercial 18,178,830 37 Schools 12,794,006 38 Hotel/Motel 10,367,170 39 Ind/Church 2,350,530 40 Com/Res 4,805,046 41 Irrigation 27,675,211 Hydrant Meters
42 Total commercial demand 133,519,297 43 City total system demand (total use) 479,759,428
44 Navy total system demand (total use) 275,404,400
45 Navy and City total system demand (total use) 755,163,828
E AVERAGE & PEAK DEMAND Volume gallons
Total supply
capacity Percent of total capacity46 City average-day demand 1,470,937 3,150,000 46.69%
47 Average-day demand including Navy 2,217,761
48 City highest daily use (8/16/08) 2,400,056 3,150,000 76.19% 49 Residential City gpcd 61
50 Commercial City gped (population/employees 7,260 ) 54

City Of Oak Harbor B-18 New Reservoir Predesign Report May 2009
City of Oak Harbor Water System ERU Calculations and Demand Growth Projections Year 2001 2002 2003 2004 2005 2006 2007 2008 Number Of Days In Year 365 365 365 366 365 365 365 366
Water Produced / Purchased - Gal. 825,015,000 840,983,600 932,150,956 908,727,900 862,781,336 872,657,037 880,041,677 809,482,594
Number of SFR Connections 3,418 3,567 3,709 3,854 4,030 4,100 4,204 4,160
SFR Consumption - Gal. 231,853,396 235,678,432 253,774,223 266,348,287 249,374,646 212,402,048 232,089,048 228,038,086
Total Unaccounted Water - Gal 20,061,117 37,289,870 30,823,585 26,750,112 (9,632,038) 111,043,196 (15,426,120) 56,655,128
Total City Demand - Gal 490,806,715 515,867,000 529,503,684 535,750,296 556,471,828 477,539,311 613,470,428 479,759,428
Total Navy Demand - Gal 314,147,168 339,331,200 384,059,000 346,205,787 315,941,546 284,074,530 281,997,439 275,404,400
City ADD - Incl Losses 1,399,368 1,366,000 1,450,695 1,450,695 1,528,410 1,566,677 1,680,741 1,470,937
City MDD - Incl Losses 2,127,000 254,000 2,900,000 2,900,000 2,665,564 2,869,733 2,753,858 2,400,056
ERU Value - GPD/ERU 186 181 187 189 170 142 151 150
Total City Non-SFR Consumption - Gal.
258,953,319 280,188,568 275,729,461 269,402,009 307,097,182 265,137,263 381,381,380 251,721,342
Total City Non-SFR ERUs 3,818 4,241 4,030 3,898 4,963 5,118 6,908 4,592
Total ERUs 7,236 7,808 7,739 7,752 8,993 9,218 11,112 8,752 % Unmetered/ Unaccounted For 3.9% 6.7% 5.5% 4.8% -1.8% 18.9% -2.6% 10.6%
Ratio MDD/ADD 1.52 0.19 2.00 2.00 1.74 1.83 1.64 1.63 Rolling 5-Yr Ave of ERU 182.5 173.8 167.8 160.3
Rolling 5-Yr Ave of MDD/ADD 1.49 1.55 1.84 1.77

City Of Oak Harbor B-19 New Reservoir Predesign Report May 2009
Year 2001 2002 2003 2004 2005 2006 2007 2008 Rolling 5-Yr Ave of % Losses 3.8% 6.8% 5.0% 5.97%
Annual % Increase In ERUs 7.9% -0.9% 0.2% 16.0% 2.5% 20.6% -21.2%
Rolling 5-Yr Ave. Incr In ERUs 5.1% 7.7% 3.6%
Total Growth Over last 7 Years 21.0%
Ave Growth over last 7 Years 3.0%

APPENDIX C
PIPELINE COST ESTIMATES

City Of Oak Harbor C-1 New Reservoir Predesign Report May 2009
APPENDIX C
PIPELINE COST ESTIMATES The following tables present the cost estimating basis for various sizes of ductile iron pipe.

APPENDIX G
CROSS-CONNECTION CONTROL PLAN

Cross Connection Control Program Summary The City of Oak Harbor has the responsibility to protect the public water system from contamination due to cross connections. A cross connection may be defined as “any actual or potential connection between a potable water line and any pipe, vessel, or machine that contains or has the probability of containing a non-potable gas or liquid, such that it is possible for a non-potable gas or liquid to enter the potable water system by backflow.” All public water systems are required to develop and implement CCC programs. The CCC requirements are contained in Washington Administrative Code 246-290-490 of the Group A Drinking Water Regulations. The minimum required elements of a CCC program are:
1. Establishment of a legal authority and program policies; 2. Evaluation of premises for cross-connection hazards; 3. Elimination and/or control of cross connections; 4. Provision of qualified staff; 5. Inspection and testing of backflow preventers; 6. Quality control of testing process; 7. Response to backflow incidents; 8. Public education for consumers; 9. Record keeping for CCC program; and 10. Special requirements for reclaimed water use.
The Oak Harbor City Council on April 4, 2006 adopted Ordinance No. 1456 amending Chapter 13.13 of the Oak Harbor Municipal Code, reproduced as Appendix A, which authorizes the Purveyor to implement a CCC Program. This Code also authorizes the Purveyor to terminate water service to consumers who do not comply with the ordinance. However, the primary method for protection of the public water system will be the installation of a backflow preventer by the customer at the customer’s expense.
Cross Connection Control Program Activities The following items are activities that have been conducted by the City of Oak Harbor’s CCC Program since 2009:
The program monitors approximately 1,000 backflow assemblies per year. Monitoring includes mailing letters to customers requiring an annual test of the backflow assembly and then entering data into our backflow software (Tokay) to track results, failures, and upkeep of each of the assemblies. Also, second and third notices are sent to customers who do not comply with the first letter.

2009 – The CCC program staff conducted re-evaluations of all Table 9 facilities (Table 9 is a Department of Health list of high hazard facilities requiring mandatory premise isolation).
2009 – The program, in conjunction with meter readers, evaluated residential properties for irrigation systems.
2010 – The program implemented a CCC backflow software program (Tokay) to streamline our backflow tracking. We also linked our backflow software (Tokay) to our billing software (Eden) for active mailing address updating. This dramatically cut down on returned mail and increased our response to letters.
2011 – The program conducted an educational workshop for property managers and landscapers.
2012 – The program conducted a presentation on local Channel 10 educating customers on the water system and CCC Program.
2012 – The program started to re-evaluate commercial facilities with no premise isolation and get the facility evaluations into the Tokay software program so that we can track re-evaluations into the future.
2013 – The program sent letters and started to re-evaluate existing Table 9 exceptions and renew the exceptions as deemed appropriate.
Cross Connection Control Program Goals The following items are future goals of the Cross Connection Control Program: 2015
Inspect and reevaluate all assemblies not tested since 2009 and remove inactive assemblies.
Re-evaluate all Table #9 facilities. Implement a “written” agreement between the City of Oak Harbor Building Division, as
the authority having jurisdiction, and the City of Oak Harbor Water Division CCC Program.
2016 (NW Quadrant)
Evaluate commercial properties without premise isolation and place them on a CCC survey schedule through the CCC Tokay software program. If high hazard exists, require owner to install appropriate Cross Connection Control.
Evaluate residential systems with special plumbing and premise isolation. Send out questionnaires to residential customers with no known special plumbing.
2017 (SE Quadrant)
Evaluate commercial properties without premise isolation and place them on a CCC survey schedule through the CCC Tokay software program. If high hazard exists, require owner to install appropriate Cross Connection Control.
Evaluate residential systems with special plumbing and premise isolation. Send out questionnaires to residential customers with no known special plumbing.

2018 (SW Quadrant) Evaluate commercial properties without premise isolation and place them on a CCC
survey schedule through the CCC Tokay software program. If high hazard exists, require owner to install appropriate Cross Connection Control.
Evaluate residential systems with special plumbing and premise isolation. Send out questionnaires to residential customers with no known special plumbing. Evaluate the current Cross Connection Control Plan.
2019 (NE Quadrant)
Evaluate commercial properties without premise isolation and place them on a CCC survey schedule through the CCC Tokay software program. If high hazard exists, require owner to install appropriate Cross Connection Control.
Evaluate residential systems with special plumbing and premise isolation. Send out questionnaires to residential customers with no known special plumbing.
2020 (NW Quadrant)
Evaluate commercial properties without premise isolation and place them on a CCC survey schedule through the CCC Tokay software program. If high hazard exists, require owner to install appropriate Cross Connection Control.
Evaluate residential systems with special plumbing and premise isolation. Send out questionnaires to residential customers with no known special plumbing.
Every Year
Complete CCC surveys for new construction/new occupancy accounts as well as scheduled surveys.
Continue to implement Cross Connection Control public education. Re-evaluate Table 9 exceptions.

CROSS CONNECTION CONTROL
PROGRAM, ORDINANCE
AND APPENDICES
865 S.E. Barrington Drive ● Oak Harbor, Washington 98277-4092 ● City Hall (360) 279-4500

CITY OF OAK HARBOR CROSS CONNECTION CONTROL PROGRAM PLAN
TABLE OF CONTENTS
CROSS CONNECTION CONTROL PROGRAM APPENDIX A - ORDINANCE 14 (OHMC CHAPTER 13.13) APPENDIX B - PROGRAM ADMINISTRATION DOCUMENTS LIST APPENDIX C - BACKFLOW ASSEMBLY TESTERS APPENDIX D - BACKFLOW INCIDENT RESPONSE PLAN APPENDIX E - BROCHURES APPENDIX F - ANNUAL SUMMARY REPORT FORM APPENDIX G - WAC 246-290-490 - CROSS CONNECTION CONTROL APPENDIX H - STANDARD INSTALLATION DRAWINGS APPENDIX I - DEFINITIONS APPENDIX J - DRAFT - QUALITY ASSURANCE AND QUALITY CONTROL WAC 51-56-0600 - CHAPTER 6 - WATER SUPPLY AND DISTRIBUTION CROSS CONNECTION CONTROL - FACTS SHEET

CROSS CONNECTION CONTROL PROGRAM PLAN

City of Oak Harbor - Cross Connection Control Program 1
Cross-Connection Control Program Plan For City of Oak Harbor Water System
A. Requirement for Program City of Oak Harbor, 62650-C, hereinafter referred to as “the Purveyor”, has the responsibility to protect the public water system from contamination due to cross connections. A cross connection may be defined as “any actual or potential physical connection between a potable water line and any pipe, vessel, or machine that contains or has a probability of containing a non-potable gas or liquid, such that it is possible for a non-potable gas or liquid to enter the potable water system by backflow.” All public water systems are required to develop and implement cross-connection control (CCC) programs. The CCC requirements are contained in Washington Administrative Code (WAC) 246-290-490 of the Group A Drinking Water Regulations. The minimum required elements of a CCC program are:
1. Establishment of legal authority and program policies; 2. Evaluation of premises for cross-connection hazards; 3. Elimination and/or control of cross connections; 4. Provision of qualified personnel; 5. Inspection and testing of backflow preventers; 6. Quality control of testing process; 7. Response to backflow incidents; 8. Public education for consumers; 9. Record keeping for CCC program; and 10. Special requirements for reclaimed water use.
Other CCC program requirements include:
1. Coordination with the Local Administrative Authority (LAA), i.e., the local building or plumbing official regarding CCC activities;
2. Prohibition of the return of used water into the public water system (PWS) distribution system; and
3. Inclusion of a written CCC program in a Water System Plan (WSP) or a Small Water System Management Program (SWSMP).
Note: Throughout the CCC program plan the term customer is used. Customer as used herein means the property owner and/or occupant of the premises served by the PWS (i.e., whoever interfaces with the PWS regarding water service). Also, unless otherwise defined, all CCC-related terms used in this program have the same definitions as those contained in WAC 246-290-010 of the Washington State Drinking Water Regulations.

City of Oak Harbor - Cross Connection Control Program 2
B. Program Objectives The objectives of the CCC program are to:
1. Reasonably reduce the risk of contamination of the public water distribution system; 2. Reasonably reduce the Purveyor's exposure to legal liability arising from the backflow of
any contaminant originating from the customer's plumbing system and then supplied to other customers; and
3. Cooperate with the LAA by joint operation of program administrative tasks. C. Summary of Program Decisions The following table summarizes the major policy and program decisions adopted for the City of Oak Harbor water system. The items in the table represent CCC program areas that have more than one acceptable approach or option.

City of Oak Harbor - Cross Connection Control Program 3
CCC Program Decision Summary Table for the City of Oak Harbor
Decision Item Decision
1. Type of Program [General, WAC 246-290-490(2)(e)] a. Premises isolation only b. Premises isolation and in-premises protection (combination program) X
2. Extent of Coordination with LAA [WAC 246-290-490(2)(d)] a. Information exchange b. Interaction c. Joint program X
3. Relationship with Customer [Element 1] a. Signed service agreement or contract b. Ordinance/resolution; implied service agreement X
4. Enforcement of Corrective Action [Element 1] a. Rely upon shut-off of water service X b. Rely upon Purveyor-installed premises isolation
5. Assessment and Re-assessment of Hazard [Element 2] a. By Purveyor’s staff or equivalent X b. By cross-connection control specialist (CCS) employed by customer; report reviewed by Purveyor’s CCS
X
6. Location and Ownership of Premises Isolation Assembly [Element 3] a. On Purveyor’s service line b. On customer’s service line X
7. CCS Option – Purveyor’s Program Management [Element 4] a. Purveyor’s staff member certified X b. Inter-agency agreement or use other agency’s CCS c. Contract with consultant CCS
8. Testing of Assemblies [Element 5] a. By Purveyor’s staff or Purveyor-employed backflow assembly tester (BAT) b. By customer-employed (contractor – BAT) X
9. Cost Recovery [WAC 246-290-100(4)(h) and –105(4)(p)] a. Borne by all customers (general water rates) X b. Assessed to specific class (commercial meters) c. Each customer directly bears cost

City of Oak Harbor - Cross Connection Control Program 4
D. Required Elements of Program The drinking water regulations for Group A public water systems in Washington, WAC 246-290, require CCC programs to include certain minimum elements. The elements are listed in WAC 246-290-490(3). This section describes how the water system intends to comply with each of the required program elements. Elements are numbered the same as they appear in the WAC. Element 1: Adoption of a written legal instrument authorizing the establishment and
implementation of a CCC program. The City of Oak Harbor water system has amended Ordinance No. 1456 (Chapter 13.13 of the Oak Harbor Municipal Code), reproduced as (Appendix A), which authorizes the Purveyor to implement a CCC program. The ordinance also authorizes the system to terminate water service to consumers who do not comply with the ordinance. However, the primary method for protection of the distribution system will be the installation of a backflow preventer by the customer, at the customer’s expense. For customers supplied prior to the adoption of the attached Ordinance, an implied service contract allows the Purveyor to protect the distribution system from contamination through a Purveyor-installed backflow preventer on a customer's service, at the customer’s expense. The written and implied contract terms are discussed further under Element 3. Element 2: Development and implementation of procedures and schedules for evaluating new and
existing service connections to assess the degree of hazard. Initial Cross-Connection Hazard Surveys The procedures for evaluating the backflow prevention requirements for new and existing customers are as follows:
1. For all new non-residential services, the Purveyor will require that the customer submit with the application for water service an evaluation (appendix B) (performed at customer’s expense) by a DOH-certified cross-connection control specialist (CCS) of the hazard posed by the proposed plumbing system, with recommendations for the installation at the meter of either a double-check valve assembly (DCVA) or a reduced-pressure principle backflow assembly (RPBA), or commensurate in-premises backflow preventers. The Purveyor may accept the recommendations or submit the recommendations to a CCS employed by the PWS for peer review and concurrence, before acceptance.
As an alternative to the above requirement for a survey by a DOH-certified CCS, the Purveyor, at his/her discretion may specify the backflow preventer required to be installed as a condition of service. As an alternative to the above requirement for a survey by a DOH-certified CCS, the customer may agree to install an approved air gap (AG) or RPBA for premises isolation as a condition of service.

City of Oak Harbor - Cross Connection Control Program 5
2. For all new residential services, the Purveyor will require that the customer submit with the
application for water service a completed “Water Use Questionnaire”. If the customer's questionnaire indicates special plumbing, such as a lawn sprinkler system, or hazardous water use on the premises, the customer shall submit to the Purveyor an evaluation by a DOH-certified CCS of the hazard posed by the proposed special plumbing system, with recommendations for the installation at the meter of either a DCVA or an RPBA or commensurate in-premises protection.
As an alternative to the above requirement for a survey by a DOH-certified CCS, the Purveyor, at his/her discretion may specify the backflow preventer required to be installed as a condition of service.
As an alternative to the above requirement for a survey by a CCS, the customer may agree to install an approved air gap (AG) or RPBA for premises isolation as a condition of service.
3. For all existing non-residential services, the Purveyor will require the customer to submit to
the Purveyor, within nine months of notification, an evaluation by a DOH-certified CCS, of the hazard posed by the plumbing system, with recommendations for the installation at the meter of either a DCVA, an RPBA or commensurate in-premises backflow preventers. The Purveyor may accept the recommendations or submit the recommendations to a CCS employed by the Purveyor for peer review and concurrence, before acceptance.
As an alternative to the above requirement for a survey by a DOH-certified CCS, the Purveyor, at his/her discretion may specify the backflow preventer required to be installed as a condition of service.
As an alternative to the above requirement for a survey by a DOH-certified CCS, the customer may agree to install an AG or RPBA for premises isolation within 90 days of notification by the Purveyor or an alternate time period acceptable to the Purveyor.
4. For all existing residential services, the Purveyor will require the customer to submit to the Purveyor, within four months of notification, a completed “Water Use Questionnaire.” If the customer's reply indicates special plumbing or water use on the premises, the customer shall submit an evaluation by a DOH-certified CCS of the hazard posed to the water system by the customer’s plumbing system, with recommendations for the installation at the meter of either a DCVA or an RPBA or commensurate in-premises backflow preventers.
As an alternative to the above requirement for a survey by a CCS, the Purveyor may specify
the backflow preventer required to be installed as a condition of service. The Purveyor’s CCS will provide guidance on the type of backflow preventer to be installed.
5. For all existing services, should the customer fail to supply the required information for a
hazard assessment or fail to submit a completed “Water Use Questionnaire,” (Appendix B) the Purveyor may have the assessment made by a CCS employed by the Purveyor, require the installation of an RPBA for premises isolation, or take other such actions consistent with the previously stated policies and bill the customer for the associated costs.

City of Oak Harbor - Cross Connection Control Program 6
Cross-Connection Hazard Survey Schedule for Initial Hazard Assessments The schedule for initial hazard assessment is outlined in the following table. The schedule starts from the date the CCC program is established.
Initial Assessment Task Schedule Assessment of all new connections At time of application for
water service Identification and assessment of high-hazard premises which are listed on Table 9 of Washington Administrative Code (WAC) 246-290-490
Within nine months
Identification and assessment of hazardous premises supplemental to Table 9 of WAC 246-290-490
Within 12 months
Identification of residential connections with special plumbing facilities and/or water use on the premises
Within 15 months
Cross-Connection Hazard Survey Schedule for Subsequent Hazard Re-Assessments For subsequent cross-connection hazard surveys, procedures for evaluating the backflow prevention requirements are:
1. For residential services, the Purveyor will require the customer to submit to the Purveyor, within two months of Purveyor notification, a completed “Water Use Questionnaire.” The procedure used for evaluating the hazard re-assessment and the potential change in the required backflow prevention will be the same as used for the initial hazard assessment.
2. For all non-residential services, the Purveyor will require the customer to submit to the
Purveyor, within two months of Purveyor notification, a hazard re-assessment (at the customer’s expense) by a DOH-certified CCS.
3. As an alternative to the above requirement for a survey by a DOH-certified CCS, the
Purveyor, at his/her discretion, may conduct the evaluation and specify the backflow preventer required to be installed as a condition of service.
The frequency of hazard re-assessments will be as shown in the table below:

City of Oak Harbor - Cross Connection Control Program 7
Type of Service Frequency of
Re-Evaluation Any services with reduced-pressure principle backflow assembly (RPBA) installed for premises isolation
None required as long as the RPBA passes annual tests and inspections
Commercial services with double-check valve assembly (DCVA) installed for premises isolation
Every two years and upon change in use or ownership
Commercial services when Purveyor relies upon in-premises protection
Every two years and upon change in use, ownership, or plumbing system
Residential services with special plumbing where the Purveyor relies upon compliance with Uniform Plumbing Code (UPC)
Every 2-3 years (questionnaire)
Residential services with DCVA installed for premises isolation
Every 4-5 years (questionnaire)
Residential services with no known special plumbing or water use on the premises
Every 4-5 years and upon change in use, ownership, or plumbing system (questionnaire)
The Purveyor will inform the customer that the survey of a customer's premises (whether by a representative of the Purveyor or through the evaluation of a questionnaire completed by the customer) is for the sole purpose of establishing the Purveyor's minimum requirements for the protection of the public water supply system, and that the required backflow protection will be commensurate with the Purveyor's assessment of the degree of hazard. The Purveyor will also inform the customer or any regulatory agencies that the Purveyor's survey, requirements for the installation of backflow prevention assemblies, lack of requirements for the installation of backflow prevention assemblies or other actions by the Purveyor’s personnel or agent do not constitute an approval of the customer's plumbing system or an assurance to the customer or any regulatory agency of the absence of cross connections. Element 3: Development and implementation of procedures and schedules for elimination
and/or control of cross-connections. Backflow Preventer Requirements The following service policy shall apply to all new and existing customers:
1. The Purveyor will require that water service to all non-residential customers be isolated immediately downstream of the meter or connection prior to any branch connections by a DOH-approved AIRGAP, DCVA or RPBA acceptable to the Purveyor. All high-hazard connections of the type described under WAC 246-290-490(4)(b)(i)(ii)(iii)(table 9) shall be isolated with an AIR GAP or RPBA. All other non-residential customers shall be isolated with a DCVA. In lieu of isolation with a DCVA, other non-residential customers, with the concurrence of the Purveyor’s CCS, may install in-premises protection commensurate with the degree of hazard, as determined by the Purveyor’s CCS.

City of Oak Harbor - Cross Connection Control Program 8
2. The Purveyor will require all residential customers with facilities of the type described under WAC 246-290-490(4)(b)(i)(ii)(iii)(table 9) to be isolated immediately downstream of the meter or connection prior to any branch connections with an AIRGAP or RPBA. All other residential customers with special plumbing or water use on the premises will be isolated with a DCVA or in-premise protection at the point of the hazard in accordance with the Uniform Plumbing Code (UPC). “Special plumbing” includes, but is not limited to, the following:
A lawn irrigation system; A solar heating system; An auxiliary source of supply, e.g., a well or creek; Piping for livestock watering, hobby farming, etc.; Residential fire sprinkler system; and Property containing a small boat moorage.
3. Additional premises requiring premises isolation. The Purveyor has chosen to
supplement Table 9 of WAC 246-290-490(4) by identifying additional premises or premises types for which premises isolation is mandated to be commensurate with the degree of hazard, as determined by the Purveyor’s CCS. Such premises will include:
Military bases; Tall buildings (over 30 feet); Premises with complex plumbing; Premises with multiple in-premise backflow preventers; Premises with restricted, secured or denied access; Premises with plumbing subject to frequent changes(shopping malls or strip malls); Premises with a repeat history of cross-connections being established or reestablished; Premises with public swimming pools; Dedicated Fire systems; and Premises outside of the City of Oak Harbor administrative authority but within the
City’s Water Service Area. 4. All remaining residential customers will be isolated at the meter by a Purveyor-installed
meter check valve (single or dual). Residential customers not required to be isolated with an RPBA may install in-premises protection in accordance with the Uniform Plumbing Code (UPC) in lieu of isolation with a DCVA.
5. For all customers that have a written service contract with the Purveyor, the required premises isolation DCVA or RPBA shall be:
Purchased and installed by the customer (at the customer's expense) immediately
downstream of the water meter in accordance with the Purveyor's standards described hereinafter; and
Maintained, tested, and inspected in accordance with the Purveyor's standards described hereinafter.

City of Oak Harbor - Cross Connection Control Program 9
For new customers, the Purveyor will not turn on water (except for testing purposes) at the meter until the customer complies with the above requirements. The failure of the customer to comply with the Purveyor’s installation and maintenance requirements shall constitute a breach of contract by the customer. The Purveyor may then proceed with corrective action provisions stipulated in the contract.
6. Customers without written contracts are considered to have an implied contract that
requires the customer to bear all reasonable costs of service. The Purveyor will install the required DCVA or RPBA on the service, upstream of the meter, and charge the customer for the cost of the initial installation, and all future maintenance, testing, and repair, as set forth in the Purveyor's schedule of rates and charges. The failure of the customer to pay these costs shall constitute a breach of contract by the customer, and the Purveyor will proceed with the established delinquency of payment procedures. As an alternative, the customer may sign a service contract and install the required backflow preventer downstream of the meter in accordance with the Purveyor’s installation standards described hereinafter.
7. Approved Backflow Preventers and Installation. All backflow preventers relied upon
by the Purveyor to protect the public water system shall meet the definition of “approved backflow preventer” as contained in WAC 246-290-010. The Purveyor will obtain and maintain a current list of assemblies approved for installation in Washington State from the DOH Office of Drinking Water. All backflow preventers will be installed in: The orientation for which they are approved; A manner and location that facilitates their proper operation, maintenance, and testing or
inspection; A manner that will protect them from weather-related conditions such as flooding and
freezing; and Compliance with applicable safety regulations.
Installation standards contained in the most recently published edition of the Pacific Northwest Section, American Water Works Association (PNWS-AWWA) CCC Manual or the University of Southern California Foundation for Cross-Connection Control and Hydraulic Research (USCFCCCHR) CCC Manual shall be followed unless the manufacturer’s requirements are more stringent. Installation shall conform to standard construction drawings and specifications of the Purveyor. The Purveyor has no regulatory responsibility or authority over the installation and operation of the customer's plumbing system. The customer is solely responsible for compliance with all applicable regulations and for prevention of contamination of his plumbing system from sources within his/her premises. Any action taken by the Purveyor to survey plumbing, inspect or test backflow prevention assemblies, or to require premises isolation (installation of DCVA or RPBA on service) is solely for the purposes of reducing the risk of contamination of the Purveyor's distribution system.

City of Oak Harbor - Cross Connection Control Program 10
The Purveyor will inform the customer that any action taken by the Purveyor shall not be construed by the customer as guidance on the safety or reliability of the customer’s plumbing system. The Purveyor will not provide advice to the customer on the design and installation of plumbing other than through the general public education program discussed in Element 8. Except for easements containing the Purveyor's distribution system, the Purveyor will not undertake work on the customer's premises.
8. Schedule for Installation of Backflow Preventers. The following table shows the schedule that the Purveyor will follow for installation of backflow preventers when they are required (based on the hazard evaluation).
Type of Service Schedule
New connections with cross-connection hazards Before service is initiated Existing connections with Table 9-type hazards and other high cross-connection hazards
Within 90 days after notification
Existing connections with other than Table 9 of WAC 246-290-490 or high cross-connection hazards
Within 180 days after notification (suggested)
Existing fire protection systems using chemicals or supplied by unapproved auxiliary water source
Within 90 days after notification
Existing fire protection systems not using chemicals and supplied by Purveyor’s water
Within 1 year after notification (suggested)
The Purveyor may consider granting an extension of time for installation of backflow preventer for an existing connection if requested by the premises owner.
Element 4: Provision of qualified personnel, including at least one person certified as a CCS, to
develop and implement the CCC program.
1. Program Administration. The responsibility for administration of the CCC Program rests with the Purveyor. General policy direction and risk management decisions are established by the Mayor and City Council. By an inter-agency agreement, the Local Administrative Authority (LAA) may undertake certain administrative tasks, and the Purveyor may undertake additional tasks to assist the LAA.
2. The Purveyor will employ or have on staff at least one person certified by DOH as a CCS to develop and implement the CCC program. As an alternative, or when no staff or employees are properly qualified, the Purveyor may retain a DOH-certified CCS on contract to provide the necessary expertise and services.
3. The following cross-connection related tasks will be performed by or under the direction of the Purveyor’s certified CCS (on staff or under contract):
Preparation of and recommendations regarding changes to the CCC program; Performance of and/or reviews of CCC hazard evaluations; Recommendations on the type of backflow preventer to be installed; Recommendations on schedules for retrofitting of backflow preventers; Inspections of backflow preventers for proper application and installation;

City of Oak Harbor - Cross Connection Control Program 11
Reviews of backflow preventer inspection and test reports; Reviews of backflow testing quality control information; Recommendations and/or the granting of exceptions to mandatory premises isolation; Participation in or cooperation with other water utility staff in the investigation of
backflow incidents and other water quality problems; Completion of Backflow Incident Reports; and Completion of CCC Activity and Program Summary Reports.
4. The Purveyor may delegate other CCC program activities to other personnel who are not
certified CCSs, including clerical support staff. These activities include:
Administration of paperwork associated with service agreements; Mailing, collecting, and initial screening of hazard evaluation/water use questionnaires; Mailing of assembly testing notices; Receiving and screening of assembly testing reports; CCC program database administration and record keeping; Dissemination of public education material; and Assisting tasks associated with coordination with the LAA.
5. The following table identifies the current CCS employed or retained on contract by the
Purveyor to manage the Purveyor’s CCC program and/or act as the CCC technical resource for the Purveyor:
Name of CCS Rich Tyhuis Address 865 SE Barrington Drive City, State, Zip Oak Harbor, Washington Telephone Number 360-279-4753 CCS Certification Number 1726
Element 5: Development and implementation of procedures to ensure that approved backflow
preventers are inspected and/or tested (as applicable).
1. Inspection and Testing of Backflow Preventers. All backflow preventers that the Purveyor relies upon for protection of the water system will be subject to inspection and, if applicable, testing. This includes backflow preventers installed for in-premises protection that the Purveyor relies upon for protection of the water systems. Inspection and testing of backflow preventers will be as follows: The Purveyor’s DOH-certified CCS will inspect backflow preventers for proper
application (i.e., to ensure that the preventer installed is commensurate with the assessed degree of hazard);
Either a DOH-certified CCS or backflow assembly tester (BAT) will perform inspections of backflow preventers for correct installation; and
A DOH-certified backflow assembly tester will test all assemblies relied upon by the Purveyor to protect the public water system.

City of Oak Harbor - Cross Connection Control Program 12
2. Frequency of Inspection and Testing. Inspection and testing of backflow preventers will be conducted: At the time of installation; Annually after installation; After a backflow incident; and After repair, reinstallation, relocation, or re-plumbing.
The Purveyor may require a backflow preventer to be inspected and/or tested more frequently than once a year, when it protects against a high-health hazard or when it repeatedly fails tests or inspections.
3. Responsibility for Inspection and Testing. The Purveyor will be responsible for
inspection and testing of all Purveyor-owned backflow preventers. The Purveyor will require the customer to be responsible for inspection and testing of backflow preventers owned by the customer. The customer shall employ, at customer expense, a DOH-certified BAT pre-approved by the Purveyor to conduct the inspection and test within the time period specified in the testing notice sent by the Purveyor. The test report shall be completed and signed by the BAT, then countersigned and returned by the customer to the Purveyor, before the due date specified by the Purveyor. The customer may request an extension of the due date for returning a test report by submitting a written request to the Purveyor. The Purveyor may grant one extension up to 90 days.
4. Approved Test Procedures. The Purveyor will require that all assemblies relied upon to protect the public water system be tested in accordance with DOH-approved test procedures as specified in WAC 246-290-490(7)(d). Any proposal to use alternate test procedures must be approved by the Purveyor’s CCS.
5. Notification of Inspection and/or Testing. The Purveyor will notify in writing all customers who own backflow preventers that are relied upon to protect the public water system to have their backflow preventer(s) inspected and/or tested. Notices will be sent out not less than 30 days before the due date of the inspection and/or test. The notice will also specify the date (up to 30 days after the due date of the inspection and/or test date) by which the inspection/test report must be received by the Purveyor. (Appendix B)
6. Enforcement. When a customer fails to send in the inspection/test report within 15 days after the due date specified, and the Purveyor has not approved an extension to the due date, the Purveyor will take the following enforcement action: The Purveyor will send a second notice giving the customer an additional 15 days to
send in the inspection/test report; If the customer has not sent in the inspection/test report within 10 days of the due date
given in the second notice, the Purveyor will send a third notice, by certified mail, giving the customer an additional 15 days to send in the report. The notice will also inform the customer that failure to satisfactorily respond to this notice will result in water service shut-off;
The Purveyor will send copies of the third notice to the owner and occupants of the premises (if different from the customer) and to the LAA;

City of Oak Harbor - Cross Connection Control Program 13
If the owner and/or occupants have not responded satisfactorily to the Purveyor within 10 days of the due date specified in the third notice, the Purveyor will implement water service shut-off procedures; and
The Purveyor will offer to arrange for the inspection and/or testing of the customer-owned backflow preventers by a certified BAT and will bill the customer the actual or typical cost of inspection and/or testing in the service area plus reasonable administrative costs. Collection and enforcement procedures for such charges will be the same as for other water utility charges.
Element 6: Development and implementation of a backflow prevention assembly testing quality
assurance/quality control program.
1. List of Pre-Approved BATs. The Purveyor will maintain a list of local, DOH-certified BATs (Appendix C) that are pre-approved by the Purveyor to perform the following activities: Backflow preventer inspection for proper installation; and Backflow assembly testing.
The Purveyor will also maintain a list of local DOH-certified CCSs that are pre-approved by the Purveyor to perform the following activities: Cross-connection hazard evaluations; Backflow preventer inspection for proper application; and Backflow preventer inspection for proper installation.
The list(s) will be revised annually or more frequently if necessary.
2. Pre-Approval Qualifications. BATs and CCSs who wish to be included on the Purveyor’s
pre-approved list and/or provide testing in the Purveyor’s service area must apply to the Purveyor and furnish the following information:
Evidence of current DOH certification in good standing; Make and model of testing equipment (BAT listing only); Evidence of test equipment verification of accuracy and/or calibration within the past 12
months (BAT listing only); and Evidence showing possession of a license to operate a business in the City of Oak
Harbor.
3. Quality Assurance. The Purveyor’s CCS will review within 30 days of receipt the backflow preventer inspection/test report forms submitted by the customer. The Purveyor’s CCS may accept reports that are signed by a CCS or BAT not on the pre-approved CCS or BAT list provided that the same information as listed in “Pre-Approval Qualifications” is also submitted to the Purveyor. The Purveyor’s CCS will provide follow up on test reports that are deficient in any way. The Purveyor’s CCS will report incidences of fraud or gross incompetence on the part of any BAT or CCS to DOH Operator Certification program staff.

City of Oak Harbor - Cross Connection Control Program 14
The Purveyor in addition, and not limited to the above requirements for quality assurance
and quality control, shall reference the proposed supplement to the 6th edition of the PNWS-AWWA CCC Manual titled Quality Assurance and Quality Control for Testing of Backflow Prevention Assemblies (Appendix J).
Element 7: Development and implementation (when appropriate) of procedures for responding
to backflow incidents.
1. Backflow Incident Response Plan. The Purveyor's CCS will participate in developing a backflow incident response plan that will be part of the water system’s emergency response program as required by WAC 246-290-415(2). (Appendix D) The incident response plan will include, but will not be limited to:
Notification of affected population; Notification and coordination with other agencies, such as DOH, the LAA, and the local
health jurisdiction; Identification of the source of contamination; Isolation of the source of contamination and the affected area(s); Cleaning, flushing, and other measures to mitigate and correct the problem; and Apply corrective action to prevent future backflow occurrences.
2. Technical Resources. The Purveyor will use the most recently published edition of the
manual, Backflow Incident Investigation Procedures, published by the PNWS-AWWA as a supplement to the Backflow Incident Response Plan for the City of Oak Harbor.
Element 8: Development and implementation of a cross-connection control public education
program.
1. Customer Education. The Purveyor will distribute with water bills or some other means, at regular intervals, public education brochures to system customers. For residential customers, such brochures will describe the cross-connection hazards in homes and the recommended assemblies or devices that should be installed by the homeowner to reduce the hazard to the public water system. The education program will emphasize the responsibility of the customer in preventing the contamination of the public water supply. The Purveyor’s staff will produce the public education brochures (Appendix E) or the Purveyor will obtain brochures from:
PNWS-AWWA; Spokane Regional Cross-Connection Control Committee (SRC4); Western Washington Cross-Connection Prevention Professionals Group (The Group); USC FCCCHR; Other national backflow prevention associations, such as the American Backflow
Prevention Association (ABPA); and/or Other water utilities.
The information distributed by the Purveyor will include, but not be limited to, the following subjects:

City of Oak Harbor - Cross Connection Control Program 15
Cross-connection hazards in general; Irrigation system hazards and corrective actions; Fire sprinkler cross-connection hazards; Importance of annual inspection and/or testing of backflow preventers; and Thermal expansion in hot water systems when backflow preventers are installed for
premises isolation. The Purveyor will distribute information brochures to all customers every two to three years, and to every new customer at the time the service agreement is signed.
2. Public Outreach. In cooperation with other water utilities, the Purveyor will participate in
an outreach program consisting of:
Distribution of cross-connection control information to hardware and plumbing stores serving the area;
Participation in fairs, exhibits, and other events; and Special education sessions for irrigation contractors, fire sprinkler contractors, local
backflow assembly testers, etc. Element 9: Development and maintenance of cross-connection control records.
1. Types of Records and Data to be Maintained. The Purveyor will maintain records of the following types of information required by WAC 246-290-490:
Service connections/customer premises information including: o Assessed degree of hazard; and o Required backflow preventer to protect the public water system.
Backflow preventer inventory and information including: o Air gap (AG) location, installation and inspection dates, inspection results and
person conducting inspection; o Backflow assembly location, assembly description (type, manufacturer, make,
model, size, and serial number), installation, inspection and test dates, test results and data, and person performing test; and
o Information on atmospheric vacuum breakers used for irrigation system applications, including manufacturer, make, model, size, dates of installation and inspections, and person performing inspections.
The Purveyor will maintain records on all assemblies that protect the public water system from contamination. At a minimum, the Purveyor will maintain records on all premises isolation assemblies required to protect the public water system. Where applicable, the above information will also be maintained for backflow preventers installed for in-premises protection that is relied upon by the Purveyor to protect the public water system. By inter-agency agreement, the Purveyor will also maintain the above information for LAA required backflow preventers that are not relied upon by the Purveyor to protect the public water system.
2. Reports to be Prepared and Submitted to DOH. The Purveyor will prepare the following

City of Oak Harbor - Cross Connection Control Program 16
reports required by WAC 246-290-490 (Appendix F) including:
Cross-connection control program activities report for the calendar year, to be sent to DOH when requested;
Cross-connection control program summary information, when required, or when there are significant policy changes;
Backflow incident reports to DOH (and voluntarily to the PNWS-AWWA CCC Committee); and
Documentation when exceptions to mandatory premises isolation are granted. At a minimum, the Purveyor’s CCS will prepare and sign the exceptions reports. The Purveyor’s CCS will prepare and sign all CCC-related reports required by WAC 246-290-490.
Element 10: Additional cross-connection control requirements for reclaimed water. At this time the City of Oak Harbor does not receive or distribute reclaimed water. In the event that reclaimed water use is proposed within the PWS’s service area, the Purveyor will make all cross-connection control requirements mandated by the Permitting Authority in accordance with Chapter 90.46 RCW part of the written CCC program plan and comply with such additional requirements. E. Other Provisions
1. Coordination with Local Administrative Authority. Both WAC 246-290-490 and the Uniform Plumbing Code amended for Washington require coordination between the water Purveyor and the Local Administrative Authority (LAA) in all matters pertaining to cross-connection control. The Purveyor will provide a copy of this CCC program to the City of Oak Harbor Development Services Department via a copy of the Purveyor's water system plan or in a separate document. The Purveyor will inform the LAA of any changes in policy or procedure that may impact the LAA.
The Purveyor will provide information to the LAA in a timely manner regarding any:
Requirement imposed on a residential customer for the installation of a DCVA or an
RPBA on the service, with a description of the cross-connection hazard identified; Upgrade of the premises isolation backflow preventer, i.e., from a DCVA to an RPBA; Action taken to discontinue water service to a customer; and Backflow incident known by the Purveyor to have contaminated the public water
system or a customer’s plumbing system.
2. Written Agreement with Local Administrative Authority. The Purveyor will pursue development of a written agreement with the Local Administrative Authority regarding the details of the coordination on CCC issues between the two parties. The agreement will include, but not be limited to, the following items:
The purpose of the written agreement; Identification of the parties and other interested agencies;

City of Oak Harbor - Cross Connection Control Program 17
Delineation of responsibilities; Procedures regarding new service connections; Procedures regarding existing and changes to existing services; Special policies and procedures, such as for fire protection and irrigation services; Procedures regarding water service shut-offs, backflow incidents, and other events; Communications between parties; and Other contingencies.
3. Prohibition of Return of Used Water. The PWS must prohibit the intentional return of
used water to the Purveyor’s distribution system per WAC 246-290-490 (2)(l). Used water is defined as water that has left the control of the Purveyor. This includes water used for heating and cooling purposes and water that may flow back into the distribution system from customers with multiple connections. It is the policy of the City of Oak Harbor water system to:
Prohibit the intentional return of used water to the distribution system by any customer served by the public water system; and
Require that all customers with multiple connections, where the hydraulics permit the potential return of used water, to install a backflow preventer (DCVA or RPBA) commensurate with the degree of hazard at each point of connection.
4. Unapproved Auxiliary Supplies. All water supplies other than those owned by the
Purveyor are considered unapproved auxiliary supplies as defined in WAC 246-290-010. The Purveyor will require backflow protection for customers with auxiliary supplies on their premises as follows:
Per Table 9 of WAC 246-290-490, the Purveyor will require the installation of an RPBA
for premises isolation at the service connection to any customer having an unapproved auxiliary supply on the premises that is interconnected with the Purveyor’s water system. The Purveyor will require the installation of a DCVA for premises isolation at the service connection to any customer with an unapproved auxiliary water supply not interconnected with the Purveyor’s water system.
5. Tanker Trucks. The Purveyor may allow tanker trucks to obtain water from the
Purveyor’s water system under the following conditions:
The tanker truck is equipped with an approved AG or an approved RPBA with a current satisfactory inspection or test report; and
The tanker truck will obtain water from Purveyor-designated watering points only. These watering points are equipped with Purveyor-installed backflow preventers.
6. Temporary Water Connections. The Purveyor will not supply water through temporary
connections, such as those used for construction projects or main disinfection, except through a backflow preventer arrangement approved by the Purveyor. The applicant for the temporary connection shall document that the backflow preventer is a DOH-approved model and has passed an inspection and/or test within the past 12 months and/or upon relocation, whichever is more recent.

City of Oak Harbor - Cross Connection Control Program 18
7. Interties and Wholesale Water Customers. The Purveyor will require that interties with other public water systems or wholesale customers (such as mobile home parks) be isolated at the point of delivery by:
A minimum of a DCVA; and A minimum of an RPBA if the Purveyor considers the purchasing system or wholesale
customer to pose a high-health hazard to the Purveyor’s system. The Purveyor may waive or reduce the level of protection at the intertie, if the purchasing
public water system or wholesale customer:
Is a Group A public water system not exempt from DOH regulation as per WAC 246-290-020(2);
Has a CCC program that complies with WAC 246-290-490 and which has been
approved by DOH; and Implements the CCC program at a level satisfactory to the Purveyor.
F. Relationship to Other Planning and Operations Program Requirements The Purveyor will consider the requirements and consequences of the CCC program on the utility’s planning and operations requirements. Such considerations include, but are not limited to ensuring:
And promoting adequate communication between CCC program personnel and other water utility staff;
That adequate training is provided to all staff to recognize potential cross-connection control problems;
That cross-connection issues be considered in water quality investigations; That the design of the water distribution system makes adequate provisions for expected
head losses incurred through the installation of experienced by backflow assemblies; That CCC program personnel be consulted in the design of water and wastewater
treatment facilities and when proposals are made to receive or distribute reclaimed water; That operations under normal and abnormal conditions do not result in excessive pressure
losses; and That adequate financial and administrative resources are available to carry out the CCC
program.

APPENDIX A
ORDINANCE 1456 OHMC CHAPTER 13.13


APPENDIX B
PROGRAM ADMINISTRATION DOCUMENTS LIST

City of Oak Harbor – Cross Connection Control Program – Appendix B
Appendix B Program Administration Documents List
Sample Forms
The first section of Appendix B contains the following forms:
Application for Water Service (Service Agreement); Backflow Assembly Test/AG Inspection Report - File Record; Cross-Connection Control Hazard Survey Report - Non-Residential Customers; Water Use Questionnaire - Residential Customers; and Backflow Incident Report Form.
Sample Letters
Request to Complete Water Use Questionnaire; Notice of Survey of Premises; Request to Install Backflow Prevention Assembly; Request to Submit Test of Backflow Prevention Assembly; and Second Notice to Test Backflow Prevention Assembly.
Appendix C contains the following forms:
Backflow Assembly Testers - Pre-Approved for Submitting Test Reports; and Commercial Cross Connection Questionnaire - Non-Residential Customers.

City of Oak Harbor – Cross Connection Control Program – Appendix B
Application for Water Service (Service Agreement) Owner's Name: Phone: Mailing Address: Location Address: Legal Description: 1. The undersigned applicant hereby applies for a water connection to the above-described property. 2. The applicant is the owner of the described property or the authorized agent of the owner. 3. As a condition of the City of Oak Harbor, hereinafter referred to as the Purveyor, providing and continuing service to the
above described property, the property owner, by signing this application, agrees to comply with: a. All provisions of the attached current Ordinance, Resolution and/or By-laws of the Purveyor, or latest revision
thereof; and b. Other such current (attached) and future rules and regulations that govern the Purveyor's water system.
4. The property owner specifically agrees: a. To install and maintain at all times his plumbing system in compliance with the most current edition of the Uniform
Plumbing Code as it pertains to the prevention of potable water system contamination and prevention of pressure surges and thermal expansion in his water piping (for thermal expansion, it shall be assumed that a check valve is installed by the Purveyor on the water service pipe);
b. Within 30 days of the Purveyor's request (or alternate schedule acceptable to the Purveyor): i) To install, maintain, test and repair in accordance with the Purveyor’s cross-connection control standards all
premises isolation backflow prevention assemblies required by the Purveyor to be installed to protect the public water system from contamination; and
ii) To report to the Purveyor the results of all assembly tests and/or repairs to the premises isolation backflow prevention assemblies.
c. As a condition of the Purveyor waiving the requirement for premises isolation by a reduced pressure backflow assembly on the property owner’s service pipe: i) To authorize the Purveyor to make periodic water use surveys of the premises; ii) Within 30 days of the Purveyor's request, to install, test, maintain, and repair in accordance with the Purveyor's
cross connection control standards (copy received with this application) all in-premises backflow prevention assemblies that provide equivalent protection for the Purveyor's distribution system;
iii) To report to the Purveyor within 30 days of obtaining the results of all tests and repairs to the aforementioned backflow prevention assemblies; and
iv) To report to the Purveyor any change to the plumbing system. d. Not to make a claim against the Purveyor or its agents or employees for damages and/or loss of production, sales or
service, in case of water pressure variations, or the disruption of the water supply for water system repair, routine maintenance, power outages, and other conditions normally expected in the operation of a water system.
e. To pay his water bill within 30 days from the date of billing. After 30 days of the Purveyor mailing a written notice to the property owner of his breach of this agreement, the Purveyor may terminate water service. In the event legal action is required and commenced between the parties to this agreement to enforce the terms and conditions herein, the substantially prevailing party shall be entitled to reimbursement of all its costs and expenses including but not limited to reasonable attorney's fees as determined by the Court.

City of Oak Harbor – Cross Connection Control Program – Appendix B
Applicant's Signature ______________________________Date __________________ Attachments received (have customer initial): Water Rates/Charges _______________ Service Connection Information _____________
Water Service Policy ________________ For Purveyor Use Only _____/______/____ Date connection fee received _____/_____/____ Date Water Use Survey questionnaire received _____/_____/____ Date risk assessment completed; by ________________
{Insert Name of CCS} _____/_____/____ Date customer notified of requirement for BPA _____/_____/____ Date BPA installation approved _____/_____/____ Date BPA test report accepted _____/_____/____ Date BPA information entered into database

City of Oak Harbor – Cross Connection Control Program – Appendix B
BACKFLOW PREVENTION ASSEMBLY TEST REPORT
ACCOUNT NO.
NAME OF PREMISE Commercial □ Residential □ SERVICE ADDRESS CITY ZIP CONTACT PERSON PHONE ( ) FAX ( ) LOCATION OF ASSEMBLY
DOWNSTREAM PROCESS DCVA □ RPBA □ PVBA □ OTHER
NEW INSTALL □ EXISTING □ REPLACEMENT □ OLD SERIAL NO. PROPER INSTALLATION? YES □ NO □ MAKE OF ASSEMBLY MODEL SERIAL NO. SIZE
INITIAL TEST
PASSED □
FAILED □
DCVA / RPBA CHECK VALVE NO. 1
LEAKED □
PSID
DCVA / RPBA CHECK VALVE NO. 2
LEAKED □
PSID
RPBA OPENED AT PSID AIR GAP OK? .
PVBA / SVBA AIR INLET
OPENED AT PSID
DID NOT OPEN □
NEW PARTS & REPAIRS
CLEAN REPLACE PART
□ □ .
□ □ .
□ □ .
□ □ .
CLEAN REPLACE PART
□ □ .
□ □ .
□ □ .
□ □ .
CLEAN REPLACE PART
□ □ .
□ □ .
□ □ .
□ □ .
CHECK VALVE HELD AT PSID
LEAKED □
CLEANED □
REPAIRED □
TEST AFTER REPAIRS
PASSED □
FAILED □
LEAKED □
PSID
LEAKED □
PSID
OPENED AT PSID #1 CHECK PSID
AIR INLET PSID CHK VALVE PSID
AIR GAP INSPECTION: Required minimum air gap separation provided? YES □ NO □ Detector Meter Reading REMARKS: LINE PRESSURE PSI OWNER SIGNATURE: CONFINED SPACE? TESTER’S SIGNATURE: CERT. NO. DATE TESTER’S NAME PRINTED: TESTER’S PHONE NO. REPAIRED BY: DATE FINAL TEST BY: CERT. NO. DATE
CALIBRATION DATE GAUGE NO. MODEL SERVICE RESTORED? YES □ NO □
I certify that this report is accurate, and I have used WAC 246-290-490 approved test methods and test equipment.

City of Oak Harbor – Cross Connection Control Program – Appendix B
COMMERCIAL CROSS-CONNECTION QUESTIONAIRE Today’s Date: Account Number:
Project Name: Permit Number #:
Business Name:
Business Type:
Physical Property Address:
City: State: Zip:
Property Owner:
Mailing Address:
Mailing City: State: Zip:
Contact Person: Phone Number: 1. Please indicate if your facility has, or will have, any of the following: □ Air conditioning system □ Air washer □ Aquarium make-up water □ Aspirator, chemical (herbicide, pesticide,
weedicide) □ Aspirator, Medical / Lab □ Autoclave □ Autopsy table □ Auxiliary water system (well, pond, creek, other) □ Baptismal fountain □ Bathtub, below rim filler □ Bedpan washer □ Beverage dispenser (post-mix Co2) □ Boiler feed lines □ Bottle washing equipment □ Box hydrant (irrigation) □ Building three stories or more tall □ Car wash □ Chemical feed tank for industrial process □ Chemical feed (commercial cleaners) □ Chlorinators □ Computer cooling lines □ Condensate tanks □ Cooling towers □ Decorative ponds □ Degreasing equipment □ Dental equipment / cuspidors □ Dialysis equipment □ Dye vats and tanks □ Etching tanks □ Fermenting tanks □ Fertilizer injection □ Film processors
□ Fire Department pumper connections □ Fire system (with booster pump) □ Fire system (without chemicals) □ Fire system (with antifreeze or chemicals) □ Fume hoods (lab) □ Garbage can washers □ Heat exchangers (other than double wall with leak path) □ Heat pumps □ High pressure washers □ Hot tubs (direct water connection) □ Hydrotherapy baths □ Ice makers □ Industrial fluid systems □ Irrigation system (no chemicals) □ Irrigation system (chemical) □ Laboratory equipment □ Laundry machines (commercial) □ Livestock drinking tanks □ Make-up tanks □ Photo developing sinks / tanks □ Pump prime lines □ Radiator flushing equipment □ Recreational vehicle sewage dump □ Sewer connected equipment □ Solar water heating system □ Spas □ Steam generating equipment □ Stills □ Swimming pools □ Trap primers □ Used, reclaimed or gray water systems □ X-ray equipment

City of Oak Harbor – Cross Connection Control Program – Appendix B
2. Are you aware of any existing backflow protection located at this property?
Please describe:
3. Please provide the name of all products or chemicals that are mixed with water at your location: 4. Please provide the name of all products or chemicals that are stored in bulk at your location: Name of person completing this form:
THIS SECTION TO BE COMPLETED BY THE WATER QUALITY DIVISION
Type of water use
Hazard Assessment Backflow Protection Required Low High None DCVA DCDA RCBA RPDA
Domestic □ □ □ □ □ □ □ Irrigation □ □ □ □ □ □ □ Fire □ □ □ □ □ □ □ Status of meter □ Meter is set □ OK to install unlocked Certified by
□ Locked per water quality Please return this questionnaire to the City of Oak Harbor Water Division:

City of Oak Harbor – Cross Connection Control Program – Appendix B
Cross-Connection Control Hazard Survey Report Non-Residential Customers
Survey date: ____________ Customer Information Premises name: ___________________________________Telephone: ___________________ Address: ______________________________________________________ZIP: ___________ Contact person: _____________________________________Title: ______________________ Description of premises: _________________________________________________________ Description of water use: ________________________________________________________ Water Service and Backflow Prevention Assembly (BPA) Size/Type
Service Type
Service Size
Meter Size
BPA Size
BPA Type
Domestic
Fire
Irrigation
Other
Cross-Connection Control Specialist (CCS) Information Name: ______________________________________ Telephone: ____________________ Company name: ________________________________________________________________ Address: ________________________________________________________ZIP: __________ DOH CCS Certification #: _____________________ Year certified: _________________

City of Oak Harbor – Cross Connection Control Program – Appendix B
Cross Connection Control Survey Report (Continued) Page 2 of 3 Survey Results Note: The CCS’s survey shall include an inspection of the premises isolation assembly to verify that it is installed correctly and is a currently listed DOH-approved assembly.
Item
Location & Description of Cross Connection
Backflow Prevention Provided/Required
Attach additional sheets if needed. Surveyor's Comments ________________________________________________________________________________________________________________________________________________________________________________________________________________________________________________________________________________________________________________________________________________________________________________________________________________________________________________________________________________________________________________________________________________________________________________________________________________________________________________________________________________________________________________________________________________________________________________________________________________________________________________________________________________________________________________________________________________________________________________________________________________________________________________________________________________________________________________________________________________

City of Oak Harbor – Cross Connection Control Program – Appendix B
Cross-Connection Control Survey Report (Continued) Page 3 of 3 Surveyor's Recommendations I certify that this cross-connection hazard survey accurately reflects the overall risk posed by the customer's plumbing system to the Purveyor's distribution system. Based on the above survey, I certify that:
1. I found the following type(s) of premises isolation backflow preventer(s):
Air Gap ____ RPBA/RPDA ____ DCVA/DCDA _____ None ____.
2. The existing backflow preventer(s) is/are properly installed.
Yes ____ No ____ N/A ____.
3. The existing backflow preventer(s) is/are commensurate with the degree of hazard:.
Yes ____ No ____ N/A ____.
4. Since no backflow preventer was installed for premises isolation, the premises owner should install a premises isolation backflow preventer of the following type:
Air Gap ____ RPBA/RPDA ____ DCVA/DCDA ____ N/A ____.
5. The premises owner should replace the existing premises isolation backflow preventer(s) with the following:
Air Gap ____ RPBA/RPDA ____ DCVA/DCDA ____ N/A ____.
The completed survey report shall be first signed by the CCS conducting the survey, and then counter-signed by the owner of the premises or the owner’s authorized agent. CCS Signature: _________________________________Date: ______________ As the Owner of the Premises (or Owner’s authorized agent), I certify that I have received a copy of this completed Cross-Connection Control Hazard Survey Report. Signature: _______________________________________Date: ____________ Note: Customers and regulatory agencies should be aware that the Purveyor's requirement for this cross-connection hazard survey and/or for the installation of a specific backflow prevention assembly on a service pipe do not constitute an approval of the customer's plumbing system, compliance of the customer's plumbing system with the Uniform Plumbing Code or an assurance of the absence of cross connections in the customer’s plumbing system.

City of Oak Harbor – Cross Connection Control Program – Appendix B
Water Use Questionnaire Residential Customers
Customer Account Number (optional)________________________ Permit Number____________________ Contact person______________________________ Property Owner_______________________________ Physical Address _________________________________________________________________________ Mailing Address _________________________________________________________________________ Phone Number______________________________ Please indicate whether the special plumbing or activities listed below apply to your premises:
Yes
No Plumbing or Activity Present on Customer’s Premises*
Underground sprinkler system Water treatment system (e.g., water softener) Solar heating system Residential fire sprinkler system Other water supply (whether or not connected to plumbing system) Sewage pumping facilities or grey water system Boat moorage with water supply Hobby farm Animal watering troughs Swimming pool or spa Greenhouse Decorative pond Photo lab or dark room Home-based business. If Yes, list type/describe (e.g., beauty salon, machine shop,
etc.): ________________________________________________________________________________________________________________________________________
* Based on their knowledge of residential connections served, public water systems may “customize” this list by adding or deleting plumbing categories or activities
Completed by (print name): ___________________________ Date: __________ Resident’s Signature: ___________________________________________________________ Please return this questionnaire to the City of Oak Harbor Water Division

City of Oak Harbor – Cross Connection Control Program – Appendix B
Backflow Incident Report Form
Many backflow incidents occur that are not reported. This is usually because:
The incidents are of short duration; The incidents are not detected; Neither the customer nor the Purveyor realizes that a contamination was caused by a backflow incident; The customer is not aware the incident should be reported; Customers do not know who to report the incidents to; and/or Liability concerns on the part of either the customer or purveyor or both.
DOH and the PNWS-AWWA Cross-Connection Control Committee are making an effort to bring backflow incidents to the attention of water purveyors, Local Administrative Authorities, legislators, and the general public. If you have any knowledge of a backflow incident, please fill out a copy of the Backflow Incident Report Form and return it to DOH and the PNWS-AWWA CCC committee.
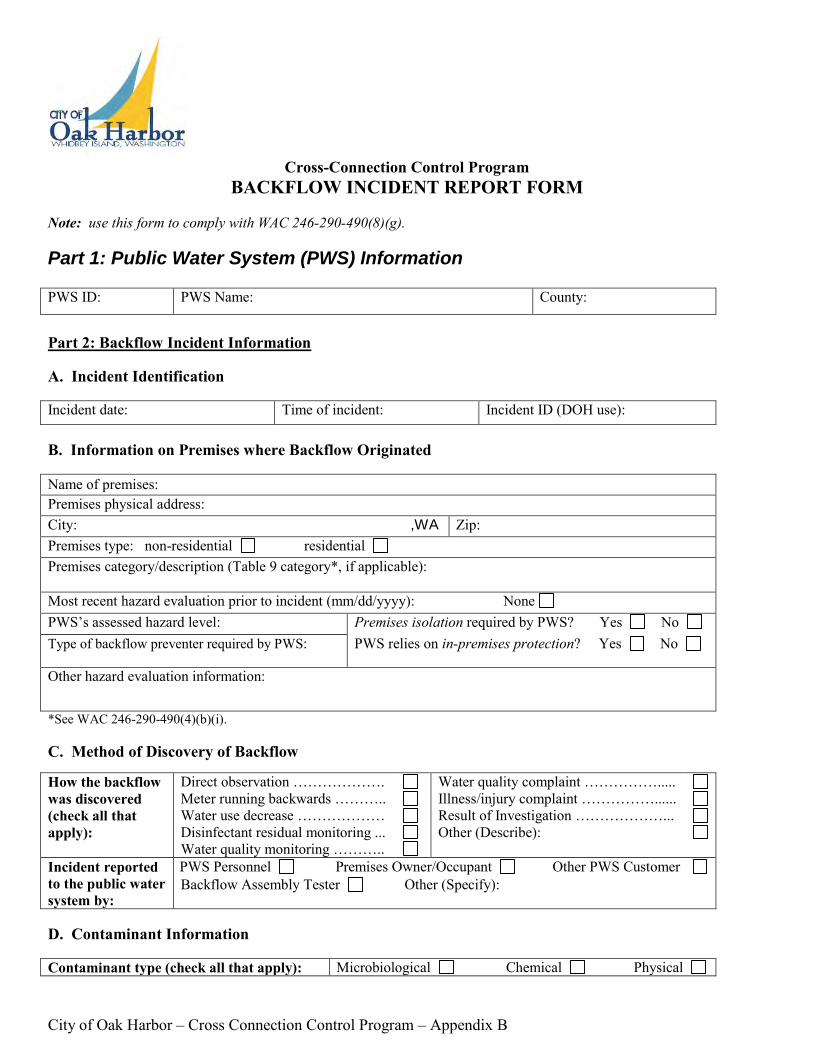
City of Oak Harbor – Cross Connection Control Program – Appendix B
Cross-Connection Control Program BACKFLOW INCIDENT REPORT FORM
Note: use this form to comply with WAC 246-290-490(8)(g).
Part 1: Public Water System (PWS) Information PWS ID: PWS Name: County:
Part 2: Backflow Incident Information A. Incident Identification Incident date: Time of incident: Incident ID (DOH use): B. Information on Premises where Backflow Originated Name of premises:
Premises physical address: City: ,WA Zip: Premises type: non-residential residential Premises category/description (Table 9 category*, if applicable):
Most recent hazard evaluation prior to incident (mm/dd/yyyy): None PWS’s assessed hazard level: Premises isolation required by PWS? Yes No Type of backflow preventer required by PWS:
PWS relies on in-premises protection? Yes No
Other hazard evaluation information:
*See WAC 246-290-490(4)(b)(i). C. Method of Discovery of Backflow How the backflow was discovered (check all that apply):
Direct observation ………………. Meter running backwards ……….. Water use decrease ……………… Disinfectant residual monitoring ... Water quality monitoring ………..
Water quality complaint ……………..... Illness/injury complaint ……………...... Result of Investigation ………………... Other (Describe):
Incident reported to the public water system by:
PWS Personnel Premises Owner/Occupant Other PWS Customer Backflow Assembly Tester Other (Specify):
D. Contaminant Information Contaminant type (check all that apply): Microbiological Chemical Physical

City of Oak Harbor – Cross Connection Control Program – Appendix B
Describe contaminant (for example, the organism name, chemical, etc.). Please attach lab analysis or MSDS, if available.
E. Extent and Effects of Contamination
Estimated extent of contamination: Contained within premises Entered PWS distribution system
Estimated number of connections affected: Residential Non-residential
Estimated population affected or at risk: Residential Non-residential
Number water quality complaints: Describe water quality complaints:
Number illnesses reported: Describe illnesses/irritation (specific illnesses, if known):
Number physical injuries(e.g. burns) or irritation(e.g. rashes) cases reported:
Part 3: Cross-Connection Control Information at Backflow Site
A. Source of Contaminant
Source of contaminant or fixture type (check all that apply):
Air conditioner/heat exchanger …..… Auxiliary water supply ……………... Beverage machine ……………..…… Boiler, hot water system ……..….…. Chemical injector/aspirator …….…... Fire protection system …………..….. Irrigation system (PWS supplied) …..
Industrial/commercial process water/fluid……………………….
Medical/dental fixture ………..…… Reclaimed water system………..….. Swimming pools, spa ….……..……. Wastewater (sewage) system …..….. Other (specify): ……….……. ……………………………..
B. Distribution System Pressure Conditions in the Vicinity of the Backflow Incident
Type of backflow:
Backsiphonage Backpressure
Typical distribution system pressure in vicinity of incident (if range, enter lower end of range): psi
Main/pressure status at time of incident (check all that apply):
Normal …………………………….... Main break ………………….............. Fire fighting ………………………… Other high usage ……………………. Power outage …………………………
Source/plant outage ………………… Scheduled water shutoff by PWS …... Unscheduled/emergency shutoff …… Unknown ...……………………......... Other (specify)
Describe causes and circumstances leading to backflow:
C. Backflow Preventer Information/Installation/Approval Status at Site of Backflow
Complete the tables in C and D for the premises isolation preventer for either of the following situations:
If a premises isolation backflow preventer is installed and the contaminant entered the PWS distribution system.
If the premises isolation assembly is the only backflow preventer at the site. In all other cases, complete tables in C and D for the in-premises backflow preventer installed at the fixture. If

City of Oak Harbor – Cross Connection Control Program – Appendix B
more than one backflow preventer was involved in the backflow incident, copy tables C and D and complete them for the additional preventer(s). If no backflow preventer was installed at the time the incident occurred, check this box and go directly to Part 4. Don’t fill out the tables below (in C and D). Backflow preventer information:
Type installed: Installed for: Make: Model: Size: Serial number: Date installed:
Installation status (check all that apply):
Properly installed/plumbed Improperly protected bypass present Improperly installed/plumbed If so, explain:
Commensurate with assessed degree of hazard?
Yes No If not, explain:
DOH/USC-approved at time of backflow incident?
Yes No If not, approved when installed? Yes No
D. Backflow Preventer Inspection/Testing Information at Site of Backflow Most recent inspection/test information prior to backflow incident. Attach test report(s), if available.
No test report on record ….................................................. Date tested/inspected: Passed test/inspection without repairs ………………… Failed initial test/inspection, passed after repair ……… Failed test/inspection, no repairs made ………………..
Inspection/test information after backflow incident [per WAC 246-290-490(7)(b)]. Attach test report.
Not tested/inspected …................................................... Date tested/inspected: Passed test/inspection without repairs ………………… Failed initial test/inspection, passed after repair………. Failed test/inspection, no repairs made………………...
Preventer failure information , if applicable (check all that apply):
Fouled check ………………. Debris ……………………… Weather-related damage …...
Damaged seat …. Other:
If preventer failed inspection/test, did failure allow backflow?
Yes No If yes, explain:
Part 4: Corrective Action/Notifications Action taken by PWS to restore water quality (check all that apply):
None ……………………… Flushed/cleaned mains …… Flushed/cleaned plumbing… Disinfected mains ………… Disinfected plumbing ……...
Other treatment (describe): Replaced mains ………… Replaced plumbing …….. Other:
Action ordered by PWS to correct cross-connection (check all that apply):
None ……………….……… Eliminate cross-connection... Remove by-pass …………... Install new preventer … For premises isolation For fixture protection
Change existing preventer Repair/replumb …..…… Reinstall correctly …...... Replace with same type Upgrade type ........……. Other:
Action ordered accomplished? Yes Date: No If no, explain:
Agency notifications per WAC 246-290-490(8)(f) (check all that apply):
DOH Local Health Agency Local Adm. Authority Issued by end of next business day:
Notifications of consumers in area of incident (check all that apply):
Population at risk Public notification (PN per DOH regs.) Boil Water Advisory Other (describe):
Other enforcement/corrective actions (describe):

City of Oak Harbor – Cross Connection Control Program – Appendix B
Part 5: Cost of Backflow Incident (optional)
Item PWS Personnel Hours Expended
Cost to PWS ($) Cost to Premises Owner ($)
Investigation Restoration of water quality Correction of cross-connection situation Litigation and/or settlement Other not included in above
Part 6: Further Information/Documentation
Additional information about this incident such as pictures, sketches, newspaper/journal articles, water quality analyses, epidemiological reports, etc. would be helpful. Information may be in electronic form or hard copy.
Part 7: Form Completion Information
Note: Form should be completed by a person currently certified as a Cross-Connection Control Specialist. I certify that the information provided in this Backflow Incident Report is complete and accurate to the best of my knowledge. CCC Program Mgr. Name (print): Title:
Signature: CCS Cert. Number: Date:
Phone: E-mail: I have reviewed this report and certify that the information is complete and accurate to the best of my knowledge. PWS Mgr./Representative Name (Print): Title:
Signature: Op. Cert. Number: Date:
Please send completed backflow incident form:
By regular mail to: Washington State Department of Health Office of Drinking Water – CCC Program Manager P O Box 47822 Olympia, WA 98504-7822
By email to: [email protected] or [email protected]
For persons with disabilities, this document is available on request in other formats. To submit a request, please call 1-800-525-0127 (TTY 1-800-833-6388).
Please send questions, comments or suggestions about this form to DOH at the address above or e-mail them to [email protected]

City of Oak Harbor – Cross Connection Control Program – Appendix B
Letter Requesting Customer to Complete Water Use Questionnaire Date Customer Account Number (optional) Customer Customer Address Line 1 Customer Address Line 2 Dear ________ Water System Customer: Washington State drinking water regulations, WAC 246-290-490, require public water systems to develop and implement cross-connection control programs. Cross-connection control programs help protect public health by preventing contamination of the drinking water as it is delivered to water system customers. The attached brochure explains what a cross connection is, describes typical household cross connections and what you can do to help protect your drinking water. As part of our efforts to keep your drinking water safe, we are conducting a cross-connection control hazard survey of residential customers served by our system. The purpose of the survey is to help us determine if any of our residential customers have special plumbing or activities on their premises that could increase the risk of contamination to our water system. For most residential customers, the cross-connection control hazard posed to the public water system is minimal. This is because your household plumbing was installed in compliance with the Uniform Plumbing Code. The Uniform Plumbing Code generally provides adequate protection of your water potable water piping and our public water distribution system from cross connections. However, a few customers with special plumbing or activities on their premises may pose an increased health risk to other customers served by our system. These customers may need to have a backflow preventer installed on their service lines or provide alternate protection to prevent contamination of the public water system. Please complete the attached questionnaire by checking the applicable boxes on the table; and return the completed, signed questionnaire by {insert date} to the address shown below. Thanks in advance for filling out the questionnaire. We appreciate your cooperation in helping us to protect the drinking water we deliver to our customers. If you have any questions about the survey or how to fill out the questionnaire, please contact me at (360) 279-4753. We will review your questionnaire and determine whether we need to contact your for further information. Sincerely, Rich Tyhuis Operations Manager Enclosures: CCC Brochure Water Use Questionnaire

City of Oak Harbor – Cross Connection Control Program – Appendix B
Notice of Survey of Premises (Non-Residential/Multi-Family Residential) Customer-Employed Cross-Connection Control Specialist
Date Customer Account Number (optional) Customer Name Customer Address Line 1 Customer Address Line 2 Dear ________ Water System Customer: Washington State drinking water regulations, WAC 246-290-490, require public water systems to develop and implement cross-connection control programs. Cross-connection control programs protect public health by preventing contamination of the drinking water supply. The attached brochure explains what a cross connection is and what you can do to help protect your drinking water. As part of the cross-connection control program, our system must assess the degree of hazard posed by each of our customer's plumbing systems upon the public water system. Non-residential customers and multi-family residential customers pose a special concern, because of the greater scope and complexity of their plumbing systems, special uses of water on the premises (e.g., manufacturing), fire protection systems, etc. Depending on the hazard assessment results, you may need to have a backflow preventer installed on your service line or provide alternate protection. A cross-connection survey needs to be conducted in order for the City to complete the hazard assessment for your premises. The drinking water regulations require a person with special training, i.e., a Department of Health certified Cross-Connection Specialist (CCS), to conduct the surveys. Our system’s policy is to have surveys of all non-residential premises and multi-family residential premises conducted by the City of Oak Harbor Water Division. Please arrange for an appointment for the City to conduct the survey by {insert date}. We appreciate your cooperation in meeting this hazard survey requirement. If you have any questions, please contact me at (360) 279-4753. Sincerely, Rich Tyhuis Operations Manager Enclosures: CCC Brochure Water Use Questionnaire CCS List

City of Oak Harbor – Cross Connection Control Program – Appendix B
Request to Install Backflow Prevention Assembly Date Customer Account Number (optional) Customer Name Customer Address Line 1 Customer Address Line 2 Dear ________ Water System Customer: Washington State drinking water regulations, WAC 246-290-490, require public water systems to develop and implement cross-connection control programs. Cross-connection control programs protect public health by preventing contamination of the drinking water as it is delivered to people served by the water system. The purpose of this letter is to inform you of a requirement to install a backflow assembly. Our water system’s policy considers each of our customers’s plumbing systems, starting from the termination of the service pipe downstream of the water meter, to pose a potential cross-connection hazard to the public water system. The policy requires a backflow prevention assembly commensurate with the degree of hazard to be installed on the service line. The purpose of this backflow prevention assembly is to isolate your plumbing system from the water distribution system. Attached is a copy of Ordinance 1456 (OHMC Chapter 13:13) describing the cross-connection control policy. We have conducted the cross-connection control survey report submitted by the Cross-Connection Control Specialist (CCS). The survey assessed the overall public health hazard posed by your plumbing system (and water use) to the public water system. We agree with the assessment made by the CCS. Based on the assessment, a Department of Health-approved {insert type of assembly} is required to be installed on your service line (at a location downstream of the water meter). Please make arrangements for the assembly to be installed by {insert date} or when your plumbing system is modified, whichever comes sooner. We realize that this expense was not anticipated, so if you are unable to comply with this deadline, please contact us to discuss an alternative date. We’ve enclosed a copy of our standard installation drawings for this type of assembly. Your CCS should oversee the installation of the assembly to ensure compliance with these standards. We appreciate your cooperation in this matter. If you have any questions, please contact me at (360) 279-4753. Sincerely, Rich Tyhuis Operations Manager cc: {City/County Plumbing Inspector} Enclosures: Standard Installation Drawings

City of Oak Harbor – Cross Connection Control Program – Appendix B
Request To Submit Test of Backflow Prevention Assembly Date Customer Account Number (optional) Customer Name Customer Address Line 1 Customer Address Line 2 Dear ________ Water System Customer: Washington State drinking water regulations, WAC 246-290-490, require public water systems to develop and implement cross-connection control programs to protect the drinking water supply from contamination. As part of this program, backflow prevention assemblies have been installed on your water service(s) and/or within your plumbing system to protect our water distribution system. Annual testing is required to ensure that the backflow prevention assemblies properly function. The purpose of this letter is to request that you now arrange for the annual testing of the reduced pressure principle (RPBA), double check valve (DCVA), and/or pressure vacuum breaker (PVBA or SVBA) assembly/assemblies described on the attached list. A Washington State Department of Health certified backflow assembly tester (BAT) must conduct the testing. Testing results should be sent to the address above and submitted by {insert date}. For your convenience, we are enclosing a list of backflow assembly testers pre-approved to test assemblies that protect the water system. Test report forms are also enclosed. The test report forms need to be properly completed by the BAT, signed by the customer/assembly owner, and returned to the City of Oak Harbor. Note: the Uniform Plumbing Code in effect in Washington also requires annual assembly testing. In addition to the testing required for the assemblies that protect the public water system (i.e., identified on the attached list), you may wish to have all of the remaining assemblies within your premises tested at this time. If you have any questions, please feel free to contact me at (360) 279-4753. Sincerely, Rich Tyhuis Operations Manager Enclosures: Assembly List Pre-Approved BAT List Assembly Test Report Forms

City of Oak Harbor – Cross Connection Control Program – Appendix B
Second Notice to Test Backflow Prevention Assembly Date Customer Account Number (optional) Customer Name Customer Address Line 1 Customer Address Line 2 Subject: Testing of Backflow Prevention Assembly - Second Notice First Notice Date: ________________ Second Notice Date: _______________ Dear ________ Water System Customer: Washington State drinking water regulations, WAC 246-290-490, require public water systems to implement cross-connection control programs to protect the drinking water supply from contamination. As part of this program, backflow prevention assemblies were installed on your service or within your premises to protect our water distribution system from contamination. The WAC requires these assemblies to be tested annually to verify that they are in good working condition. The assembly/assemblies identified in our letter of {insert date} (copy attached) must be tested by a Department of Health certified Backflow Assembly Tester (BAT) upon installation and annually thereafter. This requirement is a condition of our system continuing to supply potable water to your premises. According to our records, as of today’s date, you have not submitted the requested Assembly Test Report(s). If you believe this is in error, please contact me as soon as possible at the number below. If you have not submitted the Assembly Test Reports as requested, please:
• Immediately employ a DOH-certified BAT to test the listed assembly/assemblies; and • Submit a signed copy of the completed Assembly Test Report(s) to me at the address above within 15 days of the
date of this letter. Your cooperation in this matter is essential for protecting your drinking water supply and the public water supply from contamination. Failure to comply with the annual assembly testing requirement will trigger an enforcement action by our system. Enforcement could include a shut-off of your water service. If you have any questions, please contact me at (360) 279-4753. Sincerely, Rich Tyhuis Operations Manager Enclosure: First Test Notice Letter

APPENDIX C
BACKFLOW ASSEMBLY TESTERS

APPROVED BACKFLOW TESTER LIST COMPANY ADDRESS CITY ZIP CODE PHONE #1 PHONE #2
FIRE ES P.O. BOX 283 MOUNT VERNON 98273 360-424-3473 360-770-2284
COMMERCIAL PLUMBING, INC.
MOUNT VERNON 98273 360-428-5636 360-293-3774
COMMERCIAL FIRE PROTECTION, INC.
MOUNT VERNON 98273 360-848-9093 800-460-5990
BLYTHE PLUMBING & HEATING, INC.
2201 HUMBOLDT
STREET
BELLINGHAM 98225 360-733-7810
AMERICAN SPRINKLER
CORPORATION
2311 153RD AVE SE
SNOHOMISH 98290 425-335-4645
KING WATER COMPANY
P.O. BOX 2243 OAK HARBOR 98277 360-678-5336 1-888-241-2503
AACRA BACKFLOW ASSEMBLY
TESTING AND SERVICE
PNB A-11 621 SR 9 NE
LAKE STEVENS 98258 425-334-4507 425-438-5316
SINPLEX GRINNELL 9520 10TH AVE S, #100
SEATTLE 98108 206-291-1400
ROTO ROOTER SERVICES CO.
20508 56 AVE W, SUITE C
LYNNWOOD 98036 425-670-8442
AFFORDABLE BACKFLOW
TESTING
14441 158TH PL SE
RENTON 98059 206-369-6178
R & H MECHANICAL, INC.
1711 PORT DRIVE
BURLINGTON 98233 360-757-6909 360-757-6919 FAX
EASTSIDE BACKFLOW
14137 105TH
AVE NE
KIRKLAND 98034 425-445-4020
BELLINGHAM LOCK & SAFE
1619 N STATE ST
BELLINGHAM 98225 360-734-4940

APPENDIX D
BACKFLOW INCIDENT RESPONSE PLAN

City of Oak Harbor – Cross Connection Control Program – Appendix D
Appendix D Backflow Incident Response Plan
for the City of Oak Harbor A. General This Backflow Incident Response Plan should be considered a supplement to the Purveyor’s Emergency Plan. Purveyors should immediately begin a backflow incident investigation whenever the initial evaluation of a water quality complaint indicates that:
1. A backflow incident has occurred (i.e., drinking water supply has been contaminated) or may have occurred; or
2. The complaint can’t be explained as a "normal" aesthetic problem.
Also, whenever a water main break (or power outage for pumped systems) causes a widespread loss of water pressure in the system (creating backsiphonage conditions), purveyors should initiate a check of distribution system water quality as a precursor to the need for a backflow incident investigation. WAC 246-290-490 requires purveyors to notify DOH, the Local Administrative Authority and local health jurisdiction as soon as possible, but no later than the end of the next business day when a backflow incident contaminates the potable water supply (in the distribution system and/or in the customer's plumbing system). Purveyors should include a list of emergency contact telephone numbers at the beginning of the water system’s O & M Manual, so that the information is readily available when an incident occurs. A backflow incident investigation is often a team effort. The investigation should be made by or initially led by the DOH-certified Cross-Connection Control Specialist employed by the Purveyor. The investigation team may include state health (regional) staff, local health personnel and/or local plumbing inspectors. Purveyors can get more detailed guidance on how to respond to a backflow incident from the manual, Backflow Incident Investigation Procedures, published by the Pacific Northwest Section, American Water Works Association (PNWS-AWWA). Contact information for the PNWS-AWWA is provided in Appendix F. B. Short List of Tasks Purveyors should consult the most recently published edition of the PNWS-AWWA Backflow Incident Investigation Procedures Manual referenced above for greater detail as soon as possible after learning of a possible or confirmed backflow incident. Note: the water system is referred to as the Purveyor in the short task list.

City of Oak Harbor – Cross Connection Control Program – Appendix D
1. Customer Notification
a. As soon as possible, the Purveyor will notify customers not to consume or use water. b. The Purveyor will start the notification with the customers nearest in location to the
assumed source of contamination (usually the customer(s) making the water quality complaint).
c. The Purveyor will inform the customer about the reason for the backflow incident
investigation and the Purveyor's efforts to restore water quality as soon as possible. The Purveyor will let the customer know that customers will be informed when they may use water, the need to boil water used for consumption until a satisfactory bacteriological test result is obtained from the lab, etc.
d. Where a customer cannot be contacted immediately, the Purveyor will place a written
notice on the front door handle, and a follow-up visit will be made to confirm that the customer received notice about the possible contamination of the water supply.
e. When dealing with a backflow incident, the Purveyor will let customers know that it
could take several days to identify the source and type of contaminant(s) and to clean and disinfect the distribution system.
2. Identification of Source of Contamination
a. The Purveyor will give consideration to the distribution system as a potential source of
the contaminant (e.g., air valve inlet below ground). b. The Purveyor will not start flushing the distribution system until the source of
contamination is identified (flushing may aggravate the backflow situation, and will likely remove the contaminant before a water sample can be collected to fully identify the contaminant).
c. The Purveyor will conduct a house-to-house survey to search for the source of
contamination and the extent that the contaminant has spread through the distribution system. Note: a check of water meters may show a return of water (meter running backward) to the distribution system.
d. When the cross connection responsible for the system contamination is located, the
Purveyor should discontinue water service to that customer, until the customer completes the corrective action ordered by the Purveyor.
3. Isolation of Contaminated Portion of System
a. The Purveyor will isolate the portions of the system that are suspected of being
contaminated by closing isolating valves; leave one valve open to ensure that positive water pressure is maintained throughout the isolated system.
b. The Purveyor will be sure to notify all affected customers in the isolated area first and
then notify other customers served by the system.

City of Oak Harbor – Cross Connection Control Program – Appendix D
4. Public Health Impacts
a. The Purveyor will seek immediate input from and work with state and local health
agencies to accurately communicate and properly mitigate potential health effects resulting from the backflow incident.
b. If appropriate, the Purveyor will refer customers that may have consumed the
contaminant or had their household (or commercial) plumbing systems contaminated to public health personnel and Local Administrative Authorities (plumbing inspectors).
5. Cleaning/Disinfecting the Distribution System
a. The Purveyor will develop and implement a program for cleaning the contaminated
distribution system consistent with the contaminant(s) identified. b. Where both chemical and bacteriological contamination has occurred, the Purveyor will
disinfect the system after the removal of the chemical contaminant. c. Where any bacteriological contamination is suspected, the Purveyor will provide field
disinfection. C. Additional Information on Cleaning/Disinfecting the Distribution System Most chemical or physical contaminants can be flushed from the water distribution system or customer's plumbing system with adequate flushing velocity. However, this may not be the case in systems where scale and corrosion deposits (e.g., tuberculation on old cast iron mains) provide a restriction to obtaining adequate flushing velocity, or where chemical deposits or bacteriological slimes (biofilm) are present (on which the chemical contaminant may adhere). To remove a chemical or physical contaminant from the distribution system, purveyors may need to:
1. Physically clean the affected area using foam swabs (pigs); and/or
2. Alter the form of the chemical contaminant (e.g., through oxidation using chlorination or addition of detergents).
When adding any chemical (including chlorine) to remove a contaminant from the distribution system, it is essential that the Purveyor fully understand the chemistry of the contaminant. Adding the wrong chemical could make the contaminant more toxic to customers and/or more difficult to remove from the distribution system. To disinfect water mains using the "slug" or "continuous flow" method, a field unit should be used for chlorine injection, such as a chemical feed - metering or proportioning pump for sodium hypochlorite. Purveyors should contact the appropriate DOH regional office to discuss proposed approaches to contaminant removal and disinfection prior to taking corrective action.

APPENDIX E
BROCHURES

Double check detectorassembly:
1) Assembly shall be installed as a complete unitas it is approved by DOH and USC.
2) All assemblies must maintain a sufficient clear-ance from anything to ensure accessibility formaintenance and testing.
3) When testing a Double Check Detector As-sembly, both the main unit and the assemblyon the Bypass must be tested and two test re-ports submitted to the Water Purveyor.
4) All other requirements are the same as theDouble Check Valve Assembly.
5) Check with the local water purveyor for spe-cial requirements.
Double check valve assemblyand double check detectorassembly procedure require-ments:
1) All assemblies must be on the WashingtonState Approved Backflow Assembly List. Thislist is available through the Department ofHeath, (360) 236-3140.
2) ALL ASSEMBLIES ARE REQUIRED TO BETESTED BY A WASHINGTON STATE CERTI-FIED TESTER UPON INSTALLATION ANDANNUALLY THEREAFTER. ASSEMBLIESMUST BE TESTED AFTER REPAIRS, RELOCA-TION OR REINSTALLATION.
3) Contact Local Water Purveyor for inspectionof all newly installed assemblies.
4) When choosing the backflow assembly, con-sult with the local purveyor to ensure it is theright assembly for the application, that is ap-propriate for the water temperature and is sizedhydraulically to avoid excessive pressure loss.
Assembly installation requirements for double check valve assem-bly and double check detector assembly:
1) CONTACT LOCAL WATER PURVEYOR TO EN-SURE YOU ARE INSTALLING THE CORRECTASSEMBLY FOR THE DEGREE OF HAZARD.
2) Assembly must be installed as a complete unit,including two shut off valves, two check valvesand four test cocks for each DCVA. All assem-blies are required to be installed as a unit inthe configuration they were approved by USC.
3) THOROUGHLY FLUSH the waterline prior toinstalling assemblies.
4) Assemblies must be installed a minumum of12 inches from bottom of assembly, and nohigher than 5 feet from floor* to the centerlineof assembly. All assemblies must be installedhorizontally, unless they have Washington Stateand use approval to be installed vertically. Ifinstalled in a vertical configuration, it must be a minimum of 6 inches from floor, and no higher than 5feet to the centerline of the #2 shut-off valve. All assemblies must maintain a sufficient clearance fromany wall, and 24 inches in front of assembly to ensure accessibility for maintenance and testing. Clear-ances may vary on small units -contact the local water purveyor for special installation requirements.
*An Assembly installed more than 5 feet above floor or ground level must have a permanent platform underit for the plumber, tester or maintenance person to stand on. The platform must comply with all applicablesafety standards and codes in effect.
5) Assemblies 2-1/2 inches and larger (in diameter) shall have support blocks to prevent flange damage.
ASSEMBLIES MUST MEET ABOVE REQUIREMENTS TO ENSURE ACCESSIBILITY FOR TESTING, MAINTE-NANCE AND APPROVAL OF THE WATER PURVEYOR. VARIANCE OF ANY INSTALLATION MUST HAVEPRIOR WRITTEN APPROVAL OF THE LOCAL WATER PURVEYOR AND THE LOCAL OFFICIAL OF THEPLUMBING CODE AND IT'S INSPECTOR.
6) Plugs must be installed in all test cocks on DCVA and DCDA'S.
7) Follow all safety procedures referencing confined space entry.
8) Protect assembly from freezing, flooding and mechanical damage due to water hammer and excessivepressure.
9) Assemblies in vaults require proper drainage.
Ensure clearance for testingand maintenance,
contact your Water Purveyor
Indoor Installation Top View
AboveGround
Installation
6" Minimum from wall to valveNo higher than 5' to centerline of assembly
12" Minimum
Side View or Vault
12" Minimum – No higher than5' to Centerline of Assembly
Clearances from walls will varydue to size of assembly

Proper Installation Procedures for
The Double CheckValve Assembly
&The Double CheckDetector Assembly
1) Thoroughly flush service line prior to installation of as-sembly.
2) The backflow assembly shall be a Washington State Ap-proved Backflow Assembly and must be:• Installed as a unit,• Accessible for testing and maintenance,• Protected from freezing and vandalism,• Installed no higher than 5 feet from floor to
centerline of assembly and a minimum of 12 inchesfrom floor to bottom of assembly, and
• If installed* in a vertical configuration, assemblymust be a minimum of 23 inches from floor, and nohigher than 5 feet from floor to center of #2 shut offvalve.*Only assemblies with approval from USC & DOH
3) Do not install in an area subject to flooding. If installedin a vault, a small assembly requires a 12 inch clear-ance below the assembly with pea gravel for drainage.
4) Assembly must be tested after initial installation, annu-ally, after repairs or after relocation or reinstallation.Contact the Water Purveyor for inspection of all newlyinstalled assemblies.
5) Test reports must be signed by a certified Backflow As-sembly Tester and immediately sent to Local Water Pur-veyor.
For more information, special installation re-quirements or to schedule an initial inspection,please contact the local Water Purveyor.
This brochure is published by the WesternWashington Cross Connection Prevention
Professional Group (WWCCPP)PO Box 94551
Seattle WA 98124
Provided By
The Local Water Purveyor
Help Us ProtectYour Drinking
Water
THE GROUP
Western Washington Cross Connection Prevention Professionals
3/00
Double Check Valve Assembly & Double Check Detector Assembly
VerticalInstallationTop View
No HigherThan 5'to Center of#2 Shut Off Valve
DCVA Installation Side View2" or Smaller
6" Minimumfrom Floor
Test Cocks, with plugs(4 required)
Shutoff Valves(2 required)
Unions (2 required)
12" MinimumGravel(12" Minimum)
6" Minimum
3" M
in.
GroundLevel
GroundLevel

Drinking water systemsmay become
Pollutedor
Contaminatedthrough uncontrolled
cross connections
What is a Cross Connection?A cross connection is a point in a plumbingsystem where the potable water supply is con-nected to a non-potable source. Briefly, a crossconnection exists whenever the drinking watersystem is or could be connected to any non-potable source (plumbing fixture, equipment usedin any plumbing system). Pollutants or contami-nants can enter the safe drinking water systemthrough uncontrolled cross connections whenbackflow occurs.
Backflow is the unwanted flow of non-potablesubstances back into the consumer’s plumbingsystem and/or public water system(i.e., drinking water).
There are two types of backflow: backsiphonageand backpressure. Backsiphonage is caused bya negative pressure in the supply line to a facilityor plumbing fixture. Backsiphonage may occurduring waterline breaks, when repairs are madeto the waterlines, when shutting off the watersupply, etc.
Backpressure can occur when the potable watersupply is connected to another system operatedat a higher pressure or has the ability to createpressure, etc. Principal causes are booster pumps,pressure vessels, elevated plumbing, etc.
Backflow preventers are mechanical devicesdesigned to prevent backflow through crossconnections. However, for backflow preventers toprotect as designed, they must meet stringentinstallation requirements.
Cross Connectionscan create
HealthHazards
© 2001 R 9/02/02 [Brochure #2]
American Water Works AssociationPacific Northwest Section
For further
information
contact your
local water
purveyor or the
PNWS/AWWA
Cross-Connection
Control Committee
through the
PNWS office at
(877) 767-2992

BOILER
POTABLEWATER
NON-POTABLEWATER
BOILER
POTABLEWATER
NON-POTABLEWATER
�
�
BACKFLOW PREVENTER
Why Be Concerned?Most water systems in the United States and Canadahave good sources of water and/or sophisticatedtreatment plants to convert impure water to meetdrinking water standards. Millions of dollars arespent to make the water potable before it enters thedistribution system so most water purveyors thinkthat their supplies are not in jeopardy from this pointon. Studies have proven this to be wrong. Drinkingwater systems may become polluted or contami-nated in the distribution system through uncon-trolled cross connections.
Cross connections are installed each day in theUnited States because people are unaware of theproblems they can create. Death, illness, contami-nated food products, industrial and chemicalproducts rendered useless are some of the conse-quences of such connections. As a result, manyhours and dollars are lost due to cross connections.
Where are Cross Connections Found?Cross connections are found in all plumbing systems. It is important that each cross connection be identified andevaluated as to the type of backflow protection required to protect the drinking water supply. Some plumbing fixtureshave built-in backflow protection in the form of a physical air gap. However, most cross connections will need to becontrolled through the installation of an approved mechanical backflow prevention device or assembly. Some commoncross connections found in plumbing and water systems include:
1. Wash basins and service sinks.2. Hose bibs.3. Irrigation sprinkler systems.4. Auxiliary water supplies.5. Laboratory and aspirator equipment.6. Photo developing equipment.7. Processing tanks.8. Boilers.9. Water recirculating systems.10. Swimming pools.11. Solar heat systems.12. Fire sprinkler systems.
Every water system has cross connections. Plumbing codesand State drinking water regulations require cross connec-tions to be controlled by approved methods (physical airgap) or approved mechanical backflow prevention devicesor assemblies. The various types of mechanical backflowpreventers include: reduced pressure backflow assembly(RPBA), reduced pressure detector assembly (RPDA), doublecheck valve assembly (DCDA), double check detectorassembly (DCDA), pressure vacuum breaker assembly(PVBA), spill resistant vacuum breaker assembly (SVBA) andatmospheric vacuum breaker (AVB).
For a backflow preventer to provide proper protection, itmust be approved for backflow protection, designed for thedegree of hazard and backflow it is controlling, installedcorrectly, tested annually by a State certified tester, andrepaired as necessary. Some States require mandatorybackflow protection on certain facilities where high health-hazard-type cross connections are normally found. Thefollowing is a partial list of those facilities:
1. Hospitals, mortuaries, clinics.2. Laboratories.3. Food and beverage processing.4. Metal plating and chemical plants.5. Car washes.6. Petroleum processing and storage plants.7. Radioactive processing plants and nuclear reactors.8. Piers and docks.9. Sewage treatment plants.
Wrong:Uncontrolled Cross Connection
Right:Controlled Cross Connection
What to Do?It is impossible to cover all of the informationpertaining to cross connections in a pamphlet.We hope the preceding information will inspireyou to further educate yourself on the hazardsof unprotected cross connections. Crossconnection control manuals and trainingschools are offered throughout the Northwest.Information on manuals, schools and crossconnection control can be obtained from:
WashingtonDepartment of HealthAirdustrial Way, Bldg. 3P.O. Box 47822Olympia WA 98504-7822(360) 236-3133
OregonOregon Health Division3420 Cherry Av NE, #110Keizer OR 97303(503) 373-7201
British Columbia, CanadaBC Water & Waste AssociationSte. 342 – 17 Fawcett RoadCoquitlam B.C. V3K 6V2(604) 540-0111
IdahoIdaho Division of Environment1410 N HiltonBoise ID 83706(208) 373-0275
Additional sources of information may befound on the PNWS-AWWA web site:www.pnws-awwa.org

HouseholdHazards
Common Household Hazards
Chemical Spray ApplicatorsThe chemicals used on your lawn and garden canbe toxic or fatal if ingested. These chemicalsinclude pesticides, herbicides, and fertilizers. Evenstrong cleaning chemicals sprayed on cars, housesiding, etc., may cause health problems if ingested.
Submerged HosesWater held in pools, ponds or other vats open to theair and exposed to humans or animals may containmicrobiological contaminants. Hoses submerged inbuckets or containers can act as a conduit forcontaminants under backflow conditions.
Underground LawnIrrigation SystemsUnderground irrigation systems often havepuddles of standing water around the ground-level sprinkler heads. The sprinkler headsare not designed to be drip-tight under backflowconditions. The puddles of water may containmicrobiological contaminants, such as excrementfrom animals or chemical residue from fertilizerand herbicides sprayed on the lawn.
Help protect your
Drinking Water
from
Contamination
© 2001 R 3/30/02 [Brochure #4]
American Water Works AssociationPacific Northwest Section
For further
information
contact your
local water
purveyor or the
PNWS/AWWA
Cross-Connection
Control Committee
through the
PNWS office at
(877) 767-2992

How Contamination OccursWater normally flows in one direction, from thepublic water system through the customer’s cold orhot water plumbing to a sink tap or other plumbingfixture. The plumbing fixture is the end of thepotable water system and the start of the wastedisposal system.
Under certain conditions water can flow in thereverse direction. This is known as backflow.Backflow occurs when a backsiphonage orbackpressure condition is created in a water line.
Backsiphonage may occur due to a loss of pressurein the water distribution system during a highwithdrawal of water for fire protection, a water mainor plumbing system break, or a shutdown of a watermain or plumbing system for repair. A reduction ofpressure below atmospheric pressure creates avacuum in the piping. If a hose bib was open and thehose was submerged in a wading pool during theseconditions, the non-potable water in the pool wouldbe siphoned into the house’s plumbing and back intothe public water system.
Backpressure may be created when a source ofpressure, such as a pump, creates a pressure greaterthan that supplied from the distribution system. If apump supplied from a non-potable source, such as alandscape pond, were accidentally connected to theplumbing system, the non-potable water could bepumped into the potable water supply.
How to Prevent Contamination of Your Drinking WaterProtect your drinking water by taking the following precautions:
Don’t:� Submerge hoses in buckets, pools, tubs, sinks, ponds, etc.� Use spray attachments without a backflow prevention device.� Connect waste pipes from water softeners or other treatment systems to the sewer, submerged drain pipe, etc.� Use a hose to unplug blocked toilets, sewers, etc.
Do:✔ Keep the ends of hoses clear of all possible contaminants.
✔ If not already equipped with an integral (built-in) vacuum breaker, buy and install hose bib typevacuum breakers (see reverse side of this pamphlet) on all threaded faucets around your home.These devices are inexpensive and are available at hardware stores and home improvement centers.
✔ Install an approved backflow prevention assembly on all underground lawn irrigation systems.Remember, a plumbing permit is required for the connection of an underground lawn irriga-tion system to your plumbing system.
Hose Connection Vacuum BreakerHose connection vacuum breakers are specifically made for portable hoses attachedto hose thread faucets. Their purpose is to prevent the flow of contaminatedwater back into the drinking water. These devices screw directly to thefaucet outlet. They can be used on a wide variety of installations, such asservice sinks, hose faucets near a wading pool, laundry tub faucets, etc.
Some units are designed for manual draining for freezing conditions.Some are furnished with breakaway set screws as a tamper proof feature.
These device are not intended for operation under continuous pressure.
Protection of the Water Purveyor’s Distribution SystemIn general, the installation of plumbing in compliance with the plumbing code will provide adequate protection foryour plumbing system from contamination.
However, the water purveyor may require (as a condition of service) the installation of a backflow prevention assemblyon the water service to provide additional protection for the public water system. A backflow prevention assembly willnormally be required where a single-family residence has special plumbing that increases the hazard above the normallevel found in residential homes, or where a hazard survey cannot be completed.
To help determine if a backflow prevention assembly is required, the water purveyor may send residential customers aCross Connection Control Survey Questionnaire. The water purveyor will evaluate the returned questionnaires toassess the risk of contamination to the public water system. Based on the results of the evaluation, the installation ofbackflow prevention assemblies may be required on services to some customers.
Hose ConnectionVacuum Breaker
�

LAWN (TURF) IRRIGATION SYSTEMS
For the protection of the water purveyor’s distribution system, all irrigation systems must have an approved backflow prevention assembly that is commensurate with the degree of hazard. Irrigation systems are categorized as high health hazard or moderate health hazard as defined below. Any irrigation system that contains pumps or injectors for the addition of chemicals and/or fertilizers is considered a high hazard. This risk assessment is also based on the additional hazard posed by bacterial contaminants found on lawns, and on the possibility of changes being made to the irrigation system by the customer. An approved reduced pressure backflow assembly (RPBA), or an approved air gap separation, should be required in all cases where chemicals or herbicides may be injected into the irrigation system, or where an auxiliary water supply is also provided for irrigation water. All irrigation systems that are not classified as high health hazard are considered to be moderate health hazards. This risk assessment is based on the hazard posed by bacterial and chemical contaminants found on lawns, and on the possibility of changes being made to the irrigation system by the customer. An approved double check valve assembly (DCVA), or pressure vacuum breaker assembly (PVBA), should be required.
However, an approved PVBA does not provide adequate protection if it is subjected to flooding, backpressure, elevated piping, or if compressed air is used to winterize the irrigation systems. In these situations, an approved DCVA should be required as a minimum level of protection. APPROVED BACKFLOW ASSEMBLIES The water purveyor relies on approved backflow prevention assemblies to protect the public water system. Approved assemblies are manufactured with isolation valves and test cocks to permit field-testing to demonstrate that the assemblies are properly functioning to prevent backflow. In addition to the above assemblies, plumbing codes also allow the use of atmospheric vacuum breakers (AVB) on lawn irrigation systems without chemical addition. Because an atmospheric vacuum breaker is not designed to be tested, some water purveyors require the installation of approved, testable assemblies. Contact your water purveyor regarding the requirements for isolation of your lawn irrigation system. NOTE: All irrigation piping should be considered as a non-potable water system due to an actual or potential health hazard.
LAWN IRRIGATION
SYSTEMS AND
BACKFLOW PREVENTION
© 2 0 0 1
R 9 / 3 0 /0 2 [ B roc h u re # 3 ]
Th i s b r och u r e ma y b e c op i ed u n a l t e r ed f or d i s t r i b u t i on t o t h e pu bl i c f r e e o f c h a rg e . In fo rma t i on p ro vi d ed sh ou ld b e c on s i d er ed g en e ra l gu i d a n c e on l y . C on su l t yo u r wa t e r p u rv e yo r f or sp ec i f i c req u i r em en t s .
A mer ican Wa ter Wo r ks Ass o c ia t ion PACIF IC NORTH WE ST S ECTION Or e g o n – Wa shi ng to n - Ida ho

REDUCED PRESSURE BACKFLOW ASSEMBLY FOR ISOLATION OF
LAWN IRRIGATION SYSTEM
The reduced pressure backflow assembly (RPBA) shall be installed to isolate irrigation systems using injectors or pumps to apply fer ti l izer and other agricultural chemicals . The RPBA must be installed above ground to prevent the relief valve opening from becoming submerged. The RPBA should be installed in an insulated enclosure to provide freeze protection. The RPBA shall be tested by a certif ied backflow assembly tester upon installation, after repair of relocation, and at least annually.
Reduced Pressure backflow Assembly in Above-Ground Enclosure
DOUBLE CHECK VALVE ASSEMBLY FOR ISOLATION OF
LAWN IRRIGATION SYSTEM
The double check valve assembly (DCVA) may be installed to isolate all irrigation systems that do not use injectors or pumps to apply ferti l izer and other agricultural chemicals. The DCVA may be installed in a below ground enclosure provided the assembly test cocks are plugged; the test cocks are pointed up; adequate space is provided for maintenance and testing, and any compressed air connections are installed only downstream of the DCVA. The DCVA shall be tested by a certif ied backflow assembly tester upon installation, after repair of relocation, and at least annually.
Double Check Valve Assembly in Below-Ground Box
For further infor mation contact your local w ater purvey or or the PNWS/AWWA Cross-Connect ion Control Committee throug h the PNWS of f ice at (877) 767-2992 .
PRESSURE VACUUM BREAKER ASSEMBLY FOR ISOLATION OF
LAWN IRRIGATION SYSTEMS
The pressure vacuum breaker assembly (PVBA) may be installed to isolate all irrigation systems that do not use injectors or pumps to apply ferti l izer and other agricultural chemicals. The PVBA shall be installed at least 12 inches above the highest point in the irrigation piping. The PVBA shall be tested by a certif ied backflow assembly tester upon installation, after repair of relocation, and at least annually.
Pressure Vacuum Breaker Assembly

Proper Installation Procedures for
The Reduced PressureBackflow Assembly
&The Reduced Pressure
Detector AssemblyReduced Pressure Backflow Assembly/Reduced Pressure Detector Assembly
Top View
1) Thoroughly flush service line prior to installa-tion of assembly.
2) The backflow assembly shall be a WashingtonState Approved Backflow Assembly and mustbe:• Installed as a unit,• Accessible for testing and maintenance,• Protected from freezing and vandalism,
Installed no higher than 5 feet from floor tocenterline of assembly and a minimum of12 inches from floor to bottom of assem-bly, and
• If installed* in a vertical configuration, as-sembly must be a minimum of 23 inchesfrom floor, and no higher than 5 feet fromfloor to center of #2 shut off valve.*Only assemblies with approval from USC & DOH
3) Do not install in an area subject to flooding.Assemblies must be installed above ground.
4) Assembly must be tested after initial installa-tion, annually, after repairs or after relocationor reinstallation. Contact the Water Purveyorfor inspection of all newly installed assemblies.
5) Test reports must be signed by a certifiedBackflow Assembly Tester and immediately sentto Local Water Purveyor.
Side ViewTest Cocks (4 required)
Resilient Seated Shutoff Valves (2 required)
Clearances from walls will varydue to size of assembly
Adequate gravity drainage systemrequired with approved air gap
12” min. from floor to bottom of assembly – 5’ max. to centerline of assembly
For more information, special installationrequirements or to schedule an initial inspec-tion, please contact the local Water Purveyor.
This brochure is published by the WesternWashington Cross Connection Prevention
Professional Group (WWCCPP)PO Box 94551
Seattle WA 98124
Provided By
The Local Water Purveyor
Help Us ProtectYour Drinking
Water
THE GROUP
Western Washington Cross Connection Prevention Professionals

Requirements for air gaps:
1) Air gap must be twice the diameter of the inletpipe, minimum of 1 inch.
2) The air gap must provide a physical separa-tion from the bottom of the inlet piping to thetop of the overflow rim of the receiving vessel.
3) If inlet piping is cut diagonally to decreasesplashing, the air gap separation is measuredfrom the bottom of the cut to the receivingvessel.
4) If air gap is located near sidewalks, the sepa-ration increases to three times the diameter ofthe inlet piping, minimum of 1 1/2 inches.
Reduced pressure detectorassembly:
1) Assembly shall be installed as a unit as it isapproved by DOH and USC.
2) All assemblies must maintain a sufficient clear-ance from any wall to ensure accessibility formaintenance and testing.
3) When testing a Reduced Pressure DetectorAssembly, both assemblies must be tested andtwo test reports submitted to the Local WaterPurveyor.
4) All other requirements are the same as theReduced Pressure Backflow Assembly.
Reduced pressure backflowassembly/reduced pressuredetector assemblyprocedure requirements:
1) All assemblies must be on the WashingtonState Approved Backflow Assembly List. Thislist is available through the Department ofHeath, (360) 236-3140/1800-521-0323.
2) ALL ASSEMBLIES ARE REQUIRED TO BETESTED BY A WASHINGTON STATE CERTI-FIED TESTER UPON INSTALLATION ANDANNUALLY. IN ADDITION, ASSEMBLIESMUST BE TESTED AFTER REPAIRS, RELOCA-TION OR REINSTALLATION.
Please note: Air gaps installed in lieu of a re-duced pressure backflow assembly also requireannual inspection. Test reports must be sub-mitted immediately to Local Water Purveyor.
3) Contact Local Water Purveyor for inspectionof all newly installed assemblies.
4) When choosing the backflow assembly, con-sult Local Water Purveyor to ensure it is theright assembly for the application, is appro-priate for the water temperature and is sizedhydraulically to avoid excessive pressure loss.
5) When installing an assembly inside a build-ing, ensure assembly is located where occa-sional spitting from the relief valve port, afouled check, or water flushed out during theannual test will not be objectionable. Properdrainage must be provided.
6) Protect assembly from freezing, flooding andmechanical damage due to water hammer andexcessive pressure build up.
Assembly installation requirements for reduced pressurebackflow assembly/reduced pressure detector assembly:
1) CONTACT LOCAL WATER PURVEYOR TO ENSURE YOU ARE INSTALLING THE CORRECT ASSEMBLYFOR THE DEGREE OF HAZARD.
2) Assembly must be installed as a unit, including two shut off valves, relief port, two check valves and fourtest cocks. All assemblies are required to be installed as a unit in the configuration they were approvedby USC.
3) THOROUGHLY FLUSH the waterline prior to installing assemblies.
4) Assemblies must be installed a minimum of 12 inches from the bottom of the relief port, and no higherthan 5 feet from floor* to centerline of assembly. All assemblies must be installed horizontally, unlessthey have Washington State approval to be installed vertically. If installed in a vertical configuration, itmust be a minimum of 12 inches from floor, and no higher than 5 feet from floor* to center of the #2 shutoff valve. All assemblies must maintain a sufficient clearance from any wall to ensure accessibility ofmaintenance and testing. Clearances may vary on small units - contact the Local Water Purveyor. Sizes2 1/2 inches and larger in diameter may require additional space on one side of the assembly. Assem-blies 2 1/2 inches and larger in diameter shall have support blocks to prevent flange damage.
* An assembly installed more than 5 feet above floor or ground level must have a permanent platform underit for the tester or maintenance person to stand on. The platform must comply with all applicable safetystandards and codes in effect.
REDUCED PRESSURE BACKFLOW ASSEMBLIES CANNOT BE INSTALLED BELOW GROUND AT ANY TIME.
ASSEMBLIES MUST MEET ABOVE REQUIREMENTS TO ENSURE ACCESSIBILITY FOR TESTING, MAINTE-NANCE AND APPROVAL OF THE WATER PURVEYOR. VARIANCE OF ANY INSTALLATION MUST HAVEPRIOR WRITTEN APPROVAL OF LOCAL WATER PURVEYOR.
Clearances from walls will varydue to size of assembly
Ensure clearance for testingand maintenance,
contact Local Water Purveyor
Top View
Side View
6" Minimum from wall to valve
No higher than 5' to centerline of assembly
12" Minimum

Flow-through protection systems are thosesystems that do not have fire department pumperconnections. They are constructed of approvedpotable water piping and materials to whichsprinkler heads are attached. The system termi-nates at a connection to a toilet or other plumb-ing fixture to prevent the water from becomingstagnant.
Combination protection systems also do nothave fire department pumper connections and areconstructed of approved potable water pipingand materials that serve both the fire sprinklersystem and the consumer’s potable water system.
Both of the above two systems do not requirebackflow preventers because they are connecteddirectly to the potable water and the inherentlydesigned to potable water standards.
Closed fire protection systems are separatedfrom the potable water system by the minimumuse of a Double Check Valve Assembly (DCVA) aslong as no chemicals are used and a ReducedPressure Backflow Assembly (RPBA) if chemicalsare used. Closed system may have a fire depart-ment pumper connection.
Note:1. The water purveyor must be consulted for
proper backflow prevention requirements.
2. It is important to have the system engineeredhydraulically. The NFPA standards 13 and/or13D must be considered when designing thefire system.
3. Flow and pressure may not be adequate forfire protection.
4. A plumbing and/or fire permit may be requiredprior to starting the project.
5. A system is less expensive to install at initialhouse construction.
6. Some water purveyor’s requirements may bemore stringent than others – consult you localpurveyor for requirements.
Residential
Fire SprinklerSystems and
BackflowPrevention
© 2001 R 3/30/02 [Brochure #1]
For further
information
contact your
local water
purveyor or the
PNWS/AWWA
Cross-Connection
Control Committee
through the
PNWS office at
(877) 767-2992
American Water Works AssociationPacific Northwest Section

Residential FireSprinkler Systems
Residential fire sprinklers are in greater demandtoday than ever before. Personal fire safety is such atrend that in many areas ordinances or resolutionsrequire fire sprinklers on all new residentialconstruction.
Residential fire sprinkler systems help save lives andreduce property damage. However, from the waterpurveyor’s point of view, the residential fire sprinklersystem presents a potential pollutant and/or con-taminant source to the potable water system fromcross-connections. Both homeowners and the publicmay be exposed to health hazards from residentialfire sprinkler systems. Such hazards include stagnantwater, non-potable piping, heterotrophic bacteria,and chemicals. Therefore these systems must beevaluated for health and system hazards.
The following minimal information should beconsidered in the selection of backflow protection onresidential fire sprinkler systems.
Residential fire sprinkler systems are categorized asflow-through, combination, and closed fireprotection systems. Each of these systems has theiradvantages and disadvantages. It should also benoted that what the local fire departments, localadministrative authorities and water purveyors allowwill determine which of these systems can be foundin any particular jurisdiction. It is imperative that thewater purveyor, local administrative authority, firedepartment, and other agencies coordinate theirefforts in the design and operation of these systems.
Flow-Through Fire Protection SystemsAdvantages1. Contains no standing or stagnant water.2. No backflow protection is required.3. Usually requires a single meter.
Disadvantages1. Service line, meter and plumbing system must be designed hydraulically to
supply both domestic and fire flow requirements.
Sprinkler system must have connection at the end to a clothes washer,dishwasher, toilet or other fixture to prevent water from becoming stagnant.
Combination Protection SystemsAdvantages1. Contains no standing or stagnant water.2. No backflow protection is required.3. Usually requires a single meter.4. Water use throughout the potable water system eliminates need for water
use at the end of the system.
DisadvantagesThe service line, meter and plumbing system must be designed hydraulicallyto supply both domestic and fire flow requirements.
Closed Fire Protection SystemsAdvantages1. Installing a separately metered service line may be cheaper than upgrading
an existing service.2. A fire service rate is usually cheaper than a residential service rate.
Disadvantages1. Approved backflow preventers must be installed, thereby increasing the
homeowner’s cost by its initial installation, and thereafter for annualtesting and maintenance.
2. When chemicals are added to the fire sprinkler system to prevent freezing,a high health hazard exists. This requires a higher, more expensive, level ofprotection, i.e., a Reduced Pressure Backflow Assembly (RPBA).
If the fire service and domestic service are combined, the fire service may notbe turned off because of safety reasons.

Without a functioning
Temperature &
Pressure Relief Valve
your water heater can
Explodewith the force of
Dynamite
Protection fromThermal Expansion
Protection from thermal expansion is provided in aplumbing system by the installation of a thermalexpansion tank in the hot water system pipingdownstream of the hot water tank and atemperature and pressure relief valve(T & P Valve) at the top of the tank.
The thermal expansion tank controls the increasedpressure generated within the normal operatingtemperature range of the water heater. The smalltank with a sealed compressible air cushionprovides a space to store and hold the additionalexpanded water volume.
The T & P Valve is the primary safety feature forthe water heater. The temperature portion ofthe T & P Valve is designed to open and ventwater to the atmosphere whenever the watertemperature within the tank reaches approxi-mately 210º F (99º C). Venting allows cold waterto enter the tank.
The pressure portion of a T & P Valve is designedto open and vent to the atmosphere wheneverwater pressure within the tank exceeds thepressure setting on the valve. The T & P Valve isnormally pre-set at 125 psi or 150 psi.
Water heaters installed in compliance with thecurrent plumbing code will have the requiredT & P Valve and thermal expansion tank. Forpublic health protection, the water purveyor mayrequire the installation of a check valve orbackflow preventer downstream of the watermeter. In these situations, it is essential that a T &P Valve and thermal expansion tank be properlyinstalled and maintained in the plumbing system.
Protect YourWater Heater from
ThermalExpansion
© 2001 R 3/30/02 [Brochure #5]
For further
information
contact your
local water
purveyor,
City or County
building
department,
licensed plumber
or the
PNWS/AWWA
Cross-Connection
Control Committee
through the
PNWS office at
(877) 767-2992
American Water Works AssociationPacific Northwest Section

Thermal Expansion DangerMost homes are supplied with hot water from anelectric or gas heated tank. Until the heating elementstops working, and one is faced with a cold shower,the water heater is usually taken for granted.However, if not properly maintained, a water heatermay become a safety hazard.
Water expands in volume as its temperature rises.The extra volume caused by thermal expansionmust go somewhere. If not, the heated watercreates an increase in pressure. This is the principleof a steam engine.
The temperature and pressure in the water heater isreduced when hot water is withdrawn from a faucetand cold water enters the tank. The increase inpressure from thermal expansion can also be reducedby water flowing back into the public water system.However, when a check valve, pressure-reducingvalve or backflow preventer is installed in the servicepipe a “closed system” is created. Provisions must bemade for thermal expansion in these cases.
The thermostat of the water heater normallymaintains the water tempera-ture at about 130º F (54º C).However, if the thermostatfails to shut off the heater, thetemperature of the water willcontinue to increase.
If the water temperatureincreases to more than 212º F(100º C), the water within thetank becomes “super heated”.When this super heated wateris suddenly exposed to theatmosphere when a faucet isopened, it instantly flas hesinto steam and a violentreaction may result. As thepressure within the tankcontinues to build up undersuper heated conditions, thetank may explode.
Why the Installation of a Backflow Preventeris Required on a Water Service
Water normally flows in one direction, from the public water system through thecustomer’s cold or hot water plumbing to a sink tap or other plumbing fixture. Theplumbing fixture is the end of the potable water system and the start of the wastedisposal system.
Under certain conditions water can flow in the reverse direction. This is known asbackflow. Backflow occurs when a backsiphonage or backpressure condition iscreated in a water line.
Backsiphonage may occur due to a loss of pressure in the water distribution systemduring a high withdrawal of water for fire protection, a water main or plumbing systembreak, or a shutdown of a main or plumbing system for repair. A reduction of pressurebelow atmospheric pressure creates a vacuum in the piping. If a hose bib was open andthe hose was submerged in a wading pool were flowing during these conditions, thenon-potable water in the pool would be siphoned into the house plumbing then back intothe public water system.
Backpressure may be created when a source of pressure, such as a pump, creates apressure greater than that supplied from the distribution system. If a pump supplied from anon-potable source, such as a landscape pond, were accidentally connected to the plumb-ing system, the non-potable water could be pumped into the potable water supply.
T&P Valve Location
COLD HOT
WATER HEATER
T&PRELIEFVALVE
DRAIN
Typical T&P Valve
What the Homeowner Should Do to EnsureProtection from Thermal Expansion
� The homeowner should check to see that an expansion tank and T & P Valve are in place.If there is any doubt, the homeowner should contact a licensed plumber.
� The T & P Valve should be periodically inspected to ensure that is properly operating. SomeT & P Valves are equipped with a test level. Manually lifting the lever unseats the valve,allowing water to discharge. If water continues to leak from the T & P Valve after closing,the valve may need to be replaced. A drain line must be installed to avoid water damageand scalding injury when the valve operates.
� The T & P Valve should be periodically removed and visually inspected for corrosiondeposits and to insure it has not been improperly altered or repaired.
� The above work can best be done by a licensed plumber.
TESTLEVER
DRAIN
PROBE

APPENDIX F
ANNUAL SUMMARY REPORT FORM
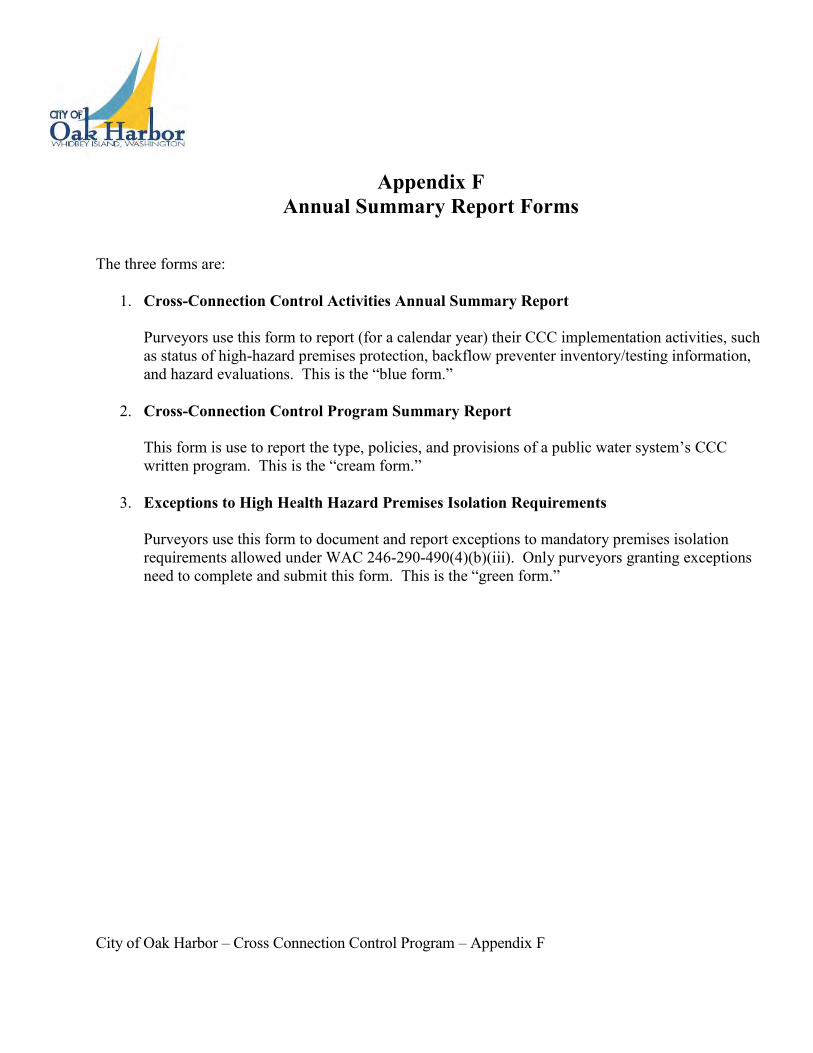
Appendix F Annual Summary Report Forms
The three forms are:
1. Cross-Connection Control Activities Annual Summary Report Purveyors use this form to report (for a calendar year) their CCC implementation activities, such as status of high-hazard premises protection, backflow preventer inventory/testing information, and hazard evaluations. This is the “blue form.”
2. Cross-Connection Control Program Summary Report This form is use to report the type, policies, and provisions of a public water system’s CCC written program. This is the “cream form.”
3. Exceptions to High Health Hazard Premises Isolation Requirements Purveyors use this form to document and report exceptions to mandatory premises isolation requirements allowed under WAC 246-290-490(4)(b)(iii). Only purveyors granting exceptions need to complete and submit this form. This is the “green form.”
City of Oak Harbor – Cross Connection Control Program – Appendix F

Office of Drinking Water Public Water System Cross-Connection Control Activities
Annual Summary Report for 2005
Part 1: Public Water System (PWS) and Cross-Connection Control Specialist (CCS) Information
Written program plan may be a separate document or part of water system plan or small water system management program. Provide information about PWS’s specific CCC Program Elements.
Check one box in each column for each row.

Part 3B: Cross-Connection Control for High-Hazard Premises or Systems Served by the PWS
Report data as accurately as possible. DOH currently bases CCC compliance actions on this information.
1) Count multiple connections or parallel installations to the same premises as separate connections. 2) Count only those connections with AG or RPBA installed for premises isolation. Don’t include connections with in-premises protection only or connections with DCVAs or DCDAs installed for premises isolation. 3) Count only those connections whose premises isolation preventers were inspected (AG) or tested (RPBA) during 2005. 4) For example, dedicated lines to irrigation systems in parks, playgrounds, golf courses, cemeteries, estates, etc. 5) Premises with hazardous materials or processes (requiring isolation by AG or RPBA) such as: aircraft and automotive manufacturers, pulp and paper mills, metal manufacturers, military bases, and wholesale customers that pose a high hazard to the PWS. May be grouped together in categories, e.g.: other manufacturing or other commercial. If needed, attach additional sheet giving same information as requested in table.

CCC Activities Report – Year 2005 3 PWS ID ____________
Part 4B: Other Implementation Activities in 2005 1) Include services where either premises isolation or in-premises preventers were required to protect the PWS. 2) Include existing services that need new, additional or higher level backflow prevention. 3) A DOH Exception to High Health Hazard Premises Isolation Requirements Form (green) must be
attached for each exception granted during the year. 4) “Enforcement actions” mean actions taken by the PWS (such as water shut-off, PWS installation of backflow preventer, etc.) when the customer fails to comply with PWS’s CCC requirements.

Part 5: Backflow Incidents, Risk Factors and Indicators during 2005 Complete only one column for each row. Check “Data Not Available” if PWS doesn’t track such data.
5) Complete and submit a DOH Backflow Incident Report form for each known backflow incident.
The form is available on the Office of Drinking Water (ODW) website or from the ODW upon request. 6) Such as stomachache, headache, vomiting, diarrhea, skin rashes, etc.
7) “BWA” means Boil Water Advisory and “PN” means Public Notification for water quality reasons.

Part 6: Comments and Clarifications
Part 7: Report Completion Information Enter dates in MM/DD/YYYY format.
1) CCC Program Manager is generally the CCS responsible for developing and implementing the PWS’s CCC Program.
2) The person that the CCC Program Manager reports to or other manager having direct responsibility and/or oversight of the CCC program. This person doesn’t need to be in charge of the entire water system.

Office of Drinking Water Cross-Connection Control Program Summary Report For 2005
Describe the characteristics of the PWS’s CCC Program at the end of 2005. Complete this form only if the PWS had written CCC program plan, policies or procedures at end of 2005.
Part 1: Public Water System (PWS) Identification
Part 2: Cross-Connection Control (CCC) Program Characteristics
A. Type of Program Currently Implemented Type of Program Check One Premises isolation only. Combination program: reliance on both premises isolation and in-premises protection. In transition from a combination program to a premises isolation only program. B. Coordination with Local Administrative Authority (LAA) on Cross-Connection Issues Indicate the status of coordination with LAAs in your service area. The LAA is the entity that enforces the Uniform Plumbing Code. Check one box in each of last 3 columns for each LAA in your service area. LAA No.
Name of LAA1 (e.g., the City or County Building Department)
PWS currently: If Not Coordinating, did LAA Decline to Coordinate?
Coordinates with LAA
Has Written Agreement with LAA
1 Y N Y N Y N
2 Y N Y N Y N 3 Y N Y N Y N
4 Y N Y N Y N
5 Y N Y N Y N If more than 5 LAAs, attach separate sheet giving the above information.
C. Corrective or Enforcement Actions Available to the Purveyor Type of Corrective Action Indicate Whether
Available Most Often Used (check one)
Denial or discontinuance of water service. Y N Purveyor installs backflow preventer and bills customer. Y N Assessment of fines (in addition to elimination or control of cross-connection).
Y N
Other corrective actions (describe): Y N Y N
CCC Program Summary – Year 2005 1 DOH Form #331-154 (Rev. 1/04/2006)

D. CCC Program Responsibilities Do not include enforcement action related procedures or circumstances.
CCC Program Activity Responsible Party (Check only one box per row)
Customer Purveyor Hazard Evaluation by DOH-certified CCS. Backflow preventer (BP) ownership. BP installation. BP initial inspection (for proper installation – all BPs). BP initial test (for testable assemblies). BP annual inspection (Air Gaps and AVBs). BP annual test (for testable assemblies). BP maintenance and repair. E. Backflow Protection for Fire Protection Systems Please remember to enter number of days allowed if you require retrofitting. PWS coordinates with LAA on CCC issues for fire protection systems (FPS). Y N N/A PWS coordinates with local Fire Marshal on CCC issues for FPS. Y N N/A PWS ensures backflow prevention is installed before serving new connections with FPS.
Y N
PWS requires retrofits to high-hazard FPS. Y (No. of days allowed: _____) N N/A
PWS requires retrofits to low-hazard FPS. Y (No. of days allowed: _____) N N/A F. Backflow Protection for Irrigation Systems Minimum level of backflow prevention required on irrigation systems without chemical addition.
Not AddresPV/SVBA
sed AVB DCVA RPBA
PWS currently inspects AVBs upon initial installation. Y N N/A PWS currently inspects AVBs upon repair, reinstallation or relo
cation. Y N N/A
G. Used Water PWS prohibits, by ordinance, rules, policy or agreement, the intentional return of used water (e.g. for heating or cooling) into the distribution system.
Y N
If not prohibited at present, date plan to prohibit. Date (mm/dd/yyyy): N/A Current number of service connections returning used water to distribution system. H. Backflow Protection for Unapproved Auxiliary Water Supplies
1
NOT Interconnected with PWS Indicate the minimum backflow preventer and type of protection required for service connections having unapproved auxiliary water supplies when they are NOT interconnected to the PWS. Check only one box per row. Existing service connections. None DCVA RPBA AG Type of protection required. None In-premises protection Premises isolation New service connections. None DCVA RPBA AG Type of protection required. None In-premises protection Premises isolation
An auxiliary water supply is any water supply on or available to the customer’s premises in addition to the purveyor’s potable water supply.
CCC Program Summary – Year 2005 2 PWS ID _______________

I. Backflow Protection for Tanker Trucks and Temporary Water Connections Minimum level of backflow protection (installed on or associated with the truck) required for tanker trucks taking water from PWS.
AG DCVA RPBA Not specified Tanker trucks not allowed
PWS requires tanker trucks to obtain water at designated filling sites each equipped with permanently installed backflow preventer(s).
Y (Min. site protection: DCVA RPBA ) N N/A No sites provided
PWS currently accepts tanker trucks approved by other PWSs without further inspection or testing. Y N N/A
Minimum level of backflow protection required for temporary water connections (e.g., for construction sites).
AG DCVA RPBA Not specified Temp. connections not allowed
PWS requires testing each time the temporary connection backflow preventer is relocated. Y N N/A (Temp. connections not allowed)
PWS provides approved backflow preventer for temporary connections. Y N N/A (Temp. connections not allowed)
J. Backflow Protection for Non-Residential Connections For each category shown, indicate whether PWS has non-residential connections of that type and the minimum level of premises isolation backflow protection required (whether or not PWS currently has that type of customer). Type of Connection PWS has Customers
of this Type Minimum Premises Isolation Backflow Protection Required
Commercial Y N Not required DCVA RPBA
Industrial Y N Not required DCVA RPBA
Institutional Y N Not required DCVA RPBA
Other (specify): __________ Y N Not required DCVA RPBA
Other (specify): __________ Y N Not required DCVA RPBA
K. Backflow Protection for Wholesale Customers Indicate whether the PWS requires backflow protection at interties with wholesale customers (other PWSs). Type of Intertie
PWS has (plans to have) Customers of this Type
Backflow Protection Required (If protection is required, indicate minimum level)
Existing Y N
Not specified/Not required Always required Required only if purchaser’s CCC program is inadequate Minimum required (if applicable): DCVA RPBA
New Y N
Not specified/Not required Always required Required only if purchaser’s CCC program is inadequate Minimum required (if applicable): DCVA RPBA
CCC Program Summary – Year 2005 3 PWS ID _______________

Part 3: CCC Program Record-Keeping and Inventory
Indicate the type or name of the computer software used by the PWS to track CCC records.
Cross-Track (BMI) BPMS XC2 (Engsoft) Tokay
Other commercial CCC software (specify): ____________ Custom developed for or by PWS1
Other non-CCC software (e.g. Excel) None Used 1
Do not include commercial CCC software customized for PWS. If PWS uses customized commercial software, check the box for the appropriate commercial software name.
Part 4: Comments and Clarifications
Enter comments or clarifications to any of the information included in this report.
Part No. Comment
Part 5: CCC Program Summary Completion Information
Enter dates in MM/DD/YYYY format. I certify that the information provided in this CCC Program Summary is complete and accurate to the best of my knowledge. CCC Program Mgr. Name (Print)2: Title:
Signature: Date:
Phone: (___) ___-____ E-mail: ____________@_____________________
I certify that the information provided in this report accurately represents the status and description of this water system’s CCC Program. PWS Mgr./Owner Name (Print)3: Title:
Signature: Op. Cert No: Date: The CCC Program Manager is generally the CCS responsible for developing and implementing the PWS’s CCC program. The person that the CCC Program Manager reports to or other manager having direct responsibility and/or oversight of the CCC
program. This person doesn’t need to be in charge of the entire water system.
CCC Program Summary – Year 2005 4 PWS ID _______________

Exceptions forms must be completed and submitted to the Department of Health (DOH) with the Annual Summary Report per WAC 246-290-490(4)(b)(iii).
Complete and submit one form for each exception PWS granted: In 2005. Before 2005, if PWS didn’t previously submit an Exceptions form to DOH. Don’t: Duplicate previously submitted Exceptions forms. Submit any Exceptions forms for 2005, if PWS didn’t grant any exceptions in 2005 and already

Part 3: Information Regarding Exception to Premises Isolation
Enter dates in MM/DD/YYYY format.
Name of Premises: _______________________________________
Part 4: Justification for not Requiring Premises Isolation Using AG, RPBA or RPDA
The following table shows typical reasons for not requiring mandatory premises isolation. The WAC doesn’t require purveyors to grant exceptions – exceptions are optional. Purveyors may provide other reasons consistent with WAC 246-290-490(4)(b)(ii), i.e. no hazard

Part 5: Form Completion Information
Enter dates in MM/DD/YYYY format.
Mandatory Premises Isolation Exception – Year 2005 2 PWS ID _______________

APPENDIX G
WAC 246-290-490 CROSS CONNECTION CONTROL

WAC 246-290-490 City of Oak Harbor – Cross Connection Control Program – Appendix G
Appendix G WAC 246-290-490 Cross Connection Control
1) Applicability, purpose, and responsibility. (a) All community water systems shall comply with the cross-connection control requirements specified in this section. (b) All noncommunity water systems shall apply the principles and provisions of this section, including subsection (4)(b) of this section, as applicable to protect the public water system from contamination via cross-connections. Noncommunity systems that comply with subsection (4)(b) of this section and the provisions of WAC 51-56-0600 of the UPC (which addresses the installation of backflow preventers at points of water use within the potable water system) shall be considered in compliance with the requirements of this section. (c) The purpose of the purveyor's cross-connection control program shall be to protect the public water system, as defined in WAC 246-290-010, from contamination via cross- connections. (d) The purveyor's responsibility for cross-connection control shall begin at the water supply source, include all the public water treatment, storage, and distribution facilities, and end at the point of delivery to the consumer's water system, which begins at the downstream end of the service connection or water meter located on the public right of way or utility-held easement. (e) Under the provisions of this section, purveyors are not responsible for eliminating or controlling cross-connections within the consumer's water system. Under chapter 19.27 RCW, the responsibility for cross-connection control within the consumer's water system, i.e., within the property lines of the consumer's premises, falls under the jurisdiction of the local administrative authority. 2) General program requirements. (a) The purveyor shall develop and implement a cross-connection control program that meets the requirements of this section, but may establish a more stringent program through local ordinances, resolutions, codes, bylaws, or operating rules. (b) Purveyors shall ensure that good engineering and public health protection practices are used in the development and implementation of cross-connection control programs. Department publications and the most recently published editions of references, such as, but not limited to, those listed below, may be used as guidance for cross-connection program development and implementation: (i) Manual of Cross-Connection Control published by the Foundation for Cross- Connection Control and Hydraulic Research, University of Southern California (USC Manual); or

WAC 246-290-490 City of Oak Harbor – Cross Connection Control Program – Appendix G
(ii) Cross-Connection Control Manual, Accepted Procedure and Practice published by the Pacific Northwest Section of the American Water Works Association (PNWS- AWWA Manual). (c) The purveyor may implement the cross-connection control program, or any portion thereof, directly or by means of a contract with another agency or party acceptable to the department. (d) The purveyor shall coordinate with the local administrative authority in all matters concerning cross-connection control. The purveyor shall document and describe such coordination, including delineation of responsibilities, in the written cross-connection control program required in (e) of this subsection. (e) The purveyor shall include a written description of the cross-connection control program in the water system plan required under WAC 246-290-100 or the small water system management program required under WAC 246-290-105. The cross-connection control program shall include the minimum program elements described in subsection (3) of this section. (f) The purveyor shall ensure that cross-connections between the distribution system and a consumer's water system are eliminated or controlled by the installation of an approved backflow preventer commensurate with the degree of hazard. This can be accomplished by implementation of a cross-connection program that relies on: (i) Premises isolation as defined in WAC 246-290-010; or (ii) Premises isolation and in-premises protection as defined in WAC 246-290-010. (g) Purveyors with cross-connection control programs that rely both on premises isolation and in-premises protection: (i) Shall comply with the premises isolation requirements specified in subsection (4)(b) of this section; and (ii) May reduce premises isolation requirements and rely on in-premises protection for premises other than the type not addressed in subsection (4)(b) of this section, if the conditions in (h) of this subsection are met. (h) Purveyors may rely on in-premises protection only when the following conditions are met: (i) The in-premises backflow preventers provide a level of protection commensurate with the purveyor's assessed degree of hazard; (ii) Backflow preventers which provide the in-premises backflow protection meet the definition of approved backflow preventers as described in WAC 246-290-010; (iii) The approved backflow preventers are installed, inspected, tested (if applicable), maintained, and repaired in accordance with subsections (6) and (7) of this section;

WAC 246-290-490 City of Oak Harbor – Cross Connection Control Program – Appendix G
(iv) Records of such backflow preventers are maintained in accordance with subsections (3)(j) and (8) of this section; and (v) The purveyor has reasonable access to the consumer's premises to conduct an initial hazard evaluation and periodic reevaluations to determine whether the in-premises protection is adequate to protect the purveyor's distribution system. (i) The purveyor shall take appropriate corrective action within its authority if: (i) A cross-connection exists that is not controlled commensurate to the degree of hazard assessed by the purveyor; or (ii) A consumer fails to comply with the purveyor's requirements regarding the installation, inspection, testing, maintenance or repair of approved backflow preventers required by this chapter. (j) The purveyor's corrective action may include, but is not limited to: (i) Denying or discontinuing water service to a consumer's premises until the cross- connection hazard is eliminated or controlled to the satisfaction of the purveyor; (ii) Requiring the consumer to install an approved backflow preventer for premises isolation commensurate with the degree of hazard; or (iii) The purveyor installing an approved backflow preventer for premises isolation commensurate with the degree of hazard. (k) Purveyors denying or discontinuing water service to a consumer's premises for one or more of the reasons listed in (i) of this subsection shall notify the local administrative authority prior to taking such action except in the event of an emergency. (l) The purveyor shall prohibit the intentional return of used water to the purveyor's distribution system. Such water would include, but is not limited to, water used for heating, cooling, or other purposes within the consumer's water system. 3) Minimum elements of a cross-connection control program. (a) To be acceptable to the department, the purveyor's cross-connection control program shall include the minimum elements identified in this subsection. (b) Element 1: The purveyor shall adopt a local ordinance, resolution, code, bylaw, or other written legal instrument that: (i) Establishes the purveyor's legal authority to implement a cross-connection control program; (ii) Describes the operating policies and technical provisions of the purveyor's cross- connection control program; and

WAC 246-290-490 City of Oak Harbor – Cross Connection Control Program – Appendix G
(iii) Describes the corrective actions used to ensure that consumers comply with the purveyor's cross-connection control requirements. (c) Element 2: The purveyor shall develop and implement procedures and schedules for evaluating new and existing service connections to assess the degree of hazard posed by the consumer's premises to the purveyor's distribution system and notifying the consumer within a reasonable time frame of the hazard evaluation results. At a minimum, the program shall meet the following: (i) For new connections made on or after the effective date of these regulations, procedures shall ensure that an initial evaluation is conducted before service is provided; (ii) For existing connections made prior to the effective date of these regulations, procedures shall ensure that an initial evaluation is conducted in accordance with a schedule acceptable to the department; and (iii) For all service connections, once an initial evaluation has been conducted, procedures shall ensure that periodic reevaluations are conducted in accordance with a schedule acceptable to the department and whenever there is a change in the use of the premises. (d) Element 3: The purveyor shall develop and implement procedures and schedules for ensuring that: (i) Cross-connections are eliminated whenever possible; (ii) When cross-connections cannot be eliminated, they are controlled by installation of approved backflow preventers commensurate with the degree of hazard; and (iii) Approved backflow preventers are installed in accordance with the requirements of subsection (6) of this section. (e) Element 4: The purveyor shall ensure that personnel, including at least one person certified as a CCS, are provided to develop and implement the cross-connection control program. (f) Element 5: The purveyor shall develop and implement procedures to ensure that approved backflow preventers are inspected and/or tested (as applicable) in accordance with subsection (7) of this section. (g) Element 6: The purveyor shall develop and implement a backflow prevention assembly testing quality control assurance program, including, but not limited to, documentation of tester certification and test kit calibration, test report contents, and time frames for submitting completed test reports. (h) Element 7: The purveyor shall develop and implement (when appropriate) procedures for responding to backflow incidents.

WAC 246-290-490 City of Oak Harbor – Cross Connection Control Program – Appendix G
(i) Element 8: The purveyor shall include information on cross-connection control in the purveyor's existing program for educating consumers about water system operation. Such a program may include periodic bill inserts, public service announcements, pamphlet distribution, notification of new consumers and consumer confidence reports. (j) Element 9: The purveyor shall develop and maintain cross-connection control records including, but not limited to, the following: (i) A master list of service connections and/or consumer's premises where the purveyor relies upon approved backflow preventers to protect the public water system from contamination, the assessed hazard level of each, and the required backflow preventer(s); (ii) Inventory information on: (A) Approved air gaps installed in lieu of approved assemblies including exact air gap location, assessed degree of hazard, installation date, history of inspections, inspection results, and person conducting inspections; (B) Approved backflow assemblies including exact assembly location, assembly description (type, manufacturer, model, size, and serial number), assessed degree of hazard, installation date, history of inspections, tests and repairs, test results, and person performing tests; and (C) Approved AVBs used for irrigation system applications including location, description (manufacturer, model, and size), installation date, history of inspection(s), and person performing inspection(s). (iii) Cross-connection program summary reports and backflow incident reports required under subsection (8) of this section. (k) Element 10: Purveyors who distribute and/or have facilities that receive reclaimed water within their water service area shall meet any additional cross-connection control requirements imposed by the department under a permit issued in accordance with chapter 90.46 RCW. 4) Approved backflow preventer selection. (a) The purveyor shall ensure that a CCS: (i) Assesses the degree of hazard posed by the consumer's water system upon the purveyor's distribution system; and (ii) Determines the appropriate method of backflow protection for premises isolation in accordance with Table 8.

WAC 246-290-490 City of Oak Harbor – Cross Connection Control Program – Appendix G
TABLE 8
APPROPRIATE METHODS OF BACKFLOW PROTECTION FOR PREMISES ISOLATION
Degree of Hazard Application Condition
Appropriate Approved Backflow Preventer
High health cross-connection hazard
Backsiphonage or backpressure backflow
AG, RPBA, or RPDA
Low health cross-connection hazard
Backsiphonage or backpressure backflow
AG, RPBA, RPDA, DCVA, or DCDA
(b) Premises isolation requirements. (i) For service connections with remises posing a high health cross-connection hazard including, but not limited to, those premises listed in Table 9, the purveyor shall ensure that an approved air gap or RPBA is installed for premises isolation. (ii) If the purveyor's CCS determines that no hazard exists for a connection serving premises of the type listed in Table 9, the requirements of (b)(i) of this subsection do not apply. (iii) The purveyor shall document, on a case-by-case basis, the reasons for not applying the requirements of (b)(i) of this subsection to a connection serving premises of the type listed in Table 9 and include such documentation in the cross-connection control program summary report required in subsection (8) of this section.

WAC 246-290-490 City of Oak Harbor – Cross Connection Control Program – Appendix G
TABLE 9
HIGH HEALTH CROSS-CONNECTION HAZARD PREMISES REQUIRING PREMISES ISOLATION BY AG OR RPBA
Agricultural (farms and dairies) Beverage bottling plants Car washes Chemical plants Commercial laundries and dry cleaners Premises where both reclaimed water and potable water are provided Film processing facilities Food processing plants Hospitals, medical centers, nursing homes, veterinary, medical and dental clinics, and blood plasma centers Premises with separate irrigation systems using the purveyor's water supply and with chemical addition+ Laboratories Metal plating industries Mortuaries Petroleum processing or storage plants Piers and docks Radioactive material processing plants or nuclear reactors* Survey access denied or restricted Wastewater lift stations and pumping stations Wastewater treatment plants* Premises with an unapproved auxiliary water supply interconnected with the potable water supply
+ For example, parks, playgrounds, golf courses, cemeteries, estates, etc. * RPBAs for connections serving these premises are acceptable only when used in combination with an in-plant approved air gap; otherwise, the purveyor
shall require an approved air gap at the service connection. (c) Backflow protection for single-family residences. (i) For single-family residential service connections, the purveyor shall comply with the requirements of (b) of this subsection when applicable. (ii) If the requirements of (b) of this subsection do not apply and the requirements specified in subsection (2)(h) of this section are met, the purveyor may rely on backflow protection provided at the point of hazard in accordance with WAC 51-56-0600 of the UPC for hazards such as, but not limited to: (A) Irrigation systems; (B) Swimming pools or spas; (C) Ponds; and (D) Boilers.

WAC 246-290-490 City of Oak Harbor – Cross Connection Control Program – Appendix G
For example, the purveyor may accept an approved AVB on a residential irrigation system, if the AVB is properly installed in accordance with the UPC. (d) Backflow protection for fire protection systems. (i) Backflow protection is not required for residential flow-through or combination fire protection systems constructed of potable water piping and materials. (ii) For service connections with fire protection systems other than flow-through or combination systems, the purveyor shall ensure that backflow protection consistent with WAC 51-56-0600 of the UPC is installed. The UPC requires minimum protection as follows: (A) An RPBA or RPDA for fire protection systems with chemical addition or using unapproved auxiliary water supply; and (B) A DCVA or DCDA for all other fire protection systems. (iii) For new connections made on or after the effective date of these regulations, the purveyor shall ensure that backflow protection is installed before water service is provided. (iv) For existing fire protection systems: (A) With chemical addition or using unapproved auxiliary supplies, the purveyor shall ensure that backflow protection is installed within ninety days of the purveyor notifying the consumer of the high health cross-connection hazard or in accordance with an alternate schedule acceptable to the purveyor. (B) Without chemical addition, without on-site storage, and using only the purveyor's water (i.e., no unapproved auxiliary supplies on or available to the premises), the purveyor shall ensure that backflow protection is installed in accordance with a schedule acceptable to the purveyor or at an earlier date if required by the agency administering the Uniform Building Code as adopted under chapter 19.27 RCW. (C) When establishing backflow protection retrofitting schedules for fire protection systems that have the characteristics listed in (d)(iv)(B) of this subsection, the purveyor may consider factors such as, but not limited to, impacts of assembly installation on sprinkler performance, costs of retrofitting, and difficulty of assembly installation. (e) Purveyors may require backflow preventers commensurate with the degree of hazard determined by the purveyor to be installed for premises isolation for connections serving premises that have characteristics such as, but not limited to, the following: (i) Complex plumbing arrangements or plumbing potentially subject to frequent changes that make it impracticable to assess whether cross-connection hazards exist; (ii) A repeated history of cross-connections being established or reestablished; or (iii) Cross-connection hazards are unavoidable or not correctable, such as, but not limited to, tall buildings.

WAC 246-290-490 City of Oak Harbor – Cross Connection Control Program – Appendix G
5) Approved backflow preventers. (a) The purveyor shall ensure that all backflow prevention assemblies relied upon by the purveyor are models included on the current list of backflow prevention assemblies approved for use in Washington state. The current approved assemblies list is available from the department upon request. (b) The purveyor may rely on testable backflow prevention assemblies that are not currently approved by the department, if the assemblies: (i) Were included on the department and/or USC list of approved backflow prevention assemblies at the time of installation; (ii) Have been properly maintained; (iii) Are commensurate with the purveyor's assessed degree of hazard; and (iv) Have been inspected and tested at least annually and have successfully passed the annual tests. (c) The purveyor shall ensure that an unlisted backflow prevention assembly is replaced by an approved assembly commensurate with the degree of hazard, when the unlisted assembly: (i) Does not meet the conditions specified in (b)(i) through (iv) of this subsection; (ii) Is moved; or (iii) Cannot be repaired using spare parts from the original manufacturer. (d) The purveyor shall ensure that AVBs meet the definition of approved atmospheric vacuum breakers as described in WAC 246-290-010. 6) Approved backflow preventer installation. (a) The purveyor shall ensure that approved backflow preventers are installed in the orientation for which they are approved (if applicable). (b) The purveyor shall ensure that approved backflow preventers are installed in a manner that: (i) Facilitates their proper operation, maintenance, inspection, and/or in-line testing (as applicable) using standard installation procedures acceptable to the department such as those in the USC Manual or PNWS-AWWA Manual; (ii) Ensures that the assembly will not become submerged due to weather-related conditions such as flooding; and (iii) Ensures compliance with all applicable safety regulations.
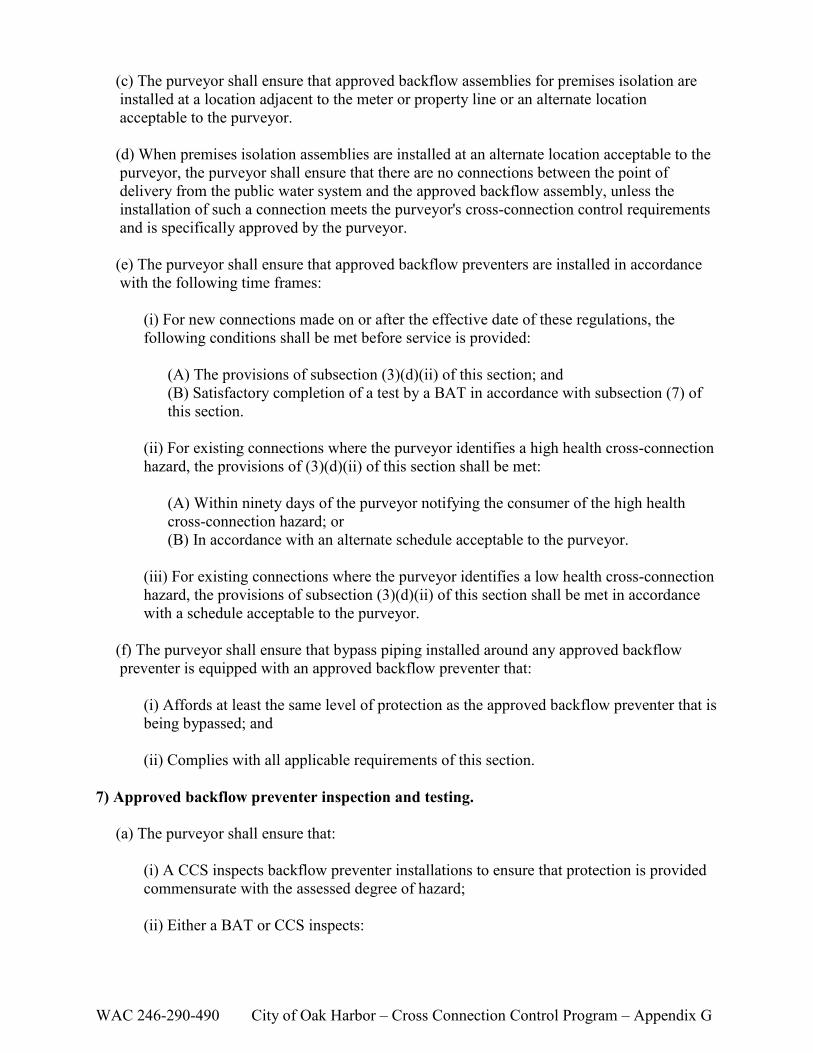
WAC 246-290-490 City of Oak Harbor – Cross Connection Control Program – Appendix G
(c) The purveyor shall ensure that approved backflow assemblies for premises isolation are installed at a location adjacent to the meter or property line or an alternate location acceptable to the purveyor. (d) When premises isolation assemblies are installed at an alternate location acceptable to the purveyor, the purveyor shall ensure that there are no connections between the point of delivery from the public water system and the approved backflow assembly, unless the installation of such a connection meets the purveyor's cross-connection control requirements and is specifically approved by the purveyor. (e) The purveyor shall ensure that approved backflow preventers are installed in accordance with the following time frames: (i) For new connections made on or after the effective date of these regulations, the following conditions shall be met before service is provided: (A) The provisions of subsection (3)(d)(ii) of this section; and (B) Satisfactory completion of a test by a BAT in accordance with subsection (7) of this section. (ii) For existing connections where the purveyor identifies a high health cross-connection hazard, the provisions of (3)(d)(ii) of this section shall be met: (A) Within ninety days of the purveyor notifying the consumer of the high health cross-connection hazard; or (B) In accordance with an alternate schedule acceptable to the purveyor. (iii) For existing connections where the purveyor identifies a low health cross-connection hazard, the provisions of subsection (3)(d)(ii) of this section shall be met in accordance with a schedule acceptable to the purveyor. (f) The purveyor shall ensure that bypass piping installed around any approved backflow preventer is equipped with an approved backflow preventer that: (i) Affords at least the same level of protection as the approved backflow preventer that is being bypassed; and (ii) Complies with all applicable requirements of this section. 7) Approved backflow preventer inspection and testing. (a) The purveyor shall ensure that: (i) A CCS inspects backflow preventer installations to ensure that protection is provided commensurate with the assessed degree of hazard; (ii) Either a BAT or CCS inspects:

WAC 246-290-490 City of Oak Harbor – Cross Connection Control Program – Appendix G
(A) Air gaps installed in lieu of approved backflow prevention assemblies for compliance with the approved air gap definition; and (B) Backflow prevention assemblies for correct installation and approval status. (iii) A BAT tests approved backflow prevention assemblies for proper operation. (b) The purveyor shall ensure that inspections and/or tests of approved air gaps and approved backflow assemblies are conducted: (i) At the time of installation; (ii) Annually after installation, or more frequently, if required by the purveyor for connections serving premises or systems that pose a high health cross-connection hazard or for assemblies that repeatedly fail; (iii) After a backflow incident; and (iv) After an assembly is repaired, reinstalled, or relocated or an air gap is replumbed. (c) The purveyor shall ensure that inspections of AVBs installed on irrigation systems are conducted: (i) At the time of installation; (ii) After a backflow incident; and (iii) After repair, reinstallation, or relocation. (d) The purveyor shall ensure that approved backflow prevention assemblies are tested using procedures acceptable to the department, such as those specified in the most recently published edition of the USC Manual. When circumstances, such as, but not limited to, configuration or location of the assembly, preclude the use of USC test procedures, the purveyor may allow, on a case-by-case basis, the use of alternate (non-USC) test procedures acceptable to the department. (e) The purveyor shall ensure that results of backflow prevention assembly inspections and tests are documented and reported in a manner acceptable to the purveyor. (f) The purveyor shall ensure that an approved backflow prevention assembly or AVB, whenever found to be improperly installed, defective, not commensurate with the degree of hazard, or failing a test (if applicable) is properly reinstalled, repaired, overhauled, or replaced. (g) The purveyor shall ensure that an approved air gap, whenever found to be altered or improperly installed, is properly replumbed or, if commensurate with the degree of hazard, is replaced by an approved RPBA. 8) Recordkeeping and reporting. (a) Purveyors shall keep cross-connection control records for the following time frames:

WAC 246-290-490 City of Oak Harbor – Cross Connection Control Program – Appendix G
(i) Records pertaining to the master list of service connections and/or consumer's premises required in subsection (3)(j)(i) of this section shall be kept as long as the premises pose a cross-connection hazard to the purveyor's distribution system; (ii) Records regarding inventory information required in subsection (3)(j)(ii) of this section shall be kept for five years or for the life of the approved backflow preventer whichever is shorter; and (iii) Records regarding backflow incidents and annual summary reports required in subsection (3)(j)(iii) of this section shall be kept for five years. (b) Purveyors may maintain cross-connection control records in original form or transfer data to tabular summaries. (c) Purveyors may maintain records or data in any media, such as paper, film, or electronic format. (d) The purveyor shall complete the cross-connection control program summary report annually. Report forms and guidance on completing the report are available from the department. (e) The purveyor shall make all records and reports required in subsection (3)(j) of this section available to the department or its representative upon request. (f) The purveyor shall notify the department, local administrative authority, and local health jurisdiction as soon as possible, but no later than the end of the next business day, when a backflow incident is known by the purveyor to have: (i) Contaminated the public water system; or (ii) Occurred within the premises of a consumer served by the purveyor. (g) The purveyor shall: (i) Document details of backflow incidents on a form acceptable to the department such as the backflow incident report form included in the most recent edition of the PNWS- AWWA Manual; and (ii) Include all backflow incident report(s) in the annual cross-connection program summary report referenced in (d) of this subsection, unless otherwise requested by the department. [Statutory Authority: RCW 43.20.050 (2) and (3) and70.119A.080 . 03-08-037, § 246-290-490, filed 3/27/03, effective 4/27/03. Statutory Authority: RCW 43.02.050 [43.20.050]. 99-07-021, § 246-290-490, filed 3/9/99, effective 4/9/99. Statutory Authority: RCW 43.20.050. 91-02-051 (Order 124B), recodified as § 246-290-490, filed 12/27/90, effective 1/31/91. Statutory Authority: P.L. 99-339. 89-21-020 (Order 336), § 248-54-285, filed 10/10/89, effective 11/10/89. Statutory Authority: RCW 34.04.045. 88-05-057 (Order 307), § 248-54-285, filed 2/17/88. Statutory Authority: RCW 43.20.050. 83-19-002 (Order 266), § 248-54-285, filed 9/8/83.]

APPENDIX H
STANDARD INSTALLATION DRAWINGS

City of Oak Harbor – Cross Connection Control Program – Appendix H
Appendix H Standard Installation Drawings
Illustration 5
Standard Details - Service Connection Options Single Family Residential
Premises Isolation Standard Installation
Located 1 – 3 ft of Property Line Purveyor’s water meter in meter
box with meter setter but without meter check
Consumer Installed, purveyor Approved Backflow Preventer
¾” service line
Property Line
Located within 5 ft of Property Line
Consumer ownership responsibilities start at downstream connection to meter setter inside purveyor’s meter box ¾” service
line
¾” service line
Alternate 1: purveyor Accepts Backflow Prevention by Customer Compliance with UPC
Alternate2: purveyor Accepts Backflow Prevention by Customer Compliance with UPC and added DCVA for Irrigation System
Purveyor’s water meter in meter box with meter setter and meter check
Consumer Installed, purveyor Approved Backflow Preventer

City of Oak Harbor – Cross Connection Control Program – Appendix H
Illustration 6 Backflow Prevention Assemblies
Recommended Premises Isolation Installations
Vault Installation – DCVA only
Lockable Insulated Enclosure Installation – RPBA and DCVA Drain to daylight- Required for RPBA
Approved Air Gap - Required for RPBA
Purveyor Approved DCVA with test cocks pointed upwards with plastic plugs
Purveyor Approved RPBA or DCVA
3” Minimum
All installations comply with manufacturer’s recommendation and USCFCCCHR CCC Manual and PNWS-AWWA Manual standards

APPENDIX I
DEFINITIONS
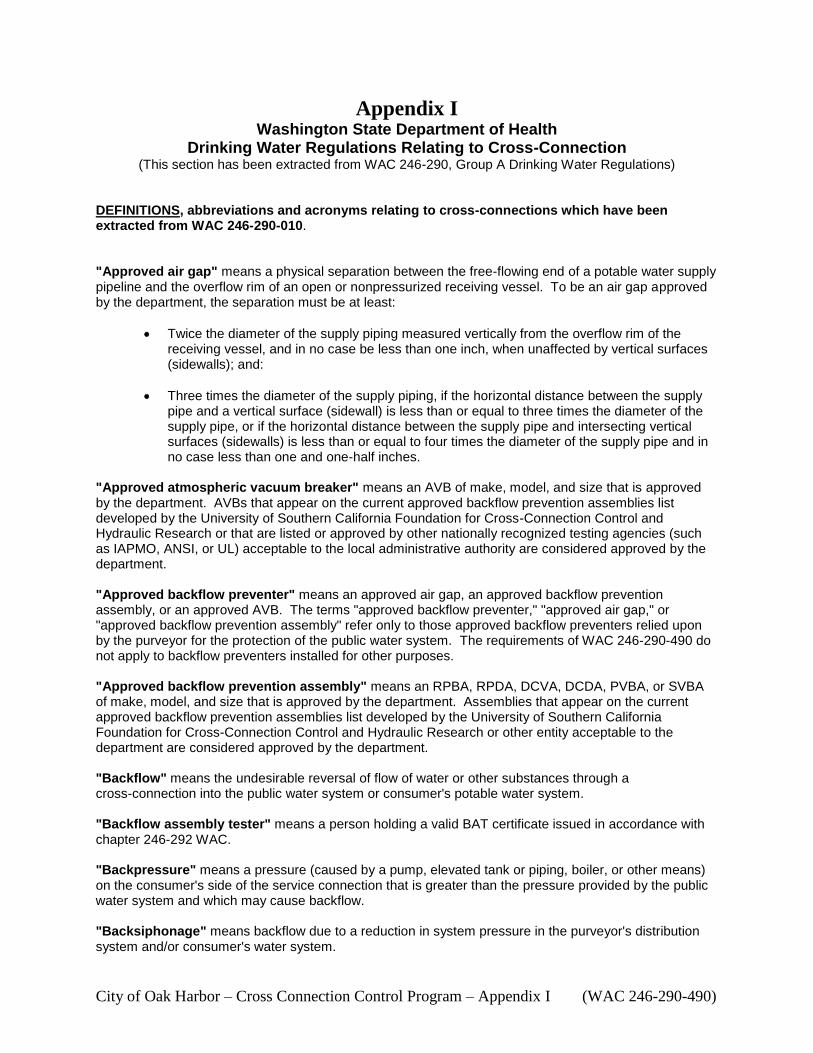
City of Oak Harbor – Cross Connection Control Program – Appendix I (WAC 246-290-490)
Appendix I Washington State Department of Health
Drinking Water Regulations Relating to Cross-Connection (This section has been extracted from WAC 246-290, Group A Drinking Water Regulations)
DEFINITIONS, abbreviations and acronyms relating to cross-connections which have been extracted from WAC 246-290-010. "Approved air gap" means a physical separation between the free-flowing end of a potable water supply pipeline and the overflow rim of an open or nonpressurized receiving vessel. To be an air gap approved by the department, the separation must be at least:
Twice the diameter of the supply piping measured vertically from the overflow rim of the receiving vessel, and in no case be less than one inch, when unaffected by vertical surfaces (sidewalls); and:
Three times the diameter of the supply piping, if the horizontal distance between the supply
pipe and a vertical surface (sidewall) is less than or equal to three times the diameter of the supply pipe, or if the horizontal distance between the supply pipe and intersecting vertical surfaces (sidewalls) is less than or equal to four times the diameter of the supply pipe and in no case less than one and one-half inches.
"Approved atmospheric vacuum breaker" means an AVB of make, model, and size that is approved by the department. AVBs that appear on the current approved backflow prevention assemblies list developed by the University of Southern California Foundation for Cross-Connection Control and Hydraulic Research or that are listed or approved by other nationally recognized testing agencies (such as IAPMO, ANSI, or UL) acceptable to the local administrative authority are considered approved by the department. "Approved backflow preventer" means an approved air gap, an approved backflow prevention assembly, or an approved AVB. The terms "approved backflow preventer," "approved air gap," or "approved backflow prevention assembly" refer only to those approved backflow preventers relied upon by the purveyor for the protection of the public water system. The requirements of WAC 246-290-490 do not apply to backflow preventers installed for other purposes. "Approved backflow prevention assembly" means an RPBA, RPDA, DCVA, DCDA, PVBA, or SVBA of make, model, and size that is approved by the department. Assemblies that appear on the current approved backflow prevention assemblies list developed by the University of Southern California Foundation for Cross-Connection Control and Hydraulic Research or other entity acceptable to the department are considered approved by the department. "Backflow" means the undesirable reversal of flow of water or other substances through a cross-connection into the public water system or consumer's potable water system. "Backflow assembly tester" means a person holding a valid BAT certificate issued in accordance with chapter 246-292 WAC. "Backpressure" means a pressure (caused by a pump, elevated tank or piping, boiler, or other means) on the consumer's side of the service connection that is greater than the pressure provided by the public water system and which may cause backflow. "Backsiphonage" means backflow due to a reduction in system pressure in the purveyor's distribution system and/or consumer's water system.

City of Oak Harbor – Cross Connection Control Program – Appendix I (WAC 246-290-490)
"Combination fire protection system" means a fire sprinkler system that: Is supplied only by the purveyor's water; Does not have a fire department pumper connection; and Is constructed of approved potable water piping and materials that serve both the fire
sprinkler system and the consumer's potable water system. "Consumer" means any person receiving water from a public water system from either the meter, or the point where the service line connects with the distribution system if no meter is present. For purposes of cross-connection control, "consumer" means the owner or operator of a water system connected to a public water system through a service connection. "Consumer's water system," as used in WAC 246-290-490, means any potable and/or industrial water system that begins at the point of delivery from the public water system and is located on the consumer's premises. The consumer's water system includes all auxiliary sources of supply, storage, treatment, and distribution facilities, piping, plumbing, and fixtures under the control of the consumer. "Cross-connection" means any actual or potential physical connection between a public water system or the consumer's water system and any source of nonpotable liquid, solid, or gas that could contaminate the potable water supply by backflow. "Cross-connection control program" means the administrative and technical procedures the purveyor implements to protect the public water system from contamination via cross-connections as required in WAC 246-290-490. "Cross-connection control specialist" means a person holding a valid CCS certificate issued in accordance with chapter 246-292 WAC. "Cross-connection control summary report" means the annual report that describes the status of the purveyor's cross-connection control program. "Flow-through fire protection system" means a fire sprinkler system that:
Is supplied only by the purveyor's water; Does not have a fire department pumper connection; Is constructed of approved potable water piping and materials to which sprinkler heads are
attached; and Terminates at a connection to a toilet or other plumbing fixture to prevent the water from
becoming stagnant. "High health cross-connection hazard" means a cross-connection which could impair the quality of potable water and create an actual public health hazard through poisoning or spread of disease by sewage, industrial liquids or waste. "In-premises protection" means a method of protecting the health of consumers served by the consumer's potable water system, located within the property lines of the consumer's premises by the installation of an approved air gap or backflow prevention assembly at the point of hazard, which is generally a plumbing fixture. "Local administrative authority" means the local official, board, department, or agency authorized to administer and enforce the provisions of the Uniform Plumbing Code as adopted under chapter 19.27 RCW. "Low health cross-connection hazard" means a cross-connection that could cause an impairment of the quality of potable water to a degree that does not create a hazard to the public health, but does adversely and unreasonably affect the aesthetic qualities of such potable waters for domestic use.

City of Oak Harbor – Cross Connection Control Program – Appendix I (WAC 246-290-490)
“Premises Isolation” means a method of protecting a public water system by installation of approved air gaps or approved backflow prevention assemblies at or near the service connection or alternative location acceptable to the purveyor to isolate the consumer’s water system from the purveyor’s distribution system. "Reclaimed water" means effluent derived in any part from sewage from a wastewater treatment system that has been adequately and reliably treated, so that as a result of that treatment, it is suitable for beneficial use or a controlled use that would not otherwise occur, and it is no longer considered wastewater. "Unapproved auxiliary water supply" means a water supply (other than the purveyor's water supply) on or available to the consumer's premises that is either not approved for human consumption by the health agency having jurisdiction or is not otherwise acceptable to the purveyor. "Uniform Plumbing Code" means the code adopted under RCW 19.27.031(4) and amended under chapter 51-56 WAC. This code establishes statewide minimum plumbing standards applicable within the property lines of the consumer's premises. "Used water" means water which has left the control of the purveyor. Abbreviations and Acronyms AG air gap AVB atmospheric vacuum breaker BAT backflow assembly tester (for WAC 246-290-490) CCS cross-connection control specialist DCDA double check detector assembly DCVA double check valve assembly IAPMO International Association of Plumbing and Mechanical Officials PVBA pressure vacuum breaker assembly RPBA reduced pressure backflow assembly RPDA reduced pressure detector assembly SVBA spill resistant vacuum breaker assembly UBC Uniform Building Code UL Underwriters Laboratories Inc. UPC Uniform Plumbing Code
APPENDIX J
DRAFT QUALITY ASSURANCE AND
QUALITY CONTROL

City of Oak Harbor – Cross Connection Control Program – Appendix J Page 1
Appendix J DRAFT Quality Assurance and Quality Control for
Testing of Backflow Prevention Assemblies George Bratton, P.E.
The following discussion is provided as a supplement to the PNWS-AWWA Cross Connection. Control Manual, Accepted Procedures and Practices, Sixth Edition, 1995. This discussion paper provides recommendations for quality assurance and quality control for the purveyor's cross connection control program. The recommendations cover both the performance of the backflow prevention assemblies relied upon by the purveyor and the testing of those assemblies. The purveyor's quality assurance and quality control program for cross connection control differs from programs undertaken by the purveyor's customers primarily with respect to the ownership of backflow prevention assemblies. The purveyor may rely upon backflow prevention assemblies owned by its customers for protection of the public water system. In this case, the purveyor's quality assurance and quality control program must address the issue of the customer's compliance in carrying out some quality assurance and quality control tasks necessary to the purveyor's program. Also, the purveyor may rely upon a backflow assembly tester employed by its customer. In this case the purveyor's program must address a third party's (tester's) involvement in the purveyor's quality assurance and quality control program. The guidance provided herein may differ from the requirements imposed by state regulations pertaining to public water systems. Where regulations exist, they form the minimum requirements. However, for good quality assurance and quality control, additional procedures may be needed. The water purveyor relies on the proper selection, installation and operation of backflow prevention assemblies for the protection of its water system from contamination. The operation of a quality assurance and quality control program is essential to the purveyor's reliance on backflow prevention assemblies. Background: A quality assurance program consists of proactive procedures to obtain a desired product quality (e.g., for a backflow prevention assembly) or performance (e.g., testing of a backflow prevention assembly). A quality control program consists of reactive procedures for determining if desired product quality or performance was achieved. The procedures are intended to detect faults in the manufacture or operation of a product or performance of a procedure, so that remedial action can be taken.

City of Oak Harbor – Cross Connection Control Program – Appendix J Page 2
The following are recommended components for the purveyor's cross connection control quality assurance and quality control program: 1. Quality Assurance Program
a. Backflow prevention assembly (BPA) standards b. BPA approval c. BPA installation standards d. BPA testing procedures e. Backflow assembly tester (BAT) training f. BAT certification and periodic re-certification g. BAT approval (acceptance) by purveyor h. Cross connection control specialists (CCS) training for program administration i. CCS certification j. BPA testing requirements k. BPA test reporting requirements l. BPA test equipment standards m. BPA test equipment approval n. BPA test equipment periodic check of calibration
2. Quality Control Program
a. Inspection of BPA installation b. Monitoring of test results for
i. BPA performance ii. BAT performance
c. Monitoring of BAT certification and other conditions for employment d. Monitoring of BAT performance of test procedure of BPA e. Monitoring of CCS performance f. Monitoring of BAT check of test equipment calibration g. Remedial action for performance failure
i. BPA performance ii. BPA [proper] installation iii. Customer reporting of BPA test results iv. BAT performance v. BAT check of test equipment calibration vi. BAT fraud vii. CCS performance viii.CCA fraud
The components of a quality assurance and quality control program may vary based on the type of cross connection control program adopted by the purveyor. There are two basic types of cross connection control programs the purveyor could adopt: A. Purveyor accepts sole responsibility for protection of its distribution system through the
installation of backflow prevention assemblies on its service pipes for premises isolation, i.e., the purveyor owns all assemblies it relies upon to protect the public water system.
B. Purveyor accepts in whole or in part the customer's installation of backflow prevention
assemblies within the premises, i.e., the customer owns all or some of the assemblies the purveyor relies upon to protect the public water system.

City of Oak Harbor – Cross Connection Control Program – Appendix J Page 3
When the purveyor owns all assemblies it relies upon for protection of the public water system, quality assurance and quality control covers only the purveyor's employees or contractors. In this respect, the quality assurance and quality control has similarities to the other activities of the purveyor, such as water main installation, maintenance of pump stations, etc. For the purveyor to place reliance upon assemblies owned by the customer, the purveyor must implement additional levels of quality assurance and quality control. The purveyor must deal with performance of assemblies and personnel over which it does not have control. For example, the purveyor does not have a direct relationship with the backflow assembly tester (BAT) employed by its customer. Any wrongdoing by the BAT cannot be directly addressed by the purveyor, such as would be the case with a disciplinary action against an employee. Also for quality assurance and quality control, size matters. A small public water system with a limited number of assemblies it relies upon and limited staff resources will have a different program than a large public water system with thousands of assemblies. For example, a small public water system may not have the staff resources to audit the performance of a backflow assembly tester. State regulations pertaining to the purveyor's cross connection control program may establish many of the components for a quality assurance and quality control program. Typical components include:
List of approved backflow prevention assemblies (e.g., assemblies approved by USC FCCCHR).
Procedures for testing of backflow prevention assemblies, etc. Certification of backflow assembly testers (BAT) and cross connection control
specialists (CCS). Reporting to the state of the inventory of assemblies, number of annual tests, number
of assemblies failing annual test. The purveyor's quality assurance and quality control efforts reduce the risk of a backflow incident, and thus, the purveyor's exposure to liability for allowing a contaminant to enter its distribution system. The greater the effort, the lower the risk and exposure to liability. Just as the failure to require premises isolation significantly increases the purveyor's risk, the failure to operate an effective quality assurance and quality control program (e.g., verifying the proper selection and installation of assemblies) significantly increases the purveyor's risk. The purveyor is responsible for the prevention of contamination of its distribution system through cross connections. While state regulations may establish the minimum requirements for the purveyor's quality assurance and quality control program, these minimum requirements may not provide the level of risk and liability management desired by the purveyor. The purveyor should then augment the minimum quality assurance and quality control measures required by state regulations. This may include establishing additional requirements for backflow assembly approval, procedures for testing of backflow prevention assemblies, training and certification of testers, etc.

City of Oak Harbor – Cross Connection Control Program – Appendix J Page 4
COMPONENTS OF QUALITY ASSURANCE PROGRAM: Backflow Prevention Assembly Standards Not all standards for the manufacture of a product are equal. For example, the requirement for a field performance evaluation is a major criterion in the American Water Works Association standards that is not common to the product standards referenced in plumbing codes. The purveyor could specify industry standards (e.g., AWWA or USC FCCCHR) as a minimum requirement, and impose additional standards for design and performance. This would reduce the makes and models of backflow prevention assemblies available for installation and could be challenged as a restraint of trade by manufacturers for their products that do not comply with the purveyor's additional requirements. The purveyor would need to demonstrate the expertise to substantiate the exclusion of a product. A private water company (non-government agency) that owns all the assemblies it relies upon has great latitude in the purchase of material. In this case, the purveyor may elect for reasons of standardizing its inventory to limit assemblies to the one or two manufactures it prefers based on quality rather than cost. A government owned utility, whether it owns assemblies or relies upon customer owned assemblies, must adhere to regulations for the purchase of materials and imposition of requirements for the customer's purchase of assemblies. The government agency must justify any limitation it places on the selection of material. Even the adoption of a list of "approved assemblies" by a private (for-profit or non-profit) organization without an "or equal" provision may lead to a challenge by a manufacturer or purchaser. Approval of Backflow Prevention Assemblies (BPA) Any manufacturer may claim that its product meets a specification. The usual statement is that an item "meets or exceeds" the standards. A significant part of quality assurance is specifying an agency to perform quality control to confirm that the manufacturer's claim of conformance to a standard. To approve an assembly (verify compliance) the purveyor would need the staff expertise and resources to evaluate a product. For this reason, the purveyor or government regulatory agency (e.g. state health department) relies upon a third party evaluation of products and listing of "approved assemblies". For a private water company, the selection of an agency for product testing and approval may be discretionary. For a government agency, the selection of an approval agency (e.g., USC FCCCHR) is subject to the same scrutiny as the setting of standards and section of materials. To specify an approval agency (e.g., USC FCCCHR) without an "or equal" provision (ASSE or state evaluation and approval by a specified procedure) may lead to a challenge by a manufacturer or purchaser.

City of Oak Harbor – Cross Connection Control Program – Appendix J Page 5
Standards for Installation of PBA The standards for backflow prevention assemblies, the agencies approving assemblies and the manufacture of assemblies stipulate installation requirements for proper assembly performance. Installation requirements are also established to prevent contaminants entering through assembly vents, freeze protection, maintenance, etc. To ensure assemblies are installed in the desired manner, the purveyor should adopt standards for assembly installation, either by reference to published standards or by issuance of its own standards. Such installation standards should be readily available to those installing assemblies. Procedure for Testing of BPA Procedures for the testing of assemblies may be established by the state. The state regulations may specifically prescribe a test procedure (e.g., procedures in the USC FCC CHR "Manual of Cross-Connection Control", Tenth Edition) or may specify more than one procedure. Where the purveyor may find deficiencies in the state specified test procedures additional procedures should be specified. For example, the purveyor may require the field test of reduced pressure backflow assemblies to include an additional step to verify if the relief valve will continue to open beyond the "drip point" indicated by verifying the relief valve opening pressure differential. Training of Backflow Assembly Testers (BAT) In assessing the quality of the BAT training the purveyor should consider:
Course syllabus. Course training manual and other course references. Number of classroom and testing lab hours. Backflow assemblies and test gauges available for training. Course instructor (experience and teaching skill). Quality assurance where a training institution may use different instructors. Testing procedures utilized (e.g., state adopted procedure). Inclusion of troubleshooting and maintenance.
The purveyor may find deficiencies in the locally available BAT training program, even where those programs are state sanctioned. As part of certification and re-certification of backflow assembly testers, some states establish a base curriculum, hours of classroom and lab time. Instructors may also require special training and certification. Technical organizations such as AWWA Sections, American Backflow Prevention Association (APBA), etc., may provide recommended course guidelines, types of assemblies for training of testers, etc. They may also provide a voluntary certification program, training for instructors and exam proctors, etc.

City of Oak Harbor – Cross Connection Control Program – Appendix J Page 6
Where the purveyor owns all assemblies it relies upon to protect the public water system, the purveyor may supplement the local training and state certification for its employee BAT or may require its contractor BAT to obtain supplemental training and certification. For example, the purveyor may send an employee to an out-of-state training course (e.g., USC FCCCHR course) or require a contractor BAT to obtain the additional training. Where the purveyor relies upon assemblies owned by its customer for protection of the public water system, imposing additional training requirements is more difficult if such training and certification is not readily available. The options available to the purveyor include:
The purveyor and/or a local technical group (e.g., AWWA, APBA) provide supplemental training.
The purveyor compensates by strengthening other quality assurance procedures (e.g., require premises isolation for a larger number of categories of customers) and quality control procedures (e.g., more frequently audit the work of testers).
One major difficultly for small purveyor is often the lack of technical knowledge by the purveyor's supervisory staff to audit the work of its employee BAT, or for the purveyor's employee BAT or CCS to audit the work of a commercial tester’s. Certification and Re-certification of BAT In assessing the quality of the BAT certification and re-certification the purveyor should consider the:
Written exam (comprehensiveness and applicability of exam questions). Practical exam (use of proctors, exam procedures, inclusion of all types of
assemblies). Proctors training and certification. Re-certification requirements. Re-certification written exam. Practical exam for re-certification. Criteria for pass/fail of certification and re-certification exams (minimum level of
competency). Similar to BAT training, the purveyor may find deficiencies in state (or local voluntary) certification program. State certification may be based on minimal "need to know" criteria. A voluntary program or a program in another state may set higher standards for certification. For greater reliance upon certification to ensure BAT the performance, the purveyor may require certification other than the one required by the state (e.g., APBA certification). Similar to BAT training, it is easier for purveyor that owns all assemblies it relies upon to protect the public water system to require its employees or contractor BAT to obtain additional certification.

City of Oak Harbor – Cross Connection Control Program – Appendix J Page 7
Where the purveyor relies upon assemblies owned by its customer for protection of the public water system, imposing additional certification requirements is more difficult if such certification is not readily available. The purveyor may compensate by strengthening other quality assurance procedures and quality control procedures (e.g., more frequently audit the work of testers). Purveyor's Approval (Acceptance) of BAT The purveyor may pre-approve a BAT for testing assemblies it replies upon for the protection of the distribution system. The list of pre-approved testers can then be given to the purveyor's customers along with a notice for the testing of assemblies. The purveyor may establish additional requirements (i.e., to state certification) for a contractor BAT it employs, such as:
State contractor license. County/City business license. Insurance. Proof of BAT certification(s). Proof of insurance, amount of insurance coverage, type of insurance (e.g., errors and
omission), purveyor named in coverage, etc. Proof of ownership of appropriated (approved) test equipment. Proof of recent calibration check of test equipment. Minimum experience or testing history (e.g., minimum number of assemblies). CCS certification in addition to BAT certification.
For a BAT employed by the purveyor's customer, the imposition of additional requirements must be reasonable in terms of the legitimate interests of the purveyor. For example, the purveyor may make the requirement that a BAT show proof of a recent check of test equipment calibration, but may not be able to require that a BAT show proof of a business license. Training of Cross Connection Control Specialists (CCS) for Program Administration Similar to BAT training, not all training CCS courses are equal. Moreover, in some states, CCS certification does not require completion of a course; certification is based solely on a written exam. In assessing the quality of the CCS training the purveyor should consider:
Course syllabus. Course training manual and other course references. Number of classroom hours. Inclusion of training on testing of backflow assemblies. Course instructor (experience and teaching skill). Quality assurance where a training institution may use different instructors.

City of Oak Harbor – Cross Connection Control Program – Appendix J Page 8
The purveyor's CCS may be an employee or contractor/consultant CCS. The purveyor may also require the customer to employ a CCS to provide the purveyor with a hazard survey. Compensating for deficiencies in local CCS training is easiest for the purveyor's employees. For example, the purveyor may send an employee to an out-of-state training course. For a contractor CCS, the options available to the purveyor include:
The purveyor and/or a local technical group (e.g., AWWA, APBA) provide supplemental education.
The purveyor compensates by strengthening other quality assurance procedures (e.g., require premises isolation for a larger number of categories of customers).
The purveyor provide periodic third-party oversight (of purveyor's staff CCS) by a contractor CCS.
The purveyor obtains an independent evaluation of the purveyor's program. One major difficultly for small purveyor is often the lack of technical knowledge by the purveyor's supervisory staff to supervise the work of its employee or contractor CCS. To overcome this shortcoming the purveyor may obtain an independent evaluation of the program. This may be provided by:
State health department staff Large utility staff CCS Consultant
Certification of CCS Not all certifications are equal. In assessing the quality of the CCS certification and re -certification the purveyor should consider:
Written exam (comprehensiveness and applicability of exam questions) Criteria for pass/fail of certification and re-certification exams (minimum level of
competency) Similar to BAT certification, the purveyor may find deficiencies in state or voluntary certification programs. The purveyor may require certification other than the one required by the state (e.g., APBA certification). Testing of BPA The frequency for testing of assemblies should be established by the purveyor. The minimum frequency may be established by state regulations (e.g., once per year). The purveyor may establish more frequent testing of assemblies in general or for specific makes and models of assemblies or for particular installations (e.g., test RPBA for a sewer treatment plant every six months).

City of Oak Harbor – Cross Connection Control Program – Appendix J Page 9
For purveyor owned assemblies, increasing the testing frequency for greater quality assurance is discretionary. For customer owned assemblies, the customer may object to the cost of for frequent testing. For government owned utilities, the reasonableness of requiring more frequent testing than standard industry practice may need to be justified to the elected officials of the government agency. Where there are a limited number of certified testers are available in an area, the purveyor may compensate by:
At the same time each year, issuing the annual notice to all customers to have their assemblies tested. This allows testers from outside the area to schedule one trip to test multiple assemblies.
Arrange for a purveyor-selected contractor BAT to test the customer's assemblies. Own all assemblies it relies upon (purveyor's staff or contract BAT tests all
assemblies). Where few testers provide a service, the purveyor's quality assurance and quality control efforts (e.g., monitoring and auditing of BAT performance) are reduced. The least effort involves purveyor staff or purveyor employed contractor BAT. Reporting Results of BPA Tests The results of tests should be on a form supplied by the purveyor or acceptable to the purveyor. Standard forms may be helpful to the tester, but may not include all of the information desired by the purveyor. Standards for BPA Test Equipment Equipment for the testing of backflow prevention assemblies utilizing differential pressure reading is expensive. Testers have assembled differential and duplex test kits from purchased component parts from sources other than the manufacturers of test equipment. To ensure that test equipment is of a quality acceptable to the purveyor, the purveyor must either specify test equipment by make and model, or specify industry standards (e.g., USC FCCCHR). It is easier for a non-government purveyor to specify test equipment by make and model. For a government agency, a standard should be specified. Approval of BPA Test Equipment A non-government purveyor may specify test equipment by make and model. The decision on approval of equipment may be subjective (based on preference). Alternatively, the selection of an agency for product testing and approval may be discretionary.

City of Oak Harbor – Cross Connection Control Program – Appendix J Page 10
For government agencies, approval of test equipment would need the staff expertise and resources to evaluate a product or it must rely upon a third party evaluation of products and listing of "approved test equipment". For a government agency, the selection of an approval agency (e.g., USC FCCCHR) is subject to the same scrutiny as the setting of standards and section of materials. To specify an approval agency (e.g., USC FCCCHR) without an "or equal" provision may lead to a challenge by a manufacturer or purchaser. Check of Test Equipment Calibration The accuracy of test equipment is essential to the testing of assemblies. The degree of accuracy is established by the product standards. The frequency for checking the calibration of test equipment must be established by the purveyor. The minimum frequency may be established by state regulations. The methods for checking the calibration of test equipment may be obtained from the manufactures of the equipment or in the test equipment standards. The purveyor must specify the calibration procedure. For the checking of test equipment, the purveyor may:
Provide the required equipment (e.g., mercury manometer) and staff. Specify an approved agency (e.g., instrument lab).
For purveyors that own all of the assemblies it relies upon, the task of checking test equipment calibration is relatively simple. Only one or two sets of equipment may be owned by the purveyor or the purveyor's contractor. For testing of customer owner assemblies by commercial testers, there may be a large number of units of test equipment. Each tester approved for submitting test reports to the purveyor would need to provide proof of a check of test equipment calibration. Some testing equipment cannot be re-calibrated. The purveyor must establish a policy on accepting test results that have been adjusted for calibration inaccuracies, or the replacement of equipment.

City of Oak Harbor – Cross Connection Control Program – Appendix J Page 11
COMPONENTS OF QUALITY CONTROL PROGRAM: Inspection of Backflow Prevention Assembly Installation The inspection of the installation of new assemblies should include:
Confirmation of the appropriate type (e.g., RPBA), make and model (approved assembly).
Confirmation of the proper installation for the type of assembly installed (e.g., horizontal), and compliance with the purveyor's adopted installation standards (e.g., ground clearance).
Recording of assembly nameplate information (e.g., serial number, model number). Recording of the assembly location (e.g., record drawing, photograph).
The acceptance of the installation of an assembly should be based on the purveyor's requirements for the proper operation of the assembly. For purveyor owned assemblies, the acceptance of the installation may also include the following:
Adequate drainage (e.g., for RPBA relief valve discharge). Worker safety (ventilation). Landscaping around or paint of enclosures. Vehicle access.
For customer owned assemblies, those located downstream of the purveyor's meter for premises isolation or in-premises assemblies relied upon by the purveyor, the purveyor must make a clear statement that approval of the installation of an assemblies indicates: 1. That the assembly is:
a. The approved type and make for protection of the purveyor's system, and b. Installed in an approved manner for its type and make, including an approved air gap
for an RPBA. 2. That the purveyor's approval does not address:
a. If the assembly or its installation complies with the building code, plumbing code, safety code or other regulations pertaining to customer's premises.
b. If the assembly is properly restrained or supported, protected from freezing and vandalism, has adequate drainage to prevent flooding damage from the RPBA relief valve discharge, etc.
The above items are recommended to limit the purveyor's exposure to liability for any deficiencies in the customer's installation of backflow assemblies. For customer owned assemblies, the purveyor may include the requirements:
That a plumbing and building permit is obtained for the assembly installation, The customer provides proof that the local administrative authority approved the
assembly installation.

City of Oak Harbor – Cross Connection Control Program – Appendix J Page 12
Inspection of the installation of backflow prevention assemblies relied upon by the purveyor should be completed prior to providing service to a new customer. The purveyor may also include with the inspection of the assembly installation:
The initial testing of the assembly or assemblies. A hazard survey of the premises to confirm the assessment made based on plan review.
Monitoring of Test Results The reporting of test results may vary from a simple statement that an assembly passed or failed a prescribed test procedure, to reporting detailed results of the test (e.g., opening pressure of the RPBA relief valve). Greater quality control is obtained through the review of detailed results. Just as the test procedures do not verify all performance parameters established by design standards, for practical reasons limits may be set for the number of parameters to be reported for the test of a backflow prevention assembly. Increasing the number of parameters reported increases the task of reviewing and recording of data (e.g., in a spreadsheet database), but decreases the purveyor's risk and exposure to liability. For quality control, the person reviewing test data must have specific knowledge of the quality control criteria. The "inspector" must be trained. Entry of the data into a computer database may facilitate the review of test result. Some computer programs for data recording provide check features, such as verifying assembly approval by make and model number, BAT certification, etc. However, to utilize the computer data entry for quality control requires the input of the appropriate parameters. The knowledge of the person reviewing the submitted test data (or writing a computer program to assist in data review) is essential to the level of quality control obtained from the submission and review of details in the test report. Without the purveyor providing staff (employee CCS or contractor CCS/consultant) with adequate knowledge for and effort in quality control utilizing the results the BAT testing of an assembly, the test report need only include the statement that the assembly passed or failed. Total reliance is then placed on the performance of the BAT. To reduce the purveyor's risk and liability, any quality control utilizing the review of test report data should be undertaken as soon as possible after the purveyor obtains a test report. This may be only a cursory review to determine the assembly passed or failed a test, that the BAT did not make a statement concerning improper application of the assembly to the degree of hazard, etc. A thorough review could be made at a more convenient time. This offers the options of the more thorough review being made by a selected staff member or contractor CCS/consultant with suitable knowledge for the task. As a minimum, the detailed review should be made annually.

City of Oak Harbor – Cross Connection Control Program – Appendix J Page 13
The field test of a backflow prevention assembly does not include all of the design parameters included in design standards. The procedures may not include a test of an assembly component to determine if backflow will occur. For example, a check valve may be tested in the direction of flow, rather than reverse direction of flow. An assembly that fails the field test (e.g., check valve holds tight with 0.5 psi in the direction of flow) may continue to perform to prevent backflow. The field test only determines if the assembly complies with the test procedures. Conversely an assembly may pass the field test with a component that does not properly function. For example, the relief valve of an RPBA may be reported as opening at 2.1 psi, but may not continue to open to dispel the quantity of water need to stop backflow. All assemblies will eventual fail to perform, and thus, would allow backflow to occur. The review of field test report for passing or failing the prescribe field test is for the purpose of providing timely maintenance or replacement. As noted above, field tests may not demonstrate a failure to prevent actual backflow test conditions. Repair or replacement is required to restore a level of confidence in the reliability of an assembly. The review of the performance data obtained in the field test is for the purpose of determining the reliability of an assembly to prevent backflow. This review may result in the preventative replacement of an assembly because of increased failure rate, removal of a specific make and model from the purveyor's approval list due to above average failure rates, or establishing a preference in the purveyor's purchase of assemblies. In monitoring the performance of the assembly, the purveyor should review the following parameters: Parameter Quality Control Review Line pressure Under high line pressure some assemblies may have a higher than average failure rate. Service meter reading Under low or no-flow conditions some assemblies (e.g., on fire lines) may have a higher than average failure rate. Pressure readings As an assembly parts show wear, the pressure readings will change (e.g., opening pressure of the RPBA relief valve will decrease). Monitoring of this data may give an indication of the need for maintenance and replacement. If an assembly shows a higher than average failure rate (compared to other makes and model) the purveyor may remove the make and model from its list of approved assemblies. For purveyor owned assemblies, the purchase of assemblies is discretionary, based on better performance rather than lowest cost.

City of Oak Harbor – Cross Connection Control Program – Appendix J Page 14
To restrict the customer's purchase of assemblies is a more difficult task, both with respect to administration (e.g., assuring that contractors and suppliers are aware of restriction) and enforcement. For a government owned utility, a manufacturer of a product withdrawn from an "approved list" by a local jurisdiction would likely be challenged. The purveyor should report any issue with the performance of an assembly to the state (if the state issues a list of approved assemblies) and to the approval agency. There is no assurance that the make and model removed from the purveyor's list will be removed from the state or testing agency's approval list. The conditions for a make or model to show higher than normal failure rates may be due to conditions found in the purveyor's system (e.g., water is corrosive or contains high levels of iron and manganese). The above parameters may also be used in monitoring the performance of the tester. By comparing the test report data over several years the purveyor may detect BAT fraud, test equipment inaccuracy, assembly replacement, etc. To limit the purveyor's liability, all test reports for assemblies owned by the customer should be returned to the purveyor by the purveyor's customer, not directly from the customer employed BAT. The customer should be required to sign the test report after its completion by the BAT. This confirms that the customer is aware of any deficiency in the assembly performance and installation reported by the BAT. Monitoring of Bat Certification and Other Conditions for Employment The purveyor should verify that the BAT submitting a test report currently holds the certifications required by the purveyor. As the minimum effort, this would require proof of the certification required by the state. Where readily available, the purveyor may rely upon a state listing of certified testers. If not readily available (e.g., though the Internet), or if the purveyor requires certification supplemental to the state certification, the purveyor should annually assemble a list of pre -approved certified testers that may submit reports on the testing of assemblies the purveyor relies upon. The purveyor's requirements for listing may include proof of ownership of appropriate test equipment, recent check of test equipment calibration, etc. For a small system, the purveyor may rely partially or completely upon the list from another nearby [larger] system following acceptable listing criteria. The purveyor should base its listing of certified testers on pre-established criteria. The criteria must be in the legitimate interests of the purveyor and not contain arbitrary criteria that restrict employment.

City of Oak Harbor – Cross Connection Control Program – Appendix J Page 15
Monitoring of BAT Test Procedure This entails the verification that a BAT is properly performing the testing procedure required by the purveyor. The issue may arise from a review of test reports submitted by each BAT, customer complaints, or accusation of improper testing by another BAT. Without a specific reason for evaluating the performance of a specific BAT, the purveyor may wish to make a random audit of BAT testing. To undertake a review of the testing ability of a BAT, the purveyor must have qualified staff and test equipment, or must arrange to use a qualified contractor BAT. Two options are available for auditing BAT performance: 1. Retest an assembly immediately before issuing a test notice or immediately after
receiving the test report. 2. Arrange to witness the testing of an assembly by a BAT. The audit may reveal that: 1. Failed to follow the requisite state testing procedure, and:
a. The BAT falsified a previous test (option "1", above). b. The BAT shows a fundamental error in the prescribed test procedures. c. The BAT shows a minor error in the prescribed test procedures.
2. Failed to follow the purveyor's required additional test procedures, and:
a. The BAT falsified a previous test (option "1", above). b. The BAT shows a fundamental error in the prescribed test procedures. c. The BAT shows a minor error in the prescribed test procedure.
Option 1, above, is most useful in determining BAT fraud. Past history has revealed:
The assembly was no longer installed. A pressure-reducing valve was found at the location listed as being tested. A RPBA relief valve opening pressure was recorded for a DCVA installation. Dirt and debris was found in the test cocks of an assembly recently claimed as being
tested. Option 2 is necessary in determining BAT competency. For a small system, the purveyor may rely partially or completely upon the monitoring of BAT performance by another nearby [larger] system. Monitoring of Test Equipment Calibration As a minimum, the purveyor should either perform the check of the calibration of the equipment or have a qualified testing laboratory submit a report on the calibration check.

City of Oak Harbor – Cross Connection Control Program – Appendix J Page 16
Remedial Action for Performance Failure Quality control requires correction of any failure to perform. Quality control may require the purveyor to take corrective actions for the following:
a. Backflow assembly failure to meet performance requirements. b. Backflow assembly is improperly installed. c. Customer failure to submit report of test results. d. BAT improper performance of assembly test. e. BAT failure to check calibration of test equipment. f. BAT fraud. g. CCS improper performance. h. CCS fraud.
Where the purveyor owns the assemblies it relies upon, remedial action is relatively easy. All parameters for quality assurance are under the control of the purveyor. For assemblies owned by the customer, the purveyor must have suitable means of enforcement. Ultimately, the enforcement could involve termination of water service or the purveyor's installation of a backflow assembly for premises isolation. Litigation may result from a termination of water service or the assessment to the customer for the purveyor's installation of a premises isolation assembly. The following table is provided for the purveyor to audit its quality assurance and quality control program.

City of Oak Harbor – Cross Connection Control Program – Appendix J Page 17
CROSS CONNECTION CONTROL PROGRAM QUALITY ASSURANCE AND QUALITY CONTROL PROGRAM
CHECKLIST
PROGRAM COMPONENTS
PURVEYOR OWNED
ASSEMBLIES (yes/no)
CUSTOMER OWNED
ASSEMBLIES (yes/no)
1 QUALITY ASSURANCE
A Backflow prevention assembly (BPA) standards B BPA approval C BPA installation standards D BPA testing procedures E Backflow assembly tester (BAT) training F BAT certification and periodic re-certification G BAT approval (acceptance) by purveyor I Cross connection control specialists (CCS) training I CCS certification and re-certification J BPA testing requirements K BPA test reporting requirements L BPA test equipment standards M BPA test equipment approval N BPA test equipment periodic check of calibration 2 QUALITY CONTROL
A Inspection of BPA installation B Monitoring of test results (i) For BPA performance (ii) For BAT performance
C Monitoring of BAT certification D Monitoring of BAT performance (testing) of BPA E Monitoring of CCS performance F Monitoring of BAT check of test equipment calibration G Remedial action for performance failure (i) BPA performance and installation (ii) Customer reporting of BPA test results (iii) BAT performance (iv) BAT check of test equipment calibration (v) BAT fraud (vi) CCS performance (vii)CCS fraud

WAC 51-56-0600
CHAPTER 6 WATER SUPPLY AND DISTRIBUTION

WAC 51-56-0600
Chapter 6 — Water supply and distribution.
601.1 Except where not deemed necessary for safety or sanitation by the AHJ, each plumbing fixture shall be provided with an
adequate supply of potable running water piped thereto in an approved manner, so arranged as to flush and keep it in a clean and
sanitary condition without danger of backflow or cross-connection. Water closets and urinals shall be flushed by means of an approved
flush tank or flushometer valve.
EXCEPTION: Listed fixtures that do not require water for their operation and are not connected to the water supply.
Kitchen sinks, lavatories, bathtubs, showers, bidets, laundry tubs and washing machine outlets shall be provided with hot and cold
water. This requirement shall not supersede the requirements for individual temperature control limitations for public lavatories, bidets,
bathtubs, whirlpool bathtubs and shower control valves.
601.2.2 Color and Information. Each system shall be identified with a colored pipe or band and coded with paints, wraps and materials
compatible with the piping.
Except as required in Chapter 16, nonpotable water systems shall have a yellow background with black uppercase lettering, with the
words "CAUTION: NONPOTABLE WATER, DO NOT DRINK." Each nonpotable system shall be identified to designate the liquid being conveyed,
and the direction of normal flow shall be clearly shown. The minimum size of the letters and the length of color field shall conform to
Table 6-1.
The background color and required information shall be indicated every twenty (20) feet (6,096 mm) but not less than once per room,
and shall be visible from the floor level.
603.0 Cross-Connection Control. Cross-connection control shall be provided in accordance with the provisions of this chapter.
Devices or assemblies for protection of the public water system must be models approved by the department of health under WAC
246-290-490. The authority having jurisdiction shall coordinate with the local water purveyor where applicable in all matters concerning
cross-connection control within the property lines of the premises.
No person shall install any water operated equipment or mechanism, or use any water treating chemical or substance, if it is found
that such equipment, mechanism, chemical or substance may cause pollution or contamination of the domestic water supply. Such
equipment or mechanism may be permitted only when equipped with an approved backflow prevention device or assembly.
603.1 Approval of Devices or Assemblies. Before any device or assembly is installed for the prevention of backflow, it shall have first
been approved by the authority having jurisdiction. Devices or assemblies shall be tested for conformity with recognized standards or
other standards acceptable to the authority having jurisdiction. Backflow prevention devices and assemblies shall comply with Table 6-2,
except for specific applications and provisions as stated in Section 603.4 through 603.4.22.
All devices or assemblies installed in a potable water supply system for protection against backflow shall be maintained in good
working condition by the person or persons having control of such devices or assemblies. Such devices or assemblies shall be tested in
accordance with Section 603.3.3 and WAC 246-290-490. If found to be defective or inoperative, the device or assembly shall be
replaced or repaired. No device or assembly shall be removed from use or relocated or other device or assembly substituted, without
the approval of the authority having jurisdiction.
Testing shall be performed by a Washington state department of health certified backflow assembly tester.
TABLE 6-2
Backflow Prevention Devices, Assemblies and Methods
The following line is deleted from the table:
Device,
Assembly or
Method
Applicable
Standards
Pollution (Low Hazard) Contamination (High Hazard)
Installation
Back
Siphonage
Back
Pressure
Back
Siphonage
Back
Pressure
Backflow
preventer for
ASSE 1022 X Installation
includes
WAC 51-56-0600: Chapter 6 — Water supply and distribution. http://apps.leg.wa.gov/wac/default.aspx?cite=51-56-0600
1 of 3 1/22/2013 2:12 PM

carbonated
beverage
dispensers
(two
independent
check valves
with a vent to
the
atmosphere.)
carbonated
beverage
machines or
dispensers.
These
devices
operate under
intermittent or
continuous
pressure
conditions.
603.3.3 For devices and assemblies other than those regulated by the Washington department of health in conjunction with the local
water purveyor for the protection of public water systems, the authority having jurisdiction shall ensure that the premise owner or
responsible person shall have the backflow prevention assembly tested by a Washington state department of health certified backflow
assembly tester:
(1) At the time of installation, repair or relocation; and
(2) At least on an annual schedule thereafter, unless more frequent testing is required by the authority having jurisdiction.
603.4.6.1 Potable water supplies to systems having no pumps or connections for pumping equipment, and no chemical injection or
provisions for chemical injection, shall be protected from backflow by one of the following devices:
(1) Atmospheric vacuum breaker.
(2) Pressure vacuum breaker.
(3) Spill-resistant pressure vacuum breaker.
(4) Reduced pressure backflow preventer.
(5) A double check valve may be allowed when approved by the water purveyor and the authority having jurisdiction.
603.4.10 Potable Water Make Up Connections to Steam or Hot Water Boilers shall be protected by an air gap or a reduced
pressure principle backflow preventer.
603.4.12 Potable Water Supply to Carbonators shall be protected by a listed reduced pressure principle backflow preventer as
approved by the authority having jurisdiction for the specific use. The backflow preventer shall be located in accordance with Section
603.3.4. The piping downstream of the backflow preventer shall not be of copper, copper alloy, or other material that is affected by
carbon dioxide.
603.4.14 Backflow preventers shall not be located in any area containing fumes or aerosols that are toxic, poisonous, infectious, or
corrosive.
603.4.16.1 Except as provided under Sections 603.4.16.2 and 603.4.16.3, potable water supplies to fire protection systems that are
normally under pressure, including but not limited to standpipes and automatic sprinkler systems, except in one or two family residential
flow-through or combination sprinkler systems piped in materials approved for potable water distribution systems, shall be protected
from back-pressure and back-siphonage by one of the following testable devices:
1. Double check valve assembly.
2. Double check detector assembly.
3. Reduced pressure backflow preventer.
4. Reduced pressure detector assembly.
WAC 51-56-0600: Chapter 6 — Water supply and distribution. http://apps.leg.wa.gov/wac/default.aspx?cite=51-56-0600
2 of 3 1/22/2013 2:12 PM

Potable water supplies to fire protection systems that are not normally under pressure shall be protected from backflow and shall meet
the requirements of the appropriate standard(s) referenced in Table 14-1.
604.15 Plastic water service piping may terminate within a building, provided the connection to the potable water distribution system
shall be made as near as is practical to the point of entry and shall be accessible. Barbed insert fittings with hose clamps are prohibited
as a transition fitting within the building.
608.5 Relief valves located inside a building shall be provided with a drain, not smaller than the relief valve outlet, of galvanized steel,
hard drawn copper piping and fittings, CPVC, or listed relief valve drain tube with fittings which will not reduce the internal bore of the
pipe or tubing (straight lengths as opposed to coils) and shall extend from the valve to the outside of the building, with the end of the
pipe not more than two (2) feet (610 mm) nor less than six (6) inches (152 mm) above the ground or the flood level of the area receiving
the discharge and pointing downward. Such drains may terminate at other approved locations. No part of such drain pipe shall be
trapped or subject to freezing. The terminal end of the drain pipe shall not be threaded.
EXCEPTION: Replacement water heating equipment shall only be required to provide a drain pointing downward from the
relief valve to extend between two feet (610 mm) and six inches (152 mm) from the floor. No additional floor
drain need be provided.
610.4 Systems within the range of Table 6-6 may be sized from that table or by the method set forth in Section 610.5.
Listed parallel water distribution systems shall be installed in accordance with their listing.
[Statutory Authority: RCW 19.27.031, 19.27.035, 19.27.074, and chapters 19.27 and 34.05 RCW. 12-07-018, § 51-56-0600, filed 3/12/12, effective 4/12/12. StatutoryAuthority: RCW 19.27.074, 19.27.031 and chapters 19.27 and 34.05 RCW. 10-03-101, § 51-56-0600, filed 1/20/10, effective 7/1/10. Statutory Authority: RCW19.27.190, 19.27.020 and chapters 19.27 and 34.05 RCW. 07-01-094, § 51-56-0600, filed 12/19/06, effective 7/1/07. Statutory Authority: RCW 19.27.031 and 19.27.074.04-01-110, § 51-56-0600, filed 12/17/03, effective 7/1/04; 02-01-114, § 51-56-0600, filed 12/18/01, effective 7/1/02.]
WAC 51-56-0600: Chapter 6 — Water supply and distribution. http://apps.leg.wa.gov/wac/default.aspx?cite=51-56-0600
3 of 3 1/22/2013 2:12 PM

APPENDIX H
DESIGN AND PERFORMANCE STANDARDS


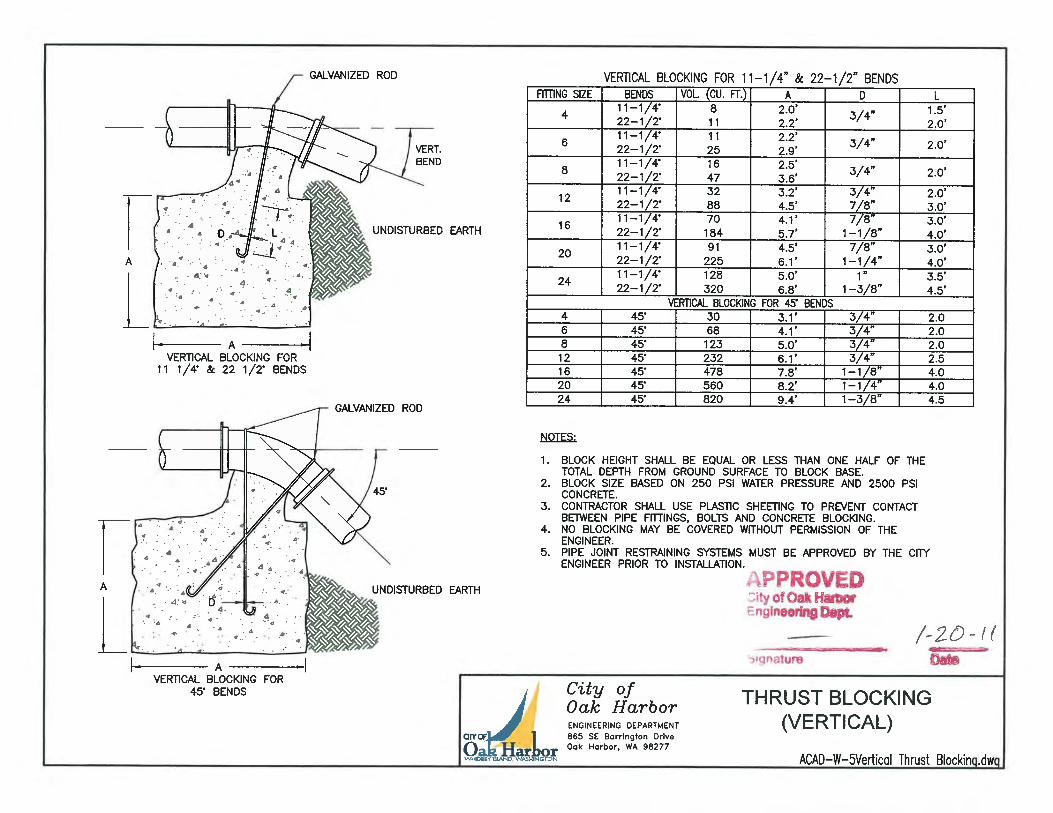


APPENDIX I
LOCAL GOVERNMENT CONSISTENCY REVIEW CHECKLIST


APPENDIX J
PLAN REVIEW COMMENTS AND CORRESPONDENCE


NOTICE OF WORKSHOP MEETING
NOTICE IS HEREBY GIVEN that the Oak Harbor City Council will hold a Workshop Meeting on Wednesday, August 27th, 2014, at 3:00 p.m. to discuss the following agenda items. The meeting will be held in the Council Chambers, 865 SE Barrington Drive. DATED this 22nd day of August 2014. Anna M. Thompson, City Clerk The City Council may meet informally in workshop sessions (open to the public) to do concentrated strategic planning, to review forthcoming programs of the City, receive progress reports on current programs or projects, or receive other similar information from the City Administrator, provided that all discussions and conclusions thereon shall be informal. Council shall make no disposition of any item at a workshop meeting. Public comment is not normally allowed at workshop meetings, although Council may allow, or request participation.
WORKSHOP MEETING CITY COUNCIL
August 27, 2014 AGENDA 3:00 p.m. Departmental Briefings 1. 42-Inch Outfall Project - PW 2. Engineer Opinion Letter on the Whidbey Avenue Crosswalk - PW 3. Scheduling Parliamentary Procedure Workshop - Admin Pending Agenda Items 1. 2016 Comprehensive Plan Amendments Public Participation Plan - Dev/Services (9/16) 2. Ordinance 1695: Extension of Impact Fee Reduction – Dev/Services (9/02) 3. Ordinance 1692: Extending Medical Marijuana Moratorium – Dev/Services
(9/02) 4. ERCI On-Call Archaeology Contract Amendment No. 3 – Engineering (9/02) 5. LED Lighting Conversion Contract (Department of Enterprise Systems) - PW 6. Water System Plan – Engineering – (9/02 and 9/16) Emerging Issues 1. Capital Projects Assessment Exercise – Results of City Council Review 2. Sale or Exchange of Real Property (Chapter 1.30 OHMC)

CITY OF OAK HARBOR PLANNING COMMISSION NOTICE OF PUBLIC HEARING
PC# 05-27-14
Notice is hereby given that the Planning Commission will conduct its regular monthly meeting on Tuesday, May 27, 2014. Staff will conduct a pre-meeting briefing with Planning Commission beginning at 7:00 pm in the Council conference room. The business meeting starts at 7:30 p.m. and will be held in the Council Chambers at City Hall, 865 SE Barrington Drive, Oak Harbor WA. The Planning Commission will consider the following: BECKETT LANDING SUBDIVISION– Public Hearing “Beckett Landing” is a proposed subdivision on 4.90 acres located south of the terminus of NW Prow Street, north of the existing and proposed Island Place development, and west of the Paragon Place development and Heller Road. The applicant proposes 22 single-family detached lots, with associated street and utility improvements and native vegetation areas. The Planning Commission will conduct a public hearing and potentially make a recommendation to City Council. WATER SYSTEM PLAN – Public Hearing The City of Oak Harbor is updating its Water System Plan of which the Water Use Efficiency program is a part. A Water System Plan and Water Use Efficiency program is required to be adopted by the City every six years by the Washington State Department of Health for all public water systems. The purpose of the Plan and Efficiency program is to preserve state water resources and provide long-term maintenance of public water supplies. Staff will present information on the city water supply, current status of the Water Use Efficiency program and the goals proposed for the program as it continues to the public and the Commission. An essential component of the program is the water rate structure. Public comment is invited especially from water system customers. Materials supporting the rationale for water efficiency goals can be viewed at the Development Services Department at Oak Harbor City Hall, 865 SE Barrington Drive. This Planning Commission meeting will also serve as the informational meeting for consumers as required by WAC 246-290-100(8). Planning Commission is expected to accept comments in a public hearing for this item. 2014 COMPREHENSIVE PLAN AMENDMENT – SCENIC VIEWS – Public Meeting Staff will continue the discussion related to Scenic Views within Oak Harbor. Staff will present various goals and policies currently within the Comprehensive Plan that either support or conflict with ideas surrounding the preservation of scenic views. MEDICAL MARIJUANA – Public Meeting A moratorium is presently in place prohibiting the establishment of medical marijuana collective gardens and marijuana dispensaries in Oak Harbor. Last month staff briefed the Planning Commission on the current status of medical marijuana law in Washington state. Staff will once again brief the Commission on this matter. All meetings of the Planning Commission are open to the public. Published Whidbey News Times May 10, 2014


APPENDIX K
COLIFORM AND NITRATE VIOLATION LETTERS AND NOTIFICATIONS

DOH Form #331-264 (Updated 08/10)
PUBLIC NOTICE CERTIFICATION
Acute Coliform MCL
Within 10 days of notifying your customers, you must send a copy of each type of notice you distribute (hand-delivered notices, press releases, newspaper articles, etc.) to our regional office. Also, complete and send this form, which certifies that you have met all the public notification requirements. If the boil water advisory remains in effect more than three months, you must notify your water users again and provide another Public Notice Certification to us. With this certification, you are also stating that you will meet future requirements for notifying new billing units of the violation or situation. Water System:__________________________________________ID #__________County:_______________ Violation Date:_____ / _____ / _____ Violation Type:_____________________________________________ This public water system certifies that public notice has been given to water users, following state and federal requirements for delivery, content, and deadlines. Complete the following items: Yes No
Distribution was completed on ___ / ___ /____. Check all that apply: Hand delivery, Press release (TV, radio, newspaper, etc.), Posting at_________________________ (by DOH approval only), Other ____________________________ (by DOH approval only).
Were the water users notified within 24 hours?
______________________________________________ ___________________ ____________________ Signature of owner or operator Position Date If you need this publication in an alternate format, call (800) 525-0127 or for TTY/TDD call (877) 833-6341. Northwest Regional Office: 20425 72nd Ave S Suite 310 Kent WA 98032 (253) 395-6775 Fax: (253) 395-6760
Southwest Regional Office: PO Box 47823 Olympia WA 98504-7823 (360) 236-3030 Fax (360) 664-8058
Eastern Regional Office: 16201 E Indiana Ave Suite 1500 Spokane Valley WA 99216 (509) 329-2100 Fax: (509) 329-2104

IMPORTANT NOTICE ABOUT YOUR WATER SYSTEM Coliform Maximum Contaminant Level (MCL) Exceeded: Non-acute MCL
The ____________________________ water system, ID# ____________ in __________ County routinely monitors for the presence of total coliform bacteria and in ____________ this type of bacteria was detected. Although this incident was not an emergency, as our customer, you have a right to know what happened and what we did or are doing to correct the situation. Coliforms are bacteria which are naturally present in the environment and are used as indicators that other, potentially-harmful, bacteria may be present. Coliforms were found in more samples than allowed and this was a warning of potential problems. The samples that showed the presence of coliform were further tested to see if other bacteria of greater concern, such as fecal coliform or E.coli were present. None of these bacteria were found. You do not need to boil your water. People with severely compromised immune systems, infants, and some elderly may be at an increased risk. These people should seek advice from their health care provider. What happened? What is the suspected or known source of contamination?
At this time: The problem is resolved. Additional samples collected were found to be free of coliform bacteria. We anticipate resolving the problem by ____ / ____ / ____. Other __________________________________________________.
For more information, contact ______________________________ at ( )____-______ or at _____________________. (owner or operator) (phone number) (address) Please share this notice with all the other people who drink this water, especially those who may not have received this notice directly (for example, people in apartments, nursing homes, schools, and businesses). You can do this by posting this notice in a public place or distributing copies by hand or mail. This notice is sent to you by __________________________________________ Date Distributed ____ / ____ / ____.
Coliform Non-acute Public Notice Certification Form The purpose of this form (below) is to provide documentation to the department that public notice was distributed. Please check the appropriate box and fill in the date that the notice was distributed: Notice was mailed to all water customers on ____ / ____/____.
Notice was hand delivered to all water customers on ___ / ___ /___.
Notice was posted (with department approval) at:
____________________________________ on ___ / ___ /____.
____________________________________ ___________________ ____________________
Signature of owner or operator Position Date If you need this publication in an alternate format, call (800) 525-0127. For TTY/TDD call (800) 833-6388.
Send copy of completed notification and certification to:
Northwest Drinking Water Department of Health
20425 72nd Ave S, Suite 310 Kent, WA 98032-2358 Phone: (253) 395-6750
Fax: (253) 395-6760
Southwest Drinking Water Department of Health
PO Box 47823 Olympia, WA 98504-7823
Phone: (360) 236-3030 Fax: (360) 664-8058
Eastern Drinking Water Department of Health
16201 E Indiana Ave, Suite 1500 Spokane Valley, WA 99216
Phone: (509) 329-2100 Fax: (509) 329-2104
DOH Form 331-263 (Updated 08/10)

AVISO IMPORTANTE ACERCA DEL SISTEMA DE SUMINISTRO DE AGUA Las bacterias coliformes rebasaron el Nivel Máximo de Contaminación: NMC no agudo
El sistema de suministro de agua ______________, número (ID#) ________ en el condado de ____________ monitorea rutinariamente la presencia de bacterias coliformes totales. En la fecha ______________________, se encontró este tipo de bacteria. Aunque este incidente no es considerado una emergencia, como consumidor, Usted tiene el derecho a saber que pasó y que se ha hecho o se esta haciendo para corregir esta situación. Las bacterias coliformes se encuentran naturalmente en el medio ambiente y se usan como indicador de la posible presencia de otras bacterias que pueden causar daño a la salud. En las muestras tomadas, las bacterias se encontraron en mayor número que el permitido y esto es una indicación de posibles problemas. Las muestras con bacterias coliformes se analizaron con más detalle en el laboratorio para ver si bacterias coliformes fecales o E. Coli pudieran también haber estado presentes. Estas bacterias causan daño a la salud de las personas. No se encontró ninguna de estas bacterias. No es necesario que usted hierva el agua. Personas con un sistema inmunológico severamente comprometido, los recién nacidos y algunas personas de edad avanzada pueden tener mas riesgo de salud y deberían llamar a algún personal médico para mayor información. ¿Qué fue lo que pasó? ¿Cuál es la fuente de contaminación de la que se sabe o sospecha? En este momento: El problema esta resuelto. En muestras adicionales que se colectaron no se encontraron bacterias coliformes. Anticipamos resolver el problema el día ____/____/____. Otro __________________________________________________.
Para mayor información comuníquese con _______________ al teléfono ( ) ______-__ _____ o con __________________________ ___________________ _________________________ (dueño u operador) (teléfono) (dirección)
Pase esta información a todas las personas pudieran tomar agua de este suministro, especialmente aquellas personas que no hayan recibido este aviso (por ejemplo, personas que vivan en apartamentos, asilos de ancianos, escuelas y negocios.) Usted puede hacer esto colocando este aviso en un lugar público donde se pueda leer claramente o distribuyendo copias en persona o enviándolas por correo.
Este aviso es enviado a Usted por el Sistema de Suministro de Agua________________ fecha ___/___/____.

Ques t ions & Answers
Why must I boil my water? Recent tests show that your water system is contaminated with organisms that can cause illness.
Who can be affected? Can I become ill? Anyone who drinks contaminated water may become ill. Infants, young children, the elderly, and people with severely compromised immune systems are more at risk of illness.
Who are people with compromised immune systems? People who are on chemotherapy, organ or bone marrow recipients, those with HIV or AIDS, malnourished children, infants, and some of the elderly have compromised or weakened immune systems. An infection from a disease-causing organism may lead to very serious health problems for these people.
Can these diseases be spread in ways other than drinking the water? Yes. Many of these disease-causing organisms are shed in the feces of infected people. In fact, some infected people do not have any symptoms but still shed these organisms. Childcare workers, young children who attend childcare, and caregivers for people who are sick and shedding these organisms are at the greatest risk of becoming ill. Washing hands with soap and water after using the toilet and before preparing food prevents the spread of diseases to others.
What are the symptoms to watch for? What should I do if I think I have a waterborne illness? Disease-causing organisms in water can cause diarrhea, stomach cramps, bloating, gas, fatigue, weight loss, nausea, vomiting, and/or fever. Symptoms may appear as early as a few hours to several days after infection and may last more than two weeks. If you are ill with these symptoms, contact your health care provider.
How can I make the water safe? Boiling is the best way to ensure water is free of illness-causing organisms. Bring the water to a rolling boil for one minute. When it cools, refrigerate the water in clean covered containers.
If you don’t want to boil your water, you can disinfect the water using household bleach. Do not use bleach that contains perfume, dyes, or other additives. Use 1/4-teaspoon bleach per gallon of water, mix thoroughly, and then let stand for 60 minutes before using.
Public Health Advisory
Coliform Aug. 2013 DOH 331-179
Revised

For people with disabilities, this document is available on request in other formats. To submit a request, please call 1-800-525-0127 (TDD/TTY call 711).
Can I use bottled water? You can use purchased bottled water. If you choose to use bottled water, Department of Health recommends water that is:
Reverse-osmosis treated. Distilled. Filtered through an “absolute” one-micron or smaller filter.
Carbonated water in cans or bottles is usually filtered or heated to remove illness-causing organisms.
During a health advisory, can I use tap water for...? Drinking No Ice cubes No Brushing teeth No Baby’s formula No Washing vegetables/fruits No Preparing food No
Coffee or tea No Showers/Baths Yes Washing clothes Yes Baby’s bath See below Washing dishes See below Pet’s water bowl Contact Veterinarian
Can I bathe my baby or child using tap water? Yes, as long as they do not drink any of the water. Don’t let babies suck on a washcloth, as they will be ingesting some of the water.
Can I wash dishes? You can use your dishwasher if you use the sanitizing/heat cycle and commercial dishwashing detergent. You can hand wash dishes, rinse them in a diluted bleach solution—one teaspoon household bleach to one gallon of water—and then let dishes air dry.
What must be done to fix the problem? Fixing the problem could be different in each situation depending on whether the problem is at the water source or in the water lines. Usually, in every case the water lines will need to be flushed and the whole system will need to be disinfected using chlorine. The water will then be tested to make sure it is free of coliform bacteria.
How long will this health advisory be in effect? This health advisory will remain in effect until the water is tested and results show that it meets public health drinking water standards. Your water system will notify you when that occurs.
For more information: Personal medical questions: Contact your health care provider (physician, nurse consultant, etc.) Call your local health jurisdiction with general questions about infectious disease, communicable disease transmission, symptoms, causes and prevention of waterborne disease.

WARNING: Do not drink tap water without boiling it first!
Fecal coliform
E. coli bacteria
Other: _____________________________ were detected in the water supply on: (date) ___________________. Boiling kills bacteria and other organisms in the water:
Bring water to a rolling boil for one minute
Let water cool before using To avoid possible illness: use boiled or purchased bottled water for drinking, making ice, brushing teeth, washing dishes, and food preparation until further notice. Contact your doctor, if you experience one or more of these symptoms: nausea, cramps, diarrhea, jaundice, headache and/or fatigue. People with chronic illnesses, infants and the elderly may be at higher risk and should seek medical advice. Water System: _________________________ I.D.: __________________________________ County: ______________________________ Contact: ______________________________ Telephone: ____________________________ Date notice distributed: _________________ What is fecal coliform and E. coli? Fecal coliform and E. coli are bacteria whose presence indicates that the water may be contaminated with human or animal wastes. Microbes in these waters can cause short-term effects, such as diarrhea, cramps, nausea, headaches or other symptoms. They may pose a special health risk for infants, young children, some of the elderly, and people with severely compromised immune systems. How long will this warning be in effect? We will consult with the Washington State Department of Health about this incident. We will notify you when you no longer need to boil the water.
Vea al reverso para la versión en Español.
October 2008

ADVERTENCIA: ¡No tome el agua de la llave
sin antes hervirla!
Bacteria coliforme fecal
Bacteria E. coli
Otra: ______________________________ fueron encontradas en su sistema de agua: (el día)___________________. Hervir el agua mata a las bacterias y otros organismos en el agua:
Ponga el agua en la estufa hasta que hierva y deje hervir el agua por un minuto
Deje enfriar el agua antes de usarla Para evitar posibles enfermedades y hasta nuevo aviso: use agua hervida o agua potable embotellada para tomar, hacer hielo, limpiarse los dientes, lavar los platos y para preparar comidas. Hable con su doctor si usted tiene uno o más de los siguientes síntomas: náusea, dolor estomacal, diarrea, ictericia, dolores de cabeza y/o cansancio. La gente con enfermedades crónicas, bebés y personas mayores de edad, pueden estar en situación de alto riesgo y deben consultar con su médico o proveedores de servicios médicos. Sistema de agua: ______________________ I.D.: __________________________________ Condado: _____________________________ Contacto: _____________________________ Teléfono: _____________________________ Fecha de notificación: __________________ ¿Qué son las bacterias coliforme fecal y E. coli? Coliformes fecales o E. coli son bacterias cuya presencia indica que el agua esta contaminada con desechos humanos o de animales. Microbios de esos desechos pueden causar diarrea, dolor estomacal, náusea, dolores de cabeza u otros síntomas. Pueden representar un peligro para la salud de bebés, niños y niñas de corta edad y personas con sistemas inmunológicos en alto riesgo. ¿Por cuánto tiempo va a estar en efecto esta advertencia? Vamos a consultar con el Departamento de Salud del estado de Washington acerca de este incidente. Le vamos a notificar cuando ya no sea necesario hervir el agua.
See reverse side for English version.

Your logo or company name here.
News Release
For Immediate Release: <DATE> Contact: Water purveyor/system contact name and telephone number <Water System> announces boil water advisory for all customers in <area> CITY NAME The <SYSTEM NAME> is advising all water customers to boil their drinking
water after recent samples showed the presence of <fecal coliform, E. coli, total coliform>. The
Washington State Department of Health (DOH) has been notified and <SYSTEM NAME> is
working closely with the Office of Drinking Water to find the source of contamination and fix
the problem, which may include disinfecting the system. The boil water advisory will remain in
effect until further notice.
<System spokesperson quote> (e.g. “We are doing all we can to eliminate the bacteria from the
water system. Safe and reliable drinking water is critical to good health and responding to this
kind of emergency is our highest priority,” said system spokesperson.)
<NUMBER or NO> illnesses related to the community’s drinking water have been reported. To
correct the problem <WHAT IS BEING DONE> (e.g. Chlorine was applied to the entire system
on DATE.)
The boil water advisory includes several precautionary steps that customers should take. These
include using purchased treated bottled water or boiled water for any water that might be
consumed: drinking, brushing teeth, dishwashing, preparing food and making ice. Water should
come to a rolling boil for one minute, then allowed to cool before using.
The advisory will remain in effect until <SYSTEM NAME> and DOH are confident there is no
longer a threat of illness to their customers. Once satisfactory results are reported, customers will
be notified that the advisory has been lifted.
If you have any questions, please call us at <TELEPHONE NUMBER>.
###
06-22-11

Your logo or company name here
News Release
For Immediate Release: <DATE> Contact: Water purveyor/system contact name and telephone number
<Water System Name> Boil Water Advisory Rescinded
CITY NAME – The <SYSTEM NAME> is advising all its water customers that it is no longer
necessary to boil their drinking water. Recent test samples show the absence of <fecal coliform,
E. coli, total coliform> bacteria.
<SYSTEM SPOKESPERSON QUOTE> (e.g. “Working with the Washington State Department
of Health over the last <NUMBER OF > days, we have completed inspections, water quality
sampling, disinfection, and flushing to resolve the contamination problem,” stated <NAME OF
WATER SYSTEM MANAGER>. “We’re pleased to be able to lift the boil water advisory.”
The inspection of the water system indicated <DESCRIPTION OF SOURCE OF
CONTAMINATION, if known, and what will be done to maintain good water quality>
If you have shut off or not used fixtures, water fountains, ice machines, soda machines, and/or
other equipment over the past several days, flush the fixture or equipment until there is a change
in water temperature before putting it back into service.
The <SYSTEM NAME> encourages customers with questions to call <TELEPHONE
NUMBER>.
###
9-15-06

Nitrate Public Health Advisory Packet
Instructions for water systems
If you have nitrate sample results above the maximum contaminant level (MCL) of 10 milligrams per liter (mg/L), you must notify your customers within 24-hours after receiving the sample results. We developed this packet to help you respond when nitrate levels in your water supply exceed 10 mg/L. Templates and Forms DOH Pub. Publications DOH Pub.
Door Hanger (English and Spanish) 331-259-2 Nitrate in Drinking Water Questions & Answers (English) 331-214
News Release Template: Announcing the Nitrate Advisory 331-259-3 Nitrate in Drinking Water
Questions & Answers (Spanish) 331-214s
News Release Template: Rescinding the Nitrate Advisory 331-259-4 Nitrate Sampling Procedure
Brochure 331-222
Warning to Drinking Water Customers (English) 331-259-5
Office of Drinking Water authority over operators and water systems Fact Sheet
331-449
Warning to Drinking Water Customers (Spanish) 331-259-6 Drinking Water After-Hours
Emergency Hotline Brochure 331-133
Public Notice Certification Form: Nitrate MCL Violation 331-248
May 2010 DOH 331-259-1
Public Notification Templates and Forms Page 2 has information and instructions on using the
nitrate public notification templates and forms.

- 2 -
Templates and forms Public Notification: You can choose from two templates to provide public notice to your customers.
Door Hanger (331-259-2): English on one-side and Spanish on the other. o This public notice is a quick way to inform customers of contamination in the water. It
includes precautions they can take to protect themselves. o You can get door hangers from local health departments and our regional offices.
Warning to Drinking Water Customers: English (331-259-5) and Spanish (331-259-6).
This public notice provides detailed information about health effects and instructions for your customers.
Public Notice Certification Form Nitrate MCL Violation (331-248): You must complete this form and mail it to our regional office within 10 days after notifying your customers about a MCL violation. You must also send us a copy of the public notice you provided to your customers. News Releases: These templates have sample information we recommend you include in a news release. If you need help contacting the media, contact your regional office.
Announcing Nitrate Advisory (331-259-3): Notifies your customers of a nitrate advisory.
Rescinding Nitrate Advisory (331-259-4): Notifies your customers the nitrate advisory is over.
For more information
Contact our regional office:
Eastern Region: Spokane Valley (509) 329-2100 Northwest Region: Kent (253) 395-6750 Southwest Region: Tumwater (360) 236-3030
People with disabilities can request this publication in other formats. To submit a request, call (800) 525-0127. For TTY or TDD, call (800) 833-6388. Office of Drinking Water publications are online at http://www.doh.wa.gov/ehp/dw

PRINT ON WATER SYSTEM LETTERHEAD
News Release
For immediate release: DATE
Contact: Water System Manager or Spokesperson XXX-XXX-XXXX <WATER SYSTEM > Issues Drinking Water Warning to Customers Olympia, WA – The <WATER SYSTEM > is alerting its customers that recent drinking water tests have shown concentrations of nitrate that are higher than state standards allow. Pregnant women and infants younger than age one should not drink tap water until further notice. The <WATER SYSTEM > will provide <alternative source of drinking water> for individuals who believe they are at risk. This drinking water is available at <LOCATION>. Tap water from this system should not be used to make baby formula or juice. Boiling the water will not reduce the nitrate and, in fact, can make it more concentrated. Nitrate can only be removed from water by special treatment. Nitrate is a chemical found in most fertilizers, manure, and liquid waste discharged from septic tanks. Drinking water with high levels of nitrate can cause a severe illness in infants, commonly known as “blue baby” syndrome. This illness occurs when nitrate reduces the ability of red blood cells to carry oxygen. Symptoms can develop quickly, usually within a few days. After reaching about one year of age, infants develop systems in the body to handle the nitrate and they are no longer as much at risk. If an infant has bluish skin or lips and is short of breath, seek medical attention immediately. “Protecting people’s health is our highest priority. We are working closely with the <WATER SYSTEM > to identify treatment options or other improvements that can help restore the water to safe levels for the community,” said Denise Clifford, director of the Office of Drinking Water. In the meantime, people should use <alternative source of drinking water> to prepare baby food or formula, and infants and pregnant women should not drink tap water. People who know they have a blood enzyme deficiency that may make them susceptible to nitrate should also use an alternative source of drinking water. If in doubt, seek advice from a medical professional. This health advisory will remain in effect until the <WATER SYSTEM’S> water quality is safe. For more information, please call <WATER SYSTEM CONTACT PERSON> at (XXX) XXX-XXXX or (XXX) XXX-XXXX>.
###

PRINT ON WATER SYSTEM LETTERHEAD
News Release
For immediate release: DATE
Contact: Water System Manager or Spokesperson XXX-XXX-XXXX <WATER SYSTEM > Drinking water warning canceled OLYMPIA ⎯ The <WATER SYSTEM> is advising its customers that its tap water is now safe to drink
for all users, and can be used to make baby formula or juice. Recent test results confirm the level of
nitrate in the water supply is safe for drinking water.
On <DATE>, the <WATER SYSTEM> advised its customers that pregnant women and infants should
not drink the water due to high levels of nitrate, which can cause severe illness in babies.
<SYSTEM SPOKESPERSON QUOTE> (e.g., “It’s important to us to provide safe drinking
water to our customers,” said <NAME OF WATER SYSTEM MANAGER>. “We’ve worked
with the state Department of Health over the last (# of) days to complete water sampling, and the
lab results are now in the safe range for nitrate. We’re pleased to be able to lift the nitrate
advisory.”
If you have not used your water fixtures, fountains, ice machines, soda machines, or other
equipment over the past several days, flush each one until there is a change in water temperature
before putting it back into service.
The <SYSTEM NAME> encourages customers with questions to call <TELEPHONE
NUMBER>.
###

Warning to Drinking Water Customers
Your tap water is contaminated with nitrate. Do not give it to infants under 12 months old or other susceptible individuals. Do not use it to make formula or juice for infants.
What’s the problem?
The Water System, ID # , in County, received drinking water sample results on _____________ showing nitrate levels of_________mg/L. This level is above the 10 mg/L nitrate standard, or Maximum Contaminant Level (MCL), allowed by the State Board of Health Rules and Regulations. Nitrate in drinking water can come from natural, industrial, or agricultural sources (including septic systems and run-off). Levels of nitrate in drinking water can vary throughout the year. Most household water filtration systems will not remove nitrate. The main risk is to infants below the age of 12 months, who could become seriously ill and, if untreated, may die. Symptoms include shortness of breath and “blue baby syndrome,” indicated by blueness of the skin. Symptoms in infants can develop rapidly, with health deteriorating over a period of days. Other susceptible individuals include pregnant women and people with certain blood disorders. These individuals may wish to consult their doctor regarding risk of consuming high-nitrate water. Susceptible individuals should use an alternative source of drinking water until further notice.
Do’s and Don’ts• Adults (except pregnant women) and children
older than 12 months can drink the tap water. Nitrate is a problem for infants less than 12 months old because they can't process nitrate as well as adults can.
• Share this information with others who drink this water, especially those who may not have received this notice directly (for example, people in apartments, nursing homes, schools, and businesses). You can do this by posting this notice in a public place or delivering copies by hand.
• People with certain rare blood enzyme disorders which affect their ability to convert methemoglobin to hemoglobin (glucose-6-phosphate dehydrogenase (G6PD) or cytochrome b5 reductase deficiencies) should use another source of water until further notice.
• Don’t give the water to infants under 12 months old.
• Don’t use the water to make formula or juice for infants under 12 months old.
• If an infant shows signs of “blue baby syndrome” (bluish skin, shortness of breath) get medical attention immediately.
• If you are pregnant or think you may be, use another source of water until further notice.
• Don’t try to make the water okay by boiling it. Boiling, freezing, filtering, or letting water stand does not reduce nitrate levels. Excessive boiling can even make the nitrate more concentrated, because it stays behind as water evaporates.
What’s being done? Your water system is taking these corrective actions: For more information, contact _______________________ at ________________ This notice was sent to you by ______________________________________Water System on _______________

Instructions to water systems for notifying customers about nitrate violations
1. You must tell your customers about a nitrate violation within 24 hours of being notified that a nitrate MCL violation has occurred. Use
the “Warning to Drinking Water Customers” on the other side of this notice as your basic template for public notification.
2. Call the Department of Health (DOH) within 24 hours of receiving a laboratory result that shows a nitrate MCL exceedance has occurred.
If you have been notified of a nitrate MCL exceedance and have not yet consulted with DOH, do so immediately.
3. DOH will help you decide how best to distribute this notice to all of your customers. Call your DOH Regional Office (see information
below) and fill out all sections of this notice. Copy the other side and deliver the notice to your customers by the method indicated by
DOH.
4. You must provide an alternative source of drinking water to customers who request it. The water must be from an approved public water
supply or source and be distributed at a convenient location. Examples: A filling station for containers provided by the customer, bottled
water, or coupons to purchase bottled water from a local merchant. One-and-a-half (1.5) gallons of water per person per day should be
provided for drinking only. Your regional office can help you with technical questions related to providing an alternative source of
drinking water for your customers.
5. You should let your customers know what they need to do if they wish to receive an alternative source of drinking water. Use the space
provided under the heading “What’s Being Done?” to give details related to how and where you are providing an alternative source of
drinking water. An example would be “Contact John Doe at (555) 555-5555 if you would like an alternative source of water until sample
results are below the MCL.”
6. In your notice, under the heading “What’s Being Done?”, also describe corrective actions you are taking. The following sentence gives an
example of one action commonly taken by water systems that have nitrate violations. Use this sentence if it is true for your situation, or
develop your own language.
“We are investigating water treatment options, such as drilling a new well, mixing the water with low-nitrate
water from another source, or buying water from another water system.”
7. Within 10 days of delivering this notice to your customers, send a copy of each type of notice that you distributed (hand-delivered form,
newspaper article, etc.) and a signed “Public Notice Certification Nitrate MCL Violation” form (#331-248) to your appropriate DOH
Regional Office. This documentation is a mandatory requirement and must be completed.
DOH REGIONAL OFFICE INFORMATION
Eastern Regional Office: 16201 E Indiana Ave, Suite 1500, Spokane Valley WA 99216; Main Office (509) 329-2100. Jurisdiction: Adams, Asotin, Benton, Chelan, Columbia, Douglas, Ferry, Franklin, Garfield, Grant, Kittitas, Klickitat,
Lincoln, Okanogan, Pend Oreille, Spokane, Stevens, Whitman, Walla Walla and Yakima Counties.
Northwest Regional Office: 20435 72nd Ave S., Suite 200, Kent WA 98032; Main Office (253) 395-6750. Jurisdiction: Island, King, Pierce, San Juan, Skagit, Snohomish and Whatcom Counties.
Southwest Regional Office: 243 Israel Road SE, Tumwater, PO Box 47823, Olympia WA 98504; Main Office (360) 236-3030. Jurisdiction: Clallam, Clark, Cowlitz, Grays Harbor, Jefferson, Kitsap, Lewis, Mason, Pacific, Skamania,
Thurston, and Wahkiakum Counties.
1/6/10

Advertencia a los clientes de agua potable El agua de la llave que usted toma está contaminada con Nitrato. No dé el agua a los bebés menores de 12 meses de edad ni a otras personas vulnerables. No la utilice para preparar fórmula (biberón) ni jugo para
los bebes menores de 12 meses.
¿Qué es el problema? El sistema de agua de , con número de identificación , en el Condado de , recibió los resultados de la prueba de agua potable el _____________ que muestran niveles de nitrato de _________mg/L. Este nivel está por encima del Nivel Máximo de Contaminación de 10 mg/L de nitrato o (MCL), que permite el Consejo Estatal de Reglas y Normas de Salud (State Board of Health Rules and Regulations).
El nitrato en el agua potable puede provenir de fuentes naturales, industriales o agrícolas (incluyendo sistemas sépticos y escurrimiento). Los niveles de nitrato en el agua potable pueden variar a lo largo del año. La mayoría de los sistemas de filtración de agua para el hogar no removerán el nitrato.
El riesgo principal es para los bebés menores de 12 meses de edad, quienes podrían enfermarse gravemente y, si no se los trata, podrían morir. Los síntomas incluyen la dificultad de respirar y el “síndrome del bebé azul”, evidente por un color azul en la piel. Los síntomas en los bebés pueden desarrollarse rápidamente, con el deterioro de la salud durante un período de días. Las mujeres embarazadas también tienen riego y a las personas con ciertos trastornos en la sangre. Es recomendable consultar a su doctor con respecto al riesgo de consumir agua con un nivel alto de nitrato. Los individuos susceptibles deben utilizar una fuente alternativa de agua potable hasta nuevo aviso.
Cosas que se deben y no se deben hacer• Los adultos (excepto las mujeres embarazadas) y los
niños mayores de 12 meses de edad pueden beber el agua. El nitrato es un problema para los bebés con menos de 12 meses de edad, debido a que ellos no pueden procesar el nitrato igual que los adultos.
• Comparta esta información con otros que beben el agua, especialmente con aquellos que no han podido recibir este aviso directamente (por ejemplo, las personas que viven en apartamentos, hospicios para ancianos, escuelas y negocios). Puede hacerlo colocando este aviso en un lugar público o entregando copias en persona.
• Las personas con ciertos trastornos raros de enzimas en la sangre que afecta su capacidad de convertir la metahemoglobina en hemoglobina (deficiencias de glucosa-6-fosfato dehidrogenasa (G6PD) o citocromo b5 reductasa deben usar otra fuente de agua hasta nuevo aviso.
• No dé el agua a los bebés menores de 12 meses de edad.
• No use el agua para preparar fórmula (biberón) ni jugo para los niños menores a 12 meses de edad.
• Si algún niño muestra signos de “síndrome de bebé azul” (piel azulada, dificultad de respirar) obtenga atención médica inmediatamente.
• Si está embarazada o cree que lo está, use otra fuente de agua hasta nuevo aviso.
• No trate de mejorar el agua haciéndola hervir. Hirviendo, congelando, filtrando, o dejando a reposar el agua no reduce los niveles de nitrato. Hervir el agua excesivamente puede hacer incluso que el nitrato sea más concentrado a medida que el agua se evapora.
¿Qué se está haciendo?
Su sistema de agua está tomando las siguientes acciones correctivas:
Para obtener mas información, llame a ____________________________ al número ________________
Este aviso le fue enviado por el Sistema de Agua _____________________________________Fecha _______________

Instructions to water systems for notifying customers about nitrate violations
1. You must tell your customers about a nitrate violation within 24 hours of being notified that a nitrate MCL violation has occurred. Use
the “Warning to Drinking Water Customers” on the other side of this notice as your basic template for public notification.
2. Call the Department of Health (DOH) within 24 hours of receiving a laboratory result that shows a nitrate MCL exceedance has occurred.
If you have been notified of a nitrate MCL exceedance and have not yet consulted with DOH, do so immediately.
3. DOH will help you decide how best to distribute this notice to all of your customers. Call your DOH Regional Office (see information
below) and fill out all sections of this notice. Copy the other side and deliver the notice to your customers by the method indicated by
DOH.
4. You must provide an alternative source of drinking water to customers who request it. The water must be from an approved public water
supply or source and be distributed at a convenient location. Examples: A filling station for containers provided by the customer, bottled
water, or coupons to purchase bottled water from a local merchant. One-and-a-half (1.5) gallons of water per person per day should be
provided for drinking only. Your regional office can help you with technical questions related to providing an alternative source of
drinking water for your customers.
5. You should let your customers know what they need to do if they wish to receive an alternative source of drinking water. Use the space
provided under the heading “What’s Being Done?” to give details related to how and where you are providing an alternative source of
drinking water. An example would be “Contact John Doe at (555) 555-5555 if you would like an alternative source of water until sample
results are below the MCL.”
6. In your notice, under the heading “What’s Being Done?”, also describe corrective actions you are taking. The following sentence gives an
example of one action commonly taken by water systems that have nitrate violations. Use this sentence if it is true for your situation, or
develop your own language.
“We are investigating water treatment options, such as drilling a new well, mixing the water with low-nitrate
water from another source, or buying water from another water system.”
7. Within 10 days of delivering this notice to your customers, send a copy of each type of notice that you distributed (hand-delivered form,
newspaper article, etc.) and a signed “Public Notice Certification Nitrate MCL Violation” form (#331-248) to your appropriate DOH
Regional Office. This documentation is a mandatory requirement and must be completed.
DOH REGIONAL OFFICE INFORMATION
Eastern Regional Office: 16201 E. Indiana Ave., Suite 1500, Spokane Valley, WA 99216; Main Office (509) 329-2100. Jurisdiction: Adams, Asotin, Benton, Chelan, Columbia, Douglas, Ferry, Franklin, Garfield, Grant, Kittitas, Klickitat,
Lincoln, Okanogan, Pend Oreille, Spokane, Stevens, Whitman, Walla Walla and Yakima Counties.
Northwest Regional Office: 20435 72nd Ave S., Suite 200, Kent WA 98032; Main Office (253) 395-6750. Jurisdiction: Island, King, Pierce, San Juan, Skagit, Snohomish and Whatcom Counties.
Southwest Regional Office: 243 Israel Road SE, Tumwater, PO Box 47823, Olympia WA 98504; Main Office (360) 236-3030. Jurisdiction: Clallam, Clark, Cowlitz, Grays Harbor, Jefferson, Kitsap, Lewis, Mason, Pacific, Skamania,
Thurston, and Wahkiakum Counties.
1/6/10

PUBLIC NOTICECERTIFICATION FORMNITRATE MCL VIOLATION
Within 10 days of notifying your customers, you are required to send this completed form and a copy of each typeof notice you distributed (hand-delivered notices, press releases, newspaper articles, etc.) to the appropriate Officeof Drinking Water Regional Office (see address below). This form certifies that you have met all public notificationrequirements. If chemical contamination remains for more than three months, you must notify your water usersagain and provide another Public Notice Certification Form to the Department of Health.
With this certification, you are also stating that you will meet future requirements for notifying new billing unitsof the violation or situation.
Water System: __________________________________________ID #: __________County:_______________
Violation Date:_____ / _____ / _____ Violation Type:_____________________________________________
This public water system certifies that public notice has been given to water users followingstate and federal requirements for delivery, content, and deadlines.
Complete the following items:
Yes No
Distribution was completed on ___ / ___ /____. Check all that apply: Hand delivery, Press release (TV, radio, newspaper, etc.), Posting at_________________________ (by DOH approval only), Other ____________________________ (by DOH approval only).
Were the water users notified within 24 hours?
______________________________________________ ___________________ ____________________Signature of owner or operator Position Date
Northwest Regional Office:20425 72nd Ave. S., Suite 310,Kent WA 98032Main Office: 253-395-6750Fax: 253-395-6760
Area of Coverage: Island, King, Pierce,San Juan, Skagit, Snohomish, andWhatcom Counties
Southwest Regional Office:243 Israel Road SE, TumwaterPO Box 47823, Olympia WA 98504Main Office: 360-236-3030Fax: 360-664-8058
Area of Coverage: Clallam, Clark,Cowlitz, Grays Harbor, Jefferson,Kitsap, Lewis, Mason, Pacific,Skamania, Thurston, and WahkiakumCounties.
Eastern Regional Office:16201 East Indiana Ave., Suite 1500,Spokane Valley WA 99216Main Office: 509-329-2100Fax: 509-329-2104
Area of Coverage: Adams, Asotin,Benton, Chelan, Columbia, Douglas,Ferry, Franklin, Garfield, Grant,Kittitas, Klickitat, Lincoln, Okanogan,Pend Oreille, Spokane, Stevens,Walla Walla, Whitman, and YakimaCounties.
For people with disabilities, this document is available on request in other formats. To submit a request, please call1-800-525-0127 (TDD/TTY call 711).
DOH Form 331-248 (Updated 10/13)

Warning to Drinking Water Customers
Your tap water is contaminated with nitrate.
Do not give it to infants under 12-months-old or use it to
make formula or juice for infants. Nitrate samples collected on ________________ show nitrate levels that exceed the State Board of Health Standard of 10 milligrams per liter (mg/L). The main health risk is to infants below the age of 12 months, who could become seriously ill and, if untreated, may die. The main symptoms are shortness of breath or blueness of the skin. These symptoms can develop rapidly. Other susceptible individuals include pregnant women and people with certain blood disorders. These individuals should use an alternative source of drinking water until further notice.
To Avoid Possible Illness:
• DO NOT give tap water to infants under 12
months of age or use it to make formula or juice.
• DO NOT try to treat the water by boiling it.
Nitrate stays in water after boiling. • If an infant shows signs of “blue baby
syndrome” (bluish skin, difficulty breathing) get medical attention immediately.
• If you are, or think you may be susceptible to
nitrate, consult your doctor or use an alternative source of drinking water.
• Please share this information with others who
drink this water and may not have received this notice directly (people in apartments, nursing homes, schools, businesses, etc.)
This advisory will remain in effect until additional samples show nitrate at acceptable levels. We will notify you when this happens. For more information on nitrate in drinking water, and what is being done regarding this incident, please contact us. Water System ___________________________ ID#_____________County_________________ Contact ________________________________ Phone _________________________________ Date notice distributed ____________________
Vea al reverso para la versión en Español.
Warning to Drinking Water Customers
Your tap water is contaminated with nitrate.
Do not give it to infants under 12-months-old or use it to
make formula or juice for infants. Nitrate samples collected on ________________ show nitrate levels that exceed the State Board of Health Standard of 10 milligrams per liter (mg/L). The main health risk is to infants below the age of 12 months, who could become seriously ill and, if untreated, may die. The main symptoms are shortness of breath or blueness of the skin. These symptoms can develop rapidly. Other susceptible individuals include pregnant women and people with certain blood disorders. These individuals should use an alternative source of drinking water until further notice.
To Avoid Possible Illness:
• DO NOT give tap water to infants under 12
months of age or use it to make formula or juice.
• DO NOT try to treat the water by boiling it.
Nitrate stays in water after boiling. • If an infant shows signs of “blue baby
syndrome” (bluish skin, difficulty breathing) get medical attention immediately.
• If you are, or think you may be susceptible to
nitrate, consult your doctor or use an alternative source of drinking water.
• Please share this information with others who
drink this water and may not have received this notice directly (people in apartments, nursing homes, schools, businesses, etc.)
This advisory will remain in effect until additional samples show nitrate at acceptable levels. We will notify you when this happens. For more information on nitrate in drinking water, and what is being done regarding this incident, please contact us. Water System __________________________ ID# ____________ County ________________ Contact________________________________ Phone_________________________________ Date notice distributed ____________________
Vea al reverso para la versión en Español.

Advertencia Para Usuarios De Agua Potable
El agua del grifo está contaminada con nitrato.
No se la dé a bebés menores de 12 meses ni la utilice para
preparar fórmula o jugo para bebés. Las muestras de nitrato tomadas el _____________ indican niveles de nitrato que superan la norma de 10 miligramos por litro (mg/L) establecida por el Consejo de Salubridad del Estado. El riesgo más importante lo corren los bebés menores de 12 meses, quienes podrían enfermarse de gravedad e incluso morir si no reciben tratamiento. Los síntomas principales son la falta de aliento o la piel azulada. Estos síntomas pueden presentarse con rapidez. También corren riesgo las mujeres embarazadas y las personas con ciertos trastornos de la sangre. Estos individuos deben usar una fuente alternativa de agua potable hasta que se indique lo contrario.
Para Evitar Una Posible Enfermedad: • NO dé agua del grifo a los bebés menores de 12
meses, ni la utilice para preparar fórmula infantil o jugo.
• NO trate de purificar el agua hirviéndola. El
hervir agua no elimina los nitrato. • Si un bebé presenta síntomas del “síndrome
del bebé azul” (piel azulada, dificultad para respirar) busque atención médica inmediatamente.
• Si usted es susceptible al nitrato o piensa que
lo podría ser, consulte con su médico o utilice otra fuente de agua potable.
• Comparta esta información con otras personas
que toman esta agua y que tal vez no hayan recibido este aviso directamente (residentes de apartamentos, hogares de ancianos, escuelas, negocios, etc.)
Esta advertencia permanecerá en vigor hasta que se tomen muestras adicionales que indiquen que el nivel de nitrato es aceptable. Le informaremos cuando esto suceda. Para información adicional acerca de los nitrato en el agua potable y lo que se está haciendo con respecto a este incidente, póngase en contacto con nosotros. Sistema de agua___________________________ No. de ID _________ Condado ______________ Contacto _________________________________ Teléfono _________________________________ Fecha de distribución del aviso _______________
See reverse side for English version.
Advertencia Para Usuarios De Agua Potable
El agua del grifo está contaminada con nitrato.
No se la dé a bebés menores de 12 meses ni la utilice para
preparar fórmula o jugo para bebés. Las muestras de nitrato tomadas el _____________ indican niveles de nitrato que superan la norma de 10 miligramos por litro (mg/L) establecida por el Consejo de Salubridad del Estado. El riesgo más importante lo corren los bebés menores de 12 meses, quienes podrían enfermarse de gravedad e incluso morir si no reciben tratamiento. Los síntomas principales son la falta de aliento o la piel azulada. Estos síntomas pueden presentarse con rapidez. También corren riesgo las mujeres embarazadas y las personas con ciertos trastornos de la sangre. Estos individuos deben usar una fuente alternativa de agua potable hasta que se indique lo contrario.
Para Evitar Una Posible Enfermedad: • NO dé agua del grifo a los bebés menores de 12
meses, ni la utilice para preparar fórmula infantil o jugo.
• NO trate de purificar el agua hirviéndola. El
hervir agua no elimina los nitrato. • Si un bebé presenta síntomas del “síndrome
del bebé azul” (piel azulada, dificultad para respirar) busque atención médica inmediatamente.
• Si usted es susceptible al nitrato o piensa que
lo podría ser, consulte con su médico o utilice otra fuente de agua potable.
• Comparta esta información con otras personas
que toman esta agua y que tal vez no hayan recibido este aviso directamente (residentes de apartamentos, hogares de ancianos, escuelas, negocios, etc.)
Esta advertencia permanecerá en vigor hasta que se tomen muestras adicionales que indiquen que el nivel de nitrato es aceptable. Le informaremos cuando esto suceda. Para información adicional acerca de los nitrato en el agua potable y lo que se está haciendo con respecto a este incidente, póngase en contacto con nosotros. Sistema de agua___________________________ No. de ID__________ Condado ______________ Contacto _________________________________ Teléfono _________________________________ Fecha de distribución del aviso________________
See reverse side for English version.

DO NOT DRINKWater Contaminated with Nitrate- Unsafe for Pregnant Women and Infants -
•Do not use for drinking if you are pregnant.
•Do not use to mix/dilute baby formula.
For more information, _____________________
_______________________________________
Si usted esta embarazada, no beba el agua.
No use el agua para preparar la fórmula para
bebés (biberón).

APPENDIX L
COLIFORM MONITORING PLAN
CITY OF OAK HARBOR
COLIFORM MONITORING PLAN
CITY OF OAK HARBOR WATER DIVISION
865 SE BARRINGTON DRIVE OAK HARBOR, WA 98277

CITY OF OAK HARBOR
COLIFORM MONITORING PLAN
TABLE OF CONTENTS
SYSTEM INFORMATION PAGE: 1 SAMPLING INFORMATION PAGE: 2 SYSTEM MAP PAGE: 3 PLAN PREPERATION / MAINTENANCE PAGE: 4 COLIFORM MONITORING TABLE CHANGE OF INFORMATION DOCUMENTATION APPENDIX

COLIFORM MONITORING PLAN
WATER SYSTEM NAME
City of Oak Harbor
COUNTY
Island
SYSTEM I.D. NUMBER
62650C
WATER SOURCES
S01
Anacortes (purchased)
S11
Well #8
S12
Well #9
S14
Well #11
STORAGE 3 reservoirs totaling 3,125,000 gallons
INTERTIES
3 interties with the U.S. Navy
PRESSURE ZONES & STATIONS 3 pressure zones are influenced by 2 booster pump stations and 5 PRV stations
MAINLAND PRESSURE
ZONE 4,475 connections
WESTSIDE PRESSURE
ZONE 323 connections
REDWING PRESSURE
ZONE 162 connections
DOWNTOWN PRESSURE
ZONE 895 connections
POPULATION SERVED
18,880
TREATMENT Fluoride is injected at the mainland booster pump station
and at the 3 well sites. Chlorine is injected at the 3 well sites.
Page: 1

Sampling Information
The City of Oak Harbor is required to take 20 routine samples monthly. The following indicates the routine and repeat sample locations.
MAINLAND PRESSURE ZONE
SAMPLE NUMBER **
ROUTINE SAMPLE SITE
REPEAT UPSTREAM
REPEAT DOWNSTREAM
3 2485 SW Talon Loop 2419 SW Talon Loop 2525 SW Talon Loop 4 3290 SW Balda Road 3186 SW Scenic Heights 3367 SW Balda Road 5 1756 SW 17th Avenue 1710 SW 17th Avenue 1772 SW 17th Avenue 6 881 SW Quinault St. 805 SW Quinault St. 911 SW Quinault St. 8 901 NW Prow Street 929 NW Prow Street 865 NW Prow Street 9 624 NW Hyak Drive 640 NW Hyak Drive 613 NW Hyak Drive 10 2866 N Oak Harbor Rd 2858 N Oak Harbor Rd 2930 N Oak Harbor Rd 11 642 NE Harvest Drive 660 NE Harvest Drive 525 NE Harvest Drive 12 751 NW 1st Aveneue 747 NW 1st Avenue 775 NW 1st Avenue 13 984 SW 6th Ave. 900 SW 6th Ave. 1041 SW 6th Ave. 14 701 SW Barrington Dr 697 SW Barrington Dr 735 SW Barrington Dr 18 220 NE Nunan Lp #1 250 NE Nunan Loop #1 180 NE Nunan Lp #1 19 1166 NE Taftson Street 1188 NE Taftson Street 1224 NE Taftson Street 20 33860 SR 20 33650 SR 20 34100 SR 20
WESTSIDE PRESSURE ZONE
SAMPLE NUMBER **
ROUTINE SAMPLE SITE
REPEAT UPSTREAM
REPEAT DOWNSTREAM
7 2090 SW Putnam Dr. 2080 SW Putnam Dr. 2095 SW Putnam Dr.
DOWNTOWN PRESSURE ZONE
SAMPLE NUMBER **
ROUTINE SAMPLE SITE
REPEAT UPSTREAM
REPEAT DOWNSTREAM
1 931 SE Jensen St. 901 SE Jensen St. 961 SE Jensen St. 2 1974 SW Dillard Lane 1950 SW Dillard Lane 2000 SW Dillard Lane 15 231 SW 8th Avenue 255 SW 8th Avenue 167 SW 8th Avenue 16 372 SE Fisher Court 330 SE Fisher Court 398 SE Fisher Court 17 950 SE Regatta Drive 849 SE Regatta Drive 1085 SE Regatta Drive
** - Number corresponds with map.
Page: 2

PLAN PREPERATION INFORMATION Prepared by: Rich Tyhuis, Water Distribution Manager III (cert. #1726)
Operations Manager, Water Division Day time phone number: (360) 240-4753 Prepared on: April 10, 2013 Last review: April PLAN MAINTENANCE
The Water Operations Manager, or his or her designee, shall maintain the plan. The Water Operations Manager, or his or her designee, shall approve any
changes to the Coliform Monitoring Plan with a memo indicating the plan changes, reason for the change, and date of the change.
All change documentation will be attached to the plan, and will include the revision date.
The master copy of the Coliform Monitoring Plan shall be located in the front office of the City of Oak Harbor Public Works Facility.
o Copy with the Operations Manager of the Water Division. o Copy with the Water Operations crew who perform the required
sampling.
Page: 4

TIP: Your Coliform Monitoring Plan should have most of the information you need to submit a triggered source water monitoring plan.
Groundwater Rule Group A Public Water Supplies – Chapter 246-290 WAC
The Groundwater Rule (GWR) builds on the Total Coliform Rule (TCR) by addressing the health risks of fecal contamination in groundwater sources used by a public water system.
Who is affected? The GWR applies to all Group A public water systems that:
Rely entirely on one or more groundwater sources.
Receive finished groundwater from another public water system.
Mix surface water sources (or groundwater under the direct influence of surface water) with groundwater. Systems that combine all of their surface water and groundwater sources before treatment are exempt from the GWR.
How does the rule affect them? The basic requirements of the Groundwater Rule include source water monitoring (triggered and assessment), compliance monitoring, sanitary surveys, corrective actions, and public notification.
Source Water Monitoring Triggered Source Water Monitoring is required when one of your system’s routine distribution samples collected under the TCR is total coliform positive. Within 24 hours of notification of the total coliform positive result, you must collect triggered source samples and have them tested for E. coli. You must test each source (prior to treatment) that was in operation when you collected the routine sample. If one of your triggered source samples is E. coli-positive, we will direct you to either take corrective action or take five additional source samples within 24 hours. If any of the five additional source samples is E. coli-positive, you must take corrective actions described on pages 3 and 4. If you have more than one groundwater source, you may be able to reduce the number of source samples you must collect by submitting a triggered source water monitoring plan.
February 2013 DOH 331-447
Updated

- 2 -
4-log Treatment Systems that provide 4-log treatment of viruses can avoid taking triggered source water monitoring samples by conducting compliance monitoring. You must let us know that you intend to exercise this option.
Your triggered source monitoring plan should be in your coliform monitoring plan (CMP). The CMP must include a system map that clearly identifies each source, routine coliform monitoring location, and any distribution system features that help to identify the source associated with each sample location (such as pressure zones and isolation valves). The Department of Health must approve this plan. Assessment Source Water Monitoring may be required on a case-by-case basis to evaluate sources that may be at risk for fecal contamination. This usually requires you to collect one source sample per month and have it tested for E. coli. We will work with you to determine how long you should sample and if any further action is required based on your results. Other Source Monitoring Details Small Systems: If your system serves 1,000 people or fewer and you have to collect a triggered source water sample, you can use this sample as both a triggered source water sample AND a repeat sample to meet the requirements of the Total Coliform Rule. In this case, an E. coli-positive source water sample would result in an acute coliform MCL violation under the Total Coliform Rule.
Consecutive and Wholesale Systems: Consecutive systems (systems that purchase water) that receive total coliform positive sample results from a routine distribution sample must notify their wholesaler (the system selling the water) within 24 hours.
The wholesale system is required to sample all of their sources that were in operation on the date the consecutive system’s positive routine sample was collected. There may be exceptions to this monitoring, so we encourage wholesale systems to contact us as soon as they get notice from a consecutive system.
Sample Location and Size: You must collect all source water samples at the source prior to treatment. If you are unable to meet these conditions, contact us to request an alternative sample location. All E. coli samples must be at least 100 milliliters (mL) and analyzed by an accredited laboratory using EPA-approved methods.
Compliance Monitoring Compliance monitoring confirms the effectiveness and reliability of your system’s treatment. If you provide 4-log treatment of viruses AND perform compliance monitoring, you won't have to meet the triggered source water monitoring requirements. The Department of Health must approve your 4-log treatment system. For chemical disinfection, you must monitor the residual concentration daily before the first customer during peak flow, and continuously monitor if you serve more than 3,300 people. Your tests must confirm you are providing a chlorine residual high enough to maintain 4-log treatment. The Department of Health must approve membrane and alternative treatment technologies, and you must follow our specifications for operations and maintenance.

- 3 -
You will be in violation if you fail to monitor, report, or provide adequate treatment. At a minimum, you must send public notification to your customers. Systems providing 4-log treatment that is not the result of a corrective action or state mandate may choose to do triggered source water monitoring instead of compliance monitoring. For more information on 4-log treatment or if you provide disinfection and are not sure if it meets 4-log inactivation, contact our regional office (see Page 5).
Sanitary Surveys and Corrective Actions The GWR increases the required frequency of sanitary surveys for community water systems from once every 5 years to once every 3 years. A community water system may be allowed to stay on a 5-year schedule if it meets one of the following criteria:
1. Provides 4-log treatment of viruses for all groundwater sources.
2. Has no total coliform MCL violations, has no more than one total coliform monitoring violation since the last survey, and has no unresolved significant deficiencies in the current survey.
For information on sanitary surveys, visit us online at http://www.doh.wa.gov/CommunityandEnvironment/DrinkingWater/RegulationandCompliance/SanitarySurveys.aspx The GWR requires you to take corrective action when you have a significant deficiency or when a source water sample is E. coli-positive. A significant deficiency is “a defect in the design, operation, or maintenance, or a failure or malfunction of the sources, treatment, storage, or distribution system that the Department of Health determines to be causing, or have the potential for causing, the introduction of contamination into the water delivered to consumers.” If left unaddressed, a significant deficiency could cause a health risk to your customers. These deficiencies can occur at any time, but are most often detected during a sanitary survey. Corrective actions can involve one or more of the following:
Correct all significant deficiencies. Provide an alternative source of water.
Eliminate the source of contamination.
Provide 4-log treatment. Your sanitary survey report will identify any deficiencies you need to address. If the report doesn’t identify specific actions needed to correct the problem, you must contact us within 30 days to determine corrective actions. Your system has 45 days either to complete corrective actions or to comply with a corrective action plan.

- 4 -
Public Notification Several situations and violations in the Groundwater Rule require public notification. This table outlines these violations, the type of water system the violation applies to, and the type of notification required:
Issue Notification Required System Type
E. coli-positive groundwater source sample1 Tier 1 PN, CCR, Special Notification
Community and Noncommunity
Failure to take corrective action within 120 days of notification
Tier 2 PN, CCR, Special Notification
Community and Noncommunity
Failure to maintain at least 4-log treatment of viruses Tier 2 PN, CCR Community and
Noncommunity
Failure to meet monitoring requirements Tier 3 PN, CCR Community and Noncommunity
Uncorrected significant deficiency2 Special Notice in CCR Community
Special Notice Noncommunity
Unaddressed E. coli-positive groundwater source sample3 Special Notice in CCR Community
1. Consecutive systems served by the groundwater source must also notify the public. 2. Systems must continue to notify the public annually until they correct the significant deficiency. 3. Community systems must put a notice in the CCR annually until they address the positive source water sample.
Systems that receive an E. coli-positive result in a source water sample must notify their customers within 24 hours of getting their results. Wholesale systems that receive E. coli-positive results must notify all their customers and the consecutive systems that receive their water within 24 hours. The consecutive system must then notify all of their customers within 24 hours after receiving notification from the wholesale system. It is important to contact us as soon as possible if you receive an E. coli-positive sample result. For more information on public notification requirements and resources, visit us online at http://www.doh.wa.gov/CommunityandEnvironment/DrinkingWater/DrinkingWaterEmergencies/PublicNotification.aspx

- 5 -
Resources EPA developed several guidance documents and fact sheets to assist water systems with the requirements of the rule:
Compliance Help—includes quick reference guides, fact sheets, and full guidance manuals: http://www.epa.gov/safewater/disinfection/gwr/compliancehelp.html
Basic Information—includes several questions and answers: http://www.epa.gov/safewater/disinfection/gwr/basicinformation.html
The Office of Drinking developed the following publication to help you:
Groundwater Rule: Source Water Sample Taps (DOH 331-436): http://www.doh.wa.gov/portals/1/Documents/pubs/331-436.pdf
For more information Staff from our regional offices can provide technical assistance, especially with source water sampling and E. coli-positive results. Please contact them at:
Northwest Regional Office—Kent Coliform Program: 253-395-6775 Main Office: 253-395-6750
Southwest Regional Office—Tumwater Coliform Program: 360-236-3044 Main Office: 360-236-3030
Eastern Regional Office—Spokane Valley Coliform Program: 509-329-2134 Main Office: 509-329-2100
If you need this publication in an alternate format, call 800-525-0127. For TTY/TDD, call 800-833-6388.

APPENDIX M
WATER QUALITY DATA


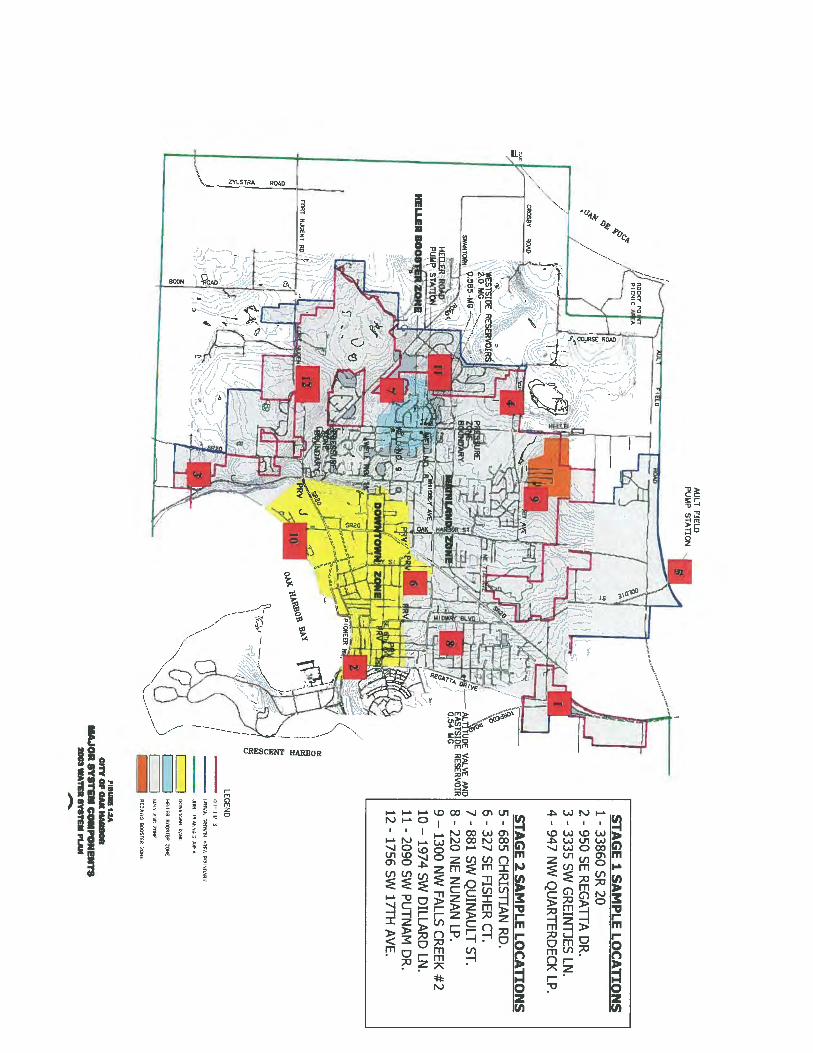


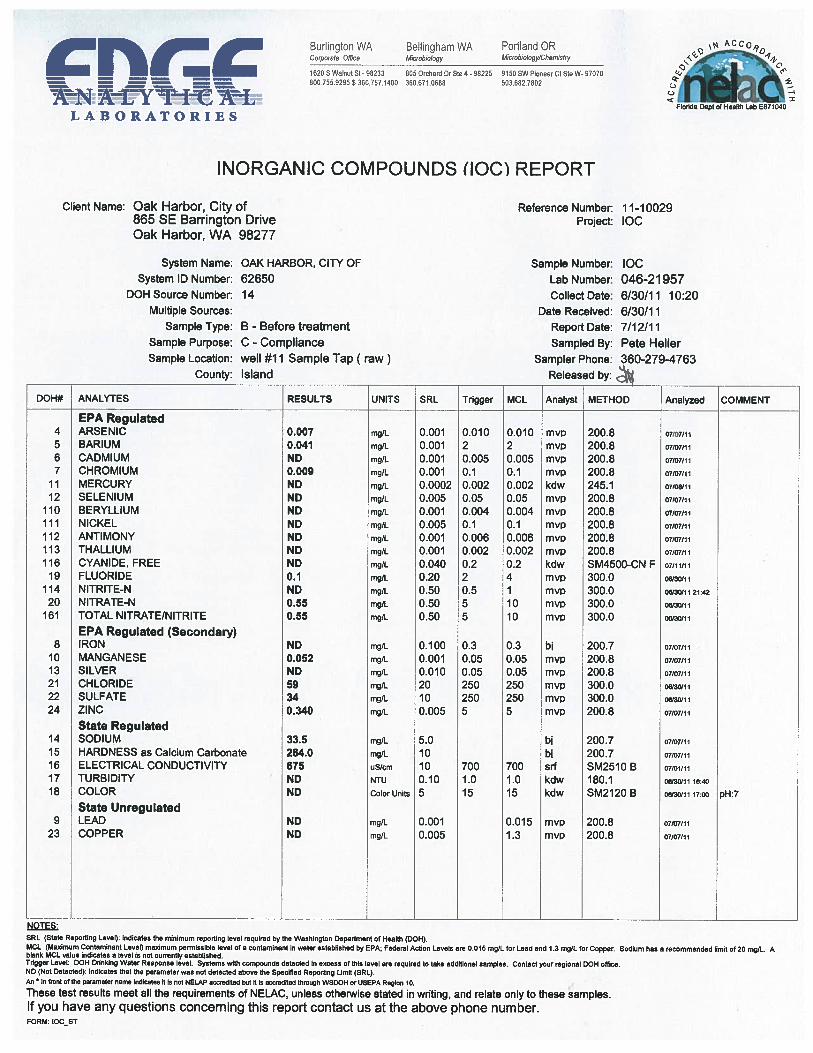


APPENDIX N
WATER QUALITY MONITORING PLAN


APPENDIX O
HYDRAULIC MODEL RESULTS

City of Oak Harbor 2013 Maximum Day DemandWater System Plan Fire Flow ScenarioNovember 2013 Existing System
Node ID
StaticDemand
(gpm)
StaticPressure
(psi)
Min. Fire FlowRequirement
(gpm)
ResidualPressure atRequired FF
(psi)
Min. SystemPressure atRequired FF
(psi)CriticalNode
CriticalPipe
Available Floww/ VelocityLimitations
(gpm)
FF Deficiencybased on
Velocity (gpm)
Available Floww/ PressureLimitations
(gpm)
FF Deficiencybased on
Pressure (gpm)10 2.43 82 1,000 76 27 718 17 2,487 0 2,998 012 2.43 76 1,000 70 27 718 19 3,176 0 2,999 014 2.43 69 1,000 64 27 718 13 2,743 0 2,995 016 2.43 90 1,000 83 27 718 31 1,567 0 2,998 018 2.43 84 3,500 73 25 718 43 4,471 0 5,863 020 2.43 85 3,500 65 25 718 57 3,009 491 5,665 022 2.43 84 3,500 70 25 718 47 3,886 0 5,689 024 2.43 84 3,500 69 25 718 49 3,350 150 5,688 026 2.43 84 3,500 70 25 718 43 2,838 662 5,784 028 2.43 58 1,000 53 34 230 3,460 0 2,418 030 2.43 54 1,000 49 34 230 3,032 0 2,431 032 2.43 50 1,000 44 34 230 2,705 0 2,439 034 2.43 61 1,000 54 34 230 2,874 0 2,417 036 2.43 60 1,000 53 34 230 2,786 0 2,417 038 2.43 60 1,000 52 34 230 2,705 0 2,417 040 2.43 65 1,000 57 34 230 2,766 0 2,417 042 2.43 63 1,000 55 34 230 2,703 0 2,417 044 2.43 65 1,000 56 34 230 83 2,258 0 2,417 046 2.43 67 1,000 58 34 230 2,624 0 2,417 048 2.43 65 1,000 56 34 230 2,501 0 2,417 050 2.43 74 1,000 65 34 230 93 2,448 0 2,417 052 2.43 72 1,000 63 34 230 95 2,446 0 2,417 054 2.43 83 3,500 73 25 718 109 4,469 0 5,655 056 2.43 80 2,000 50 50 56 111 1,551 449 3,009 058 2.43 45 1,000 44 27 684 5,540 0 3,367 060 2.43 47 1,000 44 27 684 115 2,972 0 3,550 062 2.43 48 1,000 46 27 684 123 3,968 0 3,606 064 2.43 48 1,000 46 27 684 121 4,049 0 3,586 066 2.43 50 1,000 47 27 684 131 3,646 0 3,635 068 2.43 49 1,000 46 27 684 123 3,692 0 3,666 070 2.43 72 1,000 69 27 684 133 3,515 0 3,446 072 2.43 60 1,000 56 27 684 135 2,165 0 3,446 074 2.43 59 1,000 55 55 74 3,426 0 3,425 076 2.43 101 1,000 74 74 76 141 1,567 0 1,871 078 2.43 41 1,000 36 34 230 2,340 0 2,307 080 2.43 45 2,000 27 24 230 2,447 0 2,315 082 2.43 50 2,000 31 24 230 2,649 0 2,317 084 2.43 54 2,000 37 24 230 3,015 0 2,328 086 2.43 54 2,000 36 24 230 2,884 0 2,341 088 2.43 96 1,000 94 28 686 165 5,030 0 5,006 090 2.43 96 1,000 93 28 686 163 3,502 0 4,998 092 2.43 88 3,000 71 23 718 179 3,000 0 4,215 094 2.43 67 1,000 62 34 230 3,887 0 2,439 096 2.43 63 1,000 58 34 230 3,639 0 2,462 098 2.43 90 1,000 85 27 718 185 1,778 0 3,643 0100 2.43 89 1,000 84 27 718 187 1,617 0 3,646 0102 2.43 62 3,500 -60 -70 577 189 1,564 1,936 1,715 1,785104 2.43 71 1,000 65 37 593 1265 2,372 0 3,400 0106 2.43 53 1,000 49 49 106 195 2,117 0 2,835 0108 2.43 63 1,000 51 51 613 1252 1,294 0 2,268 0110 2.43 87 1,000 80 80 110 1595 1,603 0 3,452 0112 2.43 39 1,000 35 35 112 2,203 0 2,203 0114 2.43 57 1,000 51 51 114 203 2,705 0 2,867 0116 2.43 100 3,500 68 25 718 205 1,824 1,676 5,708 0128 2.43 65 2,500 50 26 550 4,368 0 3,074 0134 2.43 63 1,000 59 36 593 263 2,712 0 2,602 0136 2.43 64 1,000 59 39 535 265 2,610 0 2,687 0138 2.43 64 1,000 61 37 593 267 4,025 0 3,200 0140 2.43 64 1,000 55 55 140 269 1,302 0 2,307 0142 2.43 67 1,000 62 37 593 1284 2,992 0 3,268 0144 2.43 71 1,000 59 59 144 273 1,453 0 2,216 0146 2.43 71 1,000 67 37 593 275 2,588 0 3,370 0148 2.43 71 1,000 61 61 148 277 1,601 0 2,607 0215 2.43 112 1,000 107 37 875 1637 4,447 0 2,727 0216 2.43 48 2,000 41 24 684 921 4,405 0 3,129 0217 2.43 70 1,000 67 27 684 1504 3,513 0 3,446 0218 2.43 79 1,000 33 23 919 925 2,126 0 1,636 0219 2.43 95 1,000 85 66 896 3,134 0 2,650 0220 2.43 99 1,000 90 37 875 3,331 0 2,727 0221 2.43 84 3,500 75 25 718 1423 6,546 0 5,937 0222 2.43 86 2,000 73 33 593 930 3,525 0 3,560 0228 2.43 74 1,000 70 27 684 923 4,393 0 3,446 0229 2.43 62 1,000 58 35 230 3,940 0 2,889 0230 2.43 39 2,000 23 23 230 2,232 0 2,231 0232 2.43 80 3,500 64 37 577 1331 7,055 0 5,309 0233 2.43 77 1,000 30 23 919 1,862 0 1,556 0235 2.43 79 1,000 31 22 352 1,782 0 1,280 0236 2.43 82 1,000 26 26 236 1,266 0 1,266 0237 2.43 39 1,000 34 34 237 1518 1,758 0 1,973 0238 2.43 50 1,000 47 37 237 129 2,994 0 3,542 0239 2.43 51 1,000 50 27 684 1008 5,911 0 3,964 0240 2.43 72 1,000 23 22 352 1,339 0 1,275 0241 2.43 90 1,000 41 22 352 2,142 0 1,280 0
Page 1 of 48

City of Oak Harbor 2013 Maximum Day DemandWater System Plan Fire Flow ScenarioNovember 2013 Existing System
Node ID
StaticDemand
(gpm)
StaticPressure
(psi)
Min. Fire FlowRequirement
(gpm)
ResidualPressure atRequired FF
(psi)
Min. SystemPressure atRequired FF
(psi)CriticalNode
CriticalPipe
Available Floww/ VelocityLimitations
(gpm)
FF Deficiencybased on
Velocity (gpm)
Available Floww/ PressureLimitations
(gpm)
FF Deficiencybased on
Pressure (gpm)242 2.43 95 1,000 45 22 352 2,263 0 1,282 0243 2.43 71 1,000 65 37 593 3,827 0 3,401 0244 2.43 48 1,000 43 43 596 1299 2,443 0 2,544 0245 2.43 46 1,000 42 42 245 3,043 0 3,040 0246 2.43 93 3,500 62 62 246 1179 2,554 946 5,770 0247 2.43 77 1,000 56 56 247 1095 879 121 1,749 0248 2.43 67 1,000 61 27 718 1096 2,630 0 3,008 0249 2.43 51 1,000 47 41 732 3,253 0 3,012 0250 2.43 52 1,000 45 45 250 966 1,759 0 2,321 0251 2.43 83 3,500 57 20 593 1309 4,666 0 3,492 8252 2.43 70 1,000 70 28 686 9,379 0 6,666 0253 2.43 78 1,000 77 28 686 1428 8,518 0 6,224 0254 2.43 52 2,000 47 25 684 6,173 0 3,415 0255 2.43 51 1,000 49 27 686 972 3,371 0 3,693 0256 2.43 47 1,000 44 27 686 973 3,309 0 3,703 0257 2.43 46 1,000 44 27 686 974 3,803 0 3,614 0258 2.43 38 1,000 37 27 686 4,674 0 3,233 0259 2.43 44 1,000 42 27 686 979 2,825 0 3,401 0260 2.43 49 1,000 45 45 260 964 2,323 0 3,263 0261 2.43 51 1,000 48 48 261 977 3,284 0 3,960 0262 2.43 59 1,000 56 56 262 957 2,467 0 3,986 0263 2.43 60 1,000 56 56 263 962 2,365 0 3,801 0264 2.43 55 1,000 51 51 264 963 1,978 0 3,117 0265 2.43 50 1,000 48 27 686 982 4,276 0 3,932 0266 2.43 43 1,000 39 39 266 970 1,951 0 2,826 0267 2.43 44 1,000 40 40 267 970 2,406 0 3,100 0268 2.43 41 1,000 38 38 268 976 1,973 0 2,913 0269 2.43 39 1,000 38 27 686 4,721 0 3,227 0270 2.43 41 1,000 40 27 686 4,902 0 3,613 0271 2.43 68 1,000 66 27 686 1477 4,387 0 4,236 0272 2.43 67 1,000 64 27 686 959 1,866 0 4,280 0273 2.43 68 1,000 65 28 686 955 3,116 0 4,612 0274 2.43 82 1,000 81 28 686 1430 7,495 0 4,922 0275 2.43 83 3,000 76 25 686 1440 5,737 0 4,924 0276 2.43 85 3,000 78 25 686 1436 5,802 0 5,221 0277 2.43 96 2,000 89 27 686 981 3,823 0 5,591 0278 2.43 95 3,000 84 26 686 1456 6,429 0 5,579 0279 2.43 88 3,000 80 25 686 956 5,385 0 5,259 0280 2.43 61 1,000 59 28 686 1601 5,178 0 4,915 0281 2.43 53 1,000 51 28 686 990 4,978 0 4,868 0282 2.43 61 1,000 57 57 282 991 1,616 0 3,570 0283 2.43 64 1,000 56 56 283 993 1,494 0 2,531 0284 2.43 58 1,000 53 53 938 994 1,880 0 3,007 0285 2.43 52 1,000 50 28 686 987 4,477 0 4,785 0286 2.43 52 1,000 50 28 686 986 4,580 0 4,726 0287 2.43 53 1,000 51 28 686 982 4,775 0 4,662 0288 2.43 54 3,500 30 30 288 985 3,035 465 4,248 0289 2.43 58 3,500 27 27 289 995 2,815 685 3,886 0290 2.43 54 3,500 33 33 290 996 2,519 981 4,511 0291 2.43 72 1,000 70 63 292 1003 3,028 0 5,281 0292 2.43 65 1,000 61 61 292 999 2,384 0 3,903 0293 2.43 92 1,000 89 28 686 997 3,018 0 5,454 0294 2.43 76 1,000 73 73 294 1002 3,193 0 5,143 0295 2.43 82 2,000 72 72 295 1588 2,918 0 5,415 0296 2.43 89 1,000 85 85 296 1465 1,985 0 4,745 0297 2.43 77 1,000 72 72 297 952 2,322 0 3,706 0298 2.43 63 1,000 60 60 298 997 2,732 0 4,311 0299 2.43 52 1,000 51 27 684 1009 6,338 0 4,284 0300 2.43 41 1,000 28 28 300 1,282 0 1,282 0301 2.43 44 1,000 37 34 300 2,000 0 1,861 0302 2.43 48 1,000 42 36 300 1012 2,092 0 2,082 0303 2.43 56 1,000 54 28 684 1004 4,935 0 5,134 0304 2.43 59 1,000 57 39 300 1015 2,147 0 3,670 0305 2.43 56 1,500 54 27 684 1016 5,853 0 4,792 0306 2.43 45 1,000 44 28 684 1017 5,448 0 5,699 0307 2.43 52 1,000 48 48 307 1005 2,386 0 3,022 0308 2.43 63 1,000 61 28 684 1579 3,600 0 5,546 0309 2.43 67 1,000 63 48 817 1580 1,865 0 3,012 0310 2.43 59 1,000 52 45 817 1057 1,564 0 2,273 0315 2.43 46 1,000 -6 -6 315 683 317 683 317316 2.43 55 1,000 27 17 315 1804 879 121 947 53318 2.43 47 1,000 26 24 317 1068 879 121 1,112 0319 2.43 58 1,000 49 35 317 1577 869 131 1,730 0320 2.43 105 2,000 97 27 686 1030 3,481 0 5,636 0321 2.43 104 3,000 90 26 686 1715 3,955 0 5,654 0322 2.43 92 1,000 88 88 322 1031 2,371 0 4,702 0323 2.43 77 1,000 74 50 817 1582 3,805 0 5,057 0324 2.43 83 1,000 73 73 324 1062 1,265 0 2,745 0325 2.43 85 1,000 80 80 325 1035 2,113 0 4,206 0326 2.43 77 1,000 74 27 718 1064 3,894 0 4,836 0327 2.43 89 1,000 85 85 327 1035 2,342 0 4,533 0328 2.43 91 1,000 84 84 328 1034 1,539 0 3,657 0329 2.43 78 1,000 75 27 718 1064 3,436 0 4,259 0
Page 2 of 48

City of Oak Harbor 2013 Maximum Day DemandWater System Plan Fire Flow ScenarioNovember 2013 Existing System
Node ID
StaticDemand
(gpm)
StaticPressure
(psi)
Min. Fire FlowRequirement
(gpm)
ResidualPressure atRequired FF
(psi)
Min. SystemPressure atRequired FF
(psi)CriticalNode
CriticalPipe
Available Floww/ VelocityLimitations
(gpm)
FF Deficiencybased on
Velocity (gpm)
Available Floww/ PressureLimitations
(gpm)
FF Deficiencybased on
Pressure (gpm)330 2.43 78 1,000 75 27 718 1083 3,976 0 3,764 0331 2.43 88 1,000 83 27 718 1084 2,179 0 3,683 0332 2.43 92 1,000 87 27 718 1086 2,415 0 3,628 0333 2.43 78 1,750 71 26 718 1083 4,209 0 3,540 0334 2.43 65 1,000 62 27 718 1081 2,699 0 3,280 0335 2.43 75 1,000 72 27 718 1087 3,154 0 3,307 0336 2.43 68 3,000 30 21 718 1092 1,508 1,492 3,311 0337 2.43 60 1,000 51 51 337 1091 1,640 0 2,242 0338 2.43 61 1,000 56 56 338 1088 1,552 0 3,127 0339 2.43 65 1,000 62 27 718 1080 3,581 0 3,220 0340 2.43 99 3,000 72 17 875 1114 4,539 0 2,814 186341 2.43 85 1,000 38 23 919 2,307 0 1,622 0342 2.43 79 1,000 34 23 919 2,362 0 1,645 0343 2.43 73 1,000 28 23 919 2,101 0 1,605 0344 2.43 76 1,000 31 23 919 2,330 0 1,559 0345 2.43 73 1,000 26 21 919 1,660 0 1,180 0346 2.43 82 1,000 29 22 352 1,429 0 1,280 0347 2.43 75 1,000 27 22 352 1,533 0 1,293 0348 2.43 82 1,000 27 27 348 1027 876 124 1,265 0349 2.43 81 1,000 30 23 352 1,599 0 1,391 0350 2.43 97 1,000 47 24 818 1526 2,264 0 1,642 0352 2.43 70 1,000 22 22 352 1,234 0 1,234 0353 2.43 74 1,000 24 24 353 1,288 0 1,287 0354 2.43 49 1,000 41 36 875 2,226 0 2,143 0355 2.43 46 1,000 39 36 875 2,218 0 2,183 0356 2.43 48 1,000 40 36 875 2,191 0 2,163 0357 2.43 51 1,000 43 36 875 1126 2,336 0 2,142 0358 2.43 51 1,000 44 35 875 2,437 0 2,132 0359 2.43 47 1,000 40 36 875 2,195 0 2,153 0360 2.43 67 1,000 59 35 875 2,718 0 2,122 0361 2.43 68 1,000 61 35 875 2,945 0 2,108 0362 2.43 71 1,000 63 35 875 3,107 0 2,108 0363 2.43 55 1,000 49 35 875 2,727 0 2,096 0364 2.43 55 1,000 49 36 875 2,727 0 2,141 0365 2.43 88 3,500 65 31 577 6,459 0 4,354 0366 2.43 58 1,000 52 36 875 2,992 0 2,204 0367 2.43 52 1,000 45 36 875 2,550 0 2,191 0368 2.43 57 1,000 50 36 875 2,685 0 2,157 0369 2.43 60 1,000 53 36 875 2,914 0 2,207 0370 2.43 71 1,000 66 36 875 1136 3,299 0 2,263 0371 2.43 87 3,000 69 25 718 1051 3,520 0 5,137 0372 2.43 84 1,000 79 28 718 1039 3,206 0 5,196 0373 2.43 86 3,000 78 25 718 1039 7,376 0 5,587 0374 2.43 101 2,000 55 54 423 1142 1,492 508 2,754 0375 2.43 65 2,000 60 37 435 1706 6,448 0 6,347 0376 2.43 65 1,000 62 37 550 4,420 0 3,039 0377 2.43 47 1,000 43 36 550 2,680 0 2,449 0378 2.43 52 1,000 49 47 546 1360 2,239 0 3,040 0379 2.43 74 1,000 66 66 379 1617 2,691 0 3,481 0380 2.43 56 1,000 52 27 718 3,925 0 3,125 0381 2.43 41 1,000 37 37 381 2,819 0 2,819 0382 2.43 39 1,000 35 35 382 2,797 0 2,797 0383 2.43 49 1,000 46 27 718 3,705 0 3,065 0384 2.43 58 1,000 55 27 718 1080 4,304 0 3,132 0386 2.43 64 1,000 61 35 230 4,736 0 2,913 0387 2.43 66 1,000 63 35 230 4,713 0 2,906 0388 2.43 42 1,000 39 27 718 3,485 0 2,934 0389 2.43 39 1,000 36 27 718 3,429 0 2,922 0390 2.43 38 1,000 35 35 390 2,872 0 2,872 0391 2.43 45 1,000 42 27 718 3,353 0 2,940 0392 2.43 48 1,000 44 27 718 3,415 0 2,946 0393 2.43 59 1,000 56 27 718 1099 3,379 0 2,946 0394 2.43 50 2,000 38 24 718 1651 2,807 0 2,950 0395 2.43 45 1,000 41 41 395 2,898 0 2,898 0396 2.43 52 1,000 48 27 718 3,269 0 2,986 0397 2.43 48 1,000 43 43 397 2,962 0 2,962 0398 2.43 56 1,000 52 27 718 1106 3,418 0 2,957 0399 2.43 61 1,000 56 27 718 1108 3,109 0 2,957 0400 2.43 55 1,000 51 27 718 1100 3,197 0 2,956 0401 2.43 58 1,000 54 27 718 3,556 0 2,958 0402 2.43 52 1,000 47 27 718 1111 2,895 0 2,962 0403 2.43 60 1,000 56 27 718 3,902 0 2,966 0404 2.43 59 1,000 55 27 718 1112 3,381 0 2,981 0405 2.43 74 3,000 63 22 718 1636 4,919 0 3,627 0406 2.43 82 1,000 78 35 230 4,982 0 2,764 0407 2.43 80 3,000 56 17 230 5,029 0 2,751 249408 2.43 78 1,000 73 35 230 1135 3,904 0 2,584 0409 2.43 66 1,000 61 28 718 1574 2,685 0 4,739 0410 2.43 84 1,000 78 78 410 1048 2,934 0 4,636 0411 2.43 70 1,000 64 60 659 1040 2,919 0 4,215 0412 2.43 67 2,000 53 53 412 1042 2,930 0 4,231 0413 2.43 58 1,000 51 51 413 1045 2,879 0 3,347 0414 2.43 66 1,000 61 52 413 1042 3,747 0 3,989 0
Page 3 of 48

City of Oak Harbor 2013 Maximum Day DemandWater System Plan Fire Flow ScenarioNovember 2013 Existing System
Node ID
StaticDemand
(gpm)
StaticPressure
(psi)
Min. Fire FlowRequirement
(gpm)
ResidualPressure atRequired FF
(psi)
Min. SystemPressure atRequired FF
(psi)CriticalNode
CriticalPipe
Available Floww/ VelocityLimitations
(gpm)
FF Deficiencybased on
Velocity (gpm)
Available Floww/ PressureLimitations
(gpm)
FF Deficiencybased on
Pressure (gpm)415 2.43 68 1,000 62 52 413 1046 2,576 0 3,995 0416 2.43 81 1,000 76 53 413 1567 2,895 0 4,777 0417 2.43 84 1,000 77 77 417 1050 2,852 0 4,673 0418 2.43 85 3,500 59 59 418 1420 2,221 1,279 5,547 0419 2.43 86 3,500 77 25 718 47 6,329 0 5,593 0420 2.43 88 3,000 72 25 718 1052 1,607 1,393 5,136 0421 2.43 88 3,000 78 25 718 1052 3,535 0 5,247 0422 2.43 89 3,500 76 24 718 1055 4,469 0 5,171 0423 2.43 100 2,000 32 32 423 2,185 0 2,185 0424 2.43 101 2,000 35 34 423 1144 1,562 438 2,237 0425 2.43 101 2,000 50 49 423 1145 1,559 441 2,592 0426 2.43 99 3,500 85 23 718 1140 4,585 0 4,654 0427 2.43 93 3,500 83 24 718 1630 7,436 0 5,110 0428 2.43 99 3,500 86 24 718 1139 5,323 0 5,105 0429 2.43 62 2,000 57 37 435 929 2,711 0 6,440 0430 2.43 59 1,000 55 55 430 928 2,858 0 5,360 0431 2.43 58 1,000 53 53 431 1228 3,390 0 5,148 0432 2.43 55 1,000 51 44 433 1229 3,344 0 4,600 0433 2.43 49 1,000 44 44 433 1230 3,224 0 3,984 0434 2.43 46 1,000 41 41 434 1232 3,011 0 3,759 0435 2.43 41 2,000 33 33 435 3,900 0 3,900 0436 2.43 69 2,000 63 37 435 1208 4,878 0 6,375 0437 2.43 72 2,000 63 63 437 1209 2,706 0 5,678 0438 2.43 64 2,000 52 52 438 1211 2,101 0 4,372 0439 2.43 64 1,000 58 58 439 1226 2,739 0 4,582 0440 2.43 61 1,000 55 55 440 1224 2,191 0 3,829 0441 2.43 52 1,000 45 45 441 1218 1,874 0 2,893 0442 2.43 45 2,000 37 34 435 4,238 0 4,180 0443 2.43 57 1,000 50 50 443 1222 2,147 0 3,289 0444 2.43 100 2,000 90 36 435 1216 3,429 0 5,117 0445 2.43 68 1,000 63 63 445 1213 4,580 0 5,359 0446 2.43 93 3,000 60 34 754 1616 3,082 0 3,876 0447 2.43 77 3,000 53 36 754 1199 3,112 0 4,057 0448 2.43 68 3,000 45 41 754 1205 3,305 0 4,576 0449 2.43 81 3,500 56 39 754 1203 3,641 0 5,017 0450 2.43 90 3,000 69 41 754 1201 3,010 0 4,660 0451 2.43 97 3,000 73 42 754 1197 2,463 537 4,691 0452 2.43 98 3,500 58 58 452 1180 2,920 580 5,076 0453 2.43 100 3,500 43 43 453 1165 2,003 1,497 4,221 0454 2.43 100 3,500 79 25 718 1168 2,348 1,152 5,768 0455 2.43 94 3,500 76 25 718 1164 4,189 0 5,642 0456 2.43 100 3,500 85 25 718 1164 5,507 0 5,693 0457 2.43 93 3,500 72 25 718 1169 3,487 13 5,857 0458 2.43 84 3,500 68 25 718 1172 5,137 0 5,957 0459 2.43 84 3,500 60 60 459 1188 3,709 0 6,075 0460 2.43 85 3,500 62 25 718 1178 3,370 130 6,246 0461 2.43 73 3,500 57 25 718 1172 4,916 0 6,242 0462 2.43 68 2,000 59 59 462 1189 3,777 0 5,864 0463 2.43 70 3,500 46 46 463 1177 3,056 444 5,334 0464 2.43 84 3,500 55 55 464 1187 3,027 473 5,526 0465 2.43 93 3,500 28 28 465 1183 1,443 2,057 3,752 0466 2.43 93 3,500 62 62 466 1184 2,552 948 5,640 0467 2.43 93 3,500 72 26 718 1195 3,482 18 6,586 0468 2.43 79 2,000 70 70 468 1194 3,181 0 6,290 0469 2.43 69 2,000 62 37 435 1208 3,359 0 6,612 0470 2.43 93 3,500 24 24 470 1192 1,861 1,639 3,597 0471 2.43 64 3,000 49 49 471 1206 3,199 0 5,626 0472 2.43 66 3,000 54 26 718 1190 5,364 0 6,460 0473 2.43 71 3,000 55 55 473 1174 3,355 0 5,953 0474 2.43 73 3,000 57 57 474 1175 3,888 0 6,224 0475 2.43 81 3,000 57 26 718 1166 2,817 183 5,168 0476 2.43 68 1,000 64 64 476 1149 4,183 0 6,066 0477 2.43 66 1,000 61 61 477 1150 3,308 0 5,489 0478 2.43 65 1,000 38 38 478 1750 909 91 1,370 0479 2.43 70 1,000 33 33 479 382 744 256 1,192 0480 2.43 76 1,000 65 58 929 1159 1,300 0 2,601 0481 2.43 73 1,000 67 67 481 1151 3,095 0 4,961 0482 2.43 73 1,000 61 61 482 1155 1,719 0 2,428 0483 2.43 71 1,000 58 58 483 1158 1,758 0 2,379 0484 2.43 81 1,000 69 69 484 1161 1,379 0 2,789 0485 2.43 80 1,000 68 68 485 1160 1,221 0 2,741 0486 2.43 82 1,000 77 28 718 1415 2,904 0 5,956 0487 2.43 89 3,500 68 22 593 1853 4,862 0 3,708 0488 2.43 94 3,500 54 23 593 1840 3,186 314 3,836 0489 2.43 87 2,000 73 34 593 1240 3,245 0 3,836 0490 2.43 95 3,500 76 24 593 1234 4,527 0 3,882 0491 2.43 98 1,000 96 38 593 1233 5,668 0 4,322 0492 2.43 102 2,000 96 36 593 1446 5,279 0 4,910 0493 2.43 100 1,000 97 38 593 1237 3,756 0 4,898 0494 2.43 98 1,000 96 38 593 1237 4,785 0 5,468 0495 2.43 100 2,000 90 37 593 1238 2,916 0 5,375 0496 2.43 101 2,000 91 36 593 1239 3,728 0 5,291 0497 2.43 95 2,000 76 67 618 1399 2,754 0 4,008 0
Page 4 of 48

City of Oak Harbor 2013 Maximum Day DemandWater System Plan Fire Flow ScenarioNovember 2013 Existing System
Node ID
StaticDemand
(gpm)
StaticPressure
(psi)
Min. Fire FlowRequirement
(gpm)
ResidualPressure atRequired FF
(psi)
Min. SystemPressure atRequired FF
(psi)CriticalNode
CriticalPipe
Available Floww/ VelocityLimitations
(gpm)
FF Deficiencybased on
Velocity (gpm)
Available Floww/ PressureLimitations
(gpm)
FF Deficiencybased on
Pressure (gpm)498 2.43 88 2,000 68 68 498 1410 2,372 0 3,812 0499 2.43 85 2,000 66 66 499 1243 1,866 134 3,849 0500 2.43 78 2,000 63 35 593 1244 2,248 0 3,949 0501 2.43 58 1,000 53 37 593 3,385 0 3,375 0502 2.43 75 3,500 46 21 593 1244 4,005 0 3,560 0503 2.43 55 2,000 22 22 503 1254 1,501 499 2,055 0504 2.43 61 1,000 52 52 613 1252 1,307 0 2,441 0505 2.43 65 1,000 59 50 503 1251 2,611 0 3,397 0507 2.43 45 1,000 42 42 507 3,123 0 3,123 0508 2.43 53 1,000 46 46 508 2,377 0 2,377 0509 2.43 74 2,000 41 41 509 1247 1,704 296 2,615 0510 2.43 81 3,500 57 20 593 1266 4,994 0 3,524 0511 2.43 68 1,000 63 37 593 1262 3,249 0 3,381 0512 2.43 70 3,250 36 21 593 1258 3,811 0 3,381 0513 2.43 68 1,000 63 37 593 3,874 0 3,386 0514 2.43 56 1,000 51 51 514 3,169 0 3,169 0515 2.43 58 1,000 53 53 515 3,366 0 3,366 0516 2.43 58 1,000 53 53 516 1260 2,626 0 3,183 0517 2.43 71 1,000 68 37 593 1268 3,913 0 3,401 0518 2.43 83 3,500 60 20 593 1267 5,486 0 3,516 0519 2.43 84 3,500 63 20 593 1275 5,793 0 3,535 0520 2.43 83 3,500 62 20 593 1277 4,914 0 3,523 0521 2.43 78 1,000 53 53 521 1383 997 3 1,598 0522 2.43 65 1,000 60 60 522 1283 1,753 0 3,191 0523 2.43 67 1,000 62 37 593 1282 2,757 0 3,277 0524 2.43 70 1,000 64 64 524 1280 1,837 0 2,931 0525 2.43 71 1,000 64 64 525 1280 2,191 0 3,050 0526 2.43 47 1,000 44 44 526 3,123 0 3,120 0527 2.43 48 1,000 45 45 527 3,247 0 3,245 0528 2.43 47 1,000 44 37 593 3,307 0 3,225 0529 2.43 48 1,000 45 37 550 3,426 0 3,180 0530 2.43 43 1,000 41 41 530 3,084 0 3,084 0531 2.43 48 1,000 45 37 550 3,410 0 3,171 0532 2.43 86 3,500 64 20 593 6,249 0 3,526 0533 2.43 64 1,000 61 37 593 1294 3,392 0 3,279 0534 2.43 44 1,000 41 41 534 3,052 0 3,052 0535 2.43 42 1,000 38 38 535 2,334 0 2,332 0536 2.43 64 1,000 61 37 593 4,305 0 3,214 0537 2.43 63 1,000 61 37 593 4,448 0 3,285 0538 2.43 85 3,500 64 20 593 6,340 0 3,493 7539 2.43 86 3,500 64 20 593 1290 5,832 0 3,499 1540 2.43 80 1,000 31 20 593 1291 1,730 0 3,456 0541 2.43 76 1,000 65 65 541 1302 1,967 0 2,351 0542 2.43 64 1,000 60 36 593 1296 2,949 0 2,751 0543 2.43 65 1,000 62 37 550 4,385 0 3,066 0544 2.43 63 1,000 59 36 593 1308 2,873 0 2,675 0545 2.43 59 1,000 55 46 594 1308 3,038 0 2,816 0546 2.43 51 1,000 47 47 546 938 2,350 0 2,916 0547 2.43 52 1,000 48 48 547 1317 2,046 0 2,796 0548 2.43 44 1,000 38 38 548 1,994 0 1,992 0549 2.43 40 1,000 35 35 549 1,996 0 1,995 0550 2.43 39 1,000 35 35 550 2,288 0 2,288 0551 2.43 70 3,500 48 19 550 5,336 0 3,440 60552 2.43 94 3,500 72 32 577 1322 4,317 0 4,467 0554 2.43 81 3,500 49 22 577 4,991 0 3,628 0555 2.43 87 3,500 -48 -48 555 380 1,567 1,933 2,399 1,101556 2.43 87 3,500 61 27 577 1325 4,614 0 3,967 0557 2.43 81 3,500 49 23 577 1948 3,539 0 3,696 0558 2.43 83 3,500 46 25 577 1328 2,420 1,080 3,859 0559 2.43 85 3,500 44 28 577 1329 2,685 815 4,090 0560 2.43 81 3,500 43 43 560 1332 2,454 1,046 4,547 0561 2.43 81 3,500 69 41 577 1426 6,194 0 6,386 0562 2.43 77 3,500 49 45 563 1333 2,441 1,059 5,011 0563 2.43 72 3,500 27 27 563 1334 2,448 1,052 3,792 0564 2.43 77 3,500 17 17 565 1335 1,564 1,936 3,405 95565 2.43 77 3,500 2 2 565 3,022 478 3,022 478566 2.43 81 3,500 48 20 577 1948 3,367 133 3,518 0567 2.43 77 3,500 20 20 567 1339 1,567 1,933 3,503 0568 2.43 72 3,500 14 -5 577 3,311 189 2,568 932569 2.43 92 3,500 -37 -39 869 1346 1,564 1,936 2,513 987570 2.43 85 3,500 -26 -26 570 1341 1,567 1,933 2,617 883571 2.43 72 3,500 13 -3 577 1344 2,303 1,197 2,616 884572 2.43 72 3,500 13 -5 577 1342 2,407 1,093 2,573 927573 2.43 72 3,500 17 -3 577 3,390 110 2,629 871574 2.43 85 3,500 8 -7 577 1345 2,759 741 2,535 965575 2.43 72 3,500 9 -10 577 3,162 338 2,453 1,047576 2.43 72 3,500 2 -18 577 2,980 520 2,314 1,186577 2.43 53 3,500 -118 -118 577 1,434 2,066 1,434 2,066578 2.43 61 3,500 38 20 550 4,762 0 3,514 0579 2.43 54 3,500 20 16 583 1353 2,313 1,187 3,278 222580 2.43 48 3,500 10 8 581 1356 2,670 830 2,875 625581 2.43 46 3,500 -33 -33 581 1355 1,567 1,933 1,955 1,545582 2.43 56 3,500 30 18 550 1755 2,001 1,499 3,337 163
Page 5 of 48

City of Oak Harbor 2013 Maximum Day DemandWater System Plan Fire Flow ScenarioNovember 2013 Existing System
Node ID
StaticDemand
(gpm)
StaticPressure
(psi)
Min. Fire FlowRequirement
(gpm)
ResidualPressure atRequired FF
(psi)
Min. SystemPressure atRequired FF
(psi)CriticalNode
CriticalPipe
Available Floww/ VelocityLimitations
(gpm)
FF Deficiencybased on
Velocity (gpm)
Available Floww/ PressureLimitations
(gpm)
FF Deficiencybased on
Pressure (gpm)583 2.43 50 3,500 -6 -6 583 1357 1,567 1,933 2,529 971584 2.43 53 3,000 34 22 550 3,998 0 3,146 0585 2.43 67 3,500 30 19 550 1358 1,567 1,933 3,440 60586 2.43 53 3,000 34 21 550 3,969 0 3,126 0587 2.43 54 1,000 52 37 550 3,807 0 3,072 0589 2.43 48 1,000 41 41 590 1364 1,541 0 2,079 0591 2.43 42 1,000 38 35 593 2,458 0 2,331 0592 2.43 41 1,000 33 33 592 1369 1,567 0 1,663 0593 2.43 39 1,000 35 35 593 2,208 0 2,206 0595 2.43 63 2,000 47 31 593 1942 3,059 0 3,023 0597 2.43 48 1,000 34 34 596 1373 879 121 1,474 0598 2.43 47 3,500 15 15 602 3,169 331 3,169 331599 2.43 62 3,500 22 12 833 1760 3,519 0 3,112 388600 2.43 61 3,500 17 7 833 3,348 152 2,912 588601 2.43 62 3,500 3 3 601 1376 1,567 1,933 2,896 604602 2.43 47 3,500 -55 -55 602 1799 1,564 1,936 1,659 1,841603 2.43 47 1,000 44 37 593 3,265 0 3,231 0604 2.43 46 1,000 43 37 550 3,294 0 3,209 0605 2.43 72 1,000 64 64 605 1382 1,864 0 2,693 0606 2.43 44 1,000 40 40 606 1385 1,398 0 2,492 0607 2.43 46 1,000 42 42 607 3,065 0 3,062 0608 2.43 50 2,500 23 23 608 2,657 0 2,657 0611 2.43 64 1,000 50 50 613 1252 1,294 0 2,110 0613 2.43 64 1,000 45 45 613 1252 1,294 0 1,710 0614 2.43 71 1,000 -15 -15 614 1397 389 611 743 257615 2.43 98 2,000 81 81 811 1400 2,467 0 4,567 0616 2.43 91 2,000 46 46 616 1401 1,067 933 2,541 0617 2.43 92 3,500 23 23 617 1406 2,000 1,500 3,569 0618 2.43 85 2,000 65 65 618 3,778 0 3,777 0619 2.43 91 3,500 27 27 619 1407 3,485 15 3,713 0620 2.43 89 1,000 80 80 620 1409 1,567 0 3,149 0621 2.43 76 2,000 54 54 621 1411 1,525 475 3,234 0622 2.43 95 3,500 61 22 593 1412 2,594 906 3,736 0623 2.43 95 3,500 51 22 593 1414 3,525 0 3,736 0624 2.43 82 1,000 77 28 718 1422 2,882 0 5,953 0625 2.43 84 3,500 70 25 718 1421 3,670 0 5,870 0626 2.43 84 1,000 80 28 718 41 4,818 0 5,926 0627 2.43 85 3,500 78 28 718 207 6,190 0 8,755 0628 2.43 90 3,500 75 28 718 1427 2,448 1,052 8,687 0629 2.43 83 3,500 50 50 629 1429 1,567 1,933 4,920 0630 2.43 87 3,500 80 25 686 1431 7,191 0 5,363 0631 2.43 87 1,000 86 28 686 1431 7,377 0 5,184 0632 2.43 93 1,000 92 28 686 1432 3,160 0 5,111 0633 2.43 100 1,000 98 28 686 1433 3,482 0 5,084 0634 2.43 106 1,000 101 101 634 1434 1,567 0 4,459 0635 2.43 102 1,000 100 28 686 165 2,663 0 5,029 0636 2.43 89 3,000 82 25 686 1437 5,445 0 4,992 0637 2.43 102 1,000 96 96 637 1439 1,567 0 4,242 0638 2.43 87 3,000 80 25 686 1441 5,629 0 4,924 0639 2.43 89 1,000 87 28 686 1442 2,527 0 4,969 0640 2.43 72 3,000 37 37 640 1444 1,567 1,433 3,721 0641 2.43 78 3,000 66 25 686 1443 4,181 0 5,106 0642 2.43 102 1,000 100 38 593 1445 4,413 0 5,361 0643 2.43 93 3,500 79 25 686 1447 5,368 0 5,457 0644 2.43 95 1,000 93 28 686 1448 3,029 0 5,543 0645 2.43 98 1,000 95 28 686 1453 3,430 0 5,604 0646 2.43 102 1,000 98 98 646 1450 2,898 0 5,569 0647 2.43 98 1,000 95 38 593 1452 2,239 0 5,557 0648 2.43 95 1,000 92 92 648 1455 3,059 0 5,486 0649 2.43 95 2,000 85 27 686 1462 2,546 0 5,617 0650 2.43 93 3,000 81 26 686 1457 4,662 0 5,513 0651 2.43 95 3,000 46 46 651 1458 1,567 1,433 3,782 0652 2.43 95 3,500 66 25 686 1461 2,455 1,045 5,612 0653 2.43 98 3,500 76 25 686 1459 3,162 338 5,605 0654 2.43 102 3,000 89 26 686 1463 5,354 0 5,633 0655 2.43 91 2,000 83 27 686 1587 3,506 0 5,682 0656 2.43 91 1,000 88 88 656 1465 2,861 0 5,495 0657 2.43 108 3,500 70 64 658 1468 2,446 1,054 5,278 0658 2.43 102 3,500 39 39 658 1470 1,567 1,933 4,025 0659 2.43 66 1,000 36 36 659 1471 881 119 1,296 0660 2.43 84 1,000 78 28 718 1472 3,047 0 5,159 0661 2.43 82 1,000 73 73 661 1474 1,567 0 3,517 0662 2.43 90 3,500 40 40 662 1475 1,567 1,933 4,257 0663 2.43 76 1,000 75 27 686 1476 4,636 0 4,342 0664 2.43 78 2,000 72 26 686 1478 2,218 0 4,208 0665 2.43 74 2,000 66 26 686 1479 2,695 0 4,170 0666 2.43 76 2,000 65 26 686 1480 2,551 0 4,148 0667 2.43 69 2,000 57 26 686 1482 3,514 0 4,143 0668 2.43 66 2,000 55 48 675 1482 3,431 0 4,088 0669 2.43 65 2,000 54 48 675 1484 2,604 0 4,125 0670 2.43 59 2,000 49 26 686 1485 2,369 0 4,127 0671 2.43 57 2,000 49 26 686 1486 2,753 0 4,099 0672 2.43 52 2,000 46 26 686 1489 2,329 0 4,018 0
Page 6 of 48

City of Oak Harbor 2013 Maximum Day DemandWater System Plan Fire Flow ScenarioNovember 2013 Existing System
Node ID
StaticDemand
(gpm)
StaticPressure
(psi)
Min. Fire FlowRequirement
(gpm)
ResidualPressure atRequired FF
(psi)
Min. SystemPressure atRequired FF
(psi)CriticalNode
CriticalPipe
Available Floww/ VelocityLimitations
(gpm)
FF Deficiencybased on
Velocity (gpm)
Available Floww/ PressureLimitations
(gpm)
FF Deficiencybased on
Pressure (gpm)673 2.43 50 1,000 49 27 686 1488 5,102 0 3,876 0674 2.43 71 2,000 56 56 674 1491 3,110 0 3,846 0675 2.43 59 2,000 43 43 675 1494 3,132 0 3,284 0676 2.43 39 1,000 38 27 686 4,702 0 3,186 0677 2.43 39 2,000 18 18 677 1496 1,567 433 1,910 90678 2.43 37 1,000 36 27 686 4,419 0 2,979 0679 2.43 33 1,000 31 26 686 2,945 0 2,337 0680 2.43 31 1,000 24 24 680 1,370 0 1,370 0681 2.43 33 1,000 30 26 686 1500 2,446 0 2,337 0682 2.43 33 1,000 30 30 682 2,257 0 2,256 0683 2.43 33 1,000 30 26 684 2,356 0 1,907 0684 2.43 28 1,000 22 22 684 1,205 0 1,205 0685 2.43 28 1,000 22 22 685 1,198 0 1,198 0686 2.43 28 1,000 23 23 686 1,240 0 1,240 0687 2.43 90 2,000 47 21 684 1768 2,163 0 2,184 0688 2.43 59 2,000 53 25 684 1503 4,513 0 3,446 0689 2.43 80 2,000 73 25 684 1505 2,356 0 3,463 0690 2.43 57 2,000 48 25 684 1507 3,600 0 3,471 0691 2.43 54 2,000 50 25 684 6,388 0 3,536 0692 2.43 63 2,000 52 25 684 1509 3,103 0 3,467 0693 2.43 54 2,000 11 11 693 1512 881 1,119 1,767 233694 2.43 59 2,000 50 25 684 1510 2,908 0 3,467 0695 2.43 52 2,000 48 25 684 1513 6,161 0 3,635 0696 2.43 52 2,000 43 25 684 1515 1,567 433 3,635 0697 2.43 54 1,000 52 37 237 1516 2,395 0 3,694 0698 2.43 77 1,000 30 23 919 1,788 0 1,599 0699 2.43 79 1,000 32 23 919 1,948 0 1,588 0700 2.43 90 1,000 43 23 919 2,621 0 1,573 0701 2.43 72 1,000 23 22 352 1,344 0 1,270 0702 2.43 88 1,000 42 23 919 2,608 0 1,567 0703 2.43 92 1,000 45 23 919 2,519 0 1,567 0704 2.43 97 1,000 48 23 919 2,490 0 1,566 0705 2.43 95 1,000 47 23 919 2,591 0 1,565 0706 2.43 86 1,000 38 23 919 2,252 0 1,560 0707 2.43 41 1,000 35 35 820 2,125 0 2,125 0708 2.43 41 1,000 35 35 708 2,127 0 2,127 0709 2.43 41 1,000 37 37 709 2,553 0 2,553 0710 2.43 41 1,000 37 37 710 1538 2,549 0 2,608 0711 2.43 41 1,000 38 27 718 1541 2,209 0 2,930 0712 2.43 39 1,000 36 27 718 3,339 0 2,927 0713 2.43 82 1,000 32 22 352 1,794 0 1,286 0714 2.43 86 1,000 36 22 352 1,825 0 1,286 0715 2.43 82 1,000 31 22 352 1,626 0 1,299 0716 2.43 79 1,000 30 22 352 1,641 0 1,286 0717 2.43 86 1,000 35 22 352 1,820 0 1,286 0718 2.43 28 1,000 27 27 718 2,723 0 2,722 0719 2.43 54 1,000 50 35 230 3,910 0 2,907 0720 2.43 54 1,000 50 35 230 3,858 0 2,896 0721 2.43 52 1,000 48 35 230 3,565 0 2,889 0722 2.43 56 1,000 52 35 230 1554 2,570 0 2,860 0723 2.43 65 1,000 59 35 230 1555 2,292 0 2,860 0724 2.43 54 1,000 50 35 230 3,462 0 2,800 0725 2.43 56 1,000 52 35 230 1558 3,470 0 2,850 0726 2.43 63 1,000 58 35 230 1561 2,587 0 2,861 0727 2.43 41 1,000 37 37 727 1807 2,238 0 2,571 0728 2.43 41 1,000 19 19 728 1565 881 119 985 15729 2.43 54 1,000 50 41 730 1569 2,808 0 2,923 0730 2.43 46 1,000 27 27 730 1570 881 119 1,195 0731 2.43 54 1,000 49 41 732 1572 2,629 0 2,667 0732 2.43 45 1,000 26 26 732 1573 881 119 1,167 0733 2.43 65 1,000 62 27 718 103 2,980 0 4,411 0734 2.43 69 1,000 65 27 718 1575 3,127 0 4,030 0735 2.43 67 1,000 65 50 817 1579 2,051 0 4,792 0736 2.43 80 1,000 78 50 817 1582 4,028 0 5,297 0737 2.43 82 2,000 73 73 737 1583 2,862 0 5,599 0738 2.43 85 2,000 75 75 738 1585 2,889 0 5,685 0739 2.43 87 2,000 78 27 686 1586 4,093 0 5,738 0740 2.43 89 2,000 81 27 686 1587 3,568 0 5,706 0741 2.43 85 2,000 74 74 741 1591 2,751 0 5,347 0742 2.43 54 1,000 52 52 742 1593 2,812 0 4,683 0743 2.43 85 1,000 78 78 743 1594 1,822 0 3,354 0744 2.43 50 1,000 47 27 686 1597 3,130 0 3,768 0745 2.43 67 1,000 65 28 686 1598 4,803 0 5,001 0746 2.43 63 1,000 58 58 746 1601 1,660 0 3,253 0747 2.43 79 1,000 29 22 352 1,577 0 1,290 0748 2.43 43 1,000 38 36 708 2,310 0 2,290 0749 2.43 41 1,000 36 36 749 2,297 0 2,297 0750 2.43 41 1,000 37 37 750 2,721 0 2,721 0751 2.43 43 1,000 39 39 751 1611 2,518 0 2,619 0752 2.43 50 1,000 46 27 718 1613 2,655 0 2,935 0753 2.43 73 3,000 45 34 754 1615 2,702 298 3,838 0754 2.43 60 1,000 53 53 754 3,466 0 3,466 0755 2.43 97 3,500 82 22 718 1620 5,521 0 4,125 0
Page 7 of 48

City of Oak Harbor 2013 Maximum Day DemandWater System Plan Fire Flow ScenarioNovember 2013 Existing System
Node ID
StaticDemand
(gpm)
StaticPressure
(psi)
Min. Fire FlowRequirement
(gpm)
ResidualPressure atRequired FF
(psi)
Min. SystemPressure atRequired FF
(psi)CriticalNode
CriticalPipe
Available Floww/ VelocityLimitations
(gpm)
FF Deficiencybased on
Velocity (gpm)
Available Floww/ PressureLimitations
(gpm)
FF Deficiencybased on
Pressure (gpm)756 2.43 97 3,500 77 22 718 1621 2,355 1,145 4,088 0757 2.43 92 3,500 69 21 718 1623 2,869 631 4,065 0758 2.43 90 3,000 75 23 718 179 4,185 0 4,091 0759 2.43 95 3,000 74 23 718 1624 3,049 0 3,988 0760 2.43 95 3,000 75 23 718 1761 2,686 314 3,929 0761 2.43 90 3,500 69 23 718 1629 2,577 923 4,754 0762 2.43 92 3,500 77 23 718 1628 4,866 0 4,847 0763 2.43 92 3,500 76 23 718 1630 3,073 427 4,916 0764 2.43 88 3,500 53 23 718 1632 2,941 559 4,881 0765 2.43 99 3,500 50 22 718 1634 1,567 1,933 4,125 0766 2.43 95 3,000 83 23 718 1635 6,228 0 3,850 0767 2.43 112 1,000 107 37 875 1744 4,261 0 2,768 0768 2.43 84 3,000 54 17 230 1641 3,034 0 2,769 231769 2.43 93 3,000 67 17 230 1638 5,388 0 2,775 225770 2.43 80 3,000 53 17 230 1645 3,366 0 2,767 233771 2.43 78 3,000 54 18 230 4,945 0 2,792 208772 2.43 71 1,000 56 56 772 1646 881 119 1,946 0773 2.43 54 1,000 47 34 875 2,474 0 1,905 0774 2.43 76 1,000 65 65 896 2,556 0 2,554 0775 2.43 69 2,000 55 25 230 4,041 0 2,411 0776 2.43 50 2,000 39 24 718 3,557 0 2,944 0777 2.43 63 2,000 53 24 718 4,828 0 2,936 0778 2.43 71 1,000 67 35 230 1656 2,324 0 2,756 0779 2.43 67 1,000 62 35 230 3,783 0 2,505 0780 2.43 50 1,000 44 34 230 2,792 0 2,454 0781 2.43 45 1,000 40 34 230 2,561 0 2,450 0782 2.43 45 1,000 39 39 782 2,303 0 2,303 0783 2.43 71 1,000 66 34 230 1661 3,218 0 2,470 0784 2.43 58 2,000 44 25 230 3,515 0 2,355 0785 2.43 58 1,000 52 34 230 1665 2,544 0 2,465 0786 2.43 45 1,000 39 39 786 2,314 0 2,314 0787 2.43 54 1,000 48 34 230 2,953 0 2,445 0788 2.43 54 1,000 49 34 230 3,038 0 2,442 0789 2.43 56 1,000 51 34 230 3,170 0 2,435 0790 2.43 63 1,000 58 34 230 3,683 0 2,437 0791 2.43 71 1,000 66 34 230 4,083 0 2,442 0792 2.43 82 1,000 76 34 230 1674 2,475 0 2,442 0793 2.43 82 1,000 76 34 230 1675 2,123 0 2,442 0794 2.43 88 1,000 81 34 230 1676 2,876 0 2,442 0795 2.43 89 1,000 81 34 230 1677 2,659 0 2,442 0796 2.43 84 1,000 78 34 230 1679 2,856 0 2,442 0797 2.43 80 1,000 74 34 230 1680 3,400 0 2,442 0798 2.43 74 1,000 68 34 230 1681 2,730 0 2,442 0799 2.43 74 1,000 69 34 230 4,166 0 2,448 0800 2.43 61 1,000 56 34 230 3,570 0 2,424 0801 2.43 67 1,000 61 34 230 1687 2,430 0 2,420 0802 2.43 63 1,000 57 34 230 3,462 0 2,417 0803 2.43 58 1,000 53 34 230 3,456 0 2,414 0804 2.43 41 1,000 36 34 230 2,401 0 2,305 0805 2.43 41 1,000 35 35 805 2,086 0 2,086 0806 2.43 46 1,000 37 37 806 1,838 0 1,837 0808 2.43 77 1,000 57 45 613 1252 1,294 0 1,710 0809 2.43 89 1,000 74 74 809 1419 1,567 0 2,270 0810 2.43 73 1,000 -75 -75 810 1398 392 608 563 437811 2.43 98 1,000 90 90 811 1707 1,567 0 3,639 0812 2.43 76 2,000 35 35 812 1416 1,567 433 2,414 0813 2.43 79 3,250 72 26 718 1713 2,126 1,124 5,779 0815 2.43 97 1,000 23 23 815 940 881 119 1,060 0816 2.43 105 1,000 78 56 247 1566 881 119 1,749 0817 2.43 52 1,000 39 39 817 949 1,567 0 1,660 0818 2.43 70 1,000 24 24 818 1,519 0 1,519 0819 2.43 72 1,000 23 23 819 1,246 0 1,246 0820 2.43 41 1,000 28 28 820 1,329 0 1,329 0833 2.43 52 3,500 -71 -71 833 1,668 1,832 1,668 1,832836 2.43 48 2,000 32 32 836 2,676 0 2,676 0837 2.43 41 2,000 28 22 684 2,634 0 2,335 0838 2.43 62 2,000 -20 -20 838 1751 645 1,355 1,373 627839 2.43 56 3,500 33 18 550 4,361 0 3,314 186840 2.43 47 3,500 14 14 840 3,099 401 3,099 401841 2.43 62 3,500 28 16 550 3,917 0 3,193 307842 2.43 95 3,000 79 23 718 1762 2,192 808 3,882 0844 2.43 90 2,000 53 21 684 1938 1,540 460 2,184 0845 2.43 80 2,000 34 21 684 2,305 0 2,184 0846 2.43 80 1,000 67 26 684 2,273 0 2,184 0847 2.43 90 2,000 47 21 684 1771 2,198 0 2,184 0848 2.43 84 1,000 68 68 848 1773 1,567 0 2,169 0853 2.43 33 1,000 30 25 684 2,401 0 1,887 0854 2.43 33 1,000 30 26 685 2,509 0 1,974 0855 2.43 33 1,000 30 26 686 2,834 0 2,244 0856 2.43 33 1,000 30 26 686 2,650 0 2,084 0857 2.43 88 2,000 28 26 851 1796 1,564 436 2,119 0858 2.43 97 2,000 31 26 851 2,175 0 2,119 0862 2.43 47 3,500 -31 -31 602 1799 1,564 1,936 1,934 1,566
Page 8 of 48

City of Oak Harbor 2013 Maximum Day DemandWater System Plan Fire Flow ScenarioNovember 2013 Existing System
Node ID
StaticDemand
(gpm)
StaticPressure
(psi)
Min. Fire FlowRequirement
(gpm)
ResidualPressure atRequired FF
(psi)
Min. SystemPressure atRequired FF
(psi)CriticalNode
CriticalPipe
Available Floww/ VelocityLimitations
(gpm)
FF Deficiencybased on
Velocity (gpm)
Available Floww/ PressureLimitations
(gpm)
FF Deficiencybased on
Pressure (gpm)863 2.43 58 1,000 43 31 315 1803 876 124 1,353 0864 2.43 46 1,000 42 27 718 3,253 0 2,944 0868 2.43 43 2,000 31 23 684 1815 2,582 0 2,566 0869 2.43 89 3,500 -68 -68 869 1818 1,567 1,933 2,249 1,251875 2.43 42 1,000 33 33 875 1,738 0 1,737 0880 2.43 95 3,500 75 23 593 1852 4,105 0 3,805 0885 2.43 94 3,500 68 23 593 1838 1,972 1,528 3,794 0887 2.43 94 3,500 59 23 593 1849 2,382 1,118 3,795 0888 2.43 94 3,500 56 23 593 1843 2,655 845 3,807 0889 2.43 76 1,000 67 35 875 2,808 0 2,108 0890 2.43 76 1,000 54 54 890 1888 881 119 1,671 0896 2.43 76 1,000 64 64 896 2,471 0 2,470 0900 2.43 54 1,000 51 51 900 368 2,808 0 3,862 0901 2.43 51 2,000 41 41 901 370 1,564 436 3,784 0903 2.43 52 2,000 33 33 903 371 1,567 433 2,640 0919 2.43 68 1,000 6 6 919 816 184 816 184920 2.43 63 1,000 57 35 230 373 2,647 0 2,860 0923 2.43 50 1,000 39 39 923 376 881 119 1,731 0924 2.43 56 3,500 16 16 924 983 3,060 440 3,326 174925 2.43 91 3,500 58 22 593 378 2,460 1,040 3,653 0926 2.43 83 3,500 -4 -4 926 379 1,567 1,933 2,949 551927 2.43 87 3,500 -3 -3 928 1324 1,562 1,938 2,990 510928 2.43 87 3,500 -55 -55 928 381 1,567 1,933 2,339 1,161929 2.43 69 1,000 48 48 929 1147 1,125 0 1,656 0930 2.43 67 1,000 58 34 230 2,621 0 2,417 0931 2.43 95 3,000 43 17 875 384 1,567 1,433 2,768 232932 2.43 69 2,000 41 25 230 385 1,567 433 2,411 0933 2.43 58 2,000 43 24 230 3,446 0 2,306 0934 2.43 95 3,000 51 23 718 387 1,613 1,387 3,850 0935 2.43 50 1,000 45 34 230 2,931 0 2,363 0936 2.43 50 1,000 39 39 936 391 1,567 0 1,794 0937 2.43 53 1,000 43 43 937 3,730 0 3,729 0
Page 9 of 48

City of Oak Harbor 2019 Maximum Day DemandWater System Plan Fire Flow ScenarioNovember 2013 Existing System w/ New East Zone
Node ID
StaticDemand
(gpm)
StaticPressure
(psi)
Min. Fire FlowRequirement
(gpm)
ResidualPressure atRequired FF
(psi)
Min. SystemPressure atRequired FF
(psi)CriticalNode
CriticalPipe
Available Floww/ VelocityLimitations
(gpm)
FF Deficiencybased on
Velocity (gpm)
Available Floww/ PressureLimitations
(gpm)
FF Deficiencybased on
Pressure (gpm)10 2.89 82 1,000 75 41 732 17 2,485 0 3,148 012 2.89 75 1,000 69 41 732 19 3,168 0 3,135 014 2.89 69 1,000 62 41 732 13 2,746 0 3,171 016 2.89 89 1,000 80 41 732 31 1,454 0 3,148 018 2.89 81 3,500 73 34 230 43 4,545 0 7,618 020 2.89 82 3,500 65 65 20 57 3,010 490 6,768 022 2.89 81 3,500 70 33 230 47 3,879 0 7,322 024 2.89 81 3,500 69 33 230 49 3,342 158 7,281 026 2.89 81 3,500 70 33 230 43 2,830 670 7,478 028 2.89 58 1,000 52 33 230 3,397 0 2,317 030 2.89 53 1,000 48 33 230 2,966 0 2,329 032 2.89 49 1,000 43 33 230 2,637 0 2,337 034 2.89 60 1,000 53 33 230 2,820 0 2,316 036 2.89 60 1,000 52 33 230 2,733 0 2,316 038 2.89 59 1,000 51 33 230 2,652 0 2,316 040 2.89 64 1,000 56 33 230 2,718 0 2,316 042 2.89 62 1,000 54 33 230 2,654 0 2,316 044 2.89 64 1,000 55 33 230 83 2,257 0 2,316 046 2.89 66 1,000 57 33 230 2,581 0 2,316 048 2.89 64 1,000 55 33 230 2,458 0 2,316 050 2.89 74 1,000 64 33 230 93 2,448 0 2,316 052 2.89 71 1,000 62 33 230 95 2,445 0 2,316 054 2.89 79 3,500 73 33 230 109 4,509 0 7,539 056 2.89 76 2,000 49 49 56 111 1,541 459 2,940 058 2.89 45 1,000 44 27 684 5,956 0 3,610 060 2.89 46 1,000 44 27 684 115 2,975 0 3,844 062 2.89 48 1,000 46 27 684 123 3,963 0 3,918 064 2.89 48 1,000 46 27 684 121 4,048 0 3,890 066 2.89 49 1,000 47 27 684 131 3,644 0 3,951 068 2.89 49 1,000 46 27 684 123 3,695 0 4,000 070 2.89 72 1,000 69 27 684 133 3,514 0 3,761 072 2.89 60 1,000 56 53 114 135 2,164 0 3,616 074 2.89 59 1,000 55 55 74 3,473 0 3,472 076 2.89 98 1,000 73 73 76 141 1,567 0 1,866 078 2.89 40 1,000 35 33 230 2,254 0 2,211 080 2.89 45 2,000 26 23 230 2,372 0 2,218 082 2.89 49 2,000 30 23 230 2,581 0 2,220 084 2.89 53 2,000 36 23 230 2,949 0 2,231 086 2.89 53 2,000 35 23 230 2,820 0 2,243 088 2.89 95 1,000 93 28 686 165 5,054 0 5,970 090 2.89 95 1,000 93 28 686 163 3,500 0 5,965 092 2.89 85 3,000 71 27 230 179 3,000 0 4,746 094 2.89 66 1,000 61 33 230 3,845 0 2,338 096 2.89 62 1,000 57 33 230 3,592 0 2,359 098 2.89 90 1,000 84 84 98 185 1,779 0 4,169 0100 2.89 89 1,000 83 83 100 187 1,616 0 4,156 0102 2.89 62 3,500 -57 -67 577 189 1,564 1,936 1,732 1,768104 2.89 70 1,000 63 63 104 1265 1,677 0 3,227 0106 2.89 84 1,000 77 28 684 195 1,567 0 3,251 0108 2.89 61 1,000 50 50 613 1252 1,317 0 2,340 0110 2.89 87 1,000 80 80 110 1595 1,617 0 3,555 0112 2.89 70 1,000 66 28 684 201 2,786 0 4,133 0114 2.89 56 1,000 51 51 114 203 2,704 0 2,895 0116 2.89 97 3,500 67 67 116 205 1,828 1,672 5,784 0128 3.23 96 2,500 86 28 684 237 4,200 0 7,900 0134 2.89 94 1,000 90 28 684 287 3,613 0 5,488 0136 2.89 95 1,000 91 28 684 289 3,905 0 5,327 0138 2.89 94 1,000 91 28 684 289 3,980 0 5,509 0140 2.89 94 1,000 91 28 684 291 3,145 0 5,657 0142 2.89 97 1,000 94 28 684 293 3,718 0 5,691 0144 2.89 101 1,000 97 28 684 1925 2,852 0 5,435 0146 2.89 101 1,000 96 28 684 1926 2,760 0 5,009 0148 2.89 70 1,000 59 59 148 277 1,544 0 2,516 0215 2.89 112 1,000 106 36 875 1637 4,446 0 2,614 0216 2.89 48 2,000 41 25 684 921 4,443 0 3,456 0217 2.89 69 1,000 67 27 684 1504 3,511 0 3,761 0218 2.89 79 1,000 33 23 919 925 2,124 0 1,573 0219 2.89 95 1,000 84 64 896 3,102 0 2,609 0220 2.89 99 1,000 88 36 875 3,298 0 2,614 0221 2.89 81 3,500 74 34 230 1708 5,888 0 7,768 0222 2.89 86 2,000 72 72 222 930 3,525 0 5,151 0228 2.89 74 1,000 70 27 684 923 4,393 0 3,761 0229 2.89 61 1,000 57 34 230 3,905 0 2,781 0230 2.89 38 2,000 22 22 230 2,139 0 2,139 0231 0 77 2,000 76 28 684 10,385 0 10,558 0232 2.89 80 3,500 64 37 577 1331 7,055 0 5,254 0233 2.89 77 1,000 30 23 919 1,830 0 1,494 0235 2.89 79 1,000 30 22 352 1,751 0 1,234 0236 2.89 81 1,000 26 22 352 1,248 0 1,235 0237 2.89 39 1,000 33 33 237 1518 1,758 0 1,988 0238 2.89 49 1,000 47 37 237 129 2,995 0 3,658 0239 2.89 51 1,000 50 27 684 1008 5,924 0 4,446 0240 2.89 71 1,000 23 22 352 1,300 0 1,230 0
Page 10 of 48

City of Oak Harbor 2019 Maximum Day DemandWater System Plan Fire Flow ScenarioNovember 2013 Existing System w/ New East Zone
Node ID
StaticDemand
(gpm)
StaticPressure
(psi)
Min. Fire FlowRequirement
(gpm)
ResidualPressure atRequired FF
(psi)
Min. SystemPressure atRequired FF
(psi)CriticalNode
CriticalPipe
Available Floww/ VelocityLimitations
(gpm)
FF Deficiencybased on
Velocity (gpm)
Available Floww/ PressureLimitations
(gpm)
FF Deficiencybased on
Pressure (gpm)241 2.89 90 1,000 41 22 352 2,117 0 1,235 0242 2.89 94 1,000 45 22 352 2,239 0 1,236 0243 2.89 70 1,000 63 63 243 193 3,186 0 3,225 0244 2.89 78 1,000 73 28 684 1299 2,442 0 3,704 0245 2.89 76 1,000 72 28 684 1274 4,702 0 5,071 0246 2.89 89 3,500 61 61 246 1179 2,557 943 5,565 0247 2.89 76 1,000 55 55 247 1095 878 122 1,716 0248 2.89 66 1,000 60 40 732 1096 2,542 0 3,071 0249 2.89 51 1,000 46 40 732 3,157 0 2,872 0250 2.89 52 1,000 45 45 250 966 1,759 0 2,331 0251 2.89 83 3,500 62 30 581 1309 4,221 0 4,479 0252 2.89 70 1,000 70 28 686 9,717 0 7,986 0253 2.89 78 1,000 77 28 686 1428 8,269 0 7,420 0254 2.89 52 2,000 48 25 684 6,652 0 3,722 0255 2.89 51 1,000 49 27 686 972 3,372 0 4,024 0256 2.89 46 1,000 44 27 686 973 3,315 0 4,029 0257 2.89 46 1,000 44 27 686 974 3,813 0 3,911 0258 2.89 38 1,000 37 27 686 4,980 0 3,423 0259 2.89 43 1,000 42 27 686 979 2,828 0 3,632 0260 2.89 49 1,000 45 45 260 964 2,326 0 3,303 0261 2.89 51 1,000 48 48 261 964 3,279 0 4,029 0262 2.89 59 1,000 56 56 262 957 2,473 0 4,043 0263 2.89 60 1,000 56 56 263 962 2,370 0 3,852 0264 2.89 55 1,000 51 51 264 963 1,977 0 3,145 0265 2.89 50 1,000 48 27 686 982 4,216 0 4,340 0266 2.89 42 1,000 39 39 266 970 1,956 0 2,867 0267 2.89 43 1,000 40 40 267 970 2,400 0 3,150 0268 2.89 41 1,000 38 38 268 976 1,974 0 2,959 0269 2.89 39 1,000 38 27 686 5,004 0 3,401 0270 2.89 41 1,000 40 27 686 5,174 0 3,858 0271 2.89 68 1,000 66 27 686 1477 4,417 0 4,680 0272 2.89 67 1,000 64 64 272 959 1,866 0 4,722 0273 2.89 68 1,000 65 27 686 955 3,123 0 5,345 0274 2.89 82 1,000 81 28 686 1430 7,803 0 5,714 0275 2.89 83 3,000 76 25 686 1440 5,835 0 5,906 0276 2.89 85 3,000 78 26 686 1436 6,090 0 6,827 0277 2.89 96 2,000 89 89 277 981 3,795 0 7,948 0278 2.89 95 3,000 85 26 686 1456 6,519 0 8,397 0279 2.89 88 3,000 80 26 686 956 5,489 0 6,968 0280 2.89 61 1,000 59 28 686 1601 5,318 0 6,136 0281 2.89 53 1,000 51 51 281 990 5,056 0 5,393 0282 2.89 61 1,000 57 57 282 991 1,623 0 3,658 0283 2.89 64 1,000 56 56 283 993 1,488 0 2,575 0284 2.89 58 1,000 53 53 938 994 1,854 0 3,111 0285 2.89 52 1,000 50 50 285 987 4,437 0 5,237 0286 2.89 52 1,000 50 50 286 986 4,566 0 5,622 0287 2.89 52 1,000 51 28 686 982 4,973 0 5,698 0288 2.89 54 3,500 33 33 288 985 3,111 389 4,551 0289 2.89 58 3,500 30 30 289 995 2,808 692 4,111 0290 2.89 54 3,500 36 36 290 996 2,457 1,043 4,962 0291 2.89 72 1,000 71 63 292 1003 2,770 0 6,560 0292 2.89 65 1,000 62 62 292 999 2,367 0 4,320 0293 2.89 92 1,000 89 89 293 997 3,115 0 6,613 0294 2.89 76 1,000 73 73 294 1002 3,105 0 5,886 0295 2.89 82 2,000 73 73 295 1588 2,971 0 5,901 0296 2.89 89 1,000 85 85 296 1465 2,013 0 4,996 0297 2.89 77 1,000 72 72 297 952 2,307 0 3,882 0298 2.89 63 1,000 61 61 298 997 2,686 0 4,708 0299 2.89 52 1,000 51 27 684 1009 6,402 0 4,934 0300 2.89 41 1,000 28 28 300 1,283 0 1,283 0301 2.89 44 1,000 37 34 300 2,012 0 1,871 0302 2.89 48 1,000 42 36 300 1012 2,091 0 2,098 0303 2.89 56 1,000 54 54 303 1004 4,149 0 6,869 0304 2.89 59 1,000 57 39 300 1015 2,146 0 3,779 0305 2.89 56 1,500 54 27 684 1016 6,213 0 5,751 0306 2.89 45 1,000 44 28 684 1017 5,981 0 7,109 0307 2.89 52 1,000 48 48 307 1005 2,299 0 3,309 0308 2.89 63 1,000 62 28 684 1579 9,661 0 12,494 0309 2.89 67 1,000 63 48 817 1580 1,827 0 3,135 0310 2.89 59 1,000 52 45 817 1057 1,564 0 2,321 0315 2.89 45 1,000 -7 -7 315 671 329 671 329316 2.89 55 1,000 26 16 315 1804 878 122 930 70318 2.89 46 1,000 25 23 317 1068 878 122 1,090 0319 2.89 58 1,000 48 34 317 1577 867 133 1,692 0320 2.89 105 2,000 96 93 658 1030 3,389 0 7,309 0321 2.89 103 3,000 90 90 321 1715 3,872 0 8,616 0322 2.89 92 1,000 88 88 322 1031 2,382 0 4,826 0323 2.89 76 1,000 74 50 817 1582 3,623 0 5,655 0324 2.89 83 1,000 73 73 324 1062 1,272 0 2,773 0325 2.89 84 1,000 79 79 325 1035 2,117 0 4,295 0326 2.89 76 1,000 74 50 817 1064 4,191 0 5,868 0327 2.89 89 1,000 84 84 327 1035 2,340 0 4,638 0328 2.89 90 1,000 84 84 328 1034 1,532 0 3,700 0
Page 11 of 48

City of Oak Harbor 2019 Maximum Day DemandWater System Plan Fire Flow ScenarioNovember 2013 Existing System w/ New East Zone
Node ID
StaticDemand
(gpm)
StaticPressure
(psi)
Min. Fire FlowRequirement
(gpm)
ResidualPressure atRequired FF
(psi)
Min. SystemPressure atRequired FF
(psi)CriticalNode
CriticalPipe
Available Floww/ VelocityLimitations
(gpm)
FF Deficiencybased on
Velocity (gpm)
Available Floww/ PressureLimitations
(gpm)
FF Deficiencybased on
Pressure (gpm)329 2.89 77 1,000 75 36 382 1064 3,225 0 5,140 0330 2.89 78 1,000 75 36 382 1083 4,200 0 4,425 0331 2.89 87 1,000 83 36 382 1084 2,172 0 4,314 0332 2.89 91 1,000 86 36 382 1086 2,419 0 4,242 0333 2.89 77 1,750 70 33 382 1083 3,989 0 4,118 0334 2.89 65 1,000 61 36 382 1081 2,681 0 3,831 0335 2.89 75 1,000 71 36 382 1087 3,094 0 3,805 0336 2.89 68 3,000 30 26 337 1092 1,509 1,491 3,278 0337 2.89 59 1,000 50 50 337 1091 1,640 0 2,215 0338 2.89 61 1,000 55 55 338 1088 1,552 0 3,090 0339 2.89 65 1,000 61 41 317 1080 3,620 0 3,762 0340 2.89 98 3,000 70 17 230 1114 4,600 0 2,693 307341 2.89 85 1,000 38 23 919 2,279 0 1,560 0342 2.89 79 1,000 33 23 919 2,326 0 1,583 0343 2.89 73 1,000 28 23 919 2,053 0 1,543 0344 2.89 76 1,000 31 23 919 2,287 0 1,498 0345 2.89 73 1,000 26 21 919 1,622 0 1,126 0346 2.89 81 1,000 28 22 352 1,408 0 1,235 0347 2.89 75 1,000 26 22 352 1,500 0 1,247 0348 2.89 82 1,000 26 26 348 1027 876 124 1,248 0349 2.89 80 1,000 30 23 352 1,575 0 1,343 0350 2.89 96 1,000 47 24 818 1526 2,262 0 1,592 0352 2.89 69 1,000 22 22 352 1,190 0 1,189 0353 2.89 73 1,000 23 23 353 1,259 0 1,258 0354 2.89 48 1,000 40 34 875 2,160 0 2,058 0355 2.89 46 1,000 38 35 875 2,146 0 2,096 0356 2.89 47 1,000 39 34 875 2,124 0 2,077 0357 2.89 50 1,000 42 34 875 2,287 0 2,057 0358 2.89 50 1,000 43 34 875 2,369 0 2,048 0359 2.89 46 1,000 39 34 875 2,125 0 2,068 0360 2.89 66 1,000 58 34 875 2,668 0 2,038 0361 2.89 68 1,000 60 34 875 2,891 0 2,025 0362 2.89 70 1,000 62 34 875 3,053 0 2,025 0363 2.89 54 1,000 47 34 875 2,658 0 2,014 0364 2.89 54 1,000 47 34 875 2,658 0 2,056 0365 2.89 88 3,500 65 31 577 6,511 0 4,347 0366 2.89 58 1,000 51 35 875 2,924 0 2,116 0367 2.89 51 1,000 44 35 875 2,480 0 2,104 0368 2.89 56 1,000 49 34 875 2,622 0 2,072 0369 2.89 59 1,000 52 35 875 2,851 0 2,120 0370 2.89 71 1,000 65 35 875 1136 3,290 0 2,172 0371 2.89 84 3,000 69 69 371 1051 3,522 0 6,444 0372 2.89 80 1,000 79 62 659 1039 3,203 0 6,689 0373 2.89 82 3,000 78 34 230 946 7,509 0 7,357 0374 2.89 98 2,000 54 54 423 1142 1,489 511 2,743 0375 2.89 62 2,000 59 35 435 6,277 0 4,699 0376 2.89 96 1,000 94 28 684 10,105 0 8,051 0377 2.89 78 1,000 74 28 684 1313 3,014 0 4,686 0378 2.89 83 1,000 80 28 684 1360 2,225 0 5,421 0379 2.89 71 1,000 65 65 379 1617 2,692 0 3,286 0380 2.89 55 1,000 51 41 730 3,840 0 3,342 0381 2.89 40 1,000 36 36 381 2,722 0 2,722 0382 2.89 38 1,000 34 34 382 2,683 0 2,683 0383 2.89 49 1,000 45 37 381 3,621 0 3,156 0384 2.89 58 1,000 54 41 317 1080 4,258 0 3,490 0386 2.89 63 1,000 60 34 230 4,825 0 2,807 0387 2.89 66 1,000 62 34 230 4,790 0 2,800 0388 2.89 42 1,000 38 35 230 3,339 0 3,055 0389 2.89 38 1,000 35 35 390 3,276 0 3,265 0390 2.89 38 1,000 34 34 390 2,748 0 2,748 0391 2.89 44 1,000 41 35 230 3,231 0 3,109 0392 2.89 47 1,000 43 37 727 3,296 0 3,058 0393 2.89 59 1,000 54 35 230 1099 3,374 0 3,053 0394 2.89 49 2,000 36 29 230 1651 2,785 0 3,023 0395 2.89 45 1,000 40 40 395 2,787 0 2,787 0396 2.89 51 1,000 46 41 732 3,150 0 3,050 0397 2.89 47 1,000 42 42 397 2,852 0 2,852 0398 2.89 56 1,000 51 35 230 3,382 0 3,030 0399 2.89 60 1,000 54 35 230 1108 3,106 0 3,027 0400 2.89 55 1,000 50 35 230 1100 3,173 0 3,028 0401 2.89 58 1,000 53 35 230 3,456 0 3,026 0402 2.89 51 1,000 46 46 402 1111 2,910 0 2,985 0403 2.89 59 1,000 54 35 230 3,892 0 2,991 0404 2.89 59 1,000 54 35 230 1112 3,405 0 3,069 0405 2.89 71 3,000 63 24 230 1636 4,928 0 3,675 0406 2.89 82 1,000 77 34 230 5,023 0 2,644 0407 2.89 79 3,000 54 16 230 5,075 0 2,632 368408 2.89 77 1,000 72 34 230 1135 3,914 0 2,474 0409 2.89 63 1,000 61 61 409 1574 2,679 0 5,417 0410 2.89 81 1,000 78 78 410 1048 2,934 0 4,623 0411 2.89 67 1,000 64 60 659 1040 2,917 0 4,205 0412 2.89 64 2,000 53 53 412 1042 2,930 0 4,216 0413 2.89 55 1,000 51 51 413 1045 2,879 0 3,336 0
Page 12 of 48

City of Oak Harbor 2019 Maximum Day DemandWater System Plan Fire Flow ScenarioNovember 2013 Existing System w/ New East Zone
Node ID
StaticDemand
(gpm)
StaticPressure
(psi)
Min. Fire FlowRequirement
(gpm)
ResidualPressure atRequired FF
(psi)
Min. SystemPressure atRequired FF
(psi)CriticalNode
CriticalPipe
Available Floww/ VelocityLimitations
(gpm)
FF Deficiencybased on
Velocity (gpm)
Available Floww/ PressureLimitations
(gpm)
FF Deficiencybased on
Pressure (gpm)414 2.89 63 1,000 60 52 413 1042 3,748 0 3,973 0415 2.89 65 1,000 62 52 413 1046 2,574 0 3,979 0416 2.89 78 1,000 75 53 413 1567 2,893 0 4,755 0417 2.89 81 1,000 77 77 417 1050 2,853 0 4,661 0418 2.89 82 3,500 58 58 418 1420 2,220 1,280 5,567 0419 2.89 83 3,500 77 33 230 47 6,398 0 7,340 0420 2.89 85 3,000 72 32 230 1052 1,614 1,386 6,521 0421 2.89 85 3,000 78 32 230 1052 3,507 0 6,695 0422 2.89 86 3,500 76 30 230 1055 4,486 0 6,491 0423 2.89 97 2,000 31 31 423 2,178 0 2,178 0424 2.89 98 2,000 35 34 423 1144 1,561 439 2,230 0425 2.89 98 2,000 49 49 423 1145 1,558 442 2,583 0426 2.89 96 3,500 85 28 230 1140 4,616 0 5,437 0427 2.89 90 3,500 82 30 230 1630 7,284 0 6,317 0428 2.89 95 3,500 86 30 230 1139 5,304 0 6,270 0429 2.89 59 2,000 57 36 435 929 2,220 0 4,674 0430 2.89 56 1,000 54 36 435 928 2,618 0 3,995 0431 2.89 54 1,000 52 36 435 1228 2,972 0 3,656 0432 2.89 52 1,000 49 35 435 1229 2,936 0 3,325 0433 2.89 45 1,000 42 35 435 1230 2,845 0 3,128 0434 2.89 42 1,000 39 35 435 2,900 0 2,876 0435 2.89 37 2,000 26 26 435 2,557 0 2,557 0436 2.89 66 2,000 61 35 435 1208 4,677 0 4,644 0437 2.89 69 2,000 61 34 435 1209 2,620 0 4,317 0438 2.89 61 2,000 50 50 438 1211 2,049 0 4,000 0439 2.89 60 1,000 57 36 435 1226 2,574 0 3,709 0440 2.89 57 1,000 53 53 440 1224 2,093 0 3,388 0441 2.89 48 1,000 43 43 441 1218 1,937 0 2,539 0442 2.89 42 2,000 31 27 435 2,970 0 2,695 0443 2.89 53 1,000 49 49 443 1222 2,081 0 2,941 0444 2.89 96 2,000 87 30 435 1216 4,242 0 3,304 0445 2.89 64 1,000 62 36 435 1213 4,139 0 3,637 0446 2.89 90 3,000 55 30 754 1616 3,088 0 3,498 0447 2.89 74 3,000 48 31 754 1199 3,169 0 3,616 0448 2.89 64 3,000 40 25 435 1205 3,444 0 3,548 0449 2.89 77 3,500 50 22 435 1203 3,732 0 3,655 0450 2.89 87 3,000 65 26 435 1201 3,053 0 3,682 0451 2.89 94 3,000 68 27 435 1197 2,509 491 3,732 0452 2.89 95 3,500 56 56 452 1180 2,901 599 4,944 0453 2.89 97 3,500 42 42 453 1165 2,005 1,495 4,191 0454 2.89 97 3,500 78 34 435 1168 2,333 1,167 6,621 0455 2.89 91 3,500 76 34 435 1164 4,211 0 6,942 0456 2.89 97 3,500 84 34 435 1164 5,495 0 6,787 0457 2.89 89 3,500 71 34 435 1169 3,470 30 6,499 0458 2.89 81 3,500 67 34 435 1163 5,149 0 6,369 0459 2.89 81 3,500 59 33 435 1188 3,710 0 5,766 0460 2.89 82 3,500 60 33 435 1178 3,369 131 5,885 0461 2.89 70 3,500 56 33 435 1172 4,830 0 5,933 0462 2.89 65 2,000 59 59 462 1189 3,787 0 5,524 0463 2.89 67 3,500 45 45 463 1177 3,060 440 5,096 0464 2.89 81 3,500 54 54 464 1187 3,029 471 5,316 0465 2.89 90 3,500 27 27 465 1183 1,444 2,056 3,711 0466 2.89 90 3,500 60 60 466 1184 2,548 952 5,428 0467 2.89 90 3,500 69 31 435 1195 3,515 0 5,004 0468 2.89 75 2,000 69 35 435 1194 3,180 0 4,824 0469 2.89 66 2,000 61 35 435 1208 3,418 0 4,777 0470 2.89 90 3,500 22 22 470 1192 1,866 1,634 3,554 0471 2.89 61 3,000 48 33 435 1190 3,249 0 5,049 0472 2.89 63 3,000 53 34 435 1190 5,697 0 5,442 0473 2.89 68 3,000 54 54 473 1174 3,346 0 5,624 0474 2.89 69 3,000 56 34 435 1175 3,894 0 5,872 0475 2.89 78 3,000 56 56 475 1166 2,837 163 5,093 0476 2.89 65 1,000 63 37 435 1149 4,164 0 5,342 0477 2.89 62 1,000 61 61 477 1150 3,277 0 5,074 0478 2.89 62 1,000 38 38 478 1750 910 90 1,363 0479 2.89 67 1,000 33 33 479 382 743 257 1,189 0480 2.89 73 1,000 65 58 929 1159 1,296 0 2,593 0481 2.89 69 1,000 67 67 481 1151 3,115 0 4,778 0482 2.89 70 1,000 60 60 482 1155 1,725 0 2,418 0483 2.89 68 1,000 58 58 483 1158 1,755 0 2,372 0484 2.89 78 1,000 69 69 484 1161 1,373 0 2,770 0485 2.89 77 1,000 68 68 485 1160 1,213 0 2,730 0486 2.89 79 1,000 77 65 929 1415 2,892 0 6,475 0487 2.89 89 3,500 72 39 581 1853 4,950 0 6,559 0488 2.89 94 3,500 58 58 488 1840 3,176 324 5,162 0489 2.89 86 2,000 73 73 489 1240 3,230 0 4,852 0490 2.89 95 3,500 80 40 581 1234 4,983 0 6,887 0491 2.89 97 1,000 95 45 581 1234 5,810 0 7,795 0492 2.89 101 2,000 96 27 686 1446 5,493 0 8,050 0493 2.89 99 1,000 97 97 493 1237 3,782 0 7,625 0494 2.89 97 1,000 95 28 686 1237 4,730 0 8,276 0495 2.89 100 2,000 90 90 495 1238 2,909 0 6,515 0496 2.89 100 2,000 91 91 496 1239 3,730 0 6,647 0
Page 13 of 48

City of Oak Harbor 2019 Maximum Day DemandWater System Plan Fire Flow ScenarioNovember 2013 Existing System w/ New East Zone
Node ID
StaticDemand
(gpm)
StaticPressure
(psi)
Min. Fire FlowRequirement
(gpm)
ResidualPressure atRequired FF
(psi)
Min. SystemPressure atRequired FF
(psi)CriticalNode
CriticalPipe
Available Floww/ VelocityLimitations
(gpm)
FF Deficiencybased on
Velocity (gpm)
Available Floww/ PressureLimitations
(gpm)
FF Deficiencybased on
Pressure (gpm)497 2.89 94 2,000 75 66 618 1399 2,750 0 4,122 0498 2.89 88 2,000 68 68 498 1410 2,382 0 3,904 0499 2.89 85 2,000 66 66 499 1243 1,872 128 4,006 0500 2.89 77 2,000 62 62 500 1244 2,269 0 4,219 0501 2.89 58 1,000 52 52 501 1259 3,105 0 3,339 0502 2.89 74 3,500 51 51 502 1244 4,230 0 5,729 0503 2.89 54 2,000 27 27 503 1254 1,452 548 2,285 0504 2.89 61 1,000 52 51 613 1252 1,318 0 2,592 0505 2.89 64 1,000 58 58 505 1251 2,889 0 3,856 0507 2.89 75 1,000 72 28 684 1381 3,831 0 5,413 0508 2.89 53 1,000 46 46 508 1745 2,945 0 3,026 0509 2.89 74 2,000 40 40 509 1247 1,702 298 2,623 0510 2.89 81 3,500 61 42 514 1266 5,165 0 6,469 0511 2.89 67 1,000 62 50 514 1262 3,744 0 3,792 0512 2.89 70 3,250 38 27 514 1249 4,029 0 3,703 0513 2.89 68 1,000 62 50 514 1251 4,065 0 3,736 0514 2.89 56 1,000 50 50 514 3,377 0 3,377 0515 2.89 57 1,000 51 51 515 3,489 0 3,489 0516 2.89 58 1,000 50 50 516 1260 1,985 0 2,884 0517 2.89 70 1,000 65 65 517 1268 2,813 0 4,074 0518 2.89 83 3,500 65 53 517 1267 5,533 0 6,510 0519 2.89 83 3,500 68 38 581 1275 6,458 0 6,345 0520 2.89 83 3,500 66 39 581 1277 5,123 0 6,402 0521 2.89 78 1,000 51 51 521 1383 1,009 0 1,538 0522 2.89 65 1,000 57 57 522 1283 1,390 0 2,715 0523 2.89 67 1,000 55 55 523 1282 1,478 0 2,274 0524 2.89 70 1,000 59 59 524 1280 1,897 0 2,400 0525 2.89 70 1,000 59 59 525 1269 1,667 0 2,409 0526 2.89 78 1,000 74 28 684 1273 4,322 0 4,879 0527 2.89 78 1,000 74 28 684 1274 4,100 0 4,914 0528 2.89 78 1,000 74 28 684 1377 4,027 0 5,348 0529 2.89 78 1,000 75 28 684 1300 5,865 0 6,275 0530 2.89 74 1,000 71 28 684 5,077 0 5,077 0531 2.89 78 1,000 76 28 684 1301 5,731 0 6,312 0532 2.89 86 3,500 69 36 581 1289 6,881 0 5,640 0533 2.89 63 1,000 59 59 533 1294 3,078 0 3,720 0534 2.89 75 1,000 71 28 684 4,890 0 4,890 0535 2.89 73 1,000 68 28 684 1306 2,465 0 3,965 0536 2.89 63 1,000 58 58 536 1295 2,670 0 3,555 0537 2.89 63 1,000 59 59 537 1293 3,228 0 4,013 0538 2.89 85 3,500 68 37 581 1276 6,691 0 6,031 0539 2.89 86 3,500 69 37 581 1290 6,428 0 5,938 0540 2.89 80 1,000 35 35 540 1291 1,716 0 4,092 0541 2.89 76 1,000 53 53 541 1292 1,371 0 1,627 0542 2.89 64 1,000 46 46 544 1296 1,142 0 1,662 0543 2.89 96 1,000 94 28 684 1312 6,357 0 8,251 0544 2.89 63 1,000 36 36 544 1,305 0 1,305 0545 2.89 90 1,000 86 28 684 1311 3,652 0 5,531 0546 2.89 81 1,000 78 28 684 938 2,341 0 5,096 0547 2.89 83 1,000 79 28 684 1317 2,083 0 4,715 0548 2.89 75 1,000 69 28 684 1365 2,083 0 3,413 0549 2.89 71 1,000 66 28 684 1315 2,346 0 3,609 0550 2.89 70 1,000 66 28 684 1314 3,656 0 4,404 0551 2.89 70 3,500 46 22 581 1310 4,752 0 3,664 0552 2.89 94 3,500 72 31 577 1322 4,320 0 4,401 0554 2.89 81 3,500 53 26 577 5,406 0 3,877 0555 2.89 87 3,500 64 31 577 6,340 0 4,357 0556 2.89 87 3,500 62 28 577 1325 5,454 0 4,118 0557 2.89 81 3,500 51 26 577 1948 3,236 264 3,900 0558 2.89 83 3,500 48 28 577 1328 2,361 1,139 4,075 0559 2.89 85 3,500 45 30 577 1329 2,630 870 4,303 0560 2.89 81 3,500 43 43 560 1332 2,471 1,029 4,557 0561 2.89 81 3,500 69 41 577 1426 6,181 0 6,354 0562 2.89 76 3,500 49 45 563 1333 2,439 1,061 4,987 0563 2.89 72 3,500 27 27 563 1334 2,448 1,052 3,775 0564 2.89 76 3,500 17 17 565 1335 1,564 1,936 3,392 108565 2.89 76 3,500 2 2 565 3,011 489 3,011 489566 2.89 81 3,500 52 23 577 1948 3,838 0 3,722 0567 2.89 76 3,500 23 23 567 1339 1,567 1,933 3,614 0568 2.89 72 3,500 17 -2 577 3,411 89 2,639 861569 2.89 91 3,500 -34 -36 869 1346 1,564 1,936 2,544 956570 2.89 85 3,500 -23 -23 570 1341 1,567 1,933 2,654 846571 2.89 72 3,500 16 0 577 1344 2,302 1,198 2,692 808572 2.89 72 3,500 17 -2 577 1342 2,407 1,093 2,645 855573 2.89 72 3,500 20 0 577 1340 3,493 7 2,707 793574 2.89 85 3,500 11 -4 577 1345 2,758 742 2,603 897575 2.89 72 3,500 12 -7 577 3,248 252 2,514 986576 2.89 72 3,500 5 -15 577 3,051 449 2,364 1,136577 2.89 52 3,500 -115 -115 577 1,442 2,058 1,442 2,058578 2.89 61 3,500 37 22 581 4,568 0 3,675 0579 2.89 54 3,500 18 14 583 1353 2,281 1,219 3,171 329580 2.89 48 3,500 6 4 581 1356 2,747 753 2,741 759581 2.89 46 3,500 -37 -37 581 1355 1,567 1,933 1,891 1,609
Page 14 of 48

City of Oak Harbor 2019 Maximum Day DemandWater System Plan Fire Flow ScenarioNovember 2013 Existing System w/ New East Zone
Node ID
StaticDemand
(gpm)
StaticPressure
(psi)
Min. Fire FlowRequirement
(gpm)
ResidualPressure atRequired FF
(psi)
Min. SystemPressure atRequired FF
(psi)CriticalNode
CriticalPipe
Available Floww/ VelocityLimitations
(gpm)
FF Deficiencybased on
Velocity (gpm)
Available Floww/ PressureLimitations
(gpm)
FF Deficiencybased on
Pressure (gpm)582 2.89 56 3,500 24 16 581 1755 2,089 1,411 3,270 230583 2.89 50 3,500 -9 -9 583 1357 1,567 1,933 2,473 1,027584 2.89 84 3,000 75 28 684 261 8,515 0 8,495 0585 2.89 67 3,500 28 22 581 1358 1,567 1,933 3,664 0586 2.89 84 3,000 74 28 684 1359 4,401 0 8,434 0587 2.89 85 1,000 83 28 684 1361 6,957 0 8,029 0589 2.89 78 1,000 73 28 684 1364 1,813 0 3,722 0591 2.89 73 1,000 69 28 684 1306 3,347 0 4,380 0592 2.89 72 1,000 64 28 684 1369 1,567 0 2,787 0593 2.89 70 1,000 66 28 684 1367 2,880 0 4,109 0595 2.89 94 2,000 82 28 684 1371 3,112 0 5,429 0597 2.89 78 1,000 64 28 684 1373 878 122 2,137 0598 2.89 74 3,500 57 25 919 1359 4,828 0 6,897 0599 2.89 89 3,500 64 25 919 1760 3,518 0 5,621 0600 2.89 89 3,500 59 25 919 1760 3,518 0 5,082 0601 2.89 89 3,500 45 25 919 1376 1,567 1,933 4,471 0602 2.89 74 3,500 -13 -13 602 1799 1,564 1,936 2,697 803603 2.89 78 1,000 74 28 684 1377 3,532 0 5,311 0604 2.89 76 1,000 73 28 684 5,899 0 5,899 0605 2.89 71 1,000 60 60 605 1382 1,886 0 2,423 0606 2.89 75 1,000 70 28 684 1385 1,389 0 3,820 0607 2.89 76 1,000 72 28 684 1387 4,595 0 5,164 0608 2.89 81 2,500 47 28 684 1389 2,443 57 4,005 0611 2.89 61 1,000 49 49 613 1252 1,317 0 2,167 0613 2.89 61 1,000 44 44 613 1252 1,317 0 1,710 0614 2.89 68 1,000 -16 -16 614 1397 389 611 741 259615 2.89 97 2,000 80 80 811 1400 2,454 0 4,706 0616 2.89 91 2,000 45 45 616 1401 1,067 933 2,545 0617 2.89 92 3,500 25 25 617 1406 1,999 1,501 3,634 0618 2.89 84 2,000 64 64 618 3,870 0 3,870 0619 2.89 91 3,500 30 30 619 1407 3,486 14 3,790 0620 2.89 89 1,000 80 80 620 1409 1,567 0 3,188 0621 2.89 76 2,000 53 53 621 1411 1,544 456 3,308 0622 2.89 95 3,500 65 65 623 1412 2,607 893 5,808 0623 2.89 95 3,500 55 55 623 1414 3,525 0 4,937 0624 2.89 79 1,000 77 72 812 1422 2,869 0 6,560 0625 2.89 81 3,500 70 70 625 1421 3,664 0 7,173 0626 2.89 81 1,000 80 65 929 41 4,834 0 7,509 0627 2.89 85 3,500 78 28 684 207 6,175 0 8,717 0628 2.89 90 3,500 75 28 684 1427 2,448 1,052 8,669 0629 2.89 83 3,500 50 50 629 1429 1,567 1,933 4,965 0630 2.89 87 3,500 81 25 686 1431 6,883 0 6,315 0631 2.89 87 1,000 86 28 686 1430 8,088 0 6,080 0632 2.89 93 1,000 92 28 686 1432 3,160 0 6,014 0633 2.89 100 1,000 98 28 686 1433 3,482 0 5,990 0634 2.89 106 1,000 101 101 634 1434 1,567 0 4,484 0635 2.89 102 1,000 99 28 686 165 2,664 0 5,962 0636 2.89 89 3,000 82 25 686 1436 5,887 0 6,141 0637 2.89 102 1,000 96 96 637 1439 1,567 0 4,262 0638 2.89 87 3,000 80 25 686 1440 5,889 0 5,855 0639 2.89 89 1,000 87 28 686 1442 2,526 0 5,932 0640 2.89 71 3,000 38 38 640 1444 1,567 1,433 3,781 0641 2.89 78 3,000 67 26 686 1443 4,223 0 6,536 0642 2.89 102 1,000 100 28 686 1445 4,491 0 7,640 0643 2.89 93 3,500 80 26 686 1447 5,388 0 7,803 0644 2.89 95 1,000 92 92 644 1448 3,014 0 6,470 0645 2.89 97 1,000 95 95 645 1453 3,436 0 7,118 0646 2.89 102 1,000 98 98 646 1450 2,896 0 5,783 0647 2.89 97 1,000 95 95 647 1452 2,269 0 7,721 0648 2.89 95 1,000 92 92 648 1455 3,056 0 5,708 0649 2.89 95 2,000 84 84 651 1462 2,536 0 5,990 0650 2.89 93 3,000 82 26 686 1457 4,674 0 8,064 0651 2.89 95 3,000 47 47 651 1458 1,567 1,433 3,836 0652 2.89 95 3,500 68 68 652 1461 2,444 1,056 6,115 0653 2.89 97 3,500 78 78 653 1459 3,139 361 7,479 0654 2.89 102 3,000 90 26 686 1463 5,403 0 8,691 0655 2.89 91 2,000 84 84 655 1587 3,388 0 7,327 0656 2.89 91 1,000 88 88 656 1465 2,802 0 5,841 0657 2.89 108 3,500 72 66 658 1468 2,366 1,134 5,470 0658 2.89 102 3,500 40 40 658 1470 1,567 1,933 4,097 0659 2.89 63 1,000 36 36 659 1471 881 119 1,294 0660 2.89 81 1,000 78 76 661 1472 3,044 0 5,154 0661 2.89 79 1,000 73 73 661 1474 1,567 0 3,512 0662 2.89 87 3,500 40 40 662 1475 1,567 1,933 4,244 0663 2.89 76 1,000 75 27 686 1476 4,700 0 4,838 0664 2.89 78 2,000 72 26 686 1478 2,217 0 4,632 0665 2.89 74 2,000 66 26 686 1479 2,694 0 4,577 0666 2.89 76 2,000 65 26 686 1480 2,549 0 4,548 0667 2.89 69 2,000 57 49 675 1482 3,514 0 4,462 0668 2.89 66 2,000 55 48 675 1482 3,431 0 4,138 0669 2.89 65 2,000 54 48 675 1484 2,602 0 4,178 0670 2.89 59 2,000 49 49 670 1485 2,366 0 4,280 0671 2.89 56 2,000 49 26 686 1486 2,747 0 4,483 0
Page 15 of 48

City of Oak Harbor 2019 Maximum Day DemandWater System Plan Fire Flow ScenarioNovember 2013 Existing System w/ New East Zone
Node ID
StaticDemand
(gpm)
StaticPressure
(psi)
Min. Fire FlowRequirement
(gpm)
ResidualPressure atRequired FF
(psi)
Min. SystemPressure atRequired FF
(psi)CriticalNode
CriticalPipe
Available Floww/ VelocityLimitations
(gpm)
FF Deficiencybased on
Velocity (gpm)
Available Floww/ PressureLimitations
(gpm)
FF Deficiencybased on
Pressure (gpm)672 2.89 52 2,000 46 26 686 1489 2,323 0 4,375 0673 2.89 50 1,000 48 27 686 1488 5,037 0 4,185 0674 2.89 71 2,000 56 56 674 1491 3,110 0 3,874 0675 2.89 59 2,000 43 43 675 1494 3,132 0 3,305 0676 2.89 39 1,000 38 27 686 4,982 0 3,353 0677 2.89 39 2,000 18 18 677 1496 1,567 433 1,918 82678 2.89 37 1,000 35 27 686 4,681 0 3,110 0679 2.89 33 1,000 31 26 686 1499 3,004 0 2,384 0680 2.89 30 1,000 24 24 680 1,371 0 1,371 0681 2.89 33 1,000 30 26 684 2,831 0 2,338 0682 2.89 33 1,000 30 26 684 2,787 0 2,284 0683 2.89 33 1,000 30 26 684 2,812 0 2,225 0684 2.89 28 1,000 23 23 684 1,263 0 1,263 0685 2.89 28 1,000 22 22 685 1,227 0 1,227 0686 2.89 28 1,000 23 23 686 1,251 0 1,251 0687 2.89 90 2,000 50 26 843 1768 2,161 0 2,508 0688 2.89 59 2,000 53 25 684 1503 4,508 0 3,761 0689 2.89 80 2,000 73 25 684 1505 2,355 0 3,783 0690 2.89 56 2,000 48 25 684 1507 3,598 0 3,793 0691 2.89 54 2,000 50 25 684 6,875 0 3,876 0692 2.89 63 2,000 52 25 684 1509 3,103 0 3,788 0693 2.89 54 2,000 11 11 693 1512 881 1,119 1,771 229694 2.89 59 2,000 50 25 684 1510 2,908 0 3,788 0695 2.89 52 2,000 48 25 684 1513 6,162 0 4,002 0696 2.89 52 2,000 44 25 684 1515 1,567 433 4,002 0697 2.89 54 1,000 52 37 237 1516 2,393 0 3,825 0698 2.89 77 1,000 29 23 919 1,757 0 1,537 0699 2.89 79 1,000 32 23 919 1,918 0 1,525 0700 2.89 90 1,000 43 23 919 2,592 0 1,511 0701 2.89 71 1,000 23 22 352 1,305 0 1,225 0702 2.89 88 1,000 41 23 919 2,577 0 1,505 0703 2.89 92 1,000 44 23 919 2,493 0 1,505 0704 2.89 96 1,000 48 23 919 2,468 0 1,504 0705 2.89 94 1,000 46 23 919 2,566 0 1,503 0706 2.89 86 1,000 38 23 919 2,225 0 1,498 0707 2.89 41 1,000 34 34 820 2,048 0 2,048 0708 2.89 41 1,000 34 34 708 2,051 0 2,051 0709 2.89 41 1,000 36 36 709 2,455 0 2,455 0710 2.89 41 1,000 36 36 710 2,507 0 2,507 0711 2.89 41 1,000 37 37 711 1541 2,201 0 2,859 0712 2.89 38 1,000 35 35 712 3,184 0 3,183 0713 2.89 81 1,000 32 22 352 1,766 0 1,241 0714 2.89 86 1,000 35 22 352 1,802 0 1,241 0715 2.89 81 1,000 31 22 352 1,602 0 1,253 0716 2.89 79 1,000 29 22 352 1,613 0 1,240 0717 2.89 86 1,000 35 22 352 1,796 0 1,240 0718 0 28 1,000 26 36 390 2,551 0 4,300 0719 2.89 54 1,000 49 34 230 3,866 0 2,799 0720 2.89 54 1,000 49 34 230 3,813 0 2,789 0721 2.89 51 1,000 47 34 230 3,503 0 2,781 0722 2.89 56 1,000 51 34 230 1554 2,565 0 2,751 0723 2.89 64 1,000 58 34 230 1555 2,291 0 2,751 0724 2.89 54 1,000 49 34 230 3,402 0 2,691 0725 2.89 56 1,000 51 34 230 3,433 0 2,742 0726 2.89 62 1,000 57 34 230 1561 2,583 0 2,753 0727 2.89 41 1,000 36 36 727 1807 2,248 0 2,470 0728 2.89 41 1,000 18 18 728 1565 881 119 961 39729 2.89 54 1,000 49 40 730 1569 2,716 0 2,808 0730 2.89 45 1,000 26 26 730 1570 881 119 1,162 0731 2.89 54 1,000 48 39 732 1572 2,636 0 2,551 0732 2.89 45 1,000 25 25 732 1573 881 119 1,132 0733 2.89 62 1,000 62 36 230 103 3,177 0 4,976 0734 2.89 69 1,000 65 65 734 1575 3,111 0 4,231 0735 2.89 67 1,000 65 50 817 1579 1,810 0 5,507 0736 2.89 80 1,000 78 50 817 1582 4,187 0 6,272 0737 2.89 82 2,000 74 74 737 1583 2,866 0 6,085 0738 2.89 84 2,000 76 76 738 1585 2,886 0 6,182 0739 2.89 87 2,000 79 79 739 1586 4,171 0 7,070 0740 2.89 89 2,000 82 82 740 1587 3,686 0 7,280 0741 2.89 84 2,000 75 75 741 1591 2,760 0 5,738 0742 2.89 54 1,000 52 52 742 1593 2,707 0 5,087 0743 2.89 84 1,000 78 78 743 1594 1,807 0 3,455 0744 2.89 50 1,000 47 47 923 1597 3,126 0 4,048 0745 2.89 67 1,000 65 28 686 1598 4,768 0 6,304 0746 2.89 63 1,000 58 58 746 1601 1,658 0 3,283 0747 2.89 79 1,000 29 22 352 1,551 0 1,245 0748 2.89 43 1,000 37 35 708 2,233 0 2,205 0749 2.89 41 1,000 35 35 749 2,212 0 2,212 0750 2.89 41 1,000 36 36 750 2,615 0 2,615 0751 2.89 43 1,000 38 38 751 1611 2,518 0 2,528 0752 2.89 49 1,000 45 34 230 1613 2,643 0 2,867 0753 2.89 70 3,000 41 29 754 1615 2,707 293 3,472 0754 2.89 57 1,000 52 52 754 3,205 0 3,205 0
Page 16 of 48

City of Oak Harbor 2019 Maximum Day DemandWater System Plan Fire Flow ScenarioNovember 2013 Existing System w/ New East Zone
Node ID
StaticDemand
(gpm)
StaticPressure
(psi)
Min. Fire FlowRequirement
(gpm)
ResidualPressure atRequired FF
(psi)
Min. SystemPressure atRequired FF
(psi)CriticalNode
CriticalPipe
Available Floww/ VelocityLimitations
(gpm)
FF Deficiencybased on
Velocity (gpm)
Available Floww/ PressureLimitations
(gpm)
FF Deficiencybased on
Pressure (gpm)755 2.89 94 3,500 82 25 230 1620 5,542 0 4,688 0756 2.89 94 3,500 77 25 230 1621 2,357 1,143 4,612 0757 2.89 89 3,500 69 24 230 1623 2,867 633 4,583 0758 2.89 87 3,000 75 27 230 179 4,193 0 4,617 0759 2.89 92 3,000 74 27 230 1624 3,049 0 4,468 0760 2.89 92 3,000 75 27 230 1761 2,685 315 4,364 0761 2.89 87 3,500 68 28 230 1629 2,585 915 5,574 0762 2.89 89 3,500 76 28 230 1628 4,866 0 5,762 0763 2.89 89 3,500 75 29 230 1630 3,081 419 5,899 0764 2.89 85 3,500 52 52 764 1632 2,942 558 5,032 0765 2.89 96 3,500 50 50 765 1634 1,567 1,933 4,551 0766 2.89 92 3,000 83 26 230 1635 6,254 0 4,105 0767 2.89 112 1,000 106 36 875 1744 4,260 0 2,653 0768 2.89 84 3,000 53 16 230 1641 3,027 0 2,648 352769 2.89 92 3,000 66 16 230 1638 5,351 0 2,654 346770 2.89 79 3,000 51 16 230 1645 3,370 0 2,648 352771 2.89 77 3,000 52 16 230 4,997 0 2,674 326772 2.89 71 1,000 55 55 772 1646 881 119 1,918 0773 2.89 53 1,000 46 33 875 2,412 0 1,834 0774 2.89 75 1,000 64 64 896 2,515 0 2,515 0775 2.89 69 2,000 53 24 230 4,044 0 2,309 0776 2.89 49 2,000 37 29 230 3,438 0 3,014 0777 2.89 62 2,000 52 28 230 4,832 0 2,888 0778 2.89 71 1,000 66 34 230 1656 2,315 0 2,649 0779 2.89 66 1,000 61 33 230 3,743 0 2,401 0780 2.89 49 1,000 43 33 230 2,721 0 2,352 0781 2.89 45 1,000 39 33 230 2,485 0 2,348 0782 2.89 45 1,000 38 38 782 2,235 0 2,235 0783 2.89 71 1,000 65 33 230 1661 3,209 0 2,366 0784 2.89 58 2,000 42 23 230 3,460 0 2,257 0785 2.89 58 1,000 51 33 230 1665 2,544 0 2,363 0786 2.89 45 1,000 38 38 786 2,246 0 2,246 0787 2.89 53 1,000 47 33 230 2,889 0 2,343 0788 2.89 53 1,000 48 33 230 2,972 0 2,340 0789 2.89 56 1,000 50 33 230 3,106 0 2,333 0790 2.89 62 1,000 57 33 230 3,636 0 2,335 0791 2.89 71 1,000 65 33 230 4,099 0 2,340 0792 2.89 82 1,000 75 33 230 1674 2,473 0 2,340 0793 2.89 82 1,000 75 33 230 1675 2,122 0 2,340 0794 2.89 87 1,000 80 33 230 1676 2,875 0 2,340 0795 2.89 88 1,000 80 33 230 1677 2,659 0 2,340 0796 2.89 84 1,000 76 33 230 1679 2,855 0 2,340 0797 2.89 79 1,000 73 33 230 1680 3,398 0 2,340 0798 2.89 73 1,000 66 33 230 1681 2,729 0 2,340 0799 2.89 73 1,000 68 33 230 4,194 0 2,346 0800 2.89 60 1,000 55 33 230 3,519 0 2,323 0801 2.89 66 1,000 60 33 230 1687 2,430 0 2,319 0802 2.89 62 1,000 56 33 230 3,405 0 2,316 0803 2.89 58 1,000 52 33 230 3,392 0 2,314 0804 2.89 40 1,000 35 33 230 2,312 0 2,209 0805 2.89 40 1,000 34 34 805 2,011 0 2,011 0806 2.89 46 1,000 36 36 806 1,787 0 1,787 0808 2.89 73 1,000 55 44 613 1252 1,317 0 1,710 0809 2.89 89 1,000 73 73 809 1419 1,567 0 2,269 0810 2.89 70 1,000 -75 -75 810 1398 392 608 562 438811 2.89 97 1,000 90 90 811 1707 1,567 0 3,698 0812 2.89 73 2,000 35 35 812 1416 1,567 433 2,411 0813 2.89 76 3,250 72 72 813 1713 2,101 1,149 7,661 0815 2.89 96 1,000 23 23 815 940 881 119 1,052 0816 2.89 105 1,000 76 55 247 1566 881 119 1,716 0817 2.89 52 1,000 39 39 817 949 1,567 0 1,675 0818 2.89 69 1,000 23 23 818 1,473 0 1,473 0819 2.89 71 1,000 22 22 819 1,209 0 1,208 0820 2.89 41 1,000 27 27 820 1,289 0 1,289 0833 2.89 80 3,500 -29 -29 833 1735 2,448 1,052 2,527 973836 2.89 78 2,000 54 28 684 1746 3,802 0 4,217 0837 2.89 41 2,000 29 23 684 2,761 0 2,719 0838 2.89 59 2,000 -20 -20 838 1751 646 1,354 1,365 635839 2.89 56 3,500 27 18 581 3,888 0 3,380 120840 2.89 74 3,500 56 25 919 1359 4,948 0 6,544 0841 2.89 89 3,500 70 25 919 1359 5,280 0 6,651 0842 2.89 92 3,000 79 26 230 1762 2,190 810 4,213 0844 2.89 90 2,000 56 26 843 1938 1,537 463 2,508 0845 2.89 80 2,000 37 37 845 2,400 0 2,400 0846 2.89 80 1,000 67 67 851 2,363 0 2,362 0847 2.89 90 2,000 50 26 843 1771 2,196 0 2,508 0848 2.89 83 1,000 67 67 848 1773 1,567 0 2,140 0853 2.89 33 1,000 30 26 684 2,775 0 2,171 0854 2.89 33 1,000 30 26 685 2,750 0 2,152 0855 2.89 33 1,000 30 26 686 2,909 0 2,302 0856 2.89 33 1,000 30 26 686 2,787 0 2,181 0857 2.89 88 2,000 31 29 851 1796 1,564 436 2,184 0858 2.89 97 2,000 34 29 851 2,232 0 2,184 0
Page 17 of 48

City of Oak Harbor 2019 Maximum Day DemandWater System Plan Fire Flow ScenarioNovember 2013 Existing System w/ New East Zone
Node ID
StaticDemand
(gpm)
StaticPressure
(psi)
Min. Fire FlowRequirement
(gpm)
ResidualPressure atRequired FF
(psi)
Min. SystemPressure atRequired FF
(psi)CriticalNode
CriticalPipe
Available Floww/ VelocityLimitations
(gpm)
FF Deficiencybased on
Velocity (gpm)
Available Floww/ PressureLimitations
(gpm)
FF Deficiencybased on
Pressure (gpm)862 2.89 74 3,500 12 12 602 1799 1,564 1,936 3,236 264863 2.89 58 1,000 42 30 315 1803 876 124 1,326 0864 2.89 45 1,000 41 37 727 3,136 0 2,828 0868 2.89 43 2,000 32 24 684 1815 2,649 0 2,941 0869 2.89 89 3,500 -65 -65 869 1818 1,567 1,933 2,270 1,230875 2.89 41 1,000 32 32 875 1,674 0 1,674 0876 0 45 1,000 32 32 875 1,447 0 1,672 0877 0 46 1,000 32 32 875 1,467 0 1,672 0878 0 43 1,000 32 32 875 1,507 0 1,672 0879 0 45 1,000 32 32 875 1,492 0 1,672 0880 2.89 94 3,500 79 39 581 1852 4,303 0 6,753 0885 2.89 93 3,500 72 39 581 1838 1,966 1,534 6,742 0887 2.89 94 3,500 63 63 887 1849 2,378 1,122 5,716 0888 2.89 94 3,500 60 60 888 1843 2,649 851 5,339 0889 2.89 75 1,000 65 34 875 2,764 0 2,025 0890 2.89 75 1,000 52 52 890 1888 881 119 1,648 0896 2.89 75 1,000 63 63 896 2,432 0 2,430 0900 2.89 54 1,000 51 51 900 368 2,807 0 3,940 0901 2.89 51 2,000 42 42 901 370 1,564 436 3,869 0903 2.89 52 2,000 33 33 903 371 1,567 433 2,666 0919 2.89 68 1,000 6 6 919 799 201 799 201920 2.89 62 1,000 56 34 230 373 2,647 0 2,751 0923 2.89 50 1,000 39 39 923 376 881 119 1,737 0924 2.89 56 3,500 19 19 924 983 3,052 448 3,471 29925 2.89 91 3,500 62 62 925 378 2,429 1,071 5,802 0926 2.89 83 3,500 0 0 926 379 1,567 1,933 3,032 468927 2.89 87 3,500 50 29 577 380 2,861 639 4,197 0928 2.89 87 3,500 -2 -2 928 381 1,567 1,933 3,006 494929 2.89 66 1,000 48 48 929 1147 1,124 0 1,651 0930 2.89 66 1,000 57 33 230 2,579 0 2,316 0931 2.89 94 3,000 42 16 875 384 1,567 1,433 2,653 347932 2.89 69 2,000 40 24 230 385 1,567 433 2,309 0933 2.89 58 2,000 42 23 230 3,382 0 2,210 0934 2.89 92 3,000 50 50 934 387 1,613 1,387 3,974 0935 2.89 49 1,000 44 33 230 2,857 0 2,264 0936 2.89 49 1,000 38 38 936 391 1,567 0 1,750 0937 3.23 84 1,000 65 28 684 3,683 0 3,683 0
Page 18 of 48

City of Oak Harbor 2033 Maximum Day DemandWater System Plan Fire Flow ScenarioNovember 2013 Existing System w/ New East Zone
Node ID
StaticDemand
(gpm)
StaticPressure
(psi)
Min. Fire FlowRequirement
(gpm)
ResidualPressure atRequired FF
(psi)
Min. SystemPressure atRequired FF
(psi)CriticalNode
CriticalPipe
Available Floww/ VelocityLimitations
(gpm)
FF Deficiencybased on
Velocity (gpm)
Available Floww/ PressureLimitations
(gpm)
FF Deficiencybased on
Pressure (gpm)10 3.23 81 1,000 74 40 732 17 2,484 0 3,082 012 3.23 75 1,000 68 40 732 19 3,166 0 3,070 014 3.23 68 1,000 62 34 230 13 2,746 0 3,076 016 3.23 89 1,000 80 40 732 31 1,448 0 3,082 018 3.23 81 3,500 73 33 230 43 4,530 0 7,390 020 3.23 82 3,500 65 65 20 57 3,011 489 6,737 022 3.23 81 3,500 70 32 230 47 3,878 0 7,104 024 3.23 81 3,500 69 32 230 49 3,342 158 7,063 026 3.23 81 3,500 70 33 230 43 2,829 671 7,255 028 3.23 57 1,000 52 33 230 3,333 0 2,243 030 3.23 53 1,000 47 33 230 2,908 0 2,255 032 3.23 49 1,000 42 33 230 2,582 0 2,262 034 3.23 60 1,000 52 33 230 2,776 0 2,242 036 3.23 59 1,000 51 33 230 2,689 0 2,242 038 3.23 59 1,000 51 33 230 2,610 0 2,242 040 3.23 64 1,000 55 33 230 2,680 0 2,242 042 3.23 62 1,000 53 33 230 2,615 0 2,242 044 3.23 64 1,000 54 33 230 83 2,256 0 2,242 046 3.23 66 1,000 56 33 230 2,548 0 2,242 048 3.23 64 1,000 54 33 230 2,425 0 2,242 050 3.23 73 1,000 63 33 230 93 2,448 0 2,242 052 3.23 71 1,000 61 33 230 95 2,445 0 2,242 054 3.23 79 3,500 73 33 230 109 4,492 0 7,285 056 3.23 76 2,000 49 49 56 111 1,541 459 2,938 058 3.23 45 1,000 44 27 684 5,900 0 3,509 060 3.23 46 1,000 44 27 684 115 2,975 0 3,734 062 3.23 47 1,000 45 27 684 123 3,963 0 3,806 064 3.23 47 1,000 45 27 684 121 4,048 0 3,779 066 3.23 49 1,000 47 27 684 131 3,644 0 3,839 068 3.23 48 1,000 46 27 684 123 3,696 0 3,885 070 3.23 71 1,000 68 27 684 133 3,512 0 3,653 072 3.23 60 1,000 56 52 114 135 2,164 0 3,594 074 3.23 59 1,000 54 54 74 3,454 0 3,452 076 3.23 98 1,000 73 73 76 141 1,567 0 1,864 078 3.23 40 1,000 34 32 230 2,191 0 2,143 080 3.23 44 2,000 25 22 230 2,317 0 2,149 082 3.23 49 2,000 29 22 230 2,528 0 2,151 084 3.23 53 2,000 35 22 230 2,892 0 2,161 086 3.23 53 2,000 34 22 230 2,767 0 2,173 088 3.23 95 1,000 93 27 686 165 5,053 0 5,784 090 3.23 95 1,000 93 27 686 163 3,501 0 5,778 092 3.23 85 3,000 71 26 230 179 3,001 0 4,549 094 3.23 66 1,000 60 33 230 3,786 0 2,262 096 3.23 62 1,000 56 33 230 3,534 0 2,283 098 3.23 90 1,000 84 35 382 185 1,779 0 4,130 0100 3.23 88 1,000 82 35 382 187 1,616 0 4,128 0102 3.23 61 3,500 -58 -67 577 189 1,563 1,937 1,722 1,778104 3.23 70 1,000 63 63 104 1265 1,678 0 3,209 0106 3.23 84 1,000 76 28 684 195 1,567 0 3,246 0108 3.23 60 1,000 50 50 613 1252 1,317 0 2,331 0110 3.23 86 1,000 80 80 110 1595 1,618 0 3,544 0112 3.23 70 1,000 66 28 684 201 2,785 0 4,124 0114 3.23 56 1,000 51 51 114 203 2,704 0 2,879 0116 3.23 97 3,500 67 67 116 205 1,827 1,673 5,771 0128 3.23 96 2,500 86 28 684 237 4,193 0 7,872 0134 3.23 94 1,000 90 28 684 287 3,615 0 5,470 0136 3.23 95 1,000 91 28 684 289 3,907 0 5,309 0138 3.23 94 1,000 91 28 684 289 3,978 0 5,491 0140 3.23 94 1,000 90 28 684 291 3,144 0 5,637 0142 3.23 97 1,000 93 28 684 293 3,717 0 5,671 0144 3.23 101 1,000 97 28 684 1925 2,852 0 5,424 0146 3.23 101 1,000 96 28 684 1926 2,760 0 4,999 0148 3.23 70 1,000 59 59 148 277 1,546 0 2,508 0215 3.23 111 1,000 105 36 875 1637 4,442 0 2,536 0216 3.23 47 2,000 41 24 684 921 4,441 0 3,359 0217 3.23 69 1,000 67 27 684 1504 3,509 0 3,653 0218 3.23 79 1,000 32 23 919 925 2,123 0 1,530 0219 3.23 94 1,000 83 36 875 3,078 0 2,536 0220 3.23 98 1,000 88 36 875 3,272 0 2,536 0221 3.23 81 3,500 74 33 230 1708 5,903 0 7,535 0222 3.23 86 2,000 72 72 222 930 3,525 0 5,128 0228 3.23 73 1,000 70 27 684 923 4,393 0 3,653 0229 3.23 61 1,000 56 34 230 3,844 0 2,688 0230 3.23 38 2,000 21 21 230 2,074 0 2,074 0231 0 77 2,000 76 28 684 10,360 0 10,532 0232 3.23 80 3,500 63 36 577 1331 7,046 0 5,221 0233 3.23 77 1,000 29 22 919 1,807 0 1,450 0235 3.23 78 1,000 30 22 352 1,729 0 1,203 0236 3.23 81 1,000 26 22 352 1,235 0 1,203 0237 3.23 39 1,000 33 33 237 1518 1,758 0 1,971 0238 3.23 49 1,000 47 37 237 129 2,995 0 3,621 0239 3.23 51 1,000 50 27 684 1008 5,910 0 4,312 0240 3.23 71 1,000 23 22 352 1,273 0 1,197 0
Page 19 of 48

City of Oak Harbor 2033 Maximum Day DemandWater System Plan Fire Flow ScenarioNovember 2013 Existing System w/ New East Zone
Node ID
StaticDemand
(gpm)
StaticPressure
(psi)
Min. Fire FlowRequirement
(gpm)
ResidualPressure atRequired FF
(psi)
Min. SystemPressure atRequired FF
(psi)CriticalNode
CriticalPipe
Available Floww/ VelocityLimitations
(gpm)
FF Deficiencybased on
Velocity (gpm)
Available Floww/ PressureLimitations
(gpm)
FF Deficiencybased on
Pressure (gpm)241 3.23 90 1,000 40 22 352 2,100 0 1,203 0242 3.23 94 1,000 44 22 352 2,223 0 1,205 0243 3.23 70 1,000 63 63 243 193 3,187 0 3,207 0244 3.23 78 1,000 73 28 684 1299 2,442 0 3,697 0245 3.23 76 1,000 72 28 684 1274 4,699 0 5,055 0246 3.23 89 3,500 61 61 246 1179 2,557 943 5,548 0247 3.23 76 1,000 54 54 247 1095 878 122 1,703 0248 3.23 66 1,000 59 40 732 1096 2,541 0 3,008 0249 3.23 50 1,000 45 40 732 3,116 0 2,808 0250 3.23 51 1,000 45 45 250 966 1,759 0 2,318 0251 3.23 83 3,500 61 30 581 1309 4,224 0 4,432 0252 3.23 70 1,000 70 28 686 9,676 0 7,715 0253 3.23 78 1,000 77 28 686 1428 8,294 0 7,169 0254 3.23 51 2,000 47 25 684 6,598 0 3,616 0255 3.23 50 1,000 48 27 686 972 3,371 0 3,908 0256 3.23 46 1,000 44 27 686 973 3,315 0 3,912 0257 3.23 46 1,000 44 27 686 974 3,813 0 3,798 0258 3.23 38 1,000 37 27 686 4,914 0 3,330 0259 3.23 43 1,000 41 27 686 979 2,829 0 3,530 0260 3.23 48 1,000 45 45 260 964 2,325 0 3,280 0261 3.23 51 1,000 48 48 261 964 3,281 0 4,002 0262 3.23 59 1,000 55 55 262 957 2,471 0 4,021 0263 3.23 60 1,000 56 56 263 962 2,369 0 3,832 0264 3.23 55 1,000 50 50 264 963 1,977 0 3,128 0265 3.23 50 1,000 48 27 686 982 4,212 0 4,211 0266 3.23 42 1,000 39 39 266 970 1,955 0 2,843 0267 3.23 43 1,000 40 40 267 970 2,401 0 3,124 0268 3.23 40 1,000 37 37 268 976 1,974 0 2,931 0269 3.23 39 1,000 37 27 686 4,950 0 3,307 0270 3.23 41 1,000 39 27 686 5,124 0 3,746 0271 3.23 67 1,000 66 27 686 1477 4,410 0 4,551 0272 3.23 67 1,000 64 27 686 959 1,865 0 4,644 0273 3.23 67 1,000 65 27 686 955 3,122 0 5,192 0274 3.23 82 1,000 81 27 686 1430 7,782 0 5,535 0275 3.23 83 3,000 76 25 686 1440 5,828 0 5,724 0276 3.23 85 3,000 78 26 686 1436 6,061 0 6,619 0277 3.23 95 2,000 88 88 277 981 3,796 0 7,911 0278 3.23 95 3,000 84 26 686 1456 6,514 0 8,146 0279 3.23 88 3,000 80 26 686 956 5,483 0 6,762 0280 3.23 61 1,000 59 27 686 1601 5,316 0 5,955 0281 3.23 53 1,000 51 51 281 990 5,056 0 5,360 0282 3.23 60 1,000 56 56 282 991 1,623 0 3,641 0283 3.23 64 1,000 56 56 283 993 1,488 0 2,564 0284 3.23 57 1,000 53 53 938 994 1,854 0 3,095 0285 3.23 51 1,000 50 50 285 987 4,437 0 5,204 0286 3.23 52 1,000 50 50 286 986 4,566 0 5,586 0287 3.23 52 1,000 51 27 686 982 4,975 0 5,535 0288 3.23 54 3,500 33 33 288 985 3,112 388 4,524 0289 3.23 58 3,500 29 29 289 995 2,808 692 4,090 0290 3.23 54 3,500 36 36 290 996 2,454 1,046 4,934 0291 3.23 72 1,000 70 63 292 1003 2,764 0 6,531 0292 3.23 65 1,000 62 62 292 999 2,366 0 4,301 0293 3.23 92 1,000 89 89 293 997 3,115 0 6,593 0294 3.23 76 1,000 73 73 294 1002 3,102 0 5,864 0295 3.23 82 2,000 73 73 295 1588 2,975 0 5,876 0296 3.23 88 1,000 85 85 296 1465 2,015 0 4,978 0297 3.23 77 1,000 72 72 297 952 2,305 0 3,868 0298 3.23 63 1,000 60 60 298 997 2,687 0 4,685 0299 3.23 52 1,000 51 27 684 1009 6,390 0 4,781 0300 3.23 41 1,000 27 27 300 1,274 0 1,274 0301 3.23 44 1,000 37 34 300 1,999 0 1,857 0302 3.23 47 1,000 42 35 300 1012 2,091 0 2,082 0303 3.23 55 1,000 54 54 303 1004 4,144 0 6,831 0304 3.23 58 1,000 56 39 300 1015 2,145 0 3,745 0305 3.23 55 1,500 54 27 684 1016 6,193 0 5,570 0306 3.23 44 1,000 44 27 684 1017 5,967 0 6,887 0307 3.23 52 1,000 48 48 307 1005 2,299 0 3,292 0308 3.23 63 1,000 62 28 684 1579 9,764 0 12,072 0309 3.23 67 1,000 62 47 817 1580 1,823 0 3,109 0310 3.23 59 1,000 52 44 817 1057 1,563 0 2,304 0315 3.23 45 1,000 -8 -8 315 665 335 665 335316 3.23 54 1,000 25 16 315 1804 878 122 919 81318 3.23 46 1,000 25 23 317 1068 878 122 1,077 0319 3.23 57 1,000 47 34 317 1577 865 135 1,667 0320 3.23 105 2,000 96 93 658 1030 3,375 0 7,279 0321 3.23 103 3,000 90 26 686 1715 3,856 0 8,475 0322 3.23 92 1,000 87 87 322 1031 2,381 0 4,806 0323 3.23 76 1,000 74 50 817 1582 3,607 0 5,599 0324 3.23 82 1,000 72 72 324 1062 1,272 0 2,762 0325 3.23 84 1,000 79 79 325 1035 2,116 0 4,273 0326 3.23 76 1,000 74 50 817 1064 4,219 0 5,810 0327 3.23 89 1,000 84 84 327 1035 2,342 0 4,615 0328 3.23 90 1,000 83 83 328 1034 1,530 0 3,684 0
Page 20 of 48

City of Oak Harbor 2033 Maximum Day DemandWater System Plan Fire Flow ScenarioNovember 2013 Existing System w/ New East Zone
Node ID
StaticDemand
(gpm)
StaticPressure
(psi)
Min. Fire FlowRequirement
(gpm)
ResidualPressure atRequired FF
(psi)
Min. SystemPressure atRequired FF
(psi)CriticalNode
CriticalPipe
Available Floww/ VelocityLimitations
(gpm)
FF Deficiencybased on
Velocity (gpm)
Available Floww/ PressureLimitations
(gpm)
FF Deficiencybased on
Pressure (gpm)329 3.23 77 1,000 74 36 382 1064 3,199 0 4,958 0330 3.23 78 1,000 74 35 382 1083 4,232 0 4,273 0331 3.23 87 1,000 82 35 382 1084 2,171 0 4,172 0332 3.23 91 1,000 86 35 382 1086 2,420 0 4,103 0333 3.23 77 1,750 69 32 382 1083 3,957 0 3,980 0334 3.23 64 1,000 60 35 382 1081 2,685 0 3,709 0335 3.23 75 1,000 71 35 382 1087 3,084 0 3,683 0336 3.23 67 3,000 29 25 337 1092 1,509 1,491 3,241 0337 3.23 59 1,000 49 49 337 1091 1,640 0 2,195 0338 3.23 60 1,000 54 54 338 1088 1,552 0 3,061 0339 3.23 64 1,000 61 35 382 1080 3,624 0 3,653 0340 3.23 98 3,000 69 16 230 1114 4,586 0 2,601 399341 3.23 84 1,000 37 23 919 2,259 0 1,516 0342 3.23 79 1,000 33 23 919 2,301 0 1,539 0343 3.23 72 1,000 27 23 919 2,020 0 1,500 0344 3.23 76 1,000 31 22 919 2,257 0 1,454 0345 3.23 73 1,000 26 21 919 1,596 0 1,088 0346 3.23 81 1,000 28 22 352 1,393 0 1,203 0347 3.23 74 1,000 26 22 352 1,477 0 1,215 0348 3.23 82 1,000 26 26 348 1027 875 125 1,237 0349 3.23 80 1,000 30 22 352 1,558 0 1,308 0350 3.23 96 1,000 47 23 818 1526 2,260 0 1,558 0352 3.23 69 1,000 21 21 352 1,159 0 1,158 0353 3.23 73 1,000 23 23 353 1,239 0 1,239 0354 3.23 48 1,000 40 34 875 2,118 0 2,005 0355 3.23 45 1,000 38 34 875 2,100 0 2,041 0356 3.23 47 1,000 39 34 875 2,082 0 2,022 0357 3.23 50 1,000 42 34 875 2,244 0 2,003 0358 3.23 50 1,000 42 34 875 2,324 0 1,995 0359 3.23 46 1,000 38 34 875 2,081 0 2,013 0360 3.23 66 1,000 57 34 875 2,633 0 1,985 0361 3.23 67 1,000 59 34 875 2,852 0 1,972 0362 3.23 70 1,000 61 34 875 3,012 0 1,972 0363 3.23 54 1,000 47 34 875 2,611 0 1,962 0364 3.23 54 1,000 47 34 875 2,611 0 2,002 0365 3.23 88 3,500 65 30 577 6,496 0 4,313 0366 3.23 57 1,000 51 34 875 2,874 0 2,060 0367 3.23 50 1,000 43 34 875 2,432 0 2,048 0368 3.23 56 1,000 48 34 875 2,578 0 2,018 0369 3.23 59 1,000 52 34 875 2,805 0 2,063 0370 3.23 70 1,000 64 34 875 1136 3,285 0 2,114 0371 3.23 84 3,000 69 31 230 1051 3,522 0 6,308 0372 3.23 80 1,000 79 36 230 1039 3,201 0 6,481 0373 3.23 82 3,000 78 33 230 946 7,511 0 7,116 0374 3.23 98 2,000 54 54 423 1142 1,487 513 2,740 0375 3.23 62 2,000 59 35 435 6,250 0 4,666 0376 3.23 96 1,000 94 28 684 10,082 0 8,022 0377 3.23 78 1,000 74 28 684 1313 3,011 0 4,678 0378 3.23 83 1,000 80 28 684 1360 2,224 0 5,413 0379 3.23 71 1,000 65 65 379 1617 2,692 0 3,279 0380 3.23 55 1,000 51 41 730 3,798 0 3,267 0381 3.23 40 1,000 36 36 381 2,660 0 2,660 0382 3.23 38 1,000 34 34 382 2,612 0 2,612 0383 3.23 49 1,000 45 36 381 3,555 0 3,077 0384 3.23 57 1,000 54 40 317 1080 4,251 0 3,420 0386 3.23 63 1,000 59 34 230 4,755 0 2,713 0387 3.23 65 1,000 61 34 230 4,724 0 2,706 0388 3.23 42 1,000 38 34 230 3,248 0 2,954 0389 3.23 38 1,000 34 34 390 3,176 0 3,163 0390 3.23 37 1,000 33 33 390 2,672 0 2,671 0391 3.23 44 1,000 40 34 230 3,155 0 3,006 0392 3.23 47 1,000 42 34 230 3,225 0 2,966 0393 3.23 58 1,000 54 34 230 1099 3,372 0 2,949 0394 3.23 49 2,000 36 28 230 1651 2,783 0 2,920 0395 3.23 45 1,000 39 39 395 2,727 0 2,727 0396 3.23 51 1,000 46 40 732 3,092 0 2,979 0397 3.23 47 1,000 41 41 397 2,794 0 2,794 0398 3.23 55 1,000 50 34 230 3,325 0 2,925 0399 3.23 60 1,000 54 34 230 1108 3,106 0 2,923 0400 3.23 54 1,000 49 34 230 1100 3,170 0 2,923 0401 3.23 57 1,000 52 34 230 3,400 0 2,921 0402 3.23 51 1,000 45 34 230 1111 2,913 0 2,904 0403 3.23 59 1,000 54 34 230 3,839 0 2,886 0404 3.23 58 1,000 53 34 230 1112 3,412 0 2,961 0405 3.23 71 3,000 63 23 230 1636 4,914 0 3,544 0406 3.23 81 1,000 76 33 230 4,967 0 2,553 0407 3.23 79 3,000 53 15 230 5,016 0 2,542 458408 3.23 76 1,000 71 33 230 1135 3,906 0 2,392 0409 3.23 62 1,000 61 61 409 1574 2,676 0 5,402 0410 3.23 81 1,000 78 78 410 1048 2,934 0 4,616 0411 3.23 67 1,000 64 60 659 1040 2,916 0 4,199 0412 3.23 64 2,000 53 53 412 1042 2,930 0 4,209 0413 3.23 55 1,000 51 51 413 1045 2,879 0 3,336 0
Page 21 of 48

City of Oak Harbor 2033 Maximum Day DemandWater System Plan Fire Flow ScenarioNovember 2013 Existing System w/ New East Zone
Node ID
StaticDemand
(gpm)
StaticPressure
(psi)
Min. Fire FlowRequirement
(gpm)
ResidualPressure atRequired FF
(psi)
Min. SystemPressure atRequired FF
(psi)CriticalNode
CriticalPipe
Available Floww/ VelocityLimitations
(gpm)
FF Deficiencybased on
Velocity (gpm)
Available Floww/ PressureLimitations
(gpm)
FF Deficiencybased on
Pressure (gpm)414 3.23 63 1,000 60 52 413 1042 3,748 0 3,964 0415 3.23 65 1,000 62 52 413 1046 2,573 0 3,970 0416 3.23 78 1,000 75 53 413 1567 2,891 0 4,743 0417 3.23 81 1,000 77 77 417 1050 2,852 0 4,654 0418 3.23 82 3,500 58 58 418 1420 2,220 1,280 5,558 0419 3.23 83 3,500 77 32 230 47 6,392 0 7,116 0420 3.23 85 3,000 72 31 230 1052 1,613 1,387 6,310 0421 3.23 85 3,000 78 32 230 1052 3,508 0 6,473 0422 3.23 86 3,500 76 30 230 1055 4,487 0 6,267 0423 3.23 97 2,000 31 31 423 2,176 0 2,176 0424 3.23 98 2,000 35 34 423 1144 1,560 440 2,228 0425 3.23 98 2,000 49 49 423 1145 1,557 443 2,581 0426 3.23 96 3,500 85 27 230 1140 4,616 0 5,211 0427 3.23 90 3,500 82 29 230 1630 7,287 0 6,086 0428 3.23 95 3,500 86 29 230 1139 5,303 0 6,041 0429 3.23 59 2,000 56 35 435 929 2,208 0 4,637 0430 3.23 56 1,000 54 36 435 928 2,615 0 3,969 0431 3.23 54 1,000 52 36 435 1228 2,970 0 3,635 0432 3.23 52 1,000 49 35 435 1229 2,934 0 3,307 0433 3.23 45 1,000 42 35 435 1230 2,844 0 3,112 0434 3.23 42 1,000 39 35 435 2,893 0 2,868 0435 3.23 37 2,000 26 26 435 2,551 0 2,551 0436 3.23 66 2,000 61 35 435 1208 4,671 0 4,611 0437 3.23 69 2,000 61 34 435 1209 2,619 0 4,287 0438 3.23 61 2,000 50 50 438 1211 2,048 0 3,988 0439 3.23 60 1,000 57 36 435 1226 2,573 0 3,687 0440 3.23 57 1,000 53 53 440 1224 2,092 0 3,376 0441 3.23 48 1,000 43 43 441 1218 1,937 0 2,535 0442 3.23 42 2,000 31 27 435 2,963 0 2,688 0443 3.23 53 1,000 49 49 443 1222 2,080 0 2,937 0444 3.23 96 2,000 87 30 435 1216 4,243 0 3,287 0445 3.23 64 1,000 62 36 435 1213 4,135 0 3,616 0446 3.23 90 3,000 55 29 754 1616 3,089 0 3,487 0447 3.23 74 3,000 48 26 435 1199 3,167 0 3,600 0448 3.23 64 3,000 40 25 435 1205 3,444 0 3,528 0449 3.23 77 3,500 50 22 435 1203 3,731 0 3,634 0450 3.23 87 3,000 65 26 435 1201 3,052 0 3,660 0451 3.23 94 3,000 68 27 435 1197 2,510 491 3,709 0452 3.23 95 3,500 56 56 452 1180 2,901 599 4,936 0453 3.23 97 3,500 42 42 453 1165 2,005 1,495 4,188 0454 3.23 97 3,500 78 34 435 1168 2,331 1,169 6,549 0455 3.23 91 3,500 76 31 230 1164 4,212 0 6,715 0456 3.23 97 3,500 84 34 435 1164 5,494 0 6,710 0457 3.23 89 3,500 71 34 435 1169 3,470 30 6,429 0458 3.23 81 3,500 67 34 435 1163 5,141 0 6,301 0459 3.23 81 3,500 58 33 435 1188 3,709 0 5,719 0460 3.23 82 3,500 60 33 435 1178 3,368 132 5,838 0461 3.23 70 3,500 56 33 435 1172 4,824 0 5,885 0462 3.23 65 2,000 59 59 462 1189 3,786 0 5,506 0463 3.23 67 3,500 45 45 463 1177 3,060 440 5,082 0464 3.23 81 3,500 54 54 464 1187 3,029 471 5,304 0465 3.23 90 3,500 27 27 465 1183 1,444 2,056 3,709 0466 3.23 90 3,500 60 60 466 1184 2,548 952 5,416 0467 3.23 90 3,500 69 31 435 1195 3,515 0 4,966 0468 3.23 75 2,000 68 35 435 1194 3,179 0 4,789 0469 3.23 66 2,000 61 35 435 1208 3,420 0 4,742 0470 3.23 90 3,500 22 22 470 1192 1,866 1,634 3,551 0471 3.23 61 3,000 48 33 435 1190 3,249 0 5,011 0472 3.23 63 3,000 53 33 435 1190 5,706 0 5,399 0473 3.23 68 3,000 54 54 473 1174 3,346 0 5,607 0474 3.23 69 3,000 56 34 435 1175 3,895 0 5,824 0475 3.23 78 3,000 56 56 475 1166 2,838 162 5,084 0476 3.23 65 1,000 63 37 435 1149 4,163 0 5,301 0477 3.23 62 1,000 61 61 477 1150 3,278 0 5,057 0478 3.23 62 1,000 38 38 478 1750 911 89 1,362 0479 3.23 67 1,000 33 33 479 382 743 257 1,187 0480 3.23 73 1,000 65 58 929 1159 1,294 0 2,590 0481 3.23 69 1,000 67 67 481 1151 3,115 0 4,767 0482 3.23 70 1,000 60 60 482 1155 1,725 0 2,416 0483 3.23 68 1,000 58 58 483 1158 1,755 0 2,370 0484 3.23 78 1,000 69 69 484 1161 1,372 0 2,768 0485 3.23 77 1,000 68 68 485 1160 1,212 0 2,729 0486 3.23 79 1,000 77 65 929 1415 2,889 0 6,453 0487 3.23 88 3,500 72 38 581 1853 4,945 0 6,485 0488 3.23 94 3,500 57 57 488 1840 3,175 325 5,137 0489 3.23 86 2,000 72 72 489 1240 3,229 0 4,827 0490 3.23 94 3,500 79 39 581 1234 4,967 0 6,808 0491 3.23 97 1,000 95 45 581 1234 5,826 0 7,701 0492 3.23 101 2,000 95 27 686 1446 5,480 0 7,794 0493 3.23 99 1,000 96 96 493 1237 3,784 0 7,591 0494 3.23 97 1,000 95 28 686 1237 4,723 0 7,999 0495 3.23 100 2,000 90 90 495 1238 2,908 0 6,485 0496 3.23 100 2,000 90 90 496 1239 3,728 0 6,615 0
Page 22 of 48

City of Oak Harbor 2033 Maximum Day DemandWater System Plan Fire Flow ScenarioNovember 2013 Existing System w/ New East Zone
Node ID
StaticDemand
(gpm)
StaticPressure
(psi)
Min. Fire FlowRequirement
(gpm)
ResidualPressure atRequired FF
(psi)
Min. SystemPressure atRequired FF
(psi)CriticalNode
CriticalPipe
Available Floww/ VelocityLimitations
(gpm)
FF Deficiencybased on
Velocity (gpm)
Available Floww/ PressureLimitations
(gpm)
FF Deficiencybased on
Pressure (gpm)497 3.23 94 2,000 75 66 618 1399 2,749 0 4,102 0498 3.23 88 2,000 67 67 498 1410 2,379 0 3,887 0499 3.23 84 2,000 66 66 499 1243 1,873 127 3,987 0500 3.23 77 2,000 62 62 500 1244 2,267 0 4,195 0501 3.23 58 1,000 51 51 501 1259 3,104 0 3,316 0502 3.23 74 3,500 50 50 502 1244 4,234 0 5,696 0503 3.23 54 2,000 27 27 503 1254 1,447 553 2,277 0504 3.23 61 1,000 52 51 613 1252 1,318 0 2,581 0505 3.23 64 1,000 58 58 505 1251 2,890 0 3,832 0507 3.23 75 1,000 72 28 684 1381 3,825 0 5,395 0508 3.23 52 1,000 46 46 508 1745 2,936 0 3,013 0509 3.23 74 2,000 40 40 509 1247 1,702 298 2,615 0510 3.23 81 3,500 61 42 514 1266 5,168 0 6,416 0511 3.23 67 1,000 62 50 514 1262 3,750 0 3,763 0512 3.23 70 3,250 38 27 514 1249 4,027 0 3,675 0513 3.23 68 1,000 62 50 514 1251 4,062 0 3,707 0514 3.23 55 1,000 49 49 514 3,353 0 3,353 0515 3.23 57 1,000 51 51 515 3,464 0 3,464 0516 3.23 58 1,000 50 50 516 1260 1,984 0 2,870 0517 3.23 70 1,000 65 65 517 1268 2,813 0 4,048 0518 3.23 83 3,500 64 38 581 1267 5,536 0 6,451 0519 3.23 83 3,500 67 38 581 1275 6,457 0 6,275 0520 3.23 83 3,500 66 38 581 1277 5,125 0 6,331 0521 3.23 78 1,000 51 51 521 1383 1,009 0 1,535 0522 3.23 65 1,000 56 56 522 1283 1,390 0 2,699 0523 3.23 66 1,000 55 55 523 1282 1,478 0 2,265 0524 3.23 70 1,000 59 59 524 1280 1,897 0 2,390 0525 3.23 70 1,000 59 59 525 1269 1,666 0 2,399 0526 3.23 78 1,000 74 28 684 1273 4,323 0 4,865 0527 3.23 78 1,000 74 28 684 1274 4,101 0 4,899 0528 3.23 77 1,000 74 28 684 1377 4,027 0 5,331 0529 3.23 78 1,000 75 28 684 1300 5,854 0 6,256 0530 3.23 74 1,000 70 28 684 5,060 0 5,060 0531 3.23 78 1,000 75 28 684 1301 5,719 0 6,293 0532 3.23 86 3,500 69 36 581 1289 6,885 0 5,580 0533 3.23 63 1,000 58 58 533 1294 3,077 0 3,693 0534 3.23 75 1,000 71 28 684 4,874 0 4,874 0535 3.23 73 1,000 68 28 684 1306 2,464 0 3,957 0536 3.23 63 1,000 58 58 536 1295 2,669 0 3,530 0537 3.23 63 1,000 58 58 537 1293 3,225 0 3,983 0538 3.23 85 3,500 68 37 581 1276 6,688 0 5,966 0539 3.23 85 3,500 68 37 581 1290 6,430 0 5,874 0540 3.23 79 1,000 35 35 540 1291 1,716 0 4,071 0541 3.23 76 1,000 52 52 541 1292 1,371 0 1,623 0542 3.23 64 1,000 46 45 544 1296 1,141 0 1,657 0543 3.23 96 1,000 94 28 684 1312 6,358 0 8,222 0544 3.23 63 1,000 36 36 544 1,298 0 1,298 0545 3.23 90 1,000 86 28 684 1311 3,653 0 5,519 0546 3.23 81 1,000 78 28 684 938 2,340 0 5,088 0547 3.23 83 1,000 79 28 684 1317 2,082 0 4,707 0548 3.23 75 1,000 69 28 684 1365 2,083 0 3,407 0549 3.23 71 1,000 66 28 684 1315 2,345 0 3,602 0550 3.23 70 1,000 66 28 684 1314 3,653 0 4,395 0551 3.23 70 3,500 46 22 581 1310 4,754 0 3,630 0552 3.23 93 3,500 71 31 577 1322 4,313 0 4,366 0554 3.23 80 3,500 53 25 577 5,386 0 3,849 0555 3.23 87 3,500 63 30 577 6,325 0 4,322 0556 3.23 87 3,500 61 28 577 1325 5,450 0 4,083 0557 3.23 80 3,500 50 25 577 1948 3,239 261 3,873 0558 3.23 83 3,500 48 27 577 1328 2,362 1,138 4,040 0559 3.23 85 3,500 45 30 577 1329 2,632 868 4,268 0560 3.23 81 3,500 43 43 560 1332 2,469 1,031 4,539 0561 3.23 81 3,500 69 40 577 1426 6,170 0 6,331 0562 3.23 76 3,500 49 44 563 1333 2,438 1,062 4,968 0563 3.23 72 3,500 26 26 563 1334 2,448 1,052 3,759 0564 3.23 76 3,500 16 16 565 1335 1,563 1,937 3,379 121565 3.23 76 3,500 2 2 565 3,001 499 3,001 499566 3.23 80 3,500 51 23 577 1948 3,833 0 3,696 0567 3.23 76 3,500 23 23 567 1339 1,567 1,933 3,599 0568 3.23 71 3,500 17 -3 577 3,395 105 2,621 879569 3.23 91 3,500 -34 -36 869 1346 1,563 1,937 2,535 965570 3.23 84 3,500 -24 -24 570 1341 1,567 1,933 2,645 855571 3.23 71 3,500 15 -1 577 1344 2,301 1,199 2,673 827572 3.23 71 3,500 16 -2 577 1342 2,406 1,094 2,627 873573 3.23 71 3,500 19 0 577 3,481 19 2,688 812574 3.23 84 3,500 11 -4 577 1345 2,757 743 2,585 915575 3.23 71 3,500 12 -8 577 3,233 267 2,496 1,004576 3.23 71 3,500 4 -15 577 3,037 463 2,349 1,151577 3.23 52 3,500 -115 -115 577 1,434 2,066 1,434 2,066578 3.23 61 3,500 36 22 581 4,537 0 3,640 0579 3.23 54 3,500 17 13 583 1353 2,280 1,220 3,147 353580 3.23 48 3,500 6 4 581 1356 2,747 753 2,719 781581 3.23 45 3,500 -37 -37 581 1355 1,567 1,933 1,876 1,624
Page 23 of 48

City of Oak Harbor 2033 Maximum Day DemandWater System Plan Fire Flow ScenarioNovember 2013 Existing System w/ New East Zone
Node ID
StaticDemand
(gpm)
StaticPressure
(psi)
Min. Fire FlowRequirement
(gpm)
ResidualPressure atRequired FF
(psi)
Min. SystemPressure atRequired FF
(psi)CriticalNode
CriticalPipe
Available Floww/ VelocityLimitations
(gpm)
FF Deficiencybased on
Velocity (gpm)
Available Floww/ PressureLimitations
(gpm)
FF Deficiencybased on
Pressure (gpm)582 3.23 56 3,500 24 16 581 1755 2,088 1,412 3,241 259583 3.23 50 3,500 -9 -9 583 1357 1,567 1,933 2,457 1,043584 3.23 84 3,000 75 28 684 261 8,490 0 8,467 0585 3.23 67 3,500 27 22 581 1358 1,567 1,933 3,630 0586 3.23 84 3,000 74 28 684 1359 4,395 0 8,410 0587 3.23 85 1,000 83 28 684 1361 6,955 0 8,011 0589 3.23 78 1,000 73 28 684 1364 1,812 0 3,716 0591 3.23 73 1,000 69 28 684 1306 3,349 0 4,371 0592 3.23 72 1,000 64 28 684 1369 1,567 0 2,783 0593 3.23 70 1,000 66 28 684 1367 2,881 0 4,100 0595 3.23 94 2,000 81 28 684 1371 3,114 0 5,421 0597 3.23 78 1,000 64 28 684 1373 878 122 2,134 0598 3.23 74 3,500 57 25 919 1359 4,820 0 6,879 0599 3.23 89 3,500 64 25 919 1760 3,518 0 5,611 0600 3.23 89 3,500 58 25 919 1760 3,518 0 5,074 0601 3.23 89 3,500 45 25 919 1376 1,567 1,933 4,466 0602 3.23 74 3,500 -14 -14 602 1799 1,563 1,937 2,694 806603 3.23 77 1,000 74 28 684 1377 3,533 0 5,295 0604 3.23 76 1,000 73 28 684 5,880 0 5,880 0605 3.23 71 1,000 60 60 605 1382 1,886 0 2,411 0606 3.23 75 1,000 70 28 684 1385 1,389 0 3,808 0607 3.23 76 1,000 72 28 684 1387 4,590 0 5,146 0608 3.23 81 2,500 47 28 684 1389 2,443 57 3,994 0611 3.23 60 1,000 49 49 613 1252 1,317 0 2,159 0613 3.23 60 1,000 43 43 613 1252 1,316 0 1,704 0614 3.23 68 1,000 -16 -16 614 1397 388 612 740 260615 3.23 97 2,000 80 80 811 1400 2,453 0 4,686 0616 3.23 91 2,000 44 44 616 1401 1,067 933 2,538 0617 3.23 92 3,500 24 24 617 1406 2,000 1,501 3,619 0618 3.23 84 2,000 64 64 618 3,852 0 3,852 0619 3.23 91 3,500 29 29 619 1407 3,486 14 3,773 0620 3.23 88 1,000 80 80 620 1409 1,567 0 3,176 0621 3.23 75 2,000 53 53 621 1411 1,542 458 3,292 0622 3.23 95 3,500 64 64 623 1412 2,606 894 5,783 0623 3.23 95 3,500 55 55 623 1414 3,525 0 4,915 0624 3.23 79 1,000 77 72 812 1422 2,866 0 6,540 0625 3.23 81 3,500 69 69 625 1421 3,669 0 7,140 0626 3.23 81 1,000 80 65 929 41 4,824 0 7,461 0627 3.23 85 3,500 77 28 684 207 6,164 0 8,689 0628 3.23 89 3,500 74 28 684 1427 2,448 1,052 8,657 0629 3.23 82 3,500 50 50 629 1429 1,567 1,933 4,951 0630 3.23 87 3,500 80 25 686 1431 6,905 0 6,108 0631 3.23 87 1,000 86 27 686 1430 8,110 0 5,884 0632 3.23 93 1,000 91 27 686 1432 3,156 0 5,822 0633 3.23 100 1,000 98 27 686 1433 3,480 0 5,799 0634 3.23 106 1,000 100 100 634 1434 1,567 0 4,474 0635 3.23 102 1,000 99 27 686 165 2,666 0 5,776 0636 3.23 89 3,000 81 25 686 1436 5,904 0 5,951 0637 3.23 102 1,000 96 96 637 1439 1,567 0 4,253 0638 3.23 87 3,000 80 25 686 1440 5,896 0 5,674 0639 3.23 89 1,000 87 27 686 1442 2,527 0 5,747 0640 3.23 71 3,000 37 37 640 1444 1,567 1,433 3,768 0641 3.23 78 3,000 67 25 686 1443 4,224 0 6,343 0642 3.23 101 1,000 99 27 686 1445 4,483 0 7,398 0643 3.23 93 3,500 80 26 686 1447 5,373 0 7,566 0644 3.23 95 1,000 92 92 644 1448 3,014 0 6,438 0645 3.23 97 1,000 94 94 645 1453 3,434 0 7,080 0646 3.23 101 1,000 98 98 646 1450 2,896 0 5,759 0647 3.23 97 1,000 95 95 647 1452 2,267 0 7,685 0648 3.23 95 1,000 91 91 648 1455 3,058 0 5,681 0649 3.23 95 2,000 84 84 651 1462 2,539 0 5,962 0650 3.23 93 3,000 81 26 686 1457 4,664 0 7,817 0651 3.23 95 3,000 47 47 651 1458 1,567 1,433 3,823 0652 3.23 95 3,500 67 67 652 1461 2,446 1,054 6,086 0653 3.23 97 3,500 77 77 653 1459 3,145 355 7,445 0654 3.23 101 3,000 89 26 686 1463 5,399 0 8,421 0655 3.23 91 2,000 83 83 655 1587 3,385 0 7,291 0656 3.23 91 1,000 87 87 656 1465 2,799 0 5,817 0657 3.23 108 3,500 72 65 658 1468 2,351 1,149 5,451 0658 3.23 101 3,500 40 40 658 1470 1,567 1,933 4,086 0659 3.23 63 1,000 36 36 659 1471 881 119 1,294 0660 3.23 81 1,000 78 76 661 1472 3,044 0 5,148 0661 3.23 79 1,000 73 73 661 1474 1,567 0 3,511 0662 3.23 87 3,500 40 40 662 1475 1,567 1,933 4,242 0663 3.23 76 1,000 74 27 686 1476 4,683 0 4,700 0664 3.23 78 2,000 72 26 686 1478 2,214 0 4,500 0665 3.23 74 2,000 66 26 686 1479 2,691 0 4,443 0666 3.23 76 2,000 65 26 686 1480 2,548 0 4,411 0667 3.23 68 2,000 57 26 686 1482 3,515 0 4,404 0668 3.23 66 2,000 55 48 675 1482 3,431 0 4,116 0669 3.23 65 2,000 54 48 675 1484 2,601 0 4,155 0670 3.23 58 2,000 48 48 670 1485 2,365 0 4,256 0671 3.23 56 2,000 49 26 686 1486 2,746 0 4,345 0
Page 24 of 48

City of Oak Harbor 2033 Maximum Day DemandWater System Plan Fire Flow ScenarioNovember 2013 Existing System w/ New East Zone
Node ID
StaticDemand
(gpm)
StaticPressure
(psi)
Min. Fire FlowRequirement
(gpm)
ResidualPressure atRequired FF
(psi)
Min. SystemPressure atRequired FF
(psi)CriticalNode
CriticalPipe
Available Floww/ VelocityLimitations
(gpm)
FF Deficiencybased on
Velocity (gpm)
Available Floww/ PressureLimitations
(gpm)
FF Deficiencybased on
Pressure (gpm)672 3.23 52 2,000 45 25 686 1489 2,323 0 4,241 0673 3.23 50 1,000 48 27 686 1488 5,046 0 4,058 0674 3.23 71 2,000 55 55 674 1491 3,110 0 3,859 0675 3.23 58 2,000 43 43 675 1494 3,132 0 3,289 0676 3.23 39 1,000 37 27 686 4,929 0 3,261 0677 3.23 39 2,000 18 18 677 1496 1,567 433 1,901 99678 3.23 37 1,000 35 27 686 4,613 0 3,028 0679 3.23 32 1,000 30 26 686 2,988 0 2,324 0680 3.23 30 1,000 24 24 680 1,349 0 1,349 0681 3.23 32 1,000 30 26 684 2,783 0 2,280 0682 3.23 32 1,000 30 26 684 2,740 0 2,227 0683 3.23 32 1,000 30 26 684 2,764 0 2,170 0684 3.23 28 1,000 22 22 684 1,238 0 1,238 0685 3.23 28 1,000 22 22 685 1,203 0 1,203 0686 3.23 28 1,000 22 22 686 1,226 0 1,226 0687 3.23 90 2,000 49 25 843 1768 2,159 0 2,476 0688 3.23 58 2,000 53 25 684 1503 4,505 0 3,654 0689 3.23 80 2,000 73 25 684 1505 2,355 0 3,675 0690 3.23 56 2,000 48 25 684 1507 3,596 0 3,684 0691 3.23 54 2,000 50 25 684 6,824 0 3,765 0692 3.23 63 2,000 52 25 684 1509 3,103 0 3,680 0693 3.23 54 2,000 11 11 693 1512 881 1,119 1,763 237694 3.23 58 2,000 49 25 684 1510 2,907 0 3,680 0695 3.23 52 2,000 48 25 684 1513 6,155 0 3,886 0696 3.23 52 2,000 43 25 684 1515 1,567 433 3,886 0697 3.23 54 1,000 52 37 237 1516 2,392 0 3,782 0698 3.23 77 1,000 29 22 919 1,737 0 1,493 0699 3.23 79 1,000 31 22 919 1,897 0 1,482 0700 3.23 90 1,000 43 22 919 2,572 0 1,467 0701 3.23 71 1,000 23 22 352 1,277 0 1,192 0702 3.23 87 1,000 41 22 919 2,556 0 1,461 0703 3.23 92 1,000 44 22 919 2,475 0 1,460 0704 3.23 96 1,000 48 22 919 2,453 0 1,459 0705 3.23 94 1,000 46 22 919 2,549 0 1,458 0706 3.23 85 1,000 38 22 919 2,206 0 1,454 0707 3.23 40 1,000 34 34 820 2,002 0 2,002 0708 3.23 40 1,000 34 34 708 2,005 0 2,005 0709 3.23 40 1,000 35 35 709 2,396 0 2,395 0710 3.23 40 1,000 35 35 710 2,446 0 2,446 0711 3.23 40 1,000 36 36 711 1541 2,190 0 2,784 0712 3.23 38 1,000 35 35 712 3,087 0 3,086 0713 3.23 81 1,000 32 22 352 1,747 0 1,209 0714 3.23 85 1,000 35 22 352 1,785 0 1,209 0715 3.23 81 1,000 30 22 352 1,585 0 1,220 0716 3.23 79 1,000 29 22 352 1,593 0 1,208 0717 3.23 85 1,000 35 22 352 1,780 0 1,209 0718 0 28 1,000 25 35 390 2,430 0 4,180 0719 3.23 53 1,000 49 34 230 3,791 0 2,705 0720 3.23 53 1,000 49 34 230 3,740 0 2,695 0721 3.23 51 1,000 46 34 230 3,430 0 2,688 0722 3.23 55 1,000 50 34 230 1554 2,561 0 2,658 0723 3.23 64 1,000 58 34 230 1555 2,291 0 2,658 0724 3.23 53 1,000 48 33 230 3,337 0 2,599 0725 3.23 55 1,000 50 34 230 3,371 0 2,649 0726 3.23 62 1,000 57 34 230 1561 2,580 0 2,660 0727 3.23 40 1,000 35 35 727 1807 2,252 0 2,412 0728 3.23 40 1,000 18 18 728 1565 881 119 948 52729 3.23 53 1,000 48 40 730 1569 2,701 0 2,750 0730 3.23 45 1,000 25 25 730 1570 881 119 1,147 0731 3.23 53 1,000 47 39 732 1572 2,634 0 2,499 0732 3.23 44 1,000 24 24 732 1573 881 119 1,117 0733 3.23 62 1,000 62 35 230 103 3,437 0 4,805 0734 3.23 69 1,000 64 64 734 1575 3,108 0 4,196 0735 3.23 67 1,000 64 50 817 1579 1,791 0 5,450 0736 3.23 80 1,000 77 50 817 1582 4,200 0 6,208 0737 3.23 82 2,000 73 73 737 1583 2,870 0 6,055 0738 3.23 84 2,000 75 75 738 1585 2,882 0 6,153 0739 3.23 86 2,000 79 79 739 1586 4,172 0 7,036 0740 3.23 88 2,000 81 81 740 1587 3,688 0 7,244 0741 3.23 84 2,000 74 74 741 1591 2,761 0 5,713 0742 3.23 54 1,000 52 52 742 1593 2,707 0 5,057 0743 3.23 84 1,000 78 78 743 1594 1,805 0 3,444 0744 3.23 50 1,000 47 27 686 1597 3,125 0 4,003 0745 3.23 67 1,000 65 27 686 1598 4,767 0 6,118 0746 3.23 63 1,000 58 58 746 1601 1,659 0 3,269 0747 3.23 79 1,000 29 22 352 1,533 0 1,212 0748 3.23 42 1,000 36 34 708 2,186 0 2,154 0749 3.23 40 1,000 34 34 749 2,162 0 2,162 0750 3.23 40 1,000 35 35 750 2,550 0 2,549 0751 3.23 42 1,000 37 37 751 2,472 0 2,472 0752 3.23 49 1,000 44 34 230 1613 2,654 0 2,770 0753 3.23 70 3,000 40 29 754 1615 2,706 294 3,461 0754 3.23 57 1,000 52 52 754 3,200 0 3,200 0
Page 25 of 48

City of Oak Harbor 2033 Maximum Day DemandWater System Plan Fire Flow ScenarioNovember 2013 Existing System w/ New East Zone
Node ID
StaticDemand
(gpm)
StaticPressure
(psi)
Min. Fire FlowRequirement
(gpm)
ResidualPressure atRequired FF
(psi)
Min. SystemPressure atRequired FF
(psi)CriticalNode
CriticalPipe
Available Floww/ VelocityLimitations
(gpm)
FF Deficiencybased on
Velocity (gpm)
Available Floww/ PressureLimitations
(gpm)
FF Deficiencybased on
Pressure (gpm)755 3.23 94 3,500 82 24 230 1620 5,524 0 4,489 0756 3.23 94 3,500 77 24 230 1621 2,357 1,143 4,420 0757 3.23 89 3,500 69 23 230 1623 2,867 633 4,389 0758 3.23 87 3,000 75 26 230 179 4,190 0 4,422 0759 3.23 92 3,000 74 26 230 1624 3,049 0 4,278 0760 3.23 92 3,000 75 26 230 1761 2,684 316 4,181 0761 3.23 87 3,500 68 27 230 1629 2,586 914 5,377 0762 3.23 89 3,500 76 28 230 1628 4,863 0 5,554 0763 3.23 89 3,500 75 28 230 1630 3,081 419 5,686 0764 3.23 85 3,500 52 52 764 1632 2,942 558 5,025 0765 3.23 96 3,500 50 24 230 1634 1,567 1,933 4,491 0766 3.23 92 3,000 83 25 230 1635 6,240 0 3,924 0767 3.23 111 1,000 106 36 875 1744 4,255 0 2,573 0768 3.23 83 3,000 52 15 230 1641 3,026 0 2,558 442769 3.23 92 3,000 65 15 230 1638 5,352 0 2,563 437770 3.23 79 3,000 50 15 230 1645 3,371 0 2,557 443771 3.23 77 3,000 51 15 230 4,938 0 2,582 418772 3.23 70 1,000 54 54 772 1646 881 119 1,900 0773 3.23 53 1,000 45 33 875 2,370 0 1,790 0774 3.23 75 1,000 63 63 896 2,488 0 2,488 0775 3.23 68 2,000 52 23 230 4,005 0 2,236 0776 3.23 49 2,000 36 28 230 3,366 0 2,913 0777 3.23 62 2,000 51 27 230 4,762 0 2,791 0778 3.23 70 1,000 65 33 230 1656 2,310 0 2,559 0779 3.23 66 1,000 60 33 230 3,688 0 2,322 0780 3.23 49 1,000 43 33 230 2,664 0 2,276 0781 3.23 44 1,000 38 33 230 2,425 0 2,272 0782 3.23 44 1,000 37 37 782 2,185 0 2,185 0783 3.23 70 1,000 64 33 230 1661 3,205 0 2,290 0784 3.23 57 2,000 42 22 230 3,399 0 2,186 0785 3.23 57 1,000 51 33 230 1665 2,544 0 2,286 0786 3.23 44 1,000 37 37 786 2,196 0 2,196 0787 3.23 53 1,000 47 33 230 2,834 0 2,267 0788 3.23 53 1,000 47 33 230 2,914 0 2,265 0789 3.23 55 1,000 49 33 230 3,048 0 2,258 0790 3.23 62 1,000 56 33 230 3,576 0 2,260 0791 3.23 70 1,000 65 33 230 4,056 0 2,265 0792 3.23 81 1,000 75 33 230 1674 2,471 0 2,265 0793 3.23 81 1,000 74 33 230 1675 2,121 0 2,265 0794 3.23 87 1,000 79 33 230 1676 2,875 0 2,265 0795 3.23 88 1,000 79 33 230 1677 2,659 0 2,265 0796 3.23 83 1,000 76 33 230 1679 2,854 0 2,265 0797 3.23 79 1,000 72 33 230 1680 3,397 0 2,265 0798 3.23 73 1,000 66 33 230 1681 2,728 0 2,265 0799 3.23 73 1,000 67 33 230 4,142 0 2,270 0800 3.23 60 1,000 54 33 230 3,459 0 2,248 0801 3.23 66 1,000 59 33 230 1687 2,429 0 2,245 0802 3.23 62 1,000 56 33 230 3,348 0 2,242 0803 3.23 57 1,000 52 33 230 3,329 0 2,240 0804 3.23 40 1,000 34 32 230 2,246 0 2,140 0805 3.23 40 1,000 33 33 805 1,959 0 1,959 0806 3.23 45 1,000 35 35 806 1,753 0 1,753 0808 3.23 73 1,000 55 43 613 1252 1,317 0 1,704 0809 3.23 88 1,000 72 72 809 1419 1,567 0 2,263 0810 3.23 70 1,000 -76 -76 810 1398 392 608 562 438811 3.23 97 1,000 89 89 811 1707 1,567 0 3,684 0812 3.23 73 2,000 35 35 812 1416 1,567 433 2,410 0813 3.23 76 3,250 72 34 230 1713 2,098 1,152 7,574 0815 3.23 96 1,000 23 23 815 940 881 119 1,047 0816 3.23 104 1,000 76 54 247 1566 881 119 1,703 0817 3.23 52 1,000 39 39 817 949 1,567 0 1,664 0818 3.23 69 1,000 23 23 818 1,442 0 1,441 0819 3.23 71 1,000 22 22 819 1,184 0 1,183 0820 3.23 40 1,000 27 27 820 1,266 0 1,266 0833 3.23 80 3,500 -29 -29 833 1735 2,448 1,052 2,525 975836 3.23 78 2,000 54 28 684 1746 3,797 0 4,204 0837 3.23 41 2,000 29 23 684 2,733 0 2,647 0838 3.23 59 2,000 -20 -20 838 1751 646 1,354 1,364 636839 3.23 56 3,500 26 18 581 3,860 0 3,349 151840 3.23 74 3,500 56 25 919 1359 4,940 0 6,527 0841 3.23 89 3,500 69 25 919 1359 5,271 0 6,636 0842 3.23 92 3,000 79 25 230 1762 2,189 811 4,031 0844 3.23 90 2,000 55 25 843 1938 1,533 467 2,476 0845 3.23 80 2,000 36 36 845 2,389 0 2,389 0846 3.23 80 1,000 67 67 851 2,352 0 2,351 0847 3.23 90 2,000 49 25 843 1771 2,194 0 2,476 0848 3.23 83 1,000 66 66 848 1773 1,567 0 2,122 0853 3.23 32 1,000 30 26 684 2,728 0 2,118 0854 3.23 32 1,000 30 26 685 2,703 0 2,100 0855 3.23 32 1,000 30 26 686 2,859 0 2,245 0856 3.23 32 1,000 30 26 686 2,740 0 2,128 0857 3.23 88 2,000 30 28 851 1796 1,563 437 2,175 0858 3.23 97 2,000 33 28 851 2,224 0 2,175 0
Page 26 of 48

City of Oak Harbor 2033 Maximum Day DemandWater System Plan Fire Flow ScenarioNovember 2013 Existing System w/ New East Zone
Node ID
StaticDemand
(gpm)
StaticPressure
(psi)
Min. Fire FlowRequirement
(gpm)
ResidualPressure atRequired FF
(psi)
Min. SystemPressure atRequired FF
(psi)CriticalNode
CriticalPipe
Available Floww/ VelocityLimitations
(gpm)
FF Deficiencybased on
Velocity (gpm)
Available Floww/ PressureLimitations
(gpm)
FF Deficiencybased on
Pressure (gpm)862 3.23 74 3,500 11 11 602 1799 1,563 1,937 3,231 269863 3.23 57 1,000 42 29 315 1803 875 125 1,309 0864 3.23 45 1,000 40 36 727 3,066 0 2,755 0868 3.23 43 2,000 31 24 684 1815 2,646 0 2,862 0869 3.23 89 3,500 -65 -65 869 1818 1,567 1,933 2,263 1,237875 3.23 41 1,000 31 31 875 1,636 0 1,636 0876 0 44 1,000 31 31 875 1,421 0 1,632 0877 0 45 1,000 32 31 875 1,442 0 1,632 0878 0 43 1,000 31 31 875 1,477 0 1,632 0879 0 44 1,000 32 31 875 1,464 0 1,632 0880 3.23 94 3,500 78 39 581 1852 4,293 0 6,676 0885 3.23 93 3,500 72 39 581 1838 1,965 1,535 6,665 0887 3.23 94 3,500 63 63 887 1849 2,376 1,124 5,691 0888 3.23 94 3,500 59 59 888 1843 2,648 852 5,327 0889 3.23 75 1,000 65 34 875 2,733 0 1,972 0890 3.23 75 1,000 52 52 890 1888 881 119 1,634 0896 3.23 75 1,000 63 63 896 2,407 0 2,407 0900 3.23 54 1,000 51 51 900 368 2,807 0 3,918 0901 3.23 51 2,000 41 41 901 370 1,563 437 3,844 0903 3.23 52 2,000 33 33 903 371 1,567 433 2,651 0919 3.23 67 1,000 6 6 919 786 214 786 214920 3.23 62 1,000 55 34 230 373 2,646 0 2,658 0923 3.23 50 1,000 39 39 923 376 881 119 1,727 0924 3.23 56 3,500 19 19 924 983 3,052 448 3,454 46925 3.23 91 3,500 62 62 925 378 2,429 1,071 5,776 0926 3.23 83 3,500 0 0 926 379 1,567 1,933 3,020 480927 3.23 87 3,500 50 29 577 380 2,860 640 4,164 0928 3.23 87 3,500 -2 -2 928 381 1,567 1,933 2,997 503929 3.23 66 1,000 48 48 929 1147 1,124 0 1,650 0930 3.23 66 1,000 56 33 230 2,545 0 2,242 0931 3.23 94 3,000 41 14 875 384 1,567 1,433 2,574 426932 3.23 68 2,000 39 23 230 385 1,567 433 2,236 0933 3.23 57 2,000 41 22 230 3,320 0 2,142 0934 3.23 92 3,000 50 25 230 387 1,613 1,387 3,924 0935 3.23 49 1,000 43 32 230 2,794 0 2,193 0936 3.23 49 1,000 37 37 936 391 1,567 0 1,721 0937 3.23 84 1,000 65 28 684 3,669 0 3,669 0
Page 27 of 48

City of Oak Harbor 2033 Maximum Day DemandWater System Plan Fire Flow ScenarioNovember 2013 Improved System w/ CIPs
Node ID
StaticDemand
(gpm)
StaticPressure
(psi)
Min. Fire FlowRequirement
(gpm)
ResidualPressure atRequired FF
(psi)
Min. SystemPressure atRequired FF
(psi)CriticalNode
CriticalPipe
Available Floww/ VelocityLimitations
(gpm)
FF Deficiencybased on
Velocity (gpm)
Available Floww/ PressureLimitations
(gpm)
FF Deficiencybased on
Pressure (gpm)10 3.23 80 1,000 71 37 435 17 2,461 0 2,204 012 3.23 74 1,000 65 37 435 2,821 0 2,203 014 3.23 67 1,000 59 37 435 2,645 0 2,206 016 3.23 88 1,000 77 37 435 31 1,448 0 2,204 018 3.23 81 3,500 73 73 18 41 3,823 0 8,131 020 3.23 82 3,500 65 65 20 57 3,002 498 6,738 022 3.23 81 3,500 70 70 22 47 3,866 0 7,934 024 3.23 81 3,500 69 69 24 49 3,339 161 7,643 026 3.23 81 3,500 70 70 26 43 2,817 683 7,657 028 3.23 68 1,000 66 37 435 3,903 0 3,109 030 3.23 64 1,000 62 37 435 61 3,257 0 3,123 032 3.23 60 1,000 57 37 435 3,187 0 3,132 034 3.23 71 1,000 67 37 435 3,237 0 3,108 036 3.23 70 1,000 66 37 435 3,155 0 3,108 038 3.23 70 1,000 65 37 435 3,075 0 3,075 040 3.23 75 1,000 70 37 435 3,098 0 3,062 042 3.23 73 1,000 68 37 435 3,049 0 3,049 044 3.23 75 1,000 69 37 435 83 2,256 0 2,940 046 3.23 77 1,000 71 37 435 2,939 0 2,939 048 3.23 75 1,000 68 37 435 89 2,790 0 2,823 050 3.23 84 1,000 78 37 435 93 2,448 0 3,028 052 3.23 82 1,000 76 37 435 95 2,445 0 3,075 054 3.23 79 3,500 74 38 732 109 4,396 0 8,760 056 3.23 76 2,000 49 49 56 111 1,541 459 2,942 058 3.23 76 1,000 74 37 435 113 5,312 0 7,000 060 3.23 77 1,000 75 37 435 115 2,754 0 7,207 062 3.23 78 1,000 76 37 435 121 4,022 0 6,857 064 3.23 78 1,000 76 37 435 119 4,058 0 6,855 066 3.23 80 1,000 77 37 435 131 3,893 0 6,364 068 3.23 79 1,000 77 37 435 123 3,541 0 6,711 070 3.23 102 1,000 100 37 435 133 3,512 0 6,777 072 3.23 90 1,000 87 37 435 135 2,164 0 5,672 074 3.23 89 1,000 86 37 435 367 3,890 0 5,260 076 3.23 98 1,000 73 73 76 141 1,567 0 1,865 078 3.23 51 1,000 49 37 435 2,966 0 2,967 080 3.23 55 2,000 41 37 435 155 2,526 0 2,988 082 3.23 60 2,000 45 37 435 3,133 0 3,002 084 3.23 64 2,000 51 37 435 3,450 0 3,015 086 3.23 64 2,000 49 37 435 147 3,131 0 3,031 088 3.23 95 1,000 93 37 435 161 5,114 0 6,287 090 3.23 95 1,000 92 37 435 163 3,518 0 6,272 092 3.23 85 3,000 71 71 92 179 3,003 0 6,454 094 3.23 77 1,000 75 37 435 4,333 0 3,132 096 3.23 73 1,000 71 37 435 1685 3,914 0 3,155 098 3.23 89 1,000 81 37 435 185 1,795 0 3,965 0100 3.23 88 1,000 80 37 435 187 1,604 0 3,952 0102 3.23 62 3,500 -22 -32 577 189 1,563 1,937 2,082 1,418104 3.23 70 1,000 63 37 435 1265 1,580 0 3,353 0106 3.23 84 1,000 77 37 435 195 1,567 0 3,270 0108 3.23 60 1,000 50 37 435 1393 1,554 0 2,365 0110 3.23 86 1,000 79 37 435 1595 1,606 0 3,432 0112 3.23 70 1,000 66 37 435 201 2,880 0 4,097 0114 3.23 87 1,000 82 37 435 203 2,704 0 4,351 0116 3.23 97 3,500 67 67 116 205 1,827 1,673 5,801 0128 3.23 96 2,500 87 37 435 237 9,450 0 7,688 0134 3.23 94 1,000 91 37 435 285 3,681 0 5,822 0136 3.23 95 1,000 91 37 435 287 3,597 0 5,606 0138 3.23 94 1,000 91 37 435 289 3,790 0 5,687 0140 3.23 94 1,000 91 37 435 291 3,118 0 5,810 0142 3.23 97 1,000 94 37 435 293 3,692 0 5,845 0144 3.23 101 1,000 97 37 435 1925 2,844 0 5,506 0146 3.23 101 1,000 96 37 435 1926 2,756 0 5,059 0148 3.23 70 1,000 59 37 435 277 1,543 0 2,531 0215 3.23 122 1,000 119 37 435 1637 4,449 0 3,439 0216 3.23 78 2,000 77 37 435 12,544 0 9,726 0217 3.23 100 1,000 98 37 435 1504 3,509 0 7,844 0218 3.23 64 1,000 58 37 435 925 3,407 0 4,162 0219 3.23 105 1,000 97 37 435 3,367 0 2,942 0220 3.23 109 1,000 101 37 435 919 3,512 0 3,035 0221 3.23 81 3,500 75 75 221 1423 6,197 0 8,387 0222 3.23 86 2,000 72 37 435 930 3,525 0 5,150 0228 3.23 104 1,000 101 37 435 923 4,393 0 6,580 0229 3.23 72 1,000 71 37 435 4,502 0 3,585 0230 3.23 49 2,000 37 37 230 2,904 0 2,904 0231 0 77 2,000 75 37 435 12,438 0 9,723 0232 3.23 80 3,500 64 37 435 8,550 0 7,340 0233 3.23 62 1,000 55 37 435 3,266 0 3,267 0235 3.23 64 1,000 58 37 435 4,825 0 3,794 0236 3.23 66 1,000 58 37 435 943 2,411 0 2,978 0237 3.23 69 1,000 63 37 435 1518 1,766 0 3,280 0238 3.23 80 1,000 77 37 435 129 2,855 0 5,981 0239 3.23 81 1,000 79 37 435 1513 4,682 0 7,060 0240 3.23 56 1,000 50 37 435 3,721 0 3,671 0
Page 28 of 48

City of Oak Harbor 2033 Maximum Day DemandWater System Plan Fire Flow ScenarioNovember 2013 Improved System w/ CIPs
Node ID
StaticDemand
(gpm)
StaticPressure
(psi)
Min. Fire FlowRequirement
(gpm)
ResidualPressure atRequired FF
(psi)
Min. SystemPressure atRequired FF
(psi)CriticalNode
CriticalPipe
Available Floww/ VelocityLimitations
(gpm)
FF Deficiencybased on
Velocity (gpm)
Available Floww/ PressureLimitations
(gpm)
FF Deficiencybased on
Pressure (gpm)241 3.23 75 1,000 68 37 435 942 3,239 0 3,780 0242 3.23 79 1,000 72 37 435 1071 2,779 0 3,772 0243 3.23 70 1,000 63 37 435 193 3,062 0 3,319 0244 3.23 78 1,000 73 37 435 1299 2,442 0 3,753 0245 3.23 76 1,000 72 37 435 1274 4,699 0 5,151 0246 3.23 89 3,500 61 61 246 1179 2,557 943 5,591 0247 3.23 75 1,000 52 52 247 1095 878 122 1,640 0248 3.23 65 1,000 57 37 732 1096 2,524 0 2,197 0249 3.23 49 1,000 42 37 732 2,347 0 2,069 0250 3.23 51 1,000 40 37 435 966 1,709 0 1,759 0251 3.23 83 3,500 63 33 581 1309 4,521 0 4,924 0252 3.23 70 1,000 70 37 435 1425 8,922 0 8,329 0253 3.23 78 1,000 77 37 435 9,215 0 7,577 0254 3.23 82 2,000 81 37 435 12,753 0 9,808 0255 3.23 81 1,000 78 37 435 972 3,482 0 6,252 0256 3.23 77 1,000 74 37 435 973 3,007 0 5,830 0257 3.23 76 1,000 74 37 435 974 3,416 0 6,301 0258 3.23 69 1,000 67 37 435 980 6,195 0 7,585 0259 3.23 74 1,000 72 37 435 979 2,614 0 6,995 0260 3.23 48 1,000 40 37 435 964 1,668 0 1,958 0261 3.23 51 1,000 44 37 435 961 2,363 0 2,408 0262 3.23 59 1,000 53 37 435 957 1,959 0 2,951 0263 3.23 60 1,000 54 37 435 1600 2,280 0 2,713 0264 3.23 55 1,000 46 37 435 963 1,574 0 2,155 0265 3.23 80 1,000 77 37 435 954 4,697 0 6,102 0266 3.23 73 1,000 68 37 435 970 2,355 0 3,855 0267 3.23 74 1,000 68 37 435 970 1,737 0 3,586 0268 3.23 71 1,000 67 37 435 976 1,822 0 4,391 0269 3.23 69 1,000 68 37 435 1495 4,241 0 6,608 0270 3.23 71 1,000 68 37 435 978 2,448 0 5,127 0271 3.23 68 1,000 65 37 435 959 3,554 0 4,142 0272 3.23 67 1,000 63 37 435 959 1,788 0 4,028 0273 3.23 68 1,000 64 37 435 955 2,823 0 4,395 0274 3.23 82 1,000 80 37 435 1430 5,984 0 5,610 0275 3.23 83 3,000 73 37 435 1437 5,520 0 6,048 0276 3.23 85 3,000 75 37 435 1436 6,574 0 6,932 0277 3.23 95 2,000 87 37 435 981 3,820 0 7,512 0278 3.23 95 3,000 83 37 435 1456 6,581 0 8,729 0279 3.23 88 3,000 77 37 435 956 5,051 0 6,499 0280 3.23 61 1,000 57 37 435 1601 4,189 0 3,993 0281 3.23 53 1,000 49 37 435 990 3,286 0 3,388 0282 3.23 60 1,000 54 37 435 991 1,617 0 2,898 0283 3.23 64 1,000 54 37 435 993 1,474 0 2,306 0284 3.23 57 1,000 51 37 435 994 1,812 0 2,647 0285 3.23 51 1,000 46 37 435 2,816 0 2,816 0286 3.23 52 1,000 46 37 435 2,650 0 2,650 0287 3.23 83 1,000 78 37 435 982 2,442 0 4,566 0288 3.23 84 3,500 39 37 435 985 2,852 648 4,460 0289 3.23 88 3,500 36 36 289 995 2,866 634 4,194 0290 3.23 84 3,500 42 37 435 996 3,028 472 4,688 0291 3.23 72 1,000 70 37 435 1003 2,555 0 6,000 0292 3.23 65 1,000 61 37 435 999 2,331 0 4,085 0293 3.23 92 1,000 88 37 435 1001 2,763 0 5,045 0294 3.23 76 1,000 73 37 435 1002 3,084 0 5,522 0295 3.23 82 2,000 71 37 435 1588 2,985 0 5,649 0296 3.23 88 1,000 84 37 435 1465 2,011 0 4,812 0297 3.23 77 1,000 71 37 435 952 2,330 0 3,604 0298 3.23 63 1,000 58 37 435 997 1,963 0 3,441 0299 3.23 82 1,000 79 37 435 1008 3,549 0 6,145 0300 3.23 71 1,000 65 37 435 1924 2,713 0 4,280 0301 3.23 74 1,000 68 37 435 1013 3,663 0 4,097 0302 3.23 78 1,000 72 37 435 1012 2,948 0 4,119 0303 3.23 86 1,000 80 37 435 1593 3,120 0 5,216 0304 3.23 88 1,000 84 37 435 1015 2,721 0 5,468 0305 3.23 85 1,500 80 37 435 1009 5,140 0 5,527 0306 3.23 74 1,000 70 37 435 1016 3,558 0 4,935 0307 3.23 82 1,000 50 37 435 1006 881 119 1,444 0308 3.23 63 1,000 62 37 435 1579 8,321 0 12,549 0309 3.23 67 1,000 61 37 435 1580 1,784 0 2,958 0310 3.23 59 1,000 50 37 435 1057 1,563 0 2,222 0315 3.23 75 1,000 38 37 435 1066 881 119 1,257 0316 3.23 84 1,000 71 37 435 1949 1,673 0 2,331 0318 3.23 76 1,000 63 37 435 1068 1,527 0 2,384 0319 3.23 88 1,000 78 37 435 1577 1,490 0 3,081 0320 3.23 105 2,000 94 37 435 1030 3,390 0 7,026 0321 3.23 103 3,000 88 37 435 1715 3,854 0 8,235 0322 3.23 92 1,000 86 37 435 1031 2,355 0 4,680 0323 3.23 76 1,000 72 37 435 1582 3,392 0 5,488 0324 3.23 82 1,000 70 37 435 1062 1,275 0 2,684 0325 3.23 84 1,000 77 37 435 1035 2,085 0 4,224 0326 3.23 76 1,000 71 37 435 1060 4,021 0 5,550 0327 3.23 89 1,000 82 37 435 1035 2,378 0 4,566 0328 3.23 90 1,000 81 37 435 1034 1,497 0 3,612 0
Page 29 of 48

City of Oak Harbor 2033 Maximum Day DemandWater System Plan Fire Flow ScenarioNovember 2013 Improved System w/ CIPs
Node ID
StaticDemand
(gpm)
StaticPressure
(psi)
Min. Fire FlowRequirement
(gpm)
ResidualPressure atRequired FF
(psi)
Min. SystemPressure atRequired FF
(psi)CriticalNode
CriticalPipe
Available Floww/ VelocityLimitations
(gpm)
FF Deficiencybased on
Velocity (gpm)
Available Floww/ PressureLimitations
(gpm)
FF Deficiencybased on
Pressure (gpm)329 3.23 77 1,000 72 37 435 1064 2,945 0 4,836 0330 3.23 77 1,000 72 37 435 1065 4,265 0 4,167 0331 3.23 87 1,000 80 37 435 1084 2,162 0 4,084 0332 3.23 91 1,000 83 37 435 1086 2,432 0 4,019 0333 3.23 77 1,750 64 35 730 1083 3,577 0 3,893 0334 3.23 64 1,000 56 37 435 1082 3,107 0 3,725 0335 3.23 74 1,000 68 37 435 1087 2,870 0 3,340 0336 3.23 67 3,000 27 23 337 1092 1,402 1,598 3,118 0337 3.23 59 1,000 46 37 435 1091 1,635 0 2,060 0338 3.23 60 1,000 50 37 435 1088 1,696 0 2,962 0339 3.23 64 1,000 55 37 435 1081 3,402 0 3,715 0340 3.23 109 3,000 83 29 875 1114 4,758 0 3,541 0341 3.23 70 1,000 63 37 435 924 2,314 0 3,663 0342 3.23 64 1,000 58 37 435 925 3,780 0 4,091 0343 3.23 58 1,000 52 37 435 4,338 0 3,811 0344 3.23 61 1,000 55 37 435 4,675 0 3,645 0345 3.23 58 1,000 51 37 435 1020 2,797 0 2,717 0346 3.23 66 1,000 59 37 435 1070 3,094 0 3,377 0347 3.23 60 1,000 53 37 435 1748 2,742 0 3,459 0348 3.23 67 1,000 58 37 435 1027 1,454 0 2,705 0349 3.23 65 1,000 58 37 435 2,999 0 2,999 0350 3.23 82 1,000 72 37 435 1526 2,274 0 3,094 0352 3.23 55 1,000 48 37 435 1522 2,591 0 3,012 0353 3.23 59 1,000 50 37 435 1543 2,188 0 2,458 0354 3.23 59 1,000 54 37 435 1121 2,511 0 2,687 0355 3.23 56 1,000 51 37 435 2,725 0 2,724 0356 3.23 58 1,000 53 37 435 1124 2,593 0 2,663 0357 3.23 60 1,000 56 37 435 1126 2,329 0 2,737 0358 3.23 61 1,000 56 37 435 2,903 0 2,724 0359 3.23 57 1,000 52 37 435 2,688 0 2,688 0360 3.23 77 1,000 71 37 435 3,054 0 2,710 0361 3.23 78 1,000 73 37 435 3,281 0 2,690 0362 3.23 80 1,000 75 37 435 3,433 0 2,690 0363 3.23 65 1,000 61 37 435 3,170 0 2,675 0364 3.23 65 1,000 61 37 435 3,170 0 2,732 0365 3.23 88 3,500 70 37 435 8,197 0 6,639 0366 3.23 68 1,000 65 37 435 3,410 0 2,810 0367 3.23 61 1,000 57 37 435 3,023 0 2,793 0368 3.23 67 1,000 62 37 435 3,106 0 2,753 0369 3.23 70 1,000 66 37 435 1133 3,156 0 2,814 0370 3.23 81 1,000 78 37 435 1136 3,284 0 2,881 0371 3.23 84 3,000 78 38 732 1038 5,051 0 8,420 0372 3.23 80 1,000 79 79 372 1039 3,362 0 6,827 0373 3.23 82 3,000 79 38 732 109 8,414 0 8,577 0374 3.23 98 2,000 54 54 423 1142 1,487 513 2,742 0375 3.23 62 2,000 59 35 435 1706 5,989 0 4,984 0376 3.23 96 1,000 94 37 435 9,710 0 7,707 0377 3.23 77 1,000 74 37 435 1313 3,024 0 4,592 0378 3.23 83 1,000 80 37 435 1360 2,659 0 5,696 0379 3.23 71 1,000 65 65 379 1617 2,692 0 3,291 0380 3.23 54 1,000 47 37 730 1093 2,542 0 2,267 0381 3.23 70 1,000 62 37 435 1077 2,645 0 3,211 0382 3.23 68 1,000 61 37 435 1076 3,168 0 3,542 0383 3.23 79 1,000 71 37 435 1078 3,102 0 3,521 0384 3.23 88 1,000 80 37 435 1577 3,678 0 3,810 0386 3.23 74 1,000 74 37 435 5,377 0 3,601 0387 3.23 76 1,000 76 37 435 5,385 0 3,598 0388 3.23 72 1,000 64 37 435 1539 3,522 0 3,834 0389 3.23 68 1,000 62 37 435 4,886 0 3,820 0390 3.23 68 1,000 61 37 435 1074 2,977 0 3,802 0391 3.23 43 1,000 37 37 391 1,829 0 1,828 0392 3.23 46 1,000 41 37 435 2,102 0 2,061 0393 3.23 58 1,000 52 37 435 2,503 0 2,064 0394 3.23 48 2,000 23 22 395 2,100 0 2,073 0395 3.23 44 1,000 38 37 435 1,962 0 1,962 0396 3.23 50 1,000 43 37 435 2,299 0 2,075 0397 3.23 46 1,000 39 37 435 2,023 0 2,023 0398 3.23 55 1,000 48 37 435 2,352 0 2,087 0399 3.23 59 1,000 52 37 435 2,378 0 2,089 0400 3.23 54 1,000 47 37 435 2,336 0 2,086 0401 3.23 57 1,000 50 37 435 2,399 0 2,095 0402 3.23 50 1,000 43 37 435 2,072 0 2,072 0403 3.23 58 1,000 51 37 435 2,418 0 2,192 0404 3.23 58 1,000 50 37 435 2,486 0 2,218 0405 3.23 71 3,000 65 39 875 1029 4,449 0 5,589 0406 3.23 92 1,000 90 37 435 5,666 0 3,496 0407 3.23 90 3,000 67 28 875 5,744 0 3,478 0408 3.23 87 1,000 85 37 435 1135 3,883 0 3,321 0409 3.23 62 1,000 61 61 409 1574 2,725 0 5,544 0410 3.23 81 1,000 78 78 410 1048 2,955 0 4,712 0411 3.23 67 1,000 64 60 659 1040 2,918 0 4,260 0412 3.23 64 2,000 53 53 412 1042 2,930 0 4,276 0413 3.23 55 1,000 51 51 413 1045 2,879 0 3,374 0
Page 30 of 48

City of Oak Harbor 2033 Maximum Day DemandWater System Plan Fire Flow ScenarioNovember 2013 Improved System w/ CIPs
Node ID
StaticDemand
(gpm)
StaticPressure
(psi)
Min. Fire FlowRequirement
(gpm)
ResidualPressure atRequired FF
(psi)
Min. SystemPressure atRequired FF
(psi)CriticalNode
CriticalPipe
Available Floww/ VelocityLimitations
(gpm)
FF Deficiencybased on
Velocity (gpm)
Available Floww/ PressureLimitations
(gpm)
FF Deficiencybased on
Pressure (gpm)414 3.23 63 1,000 60 52 413 1042 3,747 0 4,035 0415 3.23 65 1,000 62 52 413 1046 2,574 0 4,042 0416 3.23 78 1,000 75 53 413 1567 2,899 0 4,875 0417 3.23 81 1,000 77 77 417 1050 2,790 0 4,768 0418 3.23 82 3,500 59 59 418 1420 2,220 1,280 5,640 0419 3.23 83 3,500 78 37 732 946 6,012 0 8,593 0420 3.23 85 3,000 78 38 732 1052 2,585 415 8,374 0421 3.23 85 3,000 78 38 732 1052 2,688 312 8,392 0422 3.23 86 3,500 77 37 732 1055 4,634 0 8,257 0423 3.23 97 2,000 31 31 423 2,178 0 2,178 0424 3.23 98 2,000 35 34 423 1144 1,560 440 2,229 0425 3.23 98 2,000 49 49 423 1145 1,557 443 2,583 0426 3.23 96 3,500 85 37 732 1140 4,614 0 7,958 0427 3.23 90 3,500 83 37 732 1630 7,201 0 8,171 0428 3.23 95 3,500 86 36 435 1139 5,273 0 8,193 0429 3.23 59 2,000 57 36 435 929 2,340 0 5,058 0430 3.23 56 1,000 54 36 435 928 2,606 0 4,170 0431 3.23 54 1,000 52 36 435 1228 2,956 0 3,765 0432 3.23 52 1,000 49 35 435 1229 2,930 0 3,387 0433 3.23 45 1,000 42 35 435 1230 2,841 0 3,168 0434 3.23 42 1,000 39 35 435 2,911 0 2,890 0435 3.23 37 2,000 26 26 435 2,566 0 2,566 0436 3.23 66 2,000 61 35 435 1208 4,778 0 4,859 0437 3.23 69 2,000 61 34 435 1209 2,620 0 4,481 0438 3.23 61 2,000 50 50 438 1211 2,050 0 4,073 0439 3.23 60 1,000 57 36 435 1226 2,575 0 3,821 0440 3.23 57 1,000 53 53 440 1224 2,092 0 3,425 0441 3.23 48 1,000 43 43 441 1218 1,938 0 2,544 0442 3.23 42 2,000 31 27 435 2,981 0 2,705 0443 3.23 53 1,000 49 49 443 1222 2,079 0 2,949 0444 3.23 96 2,000 87 30 435 1216 4,218 0 3,344 0445 3.23 64 1,000 62 36 435 1213 4,141 0 3,706 0446 3.23 90 3,000 55 30 754 1616 3,088 0 3,523 0447 3.23 74 3,000 48 32 754 1199 3,166 0 3,643 0448 3.23 64 3,000 41 25 435 1205 3,440 0 3,608 0449 3.23 77 3,500 50 22 435 1203 3,725 0 3,723 0450 3.23 87 3,000 65 26 435 1201 3,051 0 3,752 0451 3.23 94 3,000 69 27 435 1197 2,509 491 3,806 0452 3.23 95 3,500 56 56 452 1180 2,901 599 4,961 0453 3.23 97 3,500 42 42 453 1165 2,005 1,495 4,194 0454 3.23 97 3,500 78 34 435 1168 2,331 1,169 6,740 0455 3.23 91 3,500 76 34 435 1164 4,215 0 7,044 0456 3.23 97 3,500 84 34 435 1164 5,494 0 6,909 0457 3.23 89 3,500 71 34 435 1169 3,469 31 6,613 0458 3.23 81 3,500 67 34 435 1163 5,151 0 6,475 0459 3.23 81 3,500 59 59 459 1188 3,710 0 5,831 0460 3.23 82 3,500 60 60 460 1178 3,368 132 6,021 0461 3.23 70 3,500 56 33 435 1172 4,830 0 6,096 0462 3.23 65 2,000 59 59 462 1189 3,787 0 5,575 0463 3.23 67 3,500 45 45 463 1177 3,060 440 5,124 0464 3.23 81 3,500 54 54 464 1187 3,029 471 5,340 0465 3.23 90 3,500 27 27 465 1183 1,444 2,056 3,712 0466 3.23 90 3,500 60 60 466 1184 2,548 952 5,456 0467 3.23 90 3,500 70 31 435 1195 3,512 0 5,177 0468 3.23 75 2,000 69 35 435 1194 3,177 0 5,005 0469 3.23 66 2,000 61 35 435 1208 3,405 0 4,968 0470 3.23 90 3,500 22 22 470 1192 1,866 1,634 3,555 0471 3.23 61 3,000 48 48 471 1190 3,254 0 5,248 0472 3.23 63 3,000 53 34 435 1190 5,599 0 5,662 0473 3.23 68 3,000 54 54 473 1174 3,346 0 5,670 0474 3.23 69 3,000 56 56 474 1175 3,893 0 5,915 0475 3.23 78 3,000 56 56 475 1166 2,837 163 5,094 0476 3.23 65 1,000 63 37 435 1149 4,164 0 5,545 0477 3.23 62 1,000 61 61 477 1150 3,294 0 5,156 0478 3.23 62 1,000 59 59 478 1750 2,397 0 4,797 0479 3.23 67 1,000 61 61 479 1148 1,882 0 3,047 0480 3.23 73 1,000 68 62 929 1159 1,834 0 3,807 0481 3.23 69 1,000 67 67 481 1151 3,117 0 4,774 0482 3.23 70 1,000 61 61 482 1156 1,743 0 2,444 0483 3.23 68 1,000 64 64 483 1157 2,932 0 4,192 0484 3.23 78 1,000 69 69 484 1161 1,370 0 2,771 0485 3.23 77 1,000 68 68 485 1160 1,216 0 2,755 0486 3.23 79 1,000 77 72 812 1415 3,170 0 7,068 0487 3.23 88 3,500 72 37 435 1853 5,058 0 6,720 0488 3.23 94 3,500 57 37 435 1840 3,168 332 5,123 0489 3.23 86 2,000 72 37 435 1240 3,218 0 4,813 0490 3.23 94 3,500 79 37 435 1234 5,293 0 7,113 0491 3.23 97 1,000 94 37 435 1234 5,471 0 7,933 0492 3.23 101 2,000 94 37 435 1446 5,725 0 8,506 0493 3.23 99 1,000 96 37 435 1237 3,824 0 7,288 0494 3.23 97 1,000 94 37 435 1237 4,646 0 7,849 0495 3.23 100 2,000 88 37 435 1238 2,916 0 6,278 0496 3.23 100 2,000 89 37 435 1239 3,743 0 6,402 0
Page 31 of 48

City of Oak Harbor 2033 Maximum Day DemandWater System Plan Fire Flow ScenarioNovember 2013 Improved System w/ CIPs
Node ID
StaticDemand
(gpm)
StaticPressure
(psi)
Min. Fire FlowRequirement
(gpm)
ResidualPressure atRequired FF
(psi)
Min. SystemPressure atRequired FF
(psi)CriticalNode
CriticalPipe
Available Floww/ VelocityLimitations
(gpm)
FF Deficiencybased on
Velocity (gpm)
Available Floww/ PressureLimitations
(gpm)
FF Deficiencybased on
Pressure (gpm)497 3.23 94 2,000 74 37 435 1399 2,763 0 4,053 0498 3.23 88 2,000 66 37 435 1410 2,364 0 3,847 0499 3.23 84 2,000 65 37 435 1243 1,875 125 3,971 0500 3.23 77 2,000 61 37 435 1244 2,253 0 4,174 0501 3.23 58 1,000 51 37 435 1259 3,099 0 3,405 0502 3.23 74 3,500 50 37 435 1244 4,330 0 5,736 0503 3.23 54 2,000 28 28 503 1254 1,431 569 2,347 0504 3.23 61 1,000 52 37 435 1252 1,322 0 2,635 0505 3.23 64 1,000 58 37 435 1251 2,873 0 3,943 0507 3.23 75 1,000 72 37 435 1381 3,805 0 5,505 0508 3.23 52 1,000 47 37 435 1745 2,765 0 3,107 0509 3.23 74 2,000 40 37 435 1247 1,702 298 2,640 0510 3.23 81 3,500 61 37 435 1266 5,172 0 6,542 0511 3.23 67 1,000 62 37 435 1262 3,753 0 3,923 0512 3.23 70 3,250 39 28 514 1249 4,031 0 3,822 0513 3.23 68 1,000 62 37 435 1251 4,118 0 3,859 0514 3.23 55 1,000 50 37 435 3,459 0 3,459 0515 3.23 57 1,000 51 37 435 3,573 0 3,573 0516 3.23 58 1,000 50 37 435 1260 1,984 0 2,919 0517 3.23 70 1,000 65 37 435 1268 2,856 0 4,100 0518 3.23 83 3,500 65 37 435 1267 5,564 0 6,523 0519 3.23 83 3,500 67 37 435 1275 6,806 0 6,400 0520 3.23 83 3,500 66 37 435 1277 5,146 0 6,448 0521 3.23 78 1,000 50 37 435 1383 1,009 0 1,530 0522 3.23 65 1,000 56 37 435 1283 1,391 0 2,691 0523 3.23 66 1,000 55 37 435 1282 1,479 0 2,251 0524 3.23 70 1,000 58 37 435 1280 1,894 0 2,379 0525 3.23 70 1,000 59 37 435 1269 1,664 0 2,388 0526 3.23 78 1,000 74 37 435 1273 4,331 0 4,941 0527 3.23 78 1,000 74 37 435 1274 4,124 0 4,977 0528 3.23 77 1,000 74 37 435 1377 4,088 0 5,450 0529 3.23 78 1,000 75 37 435 1300 5,850 0 6,405 0530 3.23 74 1,000 71 37 435 5,178 0 5,178 0531 3.23 78 1,000 76 37 435 1301 5,693 0 6,445 0532 3.23 86 3,500 69 37 435 1309 6,988 0 6,144 0533 3.23 63 1,000 58 37 435 1294 3,076 0 3,705 0534 3.23 75 1,000 71 37 435 5,000 0 5,000 0535 3.23 73 1,000 68 37 435 1306 2,468 0 4,075 0536 3.23 63 1,000 58 37 435 1295 2,669 0 3,541 0537 3.23 63 1,000 58 37 435 1293 3,224 0 4,001 0538 3.23 84 3,500 68 37 435 1276 6,941 0 6,082 0539 3.23 85 3,500 69 37 435 1290 6,684 0 6,125 0540 3.23 79 3,500 35 35 540 1291 1,716 1,784 4,089 0541 3.23 76 1,000 52 37 435 1292 1,371 0 1,618 0542 3.23 64 1,000 45 37 435 1296 1,141 0 1,649 0543 3.23 96 1,000 94 37 435 1312 6,241 0 7,815 0544 3.23 63 1,000 36 36 544 1,293 0 1,292 0545 3.23 90 1,000 87 37 435 285 4,595 0 5,832 0546 3.23 81 1,000 78 37 435 938 2,885 0 5,474 0547 3.23 83 1,000 80 37 435 1317 3,601 0 5,632 0548 3.23 75 1,000 69 37 435 1365 2,182 0 3,298 0549 3.23 71 1,000 66 37 435 1315 2,294 0 3,516 0550 3.23 70 1,000 66 37 435 1314 3,678 0 4,316 0551 3.23 70 3,500 50 26 581 1310 5,302 0 4,006 0552 3.23 94 3,500 76 37 435 1322 5,937 0 6,694 0554 3.23 81 3,500 61 37 435 1338 6,999 0 6,151 0555 3.23 87 3,500 68 37 435 7,872 0 6,641 0556 3.23 87 3,500 68 37 435 1325 6,994 0 6,410 0557 3.23 81 3,500 59 37 435 1948 2,681 819 6,208 0558 3.23 83 3,500 55 37 435 1328 2,200 1,300 5,694 0559 3.23 85 3,500 50 37 435 1329 2,484 1,016 5,062 0560 3.23 81 3,500 44 37 435 1332 2,557 943 4,711 0561 3.23 81 3,500 68 37 435 1426 7,676 0 7,810 0562 3.23 76 3,500 50 37 435 1333 2,438 1,062 5,299 0563 3.23 72 3,500 27 27 563 1334 2,448 1,052 3,814 0564 3.23 76 3,500 17 17 565 1335 1,563 1,937 3,414 86565 3.23 76 3,500 3 3 565 3,008 492 3,008 492566 3.23 81 3,500 62 37 577 1948 6,281 0 5,932 0567 3.23 76 3,500 34 34 567 1339 1,567 1,933 4,107 0568 3.23 72 3,500 51 32 577 1342 4,942 0 4,690 0569 3.23 91 3,500 64 37 577 1818 2,497 1,003 5,793 0570 3.23 85 3,500 66 37 435 1819 4,781 0 6,115 0571 3.23 72 3,500 51 34 577 1344 3,556 0 4,990 0572 3.23 72 3,500 51 32 577 1342 2,669 831 4,751 0573 3.23 72 3,500 52 33 577 6,491 0 4,906 0574 3.23 85 3,500 58 34 577 1346 4,240 0 4,981 0575 3.23 72 3,500 47 28 577 1347 4,500 0 4,089 0576 3.23 72 3,500 40 20 577 1349 3,519 0 3,511 0577 3.23 52 3,500 -80 -80 577 191 1,567 1,933 1,583 1,917578 3.23 61 3,500 41 26 581 5,026 0 4,039 0579 3.23 54 3,500 22 18 583 1353 2,278 1,222 3,372 128580 3.23 48 3,500 11 8 581 1356 2,756 744 2,895 605581 3.23 45 3,500 -33 -33 581 1355 1,567 1,933 1,943 1,557
Page 32 of 48

City of Oak Harbor 2033 Maximum Day DemandWater System Plan Fire Flow ScenarioNovember 2013 Improved System w/ CIPs
Node ID
StaticDemand
(gpm)
StaticPressure
(psi)
Min. Fire FlowRequirement
(gpm)
ResidualPressure atRequired FF
(psi)
Min. SystemPressure atRequired FF
(psi)CriticalNode
CriticalPipe
Available Floww/ VelocityLimitations
(gpm)
FF Deficiencybased on
Velocity (gpm)
Available Floww/ PressureLimitations
(gpm)
FF Deficiencybased on
Pressure (gpm)582 3.23 56 3,500 28 20 581 1755 2,108 1,392 3,522 0583 3.23 50 3,500 -4 -4 583 1357 1,567 1,933 2,573 927584 3.23 84 3,000 74 37 435 261 8,629 0 8,067 0585 3.23 67 3,500 32 26 581 1358 1,567 1,933 4,006 0586 3.23 84 3,000 73 37 435 1359 4,950 0 7,806 0587 3.23 85 1,000 83 37 435 1362 7,002 0 7,700 0589 3.23 78 1,000 72 37 435 1364 1,475 0 3,396 0591 3.23 73 1,000 69 37 435 1306 3,243 0 4,462 0592 3.23 72 1,000 64 37 435 1369 1,567 0 2,793 0593 3.23 70 1,000 66 37 435 1367 2,755 0 4,138 0595 3.23 94 2,000 82 37 435 1371 2,836 0 5,770 0597 3.23 78 1,000 64 37 435 1373 878 122 2,144 0598 3.23 74 3,500 55 37 435 1374 4,925 0 6,623 0599 3.23 89 3,500 62 37 435 1760 3,518 0 5,424 0600 3.23 89 3,500 57 37 435 1760 3,518 0 4,931 0601 3.23 89 3,500 43 37 435 1376 1,567 1,933 4,378 0602 3.23 74 3,500 -15 -15 602 1799 1,563 1,937 2,666 834603 3.23 77 1,000 74 37 435 1377 3,507 0 5,399 0604 3.23 76 1,000 73 37 435 1379 5,942 0 6,014 0605 3.23 71 1,000 60 37 435 1382 1,886 0 2,399 0606 3.23 75 1,000 70 37 435 1385 1,389 0 3,836 0607 3.23 76 1,000 72 37 435 1387 4,596 0 5,248 0608 3.23 80 2,500 47 37 435 1389 2,459 41 4,039 0611 3.23 60 1,000 49 37 435 1252 1,321 0 2,185 0613 3.23 60 1,000 43 37 435 1252 1,321 0 1,715 0614 3.23 68 1,000 60 60 614 1397 1,563 0 2,686 0615 3.23 97 2,000 79 37 435 1400 2,467 0 4,623 0616 3.23 91 2,000 44 37 435 1401 1,067 933 2,515 0617 3.23 92 3,500 23 23 617 1406 2,001 1,499 3,581 0618 3.23 84 2,000 63 37 435 3,809 0 3,809 0619 3.23 91 3,500 28 28 619 1407 3,486 14 3,736 0620 3.23 88 1,000 79 37 435 1409 1,567 0 3,141 0621 3.23 75 2,000 52 37 435 1411 1,532 468 3,261 0622 3.23 95 3,500 64 37 435 1412 2,614 886 5,787 0623 3.23 95 3,500 55 37 435 1414 3,525 0 4,917 0624 3.23 79 1,000 78 72 812 1422 3,136 0 7,035 0625 3.23 81 3,500 70 70 625 1421 3,636 0 7,345 0626 3.23 81 1,000 80 72 812 41 5,156 0 7,981 0627 3.23 85 3,500 75 37 435 207 6,164 0 9,131 0628 3.23 89 3,500 75 37 435 1427 3,113 387 7,123 0629 3.23 83 3,500 47 37 435 1429 1,567 1,933 4,665 0630 3.23 87 3,500 77 37 435 1428 5,758 0 6,289 0631 3.23 87 1,000 85 37 435 1431 5,968 0 6,045 0632 3.23 93 1,000 91 37 435 1432 3,141 0 6,096 0633 3.23 100 1,000 97 37 435 1433 3,473 0 6,123 0634 3.23 106 1,000 100 37 435 1434 1,567 0 4,293 0635 3.23 102 1,000 99 37 435 165 2,683 0 6,241 0636 3.23 89 3,000 79 37 435 1436 5,416 0 6,368 0637 3.23 102 1,000 95 37 435 1439 1,567 0 4,100 0638 3.23 87 3,000 77 37 435 1440 5,635 0 6,088 0639 3.23 89 1,000 86 37 435 1442 2,543 0 6,199 0640 3.23 71 3,000 32 32 640 1444 1,567 1,433 3,499 0641 3.23 78 3,000 62 37 435 1443 3,571 0 4,982 0642 3.23 101 1,000 99 37 435 1445 4,615 0 8,002 0643 3.23 93 3,500 77 37 435 1447 5,548 0 7,712 0644 3.23 95 1,000 91 37 435 1448 3,034 0 6,181 0645 3.23 97 1,000 94 37 435 1453 3,414 0 6,791 0646 3.23 101 1,000 97 37 435 1450 2,899 0 5,611 0647 3.23 97 1,000 94 37 435 1452 2,237 0 7,295 0648 3.23 95 1,000 91 37 435 1455 3,065 0 5,531 0649 3.23 95 2,000 83 37 435 1462 2,549 0 5,783 0650 3.23 93 3,000 80 37 435 1457 4,703 0 8,072 0651 3.23 95 3,000 45 37 435 1458 1,567 1,433 3,761 0652 3.23 95 3,500 65 37 435 1461 2,457 1,043 5,893 0653 3.23 97 3,500 75 37 435 1459 3,182 318 7,093 0654 3.23 101 3,000 88 37 435 1463 5,369 0 8,597 0655 3.23 91 2,000 82 37 435 1587 3,403 0 7,050 0656 3.23 91 1,000 87 37 435 1465 2,811 0 5,606 0657 3.23 108 3,500 70 63 658 1468 2,359 1,141 5,316 0658 3.23 101 3,500 38 38 658 1470 1,567 1,933 4,016 0659 3.23 63 1,000 36 36 659 1471 881 119 1,296 0660 3.23 81 1,000 78 76 661 1473 2,968 0 5,523 0661 3.23 79 1,000 73 73 661 1474 1,567 0 3,629 0662 3.23 87 3,500 41 41 662 1475 1,567 1,933 4,272 0663 3.23 76 1,000 73 37 435 1476 3,115 0 4,274 0664 3.23 78 2,000 67 37 435 1478 2,092 0 4,055 0665 3.23 74 2,000 61 37 435 1479 2,470 0 3,832 0666 3.23 76 2,000 60 37 435 1480 2,512 0 3,569 0667 3.23 69 2,000 52 37 435 1482 3,542 0 3,471 0668 3.23 66 2,000 49 37 435 1482 3,360 0 3,308 0669 3.23 65 2,000 49 37 435 1484 2,662 0 3,324 0670 3.23 59 2,000 43 37 435 1485 2,432 0 3,361 0671 3.23 56 2,000 43 37 435 1486 3,167 0 3,533 0
Page 33 of 48

City of Oak Harbor 2033 Maximum Day DemandWater System Plan Fire Flow ScenarioNovember 2013 Improved System w/ CIPs
Node ID
StaticDemand
(gpm)
StaticPressure
(psi)
Min. Fire FlowRequirement
(gpm)
ResidualPressure atRequired FF
(psi)
Min. SystemPressure atRequired FF
(psi)CriticalNode
CriticalPipe
Available Floww/ VelocityLimitations
(gpm)
FF Deficiencybased on
Velocity (gpm)
Available Floww/ PressureLimitations
(gpm)
FF Deficiencybased on
Pressure (gpm)672 3.23 52 2,000 39 37 435 1489 2,744 0 3,348 0673 3.23 50 1,000 46 37 435 3,358 0 3,358 0674 3.23 71 2,000 50 37 435 1491 3,108 0 3,314 0675 3.23 59 2,000 38 37 435 2,813 0 2,813 0676 3.23 69 1,000 68 37 435 1498 5,164 0 6,582 0677 3.23 69 2,000 60 37 435 1496 3,131 0 5,131 0678 3.23 67 1,000 66 37 435 1497 6,006 0 6,599 0679 3.23 63 1,000 61 37 435 1499 4,625 0 5,981 0680 3.23 61 1,000 58 37 435 1775 3,076 0 4,721 0681 3.23 63 1,000 61 37 435 1500 4,138 0 5,929 0682 3.23 63 1,000 61 37 435 1502 4,480 0 5,922 0683 3.23 63 1,000 61 37 435 1794 4,509 0 5,904 0684 3.23 59 1,000 56 37 435 1783 2,928 0 4,584 0685 3.23 59 1,000 56 37 435 1784 3,059 0 4,563 0686 3.23 59 1,000 56 37 435 1787 2,994 0 4,567 0687 3.23 63 2,000 55 37 435 1816 3,364 0 5,256 0688 3.23 89 2,000 86 37 435 1503 4,400 0 9,928 0689 3.23 111 2,000 106 37 435 1505 2,283 0 8,916 0690 3.23 87 2,000 81 37 435 1507 3,739 0 7,842 0691 3.23 85 2,000 82 37 435 1506 4,760 0 9,804 0692 3.23 93 2,000 85 37 435 1509 3,118 0 6,636 0693 3.23 85 2,000 44 37 435 1512 881 1,119 2,580 0694 3.23 89 2,000 82 37 435 1510 2,875 0 7,248 0695 3.23 82 2,000 78 37 435 1514 4,086 0 8,856 0696 3.23 82 2,000 74 37 435 1515 1,567 433 6,325 0697 3.23 84 1,000 82 37 435 1516 2,614 0 6,184 0698 3.23 62 1,000 54 37 435 2,879 0 2,879 0699 3.23 64 1,000 57 37 435 1521 2,630 0 3,032 0700 3.23 75 1,000 68 37 435 1530 3,544 0 3,818 0701 3.23 56 1,000 50 37 435 3,724 0 3,564 0702 3.23 73 1,000 66 37 435 1528 3,493 0 3,877 0703 3.23 77 1,000 70 37 435 1531 3,089 0 3,875 0704 3.23 82 1,000 73 37 435 1716 2,637 0 3,687 0705 3.23 79 1,000 72 37 435 1533 2,796 0 3,813 0706 3.23 71 1,000 64 37 435 1534 3,775 0 3,635 0707 3.23 71 1,000 64 37 435 1536 3,170 0 3,909 0708 3.23 71 1,000 64 37 435 1602 4,028 0 3,902 0709 3.23 71 1,000 64 37 435 1537 3,350 0 3,880 0710 3.23 71 1,000 64 37 435 1946 3,805 0 3,874 0711 3.23 71 1,000 64 37 435 1541 3,728 0 3,873 0712 3.23 68 1,000 62 37 435 1541 4,626 0 3,834 0713 3.23 66 1,000 60 37 435 1547 3,205 0 3,841 0714 3.23 71 1,000 64 37 435 1945 3,352 0 3,868 0715 3.23 66 1,000 59 37 435 1602 3,040 0 3,878 0716 3.23 64 1,000 57 37 435 3,952 0 3,871 0717 3.23 71 1,000 64 37 435 1946 3,794 0 3,873 0718 0 58 1,000 52 37 435 4,004 0 3,826 0719 3.23 64 1,000 64 37 435 243 3,793 0 3,612 0720 3.23 64 1,000 64 37 435 4,561 0 3,593 0721 3.23 62 1,000 61 37 435 4,195 0 3,585 0722 3.23 66 1,000 65 37 435 1554 2,525 0 3,553 0723 3.23 75 1,000 73 37 435 1555 2,291 0 3,553 0724 3.23 64 1,000 63 37 435 3,997 0 3,493 0725 3.23 66 1,000 65 37 435 1558 3,503 0 3,543 0726 3.23 73 1,000 72 37 435 1561 2,547 0 3,555 0727 3.23 71 1,000 48 37 435 1564 881 119 1,598 0728 3.23 71 1,000 44 37 435 1565 881 119 1,456 0729 3.23 53 1,000 45 37 730 2,506 0 2,080 0730 3.23 44 1,000 33 33 730 1570 1,567 0 1,702 0731 3.23 52 1,000 45 36 732 2,332 0 1,955 0732 3.23 44 1,000 33 33 732 1573 1,567 0 1,635 0733 3.23 62 1,000 62 40 732 103 3,597 0 5,710 0734 3.23 69 1,000 62 37 435 1575 3,092 0 4,063 0735 3.23 67 1,000 63 37 435 1579 1,504 0 5,244 0736 3.23 80 1,000 76 37 435 1582 4,342 0 6,111 0737 3.23 82 2,000 72 37 435 1583 2,920 0 5,949 0738 3.23 84 2,000 74 37 435 1585 2,857 0 6,004 0739 3.23 86 2,000 77 37 435 1586 4,185 0 6,814 0740 3.23 88 2,000 80 37 435 1587 3,677 0 6,985 0741 3.23 84 2,000 72 37 435 1591 2,760 0 5,502 0742 3.23 84 1,000 79 37 435 1592 2,606 0 5,009 0743 3.23 84 1,000 77 37 435 1594 1,824 0 3,328 0744 3.23 80 1,000 77 37 435 1596 2,906 0 5,421 0745 3.23 67 1,000 64 37 435 1599 3,958 0 4,332 0746 3.23 63 1,000 56 37 435 1601 1,590 0 2,887 0747 3.23 64 1,000 57 37 435 3,901 0 3,896 0748 3.23 73 1,000 66 37 435 1605 3,121 0 3,898 0749 3.23 71 1,000 63 37 435 1608 2,838 0 3,290 0750 3.23 71 1,000 63 37 435 1610 2,711 0 3,884 0751 3.23 73 1,000 65 37 435 1611 2,230 0 3,437 0752 3.23 79 1,000 70 37 435 1614 2,960 0 3,279 0753 3.23 70 3,000 41 29 754 1615 2,706 294 3,495 0754 3.23 57 1,000 52 52 754 3,210 0 3,210 0
Page 34 of 48

City of Oak Harbor 2033 Maximum Day DemandWater System Plan Fire Flow ScenarioNovember 2013 Improved System w/ CIPs
Node ID
StaticDemand
(gpm)
StaticPressure
(psi)
Min. Fire FlowRequirement
(gpm)
ResidualPressure atRequired FF
(psi)
Min. SystemPressure atRequired FF
(psi)CriticalNode
CriticalPipe
Available Floww/ VelocityLimitations
(gpm)
FF Deficiencybased on
Velocity (gpm)
Available Floww/ PressureLimitations
(gpm)
FF Deficiencybased on
Pressure (gpm)755 3.23 94 3,500 82 48 875 1620 5,695 0 7,242 0756 3.23 94 3,500 77 48 875 1621 2,358 1,142 7,113 0757 3.23 89 3,500 69 69 757 1623 2,867 633 6,438 0758 3.23 87 3,000 75 75 758 179 4,144 0 6,921 0759 3.23 92 3,000 74 74 759 1624 3,047 0 6,120 0760 3.23 92 3,000 75 75 760 1761 2,685 315 6,216 0761 3.23 87 3,500 68 68 761 1629 2,587 913 6,731 0762 3.23 89 3,500 77 36 732 1628 4,885 0 7,830 0763 3.23 89 3,500 75 75 763 1630 3,077 423 7,794 0764 3.23 85 3,500 53 53 764 1632 2,942 558 5,067 0765 3.23 96 3,500 50 50 765 1634 1,567 1,933 4,609 0766 3.23 92 3,000 83 47 875 1635 6,436 0 6,480 0767 3.23 122 1,000 119 37 435 1744 4,265 0 3,487 0768 3.23 94 3,000 65 29 875 1641 3,021 0 3,505 0769 3.23 103 3,000 78 29 875 1638 5,458 0 3,503 0770 3.23 90 3,000 64 29 875 1645 3,370 0 3,506 0771 3.23 88 3,000 65 29 230 5,638 0 3,542 0772 3.23 81 1,000 68 37 435 1646 881 119 2,176 0773 3.23 64 1,000 59 37 435 2,906 0 2,418 0774 3.23 86 1,000 76 37 435 2,837 0 2,837 0775 3.23 79 2,000 68 37 435 4,530 0 3,115 0776 3.23 48 2,000 23 22 395 2,093 0 2,073 0777 3.23 92 2,000 69 37 435 1654 3,525 0 3,834 0778 3.23 81 1,000 80 37 435 1656 2,294 0 3,452 0779 3.23 77 1,000 75 37 435 1657 4,067 0 3,202 0780 3.23 60 1,000 57 37 435 3,275 0 3,149 0781 3.23 55 1,000 53 37 435 3,107 0 3,107 0782 3.23 55 1,000 52 37 435 1660 2,790 0 2,827 0783 3.23 81 1,000 79 37 435 1661 3,214 0 3,165 0784 3.23 68 2,000 57 37 435 3,981 0 3,048 0785 3.23 68 1,000 65 37 435 1665 2,545 0 3,071 0786 3.23 55 1,000 52 37 435 1667 2,836 0 2,840 0787 3.23 64 1,000 61 37 435 3,383 0 3,139 0788 3.23 64 1,000 62 37 435 3,466 0 3,136 0789 3.23 66 1,000 64 37 435 1672 3,530 0 3,128 0790 3.23 73 1,000 71 37 435 4,130 0 3,129 0791 3.23 81 1,000 79 37 435 4,540 0 3,134 0792 3.23 92 1,000 89 37 435 1674 2,471 0 3,134 0793 3.23 92 1,000 89 37 435 1675 2,121 0 3,134 0794 3.23 98 1,000 94 37 435 1676 2,875 0 3,134 0795 3.23 99 1,000 94 37 435 1677 2,659 0 3,134 0796 3.23 94 1,000 90 37 435 1679 2,854 0 3,134 0797 3.23 90 1,000 87 37 435 1680 3,397 0 3,134 0798 3.23 83 1,000 80 37 435 1681 2,728 0 3,134 0799 3.23 83 1,000 81 37 435 4,620 0 3,141 0800 3.23 70 1,000 68 37 435 4,014 0 3,115 0801 3.23 77 1,000 74 37 435 1687 2,429 0 3,112 0802 3.23 73 1,000 70 37 435 3,853 0 3,108 0803 3.23 68 1,000 66 37 435 3,897 0 3,106 0804 3.23 51 1,000 49 37 435 3,032 0 2,987 0805 3.23 51 1,000 48 37 435 1693 2,445 0 2,668 0806 3.23 56 1,000 50 37 435 2,257 0 2,257 0808 3.23 73 1,000 55 37 435 1701 1,321 0 1,715 0809 3.23 88 1,000 72 37 435 1419 1,567 0 2,248 0810 3.23 70 1,000 60 60 810 1398 1,567 0 2,413 0811 3.23 97 1,000 89 37 435 1707 1,567 0 3,643 0812 3.23 73 2,000 36 36 812 1416 1,567 433 2,430 0813 3.23 76 3,250 72 72 813 1713 2,127 1,123 7,830 0815 3.23 81 1,000 69 37 435 1950 1,663 0 2,467 0816 3.23 104 1,000 73 52 247 1566 881 119 1,640 0817 3.23 52 1,000 37 37 817 949 1,567 0 1,613 0818 3.23 54 1,000 49 37 435 1743 2,293 0 3,874 0819 3.23 56 1,000 50 37 435 249 2,785 0 3,558 0820 3.23 71 1,000 64 37 435 1947 2,359 0 3,728 0833 3.23 80 3,500 -31 -31 833 1735 2,448 1,052 2,502 998836 3.23 78 2,000 54 37 435 1746 3,827 0 4,282 0837 3.23 72 2,000 62 37 435 1749 2,557 0 5,161 0838 3.23 59 2,000 54 54 838 1751 2,120 0 5,239 0839 3.23 56 3,500 31 22 581 4,169 0 3,655 0840 3.23 74 3,500 47 37 435 1758 5,463 0 6,289 0841 3.23 89 3,500 50 37 435 1759 5,888 0 6,404 0842 3.23 92 3,000 79 48 875 1762 2,190 810 6,608 0844 3.23 63 2,000 54 37 435 1771 3,365 0 4,871 0845 3.23 53 2,000 43 37 435 1769 3,104 0 3,984 0846 3.23 53 1,000 50 37 435 1780 3,088 0 4,755 0847 3.23 63 2,000 56 37 435 1953 2,985 0 5,708 0848 3.23 94 1,000 79 37 435 1773 1,567 0 2,372 0853 3.23 63 1,000 61 37 435 6,524 0 5,849 0854 3.23 63 1,000 61 37 435 1785 5,198 0 5,809 0855 3.23 63 1,000 61 37 435 1928 4,104 0 5,886 0856 3.23 63 1,000 61 37 435 1788 5,107 0 5,821 0857 3.23 61 2,000 53 37 435 1796 2,306 0 5,127 0858 3.23 69 2,000 60 37 435 11 3,686 0 5,230 0
Page 35 of 48

City of Oak Harbor 2033 Maximum Day DemandWater System Plan Fire Flow ScenarioNovember 2013 Improved System w/ CIPs
Node ID
StaticDemand
(gpm)
StaticPressure
(psi)
Min. Fire FlowRequirement
(gpm)
ResidualPressure atRequired FF
(psi)
Min. SystemPressure atRequired FF
(psi)CriticalNode
CriticalPipe
Available Floww/ VelocityLimitations
(gpm)
FF Deficiencybased on
Velocity (gpm)
Available Floww/ PressureLimitations
(gpm)
FF Deficiencybased on
Pressure (gpm)862 3.23 74 3,500 6 6 602 1799 1,563 1,937 3,090 410863 3.23 88 1,000 76 37 435 1803 1,292 0 2,823 0864 3.23 44 1,000 39 37 435 2,049 0 2,039 0868 3.23 73 2,000 67 37 435 1815 3,126 0 6,276 0869 3.23 89 3,500 74 37 435 1817 4,901 0 6,472 0875 3.23 51 1,000 45 37 435 2,206 0 2,206 0876 0 55 1,000 45 37 435 1,879 0 2,203 0877 0 56 1,000 46 37 435 1,888 0 2,203 0878 0 54 1,000 45 37 435 1828 1,567 0 2,203 0879 0 55 1,000 46 37 435 1,921 0 2,203 0880 3.23 94 3,500 78 37 435 1852 4,448 0 6,968 0885 3.23 93 3,500 71 37 435 1838 1,966 1,534 6,899 0887 3.23 94 3,500 62 37 435 1849 2,375 1,125 5,678 0888 3.23 94 3,500 59 37 435 1843 2,645 855 5,306 0889 3.23 86 1,000 79 37 435 3,099 0 2,690 0890 3.23 86 1,000 66 37 435 1888 881 119 1,875 0896 3.23 86 1,000 76 37 435 2,744 0 2,744 0900 3.23 84 1,000 79 37 435 368 2,788 0 4,744 0901 3.23 81 2,000 69 37 435 370 1,563 437 5,127 0903 3.23 82 2,000 61 37 435 371 1,567 433 3,638 0919 3.23 53 1,000 31 31 919 372 881 119 1,271 0920 3.23 73 1,000 70 37 435 373 2,646 0 3,553 0923 3.23 80 1,000 69 37 435 376 881 119 2,486 0924 3.23 86 3,500 26 26 924 983 3,077 423 3,715 0925 3.23 91 3,500 62 37 435 378 2,416 1,084 5,806 0926 3.23 83 3,500 2 2 926 379 1,567 1,933 3,060 440927 3.23 87 3,500 56 37 435 380 2,906 594 5,572 0928 3.23 87 3,500 4 4 928 381 1,567 1,933 3,124 376929 3.23 66 1,000 54 54 929 382 1,241 0 2,101 0930 3.23 77 1,000 71 37 435 2,936 0 2,936 0931 3.23 105 3,000 55 29 875 384 1,567 1,433 3,487 0932 3.23 79 2,000 54 37 435 385 1,567 433 3,045 0933 3.23 68 2,000 57 37 435 3,891 0 2,991 0934 3.23 92 3,000 50 50 934 387 1,613 1,387 4,049 0935 3.23 60 1,000 58 37 435 3,416 0 3,051 0936 3.23 60 1,000 52 37 435 391 1,567 0 2,163 0937 3.23 84 1,000 67 37 435 1921 3,326 0 3,772 0
Page 36 of 48

City of Oak Harbor 2013 Peak Hour DemandWater System Plan Existing SystemNovember 2013
IDDemand
(gpm)Elevation
(ft) Head (ft)Pressure
(psi) IDDemand
(gpm)Elevation
(ft) Head (ft)Pressure
(psi) IDDemand
(gpm)Elevation
(ft) Head (ft)Pressure
(psi)10 3.98 109 296 81 238 3.98 185 298 49 327 3.98 93 297 8812 3.98 124 296 75 239 3.98 182 298 51 328 3.98 90 297 9014 3.98 139 296 68 240 3.98 237 395 69 329 3.98 120 297 7716 3.98 92 296 88 241 3.98 194 395 87 330 3.98 119 297 7718 3.98 49 247 86 242 3.98 184 395 92 331 3.98 97 297 8720 3.98 46 246 87 243 3.98 136 297 70 332 3.98 88 297 9122 3.98 49 246 86 244 3.98 189 297 47 333 3.98 120 297 7724 3.98 49 246 86 245 3.98 194 297 45 334 3.98 149 297 6426 3.98 49 247 86 246 3.98 29 246 94 335 3.98 125 297 7428 3.98 164 296 57 247 3.98 121 296 76 336 3.98 142 297 6730 3.98 174 296 53 248 3.98 145 296 65 337 3.98 161 297 5932 3.98 184 296 48 249 3.98 181 296 50 338 3.98 158 297 6034 3.98 158 296 60 250 3.98 180 298 51 339 3.98 149 297 6436 3.98 160 296 59 251 3.98 107 297 83 340 3.98 71 296 9738 3.98 161 296 58 252 3.98 138 300 70 341 3.98 206 396 8240 3.98 149 296 64 253 3.98 121 300 77 342 3.98 219 396 7742 3.98 154 296 61 254 3.98 180 298 51 343 3.98 234 396 7044 3.98 149 296 64 255 3.98 182 298 50 344 3.98 226 396 7346 3.98 144 296 66 256 3.98 192 298 46 345 3.98 233 396 7048 3.98 149 296 64 257 3.98 193 298 46 346 3.98 214 395 7950 3.98 127 296 73 258 3.98 211 298 38 347 3.98 229 395 7252 3.98 133 296 70 259 3.98 199 298 43 348 3.98 212 395 8054 3.98 52 246 84 260 3.98 187 298 48 349 3.98 216 395 7856 3.98 59 246 81 261 3.98 182 298 50 350 3.98 179 396 9458 3.98 195 298 45 262 3.98 163 298 59 351 3.98 244 396 6660 3.98 192 298 46 263 3.98 161 298 59 352 3.98 241 395 6762 3.98 189 298 47 264 3.98 172 298 55 353 3.98 232 395 7164 3.98 189 298 47 265 3.98 184 298 49 354 3.98 186 296 4866 3.98 185 298 49 266 3.98 201 298 42 355 3.98 192 296 4568 3.98 187 298 48 267 3.98 199 298 43 356 3.98 189 296 4670 3.98 134 298 71 268 3.98 206 298 40 357 3.98 182 296 4972 3.98 161 298 59 269 3.98 209 298 39 358 3.98 181 296 5074 3.98 163 298 59 270 3.98 205 298 41 359 3.98 191 296 4576 3.98 9 246 103 271 3.98 143 298 67 360 3.98 144 296 6678 3.98 204 296 40 272 3.98 145 298 66 361 3.98 141 296 6780 3.98 194 296 44 273 3.98 143 298 67 362 3.98 136 296 6982 3.98 184 296 48 274 3.98 110 298 82 363 3.98 172 296 5484 3.98 174 296 53 275 3.98 108 298 82 364 3.98 172 296 5486 3.98 174 296 53 276 3.98 103 298 84 365 3.98 117 322 8988 3.98 79 298 95 277 3.98 78 297 95 366 3.98 164 296 5790 3.98 79 298 95 278 3.98 79 297 94 367 3.98 180 296 5092 3.98 39 246 90 279 3.98 96 297 87 368 3.98 168 296 5594 3.98 144 296 66 280 3.98 158 298 60 369 3.98 161 296 5996 3.98 154 296 61 281 3.98 176 298 53 370 3.98 134 296 7098 3.98 91 297 89 282 3.98 159 298 60 371 3.98 42 246 89100 3.98 94 297 88 283 3.98 151 298 64 372 3.98 50 246 85102 3.98 177 318 61 284 3.98 166 298 57 373 3.98 45 246 87104 3.98 136 297 70 285 3.98 180 298 51 374 3.98 10 246 102106 3.98 176 297 52 286 3.98 179 298 51 375 3.98 92 246 67108 3.98 159 297 60 287 3.98 178 298 52 376 3.98 149 297 64110 3.98 99 297 86 288 3.98 175 298 53 377 3.98 191 297 46112 3.98 209 297 38 289 3.98 166 298 57 378 3.98 178 297 52114 3.98 169 298 56 290 3.98 175 298 53 379 3.98 71 246 76116 3.98 12 246 101 291 3.98 132 297 72 380 3.98 170 296 55122 3.98 137 298 70 292 3.98 149 297 64 381 3.98 205 296 40126 3.98 116 297 79 293 3.98 87 297 91 382 3.98 210 296 37128 3.98 149 297 64 294 3.98 124 297 75 383 3.98 185 296 48134 3.98 153 297 62 295 3.98 109 297 81 384 3.98 165 297 57136 3.98 151 297 63 296 3.98 94 297 88 386 3.98 151 296 63138 3.98 152 297 63 297 3.98 121 297 76 387 3.98 146 296 65140 3.98 152 297 63 298 3.98 153 297 63 388 3.98 201 296 41142 3.98 145 297 66 299 3.98 179 298 52 389 3.98 210 297 38144 3.98 136 297 70 300 3.98 204 299 41 390 3.98 211 296 37146 3.98 136 297 70 301 3.98 197 299 44 391 3.98 195 296 44148 3.98 136 297 70 302 3.98 189 299 47 392 3.98 189 296 46150 3.98 143 297 67 303 3.98 171 298 55 393 3.98 162 296 58152 3.98 137 297 69 304 3.98 164 299 58 394 3.98 184 296 49154 3.98 142 297 67 305 3.98 171 299 55 395 3.98 194 296 44170 3.98 154 299 63 306 3.98 196 299 45 396 3.98 179 296 51215 3.98 40 296 111 307 3.98 179 298 51 397 3.98 189 296 46216 3.98 189 298 47 308 3.98 154 298 62 398 3.98 169 296 55217 3.98 139 298 69 309 3.98 144 297 66 399 3.98 159 296 59218 3.98 219 396 77 310 3.98 162 297 58 400 3.98 171 296 54219 3.98 79 296 94 315 3.98 194 297 44 401 3.98 164 296 57220 3.98 70 296 98 316 3.98 172 297 54 402 3.98 179 296 51221 3.98 49 247 86 317 3.98 196 297 44 403 3.98 161 296 58222 3.98 100 297 85 318 3.98 192 297 46 404 3.98 162 296 58228 3.98 129 298 73 319 3.98 165 297 57 405 3.98 71 247 76229 3.98 156 296 61 320 3.98 57 297 104 406 3.98 109 296 81230 3.98 209 296 38 321 3.98 60 297 103 407 3.98 114 296 79232 3.98 136 323 81 322 3.98 86 297 91 408 3.98 120 296 76233 3.98 224 396 74 323 3.98 122 297 76 409 3.98 91 246 67235 3.98 220 395 76 324 3.98 108 297 82 410 3.98 48 246 86236 3.98 214 395 79 325 3.98 104 297 84 411 3.98 80 246 72237 3.98 209 298 39 326 3.98 122 297 76 412 3.98 88 246 69
Page 37 of 48

City of Oak Harbor 2013 Peak Hour DemandWater System Plan Existing SystemNovember 2013
IDDemand
(gpm)Elevation
(ft) Head (ft)Pressure
(psi) IDDemand
(gpm)Elevation
(ft) Head (ft)Pressure
(psi) IDDemand
(gpm)Elevation
(ft) Head (ft)Pressure
(psi)413 3.98 109 246 60 498 3.98 95 297 88 585 3.98 144 298 67414 3.98 89 246 68 499 3.98 103 297 84 586 3.98 176 297 53415 3.98 86 246 69 500 3.98 120 297 77 587 3.98 174 297 53416 3.98 56 246 82 501 3.98 165 297 57 589 3.98 189 297 47417 3.98 49 246 86 502 3.98 127 297 74 590 3.98 189 297 47418 3.98 47 247 87 503 3.98 173 297 54 591 3.98 201 297 42419 3.98 44 246 88 504 3.98 158 297 60 592 3.98 204 297 40420 3.98 40 246 89 505 3.98 150 297 64 593 3.98 209 297 38421 3.98 40 246 89 507 3.98 196 297 44 594 3.98 184 297 49422 3.98 36 246 91 508 3.98 177 297 52 595 3.98 154 297 62423 3.98 11 246 102 509 3.98 128 297 73 596 3.98 189 297 47424 3.98 9 246 103 510 3.98 112 297 80 597 3.98 189 297 47425 3.98 10 246 102 511 3.98 143 297 67 598 3.98 199 297 43426 3.98 14 246 101 512 3.98 137 297 69 599 3.98 164 297 58427 3.98 27 246 95 513 3.98 142 297 67 600 3.98 165 297 57428 3.98 15 246 100 514 3.98 170 297 55 601 3.98 164 297 58429 3.98 100 246 63 515 3.98 166 297 57 602 3.98 199 297 43430 3.98 107 246 60 516 3.98 165 297 57 603 3.98 191 297 46431 3.98 110 246 59 517 3.98 136 297 70 604 3.98 194 297 45432 3.98 115 246 57 518 3.98 107 297 82 605 3.98 134 297 71433 3.98 131 246 50 519 3.98 106 297 83 606 3.98 197 297 43434 3.98 138 246 47 520 3.98 107 297 82 607 3.98 194 297 45435 3.98 149 246 42 521 3.98 119 297 77 608 3.98 184 297 49436 3.98 84 246 70 522 3.98 149 297 64 611 3.98 159 297 60437 3.98 77 246 73 523 3.98 145 297 66 612 3.98 154 297 62438 3.98 95 246 65 524 3.98 137 297 69 613 3.98 159 297 60439 3.98 96 246 65 525 3.98 136 297 70 614 3.98 79 246 73440 3.98 103 246 62 526 3.98 190 297 46 615 3.98 74 297 97441 3.98 124 246 53 527 3.98 189 297 47 616 3.98 89 297 90442 3.98 139 246 46 528 3.98 191 297 46 617 3.98 86 297 91443 3.98 112 246 58 529 3.98 189 297 47 618 3.98 104 297 84444 3.98 13 246 101 530 3.98 199 297 43 619 3.98 89 297 90445 3.98 87 246 69 531 3.98 189 297 47 620 3.98 94 297 88446 3.98 28 246 95 532 3.98 100 297 85 621 3.98 124 297 75447 3.98 65 246 78 533 3.98 152 297 63 622 3.98 79 297 95448 3.98 87 246 69 534 3.98 197 297 43 623 3.98 79 297 95449 3.98 57 246 82 535 3.98 202 297 41 624 3.98 54 247 83450 3.98 34 246 92 536 3.98 152 297 63 625 3.98 49 247 86451 3.98 18 246 99 537 3.98 153 297 62 626 3.98 49 247 86452 3.98 16 246 100 538 3.98 103 297 84 627 3.98 124 323 86453 3.98 11 246 102 539 3.98 101 297 85 628 3.98 114 323 91454 3.98 12 246 101 540 3.98 115 297 79 629 3.98 109 299 82455 3.98 26 246 95 541 3.98 123 297 75 630 3.98 99 299 87456 3.98 12 246 101 542 3.98 151 297 63 631 3.98 99 299 87457 3.98 29 246 94 543 3.98 149 297 64 632 3.98 84 299 93458 3.98 49 246 85 544 3.98 153 297 62 633 3.98 69 299 99459 3.98 49 246 86 545 3.98 163 297 58 634 3.98 54 299 106460 3.98 47 246 86 546 3.98 182 297 50 635 3.98 64 298 102461 3.98 74 246 75 547 3.98 179 297 51 636 3.98 94 298 88462 3.98 85 246 70 548 3.98 197 297 43 637 3.98 64 298 102463 3.98 80 246 72 549 3.98 206 297 40 638 3.98 99 298 86464 3.98 49 246 86 550 3.98 209 297 38 639 3.98 94 298 88465 3.98 28 246 95 551 3.98 137 298 70 640 3.98 134 298 71466 3.98 28 246 95 552 3.98 104 322 95 641 3.98 119 298 77467 3.98 27 246 95 554 3.98 134 321 81 642 3.98 64 297 101468 3.98 61 246 80 555 3.98 119 321 88 643 3.98 84 297 92469 3.98 84 246 70 556 3.98 119 322 88 644 3.98 79 297 95470 3.98 27 246 95 557 3.98 134 321 81 645 3.98 74 297 97471 3.98 94 246 66 558 3.98 129 322 83 646 3.98 64 297 101472 3.98 90 246 68 559 3.98 124 322 86 647 3.98 74 297 97473 3.98 78 246 73 560 3.98 134 322 82 648 3.98 79 297 94474 3.98 75 246 74 561 3.98 134 323 82 649 3.98 79 297 94475 3.98 56 246 82 562 3.98 144 323 77 650 3.98 84 297 92476 3.98 85 246 70 563 3.98 154 323 73 651 3.98 79 297 94477 3.98 91 246 67 564 3.98 144 323 77 652 3.98 79 297 94478 3.98 93 246 66 565 3.98 144 323 77 653 3.98 74 297 97479 3.98 80 246 72 566 3.98 134 321 81 654 3.98 64 297 101480 3.98 68 246 78 567 3.98 144 321 77 655 3.98 89 297 90481 3.98 75 246 74 568 3.98 154 319 72 656 3.98 89 297 90482 3.98 73 246 75 569 3.98 109 319 91 657 3.98 49 296 107483 3.98 79 246 73 570 3.98 124 319 85 658 3.98 64 296 101484 3.98 56 246 82 571 3.98 154 319 72 659 3.98 89 246 68485 3.98 57 246 82 572 3.98 154 319 72 660 3.98 49 246 86486 3.98 54 247 83 573 3.98 154 319 72 661 3.98 54 246 83487 3.98 94 297 88 574 3.98 124 319 85 662 3.98 34 246 92488 3.98 82 297 93 575 3.98 154 319 71 663 3.98 124 298 75489 3.98 99 297 86 576 3.98 154 318 71 664 3.98 119 298 78490 3.98 80 297 94 577 3.98 199 318 52 665 3.98 129 298 73491 3.98 74 297 97 578 3.98 159 298 60 666 3.98 124 298 75492 3.98 65 297 101 579 3.98 174 298 54 667 3.98 141 298 68493 3.98 70 297 99 580 3.98 189 298 47 668 3.98 147 298 65494 3.98 74 297 97 581 3.98 194 298 45 669 3.98 149 298 65495 3.98 68 297 99 582 3.98 169 298 56 670 3.98 164 298 58496 3.98 67 297 100 583 3.98 184 298 49 671 3.98 169 298 56497 3.98 81 297 94 584 3.98 176 297 53 672 3.98 179 298 52
Page 38 of 48

City of Oak Harbor 2013 Peak Hour DemandWater System Plan Existing SystemNovember 2013
IDDemand
(gpm)Elevation
(ft) Head (ft)Pressure
(psi) IDDemand
(gpm)Elevation
(ft) Head (ft)Pressure
(psi) IDDemand
(gpm)Elevation
(ft) Head (ft)Pressure
(psi)673 3.98 184 298 49 758 3.98 34 246 92 857 3.98 229 382 66674 3.98 135 298 71 759 3.98 24 246 96 858 3.98 209 382 75675 3.98 164 298 58 760 3.98 24 246 96 860 3.98 229 382 66676 3.98 209 298 39 761 3.98 34 246 92 862 3.98 199 297 43677 3.98 209 298 39 762 3.98 29 246 94 863 3.98 165 297 57678 3.98 214 298 36 763 3.98 29 246 94 864 3.98 194 296 44679 3.98 224 298 32 764 3.98 39 246 90 868 3.98 200 298 42680 3.98 229 298 30 765 3.98 14 246 101 869 3.98 114 319 89681 3.98 224 298 32 766 3.98 24 247 96 875 3.98 203 296 40682 3.98 224 298 32 767 3.98 40 296 111 880 3.98 81 297 94683 3.98 224 298 32 768 3.98 104 296 83 885 3.98 83 297 93684 3.98 234 298 28 769 3.98 84 296 92 887 3.98 82 297 93685 3.98 234 298 28 770 3.98 114 296 79 888 3.98 82 297 93686 3.98 234 298 28 771 3.98 119 296 77 889 3.98 124 296 74687 3.98 225 382 68 772 3.98 134 296 70 890 3.98 124 296 74688 3.98 164 298 58 773 3.98 174 296 53 896 3.98 124 296 74689 3.98 114 298 80 774 3.98 124 296 74 900 3.98 174 299 54690 3.98 169 298 56 775 3.98 139 296 68 901 3.98 181 298 51691 3.98 174 298 54 776 3.98 184 296 49 903 3.98 179 298 52692 3.98 154 298 62 777 3.98 154 296 62 919 3.98 245 396 65693 3.98 174 298 54 778 3.98 134 296 70 920 3.98 154 296 62694 3.98 164 298 58 779 3.98 144 296 66 923 3.98 184 298 49695 3.98 179 298 52 780 3.98 184 296 48 924 3.98 169 298 56696 3.98 179 298 52 781 3.98 194 296 44 925 3.98 89 297 90697 3.98 174 298 54 782 3.98 194 296 44 926 3.98 107 297 83698 3.98 224 396 74 783 3.98 134 296 70 927 3.98 119 321 88699 3.98 219 396 76 784 3.98 164 296 57 928 3.98 119 321 88700 3.98 194 396 87 785 3.98 164 296 57 929 3.98 83 246 71701 3.98 237 395 69 786 3.98 194 296 44 930 3.98 144 296 66702 3.98 199 396 85 787 3.98 174 296 53 931 3.98 80 296 93703 3.98 189 396 89 788 3.98 174 296 53 932 3.98 139 296 68704 3.98 179 396 94 789 3.98 169 296 55 933 3.98 164 296 57705 3.98 184 396 92 790 3.98 154 296 61 934 3.98 24 247 96706 3.98 204 396 83 791 3.98 134 296 70 935 3.98 184 296 48707 3.98 204 296 40 792 3.98 109 296 81 936 3.98 184 296 48708 3.98 204 296 40 793 3.98 109 296 81 938 3.98 166 298 57709 3.98 204 296 40 794 3.98 96 296 87710 3.98 204 296 40 795 3.98 94 296 87711 3.98 204 296 40 796 3.98 104 296 83712 3.98 209 296 38 797 3.98 114 296 79713 3.98 214 395 79 798 3.98 129 296 72714 3.98 204 395 83 799 3.98 129 296 72715 3.98 214 395 79 800 3.98 159 296 59716 3.98 219 395 76 801 3.98 144 296 66717 3.98 204 395 83 802 3.98 154 296 61718 3.98 234 298 28 803 3.98 164 296 57719 3.98 174 296 53 804 3.98 204 296 40720 3.98 174 296 53 805 3.98 204 296 40721 3.98 179 296 51 806 3.98 192 296 45722 3.98 169 296 55 808 3.98 129 297 73723 3.98 149 296 64 809 3.98 94 297 88724 3.98 174 296 53 810 3.98 74 246 75725 3.98 169 296 55 811 3.98 74 297 97726 3.98 154 296 62 812 3.98 67 247 78727 3.98 204 296 40 813 3.98 60 246 81728 3.98 204 296 40 814 3.98 172 395 97729 3.98 174 296 53 815 3.98 179 395 94730 3.98 194 296 44 816 3.98 56 296 104731 3.98 174 296 53 817 3.98 179 297 51732 3.98 194 296 44 818 3.98 242 396 67733 3.98 92 246 67 819 3.98 237 395 69734 3.98 139 297 68 820 3.98 204 296 40735 3.98 144 297 66 823 3.98 210 395 80736 3.98 114 297 79 824 3.98 211 395 80737 3.98 109 297 81 836 3.98 189 297 47738 3.98 104 297 84 837 3.98 204 298 41739 3.98 99 297 86 838 3.98 99 246 64740 3.98 94 297 88 839 3.98 169 298 56741 3.98 104 297 84 840 3.98 199 297 43742 3.98 174 298 54 841 3.98 164 297 58743 3.98 104 297 84 842 3.98 24 247 96744 3.98 184 298 49 843 3.98 214 298 36745 3.98 144 298 67 844 3.98 225 382 68746 3.98 154 298 62 845 3.98 247 382 59747 3.98 219 395 76 846 3.98 248 382 58748 3.98 199 296 42 847 3.98 224 382 69749 3.98 204 296 40 848 3.98 105 296 83750 3.98 204 296 40 849 3.98 229 382 66751 3.98 199 296 42 850 3.98 244 382 60752 3.98 184 296 49 851 3.98 248 382 58753 3.98 74 246 75 852 3.98 248 382 58754 3.98 104 246 62 853 3.98 224 298 32755 3.98 19 246 99 854 3.98 224 298 32756 3.98 19 246 99 855 3.98 224 298 32757 3.98 29 246 94 856 3.98 224 298 32
Page 39 of 48

City of Oak Harbor 2019 Peak Hour DemandWater System Plan Existing System w/ New East ZoneNovember 2013
IDDemand
(gpm)Elevation
(ft) Head (ft)Pressure
(psi) IDDemand
(gpm)Elevation
(ft) Head (ft)Pressure
(psi) IDDemand
(gpm)Elevation
(ft) Head (ft)Pressure
(psi)10 4.74 109 295 80 238 4.74 185 299 49 327 4.74 93 297 8812 4.74 124 295 74 239 4.74 182 299 51 328 4.74 90 297 9014 4.74 139 295 68 240 4.74 237 400 71 329 4.74 120 297 7716 4.74 92 295 88 241 4.74 194 400 89 330 4.74 119 296 7718 4.74 49 235 81 242 4.74 184 400 94 331 4.74 97 296 8720 4.74 46 235 82 243 4.74 136 297 70 332 4.74 88 296 9022 4.74 49 235 81 244 4.74 189 369 78 333 4.74 120 296 7624 4.74 49 235 81 245 4.74 194 366 75 334 4.74 149 296 6426 4.74 49 235 81 246 4.74 29 235 89 335 4.74 125 296 7428 4.74 164 295 57 247 4.74 121 295 75 336 4.74 142 296 6730 4.74 174 295 52 248 4.74 145 295 65 337 4.74 161 296 5932 4.74 184 295 48 249 4.74 181 295 49 338 4.74 158 296 6034 4.74 158 295 59 250 4.74 180 298 51 339 4.74 149 296 6436 4.74 160 295 58 251 4.74 107 298 83 340 4.74 71 295 9738 4.74 161 295 58 252 4.74 138 300 70 341 4.74 206 401 8440 4.74 149 295 63 253 4.74 121 300 78 342 4.74 219 401 7942 4.74 154 295 61 254 4.74 180 299 51 343 4.74 234 401 7244 4.74 149 295 63 255 4.74 182 298 50 344 4.74 226 401 7646 4.74 144 295 65 256 4.74 192 298 46 345 4.74 233 401 7348 4.74 149 295 63 257 4.74 193 298 46 346 4.74 214 400 8150 4.74 127 295 73 258 4.74 211 298 38 347 4.74 229 400 7452 4.74 133 295 70 259 4.74 199 298 43 348 4.74 212 400 8254 4.74 52 235 79 260 4.74 187 298 48 349 4.74 216 400 8056 4.74 59 235 76 261 4.74 182 298 50 350 4.74 179 401 9658 4.74 195 299 45 262 4.74 163 298 59 351 4.74 244 401 6860 4.74 192 299 46 263 4.74 161 298 60 352 4.74 241 401 6962 4.74 189 299 47 264 4.74 172 298 55 353 4.74 232 401 7364 4.74 189 299 47 265 4.74 184 298 50 354 4.74 186 295 4766 4.74 185 299 49 266 4.74 201 298 42 355 4.74 192 295 4468 4.74 187 299 48 267 4.74 199 298 43 356 4.74 189 295 4670 4.74 134 299 71 268 4.74 206 298 40 357 4.74 182 295 4972 4.74 161 299 60 269 4.74 209 298 39 358 4.74 181 295 4974 4.74 163 299 59 270 4.74 205 298 41 359 4.74 191 295 4576 4.74 9 235 98 271 4.74 143 299 67 360 4.74 144 295 6578 4.74 204 295 39 272 4.74 145 298 67 361 4.74 141 295 6780 4.74 194 295 44 273 4.74 143 298 67 362 4.74 136 295 6982 4.74 184 295 48 274 4.74 110 299 82 363 4.74 172 295 5384 4.74 174 295 52 275 4.74 108 298 83 364 4.74 172 295 5386 4.74 174 295 52 276 4.74 103 298 84 365 4.74 117 323 8988 4.74 79 299 95 277 4.74 78 297 95 366 4.74 164 295 5790 4.74 79 299 95 278 4.74 79 297 95 367 4.74 180 295 5092 4.74 39 235 85 279 4.74 96 298 88 368 4.74 168 295 5594 4.74 144 295 65 280 4.74 158 298 61 369 4.74 161 295 5896 4.74 154 295 61 281 4.74 176 298 53 370 4.74 134 295 7098 4.74 91 296 89 282 4.74 159 298 60 371 4.74 42 235 84100 4.74 94 296 88 283 4.74 151 298 64 372 4.74 50 235 80102 4.74 177 321 62 284 4.74 166 298 57 373 4.74 45 235 82104 4.74 136 297 70 285 4.74 180 298 51 374 4.74 10 235 98106 4.74 176 368 83 286 4.74 179 298 52 375 4.74 92 235 62108 4.74 159 297 60 287 4.74 178 298 52 376 4.74 149 373 97110 4.74 99 298 86 288 4.74 175 299 54 377 4.74 191 373 79112 4.74 209 372 71 289 4.74 166 299 58 378 4.74 178 374 85114 4.74 169 299 56 290 4.74 175 299 54 379 4.74 71 235 71116 4.74 12 235 97 291 4.74 132 299 72 380 4.74 170 296 54122 4.74 137 299 70 292 4.74 149 299 65 381 4.74 205 296 39126 4.74 116 371 111 293 4.74 87 299 92 382 4.74 210 296 37128 775 149 371 96 294 4.74 124 299 76 383 4.74 185 296 48134 4.74 153 371 95 295 4.74 109 298 82 384 4.74 165 296 57136 4.74 151 370 95 296 4.74 94 298 88 386 4.74 151 295 62138 4.74 152 370 94 297 4.74 121 298 77 387 4.74 146 295 65140 4.74 152 369 94 298 4.74 153 299 63 388 4.74 201 295 41142 4.74 145 369 97 299 4.74 179 299 52 389 4.74 210 296 37144 4.74 136 368 101 300 4.74 204 299 41 390 4.74 211 296 37146 4.74 136 368 101 301 4.74 197 299 44 391 4.74 195 295 43148 4.74 136 297 70 302 4.74 189 299 48 392 4.74 189 295 46150 4.74 143 297 67 303 4.74 171 299 55 393 4.74 162 295 58152 4.74 137 297 69 304 4.74 164 299 58 394 4.74 184 295 48154 4.74 142 297 67 305 4.74 171 299 55 395 4.74 194 295 44170 4.74 154 299 63 306 4.74 196 299 45 396 4.74 179 295 50215 4.74 40 295 110 307 4.74 179 299 52 397 4.74 189 295 46216 4.74 189 299 47 308 4.74 154 299 63 398 4.74 169 295 55217 4.74 139 299 69 309 4.74 144 298 67 399 4.74 159 295 59218 4.74 219 401 79 310 4.74 162 298 59 400 4.74 171 295 54219 4.74 79 295 93 315 4.74 194 296 44 401 4.74 164 295 57220 4.74 70 295 97 316 4.74 172 296 54 402 4.74 179 295 50221 4.74 49 235 81 317 4.74 196 296 43 403 4.74 161 295 58222 4.74 100 297 85 318 4.74 192 296 45 404 4.74 162 295 58228 4.74 129 299 73 319 4.74 165 296 57 405 4.74 71 235 71229 4.74 156 295 60 320 4.74 57 297 104 406 4.74 109 295 80230 4.74 209 295 37 321 4.74 60 297 103 407 4.74 114 295 78232 4.74 136 323 81 322 4.74 86 297 92 408 4.74 120 295 76233 4.74 224 401 77 323 4.74 122 297 76 409 4.74 91 235 62235 4.74 220 400 78 324 4.74 108 297 82 410 4.74 48 235 81236 4.74 214 400 81 325 4.74 104 297 84 411 4.74 80 235 67237 4.74 209 299 39 326 4.74 122 297 76 412 4.74 88 235 64
Page 40 of 48

City of Oak Harbor 2019 Peak Hour DemandWater System Plan Existing System w/ New East ZoneNovember 2013
IDDemand
(gpm)Elevation
(ft) Head (ft)Pressure
(psi) IDDemand
(gpm)Elevation
(ft) Head (ft)Pressure
(psi) IDDemand
(gpm)Elevation
(ft) Head (ft)Pressure
(psi)413 4.74 109 235 55 498 4.74 95 297 88 585 4.74 144 299 67414 4.74 89 235 63 499 4.74 103 297 84 586 4.74 176 375 86415 4.74 86 235 65 500 4.74 120 297 77 587 4.74 174 374 87416 4.74 56 235 78 501 4.74 165 297 57 589 4.74 189 373 80417 4.74 49 235 81 502 4.74 127 297 74 590 4.74 189 373 80418 4.74 47 235 82 503 4.74 173 297 54 591 4.74 201 371 74419 4.74 44 235 83 504 4.74 158 297 60 592 4.74 204 372 73420 4.74 40 235 85 505 4.74 150 297 64 593 4.74 209 372 70421 4.74 40 235 85 507 4.74 196 368 74 594 4.74 184 373 82422 4.74 36 235 86 508 4.74 177 297 52 595 4.74 154 374 95423 4.74 11 235 97 509 4.74 128 297 73 596 4.74 189 369 78424 4.74 9 235 98 510 4.74 112 297 80 597 4.74 189 369 78425 4.74 10 235 98 511 4.74 143 297 67 598 4.74 199 375 76426 4.74 14 235 96 512 4.74 137 297 69 599 4.74 164 375 91427 4.74 27 235 90 513 4.74 142 297 67 600 4.74 165 375 91428 4.74 15 235 95 514 4.74 170 297 55 601 4.74 164 375 91429 4.74 100 235 59 515 4.74 166 297 57 602 4.74 199 375 76430 4.74 107 235 56 516 4.74 165 297 57 603 4.74 191 369 77431 4.74 110 235 54 517 4.74 136 297 70 604 4.74 194 369 76432 4.74 115 235 52 518 4.74 107 297 82 605 4.74 134 297 71433 4.74 131 235 45 519 4.74 106 297 83 606 4.74 197 368 74434 4.74 138 235 42 520 4.74 107 297 82 607 4.74 194 366 75435 4.74 149 235 37 521 4.74 119 297 77 608 4.74 184 363 78436 4.74 84 235 65 522 4.74 149 297 64 611 4.74 159 297 60437 4.74 77 235 69 523 4.74 145 297 66 612 4.74 154 297 62438 4.74 95 235 61 524 4.74 137 297 69 613 4.74 159 297 60439 4.74 96 235 60 525 4.74 136 297 70 614 4.74 79 235 68440 4.74 103 235 57 526 4.74 190 368 77 615 4.74 74 297 97441 4.74 124 235 48 527 4.74 189 368 77 616 4.74 89 297 90442 4.74 139 235 42 528 4.74 191 369 77 617 4.74 86 297 92443 4.74 112 235 53 529 4.74 189 369 78 618 4.74 104 297 84444 4.74 13 235 96 530 4.74 199 369 74 619 4.74 89 297 90445 4.74 87 235 64 531 4.74 189 369 78 620 4.74 94 297 88446 4.74 28 235 90 532 4.74 100 297 86 621 4.74 124 297 75447 4.74 65 235 74 533 4.74 152 297 63 622 4.74 79 297 95448 4.74 87 235 64 534 4.74 197 369 75 623 4.74 79 297 95449 4.74 57 235 77 535 4.74 202 370 73 624 4.74 54 235 79450 4.74 34 235 87 536 4.74 152 297 63 625 4.74 49 235 81451 4.74 18 235 94 537 4.74 153 297 62 626 4.74 49 235 81452 4.74 16 235 95 538 4.74 103 297 84 627 4.74 124 323 86453 4.74 11 235 97 539 4.74 101 297 85 628 4.74 114 323 91454 4.74 12 235 97 540 4.74 115 297 79 629 4.74 109 299 82455 4.74 26 235 91 541 4.74 123 297 75 630 4.74 99 299 87456 4.74 12 235 97 542 4.74 151 297 63 631 4.74 99 299 87457 4.74 29 235 89 543 4.74 149 374 97 632 4.74 84 299 93458 4.74 49 235 81 544 4.74 153 297 62 633 4.74 69 299 100459 4.74 49 235 81 545 4.74 163 373 91 634 4.74 54 299 106460 4.74 47 235 81 546 4.74 182 374 83 635 4.74 64 299 102461 4.74 74 235 70 547 4.74 179 374 84 636 4.74 94 298 89462 4.74 85 235 65 548 4.74 197 373 76 637 4.74 64 299 102463 4.74 80 235 67 549 4.74 206 373 72 638 4.74 99 299 86464 4.74 49 235 81 550 4.74 209 373 71 639 4.74 94 299 89465 4.74 28 235 90 551 4.74 137 299 70 640 4.74 134 298 71466 4.74 28 235 90 552 4.74 104 323 95 641 4.74 119 298 78467 4.74 27 235 90 554 4.74 134 322 82 642 4.74 64 298 101468 4.74 61 235 75 555 4.74 119 323 88 643 4.74 84 298 93469 4.74 84 235 65 556 4.74 119 322 88 644 4.74 79 297 95470 4.74 27 235 90 557 4.74 134 322 82 645 4.74 74 297 97471 4.74 94 235 61 558 4.74 129 322 84 646 4.74 64 297 101472 4.74 90 235 63 559 4.74 124 322 86 647 4.74 74 297 97473 4.74 78 235 68 560 4.74 134 323 82 648 4.74 79 297 95474 4.74 75 235 69 561 4.74 134 323 82 649 4.74 79 297 95475 4.74 56 235 78 562 4.74 144 323 78 650 4.74 84 298 93476 4.74 85 235 65 563 4.74 154 323 73 651 4.74 79 297 95477 4.74 91 235 62 564 4.74 144 323 78 652 4.74 79 297 95478 4.74 93 235 62 565 4.74 144 323 78 653 4.74 74 297 97479 4.74 80 235 67 566 4.74 134 322 82 654 4.74 64 297 101480 4.74 68 235 73 567 4.74 144 322 77 655 4.74 89 298 90481 4.74 75 235 69 568 4.74 154 321 72 656 4.74 89 298 90482 4.74 73 235 70 569 4.74 109 321 92 657 4.74 49 297 108483 4.74 79 235 68 570 4.74 124 321 85 658 4.74 64 297 101484 4.74 56 235 78 571 4.74 154 321 72 659 4.74 89 235 63485 4.74 57 235 77 572 4.74 154 321 72 660 4.74 49 235 81486 4.74 54 235 79 573 4.74 154 321 72 661 4.74 54 235 78487 4.74 94 297 88 574 4.74 124 321 85 662 4.74 34 235 87488 4.74 82 297 93 575 4.74 154 321 72 663 4.74 124 299 76489 4.74 99 297 86 576 4.74 154 321 72 664 4.74 119 299 78490 4.74 80 297 94 577 4.74 199 321 53 665 4.74 129 299 73491 4.74 74 297 97 578 4.74 159 299 61 666 4.74 124 299 76492 4.74 65 298 101 579 4.74 174 299 54 667 4.74 141 299 68493 4.74 70 297 99 580 4.74 189 299 47 668 4.74 147 299 66494 4.74 74 297 97 581 4.74 194 299 45 669 4.74 149 299 65495 4.74 68 297 99 582 4.74 169 299 56 670 4.74 164 299 58496 4.74 67 297 100 583 4.74 184 299 50 671 4.74 169 299 56497 4.74 81 297 94 584 4.74 176 375 86 672 4.74 179 298 52
Page 41 of 48

City of Oak Harbor 2019 Peak Hour DemandWater System Plan Existing System w/ New East ZoneNovember 2013
IDDemand
(gpm)Elevation
(ft) Head (ft)Pressure
(psi) IDDemand
(gpm)Elevation
(ft) Head (ft)Pressure
(psi) IDDemand
(gpm)Elevation
(ft) Head (ft)Pressure
(psi)673 4.74 184 298 50 759 4.74 24 235 92 858 4.74 209 380 74674 4.74 135 299 71 760 4.74 24 235 92 860 4.74 229 380 66675 4.74 164 299 58 761 4.74 34 235 87 862 4.74 199 375 76676 4.74 209 298 39 762 4.74 29 235 89 863 4.74 165 296 57677 4.74 209 298 39 763 4.74 29 235 89 864 4.74 194 295 44678 4.74 214 298 37 764 4.74 39 235 85 868 4.74 200 298 43679 4.74 224 298 32 765 4.74 14 235 96 869 4.74 114 321 90680 4.74 229 298 30 766 4.74 24 235 92 875 4.74 203 295 40681 4.74 224 298 32 767 4.74 40 295 110 880 4.74 81 297 94682 4.74 224 298 32 768 4.74 104 295 83 885 4.74 83 297 93683 4.74 224 298 32 769 4.74 84 295 91 887 4.74 82 297 93684 4.74 234 298 28 770 4.74 114 295 78 888 4.74 82 297 93685 4.74 234 298 28 771 4.74 119 295 76 889 4.74 124 295 74686 4.74 234 298 28 772 4.74 134 295 70 890 4.74 124 295 74687 4.74 225 381 67 773 4.74 174 295 52 896 4.74 124 295 74688 4.74 164 299 58 774 4.74 124 295 74 900 4.74 174 299 54689 4.74 114 299 80 775 4.74 139 295 67 901 4.74 181 299 51690 4.74 169 299 56 776 4.74 184 295 48 903 4.74 179 299 52691 4.74 174 299 54 777 4.74 154 295 61 919 4.74 245 401 67692 4.74 154 299 63 778 4.74 134 295 70 920 4.74 154 295 61693 4.74 174 299 54 779 4.74 144 295 65 923 4.74 184 298 50694 4.74 164 299 58 780 4.74 184 295 48 924 4.74 169 299 56695 4.74 179 299 52 781 4.74 194 295 44 925 4.74 89 297 90696 4.74 179 299 52 782 4.74 194 295 44 926 4.74 107 298 83697 4.74 174 299 54 783 4.74 134 295 70 927 4.74 119 322 88698 4.74 224 401 77 784 4.74 164 295 57 928 4.74 119 322 88699 4.74 219 401 79 785 4.74 164 295 57 929 4.74 83 235 66700 4.74 194 401 90 786 4.74 194 295 44 930 4.74 144 295 65701 4.74 237 400 71 787 4.74 174 295 52 931 4.74 80 295 93702 4.74 199 401 87 788 4.74 174 295 52 932 4.74 139 295 67703 4.74 189 401 92 789 4.74 169 295 54 933 4.74 164 295 57704 4.74 179 401 96 790 4.74 154 295 61 934 4.74 24 235 92705 4.74 184 401 94 791 4.74 134 295 70 935 4.74 184 295 48706 4.74 204 401 85 792 4.74 109 295 80 936 4.74 184 295 48707 4.74 204 295 40 793 4.74 109 295 80 937 1,000 177 333 68708 4.74 204 295 40 794 4.74 96 295 86 938 4.74 166 298 57709 4.74 204 295 40 795 4.74 94 295 87710 4.74 204 295 40 796 4.74 104 295 83711 4.74 204 295 40 797 4.74 114 295 78712 4.74 209 296 38 798 4.74 129 295 72713 4.74 214 400 81 799 4.74 129 295 72714 4.74 204 400 85 800 4.74 159 295 59715 4.74 214 400 81 801 4.74 144 295 65716 4.74 219 400 79 802 4.74 154 295 61717 4.74 204 400 85 803 4.74 164 295 57719 4.74 174 295 52 804 4.74 204 295 39720 4.74 174 295 52 805 4.74 204 295 39721 4.74 179 295 50 806 4.74 192 295 45722 4.74 169 295 55 808 4.74 129 297 73723 4.74 149 295 63 809 4.74 94 297 88724 4.74 174 295 52 810 4.74 74 235 70725 4.74 169 295 55 811 4.74 74 297 97726 4.74 154 295 61 812 4.74 67 235 73727 4.74 204 295 40 813 4.74 60 235 76728 4.74 204 296 40 814 4.74 172 400 99729 4.74 174 295 53 815 4.74 179 400 96730 4.74 194 295 44 816 4.74 56 295 104731 4.74 174 295 52 817 4.74 179 298 51732 4.74 194 295 44 818 4.74 242 401 69733 4.74 92 235 62 819 4.74 237 400 71734 4.74 139 297 68 820 4.74 204 295 40735 4.74 144 298 67 823 4.74 210 400 83736 4.74 114 298 80 824 4.74 211 400 82737 4.74 109 298 82 836 4.74 189 359 74738 4.74 104 298 84 837 4.74 204 298 41739 4.74 99 298 86 838 4.74 99 235 59740 4.74 94 298 88 839 4.74 169 299 56741 4.74 104 298 84 840 4.74 199 375 76742 4.74 174 299 54 841 4.74 164 375 91743 4.74 104 298 84 842 4.74 24 235 92744 4.74 184 298 50 843 4.74 214 298 37745 4.74 144 298 67 844 4.74 225 381 67746 4.74 154 298 63 845 4.74 247 381 58747 4.74 219 400 79 846 4.74 248 381 57748 4.74 199 295 42 847 4.74 224 381 68749 4.74 204 295 40 848 4.74 105 295 82750 4.74 204 295 40 849 4.74 229 380 66751 4.74 199 295 42 850 4.74 244 380 59752 4.74 184 295 48 851 4.74 248 380 57753 4.74 74 235 70 852 4.74 248 380 57754 4.74 104 235 57 853 4.74 224 298 32755 4.74 19 235 94 854 4.74 224 298 32756 4.74 19 235 94 855 4.74 224 298 32757 4.74 29 235 89 856 4.74 224 298 32758 4.74 34 235 87 857 4.74 229 380 66
Page 42 of 48

City of Oak Harbor 2033 Peak Hour DemandWater System Plan Existing System w/ New East ZoneNovember 2013
IDDemand
(gpm)Elevation
(ft) Head (ft)Pressure
(psi) IDDemand
(gpm)Elevation
(ft) Head (ft)Pressure
(psi) IDDemand
(gpm)Elevation
(ft) Head (ft)Pressure
(psi)10 5.3 109 293 80 238 5.3 185 298 49 327 5.3 93 296 8812 5.3 124 293 73 239 5.3 182 298 50 328 5.3 90 296 8914 5.3 139 293 67 240 5.3 237 400 70 329 5.3 120 296 7616 5.3 92 293 87 241 5.3 194 400 89 330 5.3 119 295 7718 5.3 49 235 81 242 5.3 184 400 93 331 5.3 97 295 8620 5.3 46 235 82 243 5.3 136 296 69 332 5.3 88 295 9022 5.3 49 235 81 244 5.3 189 355 72 333 5.3 120 295 7624 5.3 49 235 81 245 5.3 194 352 68 334 5.3 149 295 6326 5.3 49 235 81 246 5.3 29 235 89 335 5.3 125 295 7428 5.3 164 293 56 247 5.3 121 293 75 336 5.3 142 295 6630 5.3 174 293 52 248 5.3 145 293 64 337 5.3 161 295 5832 5.3 184 293 47 249 5.3 181 294 49 338 5.3 158 295 5934 5.3 158 293 59 250 5.3 180 298 51 339 5.3 149 295 6336 5.3 160 293 58 251 5.3 107 297 82 340 5.3 71 293 9638 5.3 161 293 57 252 5.3 138 300 70 341 5.3 206 400 8440 5.3 149 293 62 253 5.3 121 300 77 342 5.3 219 400 7842 5.3 154 293 60 254 5.3 180 298 51 343 5.3 234 400 7244 5.3 149 293 62 255 5.3 182 298 50 344 5.3 226 400 7546 5.3 144 293 65 256 5.3 192 298 46 345 5.3 233 400 7248 5.3 149 293 62 257 5.3 193 298 45 346 5.3 214 400 8050 5.3 127 293 72 258 5.3 211 298 38 347 5.3 229 400 7452 5.3 133 293 69 259 5.3 199 298 43 348 5.3 212 400 8154 5.3 52 235 79 260 5.3 187 298 48 349 5.3 216 400 8056 5.3 59 235 76 261 5.3 182 298 50 350 5.3 179 400 9658 5.3 195 298 45 262 5.3 163 298 58 351 5.3 244 400 6760 5.3 192 298 46 263 5.3 161 298 59 352 5.3 241 400 6962 5.3 189 298 47 264 5.3 172 298 54 353 5.3 232 400 7364 5.3 189 298 47 265 5.3 184 298 49 354 5.3 186 293 4666 5.3 185 298 49 266 5.3 201 298 42 355 5.3 192 293 4468 5.3 187 298 48 267 5.3 199 298 43 356 5.3 189 293 4570 5.3 134 298 71 268 5.3 206 298 40 357 5.3 182 293 4872 5.3 161 298 59 269 5.3 209 298 38 358 5.3 181 293 4974 5.3 163 298 58 270 5.3 205 298 40 359 5.3 191 293 4476 5.3 9 235 98 271 5.3 143 298 67 360 5.3 144 293 6578 5.3 204 293 39 272 5.3 145 298 66 361 5.3 141 293 6680 5.3 194 293 43 273 5.3 143 298 67 362 5.3 136 293 6882 5.3 184 293 47 274 5.3 110 298 82 363 5.3 172 293 5284 5.3 174 293 52 275 5.3 108 298 82 364 5.3 172 293 5286 5.3 174 293 52 276 5.3 103 297 84 365 5.3 117 322 8988 5.3 79 298 95 277 5.3 78 296 95 366 5.3 164 293 5690 5.3 79 298 95 278 5.3 79 297 94 367 5.3 180 293 4992 5.3 39 235 85 279 5.3 96 297 87 368 5.3 168 293 5494 5.3 144 293 65 280 5.3 158 298 60 369 5.3 161 293 5796 5.3 154 293 60 281 5.3 176 298 53 370 5.3 134 293 6998 5.3 91 295 89 282 5.3 159 298 60 371 5.3 42 235 84100 5.3 94 295 87 283 5.3 151 298 64 372 5.3 50 235 80102 5.3 177 319 62 284 5.3 166 298 57 373 5.3 45 235 82104 5.3 136 296 69 285 5.3 180 298 51 374 5.3 10 235 98106 5.3 176 353 77 286 5.3 179 298 51 375 5.3 92 235 62108 5.3 159 296 59 287 5.3 178 298 52 376 5.3 149 359 91110 5.3 99 297 86 288 5.3 175 298 53 377 5.3 191 358 73112 5.3 209 358 64 289 5.3 166 298 57 378 5.3 178 360 79114 5.3 169 298 56 290 5.3 175 298 53 379 5.3 71 235 71116 5.3 12 235 97 291 5.3 132 298 72 380 5.3 170 294 54122 5.3 137 298 70 292 5.3 149 298 65 381 5.3 205 294 39126 5.3 116 357 104 293 5.3 87 298 91 382 5.3 210 294 37128 775 149 357 90 294 5.3 124 298 75 383 5.3 185 294 47134 5.3 153 357 88 295 5.3 109 297 81 384 5.3 165 295 56136 5.3 151 356 89 296 5.3 94 297 88 386 5.3 151 293 62138 5.3 152 355 88 297 5.3 121 298 77 387 5.3 146 293 64140 5.3 152 355 88 298 5.3 153 298 63 388 5.3 201 294 40142 5.3 145 354 91 299 5.3 179 298 52 389 5.3 210 294 37144 5.3 136 354 94 300 5.30 204 298 41 390 5.3 211 294 36146 5.3 136 354 94 301 5.3 197 298 44 391 5.3 195 294 43148 5.3 136 296 69 302 5.3 189 298 47 392 5.3 189 294 45150 5.3 143 296 66 303 5.3 171 298 55 393 5.3 162 294 57152 5.3 137 296 69 304 5.3 164 298 58 394 5.3 184 294 47154 5.3 142 296 67 305 5.3 171 298 55 395 5.3 194 294 43170 5.3 154 299 63 306 5.3 196 299 44 396 5.3 179 293 50215 5.3 40 293 110 307 5.3 179 299 52 397 5.3 189 294 45216 5.3 189 298 47 308 5.3 154 299 63 398 5.3 169 293 54217 5.3 139 298 69 309 5.3 144 297 66 399 5.3 159 293 58218 5.3 219 400 78 310 5.3 162 297 58 400 5.3 171 293 53219 5.3 79 293 93 315 5.3 194 295 44 401 5.3 164 293 56220 5.3 70 293 97 316 5.3 172 295 53 402 5.3 179 293 50221 5.3 49 235 81 317 5.3 196 295 43 403 5.3 161 293 57222 5.3 100 296 85 318 5.3 192 295 45 404 5.3 162 293 57228 5.3 129 298 73 319 5.3 165 295 56 405 5.3 71 235 71229 5.3 156 293 60 320 5.3 57 296 104 406 5.3 109 293 80230 5.3 209 293 36 321 5.3 60 296 102 407 5.3 114 293 78232 5.3 136 322 81 322 5.3 86 296 91 408 5.3 120 293 75233 5.3 224 400 76 323 5.3 122 296 76 409 5.3 91 235 62235 5.3 220 400 78 324 5.3 108 296 82 410 5.3 48 235 81236 5.3 214 400 80 325 5.3 104 296 83 411 5.3 80 235 67237 5.3 209 298 39 326 5.3 122 296 75 412 5.3 88 235 64
Page 43 of 48

City of Oak Harbor 2033 Peak Hour DemandWater System Plan Existing System w/ New East ZoneNovember 2013
IDDemand
(gpm)Elevation
(ft) Head (ft)Pressure
(psi) IDDemand
(gpm)Elevation
(ft) Head (ft)Pressure
(psi) IDDemand
(gpm)Elevation
(ft) Head (ft)Pressure
(psi)413 5.3 109 235 55 498 5.3 95 296 87 585 5.3 144 298 67414 5.3 89 235 63 499 5.3 103 296 84 586 5.3 176 360 80415 5.3 86 235 65 500 5.3 120 296 76 587 5.3 174 360 80416 5.3 56 235 78 501 5.3 165 296 57 589 5.3 189 359 74417 5.3 49 235 81 502 5.3 127 296 73 590 5.3 189 359 74418 5.3 47 235 82 503 5.3 173 296 53 591 5.3 201 357 68419 5.3 44 235 83 504 5.3 158 296 60 592 5.3 204 357 66420 5.3 40 235 85 505 5.3 150 296 63 593 5.3 209 357 64421 5.3 40 235 85 507 5.3 196 353 68 594 5.3 184 359 76422 5.3 36 235 86 508 5.3 177 296 52 595 5.3 154 359 89423 5.3 11 235 97 509 5.3 128 296 73 596 5.3 189 355 72424 5.3 9 235 98 510 5.3 112 296 80 597 5.3 189 355 72425 5.3 10 235 98 511 5.3 143 296 66 598 5.3 199 360 70426 5.3 14 235 96 512 5.3 137 296 69 599 5.3 164 360 85427 5.3 27 235 90 513 5.3 142 296 67 600 5.3 165 360 85428 5.3 15 235 95 514 5.3 170 296 55 601 5.3 164 360 85429 5.3 100 235 59 515 5.3 166 296 56 602 5.3 199 360 70430 5.3 107 235 56 516 5.3 165 296 57 603 5.3 191 354 71431 5.3 110 235 54 517 5.3 136 296 69 604 5.3 194 354 69432 5.3 115 235 52 518 5.3 107 296 82 605 5.3 134 296 70433 5.3 131 235 45 519 5.3 106 296 82 606 5.3 197 353 68434 5.3 138 235 42 520 5.3 107 296 82 607 5.3 194 352 68435 5.3 149 235 37 521 5.3 119 296 77 608 5.3 184 349 71436 5.3 84 235 65 522 5.3 149 296 64 611 5.3 159 296 59437 5.3 77 235 68 523 5.3 145 296 66 612 5.3 154 296 61438 5.3 95 235 61 524 5.3 137 296 69 613 5.3 159 296 59439 5.3 96 235 60 525 5.3 136 296 69 614 5.3 79 235 68440 5.3 103 235 57 526 5.3 190 354 71 615 5.3 74 296 96441 5.3 124 235 48 527 5.3 189 353 71 616 5.3 89 296 90442 5.3 139 235 42 528 5.3 191 354 71 617 5.3 86 296 91443 5.3 112 235 53 529 5.3 189 355 72 618 5.3 104 296 83444 5.3 13 235 96 530 5.3 199 355 67 619 5.3 89 296 90445 5.3 87 235 64 531 5.3 189 355 72 620 5.3 94 296 88446 5.3 28 235 90 532 5.3 100 297 85 621 5.3 124 296 75447 5.3 65 235 74 533 5.3 152 296 63 622 5.3 79 297 94448 5.3 87 235 64 534 5.3 197 355 68 623 5.3 79 297 94449 5.3 57 235 77 535 5.3 202 356 67 624 5.3 54 235 78450 5.3 34 235 87 536 5.3 152 296 63 625 5.3 49 235 81451 5.3 18 235 94 537 5.3 153 296 62 626 5.3 49 235 81452 5.3 16 235 95 538 5.3 103 296 84 627 5.3 124 323 86453 5.3 11 235 97 539 5.3 101 296 85 628 5.3 114 323 90454 5.3 12 235 97 540 5.3 115 296 79 629 5.3 109 299 82455 5.3 26 235 91 541 5.3 123 296 75 630 5.3 99 299 87456 5.3 12 235 97 542 5.3 151 296 63 631 5.3 99 298 86457 5.3 29 235 89 543 5.3 149 360 91 632 5.3 84 298 93458 5.3 49 235 81 544 5.3 153 296 62 633 5.3 69 298 99459 5.3 49 235 81 545 5.3 163 359 85 634 5.3 54 298 106460 5.3 47 235 81 546 5.3 182 360 77 635 5.3 64 298 101461 5.3 74 235 70 547 5.3 179 359 78 636 5.3 94 298 88462 5.3 85 235 65 548 5.3 197 358 70 637 5.3 64 298 101463 5.3 80 235 67 549 5.3 206 358 66 638 5.3 99 298 86464 5.3 49 235 81 550 5.3 209 358 65 639 5.3 94 298 88465 5.3 28 235 90 551 5.3 137 298 70 640 5.3 134 297 71466 5.3 28 235 90 552 5.3 104 322 94 641 5.3 119 297 77467 5.3 27 235 90 554 5.3 134 321 81 642 5.3 64 297 101468 5.3 61 235 75 555 5.3 119 322 88 643 5.3 84 297 92469 5.3 84 235 65 556 5.3 119 322 88 644 5.3 79 297 94470 5.3 27 235 90 557 5.3 134 321 81 645 5.3 74 297 96471 5.3 94 235 61 558 5.3 129 321 83 646 5.3 64 297 101472 5.3 90 235 63 559 5.3 124 322 86 647 5.3 74 297 96473 5.3 78 235 68 560 5.3 134 322 81 648 5.3 79 297 94474 5.3 75 235 69 561 5.3 134 322 82 649 5.3 79 296 94475 5.3 56 235 78 562 5.3 144 322 77 650 5.3 84 297 92476 5.3 85 235 65 563 5.3 154 322 73 651 5.3 79 296 94477 5.3 91 235 62 564 5.3 144 322 77 652 5.3 79 296 94478 5.3 93 235 62 565 5.3 144 322 77 653 5.3 74 296 96479 5.3 80 235 67 566 5.3 134 321 81 654 5.3 64 296 101480 5.3 68 235 73 567 5.3 144 321 77 655 5.3 89 297 90481 5.3 75 235 69 568 5.3 154 320 72 656 5.3 89 297 90482 5.3 73 235 70 569 5.3 109 320 91 657 5.3 49 296 107483 5.3 79 235 68 570 5.3 124 320 85 658 5.3 64 296 101484 5.3 56 235 78 571 5.3 154 320 72 659 5.3 89 235 63485 5.3 57 235 77 572 5.3 154 320 72 660 5.3 49 235 81486 5.3 54 235 78 573 5.3 154 320 72 661 5.3 54 235 78487 5.3 94 296 88 574 5.3 124 320 85 662 5.3 34 235 87488 5.3 82 296 93 575 5.3 154 319 72 663 5.3 124 298 75489 5.3 99 296 86 576 5.3 154 319 72 664 5.3 119 298 78490 5.3 80 296 94 577 5.3 199 319 52 665 5.3 129 298 73491 5.3 74 297 96 578 5.3 159 298 60 666 5.3 124 298 75492 5.3 65 297 101 579 5.3 174 298 54 667 5.3 141 298 68493 5.3 70 297 98 580 5.3 189 298 47 668 5.3 147 298 65494 5.3 74 297 96 581 5.3 194 298 45 669 5.3 149 298 64495 5.3 68 296 99 582 5.3 169 298 56 670 5.3 164 298 58496 5.3 67 296 99 583 5.3 184 298 50 671 5.3 169 298 56497 5.3 81 296 93 584 5.3 176 360 80 672 5.3 179 298 51
Page 44 of 48

City of Oak Harbor 2033 Peak Hour DemandWater System Plan Existing System w/ New East ZoneNovember 2013
IDDemand
(gpm)Elevation
(ft) Head (ft)Pressure
(psi) IDDemand
(gpm)Elevation
(ft) Head (ft)Pressure
(psi) IDDemand
(gpm)Elevation
(ft) Head (ft)Pressure
(psi)673 5.3 184 298 49 758 5.3 34 235 87 857 5.3 229 431 88674 5.3 135 298 71 759 5.3 24 235 91 858 5.3 209 431 96675 5.3 164 298 58 760 5.3 24 235 91 860 5.3 229 431 88676 5.3 209 298 38 761 5.3 34 235 87 862 5.3 199 360 70677 5.3 209 298 38 762 5.3 29 235 89 863 5.3 165 295 56678 5.3 214 298 36 763 5.3 29 235 89 864 5.3 194 294 43679 5.3 224 298 32 764 5.3 39 235 85 868 5.3 200 298 42680 5.3 229 298 30 765 5.3 14 235 96 869 5.3 114 320 89681 5.3 224 298 32 766 5.3 24 235 92 875 5.3 203 293 39682 5.3 224 298 32 767 5.3 40 293 110 880 5.3 81 296 93683 5.3 224 298 32 768 5.3 104 293 82 885 5.3 83 296 92684 5.3 234 298 28 769 5.3 84 293 91 887 5.3 82 296 93685 5.3 234 298 28 770 5.3 114 293 78 888 5.3 82 296 93686 5.3 234 298 28 771 5.3 119 293 75 889 5.3 124 293 73687 5.3 225 431 89 772 5.3 134 293 69 890 5.3 124 293 73688 5.3 164 298 58 773 5.3 174 293 52 896 5.3 124 293 73689 5.3 114 298 80 774 5.3 124 293 73 900 5.3 174 298 54690 5.3 169 298 56 775 5.3 139 293 67 901 5.3 181 298 51691 5.3 174 298 54 776 5.3 184 294 47 903 5.3 179 298 52692 5.3 154 298 62 777 5.3 154 294 60 919 5.3 245 400 67693 5.3 174 298 54 778 5.3 134 293 69 920 5.3 154 293 60694 5.3 164 298 58 779 5.3 144 293 65 923 5.3 184 298 49695 5.3 179 298 52 780 5.3 184 293 47 924 5.3 169 298 56696 5.3 179 298 52 781 5.3 194 293 43 925 5.3 89 297 90697 5.3 174 298 54 782 5.3 194 293 43 926 5.3 107 297 82698 5.3 224 400 76 783 5.3 134 293 69 927 5.3 119 322 88699 5.3 219 400 78 784 5.3 164 293 56 928 5.3 119 322 88700 5.3 194 400 89 785 5.3 164 293 56 929 5.3 83 235 66701 5.3 237 400 70 786 5.3 194 293 43 930 5.3 144 293 65702 5.3 199 400 87 787 5.3 174 293 52 931 5.3 80 293 92703 5.3 189 400 91 788 5.3 174 293 52 932 5.3 139 293 67704 5.3 179 400 96 789 5.3 169 293 54 933 5.3 164 293 56705 5.3 184 400 93 790 5.3 154 293 60 934 5.3 24 235 92706 5.3 204 400 85 791 5.3 134 293 69 935 5.3 184 293 47707 5.3 204 294 39 792 5.3 109 293 80 936 5.3 184 293 47708 5.3 204 294 39 793 5.3 109 293 80 937 1,000 177 318 61709 5.3 204 294 39 794 5.3 96 293 85 938 5.3 166 298 57710 5.3 204 294 39 795 5.3 94 293 86711 5.3 204 294 39 796 5.3 104 293 82712 5.3 209 294 37 797 5.3 114 293 78713 5.3 214 400 80 798 5.3 129 293 71714 5.3 204 400 85 799 5.3 129 293 71715 5.3 214 400 80 800 5.3 159 293 58716 5.3 219 400 78 801 5.3 144 293 65717 5.3 204 400 85 802 5.3 154 293 60718 5.3 234 296 27 803 5.3 164 293 56719 5.3 174 293 52 804 5.3 204 293 39720 5.3 174 293 52 805 5.3 204 293 39721 5.3 179 293 50 806 5.3 192 293 44722 5.3 169 293 54 808 5.3 129 296 72723 5.3 149 293 63 809 5.3 94 296 88724 5.3 174 293 52 810 5.3 74 235 70725 5.3 169 293 54 811 5.3 74 296 96726 5.3 154 293 60 812 5.3 67 235 73727 5.3 204 294 39 813 5.3 60 235 76728 5.3 204 294 39 814 5.3 172 400 99729 5.3 174 294 52 815 5.3 179 400 96730 5.3 194 294 43 816 5.3 56 293 103731 5.3 174 294 52 817 5.3 179 297 51732 5.3 194 294 43 818 5.3 242 400 68733 5.3 92 235 62 819 5.3 237 400 70734 5.3 139 296 68 820 5.3 204 294 39735 5.3 144 297 66 823 5.3 210 400 82736 5.3 114 297 79 824 5.3 211 400 82737 5.3 109 297 81 836 5.3 189 345 68738 5.3 104 297 84 837 5.3 204 298 41739 5.3 99 297 86 838 5.3 99 235 59740 5.3 94 297 88 839 5.3 169 298 56741 5.3 104 297 84 840 5.3 199 360 70742 5.3 174 298 54 841 5.3 164 360 85743 5.3 104 297 84 842 5.3 24 235 92744 5.3 184 298 49 843 5.3 214 298 36745 5.3 144 297 66 844 5.3 225 431 89746 5.3 154 298 62 845 5.3 247 431 80747 5.3 219 400 78 846 5.3 248 431 79748 5.3 199 294 41 847 5.3 224 431 90749 5.3 204 294 39 848 5.3 105 293 81750 5.3 204 294 39 849 5.3 229 431 88751 5.3 199 294 41 850 5.3 244 431 81752 5.3 184 294 47 851 5.3 248 431 79753 5.3 74 235 70 852 5.3 248 431 79754 5.3 104 235 57 853 5.3 224 298 32755 5.3 19 235 94 854 5.3 224 298 32756 5.3 19 235 94 855 5.3 224 298 32757 5.3 29 235 89 856 5.3 224 298 32
Page 45 of 48

City of Oak Harbor 2033 Peak Hour DemandWater System Plan Improved System with CIPsNovember 2013
IDDemand
(gpm)Elevation
(ft) Head (ft)Pressure
(psi) IDDemand
(gpm)Elevation
(ft) Head (ft)Pressure
(psi) IDDemand
(gpm)Elevation
(ft) Head (ft)Pressure
(psi)10 5.3 109 289 78 238 5.3 185 367 79 327 5.3 93 295 8812 5.3 124 289 72 239 5.3 182 366 80 328 5.3 90 295 8914 5.3 139 289 65 240 5.3 237 361 54 329 5.3 120 295 7616 5.3 92 289 85 241 5.3 194 361 72 330 5.3 119 294 7618 5.3 49 235 81 242 5.3 184 361 77 331 5.3 97 294 8620 5.3 46 235 82 243 5.3 136 296 69 332 5.3 88 294 8922 5.3 49 235 81 244 5.3 189 355 72 333 5.3 120 294 7524 5.3 49 235 81 245 5.3 194 352 68 334 5.3 149 293 6326 5.3 49 235 81 246 5.3 29 235 89 335 5.3 125 293 7328 5.3 164 321 68 247 5.3 121 290 73 336 5.3 142 293 6530 5.3 174 321 64 248 5.3 145 290 63 337 5.3 161 293 5732 5.3 184 321 59 249 5.3 181 290 47 338 5.3 158 293 5934 5.3 158 321 71 250 5.3 180 297 51 339 5.3 149 293 6336 5.3 160 321 70 251 5.3 107 297 82 340 5.3 71 321 10838 5.3 161 321 69 252 5.3 138 300 70 341 5.3 206 362 6840 5.3 149 321 75 253 5.3 121 300 78 342 5.3 219 362 6242 5.3 154 321 72 254 5.3 180 368 82 343 5.3 234 362 5644 5.3 149 321 75 255 5.3 182 367 80 344 5.3 226 362 5946 5.3 144 321 77 256 5.3 192 367 76 345 5.3 233 362 5648 5.3 149 321 75 257 5.3 193 367 76 346 5.3 214 361 6450 5.3 127 321 84 258 5.3 211 368 68 347 5.3 229 361 5752 5.3 133 321 81 259 5.3 199 368 73 348 5.3 212 361 6554 5.3 52 235 79 260 5.3 187 297 48 349 5.3 216 361 6356 5.3 59 235 76 261 5.3 182 297 50 350 5.3 179 362 7958 5.3 195 368 75 262 5.3 163 297 58 351 5.3 244 362 5160 5.3 192 367 76 263 5.3 161 297 59 352 5.3 241 362 5262 5.3 189 367 77 264 5.3 172 297 54 353 5.3 232 362 5664 5.3 189 367 77 265 5.3 184 367 79 354 5.3 186 321 5866 5.3 185 367 79 266 5.3 201 367 72 355 5.3 192 321 5668 5.3 187 367 78 267 5.3 199 367 73 356 5.3 189 321 5770 5.3 134 368 102 268 5.3 206 368 70 357 5.3 182 321 6072 5.3 161 368 90 269 5.3 209 368 69 358 5.3 181 321 6174 5.3 163 368 89 270 5.3 205 368 71 359 5.3 191 321 5676 5.3 9 235 98 271 5.3 143 298 67 360 5.3 144 321 7778 5.3 204 321 51 272 5.3 145 298 66 361 5.3 141 321 7880 5.3 194 321 55 273 5.3 143 298 67 362 5.3 136 321 8082 5.3 184 321 59 274 5.3 110 298 82 363 5.3 172 321 6584 5.3 174 321 64 275 5.3 108 298 82 364 5.3 172 321 6586 5.3 174 321 64 276 5.3 103 297 84 365 5.3 117 322 8988 5.3 79 298 95 277 5.3 78 296 94 366 5.3 164 321 6890 5.3 79 298 95 278 5.3 79 296 94 367 5.3 180 321 6192 5.3 39 235 85 279 5.3 96 297 87 368 5.3 168 321 6694 5.3 144 321 77 280 5.3 158 297 60 369 5.3 161 321 7096 5.3 154 321 72 281 5.3 176 297 52 370 5.3 134 321 8198 5.3 91 294 88 282 5.3 159 297 60 371 5.3 42 235 84100 5.3 94 294 87 283 5.3 151 297 63 372 5.3 50 235 80102 5.3 177 321 62 284 5.3 166 297 57 373 5.3 45 235 82104 5.3 136 296 69 285 5.3 180 297 51 374 5.3 10 235 98106 5.3 176 353 77 286 5.3 179 297 51 375 5.3 92 235 62108 5.3 159 295 59 287 5.3 178 366 82 376 5.3 149 358 90110 5.3 99 297 86 288 5.3 175 366 83 377 5.3 191 357 72112 5.3 209 357 64 289 5.3 166 366 87 378 5.3 178 358 78114 5.3 169 368 86 290 5.3 175 366 83 379 5.3 71 235 71116 5.3 12 235 97 291 5.3 132 298 72 380 5.3 170 291 53122 5.3 137 298 70 292 5.3 149 298 65 381 5.3 205 361 68126 5.3 116 357 105 293 5.3 87 297 91 382 5.3 210 361 65128 775 149 357 90 294 5.3 124 298 75 383 5.3 185 361 76134 5.3 153 357 88 295 5.3 109 296 81 384 5.3 165 361 85136 5.3 151 356 89 296 5.3 94 296 88 386 5.3 151 322 74138 5.3 152 355 88 297 5.3 121 297 76 387 5.3 146 322 76140 5.3 152 355 88 298 5.3 153 297 62 388 5.3 201 360 69142 5.3 145 355 91 299 5.3 179 366 81 389 5.3 210 361 65144 5.3 136 354 95 300 5.3 204 363 69 390 5.3 211 361 65146 5.3 136 354 94 301 5.3 197 364 72 391 5.3 195 289 41148 5.3 136 296 69 302 5.3 189 364 76 392 5.3 189 289 43150 5.3 143 296 66 303 5.3 171 365 84 393 5.3 162 289 55152 5.3 137 295 69 304 5.3 164 365 87 394 5.3 184 289 46154 5.3 142 295 67 305 5.3 171 365 84 395 5.3 194 289 41170 5.3 154 299 63 306 5.3 196 364 73 396 5.3 179 289 48215 5.3 40 321 122 307 5.3 179 364 80 397 5.3 189 289 43216 5.3 189 369 78 308 5.3 154 299 63 398 5.3 169 289 52217 5.3 139 368 99 309 5.3 144 296 66 399 5.3 159 289 56218 5.3 219 362 62 310 5.3 162 296 58 400 5.3 171 289 51219 5.3 79 321 105 315 5.3 194 361 72 401 5.3 164 289 54220 5.3 70 321 109 316 5.3 172 361 82 402 5.3 179 289 48221 5.3 49 235 81 317 5.3 196 361 72 403 5.3 161 289 56222 5.3 100 295 85 318 5.3 192 361 74 404 5.3 162 289 55228 5.3 129 368 104 319 5.3 165 361 85 405 5.3 71 235 71229 5.3 156 322 72 320 5.3 57 296 104 406 5.3 109 321 92230 5.3 209 321 49 321 5.3 60 296 102 407 5.3 114 321 90232 5.3 136 322 81 322 5.3 86 296 91 408 5.3 120 321 87233 5.3 224 362 60 323 5.3 122 296 75 409 5.3 91 235 62235 5.3 220 361 61 324 5.3 108 296 81 410 5.3 48 235 81236 5.3 214 361 64 325 5.3 104 295 83 411 5.3 80 235 67237 5.3 209 367 68 326 5.3 122 295 75 412 5.3 88 235 64
Page 46 of 48

City of Oak Harbor 2033 Peak Hour DemandWater System Plan Improved System with CIPsNovember 2013
IDDemand
(gpm)Elevation
(ft) Head (ft)Pressure
(psi) IDDemand
(gpm)Elevation
(ft) Head (ft)Pressure
(psi) IDDemand
(gpm)Elevation
(ft) Head (ft)Pressure
(psi)413 5.3 109 235 55 498 5.3 95 296 87 585 5.3 144 298 67414 5.3 89 235 63 499 5.3 103 296 84 586 5.3 176 359 79415 5.3 86 235 65 500 5.3 120 296 76 587 5.3 174 358 80416 5.3 56 235 78 501 5.3 165 296 57 589 5.3 189 358 73417 5.3 49 235 81 502 5.3 127 296 73 590 5.3 189 358 73418 5.3 47 235 82 503 5.3 173 295 53 591 5.3 201 357 67419 5.3 44 235 83 504 5.3 158 295 60 592 5.3 204 357 66420 5.3 40 235 85 505 5.3 150 295 63 593 5.3 209 357 64421 5.3 40 235 85 507 5.3 196 353 68 594 5.3 184 358 75422 5.3 36 235 86 508 5.3 177 295 51 595 5.3 154 358 88423 5.3 11 235 97 509 5.3 128 295 73 596 5.3 189 355 72424 5.3 9 235 98 510 5.3 112 296 80 597 5.3 189 355 72425 5.3 10 235 98 511 5.3 143 296 66 598 5.3 199 359 69426 5.3 14 235 96 512 5.3 137 295 69 599 5.3 164 359 84427 5.3 27 235 90 513 5.3 142 295 67 600 5.3 165 359 84428 5.3 15 235 95 514 5.3 170 295 54 601 5.3 164 359 84429 5.3 100 235 59 515 5.3 166 295 56 602 5.3 199 359 69430 5.3 107 235 56 516 5.3 165 296 57 603 5.3 191 355 71431 5.3 110 235 54 517 5.3 136 296 69 604 5.3 194 355 70432 5.3 115 235 52 518 5.3 107 296 82 605 5.3 134 296 70433 5.3 131 235 45 519 5.3 106 296 82 606 5.3 197 353 68434 5.3 138 235 42 520 5.3 107 296 82 607 5.3 194 352 68435 5.3 149 235 37 521 5.3 119 296 77 608 5.3 184 349 71436 5.3 84 235 65 522 5.3 149 296 64 611 5.3 159 295 59437 5.3 77 235 68 523 5.3 145 296 65 612 5.3 154 295 61438 5.3 95 235 61 524 5.3 137 296 69 613 5.3 159 295 59439 5.3 96 235 60 525 5.3 136 296 69 614 5.3 79 235 68440 5.3 103 235 57 526 5.3 190 354 71 615 5.3 74 296 96441 5.3 124 235 48 527 5.3 189 353 71 616 5.3 89 296 90442 5.3 139 235 42 528 5.3 191 355 71 617 5.3 86 296 91443 5.3 112 235 53 529 5.3 189 355 72 618 5.3 104 296 83444 5.3 13 235 96 530 5.3 199 355 68 619 5.3 89 296 90445 5.3 87 235 64 531 5.3 189 355 72 620 5.3 94 296 87446 5.3 28 235 90 532 5.3 100 296 85 621 5.3 124 296 74447 5.3 65 235 74 533 5.3 152 296 62 622 5.3 79 296 94448 5.3 87 235 64 534 5.3 197 355 69 623 5.3 79 296 94449 5.3 57 235 77 535 5.3 202 356 67 624 5.3 54 235 78450 5.3 34 235 87 536 5.3 152 296 62 625 5.3 49 235 81451 5.3 18 235 94 537 5.3 153 296 62 626 5.3 49 235 81452 5.3 16 235 95 538 5.3 103 296 84 627 5.3 124 322 86453 5.3 11 235 97 539 5.3 101 296 85 628 5.3 114 322 90454 5.3 12 235 97 540 5.3 115 296 78 629 5.3 109 299 82455 5.3 26 235 91 541 5.3 123 296 75 630 5.3 99 299 87456 5.3 12 235 97 542 5.3 151 296 63 631 5.3 99 298 86457 5.3 29 235 89 543 5.3 149 358 91 632 5.3 84 298 93458 5.3 49 235 81 544 5.3 153 296 62 633 5.3 69 298 99459 5.3 49 235 81 545 5.3 163 358 84 634 5.3 54 298 106460 5.3 47 235 81 546 5.3 182 358 76 635 5.3 64 298 101461 5.3 74 235 70 547 5.3 179 358 77 636 5.3 94 297 88462 5.3 85 235 65 548 5.3 197 357 70 637 5.3 64 298 101463 5.3 80 235 67 549 5.3 206 357 66 638 5.3 99 298 86464 5.3 49 235 81 550 5.3 209 357 64 639 5.3 94 298 88465 5.3 28 235 90 551 5.3 137 298 70 640 5.3 134 297 70466 5.3 28 235 90 552 5.3 104 322 94 641 5.3 119 297 77467 5.3 27 235 90 554 5.3 134 322 81 642 5.3 64 296 101468 5.3 61 235 75 555 5.3 119 322 88 643 5.3 84 296 92469 5.3 84 235 65 556 5.3 119 322 88 644 5.3 79 296 94470 5.3 27 235 90 557 5.3 134 322 81 645 5.3 74 296 96471 5.3 94 235 61 558 5.3 129 322 84 646 5.3 64 296 101472 5.3 90 235 63 559 5.3 124 322 86 647 5.3 74 296 96473 5.3 78 235 68 560 5.3 134 322 82 648 5.3 79 296 94474 5.3 75 235 69 561 5.3 134 322 82 649 5.3 79 296 94475 5.3 56 235 78 562 5.3 144 322 77 650 5.3 84 296 92476 5.3 85 235 65 563 5.3 154 322 73 651 5.3 79 296 94477 5.3 91 235 62 564 5.3 144 322 77 652 5.3 79 296 94478 5.3 93 235 62 565 5.3 144 322 77 653 5.3 74 296 96479 5.3 80 235 67 566 5.3 134 322 81 654 5.3 64 296 101480 5.3 68 235 73 567 5.3 144 322 77 655 5.3 89 296 90481 5.3 75 235 69 568 5.3 154 322 73 656 5.3 89 296 90482 5.3 73 235 70 569 5.3 109 322 92 657 5.3 49 296 107483 5.3 79 235 68 570 5.3 124 322 86 658 5.3 64 296 100484 5.3 56 235 78 571 5.3 154 322 73 659 5.3 89 235 63485 5.3 57 235 77 572 5.3 154 322 73 660 5.3 49 235 81486 5.3 54 235 78 573 5.3 154 322 73 661 5.3 54 235 78487 5.3 94 296 88 574 5.3 124 322 86 662 5.3 34 235 87488 5.3 82 296 93 575 5.3 154 321 73 663 5.3 124 298 75489 5.3 99 296 85 576 5.3 154 321 72 664 5.3 119 298 78490 5.3 80 296 94 577 5.3 199 321 53 665 5.3 129 298 73491 5.3 74 296 96 578 5.3 159 298 60 666 5.3 124 298 75492 5.3 65 296 100 579 5.3 174 298 54 667 5.3 141 298 68493 5.3 70 296 98 580 5.3 189 298 47 668 5.3 147 298 65494 5.3 74 296 96 581 5.3 194 298 45 669 5.3 149 298 65495 5.3 68 296 99 582 5.3 169 298 56 670 5.3 164 298 58496 5.3 67 296 99 583 5.3 184 298 49 671 5.3 169 298 56497 5.3 81 296 93 584 5.3 176 359 79 672 5.3 179 298 52
Page 47 of 48

City of Oak Harbor 2033 Peak Hour DemandWater System Plan Improved System with CIPsNovember 2013
IDDemand
(gpm)Elevation
(ft) Head (ft)Pressure
(psi) IDDemand
(gpm)Elevation
(ft) Head (ft)Pressure
(psi) IDDemand
(gpm)Elevation
(ft) Head (ft)Pressure
(psi)673 5.3 184 298 49 758 5.3 34 235 87 857 5.3 229 368 60674 5.3 135 298 71 759 5.3 24 235 92 858 5.3 209 368 69675 5.3 164 298 58 760 5.3 24 235 92 860 5.3 229 368 60676 5.3 209 368 69 761 5.3 34 235 87 862 5.3 199 359 69677 5.3 209 368 69 762 5.3 29 235 89 863 5.3 165 361 85678 5.3 214 368 67 763 5.3 29 235 89 864 5.3 194 289 41679 5.3 224 368 62 764 5.3 39 235 85 868 5.3 200 368 73680 5.3 229 368 60 765 5.3 14 235 96 869 5.3 114 322 90681 5.3 224 368 62 766 5.3 24 235 92 875 5.3 203 321 51682 5.3 224 368 62 767 5.3 40 321 122 880 5.3 81 296 93683 5.3 224 368 62 768 5.3 104 321 94 885 5.3 83 296 92684 5.3 234 368 58 769 5.3 84 321 103 887 5.3 82 296 93685 5.3 234 368 58 770 5.3 114 321 90 888 5.3 82 296 93686 5.3 234 368 58 771 5.3 119 321 88 889 5.3 124 321 85687 5.3 225 368 62 772 5.3 134 321 81 890 5.3 124 321 85688 5.3 164 368 89 773 5.3 174 321 64 896 5.3 124 321 85689 5.3 114 368 110 774 5.3 124 321 85 900 5.3 174 365 83690 5.3 169 368 86 775 5.3 139 321 79 901 5.3 181 366 80691 5.3 174 368 84 776 5.3 184 289 46 903 5.3 179 366 81692 5.3 154 368 93 777 5.3 154 359 89 919 5.3 245 362 51693 5.3 174 368 84 778 5.3 134 322 81 920 5.3 154 322 73694 5.3 164 368 88 779 5.3 144 321 77 923 5.3 184 367 79695 5.3 179 367 82 780 5.3 184 321 59 924 5.3 169 366 85696 5.3 179 367 82 781 5.3 194 321 55 925 5.3 89 296 90697 5.3 174 366 83 782 5.3 194 321 55 926 5.3 107 297 82698 5.3 224 362 60 783 5.3 134 321 81 927 5.3 119 322 88699 5.3 219 362 62 784 5.3 164 321 68 928 5.3 119 322 88700 5.3 194 362 73 785 5.3 164 321 68 929 5.3 83 235 66701 5.3 237 361 54 786 5.3 194 321 55 930 5.3 144 321 77702 5.3 199 362 71 787 5.3 174 321 64 931 5.3 80 321 104703 5.3 189 362 75 788 5.3 174 321 64 932 5.3 139 321 79704 5.3 179 362 79 789 5.3 169 321 66 933 5.3 164 321 68705 5.3 184 362 77 790 5.3 154 321 72 934 5.3 24 235 92706 5.3 204 362 69 791 5.3 134 321 81 935 5.3 184 321 59707 5.3 204 360 68 792 5.3 109 321 92 936 5.3 184 321 59708 5.3 204 360 68 793 5.3 109 321 92 937 1,000 177 324 64709 5.3 204 360 68 794 5.3 96 321 98 938 5.3 166 297 57710 5.3 204 360 68 795 5.3 94 321 98711 5.3 204 360 68 796 5.3 104 321 94712 5.3 209 360 66 797 5.3 114 321 90713 5.3 214 361 64 798 5.3 129 321 83714 5.3 204 361 68 799 5.3 129 321 83715 5.3 214 361 64 800 5.3 159 321 70716 5.3 219 361 62 801 5.3 144 321 77717 5.3 204 361 68 802 5.3 154 321 72718 5.3 234 361 55 803 5.3 164 321 68719 5.3 174 322 64 804 5.3 204 321 51720 5.3 174 322 64 805 5.3 204 321 51721 5.3 179 322 62 806 5.3 192 321 56722 5.3 169 322 66 808 5.3 129 295 72723 5.3 149 322 75 809 5.3 94 296 87724 5.3 174 322 64 810 5.3 74 235 70725 5.3 169 322 66 811 5.3 74 296 96726 5.3 154 322 73 812 5.3 67 235 73727 5.3 204 361 68 813 5.3 60 235 76728 5.3 204 361 68 814 5.3 172 361 82729 5.3 174 290 50 815 5.3 179 361 79730 5.3 194 290 42 816 5.3 56 290 101731 5.3 174 290 50 817 5.3 179 296 51732 5.3 194 290 41 818 5.3 242 362 52733 5.3 92 235 62 819 5.3 237 362 54734 5.3 139 294 67 820 5.3 204 360 68735 5.3 144 297 66 823 5.3 210 361 66736 5.3 114 296 79 824 5.3 211 361 65737 5.3 109 296 81 836 5.3 189 345 68738 5.3 104 296 83 837 5.3 204 368 71739 5.3 99 296 85 838 5.3 99 235 59740 5.3 94 296 88 839 5.3 169 298 56741 5.3 104 296 83 840 5.3 199 359 69742 5.3 174 365 83 841 5.3 164 359 84743 5.3 104 297 83 842 5.3 24 235 92744 5.3 184 367 79 843 5.3 214 368 67745 5.3 144 297 66 844 5.3 225 368 62746 5.3 154 297 62 845 5.3 247 368 52747 5.3 219 361 62 846 5.3 248 368 52748 5.3 199 360 70 847 5.3 224 368 62749 5.3 204 360 68 848 5.3 105 321 94750 5.3 204 360 68 849 5.3 229 368 60751 5.3 199 360 70 850 5.3 244 368 54752 5.3 184 360 76 851 5.3 248 368 52753 5.3 74 235 70 852 5.3 248 368 52754 5.3 104 235 57 853 5.3 224 368 62755 5.3 19 235 94 854 5.3 224 368 62756 5.3 19 235 94 855 5.3 224 368 62757 5.3 29 235 89 856 5.3 224 368 62
Page 48 of 48

APPENDIX P
WATER CONSERVATION PROGRAM


RESOLUTION NO. 2001-08 RESOLUTION OUTLINING THE CITY OF OAK HARBOR'S WATER SHORTAGE RESPONSE PLAN BE IT RESOLVED by the City Council of the City of Oak Harbor as follows:
INDEX Section One. Non-essential water uses. Section Two. Public education and notification. Section Three. Authorization. Section Four. Application. Section Five. Definitions. Section Six. Triggering criteria for initiation and termination of drought response stages. Section Seven. Variances. Section Eight. Notification. Section One. Non-essential water uses. Water uses regulated or prohibited under this article (hereinafter referred to as the "Water Shortage Plan" or the "Plan") are considered to be non-essential and continuation of such uses during times of water shortage or other emergency water supply conditions are deemed to constitute a waste of water which subjects the offender(s) to penalties as defined in this Plan. Section Two. Public education and notification. (1) City will provide public notification. The City, by and through its Department of Public Works,
shall periodically provide the public with information about the Plan, including information about the conditions under which each stage of the Plan is to be initiated or terminated, and the drought response measures to be implemented in each stage.
(2) Drought conditions - Responses requiring notification. When drought contingency measures
appear to be necessary, the public will be notified through available news media, and additional information on water conservation methods will be distributed. In the event that a trigger condition is reached, the public will be kept fully informed of the status of the drought condition through all available media.
(3) Trigger conditions requiring notification. When a trigger condition has been reached and the
City of Anacortes Water Department informs the City of Oak Harbor that drought contingency measures may be necessary, the Mayor or his/her designee will order the initiation of a public notification process. The public notification process will include, but is not limited to the following:
(a) A notice of drought condition will be posted at City Hall, the Post Office, and the
Library. (b) The notice will be circulated to local newspapers and radio stations via Public
Service Announcement.

(c) Information regarding the contingency measures for the drought condition will be mailed to all water customers by means of utility bill inserts or door-to-door and posted on the City's web page.
(4) When temporary emergency water shortage, due to major water system component failure or
supply source contamination, measures appear to be necessary the public will be notified through available media and/or door-to-door as deemed appropriate by the Mayor or his/her designee.
Section Three. Authorization. The Mayor, or his/her designee, is hereby authorized and directed to implement the applicable provisions of the Plan upon determination that such implementation is necessary to protect public health, safety, and welfare. The Mayor or his/her designee shall have the authority to initiate or terminate drought or other water supply emergency response measures as described in this Plan. Section Four. Application. The provisions of this Plan shall apply to all persons, customers, and property using water provided by the City of Oak Harbor. The terms "person" and "customer" as used in the Plan include individuals, corporations, partnerships, associations, and all other legal entities including the U.S. Navy, North Whidbey Water District and Deception Pass State Park. Section Five. Definitions. For the purposes of this Plan, the following definitions shall apply: (1) Aesthetic water use means water use for ornamental or decorative purposes such as fountains,
reflecting pools, and water gardens. (2) Commercial and institutional water use means water use, which is integral to the operations of
commercial and non-profit establishments and governmental entities such as retail establishments, hotels and motels, restaurants, and office buildings.
(3) Conservation means those practices, techniques, and technologies that reduce the consumption
of water, reduce the loss or waste of water, improve the efficiency in the use of water or increase the recycling and reuse of water so that a supply is conserved and made available for future or alternative uses.
(4) Customer means any person, company, or organization using water supplied by the City of Oak
Harbor. (5) Domestic water use means water use for personal needs or for household or sanitary purposes
such as drinking, bathing, heating, cooking, sanitation, or for cleaning a residence, business, industry, or institution.
(6) Even number address means street addresses ending in 0, 2, 4, 6, or 8, and locations without
addresses. (7) Odd numbered address means street addresses ending in 1, 3, 5, 7, or 9. (8) Industrial water use means the use of water in processes designed to convert materials of lower
value into forms having greater usability and value.

(9) Landscape irrigation use means water used for the irrigation and maintenance of landscaped areas, whether publicly or privately owned, including residential and commercial lawns, gardens, golf courses, parks, and rights-of-way and medians.
(10) Non-essential water use means water uses that are not essential nor required for the protection of
public, health, safety, and welfare, including: (a) Irrigation of landscape areas, including parks, athletic fields, and golf courses, except as
otherwise provided under this Plan. (b) Use of water to wash any motor vehicle, motorbike, boat, trailer, airplane or other vehicle. (c) Use of water to wash down any sidewalks, walkways, driveways, parking lots, tennis courts, or
other hard-surfaced areas. (d) Use of water to wash down buildings or structures for purposes other than immediate fire
protection. (e) Flushing gutters or permitting water to run or accumulate in any gutter or street. (f) Use of water to fill, refill, or add to any indoor or outdoor swimming pools or Jacuzzi-type pools. (g) Use of water in a fountain or pond for aesthetic or scenic purposes except where necessary to
support aquatic life. (h) Failure to repair a controllable leak(s) within a reasonable period after having been given notice
directing the repair of such leak(s). (i) Use of water from hydrants for construction purposes or any other purposes other than fire
fighting. Section Six. Triggering criteria for initiation and termination of drought response stages. The City of Oak Harbor purchases 99.8 percent of its potable water from the City of Anacortes. Availability of water from the City of Anacortes is based on the height of the Skagit River at the water treatment plant. Therefore, the emergency water management triggering measures will be the same as those of the City of Anacortes. Also, triggering criteria may be initiated as a result of short-term deficiencies and/or emergencies specific to the City of Oak Harbor. The following are the triggering criteria for initiation and termination of drought response stages: (1) Stage 1: Water Treatment Plant Capacity Reduction (Potential for Future Drought
Conditions Exist). A Stage 1 drought response will be implemented when there is a potential for future drought conditions due to a reduction in the water treatment plant capacity or in the water source capacity.
(a) Triggering Criteria. River height flow less than 10 feet and 10400 cubic feet per second (cfs)
and above 9 feet and 8050 cubic feet per second (cfs); the raw water conditions are such that the treatment plant is unable to produce water of high quality.
(b) Response.

(i) Install conservation condition signs. (ii) Accelerate public information efforts to teach and encourage reduced water use. (iii) Request voluntary conservation action by customers.
(C) Notify major water users and work with them to achieve voluntary water use reduction.
(v) Request a reduction in landscape watering by City government. (c) Termination Criteria. All initiated actions will remain in effect until the conditions that triggered
Stage 1 have been alleviated. (2) Stage 2: Limited Supply Capacity (Drought is Highly Likely in the Immediate Future). A
Stage 2 drought response will be implemented when drought conditions are highly likely in the immediate future due to a reduction in the water source capacity, the quality of the water source has been diminished, or there are other limitations on the ability of the treatment plan to produce high quality water.
(a) Triggering Criteria. River height flow less than 9 feet and 8050 cfs and above 8 feet and 5760
cfs; the raw water conditions are such that the treatment plant is unable to produce water of high quality; the raw water source level is reduced, requiring the plant flow to be reduced; or structural/operational problems within the treatment plant requiring flow reduction.
(b) Response. (i) Install conservation condition signs. (ii) Start aggressive public information efforts regarding water supply conditions and
conservation efforts. Efforts will include but not be limited to providing water conservation literature to the public.
(iii) Cease all flushing and flow testing of pipes. (iv) Reduce irrigation of all City parks, greenbelts and facility landscaping. (v) Cease all "wet" fire drills. (vi) Request voluntary restriction of hosing off of paved areas, sidewalks, buildings or
windows; operation of ornamental fountains, draining of swimming pools followed by refilling, washing or rinsing of vehicles by hose without a shutoff valve, using water in such a manner as to allow runoff or other water waste.
(C) Mandatory restrictions on landscape watering for commercial and residential and
government services bearing odd numbered addresses to water on odd numbered days and even numbered addresses to water on even numbered days. Where there are no numbers, a number will be assigned and/or watering will be conducted on even numbered days.

(viii) Allow watering between 8:00 p.m. and 9:00 a.m. Prohibit watering outside these hours. (d) Enforcement. Violations of restrictions will result in a warning, and then a citation may be
issued with a fine not to exceed $250.00 per incident as per ordinance. (e) Termination Criteria. All initiated actions will remain in effect until the conditions that triggered
Stage 2 have been alleviated. (3) Stage 3: Severe/Critical Water Supply Shortage (Drought Condition Emergency Exists). A
Stage 3 drought response will be implemented when a drought condition emergency exists due to a severe reduction in the water source or quality of the water source or in the event of catastrophic damage to the treatment plant.
(a) Triggering Criteria. River level below 8 feet or 5760 cfs; the raw water source is extremely poor;
or catastrophic damage (earthquake, flood etc.) has occurred. (b) Response. (i) The City shall take all measures necessary to reduce water consumption and use and
obtain additional water supplies from surrounding purveyors to the extent possible.
(ii) Cease all municipal park irrigation. (iii) Prohibit all residential, commercial and government lawn watering. (iv) Eliminate all flushing and flow testing of pipes except to protect public health. (v) Notify Oak Harbor School District to cease irrigation of school property and playgrounds
immediately. (vi) Eliminate water service to all public restrooms and non-essential facilities. (vii) Mandatory curtailment of all non-essential water use. (viii) Establish customer categories for water allocation. (ix) Require commercial and residential water users to reduce water consumption by a
percentage. (x) Impose mandatory maximum water rationing for different customer categories. (xi) Coordinate with law enforcement officials and City crews for enforcing mandatory water
restrictions. (xii) Notify the public of the seriousness of the situation. Public notification will include both
mass media and/or door-to-door. Notification will inform customers of their customer class, rationed water consumption, enforcement measures and effective means of reducing water usage.

(c) Enforcement. Violations of restrictions will result in a warning, and then a citation may be issued with a fine not to exceed $250.00 per incident as per ordinance.
(d) Termination Criteria. All initiated actions will remain in effect until the conditions that triggered
Stage 3 have been alleviated. (4) Stage 4: Temporary Emergency Water Shortage. A Stage 4 drought response will be
implemented when there is a temporary water shortage due to failure of the water distribution system or there are supply contamination concerns that require special precautions.
(a) System outage due to major water system components failure. (i) Triggering Criteria. System outage or restrictions due to major water system
components failure in the City's transmission/distribution system. (ii) Response. (A) Initiate or continue implementation of appropriate restrictions from
previous conditions as directed by the Mayor or his/her designee. (B) Affected commercial and residential water users will be required to reduce
water consumption by a percentage determined by the Mayor or his/her designee.
(b) Supply source contamination special precautions. (i) Triggering Criteria. Water system contamination caused by low distribution pressures
(below 20 psi), repeated unacceptable microbiological samples, or failure to maintain adequate chlorine residuals. In the event of such contamination, the affected area shall be isolated from the distribution system immediately and special precautions shall be taken in accordance with Washington State Board of Health Drinking Water Regulations (WAC 246-290).
(ii) Response. (A) Water customers in the affected area shall be notified immediately with a "Boil
Water Notice" and a letter explaining the situation and containing recommendations to the water customer regarding the use of bottled water. Hand deliver "Boil Water Notices" to all water customers affected.
(B) Prohibit all water usage for human consumption in the affected area for 24 to 36
hours, as determined by the Mayor or his/her designee. (c) Enforcement. Violations of restrictions will result in a warning, and then a citation may be
issued with a fine not to exceed $250.00 per incident as per ordinance. (d) Termination Criteria. All initiated actions will remain in effect until the conditions that triggered
Stage 4 have been alleviated. If Stage 4 is initiated because of water supply contamination, all initiated actions will remain in effect until the Mayor or his/her designee determines that conditions exist which will allow removal of Stage 4 actions.

Section Seven. Variances. (1) The Mayor or his/her designee may, in writing, grant temporary variances for existing water uses
otherwise prohibited under this Plan if it is determined that failure to grant such a variance would cause an emergency condition adversely affecting the health, sanitation, or fire protection for the public or the person requesting such variance, and if one or more of the following conditions are met:
(a) Compliance with this Plan cannot be technically accomplished during the duration of the water
supply shortage or other condition for which the Plan is in effect. (b) Alternative methods can be implemented which will achieve the same level of reduction in water
use. (2) Persons requesting an exemption from the provisions of this article shall file a petition for a
variance with the City within 5 days after the Plan or a particular drought response stage has been invoked. All petitions for variances shall be reviewed by the Mayor, or his/her designee, and shall include the following:
(a) Name and address of the petitioner(s). (b) Purpose of water use. (c) Specific provision(s) of the Plan from which the petitioner is requesting relief. (d) Detailed statement as to how the specific provision of the Plan adversely affects the
petitioner or what damage or harm will occur to the petitioner or others if petitioner complies with this article.
(e) Description of the relief requested. (f) Period of time for which the variance is sought. (g) Alternative water use restrictions or other measures the petitioner is taking or proposes to
take to meet the intent of this Plan and the compliance date. (h) Other pertinent information as may be required by the Mayor or his/her designee.
(3) Variances granted by the Mayor or his/her designee shall be subject to the following conditions,
unless waived or modified by the Mayor or his/her designee: (a) Variances granted shall include a timetable for compliance. (b) Variances granted shall expire when the Plan is no longer in effect, unless the petitioner has
failed to meet specified requirements. (c) No variance shall be retroactive or otherwise justify any violation of the Plan occurring prior to
the issuance of the variance.

Section Eight. Notification. (C) Public Works Superintendent's Duty. The Public Works Superintendent shall notify the Mayor if
any of the water shortage response stages are implemented. Notification by telephone is adequate to provide immediate information about the shortage, however a formal notification by memorandum is required. The information in the notification shall include:
(a) Nature and extent of the water shortage. (b) Identification of the stage of response. (c) Proposed or initiated conservation measures. (d) Corrective measures being taken. (e) Expected duration of the water shortage.
(2) Notice requirements. Public notification of a water shortage, by mass media and/or door-to-
door, will be essential and shall include the seriousness of the situation and the necessary conservation measures that must be taken. It will also include their customer class, rationed water consumption, enforcement measures and effective means of reducing water usage.
(3) Notification mediums. (a) Mass Media. Television and radio broadcasting stations, newspapers, paid advertisements,
public service announcements, and City web page. (A listing of all local television and radio broadcasting and newspaper publishers is provided in Table 1.)
(b) Material Distribution. Direct mailing of newsletters and conservation brochures, and/or an area-
wide distribution of conservation brochures, posters, and other printed material. (c) Customer Contact. Direct contact of consumers, especially large water users, to coordinate water
conservation. (d) Interdepartmental Coordination. Communication within City of Oak Harbor Departments
regarding water conservation measures to be taken. (4) Notification Responses. The following is an outline of the appropriate notification medium that
should be utilized for each stage of the Response Plan.
(C) Stage 1: Water Treatment Plant Capacity Reduction (Potential for Future Drought Conditions Exist) Public notification is not necessary at this stage.
(i) Interdepartmental coordination. (A) Interdepartmental Coordination: the Water Division shall request all City
departments to reduce watering lawns and shrubs within the City. (b) Stage 2: Limited Supply Capacity (Drought is Highly Likely in the Immediate Future)

(i) Mass Media. (A) News releases shall be distributed to the local television and radio broadcasting
stations and newspaper publishers to inform the public of the water shortage and ask for voluntary reduction in outdoor water use.
(B) Information will be provided on methods of outdoor water conservation to
newspaper publishers. (ii) Material Distribution. (A) Make water conservation brochures available to the public and post water
conservation posters around the City. (iii) Customer Contact. (A) Negotiate with major customers to cut back their demands on the water system. (iv) Interdepartmental Coordination. (A) Instruct the Parks Division to restrict watering within parks and all public
greenbelts. (c) Stage 3: Severe/Critical Water Supply Shortage (Drought Condition Emergency Exists) (i) Mass Media. (A) News releases shall be distributed to the various television and radio broadcasting
stations and newspaper publishers to inform the public of the water storage, explaining mandatory restrictions of outdoor water use, outlining fines and enforcement measures, and encouraging indoor water conservation.
(B) Provide information on methods of both indoor and outdoor water conservation to
newspaper publishers. (ii) Material Distribution. (A) Make water conservation brochures available to the public and post water
conservation posters around the City. (iii) Customer Contact. (A) Contact large water use customers and encourage them to develop water
conservation measures. (iv) Interdepartmental Coordination. (A) Instruct the Parks Division to restrict watering within parks and all public
greenbelts.

(B) Coordinate with local Police and Fire Departments, and City water crews for
enforcement of mandatory water restrictions. (C) Advise the Fire Department of any possible reduction in fire-fighting capabilities. (d) Stage 4: Temporary Emergency Water Shortage (i) Mass Media. (A) News releases shall be distributed to the various television and radio broadcasting
stations and newspaper publishers to inform the public of the water shortage, explaining water rationing and customer classes, outlining fines and enforcement measures, and providing information on water conservation.
(B) Use the public service announcement to keep the public informed of the situation
and any changes that occur. (ii) Material Distribution. (A) Make water conservation brochures available to the public and post water
conservation posters around the City. (iii) Customer Contact. (A) Conduct public meetings to explain the water shortage situation and to answer any
questions. (B) Contact large industrial water users require reduction of water consumption by a
percentage determined by the Mayor or his/her designee. (C) Eliminate service to non-essential water users. (iv) Interdepartmental Coordination. (A) Instruct the Parks Division to restrict all irrigation and to close all public
restrooms. (B) Coordinate with local Police and Fire Departments, and City water crews for the
enforcement of mandatory water restrictions and water rationing.
(C) Advise the Fire Department of a possible reduction in system pressures and fire fighting capabilities.

TABLE 1
TELEVISION AND RADIO BROADCASTING STATIONS
KOMO-TV 206-404-4000 KING-TV 206-448-5555 KIRO-TV 206-728-7777 KVOS-TV 360-671-4500 KAPS Radio 360-424-7676 KBRC Radio 360-424-1430 KING Radio 206-448-3981 KLKI Radio 360-293-3141 KIRO Radio 206-726-7000 KOMO Radio 206-223-5700 NON-BROADCASTING MEDIA Whidbey News Times 360-675-6611 Skagit Valley Herald 360-424-3251 Anacortes American 360-293-3122 Department of Health 253-395-6751 Department of Ecology 425-649-7000 Island County Health Department 360-679-7350 Island County Emergency Services 360-678-4422 Skagit County Health Department 360-336-9380 Skagit County Emergency Services 360-428-3250 Oak Harbor Police/Fire Departments 360-679-5551 Oak Harbor Public Works 360-240-6443 Oak Harbor's Channel 10 360-679-5551 Oak Harbor's Web Page www.oakharbor.org

PASSED and approved by the City Council this 7th day of August , 2001. THE CITY OF OAK HARBOR Patricia Cohen Mayor Attest: Rosemary Morrison
City Clerk Approved as to Form: Phillip Bleyhl
City Attorney

APPENDIX Q
WATER USE EFFICIENCY PROGRAM INFORMATION


APPENDIX R
WELLHEAD PROTECTION PROGRAM

CITY OF OAK HARBOR, WA
Wellhead Protection Program
WA DOH ID #62650C
A. REQUIREMENT FOR PROGRAM
Section 1428 of the 1986 Amendments to the Federal Safe Drinking
Water Act mandates that every state develop a wellhead protection
program. The Washington Department of Health is designated lead
agency for wellhead protection program development and
administration. The Safe Drinking Water Act requires that all
federally defined public water systems (Group A systems) using
groundwater as their source implement a wellhead protection
program. The minimum elements of a program required by the
Washington Department of Health are:
Make a susceptibility assessment of each well to
contamination through poor construction, lack of a confining
layer (e.g., clay), etc.
Calculate the delineation for each well of the time of travel
boundaries (1, 5, and 10 year) of a potential contaminant in
groundwater. The 10 year travel boundary is the wellhead
protection area (WHPA) boundary.
Make a vulnerability assessment of all actual and potential
groundwater contamination sources located within the
delineated WHPA boundary.
Develop a wellhead protection management program that
includes the following:
... public education to increase awareness of the threats
of groundwater contamination; the program must include
all owners/operators of actual or potential sources of
contamination within the WHPA boundaries,
... monitoring for activities that contribute to the risk
of groundwater contamination, e.g., underground
commercial storage tanks, hazardous waste
transportation and disposal, etc.
... water conservation to reduce the rate of [potential]

contaminant transportation in groundwater
... regulations to control the application, transportation
and disposal of hazardous wastes (chemicals and
sewerage) that may contaminant groundwater, and other
activities that may increase the susceptibility of
aquifer contamination (e.g., private wells, septic
tanks)
... water quality monitoring of the raw water supply to
provide early warning of groundwater contamination.
Develop a contingency plan for alternate water supplies.
Inclusion of public participation while the program is
developing.
B. DESCRIPTION OF GROUNDWATER SOURCES
The City operates three wells, designated Wells No. 8, 9 and 11,
in the area of Heller Road and Whidbey Avenue. The wells lie in a
north-south alignment, within a distance between the most
northerly and southerly wells of 2,400 feet. The wells draw water
from the same aquifer, but are not designated a well field under
WA DOH criteria because of the lack of a common tap for collection
of a water sample. The wells can be described as follows:
Well Well Well
No. 8 No. 9 No. 11
________ ________ ________
WA DOH Source No. SO11 SO12 SO14
Surface elevation: 340 ft 312 ft 297 ft
Depth: 250 ft 245 ft 160 ft
Static level: 191 ft 175 ft 172 ft
Date of Construction: 1961 1961 1977
Casing: 8-inch 10-inch 8-inch
Production rate: 166 gpm 160 gpm 160 gpm
The aquifer supplying the wells consists primarily of sand and
gravel, interspersed with several thin lenses of clay, having one
clay layer exceeding 30 feet in thickness immediately above the
water bearing strata.
All three wells area operated as standby (emergency) sources.
C. PROGRAM OBJECTIVE

The objectives of the wellhead protection program are:
1) to reasonably reduce the risk of contamination of the
groundwater supplying the City of Oak Harbor's well sources,
and
2) with other utilities, cooperate and support the Island County
aquifer protection program.
D. RELATED PROGRAMS
The above noted components of a wellhead protection program
overlap the activities of other City and Island County programs.
These activities can be summarized as follows:
The disposal of chemicals in public sewers is regulated by
the City through Ordinance (No. 14.01-14.20). The regulation
of matter to be excluded from public sewers is mandated, in
part, by the National Pollutant Discharge Elimination System
(NPDES) permit for the operation of the City's wastewater
treatment plant.
Illicit discharge to stormwater drainage systems is regulated
by the City through the Stormwater Management Ordinance (No.
12:30.330).
The disposal of hazardous chemicals in general, is regulated
by Island County, Chapter 8.08A I.C.C. through the exercise
of the Board of Health function established through Chapter
70.05 of the Revised Code of Washington. The regulations
include collection and storage household hazardous wastes and
moderate-risk waste .
Groundwater resource (aquifer) protection regulations are
enforced by Island County, Chapter 8.09. I.C.C.
On-site sewerage disposal systems are regulated by Island
County, Chapter 8.07B I.C.C. and by the City through the
Sewer Ordinance (No. 14.04.200).
E. PROGRAM OPERATION
Management and Inspection
The above regulation of the disposal of hazardous wastes and other
matter, include the common activities of inspection, education and

enforcement. For efficiency, and greater public understanding of
the need to comply with regulations, the City will coordinate
whenever possible all related regulatory actions involving private
property owners.
The wellhead protection program management is assigned to Public
Works Superintendent.
The wellhead protection program management is coordinated with the
private property inspection done by the City's Building Inspector.
The Building Inspector monitors for building activities that
contribute to the risk of groundwater contamination, such as the
installation or removal of underground storage tanks.
Hazardous waste disposal activities are coordinated with Island
County, Solid Waste Coordinator of Hazardous Waste.
Transportation of hazardous waste is coordinated with the City's
Fire Department.
For activities under Island County jurisdiction within the City
limits, the coordination includes joint inspection with County
staff, and/or the County's timely reporting of activities to the
City.
Public Involvement and Education
Because of the very limited extent of the wellhead protection
area, compared with the total area of the City, development of the
wellhead protection program included direct public involvement
only through the pubic attendance at City Council meetings.
Enforcement of regulations will be preceded by public education.
Because the repeated inspection of all property in the wellhead
protection area is not cost effective, public education will be
the primary means of obtaining compliance with regulations. For
example, the residential "best management practices" in the
Stormwater Program Guidance Manual for the Puget Sound Basin
recommends public education for "good housekeeping" practices.
Public education will be divided into the following three tasks:
1) Island County Cooperative Extension/Washington State
University Beach Watchers Program
The City will utilize the existing public education program
developed by the WSU Beach Watchers. This program combines
the topics of prevention of contamination of stormwater and

groundwater.
The program completed to date, and to be continued by the WSU
Beach Watchers, includes the following:
The development of an educational display that features
photographs depicting different forms of pollutants. It
gives solutions and alternatives to use of common
household "hazardous" chemicals. The display was first
used at the Penn Cove Water Festival in May, 1995. It
will continue to be used at other public events.
Because the display is too big for some places, a
smaller table-top display was also developed. The
smaller display has been set up at libraries, local
banks, etc.
Several brochures have been developed or were obtained
for distribution at the above displays. These include:
... Construction Best Management Practices
... Stormwater Runoff Information
... Informational Quiz (for schools)
... Business & Household Hazardous Waste (County's
Solid Waste Program)
A series of evening lectures by the WSU Beach Watcher's
"Home-Asyst" program included presentations on
watershed and wellhead protection, and hazardous waste
disposal.
2) Distribution of General Information Brochures
Brochures pertaining to the prevention of groundwater
contamination will be periodically included with utility
bills. (see Attachment `A')
3) Distribution of Notification Letters
All property owners in the wellhead protection area
boundaries will receive a letter notifying them of the
presence of the wells and the need to prevent groundwater
contamination. (see Attachment `B')
Delineation and Inventory

The wellhead protection areas were delineated using the
"Calculated Fixed Radius" method set forth in the WA Department of
Health "Ground Water Contamination Susceptibility Assessment
Survey Forms", (see Attachment `C'). For the City's operating
wells, designated Wells No. 8, 9 and 11, the delineation area for
inspection for sources of contamination is limited to a small area
of the City (see map, attachment `D'). The land use in the
wellhead protection area is entirely single family residential and
municipal (see map, attachment `E').
Because of the limited size of the delineated wellhead protection
area initially calculated by the fixed radius method, and the
predominant single family residential land use within and
surrounding the area, a more detailed delineation (e.g., using the
EPA analytical model GPTRAC to define the capture zone) was not
scheduled for the foreseeable future. A more detailed delineation
is planned only when the use of the wells is changed from standby
to supplemental supply.
The inventory of potential sources of groundwater contamination in
and around the delineated wellhead protection areas was made using
the WA DOH "Ground Water Contamination Susceptibility Assessment
Survey Forms" (see attachment `C'). The "other" potential sources
(Part V of the form) within the five year time of travel were
identified as
parks with playground equipment
abandoned private well near Well No. 8
Water Quality Monitoring
The wells are operated at least once per month for a period of 4
hours or longer.
The WA Department of Health susceptibility rating for the wells is
low for Synthetic Organic Compounds (SOC). The monitoring
requirement for the 1993-1995 Compliance period was 1 quarter of
Volatile Organic Chemicals (VOC) monitoring. No VOCs were
detected at levels above the MCL in the first set of samples.
Contingency Plan
The City's primary source of water is from a surface supply
purchased from the City of Anacortes. The production from the
City's wells is for standby (emergency) use only. The present
surface water supply is adequate to meet the maximum day demand of

the City.
The contingency plan for the detection of a contaminant in a well
supply, includes the following:
1) if necessary, implement the City's Water Shortage Response
Plan to reduce water demand;
2) assess the impact of the contaminant on water quality;
determine if water treatment will allow the continued use of
the contaminated well, and if necessary;
3) proceed with the acquisition of a replacement well, utilizing
condemnation procedures if required.
The aquifer in the service area southwest and northeast of City
has adequate recharge for additional sources of withdrawal to
replace a City well. If necessary, the City has the resources to
obtain short-term financing for the level of expenditure needed to
either install water treatment or replace a well.
Spill Response Plan
The Oak Harbor Fire Department is the lead agency in spill
response. The Fire Department has information of the delineated
wellhead protection area, and includes in their response
procedures contacting the Water Department. Their incident and
spill response plans address the protection of the wells (see
Attachment `F').

F. PROGRAM SCHEDULE
Task Scheduled Completion
__________________________________ ____________________
Public participation completed
Susceptibility assessment completed
Initial delineation of WHPA completed
Refined delineation of WHPA not scheduled
until well use
increases from
standby to
supplemental
status
Initial vulnerability assessment completed
Detailed vulnerability assessment completed
Education program development in progress
Monitoring ongoing
Contingency plan completed
Development of regulations completed
Spill response completed
G. REFERENCE MATERIAL
The following publications should be retained by the City as
references for its wellhead protection program:
"Wellhead Protection Program", December 1993,
Washington Department of Health
"Protecting Local Ground-Water Supplies Through
Wellhead Protection", May 1991, US Environmental
Protection Agency (publication EPA 570/9-91-007)

List of Attachments
A Brochures for public education
B Form letter, notifying residents in WHPA of presence of
wells, and need to prevent groundwater contamination
C Completed "Ground Water Contamination Susceptibility
Assessment Survey Forms", with list of potential
groundwater contaminant sources for each well
D Map of wellhead protection areas with delineation for
each well using the "Calculated Fixed Radius" method
E Land use map for area within and around wellhead
protection areas
F Portion of the Fire Department's incident and spill
response plan pertaining to the protection of the
City's wells

CITY OF OAK HARBOR, WA
WELLHEAD PROTECTION PROGRAM
... sample form letter ...
Dear Water Customer,
PROTECTION OF CITY WELLS
Although you may be aware that the City of Oak Harbor purchases
water from the City of Anacortes, you may not be aware that the
City operates wells to supplement this supply. One of the City's
wells is located within 1,000 feet of your property.
To prevent contamination of the groundwater supplying the wells,
it is important that residents take care to properly dispose of
all hazardous wastes. Hazardous wastes include household cleaning
products, paint, anti-freeze, weed and bug killers, old batteries,
to name a few.
To reduce the risk of chemicals contaminating groundwater:
avoid applying hazardous chemicals outside during rainy
weather,
follow the instructions on the use of chemicals, and use only
enough to get the job done,
try to use non-toxic alternatives whenever possible,
properly store all chemicals to prevent spillage, and
properly dispose of all containers and unused portions.
Your care in the use and disposal of household chemicals will help
protect the water you drink, and will also help reduce the
pollution of the stormwater runoff into Puget Sound.
For more information about the use and disposal of hazardous
chemicals, please contact:
Island County Solid Waste
Attention Jerry Mingo
(360) 678-3328
For more information about our wellhead protection program, please
feel free to call Mr. Rich Tyhuis at 679-5551.

CITY OF OAK HARBOR, WA
WELLHEAD PROTECTION PROGRAM
11
Your cooperation will be most appreciated.
B

APPENDIX S
EMERGENCY RESPONSE MANUAL

EMERGENCY RESPONSE PLAN INTRODUCTION The City has created a DRAFT Emergency Response Plan (“Plan”) for use during emergencies relating to the water system. The Plan contains valuable information about the water system, instructions on notifying the appropriate authorities during various types of emergencies, and recommendations for actions to be taken to minimize the effect of the emergency on the remaining portions of the water system. The City is currently in the process of modifying the DRAFT Plan and tailoring it to its specific needs. After completion, the Plan will be reviewed and approved by the appropriate City administration prior to finalization. The City maintains several copies of the Plan at its Public Works Facility, and copies are also distributed to various utility departments within the City. The section below highlights some of the topics covered in the Plan. PLAN TOPICS The DRAFT Emergency Response Plan covers the following topics:
- How to use this Plan - Who has a copy of the Plan - Water system description - Responding to willful/deliberate acts - Emergency response team command - Locate request procedure - Public drinking water program emergency notification form - Water distribution system emergencies - Water source emergencies - Water treatment emergencies

APPENDIX T
DETAILED COST ESTIMATES
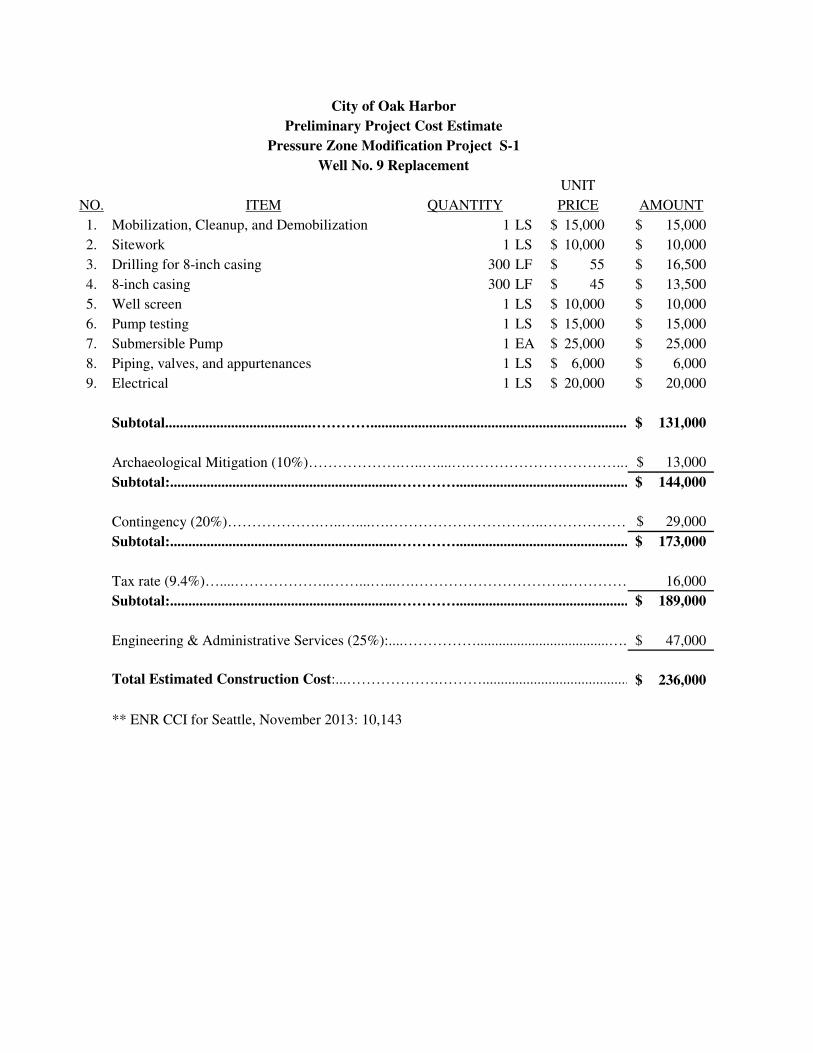
City of Oak Harbor
Preliminary Project Cost Estimate
Pressure Zone Modification Project S-1
Well No. 9 Replacement
UNIT
NO. ITEM QUANTITY PRICE AMOUNT
1. Mobilization, Cleanup, and Demobilization 1 LS 15,000$ 15,000$
2. Sitework 1 LS 10,000$ 10,000$
3. Drilling for 8-inch casing 300 LF 55$ 16,500$
4. 8-inch casing 300 LF 45$ 13,500$
5. Well screen 1 LS 10,000$ 10,000$
6. Pump testing 1 LS 15,000$ 15,000$
7. Submersible Pump 1 EA 25,000$ 25,000$
8. Piping, valves, and appurtenances 1 LS 6,000$ 6,000$
9. Electrical 1 LS 20,000$ 20,000$
Subtotal........................................…………........................................................................................131,000$
Archaeological Mitigation (10%)……………….…..…....….…………………………..………………………….13,000$
Subtotal:..............................................................…………..................................................................144,000$
Contingency (20%)……………….…..…....….…………………………..………………………….29,000$
Subtotal:..............................................................…………..................................................................173,000$
Tax rate (9.4%)…....………………..……...…...….…………………………..………………………….16,000
Subtotal:..............................................................…………..................................................................189,000$
Engineering & Administrative Services (25%):....……………....................................…..............………….47,000$
Total Estimated Construction Cost:...……………….……….......................................................236,000$
** ENR CCI for Seattle, November 2013: 10,143

City of Oak Harbor
Preliminary Project Cost Estimate
Pressure Zone Modification Project S-3
Eastside Reservoir Demolition
UNIT
NO. ITEM QUANTITY PRICE AMOUNT
1. Mobilization, Cleanup, and Demobilization 1 LS 15,000$ 15,000$
2. Sitework 1 LS 5,000$ 5,000$
3. Demolition of Existing Structure 1 LS 10,000$ 10,000$
4. Material Removal and Wastehauling 900 TN 20$ 18,000$
5. Landscape Restoration 1 LS 5,000$ 5,000$
Subtotal........................................…………........................................................................................53,000$
Archaeological Mitigation (15%)……………….…..…....….…………………………..………………………….8,000$
Subtotal:..............................................................…………..................................................................61,000$
Contingency (20%)……………….…..…....….…………………………..………………………….12,000$
Subtotal:..............................................................…………..................................................................73,000$
Tax rate (9.4%)…....………………..……...…...….…………………………..………………………….7,000
Subtotal:..............................................................…………..................................................................80,000$
Engineering & Administrative Services (25%):....……………....................................…..............………….20,000$
Total Estimated Construction Cost:...……………….……….......................................................100,000$

City of Oak Harbor
Preliminary Project Cost Estimate
Pressure Zone Modification Project S-4
Emergency Supply Well
UNIT
NO. ITEM QUANTITY PRICE AMOUNT
1. Mobilization, Cleanup, and Demobilization 1 LS 15,000$ 15,000$
2. Sitework 1 LS 10,000$ 10,000$
3. Drilling for 12-inch casing 300 LF 63$ 18,900$
4. 12-inch casing 300 LF 53$ 15,900$
5. Well screen 1 LS 13,000$ 13,000$
6. Pump testing 1 LS 15,000$ 15,000$
7. Submersible Pump 1 EA 30,000$ 30,000$
8. Piping, valves, and appurtenances 1 LS 8,000$ 8,000$
9. Electrical 1 LS 20,000$ 20,000$
Subtotal........................................…………........................................................................................146,000$
Archaeological Mitigation (25%)……………….…..…....….…………………………..………………………….37,000$
Subtotal:..............................................................…………..................................................................183,000$
Contingency (20%)……………….…..…....….…………………………..………………………….37,000$
Subtotal:..............................................................…………..................................................................220,000$
Tax rate (9.4%)…....………………..……...…...….…………………………..………………………….21,000
Subtotal:..............................................................…………..................................................................241,000$
Engineering & Administrative Services (25%):....……………....................................…..............………….60,000$

City of Oak Harbor
Preliminary Project Cost Estimate
Booster Station Project BS-1
Ault Field Booster Station Surge Protection Analysis
UNIT
NO. ITEM QUANTITY PRICE AMOUNT
1. Mobilization, Cleanup, and Demobilization 1 LS 12,000$ 12,000$
2. Surge Suppression Study 1 LS 20,000$ 20,000$
3. Hydro-pneumatic surge protector 1 EA 60,000$ 60,000$
4. Piping, Valves, and Appurtenances 1 LS 10,000$ 10,000$
5. Electrical & Telemetry 1 LS 25,000$ 25,000$
Subtotal........................................…………........................................................................................127,000$
Contingency (20%)……………….…..…....….…………………………..………………………….25,000$
Subtotal:..............................................................…………..................................................................152,000$
Tax rate (9.4%)…....………………..……...…...….…………………………..………………………….14,000$
Subtotal:..............................................................…………..................................................................166,000$
Engineering & Administrative Services (25%)…....………………..……...…...….…………………………..………………………….42,000$
Total Estimated Construction Cost:...……………….……….......................................................208,000$
** ENR CCI for Seattle, November 2013: 10,143

City of Oak Harbor
Preliminary Project Cost Estimate
Booster Station Project BS-2
Ault Field Booster Station Pump Replacement
UNIT
NO. ITEM QUANTITY PRICE AMOUNT
1. Mobilization, Cleanup, and Demobilization 1 LS 6,000$ 6,000$
2. Pumps 2 EA 20,000$ 40,000$
3. Piping & Fittings 1 LS 5,000$ 5,000$
4. Electrical 1 LS 15,000$ 15,000$
Subtotal........................................…………........................................................................................66,000$
Contingency (20%)……………….…..…....….…………………………..………………………….13,000$
Subtotal:..............................................................…………..................................................................79,000$
Tax rate (9.4%)…....………………..……...…...….…………………………..………………………….7,000$
Total Estimated Construction Cost:...……………….……….......................................................86,000$
** ENR CCI for Seattle, November 2013: 10,143

City of Oak Harbor
Preliminary Project Cost Estimate
Booster Station Project BS-3
North Booster Pump Station
UNIT
NO. ITEM QUANTITY PRICE AMOUNT
1 Mobilization, Cleanup, and Demobilization 1 LS 113,000$ 113,000$
2 Excavation Safety Systems 1 LS 5,000$ 5,000$
3 Clearing and Grubbing 1 LS 10,000$ 10,000$
4 Temporary Erosion and Sedimentation Control 1 LS 10,000$ 10,000$
5 Unsuitable Excavation 1 LS 20,000$ 20,000$
6 Earthwork 1 LS 15,000$ 15,000$
7 Booster Station Building 1 LS 350,000$ 350,000$
8 Site & Booster Station Piping 1 LS 220,000$ 220,000$
9 Vertical in-Line Pump 1 EA 12,000$ 12,000$
10 Horizontal Split Case Pump 3 EA 30,000$ 90,000$
11 Surfacing Restoration & Landscaping 1 LS 10,000$ 10,000$
12 Electrical 1 LS 300,000$ 300,000$
13 Telemetry 1 LS 70,000$ 70,000$
14 Auxilliary Generator Assembly 1 LS 20,000$ 20,000$
15 Testing, Commissioning, and Training 1 LS 25,000$ 25,000$
Subtotal........................................…………........................................................................................1,270,000$
Archaeological Mitigation (15%)……………….…..…....….…………………………..………………………….191,000$
Subtotal:..............................................................…………..................................................................1,461,000$
Contingency (20%)……………….…..…....….…………………………..………………………….292,000$
Subtotal:..............................................................…………..................................................................1,753,000$
Tax rate (9.4%)…....………………..……...…...….…………………………..………………………….165,000
Subtotal:..............................................................…………..................................................................1,918,000$
Engineering & Administrative Services (25%):....……………....................................…..............………….480,000$
Total Estimated Construction Cost:...……………….……….......................................................2,398,000$
** ENR CCI for Seattle, November 2013: 10,143

City of Oak Harbor
Preliminary Project Cost Estimate
Transmission Project T-1
Cross City Transmission Main
UNIT
NO. ITEM QUANTITY PRICE AMOUNT
1. Minor Changes 1 MC $30,000.00 $30,000.00
2. Survey 1 LS $10,000.00 $10,000.00
3. SPCC Plan 1 LS $3,000.00 $3,000.00
4. Mobilization, Cleanup, and Demobilization 1 LS $250,000.00 $250,000.00
5. Project Temporary Traffic Control 1 LS $50,000.00 $50,000.00
6. Clearing and Grubbing 1 LS $5,000.00 $5,000.00
7. Removal of Structure and Obstruction 1 LS $25,000.00 $25,000.00
8. Control Density Fill 10 CY $200.00 $2,000.00
9. Locate Existing Utilities 1 LS $10,000.00 $10,000.00
10. Crushed Surfacing Top Course 3,000 TN $22.00 $66,000.00
11. WMA Cl. 1/2" PG 58-22, Trench Repair 1,200 TN $110.00 $132,000.00
12. Temporary HMA Cl. 1/2" PG 58-22 500 TN $150.00 $75,000.00
13. DI Water Pipe, 8 in. Diam. 100 LF $50.00 $5,000.00
14. DI Water Pipe, 18 in. Diam. 8,200 LF $90.00 $738,000.00
15. Additional Fittings 2,000 LB $3.00 $6,000.00
16. Connection to Existing Water Main 4 EA $5,000.00 $20,000.00
17. Removal of Unsuitable Material (Trench) 100 CY $75.00 $7,500.00
18. Bank Run Gravel for Trench Backfill 18,000 TN $20.00 $360,000.00
19. Trench Excavation Safety Systems 1 LS $25,000.00 $25,000.00
20. Plug Existing Pipe 6 EA $200.00 $1,200.00
21. Gate Valves, 8 In. 2 EA $1,500.00 $3,000.00
22. Butterfly Valve 18 In. 6 EA $4,000.00 $24,000.00
23. Comb. Air Relief/Vacuum Assembly 3 EA $4,000.00 $12,000.00
24. Jack and Bore State Route 20 1 LS $50,000.00 $50,000.00
25. Steel Casing Pipe, 36 In. Diam. 450 LF $550.00 $247,500.00
26. DI Carrier Pipe, 18 In. DIPS Diam. 450 LF $150.00 $67,500.00
27. Metering Vault 1 LS $50,000.00 $50,000.00
28. Erosion/Water Pollution Control 1 LS $10,000.00 $10,000.00
29. Seeding and Fertilizing 6,000 SY $3.00 $18,000.00
30. Sod Installation 50 SY $6.00 $300.00
31. Topsoil, Type A 500 CY $45.00 $22,500.00
32. Wetland Mitigation 1 LS $20,000.00 $20,000.00
33. Cement Concrete Traffic Curb and Gutter 30 LF $35.00 $1,050.00
34. Cement Concrete Driveway Entrance 12 SY $35.00 $420.00
35. Paint Line 10,000 LF $0.75 $7,500.00
36. Plastic Stop Line 100 LF $7.00 $700.00
37. Project Documentation 1 LS $2,000.00 $2,000.00
Subtotal........................................…………........................................................................................2,357,000$
Archaeological Mitigation (15%)……………….…..…....….…………………………..………………………….354,000$
Subtotal:..............................................................…………..................................................................2,711,000$
Contingency (20%)……………….…..…....….…………………………..………………………….542,000$
Subtotal:..............................................................…………..................................................................3,253,000$
Tax rate (9.4%)…....………………..……...…...….…………………………..………………………….306,000
Total Estimated Construction Cost:...……………….……….......................................................3,559,000$
** ENR CCI for Seattle, November 2013: 10,143

City of Oak Harbor
Preliminary Project Cost Estimate
Transmission Project T-2
North-End Trunk Main: Phase I & II
UNIT
NO. ITEM QUANTITY PRICE AMOUNT
1. Minor Changes 1 MC $25,000.00 $25,000.00
2. Survey 1 LS $5,000.00 $5,000.00
3. SPCC Plan 1 LS $3,000.00 $3,000.00
4. Mobilization, Cleanup, and Demobilization 1 LS $120,000.00 $120,000.00
5. Project Temporary Traffic Control 1 LS $10,000.00 $10,000.00
6. Clearing and Grubbing 1 LS $10,000.00 $10,000.00
7. Removal of Structure and Obstruction 1 LS $10,000.00 $10,000.00
8. Control Density Fill 10 CY $200.00 $2,000.00
9. Locate Existing Utilities 1 LS $5,000.00 $5,000.00
10. Crushed Surfacing Top Course 7,500 TN $22.00 $165,000.00
11. WMA Cl. 1/2" PG 58-22, Trench Repair 600 TN $110.00 $66,000.00
12. Temporary HMA Cl. 1/2" PG 58-22 50 TN $150.00 $7,500.00
13. Plug Existing Pipe 2 EA $200.00 $400.00
14. DI Water Pipe, 12 in. Diam. 500 LF $70.00 $35,000.00
15. DI Water Pipe, 18 in. Diam. 4,000 LF $90.00 $360,000.00
16. Additional Fittings 2,000 LB $3.00 $6,000.00
17. Connection to Existing Water Main 3 EA $5,000.00 $15,000.00
18. Removal of Unsuitable Material (Trench) 50 CY $75.00 $3,750.00
19. Bank Run Gravel for Trench Backfill 8000 TN $20.00 $160,000.00
20. Trench Excavation Safety Systems 1 LS $15,000.00 $15,000.00
21. Gate Valves, 12 In. 2 EA $2,500.00 $5,000.00
22. Butterfly Valve 18 In. 2 EA $4,000.00 $8,000.00
23. Fire Hydrant Assembly 2 EA $5,500.00 $11,000.00
24. Water Service Connection 6 EA $1,000.00 $6,000.00
25. HDPE Pipe 24 In. Diam. 100 LF $400.00 $40,000.00
26. Erosion/Water Pollution Control 1 LS $5,000.00 $5,000.00
27. Seeding and Fertilizing 4,000 SY $3.00 $12,000.00
28. Topsoil, Type A 800 CY $45.00 $36,000.00
29. Wetland Mitigation 1 LS $20,000.00 $20,000.00
30. Paint Line 3000 LF $0.75 $2,250.00
31. Plastic Stop Line 60 LF $7.00 $420.00
32. Project Documentation 1 LS $1,000.00 $1,000.00
Subtotal........................................…………........................................................................................1,170,000$
Archaeological Mitigation (15%)……………….…..…....….…………………………..………………………….176,000$
Subtotal:..............................................................…………..................................................................1,346,000$
Contingency (20%)……………….…..…....….…………………………..………………………….269,000$
Subtotal:..............................................................…………..................................................................1,615,000$
Tax rate (9.4%)…....………………..……...…...….…………………………..………………………….152,000
Total Estimated Construction Cost:...……………….……….......................................................1,767,000$
** ENR CCI for Seattle, November 2013: 10,143

City of Oak Harbor
Preliminary Project Cost Estimate
Transmission Project T-3
West 384 Zone Extension: Phase I
UNIT
NO. ITEM QUANTITY PRICE AMOUNT
1. Minor Changes 1 MC $30,000.00 $30,000.00
2. Survey 1 LS $10,000.00 $10,000.00
3. SPCC Plan 1 LS $5,000.00 $5,000.00
4. Mobilization, Cleanup, and Demobilization 1 LS $140,000.00 $140,000.00
5. Project Temporary Traffic Control 1 LS $15,000.00 $15,000.00
6. Clearing and Grubbing 1 LS $15,000.00 $15,000.00
7. Removal of Structure and Obstruction 1 LS $15,000.00 $15,000.00
8. Control Density Fill 10 CY $200.00 $2,000.00
9. Locate Existing Utilities 1 LS $10,000.00 $10,000.00
10. Crushed Surfacing Top Course 2,000 TN $22.00 $44,000.00
11. WMA Cl. 1/2" PG 58-22, Trench Repair 800 TN $110.00 $88,000.00
12. Temporary HMA Cl. 1/2" PG 58-22 350 TN $150.00 $52,500.00
13. DI Water Pipe, 24 in. Diam. 5,300 LF $120.00 $636,000.00
14. Additional Fittings 6,000 LB $3.00 $18,000.00
15. Connection to Existing Water Main 4 EA $5,000.00 $20,000.00
16. Removal of Unsuitable Material (Trench) 150 CY $75.00 $11,250.00
17. Bank Run Gravel for Trench Backfill 13000 TN $20.00 $260,000.00
18. Trench Excavation Safety Systems 1 LS $20,000.00 $20,000.00
19. Butterfly Valve 24 In. 4 EA $6,500.00 $26,000.00
20. Fire Hydrant Assembly 2 EA $5,500.00 $11,000.00
21. Erosion/Water Pollution Control 1 LS $15,000.00 $15,000.00
22. Seeding and Fertilizing 4,000 SY $3.00 $12,000.00
23. Topsoil, Type A 500 CY $45.00 $22,500.00
24. Paint Line 5000 LF $0.75 $3,750.00
25. Plastic Stop Line 100 LF $7.00 $700.00
26. Project Documentation 1 LS $1,000.00 $1,000.00
Subtotal........................................…………........................................................................................1,484,000$
Archaeological Mitigation (10%)……………….…..…....….…………………………..………………………….148,000$
Subtotal:..............................................................…………..................................................................1,632,000$
Contingency (20%)……………….…..…....….…………………………..………………………….326,000$
Subtotal:..............................................................…………..................................................................1,958,000$
Tax rate (9.4%)…....………………..……...…...….…………………………..………………………….184,000
Subtotal:..............................................................…………..................................................................2,142,000$
Engineering & Administrative Services (25%):....……………....................................…..............………….536,000$
Total Estimated Construction Cost:...……………….……….......................................................2,678,000$
** ENR CCI for Seattle, November 2013: 10,143

City of Oak Harbor
Preliminary Project Cost Estimate
Transmission Project T-5
Westside Water Main Extension
UNIT
NO. ITEM QUANTITY PRICE AMOUNT
1. Minor Changes 1 MC $50,000.00 $50,000.00
2. Survey 1 LS $20,000.00 $20,000.00
3. SPCC Plan 1 LS $5,000.00 $5,000.00
4. Mobilization, Cleanup, and Demobilization 1 LS $300,000.00 $300,000.00
5. Project Temporary Traffic Control 1 LS $100,000.00 $100,000.00
6. Clearing and Grubbing 1 LS $20,000.00 $20,000.00
7. Removal of Structure and Obstruction 1 LS $25,000.00 $25,000.00
8. Control Density Fill 50 CY $200.00 $10,000.00
9. Locate Existing Utilities 1 LS $15,000.00 $15,000.00
10. Crushed Surfacing Top Course 6,000 TN $22.00 $132,000.00
11. WMA Cl. 1/2" PG 58-22, Trench Repair 2,400 TN $110.00 $264,000.00
12. Temporary HMA Cl. 1/2" PG 58-22 1,000 TN $150.00 $150,000.00
13. DI Water Pipe, 18 in. Diam. 16,500 LF $110.00 $1,815,000.00
14. Additional Fittings 15,000 LB $3.00 $45,000.00
15. Connection to Existing Water Main 6 EA $5,000.00 $30,000.00
16. Removal of Unsuitable Material (Trench) 200 CY $75.00 $15,000.00
17. Bank Run Gravel for Trench Backfill 30,000 TN $20.00 $600,000.00
18. Trench Excavation Safety Systems 1 LS $50,000.00 $50,000.00
19. Plug Existing Pipe 10 EA $200.00 $2,000.00
20. Butterfly Valve 18 In. 15 EA $4,000.00 $60,000.00
21. Comb. Air Relief/Vacuum Assembly 5 EA $4,000.00 $20,000.00
22. Erosion/Water Pollution Control 1 LS $20,000.00 $20,000.00
23. Seeding and Fertilizing 10,000 SY $3.00 $30,000.00
24. Sod Installation 250 SY $6.00 $1,500.00
25. Topsoil, Type A 1,000 CY $45.00 $45,000.00
26. Wetland Mitigation 1 LS $20,000.00 $20,000.00
27. Paint Line 15,000 LF $0.75 $11,250.00
28. Plastic Stop Line 500 LF $7.00 $3,500.00
29. Project Documentation 1 LS $5,000.00 $5,000.00
Subtotal........................................…………........................................................................................3,864,000$
Archaeological Mitigation (20%)……………….…..…....….…………………………..………………………….773,000$
Subtotal:..............................................................…………..................................................................4,637,000$
Contingency (20%)……………….…..…....….…………………………..………………………….927,000$
Subtotal:..............................................................…………..................................................................5,564,000$
Tax rate (9.4%)…....………………..……...…...….…………………………..………………………….523,000
Subtotal:..............................................................…………..................................................................6,087,000$
Engineering & Administrative Services (25%):....……………....................................…..............………….1,522,000$
Total Estimated Construction Cost:...……………….……….......................................................7,609,000$
** ENR CCI for Seattle, November 2013: 10,143

City of Oak Harbor
Preliminary Project Cost Estimate
Transmission Project T-6
Campbell Lake Transsmission Main Replacement
UNIT
NO. ITEM QUANTITY PRICE AMOUNT
1. Minor Changes 1 MC $30,000.00 $30,000.00
2. Survey 1 LS $10,000.00 $10,000.00
3. SPCC Plan 1 LS $5,000.00 $5,000.00
4. Mobilization, Cleanup, and Demobilization 1 LS $140,000.00 $140,000.00
5. Project Temporary Traffic Control 1 LS $15,000.00 $15,000.00
6. Clearing and Grubbing 1 LS $15,000.00 $15,000.00
7. Removal of Structure and Obstruction 1 LS $15,000.00 $15,000.00
8. Control Density Fill 50 CY $200.00 $10,000.00
9. Locate Existing Utilities 1 LS $10,000.00 $10,000.00
10. Crushed Surfacing Top Course 1,600 TN $22.00 $35,200.00
11. WMA Cl. 1/2" PG 58-22, Trench Repair 600 TN $110.00 $66,000.00
12. Temporary HMA Cl. 1/2" PG 58-22 250 TN $150.00 $37,500.00
13. HDPE Water Pipe, 24 in. Diam. 3,100 LF $110.00 $341,000.00
14. Additional Fittings 1 LS $4,000.00 $4,000.00
15. Connection to Existing Water Main 2 EA $5,000.00 $10,000.00
16. Removal of Unsuitable Material (Trench) 150 CY $75.00 $11,250.00
17. Bank Run Gravel for Trench Backfill 9,900 TN $20.00 $198,000.00
18. Trench Excavation Safety Systems 1 LS $15,000.00 $15,000.00
19. Butterfly Valve 24 In. 4 EA $6,500.00 $26,000.00
20. Erosion/Water Pollution Control 1 LS $20,000.00 $20,000.00
21. Seeding and Fertilizing 3,000 SY $3.00 $9,000.00
22. Topsoil, Type A 400 CY $45.00 $18,000.00
23. Paint Line 3,000 LF $0.75 $2,250.00
24. Project Documentation 1 LS $1,000.00 $1,000.00
Subtotal........................................…………........................................................................................1,044,000$
Archaeological Mitigation (15%)……………….…..…....….…………………………..………………………….157,000$
Subtotal:..............................................................…………..................................................................1,201,000$
Contingency (20%)……………….…..…....….…………………………..………………………….240,000$
Subtotal:..............................................................…………..................................................................1,441,000$
Tax rate (9.4%)…....………………..……...…...….…………………………..………………………….135,000
Subtotal:..............................................................…………..................................................................1,576,000$
Engineering & Administrative Services (25%):....……………....................................…..............………….394,000$
Total Estimated Construction Cost:...……………….……….......................................................1,970,000$
** ENR CCI for Seattle, November 2013: 10,143

City of Oak Harbor
Preliminary Project Cost Estimate
Distribution System Project DS-1
NE Regatta Drive Pipeline
UNIT
NO. ITEM QUANTITY PRICE AMOUNT
1. Mobilization, Cleanup, and Demobilization 1 LS 6,000$ 6,000$
2. Locate Existing Utilities 1 LS 1,000$ 1,000$
3. Erosion Control 1 LS 1,000$ 1,000$
4. Trench Safety Systems 1 LS 1,000$ 1,000$
5. 8-inch Ductile Iron Water Pipe 300 LF 75$ 22,500$
6. Additional Fittings 100 LB 4$ 400$
7. 8-inch Gate Valves 2 EA 1,200$ 2,400$
8. Fire Hydrants 2 EA 5,000$ 10,000$
9. Gravel Backfill 150 CY 20$ 3,000$
10. Foundation Gravel 20 TN 30$ 600$
11. HMA Cl. B PG 58-22 20 TN 120$ 2,400$
12. Cold Mix Asphalt 10 TN 110$ 1,100$
13. Sawcutting 600 LF 3$ 1,800$
14. Crushed Surfacing, Base Course 30 TN 25$ 750$
15. Crushed Surfacing, Top Course 20 TN 22$ 440$
16. Connections to Existing System 2 EA 3,000$ 6,000$
17. 3/4" Service Connections, Complete 0 EA 1,500$ -$
18. Traffic Control 16 HRS 95$ 1,520$
Subtotal........................................…………........................................................................................62,000$
Archaeological Mitigation (15%)……………….…..…....….…………………………..………………………….9,000$
Subtotal:..............................................................…………..................................................................71,000$
Contingency (20%)……………….…..…....….…………………………..………………………….14,000$
Subtotal:..............................................................…………..................................................................85,000$
Tax rate (9.4%)…....………………..……...…...….…………………………..………………………….8,000
Subtotal:..............................................................…………..................................................................93,000$
Engineering & Administrative Services (25%):....……………....................................…..............………….23,000$
Total Estimated Construction Cost:...……………….……….......................................................116,000$
** ENR CCI for Seattle, November 2013: 10,143

City of Oak Harbor
Preliminary Project Cost Estimate
Distribution System Project DS-2
Glencoe Street Fireflow Improvements
UNIT
NO. ITEM QUANTITY PRICE AMOUNT
1. Mobilization, Cleanup, and Demobilization 1 LS 43,000$ 43,000$
2. Locate Existing Utilities 1 LS 8,000$ 8,000$
3. Erosion Control 1 LS 8,000$ 8,000$
4. Trench Safety Systems 1 LS 4,800$ 4,800$
5. 8-inch Ductile Iron Water Pipe 2,400 LF 75$ 180,000$
6. Additional Fittings 1,100 LB 4$ 4,400$
7. 8-inch Gate Valves 4 EA 1,200$ 5,280$
8. Fire Hydrants 6 EA 5,000$ 29,000$
9. Gravel Backfill 1,170 CY 20$ 23,400$
10. Foundation Gravel 130 TN 30$ 3,900$
11. HMA Cl. B PG 58-22 190 TN 120$ 22,800$
12. Cold Mix Asphalt 110 TN 110$ 12,100$
13. Sawcutting 4,800 LF 3$ 14,400$
14. Crushed Surfacing, Base Course 220 TN 25$ 5,500$
15. Crushed Surfacing, Top Course 150 TN 22$ 3,300$
16. Connections to Existing System 5 EA 3,000$ 15,000$
17. 3/4" Service Connections, Complete 54 EA 1,500$ 81,000$
18. Traffic Control 128 HRS 95$ 12,160$
Subtotal........................................…………........................................................................................476,000$
Archaeological Mitigation (20%)……………….…..…....….…………………………..………………………….95,000$
Subtotal:..............................................................…………..................................................................571,000$
Contingency (20%)……………….…..…....….…………………………..………………………….114,000$
Subtotal:..............................................................…………..................................................................685,000$
Tax rate (9.4%)…....………………..……...…...….…………………………..………………………….64,000
Subtotal:..............................................................…………..................................................................749,000$
Engineering & Administrative Services (25%):....……………....................................…..............………….187,000$
Total Estimated Construction Cost:...……………….……….......................................................936,000$
** ENR CCI for Seattle, November 2013: 10,143

City of Oak Harbor
Preliminary Project Cost Estimate
Distribution System Project DS-3
SW 10th Court Pipe Replacement
UNIT
NO. ITEM QUANTITY PRICE AMOUNT
1. Mobilization, Cleanup, and Demobilization 1 LS 9,000$ 9,000$
2. Locate Existing Utilities 1 LS 2,000$ 2,000$
3. Erosion Control 1 LS 2,000$ 2,000$
4. Trench Safety Systems 1 LS 1,000$ 1,000$
5. 8-inch Ductile Iron Water Pipe 480 LF 75$ 36,000$
6. Additional Fittings 200 LB 4$ 800$
7. 8-inch Gate Valves 3 EA 1,200$ 3,000$
8. Fire Hydrants 1 EA 5,000$ 5,000$
9. Gravel Backfill 230 CY 20$ 4,600$
10. Foundation Gravel 30 TN 30$ 900$
11. HMA Cl. B PG 58-22 40 TN 120$ 4,800$
12. Cold Mix Asphalt 20 TN 110$ 2,200$
13. Sawcutting 960 LF 3$ 2,880$
14. Crushed Surfacing, Base Course 40 TN 25$ 1,000$
15. Crushed Surfacing, Top Course 30 TN 22$ 660$
16. Connections to Existing System 1 EA 3,000$ 3,000$
17. 3/4" Service Connections, Complete 15 EA 1,500$ 22,500$
18. Traffic Control 24 HRS 95$ 2,280$
Subtotal........................................…………........................................................................................104,000$
Archaeological Mitigation (10%)……………….…..…....….…………………………..………………………….10,000$
Subtotal:..............................................................…………..................................................................114,000$
Contingency (20%)……………….…..…....….…………………………..………………………….23,000$
Subtotal:..............................................................…………..................................................................137,000$
Tax rate (9.4%)…....………………..……...…...….…………………………..………………………….13,000
Subtotal:..............................................................…………..................................................................150,000$
Engineering & Administrative Services (25%):....……………....................................…..............………….38,000$
Total Estimated Construction Cost:...……………….……….......................................................188,000$
** ENR CCI for Seattle, November 2013: 10,143

City of Oak Harbor
Preliminary Project Cost Estimate
Distribution System Project DS-4
SW 11th Court Pipe Replacement
UNIT
NO. ITEM QUANTITY PRICE AMOUNT
1. Mobilization, Cleanup, and Demobilization 1 LS 9,000$ 9,000$
2. Locate Existing Utilities 1 LS 2,000$ 2,000$
3. Erosion Control 1 LS 2,000$ 2,000$
4. Trench Safety Systems 1 LS 1,000$ 1,000$
5. 8-inch Ductile Iron Water Pipe 480 LF 75$ 36,000$
6. Additional Fittings 200 LB 4$ 800$
7. 8-inch Gate Valves 3 EA 1,200$ 3,000$
8. Fire Hydrants 1 EA 5,000$ 5,000$
9. Gravel Backfill 230 CY 20$ 4,600$
10. Foundation Gravel 30 TN 30$ 900$
11. HMA Cl. B PG 58-22 40 TN 120$ 4,800$
12. Cold Mix Asphalt 20 TN 110$ 2,200$
13. Sawcutting 960 LF 3$ 2,880$
14. Crushed Surfacing, Base Course 40 TN 25$ 1,000$
15. Crushed Surfacing, Top Course 30 TN 22$ 660$
16. Connections to Existing System 1 EA 3,000$ 3,000$
17. 3/4" Service Connections, Complete 15 EA 1,500$ 22,500$
18. Traffic Control 24 HRS 95$ 2,280$
Subtotal........................................…………........................................................................................104,000$
Archaeological Mitigation (10%)……………….…..…....….…………………………..………………………….10,000$
Subtotal:..............................................................…………..................................................................114,000$
Contingency (20%)……………….…..…....….…………………………..………………………….23,000$
Subtotal:..............................................................…………..................................................................137,000$
Tax rate (9.4%)…....………………..……...…...….…………………………..………………………….13,000
Subtotal:..............................................................…………..................................................................150,000$
Engineering & Administrative Services (25%):....……………....................................…..............………….38,000$
Total Estimated Construction Cost:...……………….……….......................................................188,000$
** ENR CCI for Seattle, November 2013: 10,143

City of Oak Harbor
Preliminary Project Cost Estimate
Distribution System Project DS-5
Erin Park Main Road Extension
UNIT
NO. ITEM QUANTITY PRICE AMOUNT
1. Mobilization, Cleanup, and Demobilization 1 LS 28,000$ 28,000$
2. Locate Existing Utilities 1 LS 5,000$ 5,000$
3. Erosion Control 1 LS 5,000$ 5,000$
4. Trench Safety Systems 1 LS 2,900$ 2,900$
5. 12-inch Ductile Iron Water Pipe 1,450 LF 95$ 137,750$
6. Additional Fittings 700 LB 4$ 2,800$
7. 12-inch Gate Valves 5 EA 2,500$ 12,500$
8. Fire Hydrants 4 EA 5,000$ 19,500$
9. Gravel Backfill 830 CY 20$ 16,600$
10. Foundation Gravel 90 TN 30$ 2,700$
11. HMA Cl. B PG 58-22 130 TN 120$ 15,600$
12. Cold Mix Asphalt 70 TN 110$ 7,700$
13. Sawcutting 2,900 LF 3$ 8,700$
14. Crushed Surfacing, Base Course 130 TN 28$ 3,640$
15. Crushed Surfacing, Top Course 90 TN 25$ 2,250$
16. Connections to Existing System 2 EA 3,000$ 6,000$
17. 3/4" Service Connections, Complete 15 EA 1,500$ 22,500$
18. Traffic Control 76 HRS 95$ 7,220$
Subtotal........................................…………........................................................................................306,000$
Archaeological Mitigation (15%)……………….…..…....….…………………………..………………………….46,000$
Subtotal:..............................................................…………..................................................................352,000$
Contingency (20%)……………….…..…....….…………………………..………………………….70,000$
Subtotal:..............................................................…………..................................................................422,000$
Tax rate (9.4%)…....………………..……...…...….…………………………..………………………….40,000
Subtotal:..............................................................…………..................................................................462,000$
Engineering & Administrative Services (25%):....……………....................................…..............………….116,000$
Total Estimated Construction Cost:...……………….……….......................................................578,000$
** ENR CCI for Seattle, November 2013: 10,143

City of Oak Harbor
Preliminary Project Cost Estimate
Distribution System Project DS-8
Heller Reservoir Extension
UNIT
NO. ITEM QUANTITY PRICE AMOUNT
1. Mobilization, Cleanup, and Demobilization 1 LS 35,000$ 35,000$
2. Locate Existing Utilities 1 LS 7,000$ 7,000$
3. Erosion Control 1 LS 7,000$ 7,000$
4. Trench Safety Systems 1 LS 4,000$ 4,000$
5. 16-inch Ductile Iron Water Pipe 2,000 LF 105$ 210,000$
6. Additional Fittings 1,200 LB 4$ 4,800$
7. 16-inch Butterfly Valves 4 EA 4,000$ 16,000$
8. Gravel Backfill 1,300 CY 20$ 26,000$
9. Foundation Gravel 150 TN 30$ 4,500$
10. HMA Cl. B PG 58-22 210 TN 120$ 25,200$
11. Cold Mix Asphalt 90 TN 110$ 9,900$
12. Sawcutting 4,000 LF 3$ 12,000$
13. Crushed Surfacing, Base Course 180 TN 25$ 4,500$
14. Crushed Surfacing, Top Course 120 TN 22$ 2,640$
15. Connections to Existing System 2 EA 3,000$ 6,000$
16. Traffic Control 108 HRS 95$ 10,260$
Subtotal........................................…………........................................................................................385,000$
Archaeological Mitigation (10%)……………….…..…....….…………………………..………………………….39,000$
Subtotal:..............................................................…………..................................................................424,000$
Contingency (20%)……………….…..…....….…………………………..………………………….85,000$
Subtotal:..............................................................…………..................................................................509,000$
Tax rate (9.4%)…....………………..……...…...….…………………………..………………………….48,000
Subtotal:..............................................................…………..................................................................557,000$
Engineering & Administrative Services (25%):....……………....................................…..............………….139,000$
Total Estimated Construction Cost:...……………….……….......................................................696,000$
** ENR CCI for Seattle, November 2013: 10,143

City of Oak Harbor
Preliminary Project Cost Estimate
Distribution System Project PZ-1
O'Leary Way Water Main
UNIT
NO. ITEM QUANTITY PRICE AMOUNT
1. Mobilization, Cleanup, and Demobilization 1 LS 28,000$ 28,000$
2. Locate Existing Utilities 1 LS 5,000$ 5,000$
3. Erosion Control 1 LS 5,000$ 5,000$
4. Trench Safety Systems 1 LS 3,800$ 3,800$
5. 8-inch Ductile Iron Water Pipe 1,900 LF 75$ 142,500$
6. Additional Fittings 900 LB 4$ 3,600$
7. 8-inch Gate Valves 4 EA 1,200$ 4,800$
8. Fire Hydrants 5 EA 5,000$ 25,000$
9. Gravel Backfill 930 CY 20$ 18,600$
10. Foundation Gravel 100 TN 30$ 3,000$
11. HMA Cl. B PG 58-22 150 TN 120$ 18,000$
12. Cold Mix Asphalt 90 TN 110$ 9,900$
13. Sawcutting 3,800 LF 3$ 11,400$
14. Crushed Surfacing, Base Course 170 TN 25$ 4,250$
15. Crushed Surfacing, Top Course 120 TN 22$ 2,640$
16. Connections to Existing System 3 EA 3,000$ 9,000$
17. Traffic Control 100 HRS 95$ 9,500$
Subtotal........................................…………........................................................................................304,000$
Archaeological Mitigation (20%)……………….…..…....….…………………………..………………………….61,000$
Subtotal:..............................................................…………..................................................................365,000$
Contingency (20%)……………….…..…....….…………………………..………………………….73,000$
Subtotal:..............................................................…………..................................................................438,000$
Tax rate (9.4%)…....………………..……...…...….…………………………..………………………….41,000
Subtotal:..............................................................…………..................................................................479,000$
Engineering & Administrative Services (25%):....……………....................................…..............………….120,000$
Total Estimated Construction Cost:...……………….……….......................................................599,000$
** ENR CCI for Seattle, November 2013: 10,143
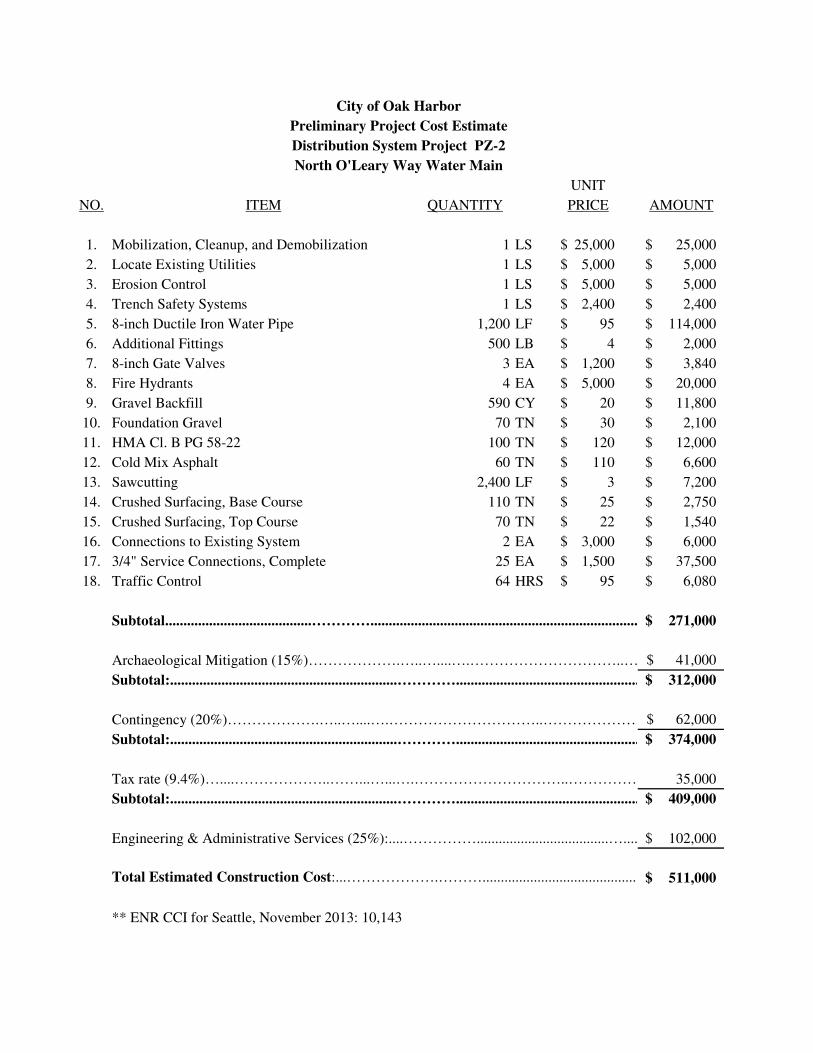
City of Oak Harbor
Preliminary Project Cost Estimate
Distribution System Project PZ-2
North O'Leary Way Water Main
UNIT
NO. ITEM QUANTITY PRICE AMOUNT
1. Mobilization, Cleanup, and Demobilization 1 LS 25,000$ 25,000$
2. Locate Existing Utilities 1 LS 5,000$ 5,000$
3. Erosion Control 1 LS 5,000$ 5,000$
4. Trench Safety Systems 1 LS 2,400$ 2,400$
5. 8-inch Ductile Iron Water Pipe 1,200 LF 95$ 114,000$
6. Additional Fittings 500 LB 4$ 2,000$
7. 8-inch Gate Valves 3 EA 1,200$ 3,840$
8. Fire Hydrants 4 EA 5,000$ 20,000$
9. Gravel Backfill 590 CY 20$ 11,800$
10. Foundation Gravel 70 TN 30$ 2,100$
11. HMA Cl. B PG 58-22 100 TN 120$ 12,000$
12. Cold Mix Asphalt 60 TN 110$ 6,600$
13. Sawcutting 2,400 LF 3$ 7,200$
14. Crushed Surfacing, Base Course 110 TN 25$ 2,750$
15. Crushed Surfacing, Top Course 70 TN 22$ 1,540$
16. Connections to Existing System 2 EA 3,000$ 6,000$
17. 3/4" Service Connections, Complete 25 EA 1,500$ 37,500$
18. Traffic Control 64 HRS 95$ 6,080$
Subtotal........................................…………........................................................................................271,000$
Archaeological Mitigation (15%)……………….…..…....….…………………………..………………………….41,000$
Subtotal:..............................................................…………..................................................................312,000$
Contingency (20%)……………….…..…....….…………………………..………………………….62,000$
Subtotal:..............................................................…………..................................................................374,000$
Tax rate (9.4%)…....………………..……...…...….…………………………..………………………….35,000
Subtotal:..............................................................…………..................................................................409,000$
Engineering & Administrative Services (25%):....……………....................................…..............………….102,000$
Total Estimated Construction Cost:...……………….……….......................................................511,000$
** ENR CCI for Seattle, November 2013: 10,143

City of Oak HarborPreliminary Project Cost EstimateDistribution System Project PZ-3
South End NASWI ConnectionUNIT
NO. ITEM QUANTITY PRICE AMOUNT
1. Mobilization, Cleanup, and Demobilization 1 LS 42,000$ 42,000$ 2. Locate Existing Utilities 1 LS 8,000$ 8,000$ 3. Erosion Control 1 LS 8,000$ 8,000$ 4. Trench Safety Systems 1 LS 2,400$ 2,400$ 5. 12-inch Ductile Iron Water Pipe 1,200 LF 75$ 90,000$ 6. Additional Fittings 600 LB 4$ 2,400$ 7. 12-inch Gate Valves 2 EA 2,500$ 5,000$ 8. Pressure Reducing Valve Station, Complete 1 LS 200,000$ 225,000$ 9. Fire Hydrants 4 EA 5,000$ 20,000$
10. Gravel Backfill 680 CY 20$ 13,600$ 11. Foundation Gravel 80 TN 30$ 2,400$ 12. HMA Cl. B PG 58-22 110 TN 120$ 13,200$ 13. Cold Mix Asphalt 60 TN 110$ 6,600$ 14. Sawcutting 2,400 LF 3$ 7,200$ 15. Crushed Surfacing, Base Course 110 TN 25$ 2,750$ 16. Crushed Surfacing, Top Course 70 TN 22$ 1,540$ 17. Connections to Existing System 1 EA 3,000$ 3,000$ 18. Traffic Control 64 HRS 95$ 6,080$
Subtotal........................................…………........................................................................................459,000$
Archaeological Mitigation (20%)……………….…..…....….…………………………..………………………….92,000$ Subtotal:..............................................................…………..................................................................551,000$
Contingency (20%)……………….…..…....….…………………………..………………………….110,000$ Subtotal:..............................................................…………..................................................................661,000$
Tax rate (9.4%)…....………………..……...…...….…………………………..………………………….62,000 Subtotal:..............................................................…………..................................................................723,000$
Engineering & Administrative Services (25%):....……………....................................…..............………….181,000$
Total Estimated Construction Cost:...……………….……….......................................................904,000$
** ENR CCI for Seattle, November 2013: 10,143

City of Oak Harbor
Preliminary Project Cost Estimate
Distribution System Project PZ-4
West 384 Zone Development
UNIT
NO. ITEM QUANTITY PRICE AMOUNT
1. Mobilization, Cleanup, and Demobilization 1 LS 16,000$ 16,000$
2. Locate Existing Utilities 1 LS 3,000$ 3,000$
3. Erosion Control 1 LS 3,000$ 3,000$
4. Trench Safety Systems 1 LS 1,600$ 1,600$
5. 8-inch Ductiles Iron Water Pipe 780 LF 75$ 58,500$
6. Additional Fittings 400 LB 4$ 1,600$
7. 8-inch Gate Valves 3 EA 1,200$ 3,360$
8. Fire Hydrants 2 EA 5,000$ 10,000$
9. Fireflow Checkvalve Installations 1 EA 35,000$ 35,000$
10. Gravel Backfill 380 CY 20$ 7,600$
11. Foundation Gravel 40 TN 30$ 1,200$
12. HMA Cl. B PG 58-22 60 TN 120$ 7,200$
13. Cold Mix Asphalt 40 TN 110$ 4,400$
14. Sawcutting 1,560 LF 3$ 4,680$
15. Crushed Surfacing, Base Course 70 TN 25$ 1,750$
16. Crushed Surfacing, Top Course 50 TN 22$ 1,100$
17. Connections to Existing System 3 EA 3,000$ 9,000$
18. Traffic Control 40 HRS 95$ 3,800$
Subtotal........................................…………........................................................................................173,000$
Archaeological Mitigation (15%)……………….…..…....….…………………………..………………………….26,000$
Subtotal:..............................................................…………..................................................................199,000$
Contingency (20%)……………….…..…....….…………………………..………………………….40,000$
Subtotal:..............................................................…………..................................................................239,000$
Tax rate (9.4%)…....………………..……...…...….…………………………..………………………….22,000
Subtotal:..............................................................…………..................................................................261,000$
Engineering & Administrative Services (25%):....……………....................................…..............………….65,000$
Total Estimated Construction Cost:...……………….……….......................................................326,000$
** ENR CCI for Seattle, November 2013: 10,143

City of Oak Harbor
Preliminary Project Cost Estimate
Distribution System Project PZ-5
West 322 Zone Development
UNIT
NO. ITEM QUANTITY PRICE AMOUNT
1. Mobilization, Cleanup, and Demobilization 1 LS 23,000$ 23,000$
2. Locate Existing Utilities 1 LS 2,000$ 2,000$
3. Erosion Control 1 LS 2,000$ 2,000$
4. Trench Safety Systems 1 LS 5,000$ 5,000$
5. PRV Installations 2 EA 90,000$ 180,000$
6. Fireflow Check Valve Installation 1 EA 35,000$ 35,000$
7. Gravel Backfill 100 CY 20$ 2,000$
8. Foundation Gravel 15 TN 30$ 450$
9. HMA Cl. B PG 58-22 10 TN 120$ 1,200$
10. Crushed Surfacing, Base Course 10 TN 28$ 280$
11. Crushed Surfacing, Top Course 10 TN 25$ 250$
12. Connections to Existing System 2 EA 3,000$ 6,000$
Subtotal........................................…………........................................................................................257,000$
Archaeological Mitigation (15%)……………….…..…....….…………………………..………………………….39,000$
Subtotal:..............................................................…………..................................................................296,000$
Contingency (20%)……………….…..…....….…………………………..………………………….59,000$
Subtotal:..............................................................…………..................................................................355,000$
Tax rate (9.4%)…....………………..……...…...….…………………………..………………………….33,000
Subtotal:..............................................................…………..................................................................388,000$
Engineering & Administrative Services (25%):....……………....................................…..............………….97,000$
Total Estimated Construction Cost:...……………….……….......................................................485,000$
** ENR CCI for Seattle, November 2013: 10,143