Q:\THIRD\2 Ben 09-10\Civil\Castrillo 09-4369\SJ FINAL II 09 ...
Upload
khangminh22Category
view
2download
0
Revolutionary Government of Zanzibar Ministry of Education and Vocational Training
Zanzibar Education Development Programme (ZEDP)
2008/09 – 2015/16
DRAFT 3 February 6, 2007

Foreword The Zanzibar Education Development Programme (ZEDP) represents the first comprehensive and sector-wide approach to the educational challenges facing Zanzibar. It identifies, establishes and plans for substantial targets for the education system, both in terms of equitable access and quality. The ZEDP is strategic in its approach, seeking to develop immediate, medium term and longer term goals for education which are achievable and sustainable. The process of developing the Programme has been participatory and open with local expertise making a major contribution to the process. We are also grateful for the direct support of development partners in the development of the Programme.
For many years education in Zanzibar has been considered a joint enterprise, the responsibility of many parties from the school and community level to the private sector plus key actors at Government level. This collaborative approach will need to be continued and strengthened if the educational goals encapsulated in the ZEDP are to be achieved.
The Zanzibar Education Development Programme is also characterized by a practical focus on where learning takes place and how that environment can be strengthened and enriched. The classroom learning environment, the management structures which support and surround it and the planning and development approaches which guide it remain the critical areas which the ZEDP addresses. By focusing on the fundamentals of learning and teaching the Programme draws together all the significant elements necessary for the qualitative changes deemed essential if the learners of Zanzibar are to fulfil their potential over the coming decades.
The ZEDP lays out the future direction of education in Zanzibar. To achieve its goals sufficient funding will be necessary as well as the active participation of all educational stakeholders. Established and new development partners and international organizations have a significant role to play and the Revolutionary Government of Zanzibar is actively seeking this kind of cooperation. A sound Programme must be supported by sufficient means to implement its proposals and the publication of the Zanzibar Education Development Programme signals the commitment of the Revolutionary Government of Zanzibar and the communities to the establishing of a high quality and relevant education system for all our citizens.
Haroun A. Suleiman
Minister of Education and Vocational Training Zanzibar

The Vision according to the Education Policy 2006:
“A democratic and peaceful society enjoying a high quality of
education and livelihood and committed to lifelong learning to
effectively respond to development challenges.”
And the mission is:
“To strive for equitable access, quality education for all and promotion
of life long learning.”

Table of contents 1 THE NATIONAL CONTEXT.....................................................................................................1
1.1 SOCIO-ECONOMIC BACKGROUND ...........................................................................................1 1.2 OVERALL DEVELOPMENT POLICIES AND STRATEGIES .............................................................1 1.3 RELATIONSHIP BETWEEN EDUCATION AND DEVELOPMENT ....................................................4 1.4 EDUCATION SECTOR POLICIES AND STRATEGIES ...................................................................6
2 PRESENT SITUATION AND POLICY DIRECTION: EDUCATION SUB-SECTORS....11 2.1 PRE-PRIMARY EDUCATION ..................................................................................................11 2.2 PRIMARY EDUCATION ..........................................................................................................12 2.3 SECONDARY EDUCATION .....................................................................................................14 2.4 TECHNICAL AND VOCATIONAL EDUCATION AND TRAINING ................................................16 2.5 TEACHERS AND TEACHER EDUCATION ................................................................................18 2.6 HIGHER EDUCATION ............................................................................................................22 2.7 NON-FORMAL, ALTERNATIVE AND ADULT EDUCATION.......................................................25
3 PRESENT SITUATION AND POLICY DIRECTION: CROSS-CUTTING ISSUES.........27 3.1 EDUCATION MANAGEMENT AND DECENTRALISATION.........................................................27 3.2 GENDER ...............................................................................................................................29 3.3 SPECIAL NEEDS AND INCLUSIVE EDUCATION.......................................................................32 3.4 SCHOOL HEALTH, NUTRITION AND HIV/AIDS ....................................................................35 3.5 INFORMATION AND COMMUNICATION TECHNOLOGY (ICT).................................................38
4 PROGRAMME OVERVIEW ...................................................................................................42 4.1 PROGRAMME OBJECTIVES ....................................................................................................42 4.2 OVERALL ZEDP TARGETS....................................................................................................43 4.3 STRATEGY............................................................................................................................44
5 COMPONENT 1 - EDUCATION SECTOR MANAGEMENT AND DECENTRALISATION ......................................................................................................................46
5.1 OBJECTIVES .........................................................................................................................46 5.2 MAPPING SECTOR CAPACITY FOR SERVICE DELIVERY ..........................................................46 5.3 EDUCATION SECTOR MANAGEMENT .....................................................................................47 5.4 REGULATORY AND OVERSIGHT FUNCTION ...........................................................................49 5.5 DECENTRALISATION.............................................................................................................50
6 COMPONENT 2 - TEACHER EDUCATION.........................................................................53 6.1 OBJECTIVES .........................................................................................................................53 6.2 RATIONALE ..........................................................................................................................53 6.3 OUTPUTS..............................................................................................................................54 6.4 ACTIVITIES...........................................................................................................................55
7 COMPONENT 3 – TEACHER RECRUITMENT AND DEPLOYMENT ...........................57 7.1 OBJECTIVE ...........................................................................................................................57 7.2 RATIONALE ..........................................................................................................................57 7.3 OUTPUTS..............................................................................................................................58 7.4 ACTIVITIES...........................................................................................................................58
8 COMPONENT 4 - PRE-PRIMARY EDUCATION ................................................................59 8.1 OBJECTIVE ...........................................................................................................................59 8.2 RATIONALE ..........................................................................................................................59 8.3 OUTPUTS..............................................................................................................................60 8.4 ACTIVITIES...........................................................................................................................60

9 COMPONENT 5 - PRIMARY EDUCATION .........................................................................61 9.1 OBJECTIVES .........................................................................................................................61 9.2 RATIONALE ..........................................................................................................................61 9.3 OUTPUTS..............................................................................................................................62 9.4 ACTIVITIES...........................................................................................................................62
10 COMPONENT 6 - SECONDARY EDUCATION ...................................................................64 10.1 OBJECTIVES .........................................................................................................................64 10.2 RATIONALE ..........................................................................................................................64 10.3 OUTPUTS..............................................................................................................................65 10.4 ACTIVITIES...........................................................................................................................66
11 COMPONENT 7 - TECHNICAL AND VOCATIONAL EDUCATION AND TRAINING67 11.1 OBJECTIVES .........................................................................................................................67 11.2 RATIONALE ..........................................................................................................................67 11.3 OUTPUTS..............................................................................................................................68 11.4 ACTIVITIES...........................................................................................................................69
12 COMPONENT 8 - HIGHER EDUCATION ............................................................................70 12.1 OBJECTIVES .........................................................................................................................70 12.2 RATIONALE ..........................................................................................................................70 12.3 OUTPUTS..............................................................................................................................71 12.4 ACTIVITIES...........................................................................................................................72
13 COMPONENT 9 - NON-FORMAL, ALTERNATIVE AND ADULT EDUCATION .........73 13.1 OBJECTIVE ...........................................................................................................................73 13.2 RATIONALE ..........................................................................................................................73 13.3 OUTPUTS..............................................................................................................................74 13.4 ACTIVITIES...........................................................................................................................74
14 COMPONENT 10 - GENDER...................................................................................................76 14.1 OBJECTIVE ...........................................................................................................................76 14.2 RATIONALE ..........................................................................................................................76 14.3 OUTPUTS..............................................................................................................................77 14.4 ACTIVITIES...........................................................................................................................77
15 COMPONENT 11 – SPECIAL NEEDS AND INCLUSIVE EDUCATION..........................78 15.1 OBJECTIVE ...........................................................................................................................78 15.2 RATIONALE ..........................................................................................................................78 15.3 OUTPUTS..............................................................................................................................79 15.4 ACTIVITIES...........................................................................................................................79
16 COMPONENT 12 - SCHOOL HEALTH, NUTRITION AND HIV/AIDS ...........................80 16.1 OBJECTIVES .........................................................................................................................80 16.2 RATIONALE ..........................................................................................................................80 16.3 OUTPUTS..............................................................................................................................81 16.4 ACTIVITIES...........................................................................................................................81
17 COMPONENT 13 - INFORMATION AND COMMUNI-CATION TECHNOLOGY (ICT) 82
17.1 OBJECTIVE ...........................................................................................................................82 17.2 RATIONALE ..........................................................................................................................82 17.3 OUTPUTS..............................................................................................................................82 17.4 ACTIVITIES...........................................................................................................................83

18 FINANCING ZEDP....................................................................................................................84 18.1 INTRODUCTION.....................................................................................................................84 18.2 THE FISCAL FRAMEWORK ....................................................................................................84 18.3 CURRENT EDUCATION BUDGET ...........................................................................................87 18.4 ENROLMENT ASSUMPTIONS AND EXPENDITURE PROJECTIONS ............................................88 18.5 OTHER ASSUMPTIONS ..........................................................................................................91 18.6 FINANCING REQUIREMENT ...................................................................................................94
19 MANAGEMENT AND MONITORING OF ZEDP ................................................................97 19.1 MANAGEMENT .....................................................................................................................97 19.2 MONITORING AND REPORTING .............................................................................................97 19.3 MONITORING OF ZEDP/EDUCATION SECTOR OUTCOMES ....................................................99 19.4 COORDINATION WITH EXTERNAL FUNDING PARTNERS .......................................................100
ANNEX I: ZEDP PROGRAMME FRAMEWORK .......................................................................101 ANNEX II: ZEDP PROGRAMME BUDGET AND FINANCING PLAN ...................................110 ANNEX III: ZEDP - PROPOSED MOU..........................................................................................124 ANNEX IV – KEY ASSUMPTION FOR SECTOR AND BUDGET PROJECTIONS ...............139

List of abbreviations AKF Aga Khan Foundation
AWPB Annual Work Program and Budget
BoT Bank of Tanzania
BS Budget Speech
CoA College of Agriculture
CBO Community Based Organisation
CEDAW The Convention on the Elimination of All Forms of Discrimination against Women
CFS Consolidated Fund Service
CoHS College of Health Science
COSTECH Commission for Science and Technology
CRC The Convetion on the Rights of the Child
CTC Child to Child Project
DARAL-IMAM A charitable association of Saudi Arabia
DEO District Education Officer
DEVTO District Education and Vocational Training Officers
ECD Early Childhood Care and Development
ECE Early Childhood Education
EFA Education for All
EMIS Education Management Information System
FAWE Forum for African Women Educationalists
FMIS Financial Management Information System
FTC Full Technical Certificate
FY Fiscal Year
GBS General Budget Support
GDP Gross Domestic Product
GER Gross enrolment rate
GFP Gender Focal Person
HBS Household Budget Survey
HEAC Tanzania Higher Education Accreditation Council

HESLB Higher Education Students’ Loan Board
ICDL International Computer Driving Licence
ICT Information and Communication Technology
IE Inclusive Education
IJA Institute of Judicial Administration
IKFL Institute of Kiswahili and Foreign Languages
IUA International University of Africa
JAST Joint Assistance Strategy for Tanzania
KTC Karume Technical College
MDAs Ministries, Departments and Agencies
MDG Millennium Development Goals
MEES Moral Ethics and Environment Studies
MKEZA Previous education project with USAID support
MKUZA Ki-Swahili name for ZSGRP
MLYWCD Ministry of Labour, Youth, Women and Child Development
MOA Ministry of Agriculture
MoECS Former name of MOEVT, then including culture and sports
MoEVT Ministry of Education and Vocational Training
MoFEA Ministry of Finance and Economic Affairs - Zanzibar
MoF Ministry of Finance -Union
MoHSW Ministry of Health and Social Welfare
MoLEYD Ministry of Labour, Employment and Youth Development
MSTHE Ministry of Science, Technology and Higher Education in Dar es Salaam
NACTED National Council for Technical Education
NECTA National Examination Council of Tanzania
NER Net enrolment rate
NFAST National Fund for the Advancement of Science and Technology
NFE Non formal education
NFU Norwegian Association for People with Development Disabilities
NGO Non Government Organization

NTA National Technical Awards
NTRC National Teacher’s Resource Centres
NTTC Nkrumah Teacher Training College
OCAG Office of the Controller and Auditor General
ODA Official Development Assistance
OCS Orientation Secondary Class
OHCI The Primary Health Care Institute
PCR Pupils Classroom Ratio
PER Public Expenditure Review
PFMRP New accounting system introduced in Zanzibar by MoFEA
PIU Programme Implementation Unit
PRSP Poverty Reduction Strategy Paper
PTA Parent Teacher Association
PTR Pupil Teacher Ratio
PWD People with Disability
REO Regional Education Officer
RGoZ Revolutionary Government of Zanzibar
RH Reproductive Health
SACMEQ Southern and Eastern African Consortium for Monitoring Educational Quality
SMC School Management Committee
SUZA State University of Zanzibar
SWAp Sector Wide Approach
SWI The Social Work Institute
TA Technical Assistance
TAC Tanzania Aids Commission
TC Teacher Centres
TEA Tanzania Education Authority
TEMAP Tanzania Multi-Sectoral AIDS Project
TIE Tanzania Institute of Education
Tsh Tanzanian Shilling

TTC Teacher Training Centre
TRA Tanzania Revenue Authority
TUC Tanzania Commission for University
TWG Technical Working Group
TVET Technical and Vocational Education and Training
UCE University College of Education
UDSM University of Dar es Salaam
UNESCO UN Education, Social and Cultural Organisation
UNFPA United Nation Fund for Population Activities
UNICEF United Nations Children’s Fund
USAID United States Agency for International Development
VET Vocational Education and Training
VETA Vocational Education and Training Authority
VTA Vocational Training Authority
WHY World Home for Youth Italy
WSD Whole School Development
ZAC Zanzibar AIDS Commission
ZAPDD Zanzibar Association for People with Development Disabilities
ZATU Zanzibar Teachers Union
ZEDP Zanzibar Education Development Programme
ZEMAP Zanzibar Education Master Plan
ZESC Zanzibar Education Sector Committee
ZHELB Zanzibar Higher Education Loan Board
ZMRC Zanzibar Madrasa Resource Centre
ZPRP Zanzibar Poverty Reduction Plan
ZRB Zanzibar Revenue Board
ZSGRP Zanzibar Strategy for Growth and the Reduction of Poverty Document
ZU Zanzibar University

Abbreviations for units of the MoEVT Abbreviations Name of Functions
Functions under the Principal Secretary
OEVT, Pemba Office of Education and Vocational Training, Pemba
DLS Department of Library Services
IAU Internal Audit Unit
PRCMO Public Relation and Coordination of the Minister’s Office
Departments and Units under Commission for Education
DPPP&LSE Department of Pre-Primary Primary and Lower Secondary Education
DSE Department of Secondary Education
DTT Department of Teachers’ Training
DI Department of Inspectorate
DHEST Department of Higher Education, Science and Technology
DCE Department of Curriculum and Examination
IEU Inclusive Education Unit
ERU Education Registration Unit
GCU Guidance of Counselling Unit
CSSU Culture and Sports at Schools Unit
Departments under Commission for Policy, Planning Budget and Research
DALAE Department of Alternative Learning & Adult Education
DVT Department of Vocational Training
DAP Department of Administration and Personnel
DAMA Department of Archives, Museums and Antiquities
DPBR Department of Policy, Planning, Budgeting & Research

1
1 THE NATIONAL CONTEXT
1.1 Socio-economic background Zanzibar is part of the United Republic of Tanzania, but is semi-autonomous. It has its own Government, a legislative assembly known as the House of Representatives, the Executive, headed by the President of Zanzibar and its own Judicial System. Zanzibar is divided into five administrative regions (three in Unguja and two in Pemba), 10 districts, two in each region, 50 constituencies and 296 shehias.
As indicated in the textbox, Zanzibar is relatively small in terms of land area and size of population. Most of the area is easily accessible both on land and with boat. Nevertheless, there are large differences between both the two main islands, and between districts. Hence the Revolutionary Government of Zanzibar (RGoZ) and not least the Ministry of Education and Vocational Training (MoEVT) are faced with considerable challenges in order to bring all citizens on board on more equal bases in the social, economic and cultural development in the coming years.
1.2 Overall development policies and strategies
1.2.1 Zanzibar Vision 2020 The very important policy document Zanzibar Vision 2020 lays the foundation of direction for the long term development for Zanzibar in general terms, but also includes objectives for the specific sectors, including education. Vision 2020’s objective is to eradicate absolute poverty in Zanzibar. One of the main challenges identified is to improve and maintain high education standards and promote skills development cost effectively in order to meet the challenges of the twenty first century.
On education, Vision 2020’s target is to attain basic universal education by raising the primary school enrolment to 100 percent by the year 2015. The transition rate to Form 3 in lower secondary education/secondary education ordinary level should reach 100 percent and thus make a strong contribution to eradicate illiteracy by the last year of the Vision (2020). The Vision’s education policy is to set broad goals that “guide educational development for promoting academic and intellectual excellence by nurturing sound cognitive development as well as providing education that promotes self-reliance of the recipients. Vocational training should be established in all districts to provide training skills to out of school youths”.
The main policy objectives of the Vision 2020 include:
- Ensuring access to quality education especially by the poor household members, women and the people with disabilities, by improving and maintaining high education standards and skills development in a cost effective manner.
- Eradicating illiteracy.
Zanzibar consists of two main islands, Unguja and Pemba, and several other smaller islands. Zanzibar is located about 30 kilometres off the East Coast of Africa between latitudes 5 and 7 degrees south of the Equator. The total land area is 2,654 km2; out of this, Unguja, which is the largest, has an area of 1,666 square kilometres while Pemba has an area of 988 square kilometres. In 2002 Zanzibar had a population of 981,754 with a growth rate of 3.1percent and a population density of 370 per square kilometres. Of the total population, 40 percent live in urban areas and the remaining 60 percent are settled in rural areas. The high population growth rate is mostly attributed to high fertility rate of 5.3. The projected population in 2005 was 1,072,000. (Population and Housing Census (2002))

2
- Promotion of higher education and tertiary institutions that include polytechnic, business colleges and universities through public and private initiatives to promote economic competitiveness and employment.
- Establishment of a viable alternative learning system that will include adult, non-formal and informal education.
- Upgrading teachers’ competence and their productivity.
- Promoting school based management, parent-teacher association and community and local government support.
- Encouraging NGOs and private sector investments in the provision of education and education facilities.
- Reviewing school curricula in the educational system to give science and technology a greater weight and orientation.
- Encouraging the use of price mechanisms in setting education and training costs such as charging school fees for education in fields likely to provide high personal returns, including securing employment in areas of high demand.
1.2.2 MKUZA 2007 In pursuance of the policy of linking education to economic growth and wealth creation, the RGoZ has been developing national policies within the overall context of poverty reduction. The first generation of Poverty Reduction Strategy Plan (PRSP) for Zanzibar (2003-05) focussed on priority sectors, including education, in an attempt to target specific ‘pockets’ of poverty. This approach proved to be flawed, as it undermined the essential holistic nature of development: for example, sectors such as education and health depend to a great degree on national governance policies which allow for civil society participation, respect for Human rights and regulatory frameworks to involve the active participation of the private sector. Hence, the development, through a long process of public consultation, of the MKUZA, (the Ki-Swahili name for the National Economic Growth and Poverty Reduction Policy (ZSGRP) in Zanzibar of 2007), which represents the second generation of the PRSP in Zanzibar.
Cluster II of MKUZA (p. 44) identifies the broad outcome and goal for education to be:
Ensure equitable access to demand driven quality education, which is gender and environmentally responsive. More specific objectives are set for the various education sub-sectors and in key, cross cutting areas, the most relevant for ZEDP being:
Early Childhood Care and Development - Increased Gross Enrolment Rate for pre-school from 15.9 percent in 2005
to 35 percent in 2010
Primary Education - Increased Net Enrolment Rate from 77 percent in 2005 to 90 percent in
2010

3
- Increased proportion of children with disabilities, enrolled, attend and completing schools by 5 percent annually
Secondary Education - Increased transition rate at form two examinations from 46.9 percent in
2005 to 70 percent by 2010
- Increased Net Enrolment Rate from 36.1 percent in 2006 to 75 percent in 2010
- Increased proportion of girls who join low and higher secondary education from 46 percent in 2005 to 50 percent by 2010
- Increased percentage of qualified secondary school teachers
- Improve quality of secondary education and promoted acquisition of knowledge
- Increased proportion of orphans and vulnerable children and children with disabilities who join secondary education
- Increased proportion of graduates from tertiary education institutions
Science and Technology - Enhanced teaching of science, mathematics and technology in schools.
- Promoted the use of Information and Communications Technology.
- Expanded access to ICT for education development.
Non-Formal Education - Increased literacy rate from 75.8 percent in 2005 to 100 percent in 2010.
- Increased literacy rate of women from 69.8 percent in 2005 to 100 percent in 2010
- F Vocational Education and Training
- Enhanced entrepreneurial skills among the youth.
Tertiary Education - Increased proportion of graduates of tertiary education institution
Quality education - Improved quality of education at all levels
Institutional Reform - Improved efficiency in the delivery of educational services.
- Integrated cross cutting issues into education system. (Gender, environment, population, HIV and AIDS, employment and disaster preparedness).

4
1.3 Relationship between education and development International economic competition among countries and regions of the world is becoming more and more intense. While globalization is increasing parallel with technical development all countries seem to agree to and focus on the importance of education and training. To improve access and quality of education has been identified all over the world to be among the most important keys to development. Countries which have succeeded economically, and where this development is not only based on extraction of natural resources such as oil or minerals, have in common large educational investments at earlier stages of their development.
There also seems to be international agreement today that it is important to invest and improve all levels of education, from pre-primary and all the way up to university levels. In terms of the scope of education, there is agreement that one should focus broadly and strengthen both academic, technical, general skills and vocational education. The international development is to a large extent based on technical innovations which all segments of the population need to participate in and utilize. This raises the demand for people of all ages for creativity, cognitive abilities and skills to interact with challenging technologies; hence the importance of life-long education.
It has been well documented that at the same time as education is important for countries to grow, there are strong links between an individual’s educational level and his/her economic achievements. An investment in education is associated with a higher probability of employment and higher income.
The 2004/2005 Household Budget Survey1 (HBS) is one of the most comprehensive and thorough studies from recent years covering central socio-economic issues, and some of its main findings and conclusions are referred to below.
The Survey confirms international findings on the positive correlation between an individual’s educational level and his/her economic achievements referred to above. First it is found that low levels of education of the household head are strongly associated with higher poverty levels2. It is also concluded that income is strongly related to the educational levels of earners.3
These are the economic and often heard arguments for the need of education. Probably equally important is the role of education in establishing the fundamental basis for development of healthy, understanding, creative, harmonious people who take care of each other and engage in their communities and societies, in social settings that are rapidly changing. Education is fundamental for societies to develop and flourish; and for peace, tolerance, equality, participation and thriving and stimulating cultures.
1 The 2004/2005 HBS was published in September 2006 by Office of Chief Office Statistician, Zanzibar 2 HBS Op Cit, page 104 3 HBS Op Cit, page 111
A healthy and educated population leads to increased productivity, better income distribution and improved standard of living, (MKUZA p.43)

5
1.3.1 Adult literacy and enrolment One of the main HBS findings, very relevant to the education sector, is an extreme difference between districts in terms of Percentage of Adult Literate in Any Language. While literacy rate is high (91%) in central urban areas of Unguja, Stone Town (Mjini), it was found to be very low (45%) in the Micheweni district, in Pemba (see following illustration (map)). Average literacy rates vary greatly between districts of the two islands. Illiteracy was also found to be highest among older age groups and declining for younger years. An indication of the fact that the education system for years has had gender balance as one of its main policies is seen in the fact that the gap between males and females in terms of literacy is getting narrower for younger ages. Nevertheless there are still higher levels of literacy amongst males even in the younger age groups.
In terms of enrolment in primary education the HBS stated that of the total population, 3 in every 10 (or 29.6 percent) have no education; 2 in every 5 (or 40.2 percent) have attended, though often not completed, primary education, and 28.0 percent have attended secondary education. This statistics is based on the data collected in 2004/05.
There are great discrepancies between districts in terms of enrolment. Enrolment stands at about 90 percent in Kusini and Mjini districts but is as low as 55.6 percent in Micheweni and below 70 percent at Kaskazini A. Interestingly, no systematic difference in enrolment between sexes by district was found. Percentage of Adult Literate in Any Language

6
1.3.2 Consumption and income issues There are large differences in terms of households’ expenditure. The average expenditure levels are highest in the most urbanized districts of Mjini and Magharibi in Unguja Island. On the other hand, the lowest average consumption expenditures are in the Micheweni district.
Different indicators were developed to assess poverty as part of the HBS. It was revealed that 13 percent of people in Zanzibar live below the food poverty line. Such poverty is more prevalent in rural areas, where about one out every six people are affected, compared to one out twelve people in urban areas. On the other hand 49 percent of people in Zanzibar cannot meet their daily basic needs. As for the food poverty line, the situation is worse in rural areas where more than 50% of the population is poor compared to 41 percent in the urban areas.
There are significant disparities in poverty levels between districts; again Micheweni comes out as the poorest. Almost three quarter of the people in Micheweni live below the basic needs poverty line.
In these contexts where education is agreed to be one of the main prerequisites for social, cultural and economic development, the pressure on the educators and the education administrative system is becoming more demanding. Ministries of Education and other education stakeholders have to deliver more and better. A considerable number of countries are increasing the education budgets in order to speed up social and economic development, and in almost all countries education reforms and other measures to improve efficiency, effectiveness and quality are taking place. The demands on the education management not only come from the local contexts. Also the national, regional and even international levels insist on increasing access to and improve quality of education.
1.3.3 International norm sets for education Education in Zanzibar has also been guided by the policies and international declarations and conventions such as:
- Jomtien Declaration on Education for All (EFA) 1990
- Millennium Development Goals (MDGs) for Education 2000
- Dakar Declarations 2000
- The Convention on the Rights of the Child (CRC)
- Convention on the Elimination of Discrimination against Women (CEDAW)
1.4 Education Sector Policies and Strategies
1.4.1 Prior Education Sector Policies in Zanzibar The policy of education in Zanzibar has for many years been guided by declaration of compulsory and free basic education for all. The Education Act No. 6 of 1982 was amended in 1993, and the Zanzibar Education Policy from 1991 was amended 1995. These sets of norms provided the overall policy orientations. There are specific objectives of ensuring that all eligible children are enrolled in and attend schools, and provided with good and relevant quality of education and equal educational opportunities. Despite the fact that education in principle is free, communities and

7
individuals are encouraged to contribute due to limited financial resources. Over the years communities have contributed considerable resources in terms of financing, work and other inputs for construction of classrooms and for stationeries.
1.4.2 The Master Plan 1996-2006 From 1996 to 2006, education planning in Zanzibar was based on the Zanzibar Education Master Plan, which detailed 15 programs covering all aspects of the sector (but not technical and vocational education which then were under the Ministry of Labour, Youth, Women and Child Development (MLYWCD). The Master Plan was very ambitious. As a result of limited financial resources during the Master Plan period a considerable amount of the targets identified were never met.
Thus, as an educational plan guiding day to day activities for the educational authorities, the Master Plan never became a success. One of the main reasons was that it was not thoroughly grounded - in the sense that responsibilities were not divided and defined among the implementing partners. Another important reason for the limited success of the Master Plan was that the donors, mainly due to international events, only to a limited extent came on board. Thirdly, the plan was probably not sufficiently distributed within the education ministry, the provinces, districts and educational institutions. It became a document which was mainly acknowledged, referred to and known among the top level planners and the donors. Hence, the new Education Policy 2006 for Zanzibar was developed on the basis of a wide-spread consultative process.
However, although not fully a result of a sector wide discussion, the process of developing the Master Plan had important elements of participatory planning, and the Master Plan is even today regarded as a good source of information both for statistics, description and analysis.
1.4.3 The Current Education Policy: Education Policy 2006 The Education Policy 2006 commented that the Master Plan had adopted a project approach in which the efforts to reform and improve the education sector appeared to have been fragmented. Consequently, the approach tended to exacerbate inequities between districts and regions and amplified distortions of sectoral objectives and targets.4
The Education Policy 2006 concluded that there is a need for a holistic education plan approach in which the entire education sector is treated as a single entity and development efforts are better coordinated to ensure harmonization in interventions and development. The Sector Wide Approach (SWAp) underlying the work with the ZEDP is providing answers to some of the questions and issues raised by the experiences with the Master Plan.
4 Education Policy 2006, page 82

8
In its effort to contribute towards achieving economic growth and national development goals, the Education Policy 2006 announces the following strategic objectives:
1. Expand Access and Equity
- Expanding access to twelve years of quality basic education to all starting from pre-school up to the end of secondary (ordinary level/lower secondary level).
- Facilitating access to life long learning whether through the traditional channel of education and training or through work based learning.
- Providing equal opportunities for education especially to vulnerable groups such as people with special educational needs.
2. Improve the quality and effectiveness of education system
- Raising the quality of education so that the learners will be able to develop their own skills and realize their potential as citizens.
- Improving education and training of teachers so that their knowledge and skills respond both to the changes and expectations in society and to the diverse students needs.
- Providing learners with relevant skills required for life.
- Optimizing personnel utilization.
- Ensuring adequate funding of non-salary operational targeted on instructional materials and teacher professional development
- Implementing cost recovery strategies.
3. Ensure access to ICT for teachers, students and education staff - Providing all teachers with skills in the use of internet and multimedia
resources as an important teaching and learning tool.
- Equipping students with computer knowledge and skills.
- Providing work places with computers that could be used in supporting quality and efficiency of education system.
4. Develop scientific and technological competence
- Expanding access to technical and vocational education in scope and geographical coverage to meet the needs of individuals and society.
- Popularization of science and mathematics to schools and society in general.
5. Expand Tertiary Education
- Transforming the Zanzibar society into a human capital able to meet the challenges of the changing environment.
- Expand access to tertiary and higher education for more Zanzibaris
6. Promote Good Governance of Education
- Devolving power and responsibility to lower organs.

9
- Developing a cadre of effective and committed education managers and staff.
- Expanding private and public partnership. 7. Provide a safe and healthy environment for teaching and learning
- Combat the spread of HIV/AIDS and other sexually transmitted diseases.
- Create a conducive, safe and child friendly school environment that is free from discrimination, abuse and harassment.
8. Learners with special needs - To better serve learners with special needs inclusive education shall be
promoted
9. Adaptation of TVET to labour market demands - Technical education and vocational education and training shall be
designed in line with labour market demands.
10. Diversified adult and alternative education - Adult education and alternative education programmes shall be
diversified and revamped
11. Establishing new institutes and organs - A curriculum institute and an examination organ shall be established - A board shall be established to ensure certification and provision of
good quality teaching/learning materials. There shall be a textbook policy.
12. Language of instruction - Kiswahili shall continue as the medium of instruction in public pre-
primary and primary schools except for mathematics and science subjects beginning Standard V where English shall be used.
- English shall continue to be the medium of instruction in post-primary schools except for Islamic studies where Kiswahili shall be used.
13. Recruitment and quality control of teachers - There shall be a single authority responsible for the recruitment of
teachers. - An authority shall be established to ensure quality control of teacher
training. - Teacher training colleges shall be part of the State University of
Zanzibar. - Teachers’ centres shall be used in professionalizing teachers according
to guidelines in force.
14. Inspection of schools - The Inspectorate shall be restructured and strengthened to become an
autonomous body. - Department of Inspection, TCs and Teacher Training Colleges shall
harmonize and coordinate their programmes and activities.

10
15. Role of community and parents - Community roles in contributing to education shall be clearly spelt out. - Clear guidelines on parental contributions to education shall be
developed.
Main reform proposed by the Education Policy 2006 1. A new structure of the Education System.
The structure of the Formal Education system shall be 2-6-4-2-3+ (that is 2 years of pre-primary education, 6 years of primary education, 4 years of secondary education ordinary level, 2 years of secondary education advanced level and a minimum of 3 years of higher education).
2. Changed entry ages
At primary level the entry age shall be six years, at secondary lower level twelve years and at secondary advanced level sixteen years.
3. A new structure for Basic education
Gradually introducing 2 years of pre-school education as part of basic education followed by 6 years of primary education, and 4 years of lower secondary education/secondary education ordinary level.
Pre-primary education as part of Basic Education
Early childhood education for children aged between 4 and 5 years shall be formalized and integrated into the formal education system and shall be a component of basic education
A four-year secondary education shall be provided for all 4. New language policy,
English is to be the language of instruction in mathematics and science from Standard 5

11
2 PRESENT SITUATION AND POLICY DIRECTION: EDUCATION SUB-SECTORS
2.1 Pre-Primary Education
2.1.1 Present Situation MKUZA summarizes concerns related to Early Childhood Care and Development (ECD) as follows:
“Enrolment at the pre-school level of education is still low and teacher quality is inadequate. One area that needs special attention is childhood care and development, a concept that encompasses all children from 9 months to the time these children enter primary schools. Interventions in this regard would include developing a holistic approach to cover care, nutrition, health and education.” (MKUZA p. 43)
Since 1988 the overall enrolment of 4-6 year old children to pre-schools has increased significantly. The current Gross Enrolment Ratio (GER) is 15.6 %. The growth has been most rapid in the private supply of pre-schools and the public share of pre-schools has fallen from 24.8 % in the year 2000 to 15,6 % in 2006. The distribution of pre-schools is highly skewed between the districts and with far more institutions in urban than rural areas.
There are four categories of private pre-schools in Zanzibar: - Quranic centres - Private commercial pre-schools - Community pre-schools registered - Community pre-schools unregistered
Of the 977 teachers in the pre-schools in 2006, around 78 % had undergone some training. However, there is no specific pre-school teacher training college in Zanzibar and the existing training is provided by private institutions. In-service training is supposed to take place in the Teacher Centres (TC), but a weak resource base for the TCs prevents them from expanding their activities.
A curriculum for pre-schools has recently been developed. The Government policy is one teacher per 20 children. The present Pupil Teacher Ratio (PTR) varies substantially between districts and between government pre-schools and private pre-schools. There are also a number of unregistered pre-schools where the PTR is not known.
2.1.2 Policy Directions MKUZA
- Increase Gross Enrolment Rate for pre-school from 15,9 % in 2005 to 35 % in 2010.
Education Policy 2006 - Early childhood education for children aged between 4 and 5 years shall be
formalized and integrated into the formal education system and shall be a component of basic education.

12
- Partnership with parents, communities, NGOs and other stakeholders shall be promoted and strengthened to improve child’s health, nutrition, growth and development.
- A comprehensive policy and guidelines to promote an integrated multisectoral approach to early childhood development shall be prepared.
- Communities and NGOs shall be fully involved in all the operational activities of early childhood education and shall be encouraged to establish ECE centres especially in rural areas.
- The curriculum of pre-primary education shall include Information Communication Technology (ICT).
- Special affirmative actions shall be taken to make early childhood education/pre-primary education accessible to children with special needs.
2.2 Primary Education
2.2.1 Present Situation MKUZA describes the present situation in primary education as follows:
“Most schools are in urban areas therefore reducing access to education by rural children. Compared to boys, girls have less access to education and so do children with special needs. The quality of education is still poor as a result of inadequate numbers of qualified teachers, availability of equipment and laboratory and library facilities. School leavers are unprepared for the world of work. The prevalence of disease, malnutrition, HIV and AIDS/STDs, inadequate changes of attitude regarding reproductive health, and gender-based violence all have negative effects on access to school and achievement.” (MKUZA p.44)
In 2006 the GER in primary school was close to 100% while the net enrolment rate (NER) was lagging behind at 75,7%. Present net enrolment rate stands at 77 %. Enrolment and completion are heavily skewed between districts in Zanzibar, and socio-economic factors show clear correlation with enrolment and completion. Most primary schools are Government schools and only 4% of the pupils are in private institutions. There is gender balance in primary schools in total. However, this varies highly between the districts.
Most schools are overcrowded and many have double shifts (in some schools even triple shifts). The size of classes varies substantially between schools, both within one district and between districts. Thus, the construction of classrooms is a critical issue in some areas. Communities show tremendous efforts by providing labour, bricks and construction up to roof level. The MoEVT provides the remaining inputs. Water and sanitation facilities are often inadequate in many schools.
The situation regarding access and equity calls for an analysis of the underlying reasons for the great variations between the districts in Zanzibar in school provision, enrolment and completion.
The pressure for places in primary school has resulted in considerable backlogs at most schools. Only 29,4 % of the 7 year olds actually start school at the right age, while the Gross Enrolment Ratio in Standard 1 is 91,9 %. Head teachers are obliged to give priority to those who failed to gain entry the previous year. In many cases

13
children up to the age of 14 can be found in Standard 1. The difference between districts is again noticeable. The new policy of Entry Age 6 therefore presents real challenges to the education sector.
It is very common that rapid quantitative expansion of the education system in a country results - at least transitionally – in lower quality of education – measured in terms of student learning achievement. It seems that Zanzibar is no exception to this trend. The SACMEQ5 programme has measured reading skills (SACMEQ I) and reading and maths skills (SACMEQ II) at Standard 6 level. The programme shows results at two levels: ‘minimum’ and ‘desirable’. The data indicate that in SACMEQ I, the percentage of pupils reaching the minimum level of mastery was 45.3 and the one for SACMEQ II was 34.2. The percentage of pupils reaching the “desirable” level of mastery in reading was 7.8 and 2.6 for SACMEQ I and SACMEQ II respectively. These results indicate a low level of learning achievement – as measured by the SACMEQ methods - in the primary schools in Zanzibar.
The average pupil teacher (PTR) ratio at the basic education level is 31:1, with a pupil teacher ratio for public schools 33:1; while in private schools it is 16:1. Inter district comparison figures show that North B district in Unguja has the lowest PTR of 27:1, whereas Micheweni district in Pemba has the highest of 46:1.6
This rather favourable situation with average PTR is counterbalanced by the fact that many schools need to run double shifts, some even triple shifts. The pupils per classroom ratio (PCR) is 84 in general, according to data from 2006 in the Education Management and Information System (EMIS). Again, West and Micheweni show the worst situation, with 138 and 100 PCR respectively.
Curriculum revision will be needed as a result of the introduction of a new entry age in primary education and the change to 6 years of primary education. In addition the decision to expand access to lower secondary education/secondary education ordinary level and make it part of basic education also calls for a renewal of the curriculum. The low levels of student achievement indicate a need for strengthening of science, mathematics and language education in primary schools. The decision to make English the language of instruction from Standard 5 in Math and Science will also demand a major upgrading of competence in English for the relevant teachers.
The textbook situation has improved, but the system is dependent on ad hoc donor support. The Government commissioned a Textbook Policy and Financial Sustainability study in 2006, and the result of the study submitted to the MoEVT in 2007 will form a basis for the Government’s renewal of textbook policy.
The number of teachers in primary schools is sufficient, according to the PTR. But, of the 7 981 teachers in primary schools, 861 or 10,7 % are untrained. Only 446, or 5,5
5 The SACMEQ network (Southern and Eastern Africa Consortium for Monitoring Educational Quality) has completed two major cross-national studies of the quality of education in Southern and Eastern Africa. The SACMEQ I Project (1995-1999) was completed by seven Ministries of Education (Kenya, Malawi, Mauritius, Namibia, Tanzania (Zanzibar), Zambia, and Zimbabwe). The SACMEQ II Project (2000-2003) was completed by fourteen Ministries of Education (Botswana, Kenya, Lesotho, Malawi, Mauritius, Mozambique, Namibia, Seychelles, South Africa, Swaziland, Tanzania (Mainland), Tanzania (Zanzibar), Uganda, and Zambia). 6 The pupil teacher ratios were calculated before the employment of a substantial number of teachers graduating in 2007. The curent PTR for primary education, based on updated figures, are 26 (See Annex IV, table 7 PTR and PCR, p. 149)

14
% are diploma teachers. Recent increases in the number of teachers have been skewed in favour of some subjects, resulting in an unfairly distributed work load among the teachers. English, Mathematics and Science remain understaffed and with teachers lacking the right qualifications. The provision of subject teachers with a diploma in mathematics, science and English to all primary schools is a key area in the implementation of the Education Sector reforms. Teacher training, both pre-service and in-service, is a therefore a question of major importance. Especially the in-service training and the Teacher Centres are of importance to the schools, and the TCs capacity to take on the in-service training programs is another critical area for successful implementation of the reforms.
School Leadership and the way the Head Teacher fulfils his/her school management tasks are crucial in terms of school development planning, school/community relations and staff development. The Education Management programme that was conducted at Nkrumah College during the Education Master Plan period was terminated after the plan period was over, and has not been replaced by a new Education Management programme.
2.2.2 Policy Directions MKUZA
- Increase the Net Enrolment Rate from 77% in 2005 to 90% in 2010
- Increase the proportion of children with disabilities, enrolled, attending and completing school
Education Policy 2006 - The Government shall ensure that all primary school age children are
enrolled at the right age, remain in school in full attendance, perform well and successfully complete primary education.
- School mapping shall be enforced as a strategy to address the problem of disparities between and within districts and provide a supportive learning environment to ensure learning takes place.
2.3 Secondary Education
2.3.1 Present Situation Transition from Standard 7 of primary school into Form 1/Orientation Secondary Class (OSC) of lower secondary school has traditionally been somewhat above 50 %. The examinations at the end of primary education which act as a filtering mechanism provide opportunities for only a small percentage of students to enter biased secondary schools (Education Policy 2006, p. 14).
In 2006, 21 679 students sat for the Standard 7 exam, 15 471 (66, 4%) were admitted into lower secondary schools. Of these 794 were allowed into form 1 biased school, the rest went to OSC classes. (EMIS, 2006)
The OSC classes were abolished from the school year 2007, so this year the intake into Form 1 was 41 000 students. This abrupt rise in intake might represent serious challenges to the quality of the teaching and learning process in lower secondary

15
education/secondary education ordinary level, thus negatively affecting learning achievements.
Transition from Form 2 to Form 3 is low, barring around 50 % of the students from access to the third year of lower secondary education/secondary education ordinary level.
Although the percentage of students who pass Form 2 exam has increased in the period 2001 to 2005, still more than half of the students are excluded from starting Form 3. Education Policy 2006 states that “the majority of students who fail the Form 2 National Exam either join continuing education classes, vocational training centres or join the army of unemployed basic education graduates.”(Education Policy 2006, p. 15)
The policy statement in MKUZA, that the transition rate through the Form 2 examinations shall increase from 47, 6 % in 2005 to 70 % by 2010, therefore represents a big challenge, due to the present lack of available secondary school classrooms.
In 2006 the promotion rates in secondary education were:
- For each 100 students starting in Form 1, 86 continued into Form 2 - Among these 86 students, 43 continued unto Form 3 - Among these 43 students, 37 continued into Form 4 - Among these 37 students, 11 continued into Form 5 - Among these 11 students, 9 continued into Form 6
The sum of policy direction and targets in MKUZA and Education Policy 2006 points to a fundamentally new role for secondary education in Zanzibar, describing a future situation where “a four-year secondary education shall be provided for all.” (Education Policy 2006) This would mean a dramatic increase from the present level of a gross enrolment rate of 26,2 % in Form 3-4.
The present secondary education provision is not adapted to the considerable increase in access set forth in the policy documents. There is a need to revise and reform secondary education, and its exam format, in light of the new policy of lower secondary education/secondary education ordinary level for all and also expanded access to upper secondary education/secondary education advanced level.
The Zanzibar Basic Education Improvement Project financed through a credit from the World Bank, makes provisions for increased access and improved quality in secondary education through the financing of 19 new schools, rehabilitating 6 schools, provision of textbooks and in-service upgrading for close to 4000 teachers (both primary and secondary), Head teachers and key personnel in the education sector.
The number of teachers in secondary schools is projected to increase from the present level of 2 867 to 3 858 by 2016, fortunately this increase will happen at the end of the period, giving the Government time to plan and implement the measures necessary to ensure that the appropriate number of teachers with the required levels of qualifications will be available. The percentage of teachers with diploma and degree is projected to rise from the present levels 1 157 and 314 to 2 508 and 1 350 respectively.

16
There is a considerable variety between districts in the gender balance in secondary education. Measures to address the gender imbalance must therefore be targeted to the relevant districts, and the level of secondary education where the difference is greatest. The underrepresentation of girls is highest in Micheweni and North A districts, and it increases through the Forms in all districts.
Providing secondary education in Zanzibar is expected to remain a predominantly public task with little growth in the present percentage of students attending students attending private schools (5%).
2.3.2 Policy Directions MKUZA
- Increased transition rate at Form 2 examinations from 46.9 percent in 2005 to 70 percent by 2010
- Increased Net Enrolment Rate from 36.1 percent in 2006 to 75 percent in 2010
- Increased proportion of girls who join lower and higher secondary education from 46 percent in 2005 to 50 percent by 2010
- Increased percentage of qualified secondary school teachers
- Improve quality of secondary education and promotion of the acquisition of knowledge
- Increased proportion of orphans and vulnerable children and children with disabilities who join secondary education (MKUZA p. 45)
Education Policy 2006 - Four years of secondary education shall be provided for all.
- Development of secondary education of quality shall be based on proper and adequate planning.
- Alternative approaches to formal secondary education shall be developed to provide opportunities to learners outside the formal system.
- A supportive school environment for students with special needs shall be provided.
- The secondary school curriculum shall include ICT. (Education Policy 2006, p. 14)
2.4 Technical and Vocational Education and Training
2.4.1 Present Situation In Zanzibar one Technical College and two biased secondary schools provide specialisation in technical education. Karume Technical College (KTC) is the only institution in Zanzibar providing technician certification in a wide range of areas, including Electrical Engineering, Mechanical Engineering, Civil & Transportation, Telecommunications and Auto mechanics. Entry to KTC is Tanzania National Examination (Form 4). In 2006, KTC had total enrolment of 208 students, of which 62 (30%) were female students according to Ministry’s EMIS. Most of KTC’s students come from the only two biased secondary schools in Zanzibar which provide

17
specialisation in technical education. Previously, KTC used to offer FTC (Full Technical Certificate), but starting from 2007 a new system called NTA (National Technical Awards) under a new board namely National Council for Technical Education (NACTED) has replaced FTC. In addition, there are 3 skills training centres, one in Pemba and two in Unguja.
Several institutions provide post-secondary education for specific sectors and fall under the responsibility of other line ministries. These are the College of Health Science, the College of Agriculture, the Zanzibar Institute of Finance Administration and the College of Hotel and Tourism. In addition, various private institutions offer courses in such fields as computing and information technology. MoEVT organises evening vocational training which recruits dropouts from Form 2 to Form 4 as well as people in regular work who need some more skills training.7
Vocational and education training institutions in Zanzibar have very limited resources and materials in inadequate workshops and laboratories.8 Training therefore relies on theoretical and class-room based activities. Instructors in training centres have been assessed as inadequate and in many cases are unqualified to meet the challenges of teaching the skills that are needed to meet the demands of Zanzibar’s development. Great efforts and large resources are needed in order to improve vocational competence in Zanzibar. In some sectors of the Zanzibar economy, such as tourism, hotels and restaurants there is considerable import of manpower both for highly qualified personnel and for lower categories of workers. It is estimated that the total employment in the tourism and hospitality industry is around 8,000.9 The Zanzibar Commission for Tourism suggests that only 40% of the employees are recruited locally.
Assessment of the Vocational Education and Training (VET) sub-sector10 concludes that there are:
- Barriers in the formal education system which have an impact on the skills training system
- Lack of coherence in the system
- Lack of relevance of the system to employment opportunities
- Lack of internal and external efficiency and
- Lack of equity in the system.
The Act of Vocational Education and Training from 2006 prescribes the establishment of a Vocational Training Authority (VTA) to develop policy guidelines specifying the roles of the public sector and private sector in the provision of technical and vocational education and training (TVET) in Zanzibar. Strengthening of the technical and vocational sub-sector will have important positive impacts in two main areas: one is related to strengthening of relevant competence in the country and the
7 In 2005 332 trainees sat for VETA examination from this training. 8 This is confirmed by reports from the consultants doing background studies for the ZEDP and Canadian Technical and Vocational Group “Technical Support Services for the Establishment and Operation of Skills Development Centres in Zanzibar”, 2004. (report 2: p. 9) 9 Source: Technical Support Services for the Establishment and Operation of Skills Development Centres in Zanzibar: First Status Report, June 2004, which refers to The Zanzibar Commission for Tourism (ZCT) estimates. 10 Ibid

18
other is related to the need to reduce the pressure of the growing number of school leavers and also of students dropping out of the school system.
2.4.2 Policy Directions The Education and VET Policies are two policies with common targets. However the main emphasis within the Education Policy 2006 is on Technical Education, while VET Policy has broad statements which focus on providing Vocational Training for those who complete basic education, to tertiary education, and even school dropouts.
The four broad policy statements in the Education Policy 2006 correlate with the VET Policy statements and strategies, and both of them correspond with the MKUZA operational targets of enhancing entrepreneurial skills among youth. The following common policy statements are from Education Policy, VET Policy and MKUZA:
- Entrepreneurial skills among the youth shall be enhanced
- Technical and vocational education and training shall be designed in line with labour market demands
- General secondary schools shall provide pre-vocational training and pre-technical skills as a means for introducing and exposing young people to various career possibilities
- A single body responsible for coordinating, regulating, controlling, evaluating, certifying and monitoring technical and vocational education and training shall be established
2.5 Teachers and Teacher Education
2.5.1 Present Situation There are three factors which determine teacher requirements: student numbers, classroom availability, and subject specialisation of teachers.
Presently there are 7981 teachers in public primary schools and 2867 teachers in secondary schools in Zanzibar. The supply of primary teachers is generous. The average pupil teacher ratio at basic education level is 31:1, well below the Regional average, the EFA target of 40:1 and the national benchmark referred to in Education Policy 2006 of 40:1. The pupil teacher ratio for public schools is 33:1, while in private schools it is 16:1.
With the projected rise in number of students in secondary school, there is need for close to 1 000 new teaching positions in secondary education, but this rise in demand comes the last year of the ZEDP period – 2016.
While the system seems to have enough teachers in terms of numbers the first part of the ZEDP period, their distribution or deployment is questionable. Inter district comparison figures show that North B district in Unguja has the lowest pupil teacher ratio of 27:1, whereas Micheweni district in Pemba has the highest pupil teacher ratio of 46:1. At primary level Urban, West and Central districts have a higher proportion of female teachers, and a higher proportion of qualified teachers than the average. The number of teachers has further been skewed in favour of some subjects. English, mathematics and science subjects remain understaffed, resulting in both an unfairly

19
distributed teaching load, but more seriously to a large number of Zanzibari pupils not getting quality teaching in key subjects.
The majority of primary teachers are qualified. 83% of primary teachers have a teaching certificate, obtained through 2 years of study following O level (lower secondary) or as an in-service course. 10% are unqualified, and close to 6% have higher qualifications (diploma or degree level).
At secondary level current policies require that teachers with a diploma level qualification teach only up to Form 2. For Form 3 to Form 6 teachers should have degree level qualifications. Currently close to 50 % of secondary teachers are unqualified (qualifications of certificate or less), 40 % have a diploma and only 11% have a degree or higher.
For the past 5 years, Zanzibar has followed a policy of primary teacher specialization, and teachers are trained in one of three subject groups, humanities, mathematics/science or Arabic/Islamic studies. Mathematics teachers are in short supply. Nearly half of all primary teachers have a qualification to teach Kiswahili, but only 16% have a qualification to teach mathematics. In practice, mathematics is often taught by teachers without a mathematics qualification.
There is a similar shortage of mathematics teachers at secondary level. Only 187 secondary teachers (8% of the total) are qualified to teach mathematics. As mathematics is a compulsory subject at O level, where students typically study 7-8 subjects, it might be expected that between 13 and 14% of teachers would be required to teach mathematics. The shortage is reflected in a greater teaching load for mathematics teachers, while teachers in other subjects take fewer classes.
The language of instruction in primary schools is Kiswahili, while secondary schools teach through English. English is been taught as a subject in primary schools, 5 years ago the introduction of English was changed from Standard 3 to Standard 1.
Current policies state that English is the medium of instruction for mathematics and science from Standard 5 of primary schools. English is not a requirement for entry to teacher training, although the teacher training is done through English. It is reported that student teachers frequently find it difficult to work through English. In practice, the poor level of English is a barrier to quality, and teaching is often done using a mixture of Swahili and English.
The sum of what has been described above is a considerable need for systematic upgrading of teachers in the education sector to reach the required levels of qualifications, both in general terms – education level – as well as in specific subjects.
To improve the quality of teaching the National Teacher Resource Centre and the 9 Teacher Resource Centres provide training courses, support and supervision to schools. The training involves a great variety of subjects. The Basic Education Improvement Project plans to upgrade teachers in both primary and secondary schools through short courses in the 9 TCs. 500 secondary teachers and 1039 primary teachers will be trained in mathematics and science, and 2000 primary teachers in English. In addition also 300 head teachers, 30 inspectors, 36 subject advisors and 9 TC coordinators will be trained. These trainings include more than 60 weeks of training in each TC during a period of 2-3 years. The TCs has a weak resource base, with one coordinator and 4 subject advisors, but no distinct budget to run their courses, except for contributions from teachers and schools. The program plans to hire more trainers, but it is important to be aware of the danger that the training described above might

20
overstretch the capacity of the TCs and they will with the present resource base not be able to take on other assignments.
The teacher training system is currently undergoing reorganization. The main teacher training college, Nkrumah Teacher Training College (NTTC) is being absorbed into the State University of Zanzibar, and will not produce any teachers after the current cohort completed in June 2007. However, this transfer will increase capacity in SUZA, which is expected to offer a diploma course for existing unqualified teachers in these facilities.
Following the absorption of NTTC into SUZA, there will be four major state-financed teacher training institutions in Zanzibar: (i) CCK Muslim Academy, (ii) Benjamin Mkapa college in Pemba, (iii) the State University of Zanzibar (SUZA), and (iv) CCK in Pemba:
- CCK is primarily a training college for teachers of Islamic Studies and Arabic, offering a certificate course for primary teachers and a diploma course in Islamic Studies and Arabic for secondary teachers. In 2006 a new diploma course was launched offering science subjects for secondary teachers.
- Benjamin Mkapa College on Pemba offers only certificate courses for primary teachers, with one third in mathematics/science subjects. A new diploma course will be established.
- The State University of Zanzibar (SUZA) offers degree courses in education.
- SUZA is considering offering diploma courses to replace those ending at NTTC, but there are no specific commitments on this as yet.
- CCK Pemba is both a secondary school and a teacher training college offering certificate courses.
In addition there is a private institution, University College of Education Zanzibar (UCEZ), which offers degree level courses. Many of its students are teachers on leave from their schools (estimated 75%), and others are from abroad.
Hence, in 2007, the total output of trained primary teachers will be 2,097. Of these 57% will be teachers of Islamic studies and Arabic, 28% humanities, and 13% mathematics and science. In the following year the numbers will fall as there will be no further output from NTTC. This will reduce the overall output and further increase the disproportionate output of teachers of Islamic studies and Arabic.
The output of teachers of mathematics is a particular concern. As all students at O level study mathematics, approximately 13-14% of teachers (650 in total) will need to be able to teach mathematics. Currently there are three institutions preparing secondary mathematics and science teachers, but only one of these (NTTC) is preparing mathematics teachers. In 2008, the only output of mathematics teachers will be from UCEZ, where the first cohort of 30 mathematics and physics teachers is in its penultimate year.
More than 97% of teachers in Zanzibar are originally from Zanzibar, and Zanzibar is dependent largely on its own output of trained teachers to meet the requirements of its education system. The potential expansion of intake into teacher training is constrained by the output of suitably qualified students emerging from secondary

21
education. In 2006 there were 1 457 students at Form 6, approximately 4% of the number in Standard 1 in primary school. Both the number of students sitting the A level examination, and the pass rate have grown over the recent years. In 2006, 1 005 students sat for the exam and 970 (96.5%) passed. However, there are still very small numbers passing in some key subjects. In 2006 only 53 students passed A level mathematics, less than the total number of mathematics teachers required for secondary teaching.
Teachers are employed as permanent Government employees, and paid according to fixed scales. Starting pay is determined by qualifications, and teachers are placed on an incremental scale with fixed annual increases. In addition to their basic pay, teachers receive a teaching allowance of 25% of salary and a housing allowance of 10% of salary. Teachers are paid a transport allowance which is either 5,000 Tsh per month, or actual travel costs, where these are greater. In the extreme cases, actual travel costs can exceed 1,000 TSh per day.
2.5.2 Policy Direction MKUZA MKUZA does not describe interventions on teachers specifically, only the following notions on quality in the education system.
- Poor quality of education
- Shortage of qualified teachers
- Limited capacity and skill in gender and participatory approaches
- Inadequate incentives for teachers especially those working in deprived areas
- Limited powers of school management bodies
Education Policy 2006
“EFA Goals direct nations to enhance teachers’ status, morale and professionalism. Teachers are essential players in promoting quality education whether in schools or in more flexible community based programmes. EFA stresses that teachers at all levels should be respected and adequately remunerated. Teachers should have access to training, continuing professional development and support. Professional development and efficient management of the teaching force are crucial factors in raising the relevance and quality of education. A well qualified and motivated teaching force is one of the determinants for the promotion of high achievements.”(Education Policy 2006, p. 40 )
2.5.3 Teacher Recruitment and Deployment - There shall be a single authority responsible for the recruitment of
teachers.
- Recruitment of teachers shall be transparent, demand based and done through competitive examinations to ensure employment of high quality teachers.

22
- Teachers shall be given the experience to work in rural and urban areas for a period determined by Government as part of their professional development and equitable distribution and deployment of teachers.
- The number of untrained teachers shall not exceed 10% of total number at any given time and at any given school.
2.5.4 Teacher Career structure and remuneration - There shall be a clearly defined career path for teachers based on
experience, performance and training.
- There shall be established a body responsible for regulating teachers’ terms and conditions of service.
- A comprehensive annual/biannual peer review system shall be instituted to guide appraisal of teachers based on the scheme of service.
2.5.5 Teacher Training - An authority shall be established to ensure quality control of teacher
training.
- Training duration shall be determined by skills, knowledge and competences required.
- Teacher training programme shall be innovative and flexible to accommodate changes.
- Teacher training colleges shall be part of the State University of Zanzibar.
- In-service training of teachers shall be regular, well planned and part of teachers’ professional development.
- ICT shall be promoted in teaching as a tool to enhance teaching/learning process.
Teachers’ Centres - Teachers’ centres shall be used in professionalizing teachers according to
guidelines in force.
- The network of Teachers’ Centres shall promote the exchange and dissemination of experiences, innovations and research results especially via ICT.
2.6 Higher Education
2.6.1 Present Situation Several institutions provide post-secondary education at both tertiary and higher education levels in Zanzibar. Higher education in Zanzibar is currently provided by the Government and two private institutions, namely the State University of Zanzibar (SUZA), the Zanzibar University (ZU) and the University College of Education (UCE) Chukwani. SUZA and UCE provide courses in languages, social sciences and general science with education and computer science whilst ZU offers courses in law, sheria and business administration.

23
The three universities in Zanzibar had in 2006/2007 a total enrolment of 2 758 students, distributed as follows: SUZA (767 of which 208 are female); UCE (578 of which 198 are female) and ZU (1 413 of which 583 are female).
In addition to the three universities, there are also opportunities for higher education provided through the Open University of Tanzania in Zanzibar. Furthermore, a number of Zanzibari students are pursuing higher education in Tanzania Mainland and outside the country. In 2006/2007, there were 111 students (39 female and 72 male) in various higher learning institutions in Tanzania Mainland while 148 students (24 female and 124 male) were studying overseas. The table below show the distribution of Zanzibari students in institutions in Zanzibar, mainland Tanzania and overseas. Enrolment of Zanzibaris in Tertiary and Higher Education Institutions in Tanzania and overseas
Institution Male Female Total
State University of Zanzibar 250 191 441
University College of Education 319 220 539
Zanzibar University 251 90 341
University of Dar es Salaam 6 4 10
Institute of Finance Management 16 10 26
Business College 9 4 13
The Social Work Institute (SWI) 4 2 6
Hubert Kairuki Memorial University 8 3 11
Institute for Rural Development and Planning, Dodoma 8 3 11
Institute of Technology, Dar es Salaam 7 0 7
University of Mzumbe 1 1 2
Islamic College, Morogoro 1 0 1
The Dar es Salaam College of International Relations Diplomacy 0 1 1
Kivukoni College 4 2 6
Bagamoyo Secretarial College 3 2 5
Institute of Judicial Administration (IJA) 3 1 4
Technical College, Mbeya 1 0 1
The Dar es Salaam Secretarial College 0 1 1
Tumaini University 0 1 1
Dar es Salaam School of Accountancy 1 0 1
The Primary Health Care Institute (OHCI), Iringa 0 1 1
The Arusha School of Journalism and Mass Communication 0 3 3

24
Institution Male Female Total
Overseas institutions 124 24 148
Total 1016 564 1580
Source: MoEVT EMIS, June 2007
A number of institutions offer tertiary education in Zanzibar. Those under MoEVT include Karume Technical College (KTC), Islamic Colleges (in Unguja and in Pemba), the former Nkrumah Teacher Training College and Benjamin Mkapa Teacher Training College in Pemba. KTC is the only tertiary institution in Zanzibar offering technical education in four engineering fields namely Electrical, Mechanical & Automobile, Civil & Transportation and Electronics & Telecommunication. By March 2007 KTC had a total enrolment of 228 students (54 female and 174 male). Apart from KTC, the other tertiary institutions under MoEVT are teacher training institutions. (See Teacher Education sub-sector)
One major reform of teacher education in Zanzibar is the Government’s decision to dissolve Nkrumah Teacher Training College and fuse its activities and programmes to SUZA. Nkrumah used to offer both Certificate and Diploma courses in teacher education and was the main college for the production of primary and secondary school teachers. While the Certificate course was relegated to the Islamic Colleges in Unguja and Pemba and Benjamin Mkapa TC (BMTC) in Pemba, the Diploma course was absorbed by SUZA which will start offering it in the academic year 2009/2010.
Other tertiary institutions in Zanzibar outside MoEVT include: Zanzibar Institute of Finance Management (ZIFA-under MoFEA), College of Health Science (CoHS-under MoHSW), College of Agriculture (Kizimbani) (CoA-under the MoA) and Hotel and Tourism College (CoHT-under MoFEA).
Staffing is also a problem at the tertiary institutions level in that there is a lack of adequately qualified staff. But the main challenge at this level is generally lack of opportunities for further studies and/or upgrading programmes for the staff.
In Zanzibar, just like in Tanzania Mainland, students at tertiary and higher learning institutions finance their studies through the Higher Education Students Loan Board (HESLB). The Zanzibar Higher Education Loan Board (ZHELB) has been established, in addition to the HESLB, to cater for the Zanzibari students only. The total number of students supported by ZHELB in 2006/07 was 1 580.
2.6.2 Policy Directions MKUZA
- Increase proportion of graduates of tertiary education institution
Education Policy 2006 - Government shall encourage public and private sectors to expand access to
higher education, respond to the diversified socio economic demands and expand the frontiers of knowledge.
- Special efforts shall be made to raise the participation rate of Zanzibaris in higher education including taking affirmative measures to increase enrolment of female students and those with special needs.

25
- Universities shall strive for quality to meet market demands and for intellectual excellence and become instruments for national research and development.
- Universities shall develop outreach programmes. - Higher education institutions shall establish a credit unit system to provide
for more flexibility and for transferability of students among institutions to allow for individual student’s interest pursued at his own pace.
- Programmes and courses offered at higher education institution shall be reviewed, streamlined and rationalized for cost – effectiveness.
- Higher education institution shall employ advanced information technologies to link faculties and specialized schools for multimedia course delivery and for administrative functions
2.7 Non-formal, Alternative and Adult Education
2.7.1 Present Situation The RGoZ acknowledges the indispensable role of non-formal, alternative and adult education - not only as contributors to an education that is not limited and tied to formal education - but also as the crucial factor towards social and economic development of the people and society. Thus, this sub-programme primarily addresses the need of the out-of-school children and youth, as well as adults, both those without literacy skills and those with literacy skills who would wish to upgrade and expand their knowledge, qualifications and professional or vocational skills.
The programmes of this sub sector, therefore, provide a framework for education and self-education activities at work and in the wider society, within and beyond the ‘formal’ classroom, the curriculum and examination. In so doing, the sub-sector will redress inequalities in access to education and therefore, access to knowledge and learning opportunities, thus empowering and tapping the human potential of the disadvantaged social groups and communities towards achieving economic growth and poverty eradication in Zanzibar.
Several centres for the out-of-school youth have been established in various schools in Zanzibar during the last years. Currently, alternative education centres have been established in 18 schools, and the total enrolment is 760 students. In 2006/2007, a total of 317 children and youth from the alternative education classes were mainstreamed into formal schools. 5 out of 17 youth who sat for the National Standard Seven Examinations passed and joined technical secondary schools. The task of developing curriculum for eight subjects in alternative education, namely English, Kiswahili, Kiarabu, Mathematics, Science, Social Sciences, Vocational Training and Islamic studies has been accomplished.
On adult education, in 2006/2007 there were 9 451 adults (of which 7 354 were women), who attended literacy classes. More importantly, a total of 5 571 adults (4 383 women and 1 188 men) representing 80% of the examinees, passed a literacy test in that year. In the same year, 631 adults (75.1%) passed the Level 4 literacy test and thus, were declared literate. Currently, there are 8 520 adults attending literacy classes.
Progress has been achieved on continuing education and lifelong learning. In 2006, there were 53 continuing education centres with a total enrolment of 4 877 students

26
whilst by March 2007 the corresponding figures were 61 centres and a total enrolment of 5 215 students. The focus of the continuing education programme has been on the fields of law; technical/vocational, in particular in domestic science, carpentry and joinery and electrical installation; book keeping/accountancy as well as in Form 4 and Form 6 subjects.
Officially inaugurated in 2006, the new Alternative Learning Centre at Rahaleo in Zanzibar has become an attractive option for learners who have either dropped out from primary school or never have been enrolled in any primary school at all. This centre offers primary education based on the three-year condensed curriculum, primarily for out-of-school youth of age group 15-19 years old. A certificate will be received after having passed primary school examination. Inaugurated in 2006, the centre has no experience with the full cycle as yet. The centre has introduced various skills training, such as cookery, tailoring, carpentry, computer training in addition to primary education. Attendance in these courses is high.
2.7.2 Policy Directions The key policy statements and operational targets for the sub-sector are:
MKUZA - Ensure equitable access to demand driven quality education which is
gender and environmentally responsive
- Increase literacy rate from 75.8% in 2005 to 100% in 2010
- Increase literacy rate for women from 69.8% in 2005 to 100% in 2010
- Increase gender sensitive youth training and employment
Education Policy 2006 on Adult Education - Adult education shall be promoted, strengthened and regulated in
collaboration with other partners.
- Adult education shall be diversified and revamped to meet the various and changing needs of learners and society.
- A continuing education programme shall be developed within the context of lifelong learning catering for the needs of different learners wishing to complete education or continue learning.
Education Policy 2006 on Alternative Education - Alternative education programmes shall be diversified and expanded to
provide basic education and pre-vocational learning opportunities to meet the needs of learners who are unable to benefit from formal schooling.
- Government shall provide incentives to NGOs, CSOs to establish and manage alternative education programmes for out-of-school children and youth.

27
3 PRESENT SITUATION AND POLICY DIRECTION: CROSS-CUTTING ISSUES
3.1 Education Management and Decentralisation
3.1.1 Present Situation The Ministry of Education and Vocational Training is overseeing a sector that has grown considerably the last 15 years. About 20 years ago there were 60 schools in Zanzibar, today the number has risen to more than 300. The growth in the education sector will continue: According to the ZEDP, at least 19 new schools will be constructed, and the ambitions on enrolment described in MKUZA and Education Policy 2006 indicate a steady growth in the number of students in the primary and secondary schools in Zanzibar. In addition there are ambitious policy targets for growth in the number of children in pre primary education, which will in the future be part of basic education.
The MoEVT has been, and still is, highly engaged in operative decisions at the district and school level that date back to the time when there were few schools and before the time the District Education Offices were established (1975).
As part of the preparation for the ZEDP the Government commissioned a study on managerial capacities in the Education sector. This study points to the underutilization of the District level in the way the education sector is managed today:
“The District Offices visited were very poorly equipped with limited or no transport facilities to visit schools. As for staffing, each Office is in principle headed by a DEVTO (District Education and Vocational Training Officer) assisted by a DEO (District Education Officer), plus a limited number of officers in charge of specific education areas such as Adult Literacy and Alternative Learning, Vocational Education, Sports etc. The total staff employed in the Districts visited varied between three and five, but in bigger districts the numbers can go up to seven or eight.
Under the present circumstances, it is not clear what the decentralized levels of administration are really adding that could make the education service delivery more efficient. Their most useful contribution seems to be in visiting schools and other education institutions regularly (if at least they have transport and operational funds). Seen from that angle, their role − if adequately streamlined and properly integrated within the overall education management system − is close to that of a supervisor who has to control but also support schools in order to make sure that they are functioning well. However other actors are also supposed to visit schools for more or less similar purposes, e.g. the inspectors who are, for the time being, all stationed at central level, either in Unguja or in Pemba, who are insufficient in number and who are too far away from the schools in order to be able to visit them regularly. There seems to be general agreement that the supervision system in Zanzibar (which has both an administrative and a pedagogical dimension and in both cases a control and support function) is not functioning well.” (Assessment of Management Capacities, report prepared for the MoEVT, March 2007, p. 20)

28
Now and even more so in the coming years, new tasks at the national and strategic level need to be handled by the Ministry. ZEDP is one example of such a task. The Ministry therefore needs to free up time and resources to manage these new tasks. Therefore the MoEVT will have to reduce its engagement in some of the tasks that can be handled at the regional, district or school level.
The salaries of the REOs and the DEOs are paid by the Ministry of Local Government, and they are in placed in the staff of the Regional and district commissioner respectively. This dual line organizational structure means that there are certain limitations to the autonomy of the MoEVT in matters regarding its local level educational managers. Future reforms in the local government set up will also affect the Education Officers. However, for administration of the education sector, both the analysis and the proposals in the ZEDP are based upon the assessment that it is up to the MoEVT to organize the distribution of tasks and responsibilities within the education line organization from the Ministry, through the region and district and to the schools.
As past of the ZEDP preparation, 40 key work processes in the education sector have been identified, and 34 of them reviewed regarding who does what part of the work process today. Changes have been proposed in 13 of these work processes, which will free up some time for the MoEVT to focus on the kind of tasks at the national and strategic level that only the Ministry can handle.
3.1.2 Policy Directions MKUZA
- Decentralising school management and changing the role of central level bodies to facilitation, monitoring and evaluation in order to improve access and quality of education. (MKUZA p.50)
- Enhanced decentralisation functions at the District level. Strategic interventions to achieve these targets include: Developing and implementing a decentralisation strategy Reviewing and implementing local government reforms (MKUZA p. 54-55) Reorganising MDAs (Ministries, Departments and Agencies) with a focus to improving operational efficiency and reduce the duplication of work. (MKUZA p. 57)
Education Policy 2006 - The structure (of MoEVT) should
- give managers at all levels the appropriate authority and resources to do their job effectively
- clearly, define the roles and responsibilities or lines of authority and delegation
- establish effective lines of communication and define relationships.
- Regional and District Education officers shall be educationists capable of providing sound guidance and support to schools and at the same time providing leadership in planning, personnel management and leading the development of the education system. (Education Policy 2006 pp. 46-48)

29
3.2 Gender
3.2.1 Present Situation The goal of gender equality is strongly articulated in Zanzibar’s Education Policy of 2006.
MoEVT has a special focal person for promoting gender issues in the education system and it appears that MoEVT deals relatively extensively with such issues. The main tasks for the gender focal person revolve around advocacy and sensitization, in particular in connection with youth and communities. The MOEVT gender focal person is a member of Zanzibar’s Convention on the Elimination of Discrimination against Women (CEDAW) committee. There is no specific technical committee on gender (Gender TAC) within the MoEVT.
Gender parity in enrolment has by and large been achieved in basic education. The gap in enrolment is narrow, and in some cases boys’ enrolment even fall behind that of girls. There is no doubt that continuous efforts to sensitize the parents and the communities at large over the last decade have yielded positive results. MoEVT is working in partnership with several international organizations to promote gender equality e.g. UNICEF, UNFPA, AKF. The local chapter of FAWE has, together with MoEVT, initiated several pilot activities addressing girls’ education. Focus has been on addressing the gender specific gaps in mathematics and science at secondary schools, specific training of female teachers who teach science as a subject, and Science Camps for Girls have been among the prioritised areas.
It should also be noted that commendable progress has been made in Zanzibar with regards to gender disaggregated statistics. However, there are still considerable gender inequalities at higher levels of education as well as in specific types of education and fields of study. One of these areas is mathematics and science. Teachers with science qualifications are usually male. The current shortage of science teachers is a reflection of choices made by the students in TTC. Three subject groups can be studied: humanities, mathematics/science or Arabic/Islam studies. The majority of students in the TTCs are females who opt for humanities (Arts). This choice appears to be closely associated with the choices of humanities as field of study in Form 2 and 4. The majority (70%) of teachers at the primary school levels is female, whereas at secondary level nearly to-thirds are male (64%).
It is reported11 that particularly female teachers prefer to be located in the relatively urbanized areas of Urban, West and Central districts. At primary level, these three districts have a higher proportion of female teachers, and a higher proportion of qualified teachers than average, but relatively high pupil teacher ratios. The rural districts of North A and B, and the four districts on Pemba have fewer female teachers and slightly fewer qualified teachers.
At secondary level, the overall patterns are less marked. Urbanized areas have the greater proportions of qualified and female teachers. Unguja has lower PTR and more qualified and female teachers than Pemba. However, there are stark differences in the distribution of teachers of particular subjects, such as mathematics. In Micheweni district there are only two qualified teachers with mathematics as their major subject,
11 WB Teacher Profile 2006

30
giving a ratio of over 1,900 students for each. By contract, in Urban district there is a qualified mathematics teacher for every 467 students.
Specific gender–based problems may also occur in some areas of the country and not in others. In some coastal areas boys tend to start later than girls in schools because they help out in the fishing sector. Despite Government policy to re-enter, there are still problems for pregnant girls to come back again to school after delivery. In general little is known about why girls and boys drop out or their different reasons for this.
Regarding transition to secondary education, girls sit for Standard 7 examination and are selected more often than boys to proceed to Form 1 in all districts in Zanzibar, except Micheweni districts, as shown in the graph below. National Exam Standard VII and Selection to Form 1 by District 2006
Source: Budget Speech 2005/06
Form 2 examinations are the real milestone of education in Zanzibar as this presently is the completion of the compulsory basic education system.
There are some striking features:
- The pass rate did not exceed 50% for either boys or girls in any of the examinations.
- The gender gap is narrowing and in 2005, girls had a pass rate of 48.2% as compared to boys 47.0 %
In terms of numbers sitting for this examination the increase for both boys and girls has been significant. In 2005 38.3% more boys and 37.6% more girls were sitting for the National Examination in Form 2 than in 2001.
Boys are more likely to go on to “A” level than girls. Few boys and girls, who pass the Form 4 examination, have good enough grades (Division) to be selected to the “A” level of Secondary School. Of the relatively small number of students who make it to the “A” level, there are more boys than girls.
In 2005/06, 579 boys and 426 girls sat for the final secondary school national examination, or Form 6. Of those who make it to this level, more than 96% pass. There is no difference between boys and girls with regards to pass rates. In terms of performance, however, the proportion of boys who scores for the top DIV I is higher
0
500
1000
1500
2000
2500
3000
Examinee Boys 2128 2156 849 459 948 475 747 1015 890 965 Examinee Girls 2405 2357 952 476 894 464 624 972 979 924 Selected to Form 1 Boys 1640 1505 418 283 478 277 528 813 626 487
2113 1956 581 381 620 332 382 773 775 503
Urban West N."A" N."B" Central South Micheweni
Wete Chake Mkoani

31
than for girls, but at the next best level DIV II the proportion of girls is higher. However, the total numbers are very small.
3.2.2 Policy Directions Pre Primary education
- Integrate gender equality in ECD interventions(MKUZA)
- Provide relevant, appropriate and gender responsive early childhood care especially to vulnerable children and children with special needs. (MKUZA)
- Develop capacity of teachers and caretakers in ECD and gender (MKUZA)
Primary education - Ensure all (boys and girls) children including those with disabilities,
orphan and other most vulnerable children are able to effectively access and complete high quality primary education (MKUZA)
- Improve school environment including gender friendly (MKUZA)
- Develop and implement effective policies, strategies and activities to eliminate gender based violence (MKUZA)
- Promote science mathematics and technology in upper primary schools for teachers and pupils (MKUZA)
- Sensitize community on importance of girls’ education (MKUZA)
Secondary education - Establishing single sex schools with boarding facilities (Education Policy
2006).
- Promote science mathematics and technology in Lower secondary schools for teacher and pupils (MKUZA).
- Providing counselling services and creating opportunities for married students, pregnant girls and young mothers to continue with education (Education Policy 2006).
- Recruiting and training more female teachers for secondary schools (Education Policy 2006).
- Introduce gender responsive pre-vocational education in secondary education (MKUZA).
- Develop relevant and gender sensitive secondary education curriculum and the introduction of alternative means of delivering secondary education including the use of ICT (MKUZA).
- Sensitize community on importance of girls’ education (MKUZA).
- Improve existing school environment including gender friendly (MKUZA).

32
Tertiary education - Providing counselling services and creating opportunities for married
students, pregnant girls and young mothers to continue with education (MKUZA).
- Collaborating with other stakeholders to promote gender equity in education (MKUZA).
- Establishing links with the ministry responsible for youth, women, employment and child development, ministry responsible for finance and economic affairs, and NGOs (Education Policy 2006).
- Address HIV/AIDS, STDs, RH and gender issues in higher learning institutions (MKUZA).
- Promote education of women and PWDs in higher learning institutions (MKUZA).
- Increase participation of girls in science, math and technology (MKUZA)..
- Establishing single sex schools with boarding facilities (MKUZA).
- Expand the intake male and female secondary school teachers in teacher training institutions (MKUZA).
Management Level - Strengthen the MoEVT capacity to implement and monitor effectively
program that promote girl education.
- Collaborating with other stakeholders to promote gender equity in education (MKUZA).
- Develop and implement effective policies, strategies and activities to eliminate gender based violence (MKUZA)
3.3 Special Needs and Inclusive Education
3.3.1 Present Situation The Education Policy 2006 underlines the RGoZ policy commitment to address the education needs of children with development disability. Enrolment of Children with Development Disabilities 2006
Government
Pre-Primary
Private
Pre-Primary
Government
STD1-Form 2
Private
STD 1-Form 2
Urban 5 36 455 62
West 4 52 571 20
North A 3 2 236
North B 3 2 286
Central 2 0 221

33
South 2 3 143
Micheweni 3 3 369 2
Wete 5 2 485
Chake 2 5 390
Mkoani 0 3 396
Total 29 108 3552 84
Source: EMIS 2007-02-06
The private sector is the largest supplier of pre-primary services to the development of disabled children. Between Standard 1 and Form 2, enrolment is largely to be found in the government schools. Statistics indicate that there is a gender discrepancy in enrolment, in favour of boys. However, too little evidence is yet known about enrolment, attendance and completion rates for this group of pupils. Enrolment of Children with Development Disabilities Pre-Primary to Form 2 (Gov. and Private) by District
Enrolment of Children with Development Disabilities Pre-Primary to Form 2 (Gov't &
Private) by District
0200400600800
10001200
Urban
WestN. "A
"N. "B
"
Central
South
Michewen
iWete
Chake
Mkoan
i
No Disabled (0-19 agegroup) Census 2002 2006 Enrolment Pre-Primary-Form 2
Source: Based on Census Data from Each District, 2002 and EMIS Data 2006.
Caution need to be made in analyzing these data. Firstly, during the Census, respondents volunteered with information. In Zanzibar it has been known that some parents are reluctant to provide information about the development needs of their children. Secondly, in cases where enrolment figures are high, there is a concern that the school environment is not conducive. Interaction with teachers and other students may often not promote a positive learning process for children with development disabilities.

34
MoEVT has taken several steps to address the situation and has so far linked up with three NGO partners to promote inclusive education in the mainstream education system (primarily at primary level):
- ZAPDD12 with NFU13support
- MKEZA , a project with USAID support, now discontinued.
- WHY14
In total these projects have registered 1 523 children who have special learning needs in these pilot areas. The number is increasing every day.
The ZAPDD/NFU project was carefully based on a Needs Assessment which was conducted in partnership with MoEVT. After having screened 100 schools, 20 schools were chosen as pilot schools. The pilot has included training of teachers, development of materials, module-based manuals and some adaptation in the school environment. An independent evaluation report of the project came out in March 2007. There is some confirmation that promising experiences have been gained and that it is possible to greatly improve these children’s learning opportunities with relatively modest means.
The MKEZA included only smaller components of inclusive education, and according to the MoEVT Unit for Inclusive Education, much of the support was in the form of delivery of teaching and learning aids. Children and schools selected as beneficiaries have not been systematically followed up. The third project, WHY, is relatively new, and implementation has not yet started in the six pilot schools in the South.
Unicef15 states that the group of identified vulnerable children that in particular seems to be deprived, are children living with disability. Enrolment in formal education is substantially below enrolment levels of other children. Unicef finds it financially feasible to ensure full enrolment of disabled children, both in mainstream schools and by establishing special schools/educational support.
It should be noted that the process of including topics of inclusive education in teacher training curriculum has begun at the Islamic College. This promising start might possibly be mainstreamed to all pre-service and in-service training programmes. Physical constructions need to be particularly concerned with accessibility for all, and MoEVT would probably benefit greatly had Zanzibar had more specialists in various fields of development disabilities.
Based on the preparation work of the ZEDP it is hence concluded that:
- There as inadequate documentation on the nature and extent of disabilities for school going children.
- Hearing, speech and sight are the most common known disabilities.
- Wrong perception of some parents and teachers about inclusion of children with disabilities in schools as they think that this will result in poor performance of the non-disabled children.
12 Zanzibar Association for People with Development Disabilities 13 Norwegian Association for People with Development Disabilities 14 World Home for Youth Italy 15 Update of the Situation of Women and Children in Zanzibar. Research on Poverty Alleviation, Oct.2006
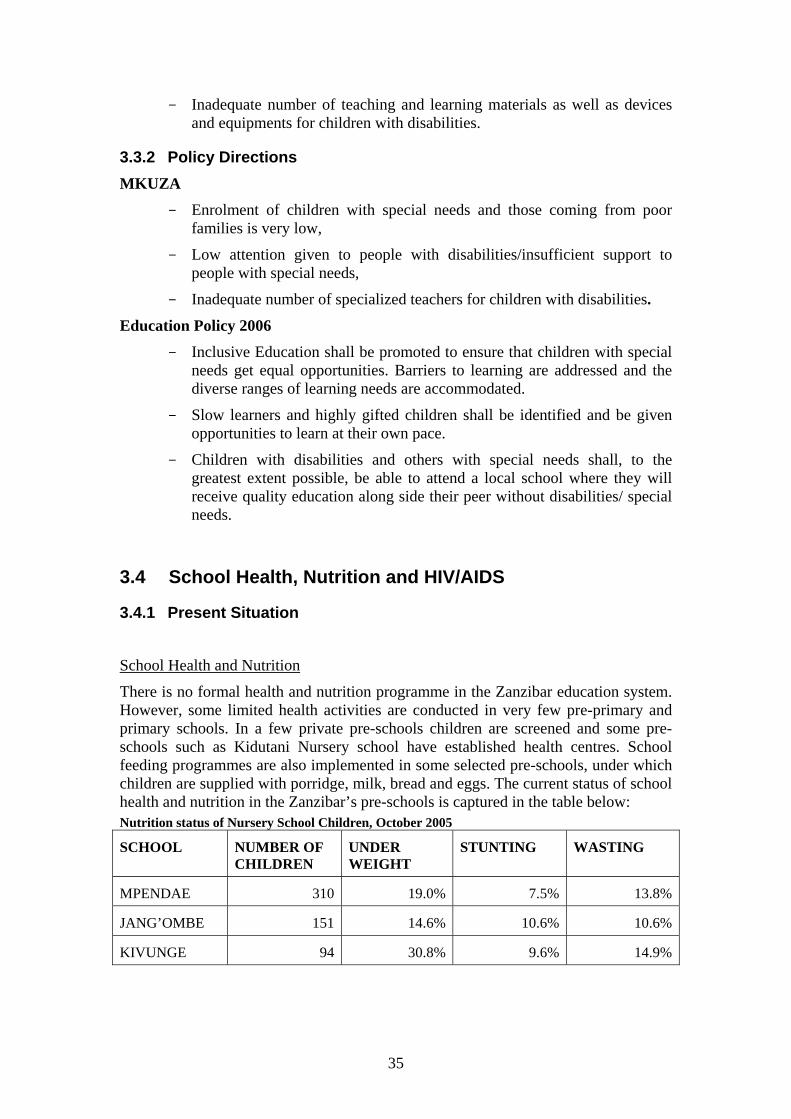
35
- Inadequate number of teaching and learning materials as well as devices and equipments for children with disabilities.
3.3.2 Policy Directions MKUZA
- Enrolment of children with special needs and those coming from poor families is very low,
- Low attention given to people with disabilities/insufficient support to people with special needs,
- Inadequate number of specialized teachers for children with disabilities.
Education Policy 2006 - Inclusive Education shall be promoted to ensure that children with special
needs get equal opportunities. Barriers to learning are addressed and the diverse ranges of learning needs are accommodated.
- Slow learners and highly gifted children shall be identified and be given opportunities to learn at their own pace.
- Children with disabilities and others with special needs shall, to the greatest extent possible, be able to attend a local school where they will receive quality education along side their peer without disabilities/ special needs.
3.4 School Health, Nutrition and HIV/AIDS
3.4.1 Present Situation
School Health and Nutrition
There is no formal health and nutrition programme in the Zanzibar education system. However, some limited health activities are conducted in very few pre-primary and primary schools. In a few private pre-schools children are screened and some pre-schools such as Kidutani Nursery school have established health centres. School feeding programmes are also implemented in some selected pre-schools, under which children are supplied with porridge, milk, bread and eggs. The current status of school health and nutrition in the Zanzibar’s pre-schools is captured in the table below: Nutrition status of Nursery School Children, October 2005
SCHOOL NUMBER OF CHILDREN
UNDER WEIGHT
STUNTING WASTING
MPENDAE 310 19.0% 7.5% 13.8%
JANG’OMBE 151 14.6% 10.6% 10.6%
KIVUNGE 94 30.8% 9.6% 14.9%

36
At primary education level there is de-worming exercise conducted by the Ministry of Health and Social Welfare (MoHSW). The table below shows the district coverage of this programme. De-wormed exercise – May/June 2006
District Schools Target Children
Children de-wormed
Percentage
SOUTH 15 9,239 9,377 101.5
CENTRAL 29 19,925 18,436 92.5
NORTH. A 25 22,801 23,672 103.8
NORTH. B 14 11,007 10,416 94.6
URBAN 20 37,712 34,921 92.6
WEST 29 39,683 42,474 107.0
In the Country Report Presentation on School Health & Nutrition16, it is revealed that the previous school health and nutrition programme included activities like:
- Health and nutrition screening
- Dental services
- Health and nutrition education
- Physical exercises
- De-worming
- Environmental sanitation
HIV/AIDS
The current prevalence rates of HIV and AIDS in Zanzibar is much lower than the neighbour countries in East Africa. The 2002 HIV and AIDS Validation Study observed that the HIV prevalence rate in Zanzibar was 0.6% and that women showed infection rates that were found to be six times higher than their male counterparts. Those most at risk were identified to be the substance users, commercial workers, men who have sex with men, those working in special circumstances (men in uniform) and mobile population such as traders, fishermen who are usually away from their home for extended periods as well as female domestic employees.
Even though Zanzibar is a low prevalence country, there is growing concern about the vulnerability of young people in schools and colleges in Zanzibar. Thus, there is a need to put in place programmes that will promote a change in young people’s behaviour so that they are less vulnerable to HIV infection as, so far, there is very little being done in schools and colleges on HIV/AIDS and sexual reproductive health. The only two occasions when Sexual Reproductive Health is taught in secondary schools are in Biology classes in Form 2. Students are also taught HIV in
16 In the Country Report Presentation on School Health & Nutrition, presented by Mr. Othman Juma Maalim and Mr. Juma Omar from Zanzibar at the International Workshop on School Health and Nutrition, held at the Institute of Medical Research in Kenya (KEMRI) Nairobi in March 2007,

37
Form 3 in the Civics subject and the Moral Ethics and Environment Studies (MEES), which include HIV/AIDS in those schools where the MEES programme is being piloted. In response to the epidemic the RGoZ has already implemented a number of programs since the mid-90s. A major achievement is the establishment of a special national focal point, the Zanzibar AIDS Commission, which has a mandate in areas of coordination, mobilisation and advocacy inclusive of monitoring and evaluation. ZAC is an autonomous body17 and has developed a National HIV/AIDS Strategy and Plan for 2003-2007. An inter-ministerial TAC has been established. However, every ministry works by itself and there are no joint projects or inter-sector activities.
The MoEVT has developed its Strategic Plan for Mainstreaming HIV/AIDS into the Ministry’s core functions in 2005. The Government’s commitment to combat spread of HIV/AIDS is reiterated in the Education Policy 2006. All education institutions at all levels are to integrate HIV/AIDS into the curriculum. Special youth clubs are to be established at school levels.
A special HIV/AIDS Focal Person in MoEVT has been assigned to coordinate the activities. Focus is on prevention and protection. The Counselling Unit and Gender Focal Person are especially active, and they work closely together with the HIV/AIDs Focal Person.
“Life skills” is an important component of the educational approach, and there is close relationship between MoEVT and UNICEF. A “Life Skills” manual have been produced for teachers, and some follow-up training provided.
As a consequence of the increased number of children with parents suffering from HIV/AIDS, the operational definition of Most Vulnerable Children (MVC) should be expanded and broadened so that it includes not only all orphaned children (i.e. children without father and mother) but also children whose parents are either health-wise or economically not sound. Orphans should include not only children who do not have parents but also those whose parents are so sick or bed-ridden that they can support neither their children nor themselves.
3.4.2 Policy Directions MKUZA
- Integrated cross cutting issues into education system. (Gender, environment, population, HIV and AIDS, employment and disaster preparedness)
- Improved health status including reproductive health survival and well being of children, women and vulnerable groups.
- Improve sanitation and sustainable environment.
- Improve food and nutrition security among the poorest, pregnant women, children and most vulnerable groups
On HIV/AIDS
- Reduced HIV and AIDS prevalence among 15-24 years pregnant women from 1% in 2005 to 0.5% in 2010
17 Established by the Act no 3 of 2002

38
- Reduce stigma surrounding HIV and AIDS” from 76% in 2005 to 60% by 2010
- Increase the proportion of population with comprehensive correct knowledge of HIV and AIDS from 44% of women and 20% of men to 80% of general population by 2010
- Increased condom use among women at least higher risk sex from 34% in 2005 to 80% in 2010.(MKUZA, page 46 Box 7)
On Sanitation and sustainable environment
- All schools and other public places have adequate sanitary facilities by 2010.
- Reduced environmental degradation
On health (food and nutrition)
- Reduced level of under nutrition amongst children under the age go five
- Reduced number of children under the age of five children with stunting from 23% in 2005 to 10% by 2010
Education Policy 2006 - Clear Policy guidelines on HIV and AIDS education in the education
sector shall be developed
- HIV and AIDS education shall be mainstreamed into Ministry core function
- Students, teachers and staff infected with or affected by HIV and AIDS shall not be discriminated against, excluded, suspended, expelled or harassed by Education institutions on the basis of the HIV and AIDS status
- A multi-sectoral comprehensive approach shall be adopted in promoting a healthy and safe school environment
- The child’s personal health, security and safety shall be essential components of the education programme
3.5 Information and Communication Technology (ICT)
3.5.1 Present Situation Information and Communication Technologies (ICTs) are technologies used to communicate, create, manage, and distribute information. A broad definition of ICT includes computers, the internet, telephone, television, radio, satellite, copiers and audiovisual equipment. The ability for users to communicate, collaborate and exchange information online is especially important for the Education Sector. In this context, ICTs typically refer to audiovisual equipment, television, satellite, computers, computer networks and the internet. Increasingly other devices are being used for network or internet access, such as, hand held portable or digital assistants (PDA) and mobile phones. ICT is an effective tool of development for individuals in this era of knowledge economies and economic globalization and impacts everyone.

39
Throughout the world, ICT is changing the face of education. It is changing the nature of work and the workplace. This means that education systems must respond adequately. A precondition is an educational force of computer literate individuals. Zanzibar has been left behind in socio-economic development compared to other countries around the globe. To catch up, Zanzibar needs to embrace ICT as a means of innovation and knowledge sharing. This means it must build up its capacity to use ICT, starting in the classroom. Schools should play the critical role of making Zanzibar communities ICT competent. Learners must master the use of ICT as well as the technology and language of ICT. It provides educators with a powerful tool to enhance learning opportunities for students and professional development opportunities for teachers. The use of ICT will enable learners to use ICT as a resource for learning. Teachers on their part will use ICT as a resource for teaching and communication. ICT as a technology and a language has the potential for creating job opportunities for many young people. For knowledge workers, it is a tool for research and information dissemination. The importance of policy and strategic framework for ICT in education cannot be overemphasized.
In preparation for the ICT Policy in Education, a baseline study was conducted in year 2005 to determine the state of ICT in the Education Sector. The following are some of the important findings:
Teacher Training Nkrumah Teacher Training College is the oldest and the main teacher training college in Zanzibar. The College had 3 computers available for staff and student use. These computers were not used in the practice of teaching and learning. The computers were used for basic computer applications such as word processing and creating spreadsheets rather than as a teaching tool. There was no internet access at the time of the Baseline Study. However, it was mentioned that internet service would soon be available.
Teachers’ Resource Centres There are nine Teachers’ Resource Centres (TC) in Zanzibar; five located on Unguja and four on Pemba. Each centre has a cluster of schools within its zone making the teacher centre a focal point for in-service training and the production of curriculum resources. Each centre has a small library and facilities to produce visual aids and learning material. Most Teachers’ centres use computers for word processing and simple record keeping. None of the centres use computers for producing visual teaching materials. The computers were relatively new and most were running Windows XP.
All of the TCs have a video camera, video player and a printer. Four TCs have a television; one TC has a radio; another TC has a scanner; another telephone; none of the TCs have internet, projector, or a photocopier. Three of the TCs do not have electricity. 53 of the 99 staff in the TCs use computers at a fundamental skill level. Miti-Ulaya TC has trained staff in ICT to an advanced level.
ICT in Primary and Secondary Education Unguja and Pemba have 298 public schools located in 10 districts. Less than 20% of schools have computers. Of these, the number of computers is small; one or two in each school. Only 13 (5%) of schools offer any ICT training and less than 3% use ICT in teaching. Of the 7 534 teachers, 268 (5%) were trained in ICT and were ICT literate; 17 of the 47 schools with computers have an ICT coordinator with varying

40
degrees of experience. With 349 computers available in schools, the ratio of the computers to student ratio is low.
Maintenance and Electricity The EMIS database (2006) shows that 23 (7%) of the 349 computers in the schools were found not to be working. Several printers photocopy machines, televisions, videos, UPS, and air condition units were in need of repair. 51 (14%) of schools had air conditioners and 180 (50%) of schools had fans in computer rooms. 73% of schools had no electricity; 22% were on the national grid; 3% used a generator; and 2% used solar power. There were 199 UPS units to protect computers and printers against power surges.
Private Training Providers There are 15 private training providers in Zanzibar. Some of these organizations offer internationally recognized qualifications such as International Computer Driving License (ICDL) and CISCO (CCNA). All the centres offer basic training in computer applications. 90% of the centres are in urban West of Unguja. All the centres offer basic training in computer applications. Most training providers have internet access.
Internet Cafes According to the baseline study of 2005, there were 54 internet cafes in Zanzibar of which 95% were located in urban west region of Unguja. The internet cafes have 216 computers averaging 4 computers in each centre.
Internet Service Providers There were two Internet Service Providers in Zanzibar with 1200 subscribes. They offer both wireless and dial-up access. Dial-up costs are USD 35 per month and wireless is USD 50 per month per computer.
Status of ICT Policy The Zanzibar ICT Policy still on paper work under the Ministry of Information Culture and Sports. The absence of this document has affected the growth of ICT initiatives in Zanzibar.
3.5.2 Policy Directions MKUZA
- Develop and implement ICT policy in the respective Miniseries’ areas of responsibility
- Develop relevant and gender sensitive secondary education curriculum and the introduction of alternative means of delivering secondary education including the use of ICT
- Develop and implement comprehensive ICT in education policy
- Promote the use of ICT in teaching and learning in schools and institutions
- Expand ICT infrastructure coverage in schools and communities
- Provide affordable Internet facilities to education and research institutions
- Integrate ICT based curriculum in post primary education institutions
- Promote pre-service and in-service training to teachers on ICT

41
- Design a tracking system for ICT graduates
- Emphasise Public Private Partnership (PPP) in ICT for education
Education Policy 2006 - ICT shall be promoted for office use and networking
- Computer education shall be introduced in schools, colleges and other education institutions
- The use of interactive potential on Information and Communication Technology in the provision of lifelong learning, anytime, anywhere shall be employed

42
4 PROGRAMME OVERVIEW
4.1 Programme objectives The ZEDP programme has been designed to be the main instrument in meeting the goals of the Education Sector Policy 2006, which in turn is reflecting the Vision 2020 for Zanzibar, the Poverty Reduction Strategy for Zanzibar (MKUZA), the MDGs and the EFA goals.
About 100 participants were invited by the MoEVT to take part in a planning exercise in June and September 2007. In the workshops the participants were asked to familiarize themselves with the Education Policy 2006 and MKUZA, look at the present situation in their respective areas18 and propose activities and outputs that would move their respective areas in the direction of the policies. The majority of the participants came from the MoEVT, including Districts and Regional Education Offices, secondary schools, but other stakeholders also participated: The Zanzibar Teachers Union, the Ministry of Finance and Economic Affairs, the Ministry of Information, Culture and Sports, representatives from the Universities, Aga Khan Foundation, Aide et Action, CARE, Changamoto Life Preservation Fund, DAMA, UNESCO, UNICEF, UNFPA and FAWE, Zanzibar. The proposals from these groups have been prioritized by the MoEVT and are integrated in the ZEDP.19
All of the policy documents have different levels of ambition and timelines of their targets and the ZEDP targets are first and foremost based on the Education Sector Policy projected for the 8 years 2008/2009 to 2015/16.
These targets have taken into account the present status of the sector as presented in previous sections, priorities according to the policy, projected future school age population (target group), reforms to be implemented to improve efficiency and effectiveness of the sector as well as projected available domestic resources to sustain sector investments and service delivery functions.
From the above the overall objectives for ZEDP are: • Increased and more equitable access to education. • Improved relevance and quality of education throughout the sector.
These overall objectives have been translated into specific sector and sub-sector targets.
18 The following areas had been defined:Education subsectors: Pre-primary education, Primary education, Secondary education, Technical and Vocational Education and Training, Teachers and Teacher education, Higher education, Non-formal, Alternative and Adult education. Cross-cutting issues: Education Management and Decentralisation, Gender, Special Needs and Inclusive education, School Health, Nutrition and HIV/AIDS and Information and Communication Technology (ICT) 19 The proposals from the Technical working groups are documented in two reports on file in the MoEVT: One from the June workshop and the other from the September workshop

43
4.2 Overall ZEDP targets
4.2.1 Equitable access To increase enrolment, infrastructure must be in place to accommodate the growing number of students. The ZEDP has provisions for the necessary infrastructure program in all sub sectors to achieve the enrolment targets set for the respective sub-sector. Among the new education facilities to be built and equipped during the ZEDP period are 19 new secondary schools, a new campus at SUZA, regional facilities for technical and vocational training and a number of educational facilities will be renovated.
The enrolment target in pre-primary education is set at 70 % by 2016 with 30% by pre-primary age children enrolled in public pre-schools, in primary education at 75 % by 2012 and 90 % net enrolment rate by 2016 with net enrolment rate for Standard 1 pupils at 100%.
In lower secondary education/secondary education ordinary level the ambition is a rise in net enrolment rate to 75 % by 2012 and 90 % by 2016 while for upper secondary education/secondary education advanced level the increased net enrolment rate is targeted to be 50 % by 2016. For TVET and Higher education the enrolment rate is targeted to rise by 20 %. The latter is to be achieved by increased percentage of lectures given by staff employed at Universities and reduced use of external, part-time lecturers by 2012. It will significantly improve efficiency and average unit costs in higher education institutions per graduated student is targeted to be reduced by 15% by the end of ZEDP as a result of these interventions.
Equitable access to education has been translated to achieving equal opportunities for all by expanding access to twelve years of quality basic education to all, starting from pre-school up to lower secondary education/secondary education ordinary level with targets as mentioned above for respective subsector. It has also made provisions for providing equal opportunities for education to be inclusive for vulnerable groups such as people with special educational needs. It has been translated into reduced illiteracy among children with special needs and other vulnerable and marginalised groups by increasing their access to quality education.
4.2.2 Relevance and Quality Increased relevance of education is another central area in ZEDP. Relevance is key to ensure that education can be an important contributor in the Government’s efforts to reduce poverty through sustained economic growth and improved opportunities for employment, including self-employment, for the people of Zanzibar.
Curriculum reform will be implemented in primary and secondary education and curriculum reforms linked to the needs of the labour market will be the basis for curriculum adjustments in TVET and higher education. A curriculum for pre-primary education will also be introduced during the ZEDP period.
The ZEDP includes a number of measures to be implemented across the education sector to improve quality of education: Teacher upgrading in relation to new curricula; targeted teacher education programs to increase the availability of qualified teacher in areas like mathematics, science and languages and available equipment, textbooks and learning material. The main target is to ensure that all teachers meet the minimum required qualifications at all levels. Another is to ensure qualified teachers

44
are equitably distributed across Zanzibar by employing an improved system for recruitment and an incentive based system for deployment to areas with recruitment problems.
A reform of secondary education to adjust it to the new reality of lower secondary education/secondary education ordinary level for all, and higher secondary education for the majority of students, will be planned and implemented, with revision of subject structure and examination system as important components.
The exam results are already being used actively in some districts as a means to see which schools need particular support. This use of exam results will be expanded in a pilot program in two districts of school self-evaluation. Results from SACMEQ will be used systematically as a basis for targeted efforts of improvement of future SACMEQ results.
4.3 Strategy During the planning of ZEDP, RGoZ has identified clear strategic priorities that focus on quantitative, qualitative and equity aspects of educational service delivery. Although the sector has a multitude of demands that ought to be addressed in order to reach the targets RGoZ has set in its policies, the limited human and financial resources require that in the coming years, RGoZ has focussed only on the core interventions that are of strategic importance if the sector is to realize its broader vision by 2020. It is in this context that the RGoZ has identified strategic priorities.
Firstly, to effectively respond to development challenges, ZEDP address the quantitative aspects through increased enrolments that aim to reach the global Education for All and Millennium Development Goals for basic education.
As lower secondary education/secondary education ordinary level becomes part of basic education in Zanzibar, the policy of having lower secondary education for all, which is a cornerstone in the ZEDP, becomes part of RGoZ’s ambitions to reach the EFA and MDG for education.
Secondly, the quality aspects of delivery during the ZEDP period will be addressed by equipping teachers and Head teachers with the requisite skills (through investing in teacher and head teacher training and professional development); facilities (such as teaching and learning materials as well as adequate school infrastructure, including libraries and laboratories), and providing improved teacher supervision and support. Reforms of the curricula will be part of quality improvement and the strengthening of developmental relevance of the education system according to the changes prescribed in the Education Policy 2006.
Thirdly, with regard to the Government policy of equitable access to education at all levels, ZEDP will address this through both formal and alternative modes of delivery in partnership with key stakeholders and development partners. It is in connection with the equity concern, as well as to facilitate RGoZ own strategic planning, that ZEDP also gives priority to a school mapping exercise. Thus, Education sector mapping will be among the first activities to be implemented under ZEDP.
The objectives of the components linked to overall sector objectives and broad descriptions of the main activities that will be undertaken during the ZEDP period are presented below and summarised in the Programme Framework matrix annexed to this Programme Document (Annex I). A more detailed implementation plan for the components will be presented in annual work plans and budgets (AWPBs).

45
For operational convenience, it was decided to present ZEDP programmes, as well as the budget for their respective activities on the basis of sub-sector (as reflected in MoEVT organization structure) and key cross cutting issues, rather than a more conventional classification of broad thematic areas such as access, quality, equity, efficiency and effectiveness, as is often done in other education plans. This decision was informed by the realisation that, to the extent that actual activities are undertaken by sub-sectors, allocations are better applied and, hence, linked to the respective sub-sector. This also allows for better visibility of resource allocation linked to overall sector targets and consequently improves resource tracking that is important in monitoring.
Subsequently the programme has been divided into several components, partly by subsector and partly by specific areas of intervention across sub-sectors, but which in total will all contribute to the above objectives and in reaching the sector targets for the ZEDP programme period.
The ZEDP has accordingly been designed with the following program components:
1. Education Sector Management and Decentralization
2. Teacher education
3. Teacher recruitment and deployment
4. Pre-primary education
5. Primary Education
6. Secondary Education
7. Technical and Vocational education and training
8. Higher Education
9. Non-formal, alternative and adult education
10. Gender
11. Special needs and inclusive education
12. School health, nutrition and HIV/AIDs
13. Information and communication technology – ICT
In the formulation of the priority interventions under respective component, other programme and projects funded by external partners have been integrated, like the World Bank funded Basic Education Improvement Project, support from BADEA to construction of new campus at SUZA, two of the five new regional Technical and Vocational Training Centres and an Alternative and Vocational Training Centre funded by ADB.
In the following each of these programme components are described in more detail.

46
5 COMPONENT 1 - EDUCATION SECTOR MANAGEMENT AND DECENTRALISATION
5.1 Objectives The specific objectives of this component are:
- Strengthened MoEVT capacity to do needs assessment for policy adjustment, based on widely accepted quality planning tools.
- Strengthened MoEVT capacity to develop and implement policies and programs, based on these needs assessments.
- Strengthened MoEVT capacity to monitor conditions and results at the school level; plan and implement changes to improve conditions and results at the school level, in particular by developing and utilizing management resources at the district and school levels.
The objectives will be achieved through three sub-components which fall under the headings of Mapping Sector Capacity for Service Delivery, Education Sector Management, Regulatory and Oversight function and Decentralisation.
5.2 Mapping sector capacity for service delivery
5.2.1 Rationale For the most part of the previous Education Master Plan period (1996-2006), the education sector, like all other sectors, in Zanzibar experienced considerable reduction in available resources, in particular development resources, which adversely affected the sector’s development plans. With more than 90 % of the recurrent education budget going to payment of salaries, there was little left - not only for development expenditure - but also for maintaining and rehabilitating the existing schools and other institutions in education sector.
The implementation of ZEDP will accordingly start with getting a comprehensive picture of the reality on the ground of all schools and other institutions in the education sector. Hence, the mapping exercise will be one of the first program components to be undertaken under ZEDP. The purpose is to establish and use reliable and objective criteria for description of the actual school realities in terms of infrastructure, equipment and teacher resources as basis for planning education sector and subsector development.
5.2.2 Outputs The main outputs under this sub-component will be:
- A mapping instrument for pre-schools, primary and secondary schools and non-formal and adult education centres developed and tested
- Mapping exercise of all schools and non-formal and adult education centres conducted
- Standards defined for pre-schools, primary and secondary schools and non-formal and adult education centres

47
5.2.3 Activities Among the specific activities which will deliver the above are:
- Development of mapping tool to be pre-tested before undertaking the survey (school census). Identify existing pre-, primary, lower secondary and secondary schools in all 10 districts and their respective infrastructure conditions including demarcation of school sites, conditions and number of classrooms, other facilities as well as staffing and number of students.
- Undertake a similar mapping exercise of all non-formal and alternative education centres as well as literacy activities in the country.
These activities will be supported by external professional assistance.
One important outcome of this exercise will be to fully update the EMIS database in MoEVT and information related to allocation of staff as well as needs for upgrading of existing facilities. In addition the mapping exercise will give the basis for defining minimum standards for school buildings and teaching and learning materials at the different levels.
5.3 Education sector management
5.3.1 Rationale The ZEDP study to assess the management capacities in the Ministry at central and decentralized level, found that the capacity of MoEVT to plan and implement education reforms as required in a sector development program such as ZEDP was limited. It therefore concluded that the need for capacity enhancement had to be addressed as a central part of the ZEDP program.
The present staff situation in MoEVT is that the total number of employees involved in the administration of the education system is 1,345 (977 in Unguja and 368 in Pemba). This figure may appear large in view of the relatively small size of the education system. However, the majority of employees are not directly engaged in any technical or professional work but are occupying various support positions.
In MoEVT only a relatively small number of staff has obtained a Diploma or a bachelor’s degree or a master’s degree: less than 120 in the Ministry offices in Unguja and 37 only (all diploma holders) in the office of Pemba. This group of officers represents the professional staff of the Ministry. Many of them are not specialized in a field which corresponds to their current position. If there is overstaffing in MoEVT, it is at the level of support staff, while there is a critical shortage of well-qualified professional staff.
In the light of the above, the MoEVT Management recognises that considerable level of management efficiency and effectiveness have to be developed and retained in a sustainable manner if the ZEDP is to be implemented with reasonable achievement of the described targets. Thus, capacity strengthening of MoEVT and its staff has been prioritised in ZEDP through specific intervention in the short to medium term, among others in the form of long term Technical Assistance providers. One of them will support MoEVT in annual planning and budgeting, program management and monitoring. The other will support MoEVT implementation of the findings of organisational and functional review of the Ministry undertaken as part of the preparation of the ZEDP to adjust the roles and functions of departments and

48
positions to reflect changes following sector reforms as well as increase capacity requirement and new functions in light of the overall capacity increase in the sector (ref. ZEDP sub-sector components described below).
The capacity building needs identified during the ZEDP preparation process have been assessed from a holistic perspective. Although technical skill development is the core focus of this program component, other dimensions of capacity building which relate to the organizational set up (including the material working conditions) and the creation of a supportive environment, have also been addressed. This component of ZEDP has not only taken into account the gaps that exist today but also, and more importantly, the upcoming challenges deriving from the implementation of the other components under ZEDP.
MoEVT will review its current recruitment procedures in order to make them more competitive. The purpose is to do away with the current practice whereby most employees continue entering the Ministry offices via the teacher career and very few professionals are directly recruited, even for highly specialized tasks. More public announcements and job offers will be made, broadening the pool of possible candidates and attracting staff with higher levels of qualification.
As part of the ZEDP programme formulation process 14 different tasks and processes currently managed by the MoEVT have been identified as tasks that can be delegated to the regional, district or school levels. The focus was to identify tasks that can be transferred from the Ministry to free up time for the Ministry to focus on the core national and strategic tasks that can only be done at this level. Thus delegation of authority and de-concentration of tasks give an opportunity to rationale use of resources and improve efficiency and quality of service delivery in the sector at large. It enables the MoEVT to focus on oversight functions at the national level by delegating those tasks where the MoEVT does not add value to the work process to lower levels of the education system. As a first step first 10 tasks identified will be delegated to the lower levels of the education sector by the second year of ZEDP.
5.3.2 Outputs The main outputs under this sub-component will be:
- Basic planning skills for the MoEVT to disseminate and process information to be used for projections; programme design; preparation of operational plans and monitoring of programme implementation, and;
- Improved MoEVT capacity to undertake its strategic and oversight functions at the national level.
5.3.3 Activities Taking into account the current situation of planning in the Ministry, and the challenges deriving from overall management responsibility for the implementation of ZEDP, a three-pronged approach for skill development is being proposed through reinforcement of generic skills, essential skills in the use of computers and in leadership and communication:
- Training in the use of computers will concern all professional and key support staff at central, DEO, TC and school level.

49
- Specific groups will receive more specialized skills in ICT: e.g. training of TC staff in the use of ICT for the production of teaching materials.
- All Department Directors and Division Heads will receive training in leadership and communication. This will be done through one or two short term workshops (including practical assignments and discussion) followed by a follow-up workshop several months later.
- Basic planning skills will be developed throughout the Ministry. All Department Directors and Division Heads will receive training on the use of data including use of projections; programme design; preparation of operational plans and monitoring of programme implementation. It will take the form of a learning-by-doing approach using the ZEDP programme planning and monitoring instruments as tools (including the sector demand and resource allocation forecast model developed as part of ZEDP preparation process).
- In a medium to long-term perspective, selected Ministry staff will be provided with advanced training in planning in general. At the same time, other staff will be given opportunity to deepen their competencies in specific technical areas.
The reinforcement of specialized skills will need a combination of different modalities (participation in short-term courses and workshops; hands-on training and coaching directly linked to practical tasks). Full use will be made of skill development resources available in the country (in training institutions, in the MoEVT, in other ministries), on the mainland and in the region.
5.4 Regulatory and oversight function
5.4.1 Rationale Another key element under this component is the Department of Inspectorate ,currently a department within MoEVT.
Improvement of management systems and human resource capacity should have one overall aim in mind – contributing to the improvement of teaching processes and learning outcomes in the classroom. Rapid expansion and restructuring, as envisaged in ZEDP will place great strain on the existing system. The capacity to maintain and extend quality in teaching and learning as numbers of pupils increase, is a major challenge facing the MoEVT. This requires paying particular attention to, among other things, not only teacher recruitment and training, but also teacher supervision and support in their implementation of the curriculum in the classroom.
In the context of ZEDP, the Department of Inspectorate is expected to assume a more independent regulatory and oversight function for planning and executing school inspection for professional support to the teachers in schools and also initiating and encouraging a culture of evaluation and research in partnership with other Department and institutions such as Department of Curriculum and Universities – SUZA, UDSM etc. on the learning outcomes in schools. In order to strengthen its regulatory and oversight function, the Department of Inspectorate will be restructured and strengthened to become an autonomous body.

50
5.4.2 Outputs The main outputs under this sub-component will be:
- The Department of Inspectorate is restructured and strengthened as an autonomous body.
As part of the restructuring process a review of recruitment criteria for school inspector positions will be undertaken.
5.4.3 Activities Among the specific activities which will deliver the above are:
- Recruitment and training of the school inspectors; not only by transfer teachers or Head teachers to be inspectors as is currently the case.
- Conduct in-service training and refresher courses for the existing school inspectors to be organized once a year and during the holidays.
- Design and implement orientation course on gender, Inclusive Education and HIV/AIDS to all school inspectors.
- Coordination and harmonization of the programme and activities between the Department of Inspection, Teacher Training Colleges and Teacher Resources Centres (TCs).
- Provide equipment and facilities such as computers, photocopiers, stationery etc. to improve the working condition of the inspectors.
- Pilot a school self-assessment program (in the same two districts as the piloting of block grants) to promote schools’ monitoring and evaluation of their own teaching processes and learning achievements
5.5 Decentralisation
5.5.1 Rationale It has already be decided at policy levels to move the Education sector in the direction of decentralization as described in MKUZA and Education Sector Policy. In Zanzibar, local communities have amply and consistently shown their strong interest in taking an active part in the development and improvement of the education services for their children. This interest offers the best chances for success, provided that the devolution process to school level is accompanied by a series of specific capacity building measures to enable the local levels to manage the delegated authority effectively.
Since the most important educational processes are taking place in the schools and classrooms, the main purpose of the education system should be to serve and support this level and provide adequate teaching staff, guidance, resources, pedagogical materials and textbooks. Often the school and local surrounding community are in the best position to analyse the problems and define adequate solutions.
There is a long tradition in Zanzibar for sharing of responsibilities for education. The School Management Committees (SMC) have for many years contributed considerable resources in the form of labour, material and financial assistance to their

51
respective schools.20 These committees have in particular been responsible for school construction, but they have also to a large extent had responsibility for getting children into school and to be in active dialogue with teachers and head teachers regarding school access, quality and issues related to school management.
It has been observed that the SMCs assisting the schools at local levels also contribute significantly to quality and access development of schools. Other countries have applied similar strategies with positive results.
Composition of SMCs varies, but the election process follows some established patterns. The School Head teacher is usually the Secretary of the SMC. Other teachers are often involved as parents, not representing the teachers per se. The functioning of the SMCs will vary and depend very much on whether one has succeeded to recruit dynamic and influential people or not. Studies indicate that SMC members often would benefit from training in order to strengthen their knowledge of educational issues and for instance improve capacity in terms of writing project proposals and plans for school development.
5.5.2 Outputs The main outputs under this sub-component will be:
- A Block Grant system, which after having been tested in two initial pilot districts, will be adjusted and expanded to the sector at large.
The introduction of block grant will be seen in the context of promoting a school based development programme (Whole School Development model)21
5.5.3 Activities Among the specific activities which will deliver the above are:
- Delegation of more decision making authority to the District Education Officer and to the Schools. This delegation will be preceded by a training program focusing on the areas that will be delegated. At the same time the DEO function will be provided more resources to be able to fulfil its role. A description of the role and functions of the DEO has been developed as part of the ZEDP.
- More autonomy and decision-making power devolved (with corresponding financial allocation) through a block grant transfer system to schools and the School Management Committees and building up their planning and management capacities.
More specifically it means that ZEDP will:
- Develop a system for transfer of grants to Schools including management and oversight systems to ensure transparent allocation of funds within schools and oversight of spending by the SMC and the community/parents.
20 As part of the ZEDP planning a “Local Community Study” was prepared by Lexow, Wirak and Massoud. This includes a relatively detailed description of the SMCs and their roles and duties. 21 Akyeampong K (2004) Whole School Development: Ghana, 2005 EFA Monitoring Report Commissioned Study

52
- Implement pilot projects in two districts, Urban district in Unguja and Micheweni district in Pemba, in order to learn and develop experience, methods as well as to assess feasibility.
- Based on the above an intermediary output will be a decision on feasibility and expansion of the block grant system after 2010 following a review of the pilot phase.

53
6 COMPONENT 2 - TEACHER EDUCATION
6.1 Objectives - Upgraded teachers to meet demands of new curriculum
- Teachers meeting the required qualifications at all levels
6.2 Rationale Zanzibar’s ambitious new education policy will require a major rethinking of its strategies for the development, deployment, and management of teachers. Adequate numbers and sufficiently trained teachers will be required at pre-primary, primary and lower secondary (basic education) and upper secondary levels.
The Government’s analysis of teacher requirements in light of the policies of expanded access to pre-primary, primary and secondary education, based on the national benchmarks for pupil/teacher ratio in the three subsectors, shows that the number of full time positions for teachers in primary school will be stable, with a slight reduction at the end of the ZEDP period. The majority of primary teachers are qualified (83 %), 10% are unqualified, and close to 6% have higher qualifications (diploma or degree level). For the past 5 years, Zanzibar has followed a policy of primary teacher specialization, and teachers are trained in one of three subject groups, humanities, mathematics/science or Arabic/Islamic studies. Mathematics teachers are in short supply. Nearly half of all primary teachers have a qualification to teach Kiswahili, but only 16% have a qualification to teach mathematics. In practice, mathematics is often taught by teachers without a mathematics qualification.
There are enough teachers in the system today to match this number of positions. This does not mean that there will be no need for new teachers in primary education. Firstly, there will be a need to replace teachers who retire or leave teaching their teaching post for other reasons. Secondly there may be a need for new teachers with the qualifications that will be needed in primary education.
At secondary level current policies require that teachers with a diploma level qualification teach only up to Form 2. For Form 3 to Form 6 teachers should have degree level qualifications. Currently close to 50 % of secondary teachers are unqualified (qualifications of certificate or less), 40 % have a diploma and only 11% have a degree or higher.
There is a shortage of mathematics teachers at secondary level. Only 187 secondary teachers (8% of the total) are qualified to teach mathematics.
At this stage there is no detailed analysis of how big in numbers the need for new teachers may be, but the MoEVT will make such an analysis as part of the ZEDP planning for teacher education.
In both pre-primary and secondary there is considerable growth in the need for new teacher positions and also in the composition of teacher qualification levels. This growth needs to be identified in more detail. The Government will therefore develop a training and recruitment plan for the sector to show in more detail the training and recruitment needs throughout the ZEDP period.
The teacher training institutions must be resourced and strengthened to fulfil their role as service providers in meeting the demands for qualified teachers for all levels and in

54
all subjects. The Government will focus on ensuring that pre-service training capacity is developed to meet the need for graduates envisaged in the ZEDP projections. In this context the Government will cooperate with SUZA to ensure that the teacher education that SUZA is taking over from the Nkrumah Teacher Training College (NTTC) is established and developed to produce the candidates and the qualification levels needed in the education sector.
In-service training through the Teacher Centres is expected to provide training courses in many subjects and also provide support and supervision to the schools. To enable the TCs to perform these demanding tasks, the Government will review the resource base and personnel situation in TCs and on the basis of this review take the necessary measures to strengthen the TCs as needed to fulfil their role in the training area for implementation of educational reforms. This review will also include the function and role of the National Teacher Resource Centre.
After the termination of the Head teachers training program at the end of the Education Master Plan period, no new training has been offered for Head teacher. There is therefore a number of Head teachers appointed after this time who have received no training in management. The Government will therefore develop and deliver a new management training program for Head teachers.
Current curriculum plans envisage introduction of English as the medium of instruction for mathematics and science from standard 5 of primary schools. English is not a requirement for entry to teacher training, although the teacher training is done through English. It is reported that student teachers frequently find it difficult to work through English. In practice, the poor level of English is a barrier to quality, and teaching is often done using a mixture of Swahili and English. As part of the ZEDP the Government will therefore initiate a training course in the use of English as language of instruction targeted to the teachers of mathematics and science in Standard 5 to 7.
6.3 Outputs The main outputs under this component will be:
Pre-service teacher education
- Authority to ensure quality control of teacher training established
- Policy and guidelines developed
- Revised and updated plan for teacher education
- Teacher education diploma program established in SUZA
- Enrolment of student teachers in mathematics, science and language subjects increased to a level required by lower education institutions.
- Curriculum for pre-primary teacher education developed.
- Pre-school and adult education course within the Teacher training colleges developed to be delivered.
- 100 tutors trained in TTCs
- 2800 teachers trained on using test items to assess higher order skills
- Plan for teaching material improvements produced

55
- Investment in teaching materials in TTCs, Libraries, Labs, computer labs and other teaching facilities increased by at least 50 %
- All TTC support staff trained
In-service teacher training
- The purpose and roles of TCs and NTRC reviewed and changes proposed
- Capacity building program implemented to strengthen NTRC
- Capacity building programme developed and delivered for TC professional staff
- Training completed for.
- 500 secondary and 1039 primary teachers in Mathematics and Science
- 2000 primary teachers in English
- 300 Head teachers, 30 inspectors, 36 subject advisors, and 9 teacher centre coordinators in school management and teacher supervision
- All primary and secondary school teachers trained in the new curriculum .
- All teachers in Standard 1 trained for the new entry age of 6 year old pupils.
- All primary school teachers trained in the use of Kiswahili and English respectively (depending on grade and subject taught) as a language of instruction.
- All primary school teachers trained in innovative skills and child friendly methods.
Head Teacher training
- Management course delivered to all Head Teachers.
- Management course at diploma level mandatory.
6.4 Activities Among the specific activities which will deliver the above are:
- Establish a national authority for control of teacher training
- Develop policy and guidelines on teacher training for formal and non-formal education
- Revise and update the plan for teacher education to meet demands for required qualifications at all levels
- Establish teacher education department in SUZA
- Expand enrolment of student teachers in SUZA and private training institutions to meet the need for diplomas and degrees in mathematics, science and language subjects
- Develop plan and curriculum for pre-primary teacher education
- Establish and run pre-school teacher education in TTCs (Number of students to be decided based on needs assessment )

56
- Train 100 tutors to increase staff capacity at TTCs (25 new tutors per year).
- Train 400 teachers per year on using test items to assess higher order skills
- Appraise teaching materials in TTCs. Libraries, labs, computer labs and other teaching facilities and formulate plan for improvements
- Based on the appraisal, improve teaching materials in TTCs, Libraries, labs, computer labs and other teaching facilities
- Upgrade the existing and train new support staff (Librarians, lab techs, computer techs etc.) to cater for better services at the four TTCs.
- Assessment of capacity needs for TCs and NTRC to meet new challenges from education sector reforms and design capacity building program.
- Develop and implement capacity building program including allocation of required recurrent budget funding for NTRC.
- Strengthen TCs capacity to provide the training demanded from them through implementation of a comprehensive capacity building programme.
- Implement the in-service training programme under the Basic Education Improved Programme.
- Train all teachers in the new curriculum for 10 days.
- Train all Standard 1 teachers for the new entry age of 6 year old pupils.
- Upgrade teachers’ competence in language teaching, both Kiswahili and English from Standard 1 as per Zanzibar language policy
- Train all teachers in innovative skills and child friendly methods for 4 days
- Develop and conduct a short management course for all Head teachers.
- Develop a management course at diploma level for Head teachers as a part time course at SUZA. Made mandatory by end of 2016 for all Head teachers.

57
7 COMPONENT 3 – TEACHER RECRUITMENT AND DEPLOYMENT
7.1 Objective - A system established for more effective recruitment and deployment to
ensure that qualified teachers are equitably distributed across Zanzibar
7.2 Rationale Teachers are the central resource in the education system. While the number of teachers employed currently exceeds the number required as per pupil teacher ratios, the main challenge is to effectively employ and deploy them and ensure that they have the skills required for the positions, whether as teachers in pre-primary, primary or secondary schools.
There are three factors which determine teacher requirements: student numbers, classroom availability, and subject specialisation of teachers. At present there is a generous supply of primary and secondary teachers with an overall pupil teacher ratio of 26, well below both the regional average and the EFA target of 40.
The projection model for the education sector developed and used for the ZEDP programme formulation process shows that the past recruitment and deployment has not been fully demand based.
The change in requirement for teachers is driven by four factors; (i) a bulge in intake to secondary school resulting from the shortening of the primary cycle and abolition of the OSC, and (ii) an increase in participation in secondary education as basic education is made compulsory and additional capacity is provided (iii) even with a shift of entry level from age six the required number of primary teachers will be less teachers when the transition in secondary level is implemented (iv) there will be a growing demand for teachers in pre-primary level. These processes will require a change in the distribution of teachers among the sub-sectors rather than an overall increase in the number of teachers (with the last year of the ZEDP as an exception).
Inter district comparison figures show that North B district in Unguja has the lowest pupil teacher ratio of 27:1, whereas Micheweni district in Pemba has the highest pupil teacher ratio of 46:1. At primary level Urban, West and Central districts have a higher proportion of female teachers, and a higher proportion of qualified teachers than the average. The number of teachers has further been skewed in favour of some subjects. English, mathematics and science subjects remain understaffed, resulting in an unfairly distributed teaching load. While the number of teachers are above current requirements and sufficient positions established to cater for the needs of teachers at pre-primary, primary and secondary levels for the ZEDP period (with the exception of the last year of the period for secondary education), the main current challenges relates to qualifications and distribution, while the future challenge relates to recruitment to ensure teachers possess the right qualifications according to needs and deployed equitably.
Accordingly, ZEDP has focussed on specific interventions to improve the system of recruitment and deployment of teachers including the development of incentive schemes that can promote a more equitable distribution of qualified teachers in targeted areas.

58
7.3 Outputs The main outputs under this component will be:
- MoEVT recruitment and deployment unit established.
- Revised system of deployment designed.
- Incentive package for teachers working in areas with recruitment problems developed and implemented.
- A Teacher Service Commission established.
7.4 Activities Among the specific activities which will deliver the above are:
- Establish a unit in MoEVT responsible for the recruitment and deployment of teachers.
- Review the system of deployment to become more transparent and demand based a with clearly defined career path for teachers based on experience, performance and training..
- Establish a Teacher Service Commission with members from ZATU, Department of Personnel in MOEVT, Civil Service Department in MoLEYD and MoFEA to regulate teachers’ terms and conditions of service.
- Develop incentive package for teachers working in areas with recruitment problems.

59
8 COMPONENT 4 - PRE-PRIMARY EDUCATION
8.1 Objective - Ensure equitable access to a quality pre-school education for all children at
the age four years through increased enrolment to public pre-schools to 30% by 2016 and expansion of enrolment to private pre-school to reach 40% by 2016.
8.2 Rationale Since 1988 to date overall enrolment of 4-6 year old children to primary pre-schools has increased significantly. The current gross enrolment rate is 15.6. There has been a rapid growth in private supply of pre-primary schools. There are, however, differences between districts. Whereas the government pre-schools seem fairly equitably distributed between districts, the private supplies are concentrated in a few districts. The in-equitable distribution of pre-school institutions has produced a much skewed enrolment, with some districts having a fairly high enrolment and others low In Unguja more than 37% of the children in the 4-6 age groups attend pre-school, whereas in districts North “A” and “B”, only approximately 3-4 % of children. This inequity will be addressed through the mapping exercise for pre-schools in ZEDP, because of the growing risk that in many primary school classes children have totally different backgrounds and preparations i.e. a head start for those children who have participated in a quality pre-school programme, and a poor start for those without.
There will be a noticeable increase in pre-primary enrolment as a result of entry age into primary school being lowered from 7 to 6 year old in 2009. An estimated third of the current enrolment is for 6-7 years old (so-called senior classes). When primary schools open for six year olds, this will allow for a commensurate increase in enrolment of ages 4 and 5 year. However, the Government plans to build an additional 800 new classrooms to reach the objective of 30 % enrolment in pre-primary education by 2016.
Of the 977 teachers in the pre-schools in 2006, around 78 % had undergone some training. However, there is no specific pre-school teacher training college in Zanzibar and the existing training is provided by private institutions. There is no specific pre-school teacher training college in Zanzibar. The RGoZ will therefore develop a unified curriculum for pre-school teachers and introduce education for pre-school teachers in one of the Teacher Training Colleges (see pre-service teacher training under component 2: Teacher training).
The Government will, however, ensure that the number of students admitted into this pre-school training program is seen in relation to employment figures for preschool teachers. As part of the preparation of ZEDP it was brought to light that as of February 2007, 70 % of the new 153 teachers produced in 2006 had not yet found employment in the pre-school sector. Despite this, prospective students still came forward in an unprecedented number.
A curriculum for pre-schools has recently been developed, and it will form a basis for supporting the efforts in the sub sector to deliver pre-school services of good quality.
The private pre-primary schools have played, and will continue to play an important part in the service delivery of pre-primary education in Zanzibar. In fact the objective of 70 % enrolment in pre-primary education by 2016 can only be reached because of

60
the envisaged enrolment of 40 % in private pre-school by that time. The Government will continue and strengthen the cooperation with private providers of pre-school services, develop criteria for establishing pre-schools and encourage establishment of more pre- schools through targeted awareness campaign in local communities.
A School Feeding and Dental Health Program will be implemented in all government pre-schools by end of 2013.
8.3 Outputs The main outputs under this component will be:
- Criteria for pre-schools established.
- Awareness campaigns conducted.
- Based on the mapping results and the defined standards, 800 new classrooms constructed, 107 existing classrooms upgraded and 140 playground facilities constructed.
- School Feeding and Dental Health Program implemented in all government pre-schools.
8.4 Activities Among the specific activities which will deliver the above are:
- Develop criteria for pre-school establishment.
- Conduct awareness campaigns and provide incentives for establishing pre-schools.
- Construction of classrooms and playgrounds. Procurement and installation of school furniture and equipment, and preventive maintenance measures.
- Improve existing and make new pre-school playgrounds.
- Develop School Feeding and Dental Health Program in government pre-schools.

61
9 COMPONENT 5 - PRIMARY EDUCATION
9.1 Objectives - Ensure equitable access to a quality primary-school education for all
children from the age of 6 years.
- Achieved net enrolment rate 90 % by 2010 and 95 % by 2016
- Achieved net enrolment rate 100 % for Standard 1 by 2016
9.2 Rationale As stated in the Education Policy 2006 the Government’s basic premise regarding primary education is that it should be “compulsory, free, and of good quality since it is a level which is accessible to the majority of children. Education at this level is guided by a holistic concept based on the total development of the child with increasing attention to the specific individual learning needs of the child. It is the level at which basic skills of numeracy, literacy, proficiency, and competency are developed and learners are introduced to logical thinking and reasoning. It is at this level that skills for further learning are developed. (Education Policy 2006, p. 12)”
The gross enrolment in primary education in Zanzibar is above 100 %. Net enrolment, however, is still low at 77 %. Only about 30 % of the 7 year olds start school at the age of 7. One of the Government’s top priorities in ZEDP is to increase the number of pupils starting Standard 1 at the right age.
Both enrolment and completion are heavily skewed between districts in Zanzibar, and socio-economic factors show clear correlation to enrolment and completion. The combination of overage children at the various levels of primary education, children not being registered and/or not attending and a drop out number of almost 2 800 (EMIS 2006) are all contributing to the net enrolment rate of 77 %. It is clear that Zanzibar still has a way to go before the Education for All goals are achieved.
The RGoZ is committed to the Education for All goals, and has therefore set explicit targets for net enrolment in the ZEDP. The ZEDP is based on the acknowledgement that in the programme period there will not be resources available to avoid double shifts in most primary schools in Zanzibar. However, special attention on school buildings will be given to areas where school congestions is the found to be the main reason children cannot start school at the right age.
There is no systematic program to monitor the standard of quality factors on the input side in the teaching and learning process, such as teacher qualification and motivation, standard of school building and equipment, or availability of textbook and learning material for pupils. The RGoZ will therefore in the ZEDP develop a mapping system to address this issue (See component 1: Education Management and Decentralization).
On the outcome/learning achievement side of education, there is no systematic monitoring of the learning achievements of pupils. The Government will therefore introduce a program for monitoring of learning achievements and self-evaluation by schools under the component Educational management and decentralization. The Government will also establish minimum standards for a conducive learning environment that is safe, gender sensitive and child friendly.

62
Gender parity in enrolment has by and large been achieved in basic education. There is no doubt that continuous efforts to sensitize the parents and the communities at large over the last decade have yielded positive results. The Government will ensure that these good achievements are sustained in the ZEDP period.
9.3 Outputs The main outputs under this component will be:
- Mobilisation campaigns developed and implemented to enrol 6 year olds in Standard 1.
- Minimum standards established for a conducive learning environment that is safe, gender sensitive and child friendly.
- New curriculum introduced.
- Quality benchmarks developed and applied.
- Approximately 330 new classrooms built and 875 existing classrooms upgraded.
- 220 schools accessible for children with disabilities.
- All students provided with one set of text books each and all teachers with teacher guides.
- Construction of 100 toilets with water supply per year.
- 50 gender sensitisation workshops conducted each year (total of 250 workshops).
- Mobilisation campaigns and workshops on girl’s education once a year.
- 175 staff houses constructed.
9.4 Activities Among the specific activities which will deliver the above are:
- Mobilize communities for the reform of getting 6 year olds to enrol in Standard 1.
- Establish minimum standards for a conducive learning environment that is safe, gender sensitive and child friendly.
- Revise curriculum to take into account new entry age and reduction of primary education from 7 to 6 years.
- Establish benchmarks for measuring quality at various levels of primary education.
- Based on the mapping results and the defined standards, construction and renovation of classrooms, other educational facilities and teacher houses. Procurement and installation of school furniture and equipment, and preventive maintenance measures. Mobilize the community/parents in maintenance of the classroom/school building by organizing the SMC.
- Based on the mapping results and the defined standards, improve school buildings to make them accessible for children with disabilities

63
- Procurement and distribution of textbooks (total approx. 2 million textbooks) and other learning materials for all levels with the introduction of a rental scheme for textbooks and approximately 11250 teacher guides per subject for 8 subjects.
- Improve and maintain the physical facilities of the school to make it gender friendly.
- Conduct 50 gender sensitization workshops for teachers, head teachers, Community, REOs & DEOs per year.
- Develop mobilization campaigns to mobilize and advocate for girls’ education through meetings, conferences, media, workshops and public forums.
- Construction of 175 staff houses, 5 per school, for primary schools in areas with recruitment problems.

64
10 COMPONENT 6 - SECONDARY EDUCATION
10.1 Objectives - A review undertaken of needed changes in secondary education as it is
changing from elite to mass education
- Transition rate from Standard 6 to Form 1 of 95 %
- Transition rate from Form 4 to Form 5 of 50 %
10.2 Rationale Lower secondary education/secondary education ordinary level is in more and more countries today regarded as part of basic Education for All, because economic and social development in today’s societies demands a higher level of general knowledge. In addition there are much fewer jobs for young people leaving primary school at the age of 13-14.
Providing secondary education in Zanzibar is mainly a public task, with only 5% of students attending private schools. In the Education Policy of 2006 the Government has stated that the policy is to have 4 years of secondary education for all as part of the basic education offered in Zanzibar. The Government acknowledges that the examinations at the end of primary education, still acts as a filtering mechanism, and does not provide opportunities for all students to enter secondary schools (Education Policy 2006, p. 14).
Another barrier in the education system is the Exam between Form 2 and Form 3. The percentage of students who do not pass the Form 2 exam, and are therefore not admitted into Form 3 is around 50 %. Although the percentage of students who pass has increased in the period 2001 to 2005, still more than half of the students are still excluded from starting Form 3. Many of those who fail to enter Form 3, and do not continue their education in vocational training or the alternative learning centres join the army of unemployed basic education graduates.22
The Government policy is that the transition from Form 2 shall increase from the present level (47, 6 % as of 2005) and that a four year secondary education shall be available to all. This demands an expansion of secondary education of great proportions. Promotion ratios will gradually be increased to 95 % per year in the 4 years of secondary education that becomes part of basic education, and to 50 % from Form 4 to Form 5.
The massive increase in enrolment in secondary education requires proportionate investments in infrastructure and teachers with the appropriate qualifications. Teachers, classrooms and textbooks and learning material will be critical to ensure quality during such a substantial increase in enrolment. To achieve the objective of secondary education for all, the RGoZ has initiated a Basic Education Improvement Project where the building of 19 new secondary schools, rehabilitation of schools, teacher training and textbook provision are the key objectives. But additional resources are still required over and above the resources allocated for this project.23
22 Education Policy 2006, p. 15 23 The ZEDP envisages building of 500 classrooms for secondary education, of which the Basic Education Improvement Project covers 236

65
The number of teachers is planned to increase from 2 867 in 2007/2008 to 3 858 by 2016, and the percentage of untrained teachers will be reduced from 12 % in 2007/08 to 0 % by 2016. Teachers with certificate will be reduced from 41 % in 2007/08 to 0 by 2016. The percentage of teachers with diploma and degree is projected to rise from 40 % and 11 % in 2007/08 to 65% and 35% respectively.
The big increase in need for more teachers comes at the end of the period, which is 2015/16, when a transition from the 7 years to 6 years of primary education will occur. In that year the last Standard 7 class from the present primary education, and the first Standard 6 from the new primary education both leave primary education and enter secondary education.
There will proportionately be more teachers in mathematics, science and foreign languages compared with today. The Government will through systematic planning of future need for number of teachers and levels of qualification implement a comprehensive training program for existing teachers, combined with recruitment of necessary qualifications to secure that the need for number of and qualification levels are met.
There is great variety in the gender balance in secondary education. Measures to address the gender imbalance have therefore been prioritized in ZEDP, targeted to the districts, and the level of secondary education where the difference is greatest. The underrepresentation of girls is highest in Micheweni and North A districts, and it increases from Form 1 to 6 in all districts.
The dramatic increase in access to secondary education that will be needed to comply with the Education Policy 2006, will change secondary education from a system for the elite to a mass education system. This raises a number of challenges in terms of secondary education delivery, which need to be carefully considered.
Therefore a review needs to be undertaken to assess needs for further reform of secondary education, to make it a good education system for all. The review needs to look at the purposes of secondary education, number of subjects (compulsory and elective subjects), differentiation/streaming issues, teaching methods and assessment and examination system. The RGoZ will review to what extent the present system of secondary education is adapted to the new situation of secondary education for all. Through a consultative process with key stakeholders, the Government will discuss what reforms of the present system of secondary education may need to be undertaken to make it good education for all students. The proposed adjustments of secondary education will be introduced starting with Form 1 from the school year 2012.
10.3 Outputs The main outputs under this component will be:
- A proposal submitted from a Technical Working Group appointed by the MoEVT to review need for changes in secondary education, regarding number of subjects, curriculum and assessment/examination system
- Reforms of secondary education introduced for Form 1 from school year 2012
- 3 reference text books for teachers of all 6 levels and 11 subjects in each secondary schools and 90 reference text books in 11 subjects distributed to each school

66
- Construction of 550 new classrooms.
- Rehabilitate 50 existing school buildings and 2 girl hostels for year 2008-2015
- Construct 2 girl boarding schools in Pemba and Unguja.
- 70 Science camps/clubs in lower Secondary schools for a total of 350 students by 2016.
- Annual such as Science/Math Festival for subject competitions.
- 175 number of staff houses for schools in areas with recruitment problems constructed by 2016
- All students provided with one set of text books each and all teachers with teacher guides by 2016.
10.4 Activities Among the specific activities which will deliver the above are:
- Review the consequences of the reforms on access to secondary education and propose changes in the content, teaching and learning methods and organization of lower and upper secondary education/secondary education advanced level (to be fully implemented from the school year 2012).
- Procurement and distribution of textbooks and other learning materials for all levels with the introduction of a rental scheme for textbooks.
- Construction of classrooms, other educational facilities and teacher houses. Procurement and installation of school furniture and equipment, and preventive maintenance measures. Mobilize the community/parents in maintenance of the classroom/school building by organizing the SMC.
- Rehabilitation of school physical facilities including renovation of classrooms, teacher houses, girls’ hostel to make it gender friendly.
- Construct 2 girl boarding schools in Pemba and Unguja.
- Introduce Science camps/clubs in lower Secondary schools (50 students per year).
- Provide program for subject competitions in Science/Math Festivals.
- Construction of staff houses for secondary schools in areas with recruitment problems.
- Procurement and distribution of textbooks in four subjects for all students in the first four years of secondary school and in all subjects for all students in Forms 5 and 6 (a total of approx. 475000 textbooks during the programme period) including science equipment and consumables to all schools teaching science, library books and other learning materials

67
11 COMPONENT 7 - TECHNICAL AND VOCATIONAL EDUCATION AND TRAINING
11.1 Objectives - Expansion of technical and vocational training infrastructures for skills
development and upgrading;
- Public-private partnership and networking with TVET stakeholders established and promoted
- Vocational training programme linked with labour market demands
- Vocational and technical education/training accessible to children with special needs
- Entrepreneurship and information and communication technology skills provided to trainees
11.2 Rationale Zanzibar, like many other African countries, is experiencing enormous challenges as a result of large and increasing “bulge” of school leavers from primary and secondary education who expect to be offered further opportunities in terms of more education or skill training for the world of work. The current international focus on strengthening and improving secondary education is one important and relevant measure to provide education for basic education leavers. Another essential strategy is to recover and give more vitality to different forms of TE and VET and preparing the youth better to the world of work.
Over the years, the main development policies and strategies for Zanzibar have increasingly seemed to strengthen the emphasis on need for TVET. The current Education Policy (2006), for example, acknowledges the role of TVET as follow:
“The need for technical skills in wealth creation is increasing where the application of science and technology is becoming a must. Hands-on learning and knowledge in mechanization and automation is constantly demanded in the labour market. One way of getting skilled labourers in the country is by providing them with technical and vocational education/training. Technical and vocational education/training is a necessary ingredient towards poverty reduction as it provides opportunity for self employment.”
As a measure towards strengthening and improving TVET, the Government has passed a new Vocational Training Act in 2006 for the establishment of a Vocational Training Authority (VTA) in Zanzibar. Currently, there are two Vocational training centres under construction: in Mkokotoni North Region, Unguja and Vitongoji, South Region, Pemba. The Government’s objective is to put in place one Vocational training centre in each region during the ZEDP period.
A seemingly general finding regarding vocational education and training institutions in Zanzibar is that there are very limited resources and materials in inadequate workshops and laboratories.24 This is forcing training to rely on theoretical and class-
24 “Technical Support Services for the Establishment and Operation of Skills Development Centres in Zanzibar” Canadian Technical and Vocational Group, several reports, 2004.

68
room based activities. As a result, TVET initiatives have not substantially benefited society. In the “world of work” and in the most important sectors of the Zanzibar economy, such as tourism, hotels and restaurants there is a steady import of manpower not only for highly qualified personnel, but also for lower categories of workers and labourers. It is for instance estimated that the total employment in the tourism and hospitality industry was around 8,000.25 However, the Zanzibar Commission for Tourism suggests that only 40% of the employment is recruited locally. Thus, large efforts and resources are needed in order to improve vocational and training competence among the Zanzibar people.
In a nutshell, the following factors have affected the realisation of TVET mission in Zanzibar: under-funded and therefore, under-performing status of TVET centres; lack of confidence by the employers in the graduates from TVET centres as demonstrated by very low placement rates; absence of consistent planning for TVET in the form of national, industry and institutional skills development plans, through which skill requirements can be identified in order to pre-empty a supply-driven training; unregulated and stagnating apprenticeship schemes; lack of internal and external efficiency and weak governance and management of TVET at national and institutional level; lack of coherence and relevance in the system; lack of effective collaboration and partnership with private sector, thus limited training tailored to the needs of small businesses and informal sector; weak quality assurance and absence of proper accreditation system especially for skills training centres. There is also lack of equity on the TVET system in that very few females and people with disabilities seem to be benefiting from the TVET programmes.
11.3 Outputs Against the above background, the immediate focus of the sub-sector during ZEDP period is twofold, namely to establish the Vocational Training Authority and to develop policy guidelines specifying the roles of the public sector and private sector in the provision of technical and vocational education and training in Zanzibar.
The Government recognises that provision of adequate and relevant technical and vocational education and training requires active involvement of the private sector. In this regard, the Government shall play a leading role in facilitating the development of policy framework that promotes mechanisms for the public-private partnership within the sub-sector.
The main outputs under this component will be:
- A Vocational Training Authority (VTA) established and fully operational, including new fully equipped VTA office building.
- Policy and guidelines for better TVET programmes established.
- The two regional TVET facilities completed, equipped and ready for use.
- TVET facilities established in the remaining three regions.
- Strategies and plan for refurbishing existing training facilities to match identified national requirements ready.
25 Ibid.

69
- Plan for establishing district TVET facilities.
- Public-private partnership and networking with TVET stakeholders established.
- Vocational Training programmes improved to link with labour market demands.
- Capacity of instructors built as per CBET needs.
11.4 Activities Among the specific activities which will deliver the above are:
- Appoint VTA Board of Directors and establish Board Advisory Committees. Recruit 8 additional staff to the ones in the present Department of Technical and Vocational Training. Design and construction of VTA office building.
- Develop and review policy and guidelines for TVET
- Plan and budget for equipping to the two new regional TVET facilities ready by mid 2008
- Plan for construction and equipping the remaining three regional TVET facilities
- Develop strategies and plans for refurbishing existing training facilities to match identified national requirements
- Develop plan for establishing district TVET facilities for next ZEDP plan period.
- Develop and implement strategies for collaboration with TVET stakeholders.
- Develop demand driven TVET programmes reflecting demands from key growth sectors in Zanzibar and/or sectors with comparative advantage but unrealised potential by among others implementation of formal labour market surveys and outcome of PPP activities.
- Establish national database for skills requirement in TVET and train instructors as per CBET.

70
12 COMPONENT 8 - HIGHER EDUCATION
12.1 Objectives - Expanded access to Tertiary and Higher education at an average of 20% in
total for the ZEDP period
- Increased enrolment of female students and students with special needs in Tertiary and Higher Education by 20 %
- Improved quality and relevance of tertiary and higher education
- Increased percentage of lectures given by staff employed at Universities – reduced use of external, part-time lecturers
- Reduced average unit costs per graduated student by 15%
12.2 Rationale The Government of Zanzibar acknowledges the critical role of tertiary and higher education in equipping its citizen with high level intellectual, professional and managerial capacities necessary for national development. In addition to enhancing pertinent research in areas of interest for national development, tertiary and higher education offers opportunity for decision makers, professional cadres and for leaders in public and private sectors, as well as in civil society to acquire new development skills, innovations and ability to make an informed decision. In order to increase the quality and relevance of tertiary and higher education, there is a need to remove the mismatch between higher education and the world of work. This is to be achieved through establishing a strong relationship between tertiary and higher education with private business and industries to include sharing of knowledge, apprenticeships and financial support.
As intimated earlier, currently there are three universities in Zanzibar providing higher education. These are the State University of Zanzibar (SUZA), the Zanzibar University (ZU) and the University College of Education (UCE) Chukwani. Whereas the former is a public university, the two latter ones are private universities. Combined, the three universities had, in academic year 2006/2007, a total enrolment of 2 758 students of which 989 students (36%) were female. In addition to the three universities, the Open University of Tanzania also provides opportunities for higher in Zanzibar. Furthermore, a number of Zanzibaris students are pursuing higher education in Tanzania Mainland and outside the country. In 2006/2007, there were 111 students (39 female and 72 male) in various higher learning institutions in Tanzania Mainland while 148 students (24 female and 124 male) were studying overseas.
Tertiary education is provided by a number of institutions in Zanzibar. Karume Technical College (KTC) is the predominant one, offering technical education in four engineering fields namely Electrical, Mechanical & Automobile, Civil & Transportation and Electronics & Telecommunication. By March 2007 KTC had a total enrolment of 228 students of which 54 were female students.
The other tertiary institutions under MoEVT are all teacher training institutions: The two Islamic Colleges (one in Unguja and the other in Pemba) and Benjamin Mkapa Teacher Training College in Pemba. (See Teacher Education sub-sector).

71
While the focus for tertiary and higher education in Zanzibar has been increase enrolment, the main area of concern, especially for the public institutions such as SUZA has been lack of physical space to permit for expansion of facilities to increase equitable education to a greater number of students. There is also a lack of adequate funding which has in most cases resulted in dilapidated infrastructure and inadequate teaching and learning materials in most public institutions. These low levels of funding to public institutions have, over the years, meant that the budget received is solely used to cover recurrent expenditure, mainly salaries, leaving insufficient surplus for capital development, staff development and research. Student grant/loan system for tertiary and higher education also need to be improved so that it caters for students who are in need of the support most. Moreover, there is a critical shortage of academic or teaching staff. SUZA, for example, is currently heavily depended on part-time lecturers - a fact which is not only expensive but also significantly impairs effective teaching and learning environment due to limited direct teacher-student contacts time. Consequently, there is a serious concern over the quality and relevance of the programmes currently offered by tertiary and higher education institutions especially in responding to a labour market demands.
12.3 Outputs The main outputs under this component will be:
- Construction of new campus for SUZA at Tuguu completed.
- Construction of the Benjamin Mkapa Teacher Training College in Pemba completed.
- Renovation plan of selected facilities developed.
- Plan for improving the functioning of the student grant/loan system completed.
- 20 awareness events conducted.
- Guidelines for construction of facilities for people with disability developed.
- Program for increasing efficiency of service delivery at colleges and universities developed.
- A new ‘professional development’ incentive package developed.
- Program to strengthen learning achievement and quality assurance developed.
- Labour market assessment completed.
- Organized meetings/forums for linking colleges and universities with private sector established.
- Demand-driven curriculum developed.
- Strengthened research capacity of tertiary and higher learning institutions.

72
12.4 Activities Against this background, activities that public tertiary colleges and SUZA shall undertake during the ZEDP period shall be determined by their respective Councils and management systems.
Among the specific activities which will deliver the above outputs are:
- Plan and implement construction of the new campus for SUZA at Tuguu.
- Plan and implement construction of the Benjamin Mkapa Teacher Training College in Pemba.
- Develop and implement a Renovation plan for selected facilities and infrastructure in universities and colleges.
- Develop plan to improve the functioning of the student grant/loan system to target those who are in most need.
- Carry out awareness raising campaigns and introduce empowerment strategies, e.g. popularize science, mathematics and technology subjects amongst female students at lower levels and for students with special needs
- Develop guidelines to ensure the construction of buildings that cater for students with special needs
- Develop and implement a program for increasing efficiency of service delivery of universities and tertiary colleges
- Review, re-design and implement a new ‘professional development’ incentive package to attract, recruit and retain high quality tutors
- Review and improve the assessment of learning achievement and strengthen quality assurance systems. Develop Program to improve the assessment of learning achievement and strengthen quality assurance systems.
- Carry out labour market review to identify needs for programs based on market demand
- Promote linkages of tertiary and higher learning institution with employers through by regular joint venues/forums for exchange of information and decision making.
- Re-design, promote and implement programmes and curricula in fields such as Fishery, Agriculture, Tourism, Engineering, Health sciences and Environmental studies on island ecology based on the findings from the needs assessment.
- Establish e-library and improve existing libraries.

73
13 COMPONENT 9 - NON-FORMAL, ALTERNATIVE AND ADULT EDUCATION
13.1 Objective - Improved access to quality education and training for the out-of-school
children and youth and adults.
13.2 Rationale Non-formal, Alternative and Adult Education is now recognized as a critical instrument in the eradication of poverty and hence, its inclusion as one of the Millennium Development Goals (MDGs) and its prominence in the ZEDP. The aim of this sub-sector programme is, therefore, to address in a comprehensive manner the educational need of the out-of-school children and youth as well as adults both those without literacy skills and those with literacy skills who would wish to upgrade and expand their knowledge, qualifications and professional or vocational skills. Currently, the Department of Alternative Learning and Adult Education (MoEVT) implements the following non-formal education programmes in the following areas: Alternative learning; Literacy programmes; Continuing education; Skills learning and Women’s programme.
Alternative education for age group 12-14 years old is primarily focusing on providing a “second chance” education for drop outs or for those who have never been to school. The aim here is to mainstream them to primary school. Whereas, for age group 15-19 years old the new Rahaleo Alternative Learning Centre, inaugurated late 2006, is an attractive option for learners who have either dropped out from primary school or never been enrolled to any primary school at all. The Centre offers primary education based on the three-year condensed curriculum. A certificate will be received after having passed primary school examination. The centre has introduced various skills training such as cookery, tailoring, carpentry, computer training in addition to primary education.
In terms of literacy levels measured in the 2002 Census, Urban District had the highest literacy rate with 86% for men and 72% for women, North “A” District has a high number of illiterate adults with only 51% for men and 41% for women. Overall the Census data also that female literacy was much lower in all districts than that of men. The latest information on literacy programme shows that in 2006 there were in total 9451 adults (of which 7354 were women), who attended literacy classes. On the other hand, women programmes basically focus on offering income generating activities which are linked to educational programmes for women, mostly school drop-outs. A total of 30 small groups (20 in Pemba and 10 in Unguja) were said to be involved into this programme in 2006.
The main challenges facing the provision of non-formal, alternative and adult education include, among other things, absence of a comprehensive national policy; inadequate teaching and learning materials; lack of officially registered literacy/adult education centres; lack of professionally adult educators; unsuitable learning time which is not convenient to the learners; outdated and irrelevant curriculum especially on literacy and adult education; need for greater Government commitment in terms of more resources; poor unreliable and unsystematic data for the sub-sector which makes

74
the development of institutional structures and mechanisms to facilitate the development of a co-ordinated, coherent and sustainable programmes difficult.
13.3 Outputs In the light of the above, the immediate focus of the sub-sector during ZEDP period is policy development, clarifying the roles of the public sector and civil society in non-formal, alternative and adult education delivery system. The Government shall play a leading role in facilitating the right to non-formal and adult education.
The main outputs under this component will be:
- Situational analysis and needs assessment for sub-sector conducted.
- Non-formal, Alternative and Adult Education Policy Guidelines produced.
- A revised, demand-driven Adult education curriculum ready
- Common database for Non-formal, Alternative and Adult Education operational.
- Fully furnished libraries established.
- 20 librarians’ assistants recruited and trained.
- 60 adult educators/trainers of trainers recruited and trained (6 per district)
- 100 Adult education and literacy radio & TV programmes broadcasted within 25 weeks
- Two mobile library vans - one in Unguja and one in Pemba in operation.
13.4 Activities To achieve the above outputs, the Government shall facilitate policy clarity regarding public-private partnership in the provision of non-formal, alternative and adult education. Much emphasis shall be placed on the enhancement of collaboration between the sub-sector and private sector, NGOs and the targeted communities in order to develop demand-driven programmes which are flexible and relevant to the labour market.
Among the specific activities which will deliver the above are:
- Carry out a situational analysis to identify the strengths and weaknesses of the sub-sector as well as the needs assessment for literacy and alternative education
- Develop non-formal, alternative and adult education policy guidelines
- Develop a demand-driven curriculum for non-formal, alternative and adult education
- Develop a common data base, as well as monitoring and evaluation tool for non-formal, alternative and adult education initiatives
- Establish 10 fully furnished libraries in Zanzibar; one in each district to be attached to community centres. Recruitment and training of librarian assistants
- Recruitment and training of adult educators/trainers

75
- Introduce an upgrading/in-service training of the existing literacy or adult education teachers.
- Procure two mobile library vans; one for Unguja and another one for Pemba.
- Alternative Education and Vocational Training Centres established

76
14 COMPONENT 10 - GENDER
14.1 Objective - Strengthen the MoEVT capacity to implement and monitor effectively
programs that promote girls’ education.
14.2 Rationale The goal of gender equality is strongly articulated in MKUZA and the Education Policy of 2006. According to the 2002 Census, Zanzibar’s total population was 981 754 of which 500 908 were women. However, due to a number of factors such as low levels of education, limited access to and control over resources of production, division of labour, women participation in the development process has been impaired. More often than not, these factors are exacerbated by cultural norms and values which promote unequal power relationship between men and women.
In society at large, there is also a wide discrepancy between households headed by men and women. Women headed households are substantially less well educated than men headed households. More than half (56.6 %) of the female heads of households have no education compared to a quarter (26.6%) of male headed households. The distribution of female headed households averages around 22% of total. There is no information, however, about the extent to which children in female headed households are less, or more, encouraged to attend schools than in male headed households.
MoEVT has a special focal person for promoting gender issues in the education system and MoEVT deals relatively extensive with such issues. The main tasks for the gender focal person revolve around advocacy and sensitization, in particular in connection with youth, and the communities.
Gender parity in enrolment has by and large been achieved in basic education. The gap in enrolment is narrow, and in some cases boys’ enrolment even fall behind that of girls. There is no doubt that continuous efforts to sensitize the parents and the communities at large over the last decade have yielded positive result. At the same time, equal enrolment rates often hide persevering inequalities in specific types of education and field of study. Teachers with science qualifications are usually male. The current shortage of science teachers is a reflection of choices made by the students in TTC.
At secondary level, the overall patterns are less marked. Urbanized areas have the greater proportions of qualified and female teachers. Unguja has lower PTR and more qualified and female teachers than Pemba. However, there are stark differences in the distribution of teachers of particular subjects, such as mathematics. In Micheweni district there are only two qualified teachers with mathematics as their major subject, giving a ratio of over 1,900 students for each. By contract, in Urban district there is a qualified mathematics teacher for every 467 students.
Despite the previously mentioned encouraging result of special gender focussed interventions, ZEDP has incorporated additional interventions into the programme in the form of sub-sector related (mainstreamed) interventions which are presented under respective sub-sector components and additional efforts to strengthen promotion of girl’s education across all sub-sectors as presented under this component.

77
In meeting the above mentioned challenges these interventions focus specifically on strengthening capacity and efforts across all education sector support institutions including in-service and pre-service teacher training and counselling institutions in an attempt to get maximum outreach of awareness and competence to the sector at large. Furthermore, mobilisation of all stakeholders to achieve results more efficiently and effectively calls for better systems and procedures for consultation and coordination among them.
Finally, the legal and regulatory instruments for prevention gender related violence; including domestic violence has been identified among stakeholders under the ZEDP formulation process as that still lacks sufficient attention. This has also been a specific area given priority under the MKUZA formulation process which involved an even wider group of stakeholder from different sector than education which recognized that the education sector could play a particular pivotal role.
Thus, as part of economic empowerment of women, the Government will under the ZEDP give special priority to developing mechanisms and facilities to encourage the retention of girls in the education system and provide girl friendly facilities in education institutions.
14.3 Outputs In response to the above, among the priority outputs of the sub-components under this heading the ZEDP has focussed on;
- Gender focal point person, guidance and counsellors, teacher centre coordinators/advisors, REO & DEO, School Inspectors, Directors and statisticians, to be trained in promotion of girls’ education.
- Procedure for coordination and working relationship with partners/stakeholders established, which will be sustained throughout the ZEDP.
- Policy, strategies and activities to eliminate gender violence as the legal and regulatory framework for implementing specific interventions.
14.4 Activities Among the specific activities which will deliver the above are:
- Conduct a training programme in promotion of girls’ education for gender focal point person, advisors and counsellors, teacher centre coordinators/advisors, REO & DEO, School Inspectors, Directors and statisticians
- Established a coordination procedure for collaborating with other stakeholders to promote gender equity in education through meetings, workshops, conferences and other consultation and coordination activities.
- Develop and implement effective policies, strategies and activities to eliminate gender based violence (MKUZA).

78
15 COMPONENT 11 – SPECIAL NEEDS AND INCLUSIVE EDUCATION
15.1 Objective - Reduced illiteracy among children with special needs and other vulnerable
and marginalised groups, by increasing their access to quality education.
15.2 Rationale The Education Policy 2006 underlines the RGoZ policy commitment to address the education needs of children with development disability. It states that inclusive Education shall be promoted to ensure that children with special needs get equal opportunities. This will require that barriers to learning are removed and the diverse ranges of learning needs are accommodated.
Slow learners and highly gifted children shall be identified and be given opportunities to learn at their own pace.
Children with disabilities and others with special needs shall, to the greatest extent possible, be able to attend a local school where they will receive quality education alongside their peers without disabilities/ special needs.
In relation to the situation analysis made by MKUZA it is stated that enrolment of children with special needs is low, and for those coming from poor families little attention is given to people with disabilities. This results in insufficient support to people with special needs. Another constraint is the fact that the number of specialized teachers for children with disabilities is inadequate.
Some of the background studies used in the preparation of ZEDP provide evidence from other surveys of reluctance by parents in providing information about disabilities of their children and thus prevents access to the limited opportunities offered to them. Furthermore, school environments are inaccessible and lack of intervention between teachers and students often do not promote positive learning process to children with disabilities once they gain access to schools.
However, some samples presented and lessons from many countries in the region and at the mainland Tanzania show that it is feasible to ensure full enrolment of disabled children with a combination of mainstreaming, special classes and introduction of Inclusive Education courses at certificate level at relevant learning institution(s).
MoEVT has taken several steps to address the situation and has so far linked up with three NGO partners to promote inclusive education in the mainstream education system (primarily at primary level). In total these NGO partnerships have registered 1,523 children who have special learning needs in respective pilot areas and the number is increasing as the interventions progress.
A study by Unicef26 states that the group of identified vulnerable children that in particular seem to be deprived are children living with disability. Enrolment in formal education is substantially below enrolment levels of other children. However, it is
26 Update of the Situation of Women and Children in Zanzibar. Research on Poverty Alleviation, Oct.2006

79
financially feasible to ensure full enrolment of disabled children, both in mainstream schools and by establishing special schools/educational support.
The process of including topics of inclusive education in teacher training curriculum has begun at the Islamic College. This promising start might possibly be mainstreamed to all pre-service and in-service training programmes. However, there are also barriers in the form of physical constructions which need to be addressed particularly and they would also benefit significantly from more specialists in various fields of development disabilities.
In addressing the above the Government has partly included components related to accessibility under respective sub-sector and partly by including cross sector interventions under this component.
15.3 Outputs The main outputs of the sub-components under this heading will be;
- Inclusive education policy guidelines developed to serve as the main tool for more attention and coordinated efforts across sectors and integration of special needs in planning interventions under respective sub-sector.
- Inclusive Education unit (IE)’s capacity strengthened to support the implementation of the policy and application of the guidelines in respective sub-sector.
- Survey and assessment of children with disabilities and other special needs completed which will form an even better basis for planning interventions than the information stemming from stand alone pilot interventions currently undertaken in selected areas.
- Teaching and learning materials, as well as other devices and equipment for children with special needs procured and distributed to assist in creating a more conducive learning environment for the target group.
15.4 Activities Among the specific activities which will deliver the above are:
- Develop inclusive education policy guidelines and promote their use in planning interventions in respective sub-sectors.
- Increase MoEVT efficiency and effectiveness in dealing with Special Needs Education by training and through technical assistance.
- Carry out a comprehensive survey and assessment for children with disabilities and other special needs based on a representative stratified sample for Zanzibar.
- Procure and distribute teaching and learning materials, as well as other devices and equipment for children with special needs.

80
16 COMPONENT 12 - SCHOOL HEALTH, NUTRITION AND HIV/AIDS
16.1 Objectives - The spread of HIV/AIDS contained
- Improved health education and nutrition services in schools.
16.2 Rationale Worldwide, it is now common knowledge that the education sector is one of the most affected sectors by the pandemic. The UNICEF’s (2002) publication – The Progress of Nations - states that “although HIV affects all sectors, its most profound effects are concentrated in the education sector” (UNICEF 2002:10). Unfortunately, understanding of how HIV/AIDS affects the education sector in Zanzibar is generally very limited, because very few studies have been undertaken that specially address the actual and likely impacts of the epidemic on the education sector. In particular, no systematic study has been undertaken in schools and colleges themselves. Lack of hard evidence about what is actually happening in schools and colleges makes it impossible for MoEVT to develop a well-conceived strategic responses to the pandemic, which will make a real difference in schools and other educational institutions.
HIV/AIDS prevalence in Zanzibar is claimed to be relatively low. A community survey in 2002 (Ministry of Health and Social Welfare) show that among the 12-65 year old population the HIV/AIDS infection rates are 0.9 percent for women and 0.2 percent for men. Awareness on HIV/AIDS is also claimed to be high, and engagement in risk behaviour is relatively low.
However, risks are there; substance abuse is on the increase with the large number of youth with limited education and job opportunities. A particular vulnerable group is the AIDS orphans who are often abused at school and live under difficult conditions, they often lack basic care, uniforms and have problems with adhering to school regulations. This is a specific risk group for dropping out of school.
The RGoZ will therefore keep up the intensity in awareness campaigns and also update and develop HIV/AIDS policy guidelines.
Regarding School Health and Nutrition, the Government asserts:
Children need to be healthy in order to learn properly. They also need to be educated on how to remain healthy. EFA stresses that learning environment should be healthy, safe and protective. A healthy learning environment should include safe, environmentally friendly and easily accessible buildings, health and nutrition services, adequate water and sanitation, facilities to deal with emergencies and disasters, facilities to cater for psychological and emotional health of teachers and learners. (Education Policy, 2006, p.63)
Consequently, the Government plans for an output in this sub-component which will address in a comprehensive manner, the health and nutrition problems of schools children that affect their access to, participation in and outcome of the education process. Among other things, problems addressed are parasitic (de-worming) and

81
other infections, school environmental health, water, sanitation, nutrition, violence, psychological health and substance abuse. It is crucial to emphasise that ZEDP is not limited to these, but is expected to adjust and include issues as they arise over the years in the ZEDP period, taking into consideration local conditions.
The Government has thus given priority to deliver School Health Education, Safety and Nutrition services to all pre-primary and primary schools, starting from January 2009. To be regularly updated on the situation in the areas of HIV/AIDS and school health and nutrition, priority will also be given to development of an integrated monitoring and evaluation system for these areas.
16.3 Outputs The main outputs of the sub-components under this heading will be;
- HIV/AIDS policy guidelines developed
- Awareness campaigns on HIV/AIDS, school health and nutrition implemented for all schools and communities
- School Health Education, Safety and nutrition services provided for all pre-primary and primary schools
- Monitoring and evaluation system for HIV/AIDS, school health and nutrition established
16.4 Activities Among the specific activities which will deliver the above are:
- Develop HIV and AIDS policy guidelines.
- Implement increased number of and improved awareness campaigns on HIV/AIDS, school health and nutrition in schools and their respective communities.
- Develop and mainstream a new syllabus on life skills, Care/Support and HIV & AIDS for pre-primary, Primary, Secondary and Teacher Education including development of guidelines and training of teachers.
- Conduct a baseline survey to determine the current status of basic health and nutrition in all pre-primary and primary schools.
- Implement Community advocacy/sensitization on screening of basic health, nutrition and school feeding and conduct screening of basic health in all pre-primary and primary schools.
- Develop a Monitoring and Evaluation system including system for annual survey based assessments at school level.

82
17 COMPONENT 13 - INFORMATION AND COMMUNI-CATION TECHNOLOGY (ICT)
17.1 Objective - Adopt and utilize ICT to improve access, quality and equity in the delivery
of education services in Zanzibar.
17.2 Rationale Throughout the world, ICT is changing the face of education. It is changing the nature of work and the workplace. This means that education systems must respond adequately. A precondition is an educational force of computer literate individuals.
Zanzibar needs to embrace ICT as a means of innovation and knowledge sharing and build up our capacity to use ICT, and starting in the classroom. At the same time, ICT represent tools to improve the efficiency and effectiveness of management and administration of the education sector.
The Government will therefore, through targeted interventions under the ZEDP, ensure that the foundation is laid and that ICT during the ZEDP period is introduced and used in both the classrooms throughout Zanzibar and the management and administration of education service delivery.
ICT as a technology and a language has the potential for creating job opportunities for many young people. For knowledge workers, it is a tool for research and information dissemination. The importance of policy and strategic framework for ICT in education is underlined in MKUZA. Thus, the Government has made the development of ICT guidelines for the Education sector one of the priorities under the ICT component.
To increase computer literacy in schools in the ZEDP period the Government will expand access to computers at the Teachers’ Resource Centres and disseminate computers to more than the 20 % of the schools that presently have computers.
There are 15 private training providers in Zanzibar. Some of these organizations offer internationally recognized qualifications such as International Computer Driving License (ICDL) and CISCO (CCNA). All the centres offer basic training in computer applications. 90% of the centres are in urban West of Unguja. All the centres offer basic training in computer applications. Most training providers have internet access.
The private training providers are important and valuable partners in the training of personnel in the education sector. The Government will therefore regulate accreditation of institutions offering examinations and certification of ICT learning programs.
17.3 Outputs - 2000 Education managers trained and provided ICT equipment
- 20 teachers with ICT experience trained, 20 Trainers trained, 500 teachers trained in basic ICT skills and 2000 teachers trained in Multimedia Content
- Relevant institutions accredited
- Guidelines for ICT established

83
17.4 Activities - Provide education managers with access to ICT tools and develop their
competence in using these tools to enable them to better deliver education services.
- Training of Trainers and teachers to facilitate the use of ICT in education and ICT education at every level of education.
- Regulate accreditation of institutions offering examinations and certification of ICT learning programs in all relevant institutions.
- Develop guidelines for ICT equipment to educational institutions (primary schools, secondary schools, tertiary institutions)

84
18 FINANCING ZEDP
18.1 Introduction The ZEDP financial requirements for the 2008/09 to 2015/16 period are calculated based on such a prioritised strategy as discussed in the preceding chapters. The key element of the strategy is increased enrolment, increased and improved capacity utilisation, teacher training and introduction of the planned change in the overall schools system from the so-called 7+2+2 to the new 2+6+4 system.
Education has historically struggled to raise sufficient money not only for investment and development of the required infrastructure, but also for operation and maintenance of the education system as it is. Domestic resource transfers from the Government budget have barely been able to cover salaries and personnel costs, thus leaving very little for other educational inputs. Donors like Sida, USAID, UNDP and many NGOs have provided important additional resources increasing overall capacity for service delivery. However, there have not been sufficient resources to maintain these capacity increases, nor has it been sufficient to develop the sector as intended in national plans.
The planned change in the basic education system will require an extra effort above what has been provided in terms of resources so far. The Government has in the 2007/08 budget showed that it is aware of the coming challenge and has scheduled what is more than a 50% increase in funds for education. The World Bank has committed about USD 42 million for the Basic Education Improvement Project in the coming years, which will go some way towards addressing the demands originating from system change. However, ZEDP will require additional funds over and above already committed amounts, to implement the planned reforms in an efficient and effective manner.
18.2 The Fiscal Framework Public spending in Zanzibar in general as well as Education in particular funded by domestic resources is in general only sufficient to accommodate recurrent expenditure, primarily wages and salaries. Development expenditure (which includes investment and project related recurrent expenditure) is at a relatively low level, and mostly funded by foreign sources.
The projections for available domestic resources for education are based on projections for overall public domestic resources (i.e. resources not including project tied aid). These projections are based on forecasting future GDP which in turn is the basis for projecting tax revenue. In addition, the RGoZ receives a share of Bank of Tanzania (BOT) dividends, and an agreed share (4.5%) of general budget support (GBS) to the United Republic of Tanzania (URT).
These resources are available for non-discretionary spending like consolidated fund services (CFS) and discretionary expenditure like salaries, other recurrent costs and investments. Over and above these resources, RGoZ will continue to have access to programme and project tied aid negotiated with its development partners. Since these resources are earmarked particular programmes and projects and tied to specific expenditures (only development expenditure) they are non-discretionary.
For the purpose of projecting the resource envelope available to the education sector the focus has been on what domestic resources will likely be available for recurrent education sector spending. Domestic resources for wages and other operational costs (OC) in the education sector will to a large degree determine the level of education sector investments that the RGoZ can sustain, since investments in new classrooms, schools, etc. have recurrent cost

85
implications (cost of new teachers to be employed and operation/maintenance costs for the new facilities). It means there is a limit to how much education sector capacity (or enrolment rate at a given student/teacher ratio) RGoZ can sustain.
Some of the scenarios presented by others give a very optimistic outlook for growth, revenue collection and external discretionary finance beyond any level experienced in the past. Economic development for a small open economy as Zanzibar is highly volatile, and vulnerable to changes in external factors. Accordingly, the projections for ZEDP are based on more conservative assumptions taking into consideration past economic performance and revenue administration.
In projecting available domestic resources for education the following inputs have been used;
- MoEFA figures used for the 2007/08 budget are based on different growth targets than what has been applied for the ZEDP with MoFEA GDP growth figures of close to 9% the first two years.
- The main assumption underlying the Public Expenditure Review for Education (PER)27 is a projected real GDP growth rising to 7% by the end of fiscal year 2010 from its current level of 5.6%28. It assumes a significant and continued high level of growth of the service sector including tourism, one of the main sources of tax revenue.
- In the project appraisal document for the Basic Education Improvement Project the World Bank has applied a more modest growth target of 6% consistent with average real GDP growth the last 5 years.
The assumption underlying some of the GDP forecasts above is that Zanzibar will achieve a steady growth at a level it has only achieved at infrequent intervals in the past, and in particular related to a high level of investments in a fast growing tourism sector. This same sector now faces several constraints with reduced level of capacity utilisation since national infrastructure developments are lagging behind private investments in the same industry.
The agriculture sector accounting for 25% of GDP is projected with a modest growth and close to the average growth rate in recent years. This is an assumption which would contribute to more realistic domestic revenue forecasts. Accordingly, an average growth of GDP at 6% has been applied for projecting domestic resources.
MoFEA assumes a significant growth in revenue collection by Tanzania Revenue Authority (TRA) and Zanzibar Revenue Board (ZRB). Part of this growth is associated with the above assumed higher growth in GDP and thus tax on traded goods and services, partly it must be assumed by either changes in tax policy and/or tax collection efforts.
However, unless there are significant changes in tax policy and efforts which could justify a significant growth of revenue (which means that the projected growth of revenue as share of GDP increases), a more realistic projection would be the current level of 16% of GDP.
Included in this revenue forecast is the BoT dividend which has throughout only constituted a small share of revenue. In addition, MoF mainland has at infrequent intervals made special transfers to accommodate RGoZ liquidity problems in order to accommodate CFS and recurrent obligations (wages and salaries). Additional special transfers are not assumed in the forecasts.
27 ”Zanzibar: Education Sector Public Expenditure Review – Medium Term Expenditure Framework”, Prof. A.V.Y. Mbelle, March 2007. 28 Latest national accounts estimate presented by Takwimu for 2005/2006.

86
External grants can be subdivided into discretionary and non-discretionary resources. The former is mainly General Budget Support (GBS) in which RGoZ is granted a 4.5% share of what URT receives from the external partners. This amount is now released automatically after the approval of the URT budget regardless of actual release of GBS from external partners.
None discretionary external grants relate to programme and project tied aid which is usually earmarked specific items under development expenditure. The PER and MoEFA has used some fairly optimistic assumptions related to external grants, in particular related to estimated budget support (both their share of URT GBS as well as multilateral debt relief).
Overall, the level of discretionary finance for education is linked to two issues; the total discretionary amount available for the budget (ref. above) and the level of priority accorded to education in the budget process (i.e. share of total budget allocated to education on account of other sectors).
Education sector (recurrent) expenditure accounted for 18.8% of total recurrent expenditure and 4.0% of GDP in 2005/2006. Education sector (recurrent) expenditure accounted 24.6% or 15.8% of discretionary finance depending on whether the World Bank PAD or PER estimates is applied. 29
Using the above forecasted availability of discretionary finance the following have been projected as different scenarios of available resources to finance recurrent expenditure for the ZEDP (ref. Table below). Resources for recurrent education expenditure in constant 2006/07 prices (billion TsH)30
2006/07 2007/08 2008/09 2009/10 2010/11 2011/12
World Bank 20.3 22.1 23.8 25.4 26.4 28.4
PER - - - 23.131 - -
ZEDP 20% of total revenue 20.3 19.6 20.6 21.6 22.8 23.9
ZEDP 25% of total revenue 20.3 24.5 25.7 27.1 28.4 29.9
ZEDP 30% of total revenue 20.3 29.4 30.9 32.5 34.1 35.9
The above serves to illustrate the fiscal “space” that MoEVT has for projecting future recurrent cost for education; i.e. the ceiling that will determine the level of recurrent expenditure in the form of salaries and other operational costs that the MoEVT will be able to accommodate. It is this amount that will determine the level of ZEDP investments since it is these resources that will be available to pay for all current and new teachers, and for operation and maintenance of existing and new classrooms and schools.
Which of the scenarios above that should be applied in the ZEDP budget model depends on the priority accorded to the education sector in the budget process and/or to what extent the Government will be able to negotiate external funding for recurrent expenditure (budget support rather than project tied aid earmarked for investments).
29 In the PER it is not always clear if the figures presented are budget, budget execution or accounting figures. 30 Excludes project tied/earmarked grants and Consolidated Fund Services (CFS) 31 Ref. PER chapter V. table 5.3. – the figure adjusted for inflation.

87
The above projections will result in the following recurrent education expenditure share of GDP (ref. table TT). Resources for recurrent education expenditure (percent of GDP)32
2006/07 2007/08 2008/09 2009/10 2010/11 2011/12
World Bank 4.1 4.3 4.3 4.4 4.3 4.3
PER - - - 4.5 - -
ZEDP 20% 3.8 3.8 3.7 3.7 3.7
ZEDP 25% 3.8 3.7 3.7 3.7 3.7
ZEDP 30% 4.7 4.7 4.6 4.6 4.6
While the “ZEDP 20%” scenario assumes a low priority accorded to education in the budget process (close to the average for the last ten years), “ZEDP 25%” assumes a more realistic level of expected allocation to education. “ZEDP 30%” presents a scenario in which education is accorded significant priority on account of other sectors.
For the ZEDP programme budget the ZEDP 25% scenario has been used to determine level of domestic and externally financed education sector investments that RGoZ will be able to sustain over the first 5 years of the ZEDP period. Based on actual data these projections will be updated annually to adjust the ZEDP budget. In the event that external funding allows a further increase in recurrent expenditure (if provided as sector budget support) the “ceilings” should be adjusted.
18.3 Current Education Budget The education budget for 2007/2008 saw a major increase from roughly Tsh 18 billion (actual) the year before to about Tsh 28 bn. Most of the increase is due to a significant increase in personnel costs, from about Tsh 16 billion according to the pay roll in 2007, to now more than Tsh 22 billion in 2007/08. This increase in the budget had been made to cater for among other the 2 027 new persons employed by the ministry, predominantly teachers graduating from teacher education institutions. There are also additional salaries in the institutional grants given to higher education institutions.
The budget in 2007/08 is taken as the base for the projections made in the ZEDP budget. The table below summarises the 07/08 budget according to the main sub-votes, and the main cost components.
As can be seen from the table, there are limited resources available for other school inputs than salaries and grants for institutions, which for its part are mostly operational grants to the University of Zanzibar. This illustrates the strategic predicament Zanzibar education finds itself in, as the high and rapidly increasing staff costs now dominate the expenditure to such a degree that it limits the policy options of the Government. The average P/T ratio is low although there are significant variations between schools. Accordingly, the main focus of this programme is to not expand the number of staff in the sector at any significant degree but rather to more efficiently allocate existing staff and upgrade skill levels of existing staff through training.
32 Excludes project tied/earmarked grants and Consolidated Fund Services (CFS)

88
Education Budget 2007/2008
SV 3
SV 4,5,7,9,
13 SV 8 SV 12 SV 14 SV 15 SV 16 SV 17
Pemba Adm
& school Administr.
Prim
& SecAdult Edu.
Higher Education Vocational
Teacher Training
Second. education TOTAL
Salaries and Allowances 6,320 718 10,717 188 184 42 319 3,645 22,134
Building, Mainten, etc 47 32 5 2 4 2 0 8 100
Purchase vehicles, furniture etc 13 15 8 8 33 2 5 3 85
Local & Foreign training, materials 17 34 15 0 31 2 0 2 102
Teaching Materials 19 0 7 9 0 4 0 50 88
Examination 51 320 0 0 0 0 0 0 371
Grants Institutions (HE) 23 160 0 0 4,190 0 0 0 4,373
Other 144 342 90 16 61 38 20 42 753
TOTAL 6,634 1,621 10,842 224 4,504 89 344 3,749 28,007
18.4 Enrolment Assumptions and Expenditure Projections The key assumption for the expenditure projection is the expected enrolment. This influences the cost of ZEDP through demands on teachers, classrooms, teacher training, materials and other operating costs. A related assumption of great importance is the pupil/teacher ratios at different levels of the education system (lower P/T ratio increases the demand for qualified teachers which combined with higher enrolment increases cost of teacher salary as well as teacher training). In addition, a major share of costs in ZEDP is related to upgrading existing levels of service delivery through teacher training and provisions for teaching materials.
The new Education policy of 2006 introduced a revised structure of the education sector: “The structure of the Formal Education system shall be 2-6-4-2-3+ (that is 2 years of pre-primary education, 6 years of primary education, 4 years of secondary education ordinary level, 2 years of secondary education advanced level and a minimum of 3 years of higher education.)”33 In addition it changed the entry age at primary level from seven to six years.
33 Education Policy 2006, p. 8

89
Entry age at lower secondary level was set at twelve years and at upper secondary level at sixteen years.
For pre-primary education it was stated: “Gradually introducing 2 years of pre-school education as part of basic education.”34
In addition to these structural changes, the Education Policy 2006 and MKUZA also describe - often in concrete terms - the expected enrolment level for each stage of the education system, in some cases with percentage enrolment to be reached at specific years in the future.
Below is a description of the future level of enrolment based on existing policies and strategic decisions made by the MoEVT management for the ZEDP period 2008/09 – 2015/16, for pre-primary, primary and secondary education.
The first 6 year olds will start primary school in 2009. The last cohort starting as 7 year olds will be in Standard 1 in 2008, and graduating from Standard 7 in 2014. In the new calculations, the starting populations of 6 year olds and the phasing out of 7 year olds have been spread out over several years, but there will in any circumstance be a substantial increase in primary school population in 2009.
18.4.1 Enrolment pre-primary The policy is to gradually increase enrolment in pre-primary. The MoEVT has set a target a target of 30% of children entering the public pre-primary system by 2015/16. Pre-Primary enrolment, alternative 1 and 2
Year 2006 2007 2008 2009 2010 2011 2012 2013 2014 2015
Enrolment 3,920 5,010 6,604 9,080 11,746 14,549 12,639 14,712 16,867 19,104
18.4.2 Enrolment primary The primary schools will experience an increasing number of children in response to two factors:
• Projected growth of the population by 3.1 % annually, • The policy target of gradually reducing the number of overage children
The biggest temporary increase in the number of children, however, is due to the fact that the 6 year olds will start in primary school in 2009, as this is the year the new curriculum for primary education Standard 1 is planned to be ready. The last cohort starting as 7 year olds will begin Standard 1 in 2008/09, and graduating from Standard 7 in 2014/15. The total net enrolment figures will stabilise at about 223,000 pupils from 2009/10 and onwards, before dropping substantially in the last year of ZEDP.
34 IBID
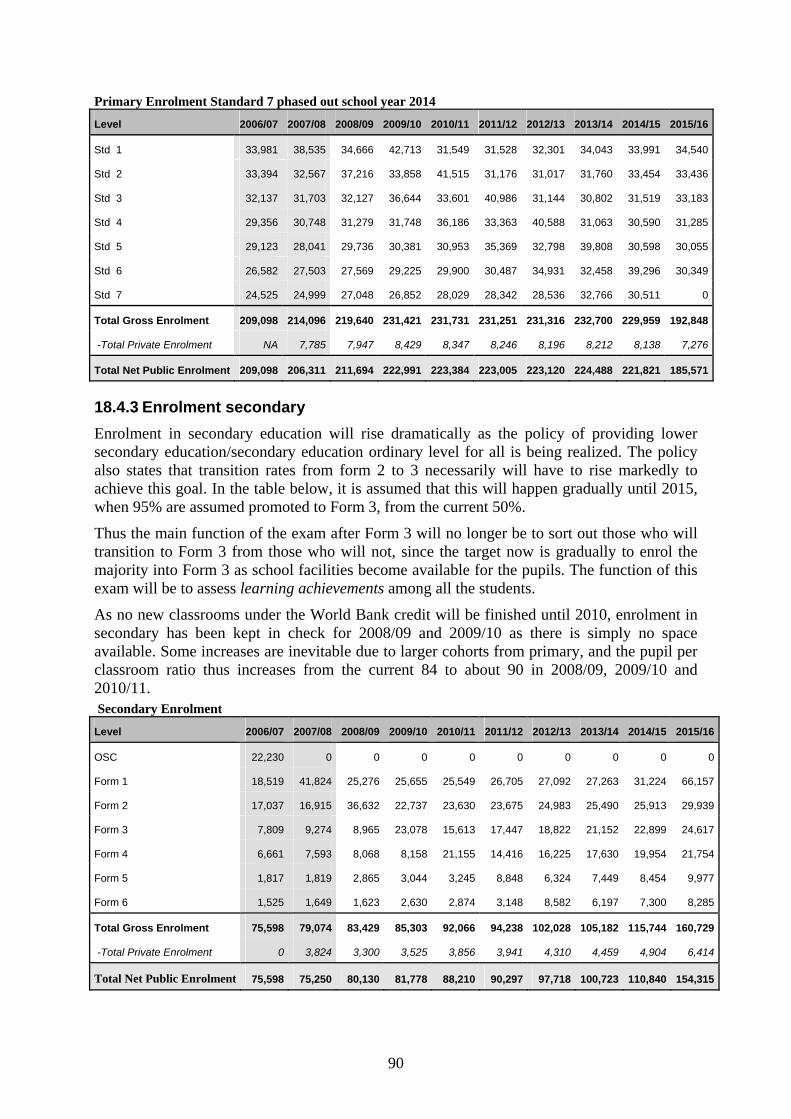
90
Primary Enrolment Standard 7 phased out school year 2014
Level 2006/07 2007/08 2008/09 2009/10 2010/11 2011/12 2012/13 2013/14 2014/15 2015/16
Std 1 33,981 38,535 34,666 42,713 31,549 31,528 32,301 34,043 33,991 34,540
Std 2 33,394 32,567 37,216 33,858 41,515 31,176 31,017 31,760 33,454 33,436
Std 3 32,137 31,703 32,127 36,644 33,601 40,986 31,144 30,802 31,519 33,183
Std 4 29,356 30,748 31,279 31,748 36,186 33,363 40,588 31,063 30,590 31,285
Std 5 29,123 28,041 29,736 30,381 30,953 35,369 32,798 39,808 30,598 30,055
Std 6 26,582 27,503 27,569 29,225 29,900 30,487 34,931 32,458 39,296 30,349
Std 7 24,525 24,999 27,048 26,852 28,029 28,342 28,536 32,766 30,511 0
Total Gross Enrolment 209,098 214,096 219,640 231,421 231,731 231,251 231,316 232,700 229,959 192,848
-Total Private Enrolment NA 7,785 7,947 8,429 8,347 8,246 8,196 8,212 8,138 7,276
Total Net Public Enrolment 209,098 206,311 211,694 222,991 223,384 223,005 223,120 224,488 221,821 185,571
18.4.3 Enrolment secondary Enrolment in secondary education will rise dramatically as the policy of providing lower secondary education/secondary education ordinary level for all is being realized. The policy also states that transition rates from form 2 to 3 necessarily will have to rise markedly to achieve this goal. In the table below, it is assumed that this will happen gradually until 2015, when 95% are assumed promoted to Form 3, from the current 50%.
Thus the main function of the exam after Form 3 will no longer be to sort out those who will transition to Form 3 from those who will not, since the target now is gradually to enrol the majority into Form 3 as school facilities become available for the pupils. The function of this exam will be to assess learning achievements among all the students.
As no new classrooms under the World Bank credit will be finished until 2010, enrolment in secondary has been kept in check for 2008/09 and 2009/10 as there is simply no space available. Some increases are inevitable due to larger cohorts from primary, and the pupil per classroom ratio thus increases from the current 84 to about 90 in 2008/09, 2009/10 and 2010/11. Secondary Enrolment
Level 2006/07 2007/08 2008/09 2009/10 2010/11 2011/12 2012/13 2013/14 2014/15 2015/16
OSC 22,230 0 0 0 0 0 0 0 0 0
Form 1 18,519 41,824 25,276 25,655 25,549 26,705 27,092 27,263 31,224 66,157
Form 2 17,037 16,915 36,632 22,737 23,630 23,675 24,983 25,490 25,913 29,939
Form 3 7,809 9,274 8,965 23,078 15,613 17,447 18,822 21,152 22,899 24,617
Form 4 6,661 7,593 8,068 8,158 21,155 14,416 16,225 17,630 19,954 21,754
Form 5 1,817 1,819 2,865 3,044 3,245 8,848 6,324 7,449 8,454 9,977
Form 6 1,525 1,649 1,623 2,630 2,874 3,148 8,582 6,197 7,300 8,285
Total Gross Enrolment 75,598 79,074 83,429 85,303 92,066 94,238 102,028 105,182 115,744 160,729
-Total Private Enrolment 0 3,824 3,300 3,525 3,856 3,941 4,310 4,459 4,904 6,414
Total Net Public Enrolment 75,598 75,250 80,130 81,778 88,210 90,297 97,718 100,723 110,840 154,315

91
As the table shows, secondary education will see more than a doubling of students during the ZEDP period. The key strategic focal point in ZEDP will be to accommodate this massive increase, without compromising quality.
The secondary enrolment calculations have been based on the following projected promotion rates: Promotion rate secondary education
Class/Year 2006/07 2007/08 2008/09 2009/10 2010/11 2011/12 2012/13 2013/14 2014/15 2015/16
Form 1 - Form 2 Promotion rate 86.5 86.8 87.1 90.3 91.3 92.2 93.2 94.1 95.1 95.0
Form 2 - Form 3 Promotion rate 50.6 48.0 53.0 63.0 68.7 73.8 79.5 84.7 89.8 95.0
Form 3 - Form 4 Promotion rate 84.0 87.0 89.0 91.0 91.7 92.3 93.0 93.7 94.3 95.0
Form 4 - Form 5 Promotion rate 31.6 33.6 35.7 37.7 39.8 41.8 43.9 45.9 48.0 50.0
Form 5 - Form 6 Promotion rate 84.0 86.6 89.2 91.8 94.4 97.0 97.0 98.0 98.0 98.0
The total enrolment is summarised in the following figure: Projected enrolment pre-primary, primary and secondary education
4 5 7 9 12 15 13 15 17 19
209 206 212223 223 223 223 224 222
186
76 75 80 82 88 90 98 101111
154
0
50
100
150
200
250
2006
/07
2007
/08
2008
/09
2009
/10
2010
/11
2011
/12
2012
/13
2013
/14
2014
/15
2015
/16
'000
Stu
dent
Pre-Primary,Public
Primary school
Secondaryschool
18.5 Other Assumptions The enrolment projection determines the number of teachers required, learning equipment per student and the classrooms needed. Other key assumptions for the expenditure projections include:
- The calculation is done in fixed 2007 prices. All costs are assumed to develop in line with inflation, i.e. there is no change in real terms. The Tsh/USD rate used is 1300. This is similar to the WB rate (1306) applied in their calculations.
- As mentioned, a key cost driver is enrolment. This again is normally based on population projections. As the existing population projections were obviously wrong – the number of 6 year olds increased by about 34% from 2008 to 2009 – ZEDP has through joint analysis

92
with the Bureau of Statistics in Tanzania made a corrected - but preliminary – new population projection.35 This may need further refinement, but is believed to be more accurate than the currently official data.
- The two basic types of expenditures are recurrent – or operational costs - and development costs. Recurrent includes all operational costs included in running an education sector. The development cost includes all typical capital expenditure projects and all development projects as proposed in the 13 Components described in the ZEDP. All expenditures connected to the Basic Education Improvement Project financed through the World Bank credit is categorised as development cost. Some costs items – like textbooks – moves from being developmental through WB and ZEDP support early in the period, to being recurrent as the MoEVT takes over responsibility for operating a sustainable textbook programme later.
- All known projects from all donors have been tried included. Some smaller support programmes from for instance NGOs that go directly to the schools may not be included, but this is not believed to represent significant amounts.
- The budgeting has been done according to standard projection methodology for pre-primary, primary and secondary sectors. Number of teachers, classrooms and other inputs are calculated by combining enrolment numbers and targeted ratios for Pupil-Teacher-Ratios and Pupil-Classroom-Ratios. Detailed information about the other education sectors than pre-primary, primary and secondary does not yet exist in a systematic form. The recurrent costs for these other sectors have been based on the 2007/08 budget level, adjusted somewhat for assumed changes in operational activity levels.
- The PTR for primary and secondary education is now about 26 pupils per teacher. The PTR target in 2010 is 40, in other words the current number of teachers on the pay roll can support a much higher enrolment. Indeed, it is not until 2015/16 that new teachers are needed. Thus, the current gross number of teachers of about 11,300 is kept for almost the whole period.
- Administration is calculated the same way, but with a general increase of 1% in real terms each year. Substantial strengthening of capacities and abilities are foreseen. The main share of administration expenses is personnel expenditure, but it is very difficult to identify the exact amount, as administration is lumped together with other sectors in the accounts and in the budget, and is almost impossible to verify.
- The budget and the WB PAD have been used to estimate unit costs for many of the items. Salaries are taken from the payroll 2007, but adjusted substantially upwards to come into line with the total budgeted salary figure for that year. Of the grants given to SUZA, it is assumed that 70% will be for salaries. This may be a conservative estimate.
A few caveats remain as to the accuracy of the budget projections. An important one is that current accounting does not support sub sector cost analysis, as administration, pre-primary, primary and secondary to varying degrees are lumped together under different sub-votes. Thus, there is uncertainty as to the initial resource allocation between sub-sectors assumed for the budget. ZEDP has used proxies like number enrolled school children to split for instance the teachers on the different sub-sectors. However, it is unlikely that any intra sub-sector deviations are of great significance for the total costing of the ZEDP. Further, the MoFEA is now introducing a new accounting system (PFMRP) that will allow sub sector accounting, and output based financial reporting in the future.
35 One of the key problems with the existing projections was that age specific fertility rate used was not consistent with the 2002 population census, and resulted in a growth of 0-1 year age group by close to 30% from the 2002 population data to the 2003 projection data.

93
A second issue is general uncertainty about accuracy of numbers, like for instance teacher placement and teacher activity. The state of school infrastructure is also to a large degree unknown. However, these will be sought addressed through the planned school mapping exercise included in Component 1 described above.
The above assumptions result in the following cost projection. The operational – or recurrent cost – summarises as follows:
Education Recurrent Cost Projection 2007 – 2015 (bn 2007 Tsh) Bn Tsh 2007/08 2008/09 2009/10 2010/11 2011/12 2012/13 2013/14 2014/15 2015/16
Pre-Primary 0.67 0.84 1.11 1.40 1.69 1.47 1.64 1.81 1.95
Primary 12.12 12.21 12.10 12.08 11.83 12.89 12.72 12.53 12.18
Secondary 5.08 5.67 5.58 5.68 5.93 6.50 6.63 6.73 9.67
Tertiary 4.51 4.53 4.53 4.53 4.53 4.53 4.53 4.53 4.53
Vocational & Teacher 0.43 0.50 0.51 0.52 0.53 0.54 0.55 0.56 0.58
Non-Formal & Adult 0.31 0.31 0.32 0.32 0.32 0.32 0.32 0.32 0.33
Administration 4.91 4.96 5.01 5.06 5.11 5.16 5.21 5.26 5.32
Total Recurrent Costs 28.03 29.03 29.15 29.59 29.95 31.42 31.61 31.76 34.56
- of which personnel costs 25.08 25.31 25.80 26.00 26.27 26.43 26.57 26.64 28.71
The key point to notice is the high salary cost. However, space is slowly created also for other kinds of education inputs over the period in question. Primary is the biggest sector and will remain so for the duration of ZEDP. Secondary sees a major increase in costs in 2015/16, when it receives two classes from primary following the reduction to 6 years in primary. Only small increases are assumed in other sectors, with the pre-primary adding about Tsh 1.2 bn to costs in the period.
The development cost is dependent on the targets with regard to infrastructure, and the building of schools. The expansion of the secondary system will in particular demand additional external funding, even though the World Bank credit is already funding parts of the required buildings. In 2014, Standard 7 will be abolished, and two classes will join the secondary, and this will have a major impact on costs. This requires additional funds over and above what has already been secured through the WB credit. Development costs have been split according to the components as described in the earlier sections. Education Development Cost Projection 2007 – 2015 (bn 2007 Tsh)
2008/09 2009/10 2010/11 2011/12 2012/13 2013/14 2014/15 2015/16 Total
Cp 1: Education Sector Management 0.98 1.03 0.62 0.62 0.58 0.00 0.00 0.00 3.83
Cp 2: Teacher Education 3.49 3.53 3.81 1.11 0.51 0.06 0.06 0.06 12.64
Cp 3: Teacher Recruitment 0.02 0.01 0.00 0.01 0.00 0.00 0.00 0.00 0.05
Cp 4: Pre Primary Education 0.56 0.93 1.00 1.11 0.01 0.41 1.03 1.13 6.19
Cp 5: Primary Education 3.57 6.57 2.99 3.34 2.61 2.65 2.47 2.47 26.65
Cp 6: Secondary Education 17.87 19.30 19.05 3.48 10.23 5.83 10.28 10.45 96.48
Cp 7: Vocational Training 1.59 1.59 0.22 0.00 0.04 1.38 1.38 1.38 7.56
Cp 8: Tertiary Education 2.04 2.34 0.86 0.59 0.00 0.00 0.00 0.00 5.83
Cp 9: Non Formal and Adult Education 0.04 0.17 0.46 0.00 0.04 0.10 0.00 0.00 0.80

94
Cp 10: Gender 0.00 0.02 0.02 0.02 0.02 0.02 0.02 0.02 0.16
Cp 11: Special Needs and Inclusive 0.39 0.49 0.22 0.22 0.22 0.22 0.22 0.22 2.21
Cp 12: Health, Nutrition and HIV/AIDS 0.39 0.07 0.01 0.01 0.00 0.00 0.00 0.00 0.47
Cp 13: ICT 0.02 0.70 0.42 0.10 0.10 0.10 0.10 0.10 1.62
Unallocated 0.37 0.64 0.55 0.43 0.69 0.54 0.78 0.79 4.79
Total 31.32 37.40 30.21 11.04 15.06 11.30 16.33 16.62 169.28
The focus on expanding secondary education is clearly visible in the development costs. Secondary constitutes about 58% of all development costs. Most of this is for the building of schools and classrooms, construction of support facilities, staff houses and for education inputs like textbooks. The second most important is primary, which will also see some construction, while teacher education is the third biggest item. More than Tsh 12 bn will be spent on generally increasing teacher capacity, and on building an adequate teacher education infrastructure. The focus on increasing teacher quality is a conscious strategic choice in the ZEDP.
The total costs including both recurrent and developmental is shown in the figure below. Total ZEDP Expenditure
2007
/08
2008
/09
2009
/10
2010
/11
2011
/12
2012
/13
2013
/14
2014
/15
2015
/16
0
10,000,000
20,000,000
30,000,000
40,000,000
50,000,000
60,000,000
70,000,000
'000
TSH
DevelopmentRecurrent
The figure shows that there will be large expenditures in the first 3 years of ZEDP. This is partly due to the fact that the Basic Education Improvement Project will be implemented then, but it is also in general the result of general capacity investments to prepare for and implement the overall education system reforms.
18.6 Financing requirement As described above, the Government has made a forecast of likely government spending for education, depending on how much of the total government budget will be allocated to education. Three scenarios were shown, where alternatively 20%, 25% and 30% of the total government recurrent budget is spent on education. The base case is assessed to be the 25% scenario. The revenue forecast in the World Bank PAD document is also included for reference. To ensure a sustainable development path in the long term for the education sector, revenues from the Government should cover at least the recurrent, operational cost. The budget includes substantial investments, and to uphold the capacity and quality of that

95
investment, necessary resources must be allocated to its maintenance in the broadest sense. Also, the Government want Zanzibar to take the funding responsibility of key inputs like basic textbooks to ensure that control over the basic education package is in Zanzibari hands. In the budget, while donors will support the purchase and distribution of text- and reference books in the first 4 years, the recurrent budget tales over most of the funding responsibilities from about 2012.
The recurrent expenditure budget is compared to two government funding scenarios in the figure below, one for 25% and one for 20% of total government revenues. Total ZEDP Expenditure
Recurrent Expenditure & Revenue Scenarios
0.0
5.0
10.0
15.0
20.0
25.0
30.0
35.0
40.0
2008/09 2009/10 2010/11 2011/12 2012/13 2013/14 2014/15 2015/16
Bn T
sh
Recurrent expenditure
ZEDP 20%
ZEDP 25%
While the ZEDP starts out with a slight deficit compared to the 25% scenario, it turns into a surplus from about 2011. Zanzibar will in this case be able to pay for running its own education sector when the end of ZEDP is reached in summer 2016. On the other hand, the projected recurrent costs will never be covered if the 20% turns out to be the correct scenario.
When assessing the total funding package, all major donors are included. The biggest is the World Bank credit that will contribute with about USD 42 mn net, and USD 48 mn gross in financing.36 The timing of the implementation and the release of funds is as of January 2008 not finally decided, but the majority is assumed to be spread over the next 3 years. The resulting external funding gap after deducting government revenues and secure funding is shown in the table below, under both the 20% and 25% scenarios. All numbers have been converted to USD at the 1300 Tsh/USD exchange rate. Calculation of external funding gap 2007 – 2015 (mn 2007 USD)
Mn USD 2008/09 2009/10 2010/11 2011/12 2012/13 2013/14 2014/15 2015/16 Total
Recurrent expenditure 22.33 22.43 22.76 23.04 24.17 24.31 24.43 26.58 190.05
Development Expenditure 24.09 28.77 23.24 8.49 11.58 8.69 12.56 12.79 130.22
Total Expenditure 46.42 51.19 46.00 31.53 35.75 33.00 36.99 39.37 320.26
- World Bank, other Funding 17.85 18.09 14.43 1.49 0.45 0.00 0.00 0.00 52.31
36 The local contribution of USD 6 mn will be in the form of exempt VAT, and is thus included as additional funding as the costs have been registred includisive of VAT.

96
"Gross" Funding Gap 28.57 33.10 31.57 30.04 35.30 33.00 36.99 39.37 267.95
ZEDP Base Case 20% of rev. 15.85 16.62 17.54 18.38 18.71 19.34 19.97 20.60 147.01
ZEDP Base Case 25% of rev. 19.77 20.85 21.85 23.00 24.69 26.03 27.37 28.72 192.27
Net Funding Gap 20% of rev 12.73 16.49 14.03 11.66 16.59 13.66 17.02 18.77 120.94
Net Funding Gap 25% of rev 8.80 12.26 9.72 7.04 10.62 6.97 9.62 10.65 75.68
In total, a 25% revenue case would require about USD 76 mn in external funding in addition to what is already committed to pay for the ZEDP until 2015/16. In the 20% case, the total external funding requirement is significantly higher at about USD 121 mn.

97
19 MANAGEMENT AND MONITORING OF ZEDP
19.1 Management ZEDP is an integrated part of the total public education sector and will be fully managed by the MoEVT through its regular organisation, systems and procedures. ZEDP is by definition equivalent to the activities funded under the education sector budget heads (education sector sub-votes of the MoEVT budget) which include both policy, regulatory and service delivery functions of all the education sub-sectors as well as the additional capacity enhancing measures described in this document.
The departments of MoEVT will accordingly be responsible for the implementation of respective sub-sector activities of ZEDP for which they are in charge under the overall supervision of the Principal Secretary of the MoEVT.
The overall coordination will be done by the Department of Policy, Planning, Budget and Research. In addition the Zanzibar Education Sector Committee (ZESC) which is already established to monitor sector developments, will also oversee the progress in implementing the ZEDP program, in particular related to the achievement of the ZEDP targets. For this purpose they will be informed by quarterly progress reports showing actual outputs produced compared to targets set in annual work-plans as well as changes in sector outcome indicators as presented through annual EMIS monitoring reports and reports from annual technical reviews.
The programme management will in addition call for semi-annual consultations with its external funding partners to jointly review annual progress and present next year’s work-plans.
19.2 Monitoring and reporting
19.2.1 Meetings The MoEVT will organise Semi Annual meetings in cooperation with the Zanzibar Education Sector Committee (ZESC). The meetings will serve as a common review process of programme performance including MoEVT, MoFEA, NGOs and external funding partners to the sector.
The process will consist of semi annual review meetings of which one will review progress in previous fiscal year and the other will review proposed work-plan and budget for the upcoming fiscal year. The semi annual meeting to review progress, will be convened in October/November, while the semi-annual meeting to review proposed work-plan and budget will be convened in April/May in time for inclusion of decisions in the overall submission of the MoEVT budget to MoEFA and subsequently the House of Representatives following the regular state budget calendar of RGoZ (ref. review calendar below).
The meeting in March/April will review the Annual Workplan and Budget for ZEDP for the next fiscal year, the audit report of the previous fiscal year, and the findings of a technical review mission.
The meeting in October/November will review overall progress for the previous fiscal year based on reports, progress reports and annual reports. The Donors are expected to make an initial indication of funding to be provided for ZEDP for the following fiscal year in order for MoEVT to include this in their budget preparation process for the Ministry.

98
The Donors, MoFEA, the Office of the Controller and Auditor General ("OCAG") and MoEVT will be represented at the meetings. MoEVT in cooperation with the Donors will be responsible for the agenda. MoEVT will call and chair the meetings.
The outcome of the meetings will be presented in an aide memoire. ZEDP will be monitored by MoEVT using internal monitoring procedures, among others guided by the financial regulations of RGoZ including monitoring of physical and financial performance, financial management, internal control and external audits.
19.2.2 Reporting Monitoring will consist of three broad elements;
√ Monitoring of progress by compilation of within year and annual progress reports with information on performance of each of the components towards achievements of defined outputs presented in annual work plans and budgets (AWPB), which translates the broad program targets presented in the ZEDP into detailed outputs, activities and inputs for each fiscal year,
√ Monitoring of resource use will be based on expenditure returns compared to the budget by institutional, functional and economic classifications using RGoZ chart of accounts and by component in accordance with the ZEDP programme structure (ref. Annex I and proposed reporting format attached to the MoU in Annex III). The accounts are consolidated and closed on a monthly basis. With the introduction of the computerised Financial Management Information System (IFMIS) to MoFEA in Zanzibar (through the PFMRP) and the implementation of the same in MoEVT, RGoZ will be able to produce timely reports according to the above classifications.
√ Monitoring and reporting on utilisation of development partner contributions from partners, who will transfer their funding for ZEDP through the Treasury (support to ZEDP fully aligned with RGoZ systems), will be based on bank reconciliation statements that will show withdrawal of donor deposits into forex account(s) reconciled with actual transfers to Treasury revenue account for funding of ZEDP.
√ For development partners who will support specific expenditure items/components through separate forex accounts (project tied aid) under management of MoEVT, a separate report reconciling expenditure with deposits made will be produced, While the latter is not the desired funding arrangement since it requires additional accounting and monitoring efforts in the financial monitoring of ZEDP, it is envisaged that some external partners may not be in a position to extend its contribution through the RGoZ treasury system (full alignment).
The above reports will be consolidated and produced within the year and annually showing changes within the period as well as cumulative for the year. The last report in the fiscal year will accordingly serve as the annual report for the full fiscal year.
In addition to the above, MoEVT will produce annual education sector performance reports showing changes in key outcome targets as per ZEDP (like for instance enrolment, Pupil/teacher Ratios, Pupil/Classroom Ratios, learning achievement measurements like SACMEQ, examination results and other data on learning achievements). These reports will, as in the past, serve as the key monitoring instruments to assess overall sector and sub-sector performance.
MoEVT will also commission periodic studies to further assess learning achievements. The RGoZ will conduct annual audits of MoEVT accounts which will include the ZEDP budget heads (education and administration). The audit will be conducted by the Office of the Controller and Auditor General, Zanzibar (OCAG). As per OCAG mandate the audit will be a full scope financial and compliance audit. The annual audit report will be presented by 6

99
months after close of the fiscal year. Due to capacity constrains, OCAG may be contracting external auditors to support them in for which the cost will be borne by the RGoZ budget (extra budgetary allocations for OCAG).
19.2.3 Reviews The semi-annual meetings will be presented with the relevant plans, budgets and reports as described under the section above. In addition it will, based on prior annual meeting decisions conduct reviews and studies before the next semi-annual meetings to assess actual outcomes of the ZEDP and/or assess specific area of focus under the ZEDP (like learning outcomes, outreach of services, efficiency and effectiveness of resource use).
These reviews will be external and thus serve as an additional source of information to verify progress and annual reports based on internal monitoring systems, as well as opportunities to conduct studies and assess outcomes in specific areas, both for monitoring purposes and for informing the MoEVT and donors in the process of reviewing the AWPB.
19.3 Monitoring of ZEDP/Education Sector outcomes Policy and Planning are two dimensions that are strategic to the realisation of the objectives of the ZEDP. These two aspects jointly aim to develop, revise and improve the overall framework for quality educational planning of education delivery. At the centre stage of this task is the Section of Statistics under the Department of Policy, Planning, Budgeting and Research, which will assume an even more important facilitative responsibility for planning and monitoring of ZEDP through its EMIS system.
With the technical support from UNESCO Institute for Statistics (UIS), MoEVT is currently engaged in a project of upgrading its central EMIS system. The EMIS will, through this project, build sustainable capacity in order to meet in a timely and reliable fashion both the quantitative and qualitative information requirements of all education sector stakeholders and for the annual planning process and progress reporting on sector outcomes in the context of ZEDP as described in sections above.
There is not yet a systematic program to monitor the standard of quality factors on the input side in the teaching and learning process, such as teacher qualifications and motivation, standard of school building and equipment or availability of textbook and learning material for pupils. However, this will be developed as one of the results of the mapping exercise.
On the outcome side of education, the main indicators of learning achievements presently available to the Education authorities are examination results and results from international, comparative studies. Examination results for each school are known, and are to some extent used in feedback to schools to improve learning achievements.
Examination results are by many educationalists regarded to be of somewhat limited value as measurements of learning achievements.
Zanzibar also takes part in cross-national studies organized by the Southern and Eastern Africa Consortium for Monitoring Educational Quality – SACMEQ (See 2.2 Primary Education). These studies will serve to inform MoEVT on sector outcomes.
In addition, the technical reviews mentioned above will serve as an additional opportunity to acquire general and specific survey based data related to sector outcomes.

100
19.4 Coordination with external funding partners To ensure a consistent framework for program monitoring and reporting as well as funding, MoEVT will, jointly with the external development partners, draft a Memorandum of Understanding (MoU)) which will describe in more detail the above management and monitoring instruments to ensure a consistent and harmonised approach to monitoring and support for the ZEDP. A first draft is presented in Annex III to this document and is intended as the point of departure for a dialogue with the donors considering support to ZEDP.
All external partners who consider support for the program, will be invited to become signatories including current partners that have already committed their support. Any new partners considering support to the ZEDP will be included as and when their decision to support the ZEDP has been made.
The MoU also includes a model disbursement arrangement and associated monitoring and control mechanisms for donors aligning their support to RGoZ management systems (Treasury disbursement arrangement).

101
ANNEX I: ZEDP PROGRAMME FRAMEWORK Component Objectives Outputs 2008/09 – 2015/16 Activities 2008/09 – 2015/16
1. EDUCATION SECTOR MANAGEMENT AND DECENTRALISATION
Strengthened MoEVT capacity to do needs assessment for policy adjustment, based on widely accepted quality planning tools.
Strengthened MoEVT capacity to develop and implement policies and programs, based on these needs assessments.
Strengthened MoEVT capacity to monitor conditions and results at the school level; plan and implement changes to improve conditions and results at the school level, in particular by developing and utilizing management resources at the district and school levels.
1. Mapping instrument for pre-schools, primary and secondary schools and non-formal and adult education centres, developed and tested by end 2008.
2. Mapping exercise of all schools and non-formal and adult education centres conducted by end 2010.
3. Standards defined for pre-schools, primary and secondary schools and non-formal and adult education centres by end 2011.
4. Basic planning and monitoring skills improved in the MoEVT by end of 2009.
5. Improved MoEVT capacity for strategic and oversight functions at the national level by end 2009.
6. Block Grant system reviewed and decision on feasibility and expansion by end 2010.
7. The Department of Inspectorate restructured and strengthened as an autonomous body by end of 2009.
1. Develop a mapping instrument for pre-schools, primary and secondary schools and non-formal and adult education centres
2.. Carry out a comprehensive mapping exercise of all schools and non-formal and adult education centres in Zanzibar
3. Develop minimum standards for infrastructure demands for pre-schools, primary and secondary schools and non-formal and adult education centres
4. Basic planning skills training for management and key staff at the MoEVT on the use of data including use of projections; programme design; preparation of operational plans and monitoring of programme implementation.
5. Implement functional and organisational review of the MoEVT including decentralising the first 10 tasks where the MoEVT does not add value to the work process to lower levels of the education system by end 2008. 6. Establish pilot projects on Block Grants in 10 schools
7. Restructure and change the Department of Inspectorate to become an autonomous body. As part of the restructuring review recruitment criteria required for qualifications of school inspectors
2. TEACHER EDUCATION
Upgraded teachers to meet demands of new curriculum
Teachers meeting the required qualifications at all levels
I Pre-service teacher education
1. Authority to ensure quality control of teacher training established by mid 2009.
2. Policy and guidelines developed by end of 2008.
3. Revised and updated plan for teacher education by end 2009.
4. Teacher education Diploma program established in SUZA by end 2009.
5. Enrolment of student teachers in mathematics, science and language subjects increased to a level required by lower education institutions.
I Pre-service teacher education
1. Establish a national authority for control of teacher training
2. Develop policy and guidelines on teacher training for formal and non-formal education
3. Revise and update the plan for teacher education to meet demands for required qualifications at all levels
4. Establish teacher education department in SUZA
5. Expand enrolment of student teachers in SUZA and private training institutions to meet the need for diplomas and degrees in mathematics, science and language subjects
6. Develop plan and curriculum for pre-primary teacher education
7. Establish and run pre-school teacher education in TTCs (Number of students to

102
Component Objectives Outputs 2008/09 – 2015/16 Activities 2008/09 – 2015/16 6. Curriculum for pre-primary teacher education developed by end 2009.
7. Pre-school and adult education course within the Teacher training colleges developed to be delivered by academic year 2010.
8. 100 tutors trained in TTCs by end 2012.
9. 2800 teachers trained on using test items to assess higher order skills by 2016.
10. Plan for teaching material improvements produced by end of 2009.
11. Investment in teaching materials in TTCs, Libraries, Labs, computer labs and other teaching facilities increased by at least 50 % by 2016
12. All TTC support staff trained by end 2012.
be decided based on needs assessment )
8. Train 100 tutors to increase staff capacity at TTCs (25 new tutors per year).
9. Train 400 teachers per year on using test items to assess higher order skills
10. Appraise teaching materials in TTCs. Libraries, labs, computer labs and other teaching facilities and formulate plan for improvements
11. Based on the appraisal, improve teaching materials in TTCs, Libraries, labs, computer labs and other teaching facilities
12. Upgrade the existing and train new support staff (Librarians, lab techs, computer techs etc.) to cater for better services at the four TTCs.
II In-service training
1. The purpose and roles of TCs and NTRC, reviewed and changes proposed by end 2008.
2. Capacity building program implemented to strengthen NTRC by 2009.
3. Capacity building programme developed and delivered for TC professional staff by end of 2010.
4. Training completed for.
- 500 secondary and 1039 primary teachers in Mathematics and Science
- 2000 primary teachers in English
- 300 head teachers, 30 inspectors, 36 subject advisors, and 9 teacher centre coordinators in school management and teacher supervision
5. All primary and secondary school teachers trained in the new curriculum by
II In-service training
1. Assessment of capacity needs for TCs and NTRC to meet new challenges from education sector reforms and design capacity building program.
2. Develop and implement capacity building program including allocation of required recurrent budget funding for NTRC.
3. Strengthen TCs capacity to provide the training demanded from them through implementation of a comprehensive capacity building programme.
4. Implement the in-service training programme under the Basic Education Improved Programme.
5. Train all teachers in the new curriculum for 10 days.
6. Train all Standard 1 teachers for the new entry age of 6 year old pupils.
7. Upgrade teachers’ competence in language teaching, both Kiswahili and English from Standard 1 as per Zanzibar language policy.
8. Train all teachers in innovative skills and child friendly methods for 4 days.

103
Component Objectives Outputs 2008/09 – 2015/16 Activities 2008/09 – 2015/16 2011.
6. All teachers in Standard 1 trained for the new entry age of 6 year old pupils by the start of school year 2009/10.
7. All primary school teachers trained in the use of Kiswahili and English respectively (depending on grade and subject taught) as a language of instruction by 2011.
8. All primary school teachers trained in innovative skills and child friendly methods by 2011.
III Head Teacher training
1. Management course delivered to all Head Teachers by end 2012.
2. Management course at diploma level mandatory by end 2016.
III Head Teacher training
1. Develop and conduct a short management course for all Head teachers.
2. Develop a management course at diploma level for Head teachers as a part time course at SUZA. Made mandatory by end of 2016 for all Head teachers.
3. TEACHER RECRUITMENT AND DEPLOYMENT
System for recruitment and deployment to ensure that qualified teachers are equitably distributed across Zanzibar
1. MoEVT recruitment and deployment unit established by mid 2009.
2. Revised system of deployment designed by end 2009.
3. A Teacher Service Commission established by end 2008.
4. Incentive package for teachers working in areas with recruitment problems developed and implemented from budget year 2010/11.
1. Establish a unit in MoEVT responsible for the recruitment and deployment of teachers.
3. Review the system of deployment to become more transparent and demand based.
2. Establish a Teacher Service Commission.
4. Develop incentive package for teachers working in areas with recruitment problems
4. PRE-PRIMARY EDUCATION
Ensure equitable access to a quality pre-school education for all children at the age four years through increased enrolment to public pre-schools to 30% by 2016 and expansion of enrolment to private pre-school to reach 40% by 2016.
1. Criteria for pre-schools established by end 2009.
2. Awareness campaigns conducted by end 2010.
3. Based on the mapping results and the defined standards, 800 new classrooms constructed and 107 existing classrooms upgraded within four years.
4. 140 playground facilities constructed by
1. Develop criteria for pre-school establishment.
2. Conduct awareness campaigns and provide incentives for establishing pre schools.
3. Construction of classrooms. Procurement and installation of school furniture and equipment, and preventive maintenance measures.
4. Improve existing and make new pre-school playgrounds. 5. Develop School Feeding and Dental Health Program in government pre-schools.

104
Component Objectives Outputs 2008/09 – 2015/16 Activities 2008/09 – 2015/16 2016.
5. School Feeding and Dental Health Program implemented in all government pre-schools by end of 2013.
5. PRIMARY EDUCATION
Equitable access to a quality primary-school education for all children from the age of 6 years.
Net Enrolment Rate 90 % by end 2010 and 95 % by 2016.
Net enrolment rate for Standard 1 pupils 100% by 2016.
1. Mobilisation campaigns developed and implemented by end 2008 on the reform to enrol 6 year olds in Standard 1.
2. Minimum standards established for a conducive learning environment that is safe, gender sensitive and child friendly by end 2010.
3. New curriculum introduced by end 2009
4. Quality benchmarks developed and applied by end 2011
5. Approximately 330 new classrooms built and 875 existing classrooms upgraded by 2016.
6. 220 schools accessible for children with disabilities by 2014.
7. All students provided with one set of text books each and all teachers with teacher guides by 2016.
8. Construction of 100 toilets with water supply per year.
9. 50 gender sensitisation workshops conducted each year (total of 250 workshops).
10. Mobilisation campaigns and workshops on girl’s education once a year.
11. 175 staff houses constructed by 2015/16.
1. Mobilize communities for the reform of getting 6 year olds to enrol in Standard 1 from 2009.
2. Establish minimum standards for a conducive learning environment that is safe, gender sensitive and child friendly.
3. Revise curriculum to take into account new entry age and reduction of primary education from 7 to 6 years.
4. Establish benchmarks for measuring quality at various levels of primary education.
5. Based on the mapping results and the defined standards, construction and renovation of classrooms, other educational facilities and teacher houses. Procurement and installation of school furniture and equipment, and preventive maintenance measures. Mobilize the community/parents in maintenance of the classroom/school building by organizing the SMC.
6. Based on the mapping results and the defined standards, improve school buildings to make them accessible for children with disabilities
7. Procurement and distribution of textbooks (total approx. 2 million textbooks) and other learning materials for all levels with the introduction of a rental scheme for textbooks and approximately 11250 teacher guides per subject for 8 subjects.
8. Improve and maintain the physical facilities of the school to make it gender friendly by 2015.
9. Conduct 50 gender sensitization workshops for teachers, head teachers, Community, REOs & DEOs per year.
10. Develop mobilization campaigns to mobilize and advocate for girls’ education through meetings, conferences, media, workshops and public forums.
11. Construction of 175 staff houses, 5 per school, for primary schools in areas with recruitment problems
6. SECONDARY EDUCATION
A review undertaken of needed changes in secondary education as it is changing from elite to mass education
1. A proposal submitted from a Technical Working Group appointed by the MoEVT to review need for changes in secondary education, regarding number of subjects, curriculum and assessment/examination system. Reforms of secondary education
1. Review the consequences of the reforms on access to secondary education and propose changes in the content, teaching and learning methods and organization of lower and upper secondary education (to be fully implemented from the school year 2012).
2. Procurement and distribution of textbooks and other learning materials for all

105
Component Objectives Outputs 2008/09 – 2015/16 Activities 2008/09 – 2015/16 Transition rate from Standard 6 to Form 1 of 95 %
Transition rate from Form 4 to Form 5 of 50 %
introduced for Form 1 from school year 2012
2. 3 reference text books for teachers of all 6 levels and 11 subjects in each secondary schools and 90 reference text books in 11 subjects distributed to each school
3. Construction of 550 new classrooms.
4. Rehabilitate 50 existing school buildings and 2 girl hostels for year 2008-2015
5. Construct 2 girl boarding schools in Pemba and Unguja.
6. 70 Science camps/clubs in lower Secondary schools for a total of 350 students by 2016.
7. Annual such as Science/Math Festival for subject competitions.
8. 175 staff houses for schools in areas with recruitment problems constructed by 2016
9. All students provided with one set of text books each and all teachers with teacher guides by 2016.
levels with the introduction of a rental scheme for textbooks.
3. Construction of classrooms, other educational facilities and teacher houses. Procurement and installation of school furniture and equipment, and preventive maintenance measures. Mobilize the community/parents in maintenance of the classroom/school building by organizing the SMC.
4. Rehabilitation of school physical facilities including renovation of classrooms, teacher houses, girls’ hostel to make it gender friendly.
5. Construct 2 girl boarding schools in Pemba and Unguja.
6. Introduce Science camps/clubs in lower Secondary schools (50 students per year).
7. Provide program for subject competitions in Science/Math Festivals.
8. Construct staff houses for secondary schools in remote areas. 9. Procurement and distribution of textbooks in four subjects for all students in the first four years of secondary school and in all subjects for all students in Forms 5 and 6 (a total of approx. 475 000 textbooks during the programme period) including science equipment and consumables to all schools teaching science, library books and other learning materials

106
Component Objectives Outputs 2008/09 – 2015/16 Activities 2008/09 – 2015/16
7. TECHNICAL AND VOCATIONAL EDUCATION AND TRAINING
Expansion of technical and vocational training infrastructures for skills development and upgrading; Public-private partnership and networking with TVET stakeholders established and promoted Vocational training programme linked with labour market demands Vocational and technical education/training accessible to children with special needs Entrepreneurship and information and communication technology skills provided to trainees
1. A Vocational Training Authority (VTA) established by end 2008 and fully operational by mid 2010 including new fully equipped VTA office building.
2. Policy and guidelines for better TVET programmes established by June 2013
3. The two regional TVET facilities completed in early 2008 equipped and ready for use by end 2008
4. TVET facilities established in the remaining three regions by end 2015
5. Strategies and plan for refurbishing existing training facilities to match identified national requirements ready by mid 2013
6. Plan for establishing district TVET facilities by end 2016.
7. Public-private partnership and networking with TVET stakeholders established by mid 2013
8. Vocational Training programmes improved to link with labour market demands by mid 2013
9. Capacity of instructors built as per CBET needs by mid 2013
1. Appoint VTA Board of Directors and establish Board Advisory Committees. Recruit 8 additional staff to the ones in the present Department of Technical and Vocational Training. Design and construction of VTA office building.
2. Develop and review policy and guidelines for TVET
3. Plan and budget for equipping to the two new regional TVET facilities ready by mid 2008
4. Plan for construction and equipping the remaining three regional TVET facilities
5. Develop strategies and plans for refurbishing existing training facilities to match identified national requirements
6. Develop plan for establishing district TVET facilities for next ZEDP plan period.
7. Develop and implement strategies for collaboration with TVET stakeholders.
8. Develop demand driven TVET programmes reflecting demands from key growth sectors in Zanzibar and/or sectors with comparative advantage but unrealised potential by among others implementation of formal labour market surveys and outcome of PPP activities.
9. Establish national database for skills requirement in TVET and train instructors through CBET.

107
Component Objectives Outputs 2008/09 – 2015/16 Activities 2008/09 – 2015/16
8. HIGHER EDUCATION
Expanded access at an average of 20% in total for the ZEDP period
Increased enrolment of female students and students with special needs in Tertiary and Higher Education by 20 %
Improved quality and relevance of tertiary and higher education
Increased percentage of lectures given by staff employed at Universities – reduced use of external, part-time lecturers. Reduced average unit costs per graduated student by 15%.
1. Construction of new campus for SUZA at Tunguu completed by end 2011. 2. Construction of the Teacher Training College in Pemba completed by end 2012. 3. Renovation plan completed by end 2009 4. Plan for student grant/loan system completed by end 2009 5. 20 awareness events conducted by end of 2009 6. Guidelines developed by end 2008 7. Program for increasing efficiency of service delivery developed by end 2009 8. A new ‘professional development’ incentive package developed by end 2009 9. Program to strengthen learning achievement and quality assurance developed by end 2009
10. Labour market assessment completed by end 2008
11. Organized meetings/forums created by mid 2009
12. Demand-driven curriculum developed 2010.
13. Strengthened research capacity of tertiary and higher learning institutions by 2011.
1. Plan and implement construction of the new campus of SUZA.
2. Plan and implement construction of the Benjamin Mkapa Teacher Training College in Pemba.
3. Develop and implement a Renovation plan for selected facilities and infrastructure in universities and colleges.
4. Develop plan to improve the functioning of the student grant/loan system to target those who are in most need.
5. Carry out awareness raising campaigns and introduce empowerment strategies, e.g. popularize science, mathematics and technology subjects amongst female students at lower levels and for students with special needs
6. Develop guidelines to ensure the construction of buildings that cater for students with special needs
7. Develop and implement a program for increasing efficiency of service delivery of universities and tertiary colleges
8. Review, re-design and implement a new ‘professional development’ incentive package to attract, recruit and retain high quality tutors
9. Review and improve the assessment of learning achievement and strengthen quality assurance systems. Develop Program to improve the assessment of learning achievement and strengthen quality assurance systems.
10. Carry out labour market review to identify needs for programs based on market demand
11. Promote linkages of tertiary and higher learning institution with employers through by regular joint venues/forums for exchange of information and decision making.
12. Re-design, promote and implement programmes and curricula in fields such as Fishery, Agriculture, Tourism, Engineering, Health sciences and Environmental studies on island ecology based on the findings from the needs assessment
13. Establish e-library and improve existing libraries

108
Component Objectives Outputs 2008/09 – 2015/16 Activities 2008/09 – 2015/16
9. NON-FORMAL, ALTERNATIVE AND ADULT EDUCATION
Improve access to quality education and training for the out-of-school children and youth and adults.
1. Situational analysis and needs assessment for subsector conducted by end 2008.
2. Non-formal, Alternative and Adult Education Policy Guidelines produced by end 2009
3. A revised, demand-driven Adult Education curriculum ready by end 2009
4. Common database for Non-formal, Alternative and Adult Education operational by end 2010
5. 10 fully furnished libraries established by end 2014
6. 20 librarians assistants recruited and trained by end 2014
7. 60 adult educators/trainers of trainers recruited and trained by 2015 (6 per district)
8. 100 Adult education and literacy radio & TV programmes broadcasted within 25 weeks by 2010
9. Two mobile library vans - one in Unguja and one in Pemba in operation by 2010
10. Alternative Education and Vocational Training Centre established by 2012.
1. Carry out a situational analysis to identify the strengths and weaknesses of the sub-sector as well as the needs assessment for literacy and alternative education
2. Develop non-formal, alternative and adult education policy guidelines
3. Develop a demand-driven curriculum for non-formal, alternative and adult education
4. Develop a common data base, as well as monitoring and evaluation tool for non-formal, alternative and adult education initiatives
5. Establish 10 fully furnished libraries in Zanzibar; one in each district to be attached to community centres.
6. Recruitment and training of librarian assistants
7.Recruitment and training of adult educators/trainers
8. Introduce an upgrading/in-service training of the existing literacy or adult education teachers.
9. Procure two mobile library vans; one for Unguja and another one for Pemba.
10. Construction of facilities for a new Alternative Education and Vocational Training Centre. .
10. GENDER Strengthen the MoEVT capacity to implement and monitor effectively programs that promote girls’ education and mainstream gender in education sector.
1. Gender focal point person, guidance and counsellors, teacher centre coordinators/advisors, REO & DEO, School Inspectors, Directors and statisticians, trained in promotion of girls’ education.
2. Procedure for coordination and working relationship with partners/stakeholders established 2009.
3. Policy, strategies and activities to eliminate gender violence developed by 2009.
1. Conduct a training programme in promotion of girls’ education for gender focal point person, advisors and counsellors, teacher centre coordinators/advisors, REO & DEO, School Inspectors, Directors and statisticians
2. Established a coordination procedure for collaborating with other stakeholders to promote gender equity in education (EP07) through meetings, workshops, conferences, etc..
3. Develop and implement effective policies, strategies and activities to eliminate gender based violence (MKUZA)

109
Component Objectives Outputs 2008/09 – 2015/16 Activities 2008/09 – 2015/16
11. SPECIAL NEEDS AND INCLUSIVE EDUCATION
Reduce illiteracy among children with special needs and other vulnerable and marginalised groups by increasing their access to quality education.
1. Inclusive education policy guidelines in place by end 2009
2. Inclusive Education Unit (IE)’s capacity strengthened by end 2009
3. Survey and assessment of children with disabilities and other special needs completed by end 2009.
4. Teaching and learning materials, as well as other devices and equipment for children with special needs procured and distributed.
1. Develop inclusive education policy guidelines.
2. Increase MoEVT efficiency and effectiveness in dealing with Special Needs Education
3. Carry out a comprehensive survey and assessment for children with disabilities and other special needs in whole Zanzibar.
4. Procure and distribute teaching and learning materials, as well as other devices and equipment for children with special needs.
12. SCHOOL HEALTH, NUTRITION AND HIV/AIDS
Contain the spread of HIV/AIDS and improve health education and nutrition services in schools.
1. HIV/AIDS policy guidelines developed by mid 2010
2. Awareness campaigns on HIV/AIDS, school health and nutrition implemented for all schools and communities by 2012.
3. School Health Education, Safety and nutrition services provided for all pre-primary and primary schools starting from January 2009.
4. Monitoring and evaluation system for HIV/AIDS, school health and nutrition established by May 2009.
1. Develop HIV and AIDS policy guidelines
2. Implement increased number of and improved awareness campaigns on HIV/AIDS, school health and nutrition in schools and their respective communities. Develop and mainstream a new syllabus on life skills, Care/Support and HIV & AIDS for pre-primary, Primary, Secondary and Teacher Education including development of guidelines and training of teachers. 3. Conduct a baseline survey to determine the current status of basic health and nutrition in all pre-primary and primary schools. Implement Community advocacy/sensitization on screening of basic health, nutrition and school feeding and conduct screening of basic health in all pre-primary and primary schools.
4. Develop a Monitoring and Evaluation system including system for annual survey based assessments at school level.
13. INFORMATION AND COMMUNICATION TECHNOLOGY - ICT
Adopt and utilize ICT to improve access, quality and equity in the delivery of education services in Zanzibar.
1. 2000 Education managers trained and provided ICT equipment by 2013
2. 20 teachers with ICT experience trained, 20 Trainers trained, 500 teachers trained in basic ICT skills and 2000 teachers trained in Multimedia Content by 2013. 3. Relevant institutions accredited by 2010.
4. Guidelines for ICT established by 2009.
1. Provide education managers with access to ICT tools and develop their competence in using these tools to enable them to better deliver education services.
2. Training of Trainers and teachers to facilitate the use of ICT in education and ICT education at every level of education.
3. Regulate accreditation of institutions offering examinations and certification of ICT learning programs in all relevant institutions.
4. Develop guidelines for ICT equipment to educational institutions (primary schools, secondary schools, tertiary institutions)

110
ANNEX II: ZEDP PROGRAMME BUDGET AND FINANCING PLAN Table 1: Pre-Primary Recurrent and Development Costs
2006/07 2007/08 2008/09 2009/10 2010/11 2011/12 2012/13 2013/14 2014/15 2015/16 All numbers in 1000 Tsh
Recurrent expenditure School level Teacher salaries 534,037 630,163 791,089 1,048,302 1,308,880 1,566,551 1,316,566 1,484,176 1,649,530 1,760,480 Non-teacher salaries 23,274 27,464 36,058 48,874 69,138 92,110 117,593 117,593 126,706 150,186 Learning materials 3,920 5,010 6,604 9,080 11,746 14,549 12,639 14,712 16,867 19,104
Maintenance costs 4,470 4,470 5,869 7,955 11,253 14,992 19,140 19,140 20,623 24,444 Sub Total 565,701 667,107 839,619 1,114,211 1,401,018 1,688,202 1,465,938 1,635,621 1,813,726 1,954,214 National and district level Related to pre-primary 0 0 0 0 0 0 0 0 0 0 Other 0 0 0 0 0 0 0 0 0 0 Sub-total 0 0 0 0 0 0 0 0 0 0 TOTAL Recurrent Expenditure 565,701 667,107 839,619 1,114,211 1,401,018 1,688,202 1,465,938 1,635,621 1,813,726 1,954,214 All numbers in 1000 Tsh
Investment and Dev. Expenditure Construction new classrooms 350,919 523,345 827,436 937,994 1,040,565 - 372,100 958,766 1,056,428 Upgrading existing schools - - - - - - - - - Contingencies 2% 7,018 10,467 16,549 18,760 20,811 - 7,442 19,175 21,129 ZEDP Programmes - 31,109 82,571 44,150 50,495 12,639 27,567 49,989 55,598 TOTAL Investment Expenditure 357,937 564,921 926,556 1,000,904 1,111,872 12,639 407,108 1,027,930 1,133,155

111
Table 2: Primary Recurrent and Development Costs
2006 2007/08 2008/09 2009/10 2010/11 2011/12 2012/13 2013/14 2014/15 2015/16 All numbers in 1000 Tsh
Recurrent expenditure School level Teacher salaries 11,353,441 11,149,525 11,096,735 10,856,819 10,586,447 10,848,754 10,672,883 10,499,378 10,382,960 Non-teacher salaries 524,803 524,803 534,192 568,733 575,908 590,873 591,177 594,803 594,803 Pupil Inputs 103,156 396,942 322,725 509,784 498,641 1,240,547 1,245,254 1,223,911 989,619 Teacher related 15,962 15,719 15,347 14,970 36,494 74,819 73,606 72,409 71,607 Demand side interventions 0 0 0 0 0 0 0 0 0 Maintenance costs 123,793 123,793 126,008 134,156 135,848 139,378 139,450 140,305 140,305 Sub-total 0 12,121,155 12,210,784 12,095,008 12,084,463 11,833,339 12,894,370 12,722,370 12,530,807 12,179,294 TOTAL Recurrent Expenditure 0 12,121,155 12,210,784 12,095,008 12,084,463 11,833,339 12,894,370 12,722,370 12,530,807 12,179,294 in 1000 Tsh
Investment and Dev. Expenditure Construction new schools 0 457,812 1,684,215 349,870 729,656 14,864 176,786 0 0 Upgrading existing schools 0 0 516,780 516,780 516,780 516,780 516,780 516,780 516,780 Equipment new schools 0 0 0 0 0 0 0 0 0 Contingencies 2% - 9,156 33,684 6,997 14,593 297 3,536 - -Sub-total 0 0 466,968 2,234,680 873,648 1,261,029 531,941 697,102 516,780 516,780 ZEDP Components 0 837,050 2,074,000 2,113,163 2,074,000 2,074,000 1,950,500 1,950,500 1,950,500 World Bank 0 2,264,586 2,264,586 0 0 0 0 0 0 Development Program 0 0 0 0 0 0 0 0 0Sub-total 0 0 3,101,636 4,338,586 2,113,163 2,074,000 2,074,000 1,950,500 1,950,500 1,950,500 TOTAL Development Expenditure 0 0 3,568,603 6,573,265 2,986,810 3,335,029 2,605,941 2,647,602 2,467,280 2,467,280

112
Table 3: Secondary Recurrent and Development Costs
2007/08 2008/09 2009/10 2010/11 2011/12 2012/13 2013/14 2014/15 2015/16
All numbers in 1000 Tsh
Recurrent expenditure
School level
Teacher salaries 4,696,845 4,834,301 5,049,832 5,128,728 5,269,682 5,336,059 5,410,636 5,410,636 7,280,643
Non-teacher salaries 214,488 214,488 214,528 215,333 271,883 271,883 292,684 309,674 440,562
Pupil Inputs 75,250 533,947 225,972 241,975 239,467 745,482 763,187 841,707 1,715,060
Teacher related 8,601 8,601 8,601 8,601 48,739 48,739 48,739 48,739 65,584
Demand side interventions 0 0 0 0 0 0 0 0 0
Maintenance costs 80,562 80,562 80,577 80,880 102,120 102,120 109,933 116,314 165,476
Sub-total 5,075,746 5,671,899 5,579,510 5,675,516 5,931,890 6,504,282 6,625,178 6,727,070 9,667,325
World Bank Project
Teacher training 0 0 0 0 0 0 0 0 0
Textbooks 0 0 0 0 0 0 0 0 0
Sub-total 0 0 0 0 0 0 0 0 0
TOTAL Recurrent Expenditure 5,075,746 5,671,899 5,579,510 5,675,516 5,931,890 6,504,282 6,625,178 6,727,070 9,667,325
Investment and Dev. Expenditure
Construction new classrooms 0 13,314 264,611 0 0 6,836,172 2,958,073 7,333,161 7,112,735

113
2007/08 2008/09 2009/10 2010/11 2011/12 2012/13 2013/14 2014/15 2015/16
Upgrading existing schools 0 0 0 0 0 0 0 0 0
Equipment new secondary schools 0 0 0 0 0 0 0 0 0
Contingencies 2% 0 266 5,292 0 0 136,723 59,161 146,663 142,255
Sub-total 0 13,580 269,903 0 0 6,972,895 3,017,234 7,479,824 7,254,990
World Bank Project 0 16,560,302 16,560,302 16,560,302 0 0 0 0 0
ZEDP Programmes 0 1,297,853 2,468,642 2,488,760 3,475,222 3,256,500 2,809,629 2,796,230 3,196,654
Sub-total 0 17,858,156 19,028,944 19,049,063 3,475,222 3,256,500 2,809,629 2,796,230 3,196,654
TOTAL Development Expenditure 0 17,871,736 19,298,847 19,049,063 3,475,222 10,229,395 5,826,863 10,276,054 10,451,644

114
Table 4: Tertiary Recurrent and Development Costs
2007/08 2008/09 2009/10 2010/11 2011/12 2012/13 2013/14 2014/15 2015/16
All numbers in 1000 Tsh
Recurrent expenditure
Personnel costs 3,118,542 3,140,710 3,140,710 3,140,710 3,140,710 3,140,710 3,140,710 3,140,710 3,140,710
Training 31,170 32,000 32,000 32,000 32,000 32,000 32,000 32,000 32,000
Other operating costs 1,361,369 1,361,369 1,361,369 1,361,369 1,361,369 1,361,369 1,361,369 1,361,369 1,361,369
Other 0 0 0 0 0 0 0 0 0
Sub-total 4,511,081 4,534,079 4,534,079 4,534,079 4,534,079 4,534,079 4,534,079 4,534,079 4,534,079
Other
Related to tertiary 0 0 0 0 0 0 0 0 0
Other 0 0 0 0 0 0 0 0 0
Sub-total 0 0 0 0 0 0 0 0 0
TOTAL Recurrent Expenditure 4,511,081 4,534,079 4,534,079 4,534,079 4,534,079 4,534,079 4,534,079 4,534,079 4,534,079
Investment and Dev. Expenditure
Construction 0 1,372,500 1,372,500 0 0 0 0 0 0
Upgrading 0 0 0 0 0 0 0 0 0
Other construction 0% 0 0 0 0 0 0 0 0 0
Sub-total 0 1,372,500 1,372,500 0 0 0 0 0 0

115
2007/08 2008/09 2009/10 2010/11 2011/12 2012/13 2013/14 2014/15 2015/16
ZEDP Component 8 0 90,923 112,928 0 19,175 0 0 0 0
World Bank 0 573,038 859,557 859,557 573,038 0 0 0 0
Development Program 3 0 0 0 0 0 0 0 0 0
Development Program 4 0 0 0 0 0 0 0 0 0
Sub-total 0 663,960 972,484 859,557 592,213 0 0 0 0
TOTAL Development Expenditure 0 2,036,460 2,344,984 859,557 592,213 0 0 0 0

116
Table 5: Vocational and Teacher Training Recurrent and Development Costs
2006/07 2007/08 2008/09 2009/10 2010/11 2011/12 2012/13 2013/14 2014/15 2015/16
All numbers in 1000 Tsh
Recurrent expenditure
Vocational
Salaries 41,705 49,212 49,212 49,212 49,212 49,212 49,212 49,212 49,212
Other operating 47,638 47,638 47,638 47,638 47,638 47,638 47,638 47,638 47,638
Other 0 0 0 0 0 0 0 0 0
Sub-total 0 89,343 96,850 96,850 96,850 96,850 96,850 96,850 96,850 96,850
Teacher
Salaries 319,497 377,006 384,547 392,238 400,082 408,084 416,246 424,571 433,062
Other operating 24,637 24,637 24,637 29,564 32,521 35,773 39,350 43,285 47,614
Interventions 0 0 0 0 0 0 0 0 0
Sub-total 0 344,134 401,643 409,184 421,802 432,603 443,857 455,596 467,856 480,676
TOTAL Recurrent Expenditure 0 433,477 498,493 506,033 518,652 529,453 540,707 552,446 564,706 577,526
000 Tsh
Investment and Dev. Expenditure
Vocational Investment 0 1,372,500 1,372,500 0 0 0 0 0 0
Upgrading 0 0 0 0 0 0 0 0 0
Other construction % 0 0 0 0 0 0 0 0 0

117
2006/07 2007/08 2008/09 2009/10 2010/11 2011/12 2012/13 2013/14 2014/15 2015/16
Sub-total 0 0 1,372,500 1,372,500 0 0 0 0 0 0
ZEDP Teacher, Comp 2 0 2,725,529 2,773,276 3,048,097 351,115 512,284 61,401 62,029 62,720
ZEDP Teacher, Comp 3 0 23,675 12,513 0 12,513 0 0 0 0
World Bank Project teacher 0 761,646 761,646 761,646 761,646 0 0 0 0
ZEDP Vocational 0 216,667 216,667 216,667 0 43,680 1,375,000 1,375,000 1,375,000
Development Program 4 0 0 0 0 0 0 0 0 0
Sub-total 0 0 3,727,517 3,764,102 4,026,410 1,125,274 555,964 1,436,401 1,437,029 1,437,720
TOTAL Development Expenditure 0 5,100,017 5,136,602 4,026,410 1,125,274 555,964 1,436,401 1,437,029 1,437,720

118
Table 6: Non-Formal and Adult Education, Recurrent and Development Costs
2006/07 2007/08 2008/09 2009/10 2010/11 2011/12 2012/13 2013/14 2014/15 2015/16
All numbers in 1000 Tsh
Recurrent expenditure
School level
Salaries 276,462 277,886 277,886 277,886 277,886 277,886 277,886 277,886 277,886
Other costs 35,960 36,679 37,413 38,161 41,672 43,339 45,072 46,875 48,750
Interventions 0 0 0 0 0 0 0 0 0
Sub-total 0 312,422 314,566 315,299 316,047 319,558 321,225 322,959 324,762 326,637
TOTAL Recurrent Expenditure 0 312,422 314,566 315,299 316,047 319,558 321,225 322,959 324,762 326,637
Investment and Dev. Expenditure
Construction 0 0 0 0 0 0 0 0 0
Upgrading 0 0 0 0 0 0 0 0 0
Sub-total 0 0 0 0 0 0 0 0 0 0
ZEDP Programmes 0 35,018 167,661 455,000 0 37,900 100,900 0 0
Development Program 2 0 0 0 0 0 0 0 0 0
Development Program 3 0 0 0 0 0 0 0 0 0
Development Program 4 0 0 0 0 0 0 0 0 0
Sub-total 0 0 35,018 167,661 455,000 0 37,900 100,900 0 0
TOTAL Development Expenditure 0 35,018 167,661 455,000 0 37,900 100,900 0 0

119
Table 7: Administration, Recurrent and Development Costs
Summary
2006/07 2007/08 2008/09 2009/10 2010/11 2011/12 2012/13 2013/14 2014/15 2015/16
Salary
Allowances 3,878,142 3,916,924 3,956,093 3,995,654
4,035,610 4,075,966 4,116,726 4,157,893 4,199,472
Other Costs 1,032,342 1,042,665 1,053,092 1,063,623
1,074,259 1,085,002 1,095,852 1,106,810 1,117,878
Total Recurrent Expenditure
4,910,484 4,959,589 5,009,185 5,059,277 5,109,869 5,160,968 5,212,578 5,264,704 5,317,351
W orld Bank
- 583,036 583,036 583,036
583,036 583,036 - - -ZEDP
- 401,363 446,855 36,528
33,625 - - - -Total Development Costs
0 984,399 1,029,891 619,564 616,661 583,036 0 0 0

120
Table 8: Cross Cutting ZEDP Development Programmes
2 0 0 8 /0 9 2 0 0 9 /1 0 2 0 1 0 /1 1 2 0 1 1 /1 2 2 0 1 2 /1 3 2 0 1 3 /1 4 2 0 1 4 /1 5 2 0 1 5 /1 6 T s h / U S D R a te 1 ,3 0 0 G e n d e r T o ta l C o m po n e n ts U S D 0 1 7 ,6 92 1 7 ,6 92 1 7 ,6 92 1 7 ,6 92 1 7 ,6 92 1 7 ,6 92 1 7 ,6 92
T o ta l T S H 0 2 3 ,0 00 ,0 00 2 3 ,0 00 ,0 00 2 3 ,0 00 ,0 00 2 3 ,0 00 ,0 00 2 3 ,0 00 ,0 00 2 3 ,0 00 ,0 00 2 3 ,0 00 ,0 00 S p e c ia l N e e d s T o ta l C o m po n e n ts U S D 2 9 7 ,69 2 3 7 4 ,61 5 1 7 0 ,76 9 1 7 0 ,76 9 1 7 0 ,76 9 1 7 0 ,76 9 1 7 0 ,76 9 1 7 0 ,76 9
T o ta l T S H 3 8 7 ,00 0 ,00 04 8 7 ,00 0 ,00 02 2 2 ,00 0 ,00 02 2 2 ,00 0 ,00 0 2 2 2 ,00 0 ,00 02 2 2 ,00 0 ,00 02 2 2 ,00 0 ,00 02 2 2 ,00 0 ,00 0 H e a lth a n d N u tritio n T o ta l C o m po n e n ts U S D 2 9 6 ,66 5 5 0 ,9 00 7 ,9 0 0 7 ,9 0 0 0 0 0 0
T o ta l T S H 3 8 5 ,66 4 ,50 0 6 6 ,1 70 ,0 00 1 0 ,2 70 ,0 00 1 0 ,2 70 ,0 00 0 0 0 0 IC T T o ta l C o m po n e n ts U S D 1 4 ,7 50 5 3 7 ,00 0 3 2 0 ,00 0 7 5 ,0 00 7 5 ,0 00 7 5 ,0 00 7 5 ,0 00 7 5 ,0 00
T o ta l T S H 1 9 ,1 75 ,0 00 6 9 8 ,10 0 ,00 04 1 6 ,00 0 ,00 0 9 7 ,5 00 ,0 00 9 7 ,5 00 ,0 00 9 7 ,5 00 ,0 00 9 7 ,5 00 ,0 00 9 7 ,5 00 ,0 00 T o ta l C ro s s C u ttin g 0 0 0 T s h Z E D P G e n de r 0 2 3 ,0 00 2 3 ,0 00 2 3 ,0 00 2 3 ,0 00 2 3 ,0 00 2 3 ,0 00 2 3 ,0 00 S p ec ia l N e e ds 3 8 7 ,00 0 4 8 7 ,00 0 2 2 2 ,00 0 2 2 2 ,00 0 2 2 2 ,00 0 2 2 2 ,00 0 2 2 2 ,00 0 2 2 2 ,00 0 H e a lth an d N u trition 3 8 5 ,66 5 6 6 ,1 70 1 0 ,2 70 1 0 ,2 70 0 0 0 0 IC T 1 9 ,1 75 6 9 8 ,10 0 4 1 6 ,00 0 9 7 ,5 00 9 7 ,5 00 9 7 ,5 00 9 7 ,5 00 9 7 ,5 00T O T A L D e v e lo p m e n t E x p e n d itu re 7 9 1 ,84 0 1 ,2 7 4 ,2 7 0 6 7 1 ,27 0 3 5 2 ,77 0 3 4 2 ,50 0 3 4 2 ,50 0 3 4 2 ,50 0 3 4 2 ,50 0

121
Table 9: Summary Recurrent and Development Costs per Sub-Sector Recurrent Expenditure in mn Tsh 2007/08 2008/09 2009/10 2010/11 2011/12 2012/13 2013/14 2014/15 2015/16 Pre-Primary 667 840 1,114 1,401 1,688 1,466 1,636 1,814 1,954 Primary 12,121 12,211 12,095 12,084 11,833 12,894 12,722 12,531 12,179 Secondary 5,076 5,672 5,580 5,676 5,932 6,504 6,625 6,727 9,667 Tertiary 4,511 4,534 4,534 4,534 4,534 4,534 4,534 4,534 4,534 Vocational & Teacher 433 498 506 519 529 541 552 565 578 Non-Formal & Adult 312 315 315 316 320 321 323 325 327 Administration 4,910 4,960 5,009 5,059 5,110 5,161 5,213 5,265 5,317 Total Recurrent Costs 28,031 29,029 29,153 29,589 29,946 31,422 31,605 31,760 34,556 - of which personell costs 25,082 25,312 25,801 26,003 26,266 26,434 26,570 26,641 28,710
Development Cost
2007/08 2008/09 2009/10 2010/11 2011/12 2012/13 2013/14 2014/15 2015/16 Pre-Primary 358 565 927 1,001 1,112 13 407 1,028 1,133 Primary 0 3,569 6,573 2,987 3,335 2,606 2,648 2,467 2,467 Secondary 0 17,872 19,299 19,049 3,475 10,229 5,827 10,276 10,452 Tertiary 0 2,036 2,345 860 592 0 0 0 0 Vocational & Teacher Education 0 5,100 5,137 4,026 1,125 556 1,436 1,437 1,438 Non-Formal & Adult 0 35 168 455 0 38 101 0 0 Administration 0 984 1,030 620 617 583 0 0 0 Cross cutting 0 792 1,274 671 353 343 343 343 343 Unallocated 18 369 643 545 434 689 538 778 792 Total Development Costs 376 31,322 37,395 30,214 11,043 15,057 11,299 16,328 16,624

122
Table 10: Development Expenditure per ZEDP Component, Tsh and USD MN TSH 2008/09 2009/10 2010/11 2011/12 2012/13 2013/14 2014/15 2015/16 Total
Cp 1: Education Sector Management 984.40 1,029.89 619.56 616.66 583.04 0.00 0.00 0.00 3,833.55 Cp 2: Teacher Education 3,487.18 3,534.92 3,809.74 1,112.76 512.28 61.40 62.03 62.72 12,643.04 Cp 3: Teacher Recruitment 23.68 12.51 0.00 12.51 0.00 0.00 0.00 0.00 48.70 Cp 4: Pre Primary Education 564.92 926.56 1,000.90 1,111.87 12.64 407.11 1,027.93 1,133.15 6,185.08 Cp 5: Primary Education 3,568.60 6,573.27 2,986.81 3,335.03 2,605.94 2,647.60 2,467.28 2,467.28 26,651.81 Cp 6: Secondary Education 17,871.74 19,298.85 19,049.06 3,475.22 10,229.40 5,826.86 10,276.05 10,451.64 96,478.83 Cp 7: Vocational Training 1,589.17 1,589.17 216.67 0.00 43.68 1,375.00 1,375.00 1,375.00 7,563.68 Cp 8: Tertiary Education 2,036.46 2,344.98 859.56 592.21 0.00 0.00 0.00 0.00 5,833.21 Cp 9: Non Formal and Adult Education 35.02 167.66 455.00 0.00 37.90 100.90 0.00 0.00 796.48 Cp 10: Gender 0.00 23.00 23.00 23.00 23.00 23.00 23.00 23.00 161.00 Cp 11: Special Needs and Inclusive 387.00 487.00 222.00 222.00 222.00 222.00 222.00 222.00 2,206.00 Cp 12: Health, Nutrition and HIV/AIDS 385.66 66.17 10.27 10.27 0.00 0.00 0.00 0.00 472.37 Cp 13: ICT 19.18 698.10 416.00 97.50 97.50 97.50 97.50 97.50 1,620.78 Unallocated 368.72 643.25 545.20 433.61 689.22 538.07 777.54 791.61 4,787.22
Total 31,321.72 37,395.33 30,213.78 11,042.65 15,056.59 11,299.44 16,328.33 16,623.91 169,281.75
MN USD 2008/09 2009/10 2010/11 2011/12 2012/13 2013/14 2014/15 2015/16 Total
Cp 1: Education Sector Management 0.76 0.79 0.48 0.47 0.45 0.00 0.00 0.00 2.95 Cp 2: Teacher Education 2.68 2.72 2.93 0.86 0.39 0.05 0.05 0.05 9.73 Cp 3: Teacher Recruitment 0.02 0.01 0.00 0.01 0.00 0.00 0.00 0.00 0.04 Cp 4: Pre Primary Education 0.43 0.71 0.77 0.86 0.01 0.31 0.79 0.87 4.76 Cp 5: Primary Education 2.75 5.06 2.30 2.57 2.00 2.04 1.90 1.90 20.50 Cp 6: Secondary Education 13.75 14.85 14.65 2.67 7.87 4.48 7.90 8.04 74.21 Cp 7: Vocational Training 1.22 1.22 0.17 0.00 0.03 1.06 1.06 1.06 5.82 Cp 8: Tertiary Education 1.57 1.80 0.66 0.46 0.00 0.00 0.00 0.00 4.49 Cp 9: Non Formal and Adult Education 0.03 0.13 0.35 0.00 0.03 0.08 0.00 0.00 0.61 Cp 10: Gender 0.00 0.02 0.02 0.02 0.02 0.02 0.02 0.02 0.12 Cp 11: Special Needs and Inclusive 0.30 0.37 0.17 0.17 0.17 0.17 0.17 0.17 1.70 Cp 12: Health, Nutrition and HIV/AIDS 0.30 0.05 0.01 0.01 0.00 0.00 0.00 0.00 0.36 Cp 13: ICT 0.01 0.54 0.32 0.08 0.08 0.08 0.08 0.08 1.25
Unallocated 0.28 0.49 0.42 0.33 0.53 0.41 0.60 0.61 3.68
Total 24.09 28.77 23.24 8.49 11.58 8.69 12.56 12.79 130.22

123
Table 11: Committed Funding
Year 2007/08 2008/09 2009/10 2010/11 2011/12 2012/13 2013/14 2014/15 2015/16 Total
World Bank Project Costs
Recurrent Costs 0 0 0 0 0 0 0 0 0 0
Development Costs 0 20,833,531 21,142,055 18,764,542 1,936,895 583,036 0 0 0 63,260,059
Total 0 20,833,531 21,142,055 18,764,542 1,936,895 583,036 0 0 0 63,260,059
World Bank Funding Share Total
Recurrent Costs 0.0% 0 0 0 0 0 0 0 0 0 0
Development Costs 100.0% 0 20,833,531 21,142,055 18,764,542 1,936,895 583,036 0 0 0 63,260,059
Total 0 20,833,531 21,142,055 18,764,542 1,936,895 583,036 0 0 0 63,260,059
Tsh Tsh/USD USD 48,662
Total Project Cost 63,260,059 1,300 48,662
Total Project WB Financing 42,000
Difference is VAT that Zanzibar will exempt. This in effect adds the sameamount as “extra” funding as the costs have been calculated inclusive ofVAT.
BADEA FUNDING
000 Tsh
SUZA Investment Cost 0 1,372,500 1,372,500 0 0 0 0 0 0 2,745,000
BADEA Funding 94.7% 0 1,300,000 1,300,000 0 0 0 0 0 0 2,600,000
ADB
000 Tsh
Voc. Training Centre Cost 1,372,500 1,372,500 0 0 0 0 0 0 2,745,000
ADB Funding 78.1% 1,072,500 1,072,500 0 0 0 0 0 0 2,145,000
Total External Funding 23,206,031 23,514,555 18,764,542 1,936,895 583,036 0 0 0 68,005,059

124
ANNEX III: ZEDP - PROPOSED MOU Draft Memorandum of Understanding
This Memorandum of Understanding is among:
<donor>;
<donor>;
<donor>;
<donor>;
.....
collectively referred to as (the "Donors")
and
The Revolutionary Government of Zanzibar, hereinafter referred to as ("RGoZ")
1. WHEREAS RGoZ has requested the support of the Donors to contribute
towards the funding of the Education sector described in the Zanzibar Education Sector Development Program Document, dated ... 2008 (hereinafter referred to as "ZEDP"). RGoZ and the Donors together are hereinafter referred to as "the Signatories";
2. WHEREAS RGoZ has committed itself to provide an agreed level of funding, in March/April meeting of every year, to the ZEDP and intends to contract from Donors, credits and/or grants in an approximate amount equivalent to .............. million United States dollars (US$.....) to assist in financing part of the ZEDP on the terms and conditions set forth in an agreement to be entered into between RGoZ and each of the Donors;
3. WHEREAS the Donors have committed themselves to the principles of harmonisation as reflected in this Memorandum of Understanding (hereinafter referred to as the "MoU") and strive to reach the highest degree of alignment with the budgetary and accountability system and legislation of Zanzibar so as to enhance effective implementation and to reduce the administrative burden of RGoZ;
4. WHEREAS respect for human rights, democratic principles, the rule of law and good
governance, form the basis of the co-operation and constitute essential elements of this
MoU; 5. NOW THEREFORE, the Signatories to this MoU have come to the following
understanding:
I. Goals of the ZEDP and Scope of the MoU 6. This MoU will apply to all activities budgeted and accounted for in Zanzibar under all
budget heads of the Ministry of Education and Vocational Training (MoEVT) including recurrent and development expenditures with the exception of budget head 23-05 for recurrent expenditures under the Department of Archives, Museums and Antiquities as well as Development Expenditure associated to the same. In the context of this MoU the above budget heads will comprise the Education sector for financial reporting purposes.

125
7. The overall objective of the ZEDP as reflected in the Education Sector Policy of the RGoZ are to provide equitable access and quality education for all and promotion of life long learning.
8. This MoU sets forth the joint provisions and procedures for financial support to the ZEDP and serves as a co-ordination framework for consultation between the Signatories, for ZEDP monitoring and decision-making, joint reviews of performance, common procedures on disbursement for those Donors that fully align there support to the Public Financial Management System of RGoZ, reporting and audits.
9. The financial commitments of the Donors will be confirmed within the bilateral agreements concluded between RGoZ and each of the Donors.
10. The Donors will establish bilateral agreements that are compatible with the spirit and provisions of this MoU and will refrain, as far as possible, from setting conditions in the bilateral agreements that contradict or diverge from the spirit of this MoU. In case of any inconsistency or contradiction between the provisions and conditions of this MoU and any of the bilateral agreements, the provisions of the bilateral agreements will prevail. Insofar specific agreements on specific items made in bilateral agreements should deviate from the MoU, the Donor concerned will inform the other Donors thereof by supplying a copy of the bilateral agreement to the other Donors and specify the deviations and how to resolve them in case of inconsistency with this MoU.
11. The Donors will base their actual support on the progress attained in the implementation of the ZEDP. Progress will be measured through the common procedures for monitoring and reporting as described in paragraphs IX and X.
II. Representation 12. In matters pertaining to the implementation of this MoU, the RGoZ will be
represented by the Ministry of Finance and Economic Affairs ("MoFEA"). The responsibility for the implementation of the ZEDP not affecting the overall responsibilities of RGoZ or the MoFEA will lie with the Ministry of Education and Vocational Training ("MoEVT").
13. In matters pertaining to the implementation of the MoU, the representative of each Donor will be regulated in their respective bilateral agreements.
III. Responsibilities of RGoZ 14. The RGoZ will make all reasonable efforts to facilitate the successful implementation
of the ZEDP, and will hereunder: a. have the overall responsibility for the planning, administration, financial
management and implementation of the ZEDP; b. for the donors who will align their support to the Public Financial Management
system of RGoZ, establish a foreign exchange account in United States Dollar with Bank of Tanzania ("BoT") to which the Donors will disburse resources and from which funds will be released to be utilised exclusively for the ZEDP;
c. ensure that accounts for the ZEDP are kept in accordance with procedures set forth in Public Finance Act and its regulations ("FR") of RGoZ.
d. maintain a financial management system adequate to reflect the transactions, resources, expenditures and assets under the ZEDP. The financial management system will ensure that the RGoZ is able to produce timely, relevant and reliable financial information for planning and implementation of the ZEDP, and monitoring of progress toward its objectives that will also allow the Donors to evaluate compliance with agreed procedures;

126
e. provide sufficient qualified personnel and do their utmost to release all
financial and other resources that is required over and above the funding from the Donors for the successful implementation of the ZEDP; and
f. promptly inform the Donors of any condition which interferes or threatens to interfere with the successful implementation of the ZEDP and will call for a meeting to consult with the Donors on remedial actions to be taken.
15. The RGoZ will convene and make adequate arrangements and documentation as stated herein for joint consultations.
16. The Donors do not bear any responsibility and/or liability to any third party with regard to the implementation of the ZEDP.
IV. Responsibilities of the Donors 17. For donors aligning their support in accordance with Section III, Para 14b) they will
make available to Zanzibar funds through a foreign exchange account in the name of the MoFEA in the Bank of Tanzania (BoT) to be used exclusively to finance the ZEDP.
18. On an annual basis, the Donors will review the Annual Work Plan and Budget ("AWPB") for the ZEDP and commit their contributions (ref. section 30).
19. The Donors will ensure timely release of their commitments to the foreign exchange account in accordance with the provisions of paragraph VII below and the bilateral agreements.
V. Meeting Structure 20. The Donors and RGoZ will conduct semi-annual meetings (October/November and
March/April). 21. The meeting in October/November will review overall progress for the previous fiscal
year based on reports as mentioned in paragraph IX as well as section 24 (a) below. The Donors will make an initial indication of funding to be provided for the following fiscal year.
22. The meeting in March/April will review the AWPB for the next fiscal year, the audit report of the previous fiscal year, and the findings of a technical review mission.
23. The Donors, MoFEA, the Office of the Controller and Auditor General ("OCAG") and MoEVT will be represented at the meetings. MoEVT in cooperation with the Donors will be responsible for the agenda. MoEVT will call and chair the meetings. The outcome of the meetings will be presented in an aide memoire. The aide memoire will be drafted jointly by the Signatories.
24. The discussions and decisions in the semi-annual meetings will be based on, inter alia, the following documents, which will be submitted to the Donors in accordance with the deadlines set forth in paragraph IX and XI below but no later than two weeks ahead of the meeting: a. October/November meeting: annual financial statement (ref. section 49 (a)),
annual performance report (ref. section 51 (a)) and a consolidated monitoring report of the previous fiscal year (ref. section 51 (c)of the previous fiscal year, and a financial monitoring report for the first quarter of the current fiscal year; and
b. March/April meeting: the annual audit report of the ZEDP as certified by the OCAG, the AWPB for the next fiscal year, the financial report for the third quarter of the current fiscal year and a report from the technical review mission.

127
VI. Organizational Structure and Consultations 25. All the Donors will be represented in a Donor Working Group ("DWG"). The Donors
through the DWG will designate one of the Donors as a Focal Point for communication and information sharing with the RGoZ on matters concerning the implementation of this MoU. However, the Donor Focal Point will not have any authority to make decisions on behalf of the Donors.
26. The terms of reference ("ToR") for the Donors' Focal Point will be prepared by DWG and decided upon between the Donors, and a copy of the ToR will be shared with RGoZ and the Donors.
27. The selection of and any change of the role of the Donors' Focal Point will be communicated to the MoFEA and MoEVT in writing by the Donors' Focal Point.
28. The Signatories will co-operate and communicate fully and in a timely manner with each other on all matters relevant to the implementation of the ZEDP and this MoU. Signatories will share all information on financial flows, plans to carry out reviews, missions, and any other initiatives relating to the implementation of the ZEDP.
VII. Funding Arrangement 29. The Donors will provide indicative funding levels for the following fiscal year in the
semi-annual meeting in October/November. 30. The Donors will provide a funding commitment in the semi-annual meeting in
March/April. It will take into account the sector budget and cash flow needs for the implementation of the ZEDP.
31. The Signatories will in the light of these commitments determine the schedule of cash transfers from each source for funding of the ZEDP budget heads as described in section 6 of paragraph I above for the coming fiscal year.
32. The maximum level of disbursements from the Donors for any fiscal year will be limited to the total amount of the Donors commitments for that fiscal year.
33. The disbursements of the Donors to the foreign exchange account will be as follows: a. for the first disbursement of each fiscal year under the ZEDP, the Donors will
advance 50% of their annual commitment. Such advance will be effected within 30 days following the receipt of RGoZ’s request;
b. for every disbursement thereafter for the fiscal year, the Donors will replenish the Foreign Exchange Account (FE Account) once, based on the second quarterly Programme Monitoring Report (PMR) where funds utilized during the first two quarters, the cash balance position of the FE Account, and the cash forecast based on work program for the remaining fiscal year will have to be indicated;
c. the disbursement for the first two quarters of the second fiscal year and each fiscal year thereafter will be on the basis of the consolidated PMR for the total fiscal year; and
d. any outstanding advance may be liable for repayment or deduction against the advance for the following fiscal year.
34. The MoFEA is responsible for certifying and forwarding the relevant financial reports indicated in paragraph IX below, and submitting the request for disbursement in writing in accordance with the provisions of this MoU to the DWG Focal Point.
35. The DWG Focal Point in consultations with other Donors will have 10 days upon receipt of this request to review the attached reports (ref. paragraph IX) and clarify any outstanding issues with the MoFEA and MoEVT.
36. In the event of their being ‘no objection’, the Donors' Focal Point will advise the Donors to deposit commitment of the overall disbursement in the designated foreign

128
exchange account, which should take place no later than 30 days after the receipt of the MoFEA's request.
37. In the event of their being issues which are not possible to clarify within the 10 day period indicated in section 35 above, the above process will be suspended until outstanding issues are resolved. RGoZ and the Donors will make their best endeavours to resolve any such issues as quickly as possible.
38. Following confirmation from BoT, MoFEA will immediately acknowledge receipt of the foreign exchange funds, in writing, to the respective Donor and MoFEA.
39. The FE Account will be a non-interest bearing account. If any fees and commissions are to be charged by the BoT for the operation of the account it is to be decided annually by the Signatories.
40. The exchange rate at which funds from the foreign exchange account will be converted into Tanzanian Shillings (TSh) will be the official buying rate of the BoT on the date of conversion.
41. FE Account will be used only for the purpose of transferring the amount to RGoZ's consolidated fund following the certification of actual expenditures. There will be no direct expenditure on the procurement of imported goods and services from the foreign exchange account. The procurement of such items will take place in accordance with paragraph VIII below. Upon MoEVT requests, foreign exchange currency payments will be facilitated by RGoZ.
VIII. Procurement 42. RGoZ undertakes to effect all procurement of works, goods and services for the ZEDP
and is responsible for the contracts to be signed. 43. All procurements will be performed in accordance with generally accepted principles
and good procurement practices and in conformity with RGoZ's regular procedures and regulations as described in the FR of RGoZ and Public Procurement and Disposal of Public Assets Act No. 9 of 2005 unless otherwise provided for below.
44. For the semi-annual meeting in March/April of each year, MoEVT will provide the Donors for their review a draft annual procurement plan ("Procurement Plan"), which will include on-going contracts rolling into the following year, and detailed procurement plans for the following fiscal year prepared based on the agreed work program. The Procurement Plan shall only include activities to be financed under the ZEDP. Such plan will be approved in the March/April meeting.
45. During implementation of the Procurement Plan, MoEVT will provide the Donors with quaterly procurement monitoring reports concerning progress in implementation of the Procurement Plan and identifying any contracts that were not included in the previous Procurement Plan.
46. With respect to each procurement MoEVT shall also provide information to the Donors concerning awarded of contracts, appointment of consultants, and any material modifications to the terms and conditions of such contracts after their award.
47. RGoZ will, upon request, furnish the Donors with all relevant information on its procurement practices and actions taken, and provide access to all related records and documents.
IX. Reporting 48. The following set of physical and financial progress reports will be produced by
MoFEA and submitted to the DWG Focal Point on a quarterly basis: within 2 weeks of the end of each quarter: a. a report for each quarter and the year to date on transfers to and countervalue
conversions from the foreign exchange account (reference AnnexII);

129
b. a consolidated financial report for allocation and expenditures from the MoFEA for the budget heads described in section 6 of paragraph I above, comparing actual and budgeted figures by budget line item code for the quarter and cumulatively for the fiscal year to date; and
c. a consolidated progress report by ZEDP components showing details of outputs produced compared to planned outputs and details of actual expenditures by component compared to approved budget for the quarter and cumulatively for the fiscal year to date (ref. para 51 (a) below).
49. The following financial reports will be produced by MoEVT and submitted to the Donors on an annual basis: a. The unaudited annual financial statement for the budget heads referred to in
section 6 of paragraph I above certified by the MoFEA by 31 August of the following fiscal year.
50. The financial reporting will be conducted in accordance with international standards, consistently applied and should compare costs for actual activities for the current reporting period with the budget for the same period, and in the same currency.
51. The following performance reports will be produced by MoEVT and submitted to the DWG Focal Point, who will forward to the Donors, on an annual basis: a. a performance report for the fiscal year relating to all sector expenditure and
outputs by component listed in Annex 4 by 31 August of the following year; b. an annual progress report on education sector outcomes for the fiscal year
against ZEDP overall education sector targets, as presented in Annex 5 by 31 August of the following fiscal year.
X. Monitoring 52. As part of the preparation for the semi-annual meeting in March/April, the Signatories
will jointly conduct an external technical review in February/March of past performance and future financial needs. The ToR for the technical review will be drawn up and consultants identified by the Signatories. The costs of the technical review will be charged to the ZEDP.
53. The Signatories will jointly conduct a mid-term review after two years of ZEDP
implementation. The MoEVT will elaborate the ToRs of the review to be discussed at a semi-annual meeting. The MoEVT will jointly with the Donors' focal point coordinate and manage the review process including the contracting of any external technical assistance for the review. The cost of the review will be charged to the ZEDP.
54. The Donors will jointly conduct an evaluation of the ZEDP after ZEDP completion. The DWG will prepare a ToR for the evaluation to be discussed at the last semi-annual meeting of the ZEDP. The Donors' focal point will coordinate and manage the evaluation process. The cost of the evaluation will be charged to the Donors.
55. The Donors will to the extent possible refrain from initiating unilateral reviews/evaluations of the ZEDP. However, in case a Donor is required to conduct a review/evaluation this Donor will in a timely manner consult with the other Signatories.
XII. Audit 56. With respect to the ZEDP, RGoZ will submit to the Donors an annual audit report of
the budget heads referred to in section 6 for each fiscal year as so audited by the OCAG, no later than 31 January of the following fiscal year. Such audit shall be carried out in accordance with auditing standards and under terms of reference agreed

130
between OCAG and the Donors. OCAG will submit the audit report of the ZEDP with detailed observations as reported in the Auditor General’s Annual Report. The Audit report will also include the audit of the FE Account and the related local currency account.
57. The Signatories may request a performance related audit to be carried out by the OCAG, or at his/her discretion, with the support of appropriately qualified auditors contracted under his/her authority. RGoZ will provide adequate resources for such a purpose. The selection of the auditors and timing for such audit will be done in close collaboration with the Donors. The Signatories will jointly agree on the ToR. Based on the outcome of such audit the Signatories will agree on any needed corrective measures to be undertaken.
58. The Donors reserve the right to conduct special audits and inspections in addition to the regular annual audits. The Donors will to the extent possible refrain from initiating unilateral audits of the ZEDP. However, in case a Donor is required to conduct an audit this Donor will timely consult with the other Signatories. RGoZ will offer all reasonable support to facilitate such audits/inspections. The cost of this audit/inspection will be covered by the Donor(s) through separate arrangements.
XII. Non-Compliance 59. In case of non-compliance with the provisions of this MoU and/or violation of the
essential elements mentioned in this MoU, the Donors reserve the right to suspend further disbursements to the ZEDP and/or to reclaim all or part of the funds already transferred. Such non-compliance includes inter alia that: a. substantial deviations from agreed plans and budgets occur is declared; b. ZEDP implementation does not comply with the conditions of this MoU; c. the ZEDP develops unfavourably in relation to the objectives of the ZEDP; and d. the suspension is warranted by a fundamental change in circumstances
compared to those which existed at the start of the ZEDP . 60. The Suspension shall cease as soon as the event(s) which gave rise to suspension have
ceased to exist. 61. If a Donor has the intention to suspend new disbursements, reclaim funds or terminate
its support, the Donor will call for a meeting with the other Signatories in order to seek a solution in the matter and the Signatories will seek to reach a joint position on the remedial measures required.
XIII. Corruption 62. The RGoZ will promptly inform the Donors in case of any incidence of accidental or
deliberate misuse of funds or corruption as investigated by responsible anti-corruption bodies of RGoZ.
XIV. Modification, Donor Accession, Withdrawal 63. Any modification or amendment of/to the provisions of this MoU will only be
effective if decided in writing by all Signatories. 64. The Signatories welcome the accession to this MoU by other donors who wish to
support the ZEDP. 65. Upon a new donor's written request and written acceptance of the provisions and
conditions of this MoU, the RGoZ may authorise in writing as an annex to this MoU, a donor to become a Signatory. The RGoZ will inform the other Donors in advance of possible donor accession and subsequently furnish them with a copy of the letter of acceptance.
66. In case a Donor intends to withdraw/terminate its support, the Donor will call for a

131
meeting to inform the other Signatories on its decision and to consult on the consequences for the ZEDP. Each Donor reserves the right to withdraw/terminate its support to the ZEDP by giving the other Signatories three months written notice.
XV. Dispute Settlement 67. If any dispute arises between the Signatories as to the interpretation, application or
performance of this MoU, the Signatories will consult with each other in order to reach an amicable solution.
XVI. Come into effect 68. This MoU comes into effect on the date of signature by RGoZ and the individual
Pooling Donor and will remain in effect until all obligations under this MoU have been completed.
REVOLUTIONARY GOVERNMENT OF ZANZIBAR
By________________________________
Authorized Representative
MINSITRY/AGENCY OF DONOR
By_____________________________________
Authorized Representative
MINSITRY/AGENCY OF DONOR
By_____________________________________
MINSITRY/AGENCY OF DONOR
By_____________________________________

132
ANNEX 1. Zanzibar – ZEDP Schedule of Monitoring and Reporting37
Month RGoZ input Donor Input Dialogue and expected output
April
AWPB,
Annual Procurement Plan,
Cash Forecast for the Fiscal Year.
Annual Review meeting: Input: Reports. Output: Aid Memoire with agreed donor share of budget and proposed schedule of donor disbursements.
July MoFEA request for advance donor disbursement.
50% of donor commitment for the fiscal year to be disbursed by each donor to the FOREX account within agreed date.
October PMR1
RGoZ - donor consultations: Input: Reports Output: Aid Memoire with donor pledges for next fiscal year.
Terms of Reference for External Technical review
January PMR2 MoFEA request for donor replenishment
Second disbursement by donors to the FOREX account within agreed date according to revised cash forecast consolidated with previous advances and actual expenditure.
March External Technical Review of performance.
37 For first two years of the program

133
Month RGoZ input Donor Input Dialogue and expected output
April
PMR3,
AWPBP,
Annual Procurement Plan, Technical Review Report
Annual Review meeting: Input: Reports. Output: Aid Memoire with agreed donor share of budget and proposed schedule of donor disbursements.
July PMR4
MoFEA request for advance donor disbursement.
50% of donor commitment for the fiscal year to be disbursed by each donor to the FOREX account within agreed date.
October
PMR1
Annual Consolidated Financial Report,
Annual Consolidated Output Based Report.
Annual report on education sector outcomes previous year.
RGoZ - donor consultations: Input: Reports Output: Aid Memoire with donor pledges for next fiscal year.
January
PMR2
MoFEA request for donor replenishment OAG Audit report
Second disbursement by donors to the FOREX account within agreed date according to revised cash forecast consolidated with previous advances and actual expenditure.
March External Technical Review of performance.

134
Month RGoZ input Donor Input Dialogue and expected output
April
PMR3,
AWPBP,
Annual Procurement Plan,
Technical Review Report
Annual Review meeting: Input: Reports. Output: Aid Memoire with agreed donor share of budget and proposed schedule of donor disbursements.
PMR 1-4 = Quarterly Programme Monitoring Reports (ref. Section 48 of Memorandum of Understanding). It will include Progress Reports related to outputs according to ZEDP.
AWPB = Annual Workplan and Budget.
Annual report on education sector outcomes previous year = will include progress in achieving education sector target as specified in ZEDP based on information from EMIS, annual technical reviews and surveys on education sector outcomes. .

135
Annex2. Statement of funds flow through Foreign Exchange Account covering [date] to [date]
Amount in USD Exchange Rate Amount TSh
1 Balance of Advance not expended
(from previous year & due for refund)
2 Receipt of Funds
Sida
……….
Total Cash Received
3 Less:
Counter-value credit to MoFEA countervalue account for ZEDP
Commissions/fees by NRB
4 Closing Balance
5 Opening Balance Countervalue Account
6 Receipt of Funds: Counter-value debited from FOREX account for ZEDP
7 Less: Transfers to MoFEA revenue account for ZEDP
8 Closing Balance Countervalue Account

136
Annex 3. Semi-annual/Quarterly financial report
MoFEA
Budget Performance Report
Fiscal Year --/-- For month up to
Ministry/Budget Head Budget in mill. TSh
Release in mill. TSh %
XX-X-XXX
Sub-Total
XX-X-XXX
.....
Sub-Total
XX-X-XXX
.....
Total
Date prepared:____________ Certified by: ____________

137
ANNEX 4. ZEDP - Output based Progress Report Output based progress report for fiscal year [ ] from [date] to [date] (all figures in TSh)
Financial Progress Physical Progress
Program Output by component Planned Budget for the Fiscal Year
Expenses during Reporting Period
Cumulative Expenses for the Fiscal Year
% of Total Expenditure vs Planned Total Cost
Output /Target Actual Progress
1 Education Sector Management
1.1
1,2
1.3
Total
Prepared by:____________________ Approved by:________________

138
ANNEX 5. ZEDP – annual Progress Report on education sector outcomes Outcome based progress report for fiscal year [ ] from [date] to [date]
Indicator Program Target Fiscal year target Actual end of fiscal year Comments
1 Primary
1.1 GER
1,2 NER
1.3 Pupil/teacher ratio
.. ....
Total
Prepared by:____________________ Approved by:________________

139
ANNEX IV – KEY ASSUMPTION FOR SECTOR AND BUDGET PROJECTIONS Table 1: Updated Population Projections
M ale A ge 2002 2003 2004 2005 2006 2007 2008 2009 2010 2011 2012 2013 2014 2015
3 15,598 15 ,470 15,027 14 ,042 14 ,422 14,784 15 ,141 15,499 15,861 16 ,228 16 ,597 16 ,967 17 ,337 17,704 4 15,418 15 ,491 15,363 14 ,923 13 ,945 14,323 14 ,682 15,037 15,392 15 ,752 16 ,116 16 ,482 16 ,850 17,217 5 15,176 15 ,232 15,304 15 ,178 14 ,743 13,777 14 ,150 14,505 14,855 15 ,207 15 ,562 15 ,922 16 ,283 16,646 6 14,919 15 ,134 15,191 15 ,262 15 ,137 14,703 13 ,739 14,111 14,465 14 ,815 15 ,165 15 ,520 15 ,878 16,239 7 14,692 14 ,879 15,093 15 ,149 15 ,220 15,095 14 ,663 13,701 14,073 14 ,425 14 ,774 15 ,124 15 ,477 15,835 8 14,522 14 ,651 14,838 15 ,051 15 ,108 15,179 15 ,054 14,623 13,664 14 ,034 14 ,386 14 ,734 15 ,082 15,435 9 14,403 14 ,482 14,611 14 ,797 15 ,010 15,067 15 ,137 15,013 14,583 13 ,627 13 ,996 14 ,347 14 ,694 15,041
10 14,287 14 ,363 14,443 14 ,571 14 ,757 14,969 15 ,025 15,096 14,972 14 ,543 13 ,589 13 ,958 14 ,307 14,653 11 14,092 14 ,249 14,325 14 ,404 14 ,533 14,718 14 ,929 14,985 15,056 14 ,932 14 ,504 13 ,553 13 ,921 14,269 12 13,723 14 ,055 14,210 14 ,287 14 ,366 14,494 14 ,678 14,890 14,945 15 ,015 14 ,892 14 ,465 13 ,517 13,883 13 13,124 13 ,686 14,017 14 ,173 14 ,249 14,327 14 ,455 14,639 14,850 14 ,905 14 ,975 14 ,852 14 ,427 13,481 14 12,364 13 ,089 13,650 13 ,980 14 ,135 14,211 14 ,289 14,417 14,600 14 ,810 14 ,866 14 ,935 14 ,813 14,388 15 11,542 12 ,331 13,054 13 ,613 13 ,942 14,097 14 ,173 14,251 14,378 14 ,561 14 ,771 14 ,826 14 ,896 14,773 16 10,776 11 ,496 12,281 13 ,001 13 ,558 13,886 14 ,040 14,116 14,194 14 ,320 14 ,503 14 ,711 14 ,766 14,836 17 10,117 10 ,733 11,449 12 ,232 12 ,949 13,504 13 ,830 13,984 14,059 14 ,137 14 ,263 14 ,444 14 ,652 14,707
Fem ale A ge 2002 2003 2004 2005 2006 2007 2008 2009 2010 2011 2012 2013 2014 2015
3 15,368 15 ,176 14,723 13 ,807 13 ,843 14,190 14 ,533 14,877 15,224 15 ,576 15 ,930 16 ,285 16 ,640 16,993 4 15,282 15 ,256 15,064 14 ,616 13 ,706 13,742 14 ,086 14,427 14,768 15 ,113 15 ,462 15 ,813 16 ,166 16,519 5 15,134 15 ,092 15,066 14 ,877 14 ,434 13,536 13 ,571 13,911 14,247 14 ,584 14 ,925 15 ,270 15 ,617 15,965 6 14,941 15 ,090 15,048 15 ,022 14 ,834 14,392 13 ,497 13,531 13,870 14 ,206 14 ,542 14 ,882 15 ,225 15,571 7 14,721 14 ,897 15,046 15 ,005 14 ,978 14,791 14 ,350 13,457 13,492 13 ,830 14 ,164 14 ,499 14 ,838 15,181 8 14,487 14 ,678 14,854 15 ,002 14 ,961 14,935 14 ,748 14,308 13,418 13 ,453 13 ,790 14 ,123 14 ,457 14,795 9 14,243 14 ,445 14,635 14 ,811 14 ,958 14,918 14 ,891 14,705 14,267 13 ,379 13 ,414 13 ,750 14 ,082 14,415
10 13,978 14 ,201 14,403 14 ,593 14 ,768 14,915 14 ,874 14,848 14,662 14 ,225 13 ,340 13 ,375 13 ,710 14,041 11 13,675 13 ,939 14,161 14 ,362 14 ,552 14,726 14 ,873 14,832 14,806 14 ,621 14 ,185 13 ,303 13 ,337 13,671 12 13,310 13 ,636 13,899 14 ,121 14 ,322 14,510 14 ,684 14,831 14,790 14 ,764 14 ,579 14 ,145 13 ,265 13,299 13 12,872 13 ,272 13,598 13 ,860 14 ,081 14,281 14 ,469 14,643 14,789 14 ,748 14 ,722 14 ,538 14 ,105 13,227 14 12,386 12 ,836 13,235 13 ,559 13 ,821 14,041 14 ,241 14,428 14,601 14 ,747 14 ,706 14 ,681 14 ,497 14,065 15 11,871 12 ,351 12,799 13 ,197 13 ,521 13,782 14 ,001 14,201 14,388 14 ,560 14 ,705 14 ,665 14 ,639 14,456 16 11,376 11 ,825 12,304 12 ,751 13 ,147 13,469 13 ,729 13,948 14,146 14 ,333 14 ,504 14 ,649 14 ,609 14,583 17 10,949 11 ,332 11,780 12 ,257 12 ,702 13,097 13 ,418 13,677 13,895 14 ,092 14 ,278 14 ,449 14 ,593 14,553

140
Table 2: Admission Assumptions
Agewise Enrolment Assumption Age 6 Age 7 Age 8 Age 9 Age 10 Total Born 1997 NA NA NA 21.4% 11.0% NA Born 1998 NA NA 45.6% 18.0% 11.0% NA Born 1999 NA 47.2% 27.0% 16.0% 6.0% NA Born 2000 4.2% 47.0% 28.0% 12.0% 2.0% 93.2% Born 2001 6.0% 55.0% 17.0% 12.0% 3.0% 93.0% Born 2002 8.0% 60.0% 15.0% 8.0% 3.0% 94.0% Born 2003 58.0% 21.0% 8.0% 5.0% 3.0% 95.0% Born 2004 62.0% 21.0% 7.0% 3.0% 2.0% 95.0% Born 2005 70.0% 15.0% 7.0% 3.0% 1.0% 96.0% Born 2006 80.0% 10.0% 5.0% 2.0% 0.0% 97.0% Born 2007 90.0% 5.0% 3.0% 0.0% 0.0% 98.0% Born 2008 95.0% 3.0% 1.0% 0.0% 0.0% 99.0% Born 2009 100.0% 0.0% 0.0% 0.0% 0.0% 100.0% Start school in 2007 Start school in 2010

141
Annual School Admission
AGE 2008/09 2009/10 2010/11 2011/12 2012/13 2013/14 2014/15 2015/16 Population Projection 6 year 27,236 27,642 28,335 29,021 29,707 30,402 31,103 31,810
School admission Start school at age 6 2,179 16,032 17,568 20,315 23,766 27,362 29,548 31,810 Start school at age 7 16,002 16,342 5,805 5,950 4,353 2,971 1,520 933 Start school at age 8 8,392 4,946 4,085 2,211 1,983 2,031 1,485 912 Start school at age 9 4,804 3,597 3,491 2,179 1,382 850 871 594
Start school at age 10 3,289 1,797 599 873 817 829 567 290 INTAKE 34,666 38,535 31,549 31,528 32,301 34,043 33,991 34,540

142
Table 3: Primary Promotion Rates
Primary Promotion Rates
2006/07 2007/08 2008/09 2009/10 2010/11 2011/12 2012/13 2013/14 2014/15 2015/16
Std 1 - Std 2 Promotion rate 92.9 93.6 94.3 95.0 95.7 96.5 96.5 96.5 96.5 96.5
Repetition rate 4.6 4.1 3.7 3.2 2.8 2.3 2.3 2.3 2.3 2.3
Drop out rate 2.5 2.3 2.0 1.8 1.5 1.25 1.25 1.25 1.25 1.25
Std 2 - Std 3 Promotion rate 94.8 95.3 95.8 96.4 96.9 97.4 97.4 97.4 97.4 97.4
Repetition rate 3.9 3.5 3.1 2.7 2.3 2.0 2.0 2.0 2.0 2.0
Drop out rate 1.3 1.2 1.0 0.9 0.8 0.7 0.7 0.7 0.7 0.7
Std 3 - Std 4 Promotion rate 95.7 96.1 96.6 97.0 97.42 97.9 97.9 97.9 97.9 97.9
Repetition rate 3.8 3.4 3.0 2.7 2.3 1.9 1.9 1.9 1.9 1.9
Drop out rate 0.5 0.5 0.4 0.4 0.3 0.3 0.3 0.3 0.3 0.3
Std 4 - Std 5 Promotion rate 94.7 95.2 95.8 96.3 96.8 97.4 97.4 97.4 97.4 97.4
Repetition rate 2.9 2.6 2.3 2.0 1.7 1.5 1.5 1.5 1.5 1.5
Drop out rate 2.4 2.2 1.9 1.7 1.4 1.2 1.2 1.2 1.2 1.2
Std 5 -Std 6 Promotion rate 95.8 96.2 96.5 96.9 97.2 97.9 97.9 97.9 97.9 97.9
Repetition rate 1.8 1.6 1.4 1.3 1.1 0.9 0.9 0.9 0.9 0.9
Drop out rate 2.4 2.2 2.0 1.9 1.7 1.2 1.2 1.2 1.2 1.2
Std 6 - Std 7 Promotion rate 91.7 91.8 92.1 92.6 93.1 93.6 93.8 94.0 94.2 95.0
Repetition rate 2.5 2.2 1.9 1.6 1.3 1.0 1.0 1.0 1.0 1.0
Drop out rate 5.8 6.0 6.0 5.8 5.6 5.4 5.2 5.0 4.8 4.0

143
Table 4: Secondary Promotion Rates
Form 1 - Form 2 Promotion rate 86.5 86.8 87.1 90.3 91.3 92.2 93.2 94.1 95.1 95.0
Repetition rate 3.5 3.2 2.9 2.7 2.4 2.1 1.8 1.6 1.3 1.0
Drop out rate 10.0 10.0 10.0 7.0 6.3 5.7 5.0 4.3 3.7 4.0
Form 2 - Form 3 Promotion rate 50.6 48.0 53.0 63.0 68.7 73.8 79.5 84.7 89.8 95.0
Repetition rate 0 2.0 2.0 2.0 1.5 1.5 1.0 1.0 1.0 1.0
Drop out rate 49.4 50.0 45.0 35.0 29.8 24.7 19.5 14.3 9.2 4.0
Form 3 - Form 4 Promotion rate 84 87.0 89.0 91.0 91.7 92.3 93.0 93.7 94.3 95.0
Repetition rate 0 0 0 0 0 0 0 0 0 0
Drop out rate 16 13.0 11.0 9.0 8.3 7.7 7.0 6.3 5.7 5
Form 4 - Form 5 Promotion rate 31.6 33.6 35.7 37.7 39.8 41.8 43.9 45.9 48.0 50.0
Repetition rate 0 0 0 0 0 0 0 0 0 0
Drop out rate 68.4 66.4 64.3 62.3 60.2 58.2 56.1 54.1 52.0 50.0
Form 5 - Form 6 Promotion rate 84 86.6 89.2 91.8 94.4 97 97 98 98 98
Repetition rate 0 0 0 0 0 0 0 0 0 0
Drop out rate 16 13.4 10.8 8.2 5.6 3 3 2 2 2
Repetition in F3 - 6 is not estimated due to missing basic data. Thus assumed included in net promotion rates

144
Table 5: Primary Enrolment GIRLS PRIMARY ENROLMENT (Both Public and Private)
Level 2006/07 2007/08 2008/09 2009/10 2010/11 2011/12 2012/13 2013/14 2014/15 2015/16
Std 1 16,732 18,892 17,168 21,064 15,489 15,451 15,817 16,664 16,639 16,907
Std 2 16,405 16,151 18,252 16,762 20,475 15,308 15,201 15,552 16,376 16,367
Std 3 16,104 15,654 15,931 17,977 16,630 20,215 15,295 15,096 15,434 16,244
Std 4 14,502 15,665 15,457 15,741 17,755 16,510 20,020 15,256 14,993 15,320
Std 5 14,823 14,107 15,146 15,020 15,346 17,356 16,229 19,635 15,028 14,731
Std 6 13,706 14,067 13,875 14,883 14,789 15,115 17,143 16,059 19,383 14,907
Std 7 12,521 13,153 13,861 13,527 14,268 14,026 14,148 16,080 15,096 0
Total 104,793 107,689 109,688 114,973 114,753 113,981 113,851 114,343 112,949 94,475
BOYS PRIMARY ENROLMENT (Both Public and Private)
Level 2006/07 2007/08 2008/09 2009/10 2010/11 2011/12 2012/13 2013/14 2014/15 2015/16
Std 1 17,249 19,643 17,499 21,649 16,060 16,077 16,485 17,379 17,352 17,632
Std 2 16,989 16,416 18,964 17,097 21,040 15,868 15,816 16,208 17,078 17,069
Std 3 16,033 16,049 16,197 18,667 16,971 20,771 15,850 15,706 16,085 16,940
Std 4 14,854 15,083 15,822 16,007 18,431 16,854 20,569 15,807 15,597 15,965
Std 5 14,300 13,934 14,589 15,361 15,606 18,013 16,569 20,173 15,570 15,324
Std 6 12,876 13,436 13,695 14,342 15,111 15,372 17,788 16,399 19,913 15,442
Std 7 12,004 11,846 13,187 13,325 13,760 14,316 14,388 16,686 15,415 0
Total 104,305 106,407 109,952 116,447 116,979 117,270 117,464 118,357 117,010 98,372

145
TOTAL PRIMARY ENROLMENT )
Level 2006/07 2007/08 2008/09 2009/10 2010/11 2011/12 2012/13 2013/14 2014/15 2015/16
Std 1 33,981 38,535 34,666 42,713 31,549 31,528 32,301 34,043 33,991 34,540
Std 2 33,394 32,567 37,216 33,858 41,515 31,176 31,017 31,760 33,454 33,436
Std 3 32,137 31,703 32,127 36,644 33,601 40,986 31,144 30,802 31,519 33,183
Std 4 29,356 30,748 31,279 31,748 36,186 33,363 40,588 31,063 30,590 31,285
Std 5 29,123 28,041 29,736 30,381 30,953 35,369 32,798 39,808 30,598 30,055
Std 6 26,582 27,503 27,569 29,225 29,900 30,487 34,931 32,458 39,296 30,349
Std 7 24,525 24,999 27,048 26,852 28,029 28,342 28,536 32,766 30,511 0
Total Gross Enrolment 209,098 214,096 219,640 231,421 231,731 231,251 231,316 232,700 229,959 192,848
Private share
Std 1 4.7% NA 1,795 1,615 1,990 1,470 1,469 1,505 1,586 1,583 1,609
Std 2 4.4% NA 1,423 1,626 1,479 1,814 1,362 1,355 1,388 1,462 1,461
Std 3 3.9% NA 1,232 1,248 1,424 1,306 1,593 1,210 1,197 1,225 1,290
Std 4 3.5% NA 1,090 1,109 1,125 1,283 1,183 1,439 1,101 1,084 1,109
Std 5 3.2% NA 896 950 971 989 1,130 1,048 1,272 978 960
Std 6 2.8% NA 768 770 816 835 851 975 906 1,097 847
Std 7 2.3% NA 581 629 624 651 659 663 762 709 0
Total Private Enrolment 3.6% 0 7,785 7,947 8,429 8,347 8,246 8,196 8,212 8,138 7,276
Net Total Public Enrolment 209,098 206,311 211,694 222,991 223,384 223,005 223,120 224,488 221,821 185,571

146
Pre-Primary public school population (NEW POLICY 2 years of Pre-school)
Class/Year 2006/07 2007/08 2008/09 2009/10 2010/11 2011/12 2012/13 2013/14 2014/15 2015/16
Nursery 1426 2170 3009 3901 4836 5811 6828 7885 8983 10121
Junior 1414 1426 2170 3009 3901 4836 5811 6828 7885 8983
Senior 1080 1414 1426 2170 3009 3901 No more Senior class
Total 3920 5010 6604 9080 11746 14549 12639 14712 16867 19104

147
Table 6: Secondary Enrolment
GIRLS SECONDARY ENROLMENT (Both Public and Private)
Level 2006/07 2007/08 2008/09 2009/10 2010/11 2011/12 2012/13 2013/14 2014/15 2015/16
OSC 10,316 0 0 0 0 0 0 0 0 0
Form 1 9,225 21,495 13,295 13,157 12,877 13,592 13,415 13,516 15,326 32,675
Form 2 8,934 8,613 18,825 11,951 12,124 11,936 12,713 12,625 12,847 14,696
Form 3 4,021 4,646 4,565 11,860 8,206 8,952 9,489 10,764 11,342 12,204
Form 4 3,371 3,904 4,042 4,154 10,872 7,577 8,325 8,888 10,154 10,775
Form 5 732 827 1,473 1,525 1,652 4,547 3,324 3,822 4,262 5,077
Form 6 656 668 738 1,352 1,440 1,603 4,410 3,257 3,746 4,177
Total 37,255 40,153 42,938 43,999 47,171 48,206 51,677 52,873 57,676 79,605
BOYS SECONDARY ENROLMENT (Both Public and Private)
Level 2006/07 2007/08 2008/09 2009/10 2010/11 2011/12 2012/13 2013/14 2014/15 2015/16
OSC 11,914 0 0 0 0 0 0 0 0 0
Form 1 9,294 20,329 11,981 12,498 12,672 13,113 13,677 13,747 15,898 33,482
Form 2 8,103 8,302 17,807 10,786 11,506 11,739 12,270 12,865 13,066 15,243
Form 3 3,788 4,628 4,400 11,218 7,406 8,495 9,333 10,388 11,557 12,413
Form 4 3,290 3,689 4,026 4,004 10,284 6,839 7,900 8,742 9,800 10,979
Form 5 1,085 992 1,392 1,519 1,593 4,301 3,000 3,627 4,192 4,900
Form 6 869 981 885 1,278 1,434 1,545 4,172 2,940 3,555 4,108
Total 38,343 38,921 40,491 41,304 44,895 46,032 50,351 52,309 58,067 81,125

148
TOTAL SECONDARY ENROLMENT
Level 2006/07 2007/08 2008/09 2009/10 2010/11 2011/12 2012/13 2013/14 2014/15 2015/16
OSC 22,230 0 0 0 0 0 0 0 0 0
Form 1 18,519 41,824 25,276 25,655 25,549 26,705 27,092 27,263 31,224 66,157
Form 2 17,037 16,915 36,632 22,737 23,630 23,675 24,983 25,490 25,913 29,939
Form 3 7,809 9,274 8,965 23,078 15,613 17,447 18,822 21,152 22,899 24,617
Form 4 6,661 7,593 8,068 8,158 21,155 14,416 16,225 17,630 19,954 21,754
Form 5 1,817 1,819 2,865 3,044 3,245 8,848 6,324 7,449 8,454 9,977
Form 6 1,525 1,649 1,623 2,630 2,874 3,148 8,582 6,197 7,300 8,285
Total Gross Enrolment 75,598 79,074 83,429 85,303 92,066 94,238 102,028 105,182 115,744 160,729
Private share
OSC 1.0% 0 0 0 0 0 0 0 0 0 0
Form 1 3.0% 0 866 758 770 766 801 813 818 937 1,985
Form 2 4.0% 0 962 1,465 909 945 947 999 1,020 1,037 1,198
Form 3 5.0% 0 830 448 1,154 781 872 941 1,058 1,145 1,231
Form 4 5.0% 0 755 403 408 1,058 721 811 881 998 1,088
Form 5 5.0% 0 278 143 152 162 442 316 372 423 499
Form 6 5.0% 0 133 81 132 144 157 429 310 365 414
Total Private Enrolment 0 3,824 3,300 3,525 3,856 3,941 4,310 4,459 4,904 6,414
Net Total Public Enrolment 75,598 75,250 80,130 81,778 88,210 90,297 97,718 100,723 110,840 154,315

149
Table 7: PTR and PCR
Assumptions for Primary (Public)
Year 2006/072007/082008/092009/102010/112011/122012/132013/142014/152015/16
Pupils per Classroom 84 84 84 83 82 80 80 80 80 80
Theoretical Pupils Teacher Ratio 26 26 29 31 34 40 40 40 40 40
Real Pupils Teacher Ratio 26 26 27 29 30 31 30 31 31 26
Assumptions for Secondary (Public)
Year 2006/072007/082008/092009/102010/112011/122012/132013/142014/152015/16
Pupils per Classroom 84 84 90 91 90 80 80 80 80 80
Theoretical Pupils Teacher Ratio 26 29 32 35 37 40 40 40 40 40
Real Pupils Teacher Ratio 26 26 28 29 31 31 34 35 39 40
Pre – Primary Assumptions 2006/07 2007/08 2008/09 2009/10 2010/11 2011/12 2012/13 2013/14 2014/15 2015/16 Pupils/Teacher Ratio 9 11 12 12 12 13 13 14 14 15Pupils per classroom 26 25.6 24.9 24.2 23.5 22.8 22.1 21.4 20.7 20
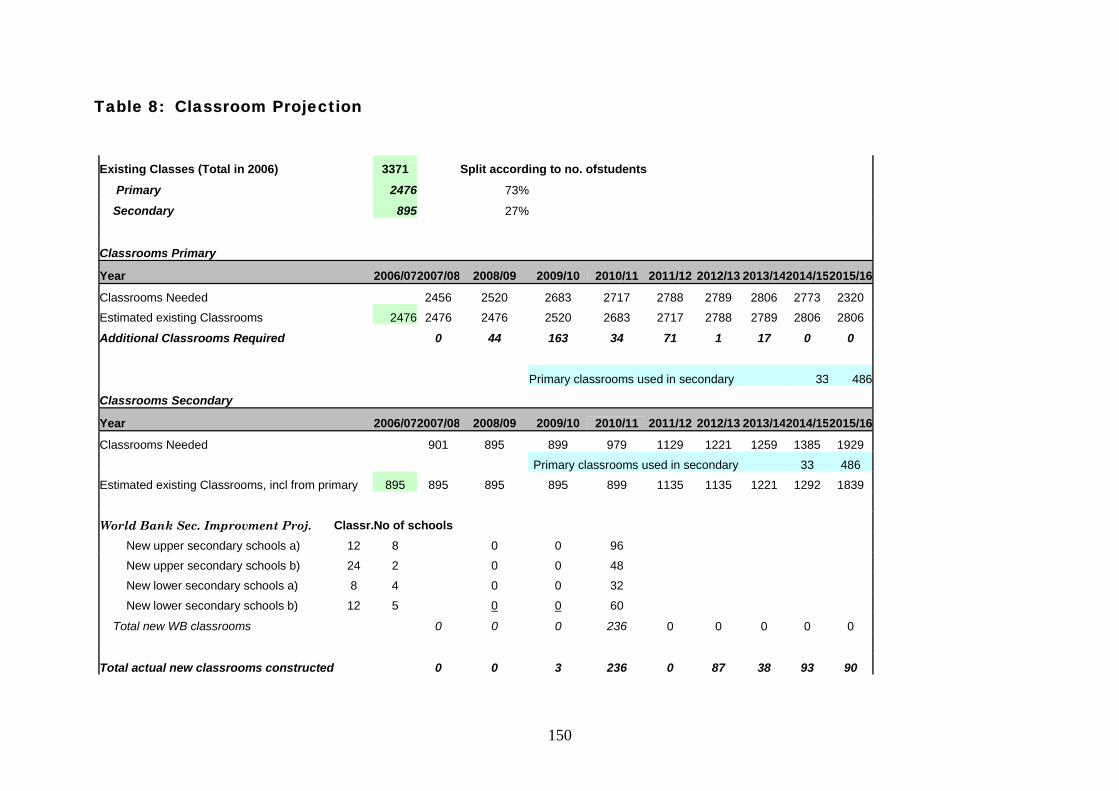
150
Table 8: Classroom Projection
Existing Classes (Total in 2006) 3371 Split according to no. ofstudents
Primary 2476 73%
Secondary 895 27%
Classrooms Primary
Year 2006/072007/08 2008/09 2009/10 2010/11 2011/12 2012/13 2013/142014/152015/16
Classrooms Needed 2456 2520 2683 2717 2788 2789 2806 2773 2320
Estimated existing Classrooms 2476 2476 2476 2520 2683 2717 2788 2789 2806 2806
Additional Classrooms Required 0 44 163 34 71 1 17 0 0
Primary classrooms used in secondary 33 486
Classrooms Secondary
Year 2006/072007/08 2008/09 2009/10 2010/11 2011/12 2012/13 2013/142014/152015/16
Classrooms Needed 901 895 899 979 1129 1221 1259 1385 1929
Primary classrooms used in secondary 33 486
Estimated existing Classrooms, incl from primary 895 895 895 895 899 1135 1135 1221 1292 1839
World Bank Sec. Improvment Proj. Classr.No of schools
New upper secondary schools a) 12 8 0 0 96
New upper secondary schools b) 24 2 0 0 48
New lower secondary schools a) 8 4 0 0 32
New lower secondary schools b) 12 5 0 0 60
Total new WB classrooms 0 0 0 236 0 0 0 0 0
Total actual new classrooms constructed 0 0 3 236 0 87 38 93 90

151
Table 9: Teacher Projection
Year 2006/07 2007/08 2008/09 2009/10 2010/11 2011/12 2012/13 2013/14 2014/15 2015/16 Pre-primary 451 451 572 758 947 1133 952 1074 1193 1274Untrained 78 78 143 190 237 283 238 268 298 318Certificate 365 365 429 569 710 850 714 805 895 955Diploma 8 8 0 0 0 0 0 0 0 0Degree 0 0 0 0 0 0 0 0 0 0 Primary 7981 7981 7860 7674 7485 7299 7480 7358 7239 7158Untrained 861 861 786 384 0 0 0 0 0 0Certificate 6644 6644 6681 6523 6737 6569 6732 6622 6515 6443Diploma 446 446 393 767 749 730 748 736 724 716Degree 30 30 0 0 0 0 0 0 0 0 Secondary 2867 2867 2867 2867 2867 2867 2867 2867 2867 3858Untrained 320 320 143 143 0 0 0 0 0 0Certificate 1076 1076 1003 573 573 287 143 0 0 0Diploma 1157 1157 1290 1434 1577 1720 1864 1864 1864 2508Degree 314 314 430 717 717 860 860 1003 1003 1350 Grand total 11299 11299 11299 11299 11299 11299 11299 11299 11299 12290

152
Table 10: Main Unit Costs
2006/07 2007/08 2008/09 2009/10 2010/11 2011/12 2012/13 2013/14 2014/15 2015/16
Unit costs teachers
Untrained 1,115,948 1,316,818 1,316,818 1,316,818 1,316,818 1,316,818 1,316,818 1,316,818 1,316,818 1,316,818
Certificate 1,189,956 1,404,148 1,404,148 1,404,148 1,404,148 1,404,148 1,404,148 1,404,148 1,404,148 1,404,148
Diploma 1,582,366 1,867,192 1,867,192 1,867,192 1,867,192 1,867,192 1,867,192 1,867,192 1,867,192 1,867,192
Degree 1,630,839 1,924,390 1,924,390 1,924,390 1,924,390 1,924,390 1,924,390 1,924,390 1,924,390 1,924,390
Support staff 781,015 921,598 921,598 921,598 921,598 921,598 921,598 921,598 921,598 921,598
Salaries has been increased in 07/08 so that the total personnel bill in that year matches the budget of Tsh 22 bn. Unfortunately, there is no detailed breakdown available of that bill in the MoEVT, so the details of the personnel costs remain diffuse. However, the projections have assumed that the budget in 07/08 does reflect the true, current personnel costs of education in Zanzibar.
UNIT COST CONSTRUCTION
Item Unit cost Unit TSH / USD Classroom size Sqm TSHs (000)
Classroom , pre-primary 6,811 USD 1300 1 8,854
Classroom, primary 9,353 USD 1 12,160
Classroom, secondary 60,576 USD 1 78,748
Classroom major repair 40% Tsh 40%
Teacher House 36,000 USD 46,800
Library construction 0 Tsh Cost saving rehab -
Secondary School rehabilitation 800,000 USD 75% 260,000

153
Base cost for classroom construction is the unit prices from the World Bank project, for secondary schools. The project includes building both urban and rural schools, and extensions in the same areas. To get an average classroom cost, it is assumed that new classrooms will be constructed in the same proportion as in the WB project. Primary and pre-primary classrooms are assumed stripped down versions of the secondary units. These costs are assumed to include all costs - on average – of building a classroom, meaning administrate rooms, equipment, libraries etc, are factored into the cost.
Classrooms for secondary have been further reduced by 25% compared to the WB unit cost to take account of likely costs savings. While secondary is still very costly to build, it is important to stress that quality learning environment is important for quality of the education itself. Thus, necessary support functions for the classrooms as laboratories and libraries should not be skimped. The pre primary and primary are all very cheap types of open classrooms. In these cases, the community is assumed to cover 20% of building costs.
Copyright © 2022 FDOKUMEN