Travel risk, malaria importation and malaria transmission in Zanzibar
7
Travel risk, malaria importation and malaria transmission in Zanzibar Arnaud Le Menach 1 , Andrew J. Tatem 2,3,4 , Justin M. Cohen 5 , Simon I. Hay 6,4 , Heather Randell 1,7 , Anand P. Patil 6 & David L. Smith 1,2,4,8 1 Center for Disease Dynamics, Economics & Policy, Washington, DC, USA, 2 Emerging Pathogens Institute, University of Florida, Gainesville, FL, USA, 3 Department of Geography, University of Florida, Gainesville, FL, USA, 4 Fogarty International Center, National Institutes of Health, Bethesda, MD, USA, 5 Clinton Health Access Initiative, Boston, MA, USA, 6 Department of Zoology, Oxford University, UK, 7 Department of Sociology, Brown University, Providence, RI, USA, 8 Department of Biology, University of Florida, Gainesville, FL, USA. The prevalence of Plasmodium falciparum malaria in Zanzibar has reached historic lows. Improving control requires quantifying malaria importation rates, identifying high-risk travelers, and assessing onwards transmission. Estimates of Zanzibar’s importation rate were calculated through two independent methodologies. First, mobile phone usage data and ferry traffic between Zanzibar and mainland Tanzania were re-analyzed using a model of heterogeneous travel risk. Second, a dynamic mathematical model of importation and transmission rates was used. Zanzibar residents traveling to malaria endemic regions were estimated to contribute 1–15 times more imported cases than infected visitors. The malaria importation rate was estimated to be 1.6 incoming infections per 1,000 inhabitants per year. Local transmission was estimated too low to sustain transmission in most places. Malaria infections in Zanzibar largely result from imported malaria and subsequent transmission. Plasmodium falciparum malaria elimination appears feasible by implementing control measures based on detecting imported malaria cases and controlling onward transmission. T he expansion of road, rail and air transport networks and their increasing affordability contribute to the spread of vector-borne diseases through human and vector movement 1, 2 . The relevant concept for malaria was named ‘‘vulnerability’’ by the World Health Organization (WHO) and defined qualitatively as ‘‘the frequent influx of infected individuals or groups and/or infective anophelines’’ 3 ; quantitatively, the rate of malaria importation includes all parasites that cross the border in humans and vectors. The impact of vulnerability depends on an area’s ‘‘receptivity’’ to malaria which reflects the conditions of transmission ‘‘through the abundant presence of vector anophelines and the existence of other ecological and climatic factors’’ 3 . Receptivity is defined quantitatively as the effective reproduction number R c , which describes the expected number of secondary human infections originating from a single, untreated infected human taking into account vector control measures 4, 5 . As part of renewed effort towards malaria elimination addressed in the Global Malaria Action Plan (GMAP), the malaria Eradication Research Agenda (MalERA) highlighted the importance of modeling strategies in defining vulnerability to plan for sustainable elimination and prevent reintroduction 6, 7 , especially in areas where malaria prevalence has been reduced but receptivity is still favorable to transmission 8 . In Zanzibar where the main malaria pathogen is Plasmodium falciparum, the introduction of artemisinin- based combination therapy in 2003 and the escalating ownership of insecticide-treated nets 9, 10 resulted in an important decrease in malaria prevalence (Figure 1) 11 . Therefore, the Zanzibar Minister of Health commissioned a report to assess the feasibility of malaria elimination 12, 13 , which highlighted the risk that cases may be imported from surrounding malaria-endemic regions of mainland Tanzania (Figure 1). Recent approaches to quantifying human mobility patterns point to novel insights through the analysis of mobile phone records 14 and initial estimates of malaria importation based on such records estimated between 1 and 12 infections imported each year per 1,000 Zanzibari citizens 15 . Uncertainty in the estimated importation rate spanned a critical value; at the lowest estimates of malaria importation rates, malaria elimination was cost-saving and sustainable, but at the upper estimates, controlling malaria was optimal. SUBJECT AREAS: DISEASES BIOLOGICAL MODELS COMPUTATIONAL BIOLOGY ECOLOGY Received 8 July 2011 Accepted 30 August 2011 Published 15 September 2011 Correspondence and requests for materials should be addressed to A.L.M. (arnaudlemenach@ gmail.com) SCIENTIFIC REPORTS | 1 : 93 | DOI: 10.1038/srep00093 1
Transcript of Travel risk, malaria importation and malaria transmission in Zanzibar

Travel risk, malaria importation andmalaria transmission in ZanzibarArnaud Le Menach1, Andrew J. Tatem2,3,4, Justin M. Cohen5, Simon I. Hay6,4, Heather Randell1,7,Anand P. Patil6 & David L. Smith1,2,4,8
1Center for Disease Dynamics, Economics & Policy, Washington, DC, USA, 2Emerging Pathogens Institute, University of Florida,Gainesville, FL, USA, 3Department of Geography, University of Florida, Gainesville, FL, USA, 4Fogarty International Center,National Institutes of Health, Bethesda, MD, USA, 5Clinton Health Access Initiative, Boston, MA, USA, 6Department of Zoology,Oxford University, UK, 7Department of Sociology, Brown University, Providence, RI, USA, 8Department of Biology, University ofFlorida, Gainesville, FL, USA.
The prevalence of Plasmodium falciparum malaria in Zanzibar has reached historic lows. Improving controlrequires quantifying malaria importation rates, identifying high-risk travelers, and assessing onwardstransmission.
Estimates of Zanzibar’s importation rate were calculated through two independent methodologies. First,mobile phone usage data and ferry traffic between Zanzibar and mainland Tanzania were re-analyzed usinga model of heterogeneous travel risk. Second, a dynamic mathematical model of importation andtransmission rates was used.
Zanzibar residents traveling to malaria endemic regions were estimated to contribute 1–15 times moreimported cases than infected visitors. The malaria importation rate was estimated to be 1.6 incominginfections per 1,000 inhabitants per year. Local transmission was estimated too low to sustain transmissionin most places.
Malaria infections in Zanzibar largely result from imported malaria and subsequent transmission.Plasmodium falciparum malaria elimination appears feasible by implementing control measures basedon detecting imported malaria cases and controlling onward transmission.
The expansion of road, rail and air transport networks and their increasing affordability contribute to thespread of vector-borne diseases through human and vector movement1, 2. The relevant concept for malariawas named ‘‘vulnerability’’ by the World Health Organization (WHO) and defined qualitatively as ‘‘the
frequent influx of infected individuals or groups and/or infective anophelines’’3; quantitatively, the rate of malariaimportation includes all parasites that cross the border in humans and vectors. The impact of vulnerabilitydepends on an area’s ‘‘receptivity’’ to malaria which reflects the conditions of transmission ‘‘through the abundantpresence of vector anophelines and the existence of other ecological and climatic factors’’3. Receptivity is definedquantitatively as the effective reproduction number Rc, which describes the expected number of secondary humaninfections originating from a single, untreated infected human taking into account vector control measures4, 5. Aspart of renewed effort towards malaria elimination addressed in the Global Malaria Action Plan (GMAP), themalaria Eradication Research Agenda (MalERA) highlighted the importance of modeling strategies in definingvulnerability to plan for sustainable elimination and prevent reintroduction6, 7, especially in areas where malariaprevalence has been reduced but receptivity is still favorable to transmission8.
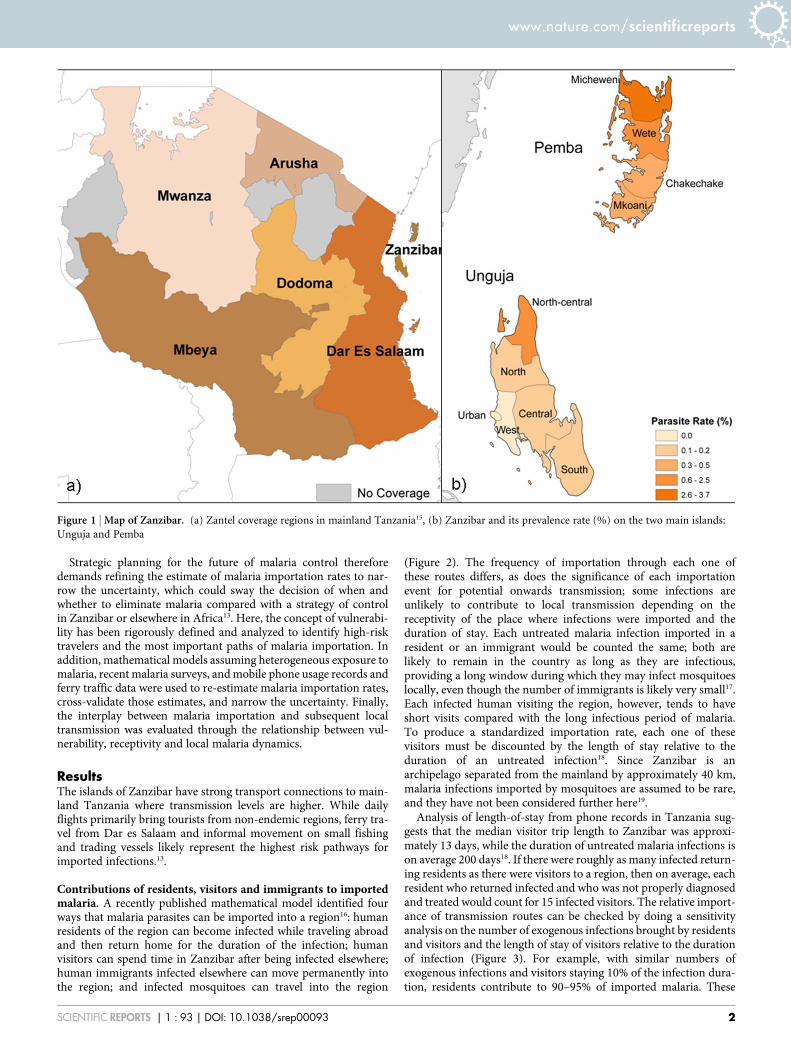
In Zanzibar where the main malaria pathogen is Plasmodium falciparum, the introduction of artemisinin-based combination therapy in 2003 and the escalating ownership of insecticide-treated nets9, 10 resulted in animportant decrease in malaria prevalence (Figure 1)11. Therefore, the Zanzibar Minister of Health commissioneda report to assess the feasibility of malaria elimination12, 13, which highlighted the risk that cases may be importedfrom surrounding malaria-endemic regions of mainland Tanzania (Figure 1). Recent approaches to quantifyinghuman mobility patterns point to novel insights through the analysis of mobile phone records14 and initialestimates of malaria importation based on such records estimated between 1 and 12 infections imported eachyear per 1,000 Zanzibari citizens15. Uncertainty in the estimated importation rate spanned a critical value; at thelowest estimates of malaria importation rates, malaria elimination was cost-saving and sustainable, but at theupper estimates, controlling malaria was optimal.
SUBJECT AREAS:DISEASES
BIOLOGICAL MODELS
COMPUTATIONAL BIOLOGY
ECOLOGY
Received8 July 2011
Accepted30 August 2011
Published15 September 2011
Correspondence andrequests for materials
should be addressed toA.L.M.
SCIENTIFIC REPORTS | 1 : 93 | DOI: 10.1038/srep00093 1
Strategic planning for the future of malaria control thereforedemands refining the estimate of malaria importation rates to nar-row the uncertainty, which could sway the decision of when andwhether to eliminate malaria compared with a strategy of controlin Zanzibar or elsewhere in Africa13. Here, the concept of vulnerabi-lity has been rigorously defined and analyzed to identify high-risktravelers and the most important paths of malaria importation. Inaddition, mathematical models assuming heterogeneous exposure tomalaria, recent malaria surveys, and mobile phone usage records andferry traffic data were used to re-estimate malaria importation rates,cross-validate those estimates, and narrow the uncertainty. Finally,the interplay between malaria importation and subsequent localtransmission was evaluated through the relationship between vul-nerability, receptivity and local malaria dynamics.
ResultsThe islands of Zanzibar have strong transport connections to main-land Tanzania where transmission levels are higher. While dailyflights primarily bring tourists from non-endemic regions, ferry tra-vel from Dar es Salaam and informal movement on small fishingand trading vessels likely represent the highest risk pathways forimported infections.13.
Contributions of residents, visitors and immigrants to importedmalaria. A recently published mathematical model identified fourways that malaria parasites can be imported into a region16: humanresidents of the region can become infected while traveling abroadand then return home for the duration of the infection; humanvisitors can spend time in Zanzibar after being infected elsewhere;human immigrants infected elsewhere can move permanently intothe region; and infected mosquitoes can travel into the region
(Figure 2). The frequency of importation through each one ofthese routes differs, as does the significance of each importationevent for potential onwards transmission; some infections areunlikely to contribute to local transmission depending on thereceptivity of the place where infections were imported and theduration of stay. Each untreated malaria infection imported in aresident or an immigrant would be counted the same; both arelikely to remain in the country as long as they are infectious,providing a long window during which they may infect mosquitoeslocally, even though the number of immigrants is likely very small17.Each infected human visiting the region, however, tends to haveshort visits compared with the long infectious period of malaria.To produce a standardized importation rate, each one of thesevisitors must be discounted by the length of stay relative to theduration of an untreated infection18. Since Zanzibar is anarchipelago separated from the mainland by approximately 40 km,malaria infections imported by mosquitoes are assumed to be rare,and they have not been considered further here19.
Analysis of length-of-stay from phone records in Tanzania sug-gests that the median visitor trip length to Zanzibar was approxi-mately 13 days, while the duration of untreated malaria infections ison average 200 days18. If there were roughly as many infected return-ing residents as there were visitors to a region, then on average, eachresident who returned infected and who was not properly diagnosedand treated would count for 15 infected visitors. The relative import-ance of transmission routes can be checked by doing a sensitivityanalysis on the number of exogenous infections brought by residentsand visitors and the length of stay of visitors relative to the durationof infection (Figure 3). For example, with similar numbers ofexogenous infections and visitors staying 10% of the infection dura-tion, residents contribute to 90–95% of imported malaria. These
Figure 1 | Map of Zanzibar. (a) Zantel coverage regions in mainland Tanzania15, (b) Zanzibar and its prevalence rate (%) on the two main islands:
Unguja and Pemba
www.nature.com/scientificreports
SCIENTIFIC REPORTS | 1 : 93 | DOI: 10.1038/srep00093 2

estimations assume both residents and visitors stay in the sameplaces in Zanzibar.
Estimating the vulnerability of Zanzibar. Simply counting thenumber of travelers to Zanzibar may not provide accurateestimates of malaria importation, so estimation of malaria risk wasdone in two ways for cross-validation. First, estimates of importationwere made from mobile phone usage records and ferry traffic data.The proportion of residents infected while travelling abroad can beestimated from the sum of their time spent at various levels of risk.An important caveat is that infection risk while traveling is highlyheterogeneous20, 21. Second, a mathematical model was developedthat could explicitly take into account the dynamics of trans-mission and malaria importation; this model was applied to cross-sectional parasite surveys from Zanzibar in 200711 to estimate theimportation rate and Rc.
The first method, based on mobile phone usage data, ferry trafficand heterogeneous risk of infection gives an estimate of between 0.7and 6 infections imported by residents per 1,000 Zanzibaris, based onthe risk of malaria for the entire regions of origin, or their principalcities, respectively (Table 1). Assuming, half of ferry passengers arevisitors to Zanzibar22, the annual number of infectious visitors variedfrom 8.5 to 8.8 per 1,000. The net visitor importation rate is weighedby the visitor length of stay respectively to the duration of infectionand varies between 0.7 and 0.9 infections per 1,000 Zanzibaris(Table 1). The total net importation rate to Zanzibar varies between1.6 if estimates are based on the risk measured in the main cities of
each region of origin to 6.7 if estimates are based on transmission riskmeasured in the region (Table 1). These estimates would also vary upor down depending on the ratio of residents to visitors. As mosttravel is assumed to occur between Zanzibar and main cities onmainland Tanzania, where malaria risk is low, the importation netrate of 1.6 infections per 1,000 inhabitants per year is kept as abaseline reference for further comparisons.
In urban Unguja, where an epidemiological survey estimated aparasite rate of 0% (95% Confidence Interval: 0–0.2%)11, the upperbound for the net malaria importation rate, if Rc were equal to 0, was3.7 per 1,000 inhabitants per year; the lower bound was 0 (Figure 4a).The midpoint of the estimates, 1.6 infections per 1,000 inhabitantsper year, is consistent with the findings from mobile phone dataanalysis. Assuming malaria importation rates tend to be highest inthe urban areas that are near the ferry landing, malaria prevalence inrural Unguja and Pemba likely provides more information aboutlocal transmission than about imported malaria. Using the estimatefrom the mobile phone survey of 1.6 imported infections, per1,000 per year, Rc ranges between 0 and 0.56 in urban Unguja(Figure 4a), between 0.71 and 0.91 in rural Unguja (Figure 4b),and between 0.92 and 0.98 in Pemba (Figure 4c).
Relationships between vulnerability, receptivity and malariaprevalence in Zanzibar. The models outlined here illustrate therelationship between the net importation rate, Rc and the pre-valence rate for contexts outside of Zanzibar. For the range ofmalaria importation rates (0 to 10 incoming infections per 1,000
Figure 2 | Qualitative assessment of malaria importation to Zanzibar and its influence on local malaria dynamics. The pathogen can be introduced into
the island according to four ways: 1) Zanzibar residents (R) can become infected while traveling abroad and bring it home; 2) infected visitors (V) to
Zanzibar can bring the pathogen from mainland Tanzania; 3) infected immigrants (M) travel and settle permanently in Zanzibar; 4) infected vectors
travel to Zanzibar either flying or passively carried out by wind or riding along human means of transportations. Once introduced, the probability for
further transmission is based on the length and the receptivity of the area where the pathogen is imported, defining the net importation rate.
www.nature.com/scientificreports
SCIENTIFIC REPORTS | 1 : 93 | DOI: 10.1038/srep00093 3

per year) and Rc (0 to 1) values used here, parasite rate estimates arefound to be below 8% (Figure 5a). Assuming the malaria importationrate to Zanzibar is less than 1.6 cases, malaria prevalence would notexceed 2% unless Rc was close or equal to 1 (Figure 5a).
Imported malaria not only brings malaria parasites to the island,but it also adds to local transmission23. As Rc and the net importationrate increase, the proportion of local infection amid all infectionsincreases. Under our current estimation of net importation rate toZanzibar of 1.6 and as Rc is close to one in rural Zanzibar, even lowundetected net importation rate triggers important local non-endemic transmission with high parasite rate that might delay mal-aria elimination (Figure 5b). Nevertheless, the overall estimates of Rc
are below 1, which suggests that if malaria importation ceased,
endemic malaria transmission would eventually end except in afew residual local transmission foci.
DiscussionStrategic priorities of national malaria control programs varydepending on many factors, including the natural potential forendemic malaria transmission, the levels of control that have beenachieved, and the proximity to other malaria endemic countries. Incountries where malaria is rare, malaria importation is of primaryconcern. Countries with well-developed health systems, good sur-veillance through national case reporting, and no local malaria cansimply count the number of malaria cases that occur. In the UnitedStates in 2008, 1,298 detected malaria cases were imported mainly intourists inadequately protected by chemoprophylaxis and immi-grants, and none triggered any further transmission24; autochthon-ous cases do occur, but only rarely25. Countries that have recentlyreduced their malaria burden, but that have strong human travelconnections with other malaria endemic countries26 with poorlydeveloped health systems, or some level of ongoing transmissionmust devise alternative methods for estimating malaria importationrates. Key information is required to set up appropriate measures:contributions of various routes of malaria importation, reliable esti-mates of malaria importation rates and of the potential for localtransmission, and the total impact of these quantities on the localendemic and non-endemic transmission. These estimates must alsobe made in a highly dynamic environment as neighboring countriesalso control malaria. Our analysis suggests that citizens of Zanzibarwho travel to malaria endemic regions are likely to be the single mostimportant source of importation. Mobile phone data analysis esti-mates that less than 1.6 malaria infections are imported per 1,000Zanzibar residents every year, with a credible value of less than 3.7infections per 1,000 people per year according to mathematical mod-els. This analysis suggests that Rc is below 1 in most places, as mostlocal transmission is driven by imported malaria. Therefore, ourresults suggest that, if current levels of control are sustained, malariawould eventually disappear from most of the island, except possiblyin a few residual foci if no imported infections occurred.
Therefore, enhanced prevention and control strategies should aimat mitigating pathogen importation to move towards malaria elim-ination and prevent reintroduction. The government could providefree chemoprophylaxis through the health system to Zanzibar resi-dents travelling to endemic mainland using drugs that minimize therisk of developing resistance27. As immunity to malaria parasite
Table 1 | Quantitative assessment of imported malaria from mainland Tanzania (Five Zantel regions: Arusha, Dar es Salam, Dodoma,Mbeya and Mwanza) to Zanzibar (Pemba and Unguja).dr and dv respectively represents the total number of imported infections brought toZanzibar by residents or visitors infected on mainland Tanzania (importation rate) with Tr the median time spent by residents on mainlandTanzania and Tv the median time spent by visitors on Zanzibar; Nv represents the total number of visitors travelling monthly to Zanzibar;dW
v represents visitor net importation rate, the number of infected visitors weighed by the duration of the trip, Tv, relatively to the durationof infection. The risk of infection is calculated with risk estimates from the main city or from the rest of the region of origin on mainlandTanzania.
Regions
Residents VisitorsRatio Residents
Visitors
dr
(region)dr
(city)Tr
(days)Nv
(ferry)dv
(region)dv
(city)dW
v(city)
dWv
(region)Tv
(days)dr
�dW
v
(region)dr
�dW
v
(city)
Imported malariaper month (absolutenumber)
Arusha 0.2 0.1 8 232 4.2 2.1 0.3 0.2 12 0.7 0.5Dar es Salaam 479 48.2 6 13990 648.1 592.3 47.8 66.4 13 10.0 0.7
Dodoma 6.8 3.9 6 301 49.5 63.5 3.2 6 13 2.1 0.7Mbeya 8 2.5 8 70 12.5 19.1 0.9 1.5 11 8.0 1.7
Mwanza 2.9 2.7 10 78 17.1 31.7 1.2 3.3 21 2.4 0.8Mainland Tanzania 496.9 57.4 6 14671 731.4 708.7 53.4 77.4 13 9.3 0.7
Imported malariaper year per 1,000
Mainland Tanzania 5.96 0.69 8.78 8.50 0.64 0.93 9.3 0.7
Figure 3 | Relative importance of residents on malaria importation.Contribution of resident travelers to the net malaria importation rate as a
function of the number of imported infections from visitors versus
residents (dv/dr) and the length of stay for visitors (Tv). The solid red line
represents the contribution threshold below which residents contribute to
more than 50% to malaria importation.
www.nature.com/scientificreports
SCIENTIFIC REPORTS | 1 : 93 | DOI: 10.1038/srep00093 4

Figure 4 | Quantitative assessment of malaria importation. Vulnerability (the number of imported malaria per year per 1,000 inhabitants, d) and
receptivity (the effective reproductive number, Rc) in three different epidemiological settings in Zanzibar: (a) urban Unguja with a parasite rate of 0%
(95% Confidence Interval: 0–0.2%), (b) rural Unguja with a parasite rate of 0.5% (0.3–0.9), and (c) Pemba with a parasite rate of 1.5% (1–2.1). The solid
black line represents the mean annual number of imported malaria cases and the dashed black lines the upper and lower bounds of the 95% confidence
interval represented by the grey area. The red dotted line represents the empirical estimation of d in Zanzibar according to travel assessment survey, which
is of 1.6 imported malaria cases per 1,000 inhabitants per year.
Figure 5 | Quantitative assessment of the impact of malaria importation on local malaria dynamics. The effect of vulnerability (the number of imported
malaria per year per 1,000 inhabitants, d) and of receptivity (the effective reproductive number, Rc) on, (a) the parasite rate (PR), and (b) the proportion
of local infection among all malaria infection. The red dashed line represents the empirical estimation of d in Zanzibar according to the travel assessment
survey, which is of 1.6 imported malaria cases per 1,000 inhabitants per year. The solid red line represents the contribution threshold above which local
infections contribute to more than 50% to total malaria prevalence
www.nature.com/scientificreports
SCIENTIFIC REPORTS | 1 : 93 | DOI: 10.1038/srep00093 5

declines in low endemic settings, such travelers are even more vul-nerable to infection, stressing the rationale to distribute prophylaxis.In addition, each case of infection should be reported to healthauthorities, which highlights the need for enhanced surveillance28.Measures should include border screening especially at ports of land-ing, active case detection and investigation to set up appropriatereactive measures in the environment of the cases. Surveillance toolsrely on the availability of sensitive and specific diagnostic tools suchas rapid diagnostic tests (RDTs), which require further improve-ment29. Finally, vector control measures could mitigate the importa-tion of infectious anopheles, for instance by using insecticide inplanes flying from malaria endemic region30, even though this islikely to be a minor issue. Some of these measures may be technically,economically and operationally challenging and require prior feas-ibility assessment combined with public health education campaigns.
Imported malaria contributes differently to local dynamicsdepending on the number of incoming pathogens and the lengthof stay as addressed here, but also on when and where malaria isimported. Formal and informal human movements are increasinglybecoming amenable to study as humans use mobile phones.Nevertheless, mobile phone usage data are subject to biases basedon data availability, ownership and usage patterns. Principal malariatransmission season on mainland starts between November andJanuary and ends approximately between April and June.Therefore, the current survey extending over a three-month periodfrom October to December only captures a subset of potential mal-aria importation. Furthermore, the available Zantel mobile recordsdid not provide further information on local cell tower usage, so itwas not known where residents and visitors stayed in Zanzibar. As aresult, even though malaria importation could be quantified for themain regions of Zanzibar, no local foci of residual transmission canbe identified at higher spatial resolutions. Finally, even though gen-eral population movement to and from Zanzibar mainly rely on ferrytransportation, informal movement on small fishing boats alsorepresent a pathway for malaria importation and can only be par-tially captured through mobile phone records. These movementscreate hotspots of malaria importation mainly in coastal communit-ies. As health authorities know these hotspots, the Zanzibar MalariaControl Programme (ZMCP) can intervene and mitigate malariaimportation in these communities.
Some of these limitations have been addressed by cross-validatingestimates with two completely independent methods using differentdata. Despite the uncertainties, mobile phone usage records haveprovided useful and reasonably accurate information about thelengths of stay in Zanzibar and the relative importance of variousroutes of malaria importation. These estimates could be improvedthrough further studies focusing on the places where people stay inZanzibar, and gathering mobile phone data over a longer study per-iod to better take into account malaria seasonality. To move towardselimination, additional tools should be used to complement currentassessment especially in terms of risk mapping. The Malaria AtlasProject (MAP) provides with endemicity maps based on prevalencesurveys at a global, continental or country level. Using mathematicalmodels31–33, these maps were converted to EIR risk maps, a morerelevant measure for risk transmission15. Nevertheless, as Zanzibaris getting closer to elimination, finer scale mapping based onenvironmental, epidemiological, population, vector, social and eco-nomical factors is required to identify residual foci in order to imple-ment rapid localized response.
As very low levels of transmission are reached, programs movefrom a focus on control to a focus on pre-elimination and elimina-tion, and finally prevention of re-introduction. Quantitativeapproaches to human movement and the spread of malaria areincreasingly useful for government to appropriately decide whenshifting efforts to stemming importation. Mobility patterns can beused to estimate the import of infectious disease into geographic
regions with low endemic states. The importance of control methodswill depend on the vectors and immuno-epidemiology of the patho-gen, as for dengue which has a shorter infectious period, daytimebiting vectors, and life-long immunity34. As methods improve forquantifying malaria importation and transmission, they can beapplied more widely to advise countries on strategic planning acrossthe region and worldwide.
MethodsContributions of residents, visitors and immigrants to imported malaria. Thestandardized contributions of imported malaria from all four routes can be added toestimate the malaria importation rate, denoted d, reported as the equivalent numberof untreated new human infections, per thousand populations, per year.Quantitatively, the way residents or visitors influence malaria dynamics mainlydepends on the number of infections brought by residents and visitors (dr and dv), andthe length of stay of visitors (Tv) relative to the duration of infections in residents (1/r).Assuming infectivity is constant over the duration of infection, the relativecontribution of one imported malaria case by a resident compared to one by a visitor
is estimated according to the following formula:dr=r
dr=rzdvTv.
Estimating the vulnerability of Zanzibar. Estimating the net malaria importationrate from mobile phone usage data. Anonymized phone call record data, whichincluded both the time each call was made and the location of the nearest mast thateach call was routed through, was used to construct trajectories of the movements ofindividuals over time15. About 9 out 10 Tanzanians have access to a mobile phone35, 36
and the Zanzibar telecom (Zantel) mobile phone operator has approximately a 99%market share on Zanzibar35, this likely comprises a representative sample of Zanzibariresidents. This does not hold for Tanzania as a whole, as Zantel had onlyapproximately a 10% share of the market on the mainland during the data period.Mobile phone usage records encompassing a three-month period from October toDecember 2008 were obtained, as the company only archives three months of records.This covers the busiest period in terms of travel to and from Zanzibar, and thereforeenables conservative upper estimates of malaria importation. Zanzibar residents wereidentified based on the assumptions that they made the majority of their calls onZanzibar; the rest were considered to be visitors. Each individual call and message wasspatially referenced to one of six areas: Arusha, Dar es Salaam, Dodoma, Mbeya,Mwanza and Zanzibar (Figure 1). Only those making regular calls (more than four amonth) with apparent overnights trips were considered, as day trips are of little riskconsidering the mosquito night biting habits37. The final dataset included 67,236 tripsmade by visitors between Zanzibar and mainland and 73,095 trips made by forZanzibari residents, 88% of Zanzibari users did not travel long distance during thestudy period.
Mobile phone data inform on individual trips made by Zanzibar residents toendemic areas on the mainland, more specifically, where they went and how long theystayed (length of stay, Tr). The level of malaria endemicity can be measured by thedaily entomological inoculation rate (EIR or E), which corresponds to the number ofinfectious bites received per person per day. Recent research efforts have providedspatial quantification of P. falciparum endemicity enabling estimation of EIR at thelocations where Zanzibar residents visit38, 39. Two types of population-weightedestimates for EIR were provided based on the endemicity level for each Zantel regioneither for the entire regions of origin, or their principal cities disaggregated by monthto take into account transmission seasonality. For residents, the individual probabilityof getting infected by malaria parasites during each trip is described by the followingformula for the whole trip attack rate that takes into account heterogeneous biting
Pr~1{ 1zabETrð Þ{1=a 31–33. b represents the probability that an infectious bite leads
to infection, and a is an index of heterogeneous risk during a trip in an area withaverage daily exposure E, anda54.2 so that approximately 20% of the population gets80% of all the risk20. Combining the information collected with mobile phones to theformula of heterogeneous biting allow for estimating the total number of importedinfections from residents, dr, over all Nr people trips made in during the study period,
which is dr~XNr
Pr .
As the mobile phone data do not cover all visitors to Zanzibar, the risk from eachindividual visitor trip provided by mobile phone data was extrapolated to the numberof visitors travelling each month to Zanzibar provided by ferry traffic data. Thenumber of infected visitors traveling to Zanzibar from mainland Tanzania, dv, is
calculated according to the following formula dv~XNv
i
Xi with Nv the overall number
of visitors traveling to Zanzibar according to ferry traffic data and X the parasite ratefor each region of origin or their principal cities, disaggregated by month. To comparethe respective impact of imported malaria from visitors on local transmissionto the one from residents, the number of infected visitors was standardized using
the formula dWv ~
XNv
i
rTvXi, with Tv the duration of their trip, and r approximately0.005 d21.
Estimating the net malaria importation rate from a mathematical model. The secondmethod, which is based on a model of importation and transmission, estimates themalaria importation rate as a function of malaria prevalence and Rc. The model
www.nature.com/scientificreports
SCIENTIFIC REPORTS | 1 : 93 | DOI: 10.1038/srep00093 6

considers only imported malaria cases that are not treated. The dynamics of malariainfection at low intensity can be described by a slightly modified Ross-Macdonaldmodel40, 41. At low prevalence, the model is simplified to X
:~RcXr(1{X){rX32. The
expression reflects the local transmission of the disease. But the overall malariadynamics should also encompass imported malaria and the expression can beimproved by explicitly adding per-capita importation rate d:X:~RcXr(1{X)zd(1{X){rX. At the equilibrium, X
:~0, and the net malaria
importation rate is estimated by the following formula: d~rX1
1{X{Rc
� �.
Relationships between vulnerability (d), receptivity (Rc) and malaria prevalence inZanzibar. The estimates of receptivity and vulnerability influence malaria prevalenceand the proportion of local infection amid all infections. Malaria prevalence (X) atequilibrium is estimated by solving RcXr(1{X)zd(1{X){rX~0. In our model,the local force of infection is described by RcXr, therefore the proportion of localinfection amid the total number of infections in the area of interest is described by the
following formulaRcXr
RcXrzd.
1. Stoddard, S. T. et al. The role of human movement in the transmission of vector-borne pathogens. PLoS Negl Trop Dis 3, e481 (2009).
2. Tatem, A. J., Rogers, D. J. & Hay, S. I. Global transport networks and infectiousdisease spread. Adv Parasitol 62, 293–343 (2006).
3. World Health Organization. Technical report Series 324 (1966).4. Anderson, R. M. & Anderson, R. M. & May, R. M. Infectious diseases of humans
(Oxford University Press, Oxford, 1991).5. Dietz K. The estimation of the basic reproduction number for infectious diseases.
Stat Methods Med Res 2, 23–41 (1993).6. Alonso, P. L. et al. A research agenda to underpin malaria eradication. PLoS Med
8, e1000406 (2011).7. The malERA Consultative Group on Modeling. A research agenda for malaria
eradication: modeling. PLoS Med 8, e1000403 (2011).8. Sabot, O. et al. Costs and financial feasibility of malaria elimination. Lancet 376,
1604–15 (2010).9. Bhattarai, A. et al. Impact of artemisinin-based combination therapy and
insecticide-treated nets on malaria burden in Zanzibar. PLoS Med 4, e309 (2007).10. Stich, A. H. et al. Insecticide-impregnated bed nets reduce malaria transmission in
rural Zanzibar. Trans R Soc Trop Med Hyg 88, 150–4 (1994).11. Zanzibar Malaria Control Program. (Zanzibar, 2008).12. Tatem, A. J. et al. Ranking of elimination feasibility between malaria-endemic
countries. Lancet 376, 1579–91 (2010).13. Zanzibar Malaria Control Programme. Malaria Elimination in Zanzibar: A
Feasibility Assessment. 1–81 (2009).14. Gonzalez, M. C., Hidalgo, C. A. & Barabasi, A. L. Understanding individual
human mobility patterns. Nature 453, 779–82 (2008).15. Tatem, A. J. et al. The use of mobile phone data for the estimation of the travel
patterns and imported Plasmodium falciparum rates among Zanzibar residents.Malar J 8, 287 (2009).
16. Cosner, C. et al. The effects of human movement on the persistence of vector-borne diseases. J Theor Biol 258, 550–60 (2009).
17. Gossling, S. & Schulz, U. Tourism-Related Migration in Zanzibar, Tanzania.Tourism Geographies 7, 43–62 (2005).
18. Snow, R. W. & Gilles, H. M. in Essential Malariology (eds. Warrell, D. A. & Gilles,H. M.) 85–106 (Arnold, London, 2002).
19. Service, M. W. Mosquito (Diptera: Culicidae) dispersal—the long and short of it. JMed Entomol 34, 579–88 (1997).
20. Smith, D. L., Drakeley, C. J., Chiyaka, C. & Hay, S. I. A quantitative analysis oftransmission efficiency versus intensity for malaria. Nat Commun 1, 108 (2010).
21. Smith, D. L., Dushoff, J. & McKenzie, F. E. The risk of a mosquito-borne infectionin a heterogeneous environment. PLoS Biol 2, e368 (2004).
22. Zanzibar Ministry of Communication and Transport. Ferry Passenger data: 2006–2007. (2008).
23. Cohen, J. M., Moonen, B., Snow, R. W. & Smith, D. L. How absolute is zero? Anevaluation of historical and current definitions of malaria elimination. Malar J 9,213 (2010).
24. Mali, S., Steele, S., Slutsker, L. & Arguin, P. M. Malaria surveillance – United States,2008. MMWR Surveill Summ 59, 1–15.
25. MacArthur, J. R. et al. Probable locally acquired mosquito-transmitted malaria inGeorgia, 1999. Clin Infect Dis 32, E124–8 (2001).
26. Tatem, A. J. & Smith, D. L. International population movements and regionalPlasmodium falciparum malaria elimination strategies. Proc Natl Acad Sci U S A107, 12222–7 (2010).
27. The malERA Consultative Group on drugs. A research agenda for malariaeradication: drugs. PLoS Med 8, e1000402 (2011).
28. The malERA Consultative Group on Monitoring, E., and Surveillance. A researchagenda for malaria eradication: monitoring, evaluation, and surveillance. PLoSMed 8, e1000400 (2011).
29. The malERA Consultative Group on diagnoses and diagnostics. A researchagenda for malaria eradication: diagnoses and diagnostics. PLoS Med 8, e1000396(2011).
30. The malERA Consultative Group on vector control. A research agenda for malariaeradication: vector control. PLoS Med 8, e1000401 (2011).
31. Smith, D. L., Dushoff, J., Snow, R. W. & Hay, S. I. The entomological inoculationrate and Plasmodium falciparum infection in African children. Nature 438, 492–5(2005).
32. Smith, D. L. & McKenzie, F. E. Statics and dynamics of malaria infection inAnopheles mosquitoes. Malar J 3, 13 (2004).
33. Smith, D. L., McKenzie, F. E., Snow, R. W. & Hay, S. I. Revisiting the basicreproductive number for malaria and its implications for malaria control. PLoSBiol 5, e42 (2007).
34. Whitehorn, J. & Farrar, J. Dengue. Br Med Bull 95, 161–73 (2010).35. Tanzania Communications regulatory Authority. (ed. TCR) (Dar es Salam, 2009).36. International Communication Union. (2007).37. Sinka, M. E. et al. The dominant Anopheles vectors of human malaria in Africa,
Europe and the Middle East: occurrence data, distribution maps and bionomicprecis. Parasit Vectors 3, 117 (2010).
38. Hay, S. I. et al. A world malaria map: Plasmodium falciparum endemicity in 2007.PLoS Med 6, e1000048 (2009).
39. Smith, D. L. & Hay, S. I. Endemicity response timelines for Plasmodiumfalciparum elimination. Malar J 8, 87 (2009).
40. Mac Donald, G. The epidemiology and control of malaria (Oxford UniversityPress, London, 1957).
41. Ross, R. The prevention of malaria (John Murray, London, 1910).
AcknowledgementsThe author would like to thank members of the Zanzibar Malaria Control Programme.ALM, HR, DLS, AJT are supported by a grant from the Bill and Melinda Gates Foundation(#49446)(http://www.gatesfoundation.org). SIH is funded by a Senior Research Fellowshipfrom the Wellcome Trust (#079091). DLS, AJT and SIH also acknowledge funding supportfrom the RAPIDD program of the Science & Technology Directorate, Department ofHomeland Security, and the Fogarty International Center, National Institutes of Health(http://www.fic.nih.gov). APP is paid by a Biomedical Resources Grant from the WellcomeTrust (#091835). This work forms part of the output of the Malaria Atlas Project (MAP,http://www.map.ox.ac.uk), principally funded by the Wellcome Trust, U.K (http://www.wellcome.ac.uk). The funders had no role in study design, data collection and analysis,decision to publish, or preparation of the manuscript.
Author contributionsDLS and ALM jointly conceived and led the research. ALM, DLS, AT, and HR developed thelogic of the analyses. ALM performed the analyses and wrote the manuscript. AT, SIH, JMCand APP contributed to the analyses. All authors discussed the study design and results andcontributed to drafting and revising the manuscript and figures.
Additional informationCompeting financial interests The authors declare no competing financial interests.
License: This work is licensed under a Creative CommonsAttribution-NonCommercial-ShareAlike 3.0 Unported License. To view a copy of thislicense, visit http://creativecommons.org/licenses/by-nc-sa/3.0/
How to cite this article: Le Menach, A. et al. Travel risk, malaria importation and malariatransmission in Zanzibar. Sci. Rep. 1, 93; DOI:10.1038/srep00093 (2011).
www.nature.com/scientificreports
SCIENTIFIC REPORTS | 1 : 93 | DOI: 10.1038/srep00093 7