Nigerian Capital Importation - National Bureau of Statistics
36
NATIONAL BUREAU OF STATISTICS Nigerian Capital Importation (Q4 & Full Year 2017) Report Date: February 2018
-
Upload
khangminh22 -
Category
Documents
-
view
1 -
download
0
Transcript of Nigerian Capital Importation - National Bureau of Statistics
NATIONAL BUREAU OF STATISTICS
Nigerian Capital Importation(Q4 & Full Year 2017)
Report Date: February 2018

Contents
S u m m a r y ...................................................................................................................................................... 1
C a p i t a l Im p o r t a t io n b y T y p e ........................................................................................................... 2
C a p i t a l Im p o r t a t io n b y S e c t o r .......................................................................................................... 3
C a p i t a l Im p o r t a t io n b y S t a t e ..............................................................................................................5
C a p i t a l Im p o r t a t io n b y C o u n t r y o f O r i g i n ........................................................................... 5
C a p i t a l Im p o r t a t io n b y B a n k .......................................................................................................... 7
I n f o g r a p h ic s ................................................................................................................................................ 8
A p p e n d ix - T a b le s ...................................................................................................................................... 26
M e t h o d o l o g y .............................................................................................................................................. 33
A c k n o w le d g m e n t a n d C o n t a c t ....................................................................................................... 34
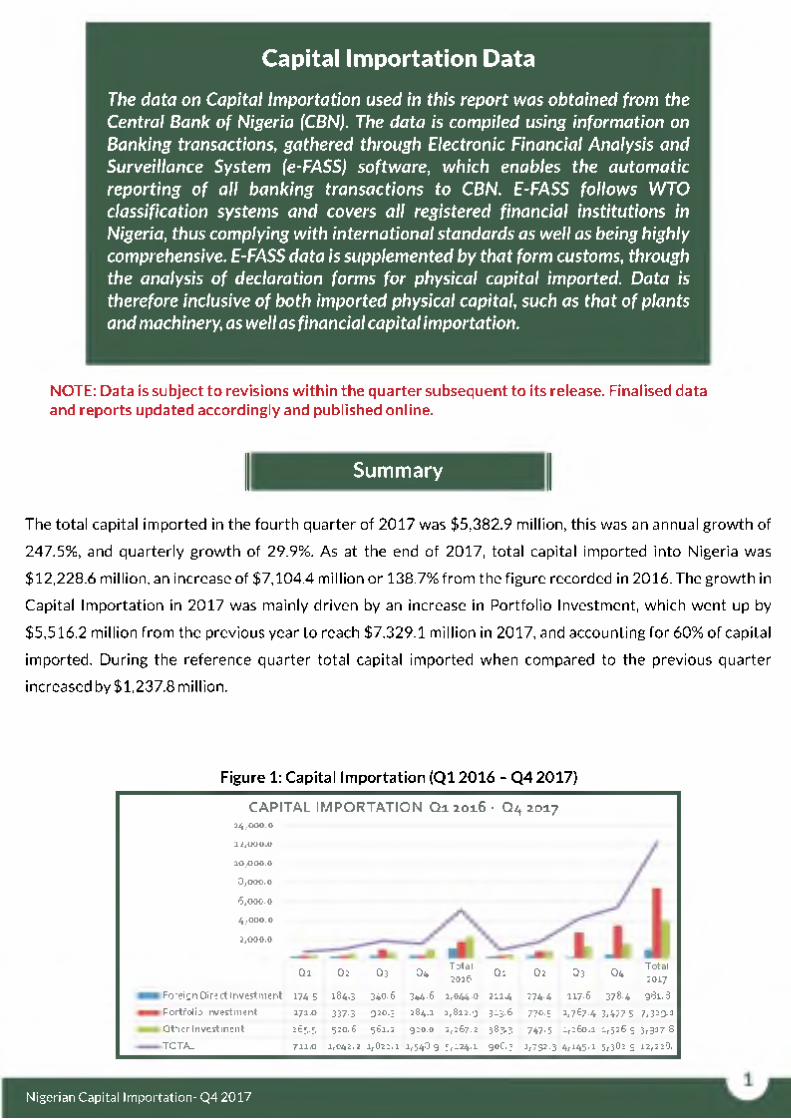
Capital Importation DataThe data on Capital Importation used in this report was obtained from the Central Bank of Nigeria (CBN). The data is compiled using information on Banking transactions, gathered through Electronic Financial Analysis and Surveillance System (e-FASS) software, which enables the automatic reporting of all banking transactions to CBN. E-FASS follows WTO classification systems and covers all registered financial institutions in Nigeria, thus complying with international standards as well as being highly comprehensive. E-FASS data is supplemented by that form customs, through the analysis of declaration forms for physical capital imported. Data is therefore inclusive of both imported physical capital, such as that of plants and machinery, as well as financial capital importation.
NOTE: Data is subject to revisions within the quarter subsequent to its release. Finalised data and reports updated accordingly and published online.
Sum m ary
The total capital imported in the fourth quarter of 2017 was $5,382.9 million, this was an annual growth of
247.5%, and quarterly growth of 29.9%. As at the end of 2017, total capital imported into Nigeria was
$12,228.6 million, an increase of $7,104.4 million or 138.7% from the figure recorded in 2016. The growth in
Capital Importation in 2017 was mainly driven by an increase in Portfolio Investment, which went up by
$5,516.2 million from the previous year to reach $7,329.1 million in 2017, and accounting for 60% of capital
imported. During the reference quarter total capital imported when compared to the previous quarter
increased by $1,237.8 million.
Figure 1: Capital Importation (Q1 2016 - Q4 2017)
CAPITAL IMPORTATION Q i 2016 - Q4 201714,000.0
12 f 0 0 0 .0
10,000.0
8,000.0
6.000. 0
4.000. 0
2. 000. 0
Q l Q l Û3 Ü4Total1016 Ql Q l Û3 Ü4
Total2017
Foreign Direct Investment 174.5 184.3 340.5 344.6 1,044.0 211.4 274.4 117.6 378.4 981.8
Portfolio Investment 271.0 337-3 910.3 284.2 1,811.9 313.6 770-5 2,767.4 3,477.5 7,3*9-3Other Investment 265.5 52O.6 561.1 920,0 2,167.2 583-3 747.5 1,260.1 1,526.9 3, 917-8TOTAL 7II.O 1,042.2 1,811.1 1,548.9 5,1.24.1 908.3 3,791-3 4,145.1 5,382.9 12,228.
Nigerian Capital Importation- Q4 2017
Capital Importation by Type
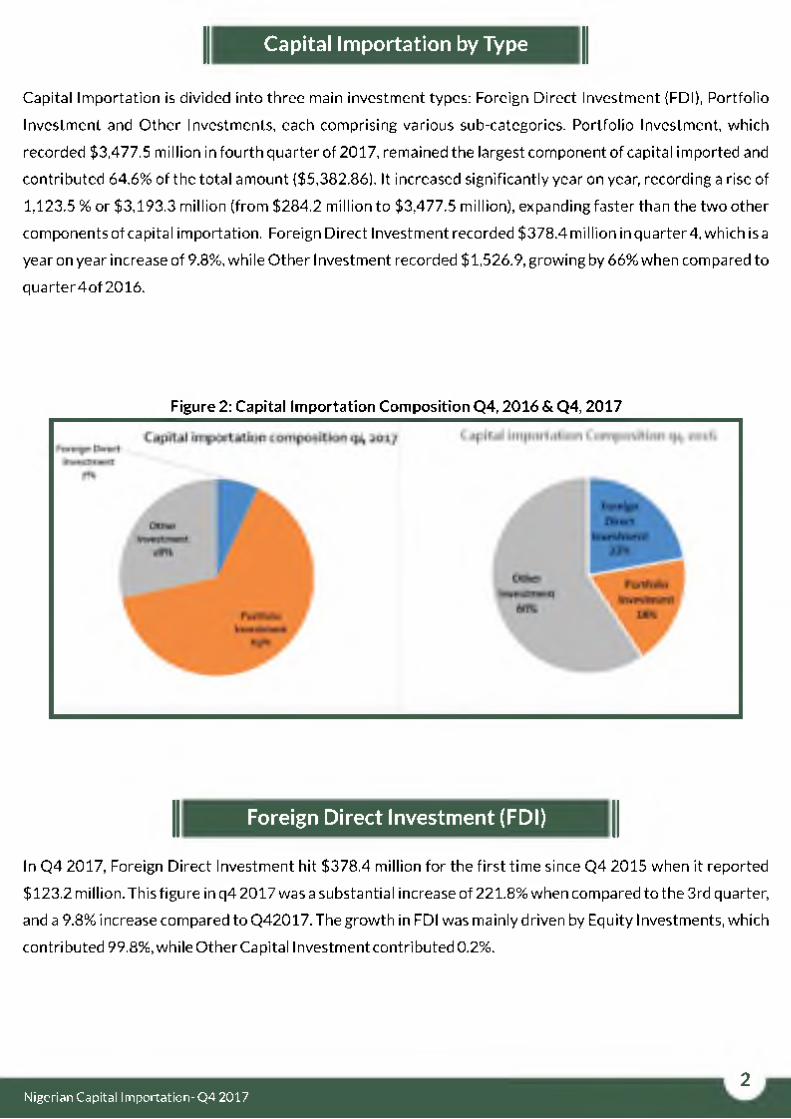
Capital Importation is divided into three main investment types: Foreign Direct Investment (FDI), Portfolio
Investment and Other Investments, each comprising various sub-categories. Portfolio Investment, which
recorded $3,477.5 million in fourth quarter of 2017, remained the largest component of capital imported and
contributed 64.6% of the total amount ($5,382.86). It increased significantly year on year, recording a rise of
1,123.5 % or $3,193.3 million (from $284.2 million to $3,477.5 million), expanding faster than the two other
components of capital importation. Foreign Direct Investment recorded $378.4 million in quarter 4, which is a
year on year increase of 9.8%, while Other Investment recorded $1,526.9, growing by 66% when compared to
quarter 4 of 2016.
Figure 2: Capital Importation Composition Q4, 2016 & Q4, 2017
Foreign Direct Investment (FDI)
In Q4 2017, Foreign Direct Investment hit $378.4 million for the first time since Q4 2015 when it reported
$123.2 million. This figure in q4 2017 was a substantial increase of 221.8% when compared to the 3rd quarter,
and a 9.8% increase compared to Q42017. The growth in FDI was mainly driven by Equity Investments, which
contributed 99.8%, while Other Capital Investment contributed 0.2%.
2Nigerian Capital Importation- Q4 2017
Portfolio Investments
Portfolio Investment was the main driver of Capital Importation in the fourth quarter of 2017, with an amount
of $3,477.5 million, representing a quarter on quarter growth of 25.7%. Year on year, it increased by 1,123.5%,
which is over twelve times the figure recorded in Q4 2016($284.2 million). The increase in Portfolio
Investment was driven by a strong growth in Money Market Instruments, which recorded $2,178.8 million, the
first time since Q3 2013. Money Market Instruments contributed 63% to Portfolio investments. Equity which
had been the main driver of Portfolio investments in previous quarters dropped by $942.9 million, from
$1,932.1 million in Q3 to $989.2 million in Q4 2017. On the other hand, Bonds recorded an increase of $194.1
million, from $115.4 million in Q3 to $309.5 million in Q4 of the same year.
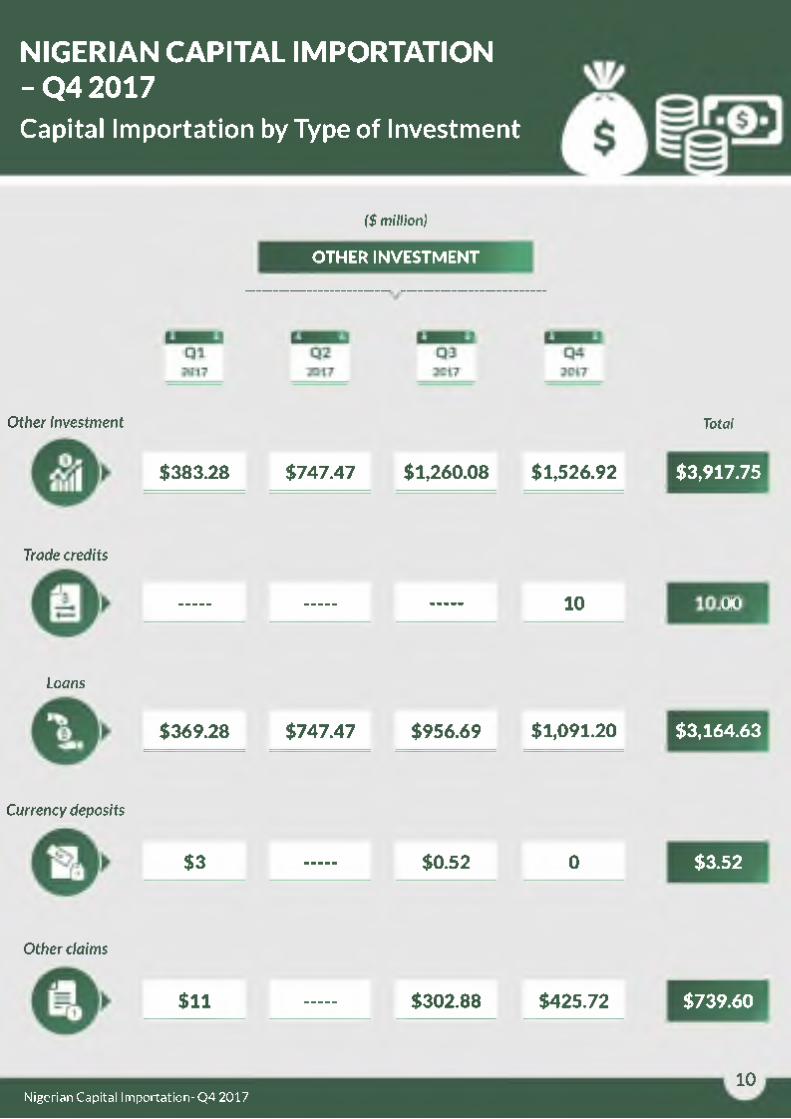
O ther Investments
Other Investment accounted for 28.4% of total capital importation in the fourth quarter of 2017. This category
of capital importation grew 65.96% year on year, and by 21.2% when compared to the previous quarter. The
$1,526.9 million recorded by Other Investment was mainly in the form of Loans, which was $1,091.2 million in
the fourth quarter, followed by Other Claims which recorded $425.7 million, and then Trade credits which
reported $10million, having posted no inflows since Q4 2016.
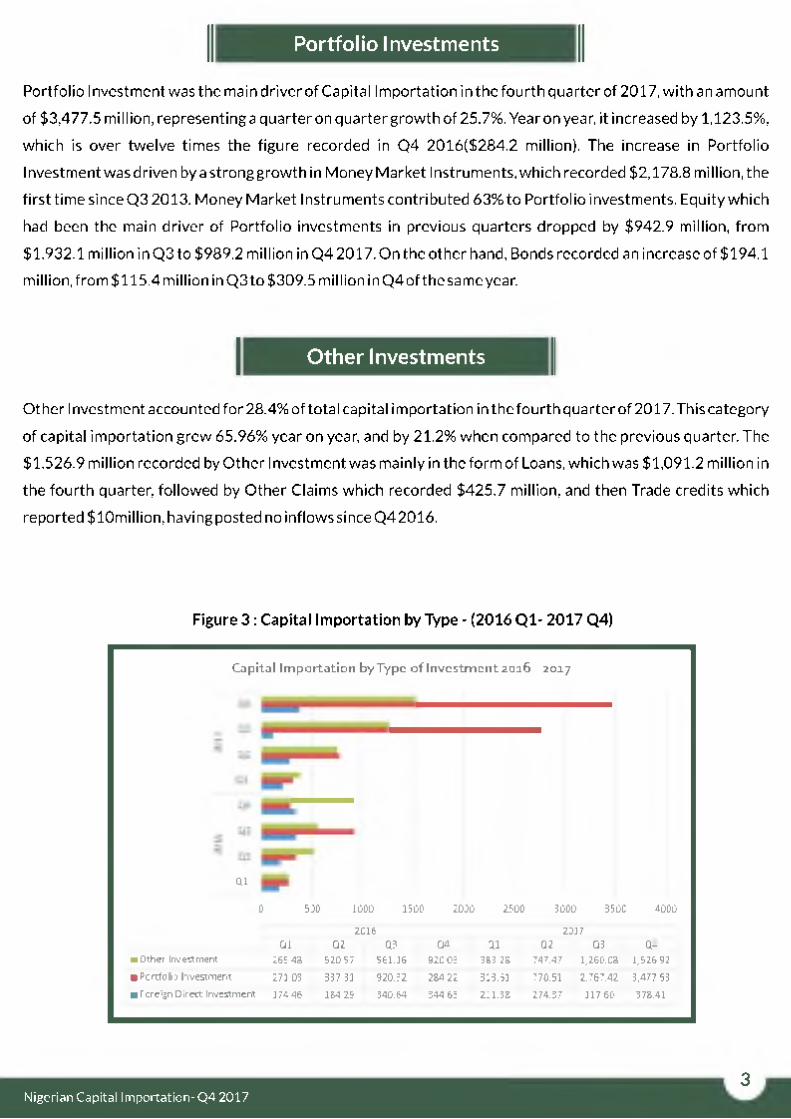
Figure 3 : Capital Importation by Type - (2016 Q1- 2017 Q4)
Capital Importation by Type of Investment 2016 - 2017
Q.10 500 1000 1500 2000 2500 3000 3500 4000
2016 2017Q1 02 Q3 G^ Q1 G2 Q3 G-
■ Other Investment 265 48 520.57 561.16 320.03 3B3.2.B 747.47 1,260. OB 1,526.32■ Portfoio Investment 271.03 337.31 320.32 234.22 313.61 770.51 2,767.42 3,477.53■ Foreign Direct Investment 174.46 1B4.Z3 340.64 344.63 211.3B 274.37 117.60 37B.41
3Nigerian Capital Importation- Q4 2017
Capital Importation by Sector
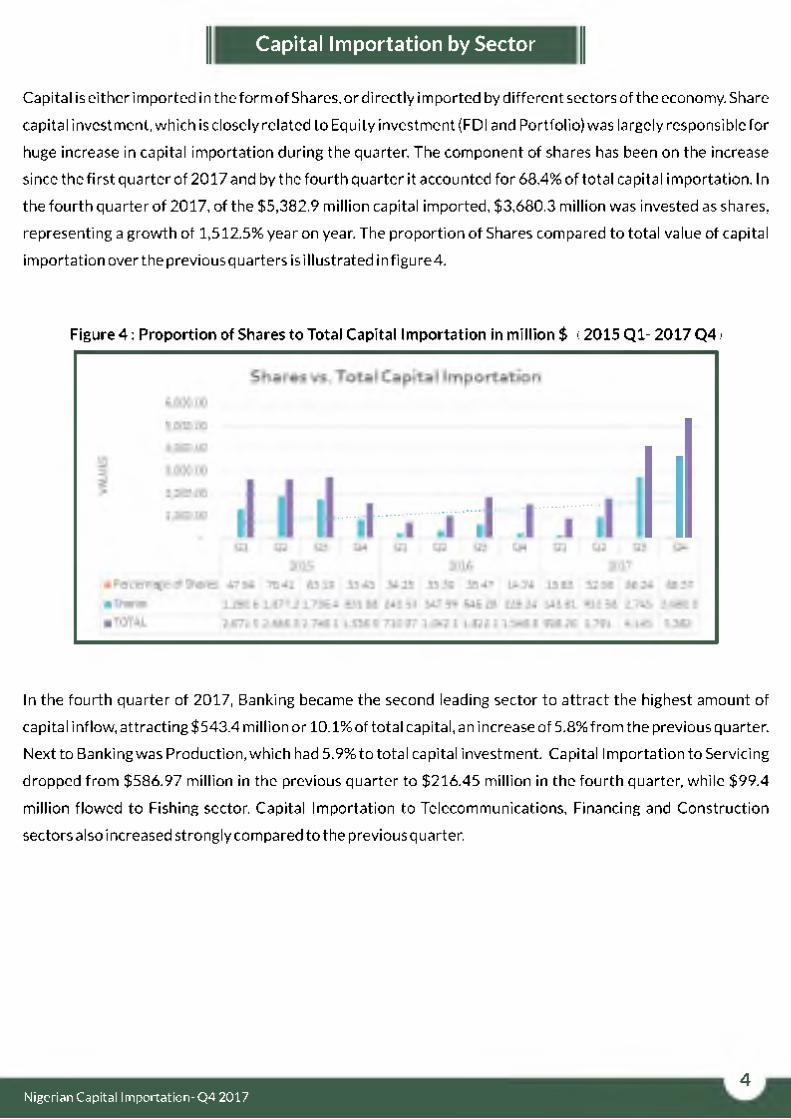
Capital is either imported in the form of Shares, or directly imported by different sectors of the economy. Share
capital investment, which is closely related to Equity investment (FDI and Portfolio) was largely responsible for
huge increase in capital importation during the quarter. The component of shares has been on the increase
since the first quarter of 2017 and by the fourth quarter it accounted for 68.4% of total capital importation. In
the fourth quarter of 2017, of the $5,382.9 million capital imported, $3,680.3 million was invested as shares,
representing a growth of 1,512.5% year on year. The proportion of Shares compared to total value of capital
importation over the previous quarters is illustrated in figure 4.
Figure 4 : Proportion of Shares to Total Capital Importation in million $ (2015 Q1- 2017 Q4)
In the fourth quarter of 2017, Banking became the second leading sector to attract the highest amount of
capital inflow, attracting $543.4 million or 10.1% of total capital, an increase of 5.8% from the previous quarter.
Next to Banking was Production, which had 5.9% to total capital investment. Capital Importation to Servicing
dropped from $586.97 million in the previous quarter to $216.45 million in the fourth quarter, while $99.4
million flowed to Fishing sector. Capital Importation to Telecommunications, Financing and Construction
sectors also increased strongly compared to the previous quarter.
4Nigerian Capital Importation- Q4 2017
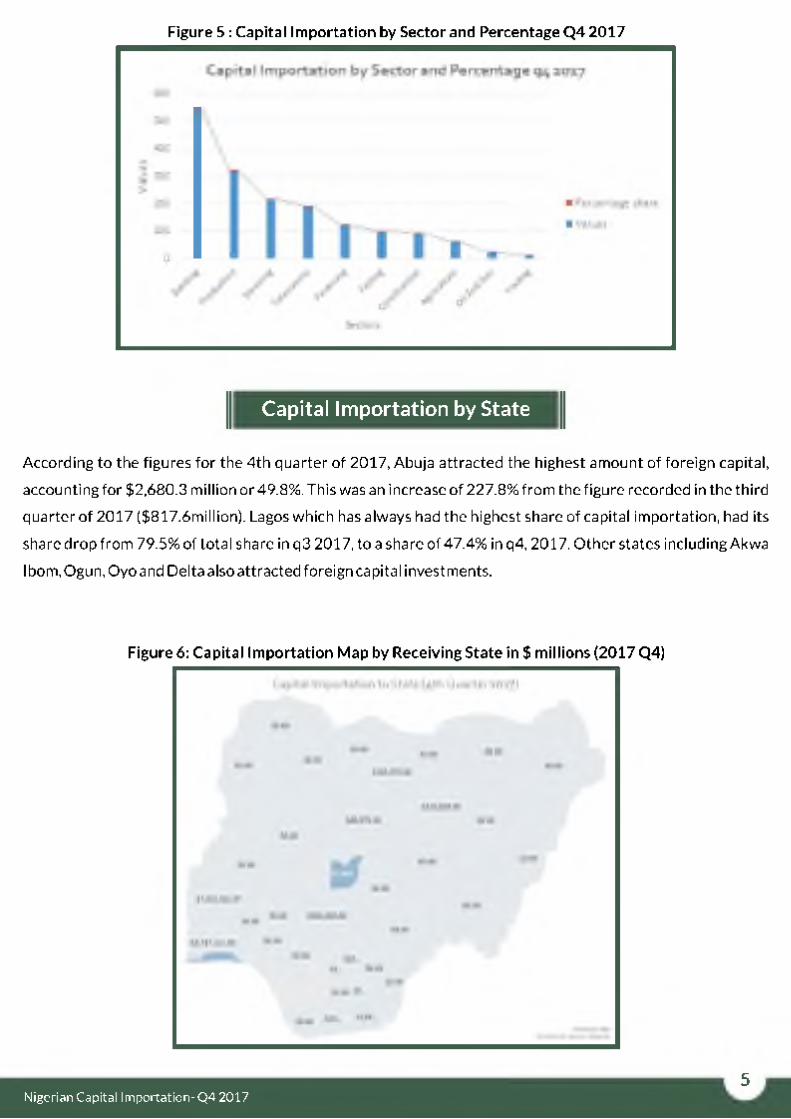
Figure 5 : Capital Importation by Sector and Percentage Q4 2017
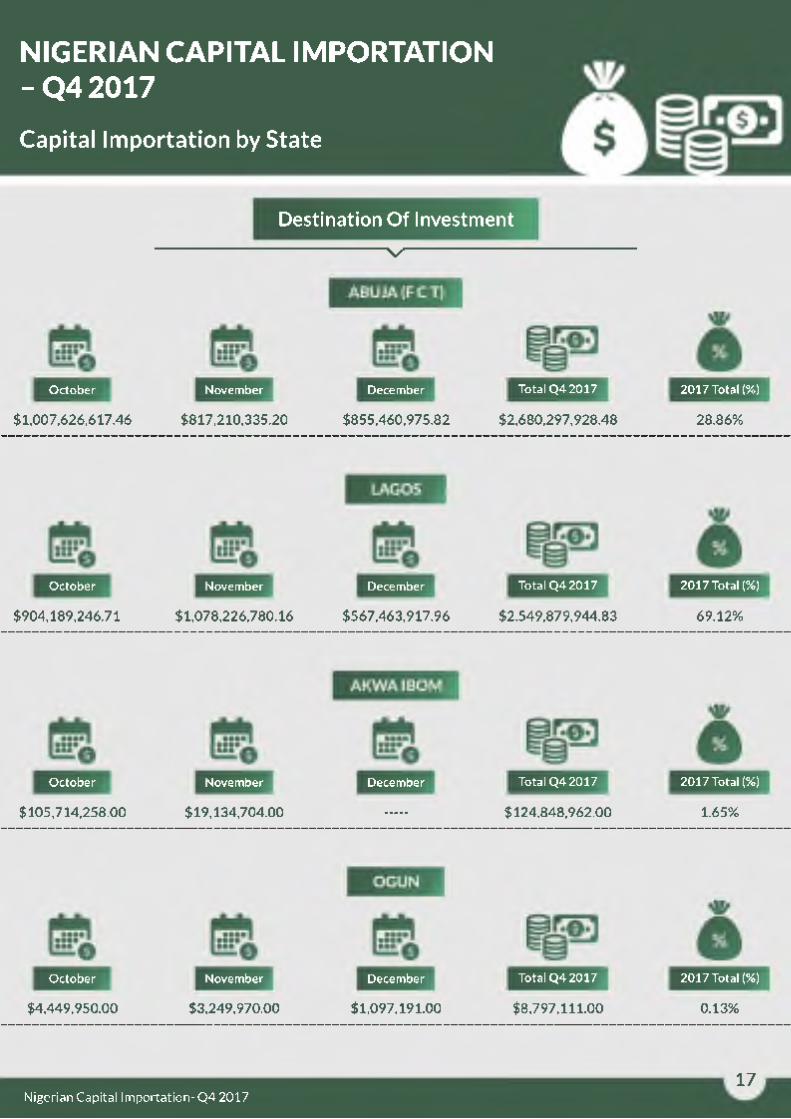
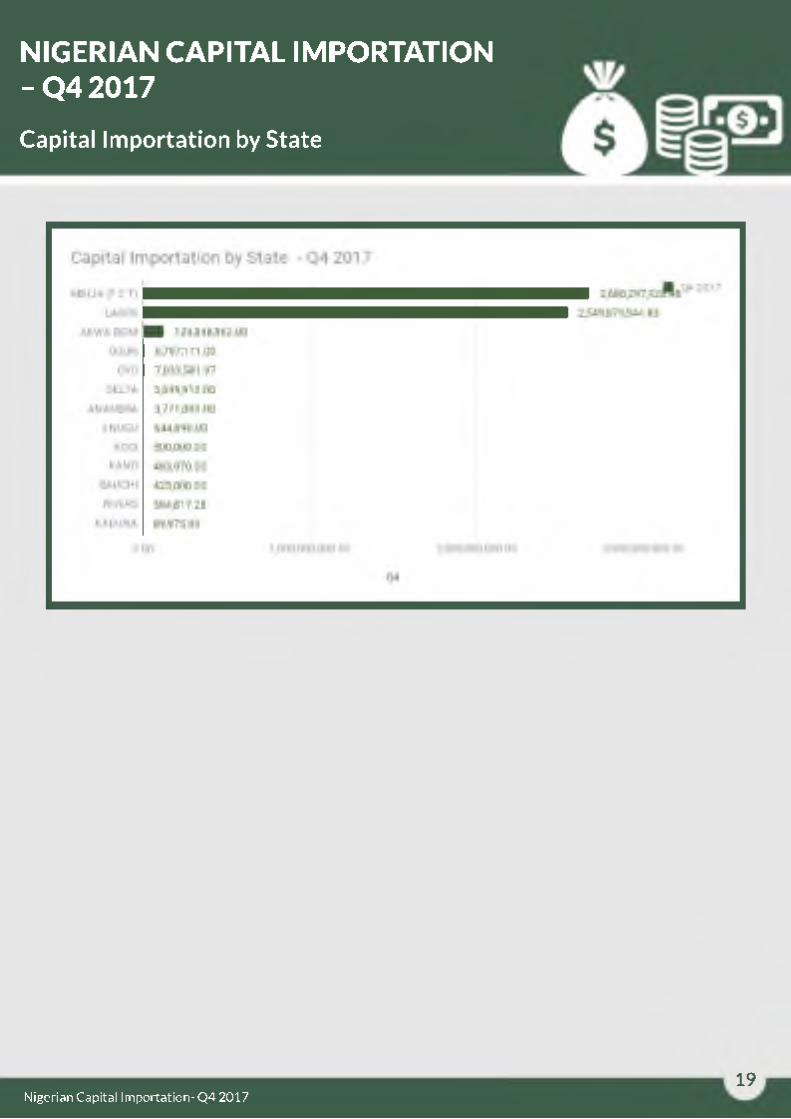
Capital Importation by State
According to the figures for the 4th quarter of 2017, Abuja attracted the highest amount of foreign capital,
accounting for $2,680.3 million or 49.8%. This was an increase of 227.8% from the figure recorded in the third
quarter of 2017 ($817.6million). Lagos which has always had the highest share of capital importation, had its
share drop from 79.5% of total share in q3 2017, to a share of 47.4% in q4, 2017. Other states including Akwa
Ibom, Ogun, Oyo and Delta also attracted foreign capital investments.
Figure 6: Capital Importation Map by Receiving State in $ millions (2017 Q4)
5Nigerian Capital Importation- Q4 2017
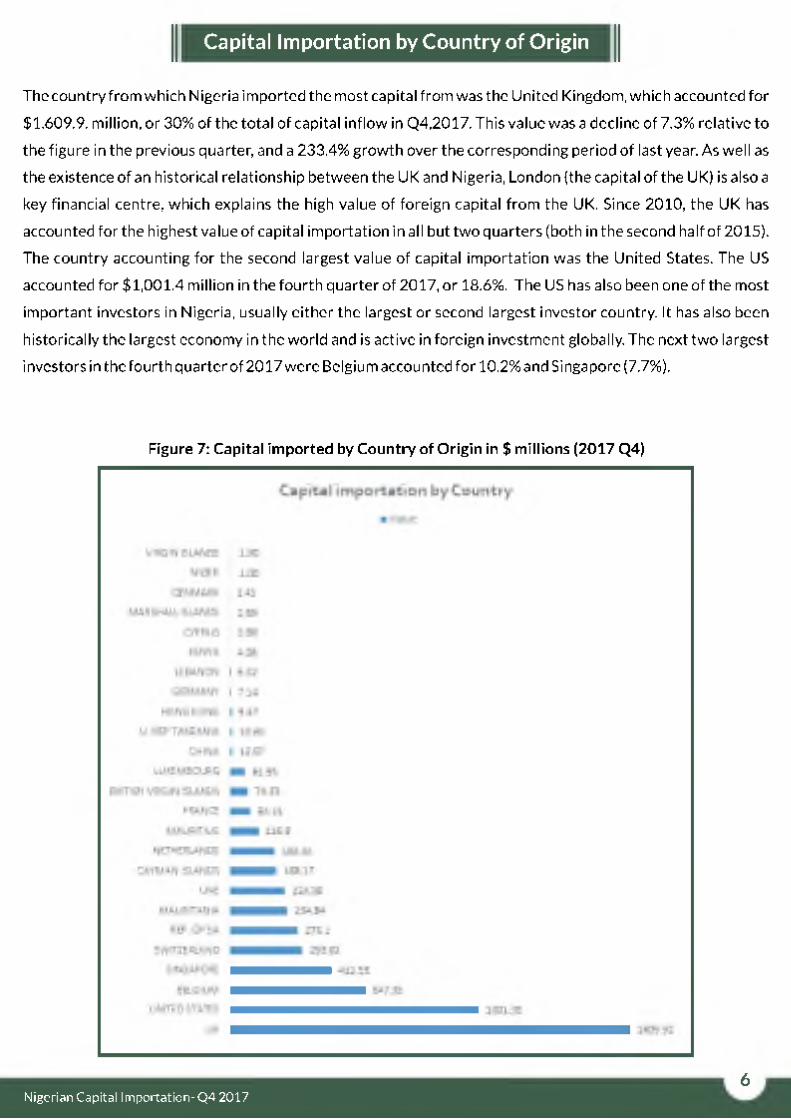
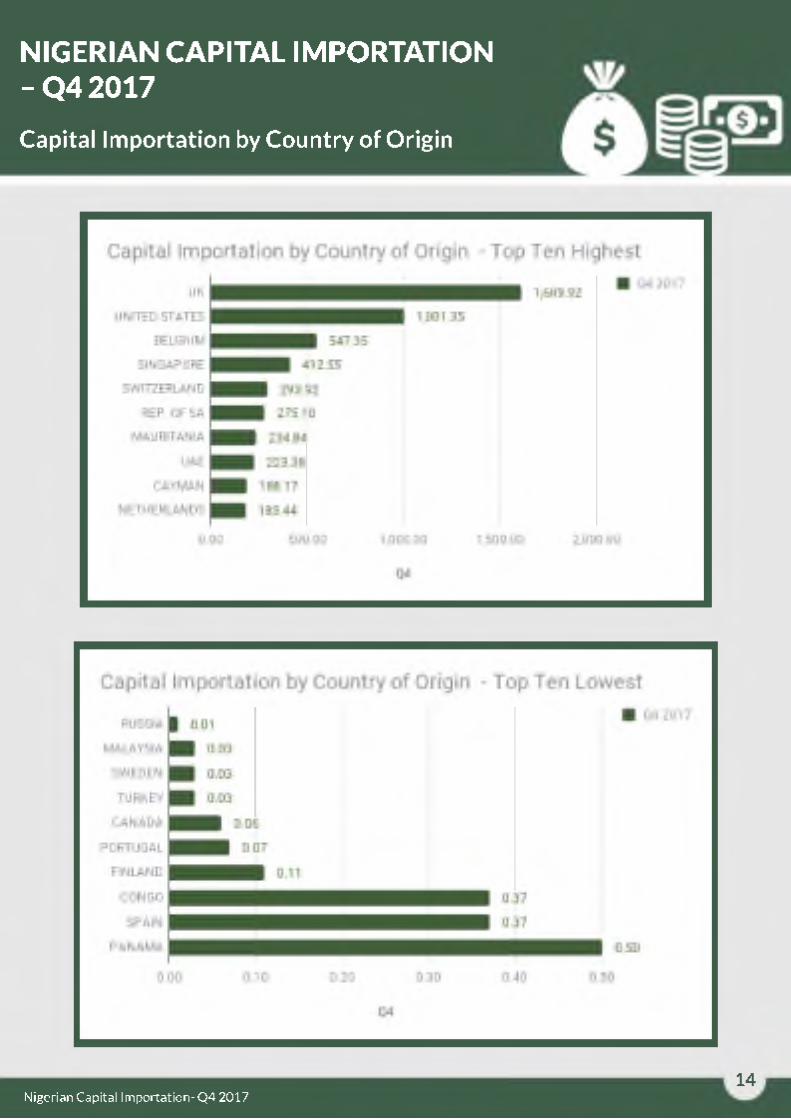
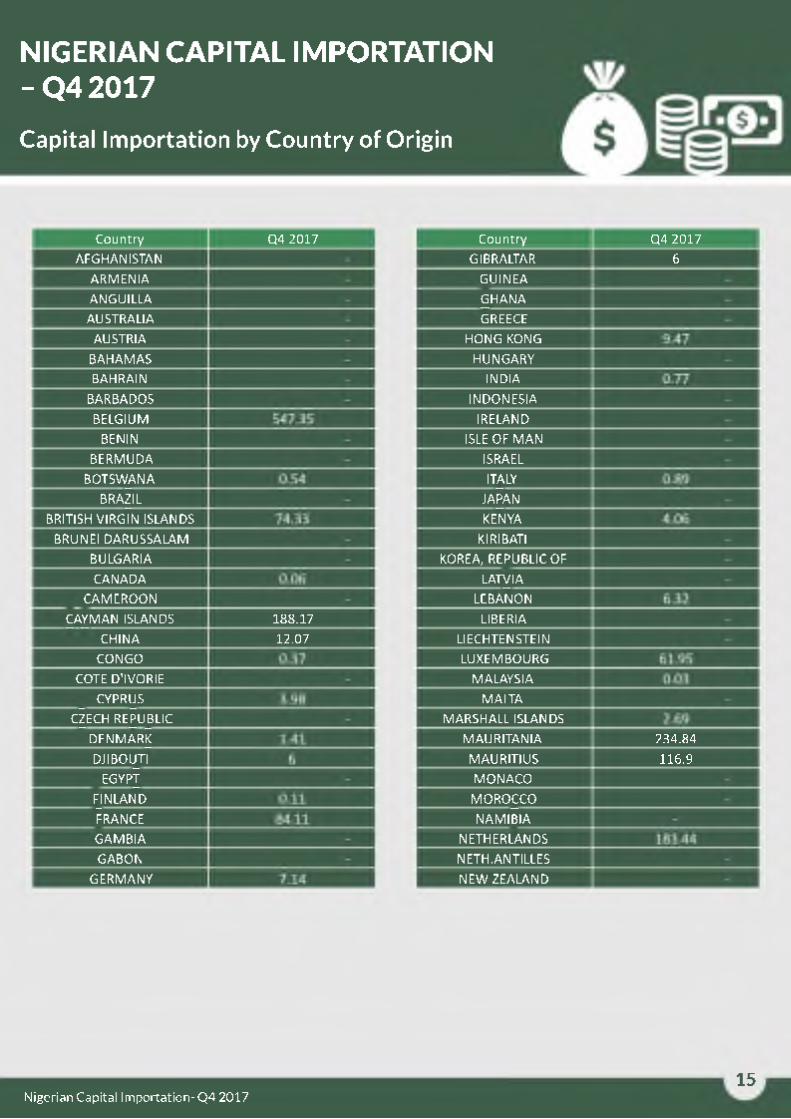
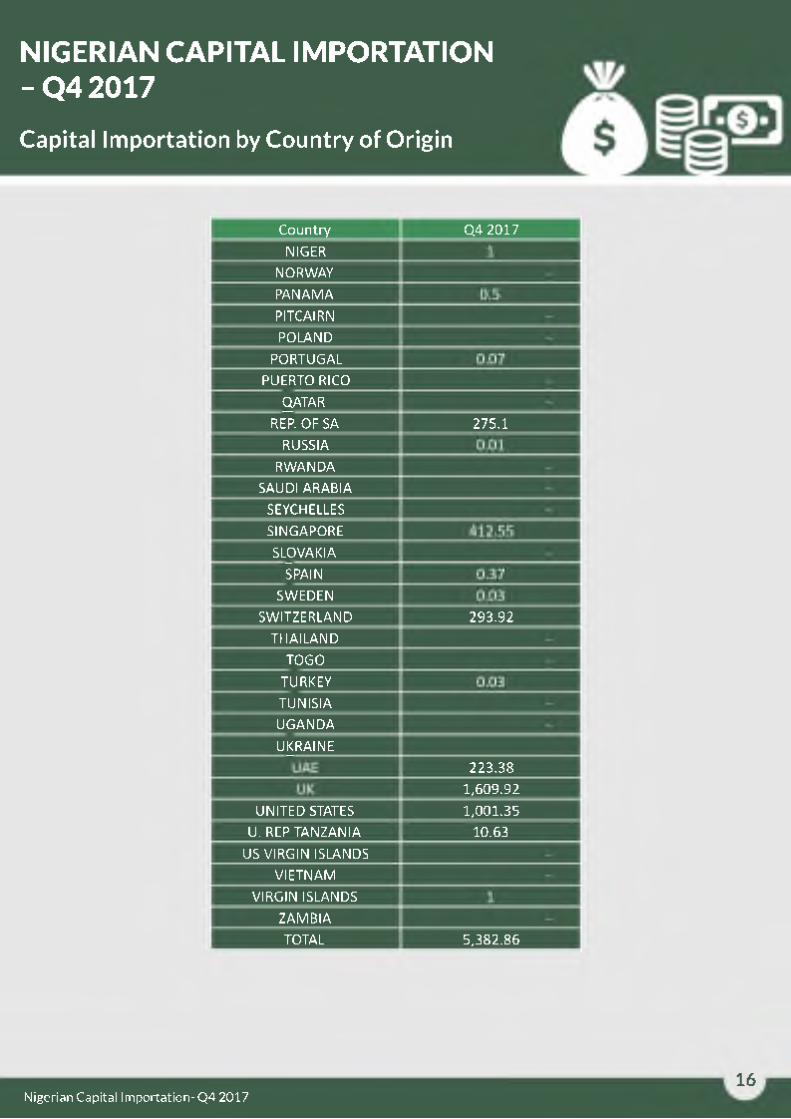
Capital Importation by Country of Origin
The country from which Nigeria imported the most capital from was the United Kingdom, which accounted for
$1,609.9. million, or 30% of the total of capital inflow in Q4,2017. This value was a decline of 7.3% relative to
the figure in the previous quarter, and a 233.4% growth over the corresponding period of last year. As well as
the existence of an historical relationship between the UK and Nigeria, London (the capital of the UK) is also a
key financial centre, which explains the high value of foreign capital from the UK. Since 2010, the UK has
accounted for the highest value of capital importation in all but two quarters (both in the second half of 2015).
The country accounting for the second largest value of capital importation was the United States. The US
accounted for $1,001.4 million in the fourth quarter of 2017, or 18.6%. The US has also been one of the most
important investors in Nigeria, usually either the largest or second largest investor country. It has also been
historically the largest economy in the world and is active in foreign investment globally. The next two largest
investors in the fourth quarter of 2017 were Belgium accounted for 10.2% and Singapore (7.7%).
Figure 7: Capital imported by Country of Origin in $ millions (2017 Q4)
6Nigerian Capital Importation- Q4 2017
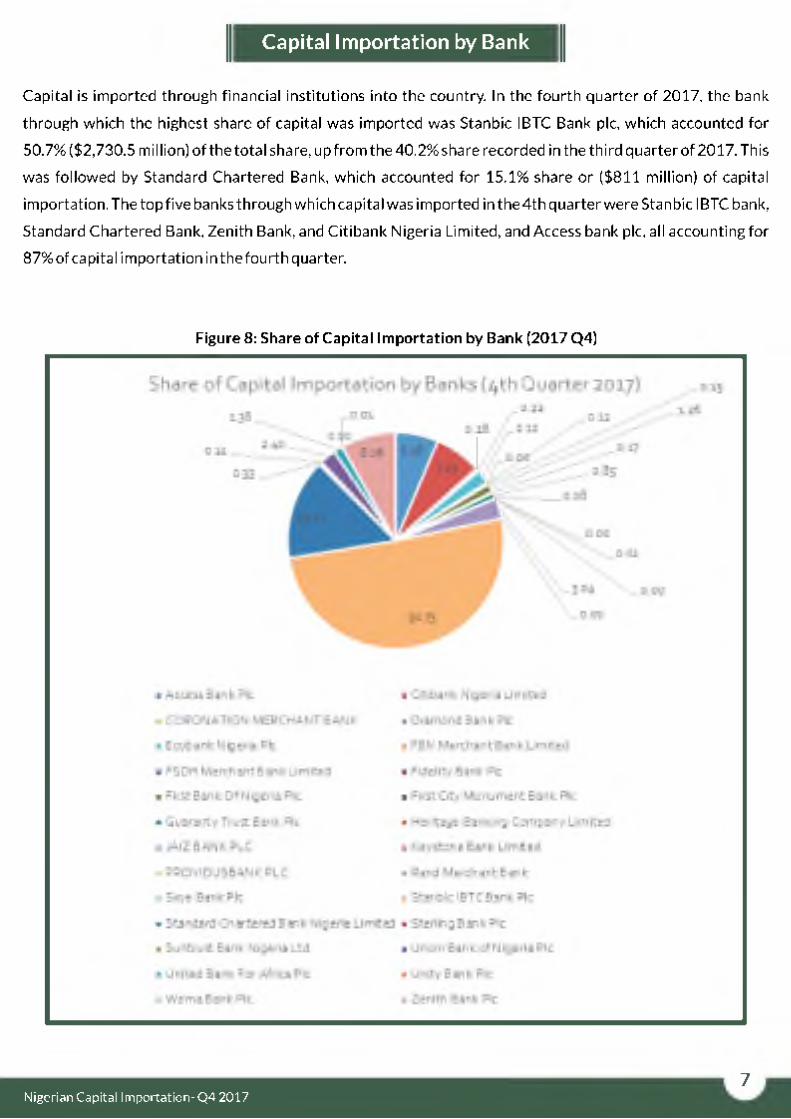
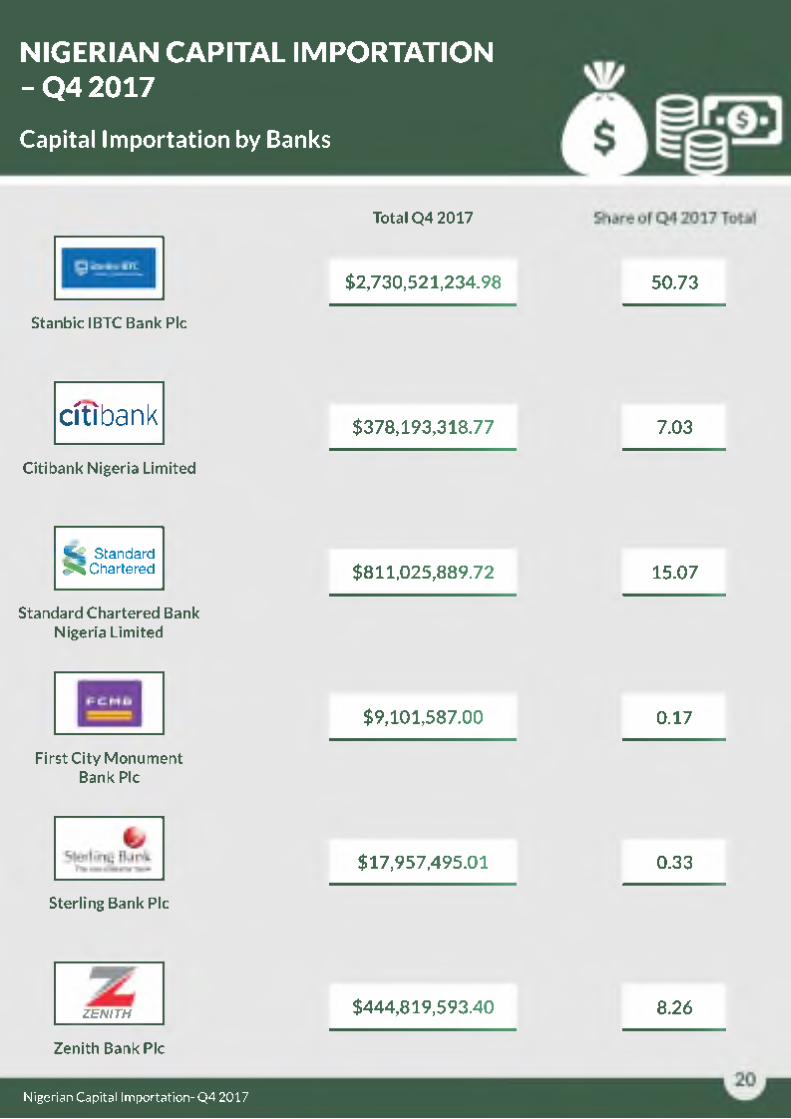
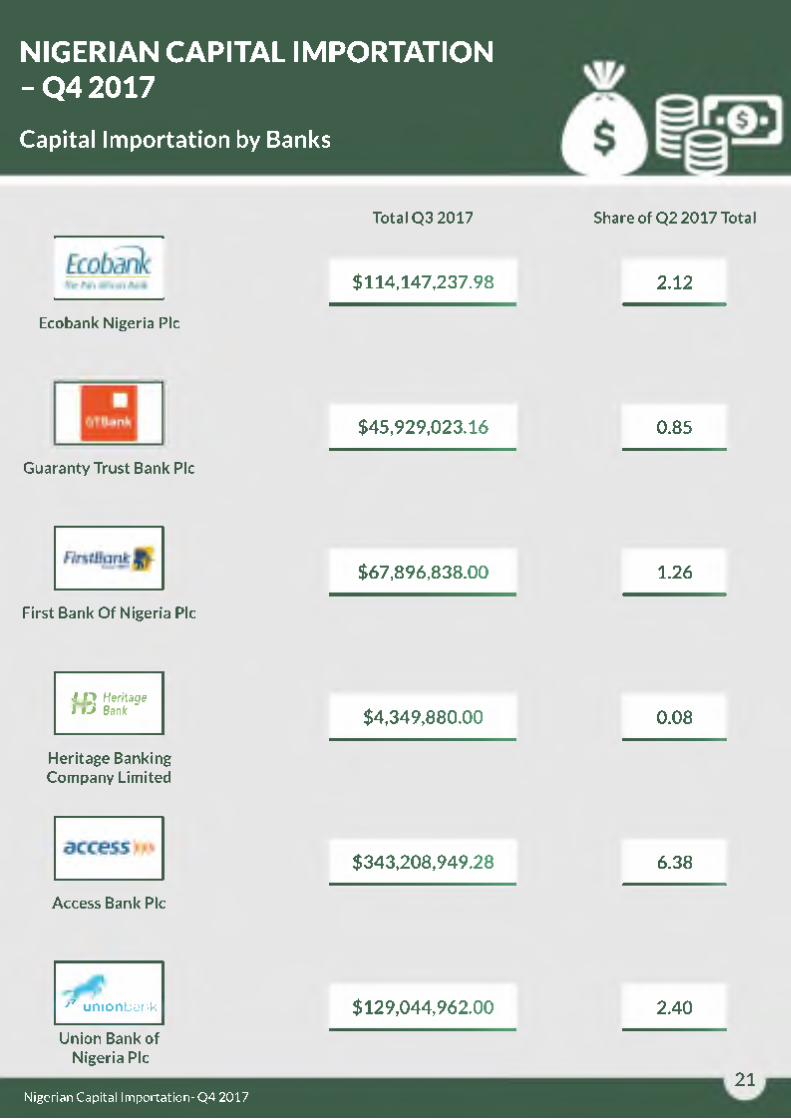
Capital Importation by Bank
Capital is imported through financial institutions into the country. In the fourth quarter of 2017, the bank
through which the highest share of capital was imported was Stanbic IBTC Bank plc, which accounted for
50.7% ($2,730.5 million) of the total share, up from the 40.2% share recorded in the third quarter of 2017. This
was followed by Standard Chartered Bank, which accounted for 15.1% share or ($811 million) of capital
importation. The top five banks through which capital was imported in the 4th quarter were Stanbic IBTC bank,
Standard Chartered Bank, Zenith Bank, and Citibank Nigeria Limited, and Access bank plc, all accounting for
87% of capital importation in the fourth quarter.
Figure 8: Share of Capital Importation by Bank (2017 Q4)
7Nigerian Capital Importation- Q4 2017
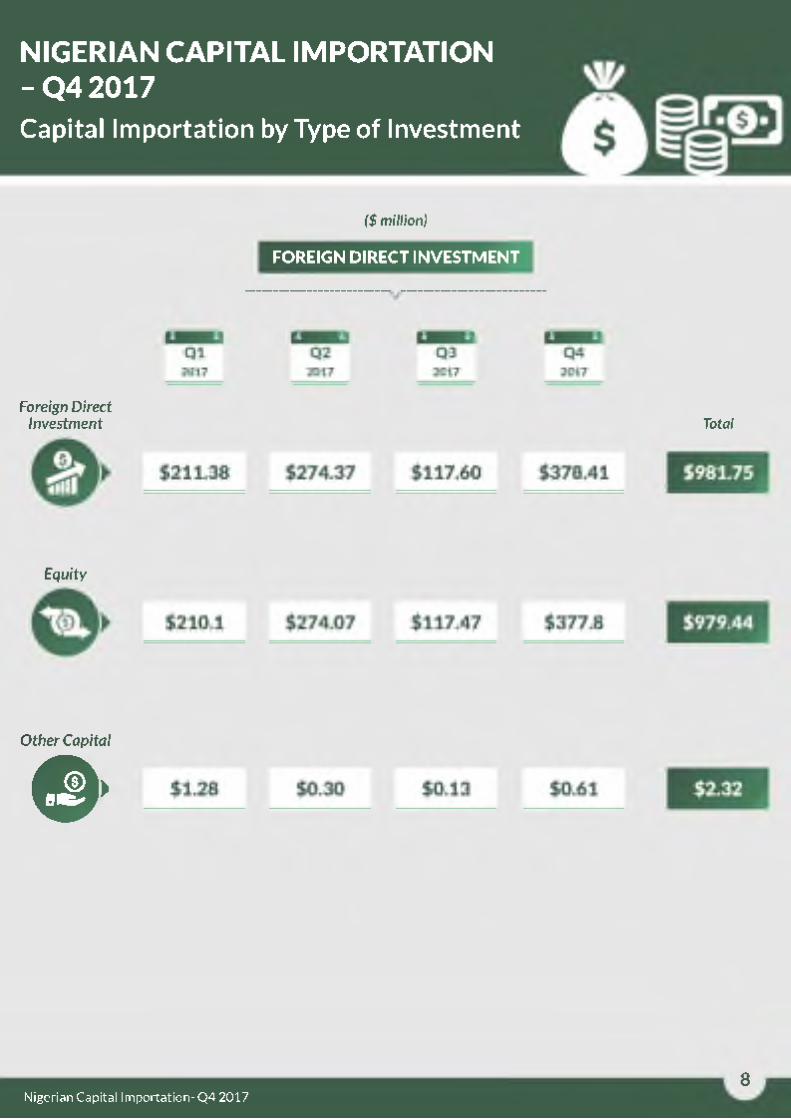
Capital Importation by Type of Investment
NIGERIAN CAPITAL IMPORTATION- Q4 2017
($ million)
FOREIGN DIRECT INVESTMENT
Foreign Direct Investment
Equity
Other Capital
0 »
Total
8Nigerian Capital Importation- Q4 2017
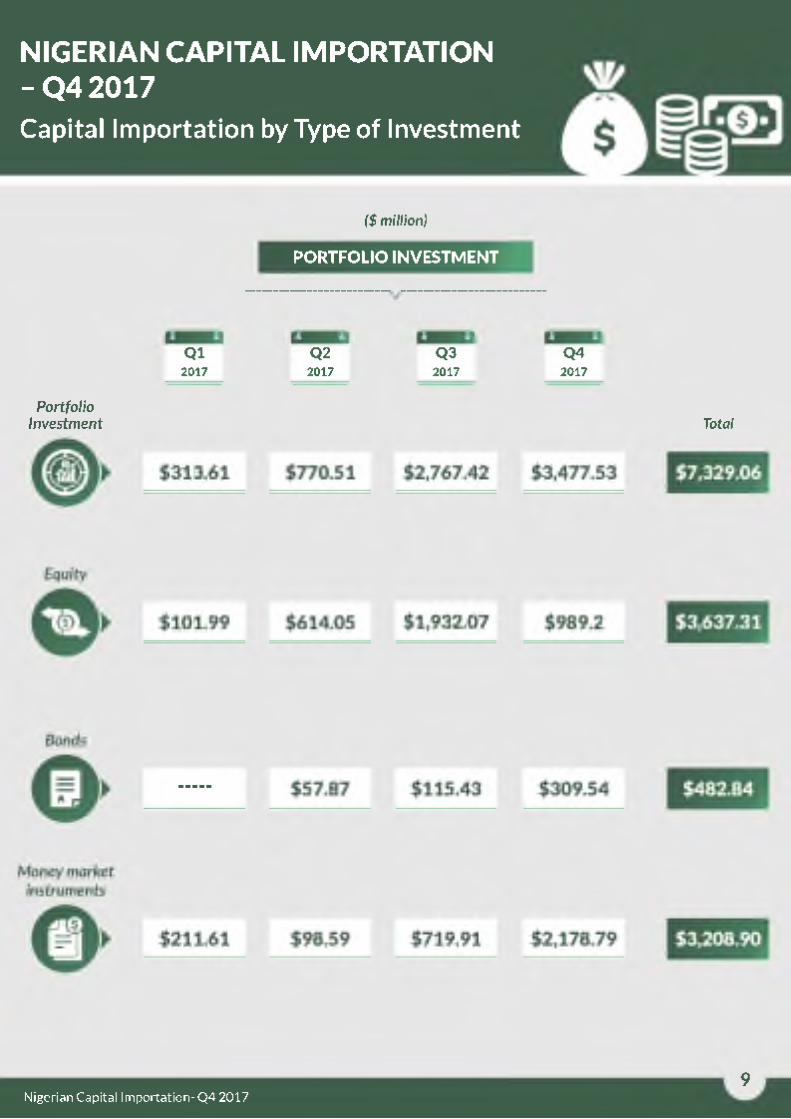
Capital Importation by Type of Investment
NIGERIAN CAPITAL IMPORTATION- Q4 2017
($ million)
PORTFOLIO INVESTMENT
Q l2017
Q22017
Q32017
Q42017
PortfolioInvestment Total
9Nigerian Capital Importation- Q4 2017
Capital Importation by Type of Investment
NIGERIAN CAPITAL IMPORTATION- Q4 2017
($ million)
OTHER INVESTMENT
Other Investment
Trade credits
Loans
Total
$383.28 $747.47 $1,260.08 $1,526.92 $3,917.75
10 00
$369.28 $747.47 $956.69 $1,091.20 $3,164.63
Currency deposits
$3 $0.52 0 $3.52
Other claims
$11 $302.88 $425.72 $739.60
10Nigerian Capital Importation- Q4 2017
Capital Importation by Type of Investment
NIGERIAN CAPITAL IMPORTATION- Q4 2017
($ million)
TOTAL
Q l Q2 Q3 Q42017 2017 2017 2017
Total
$908.27 $1,792.34 $4,145.10 $5,382.86 $12,228.57
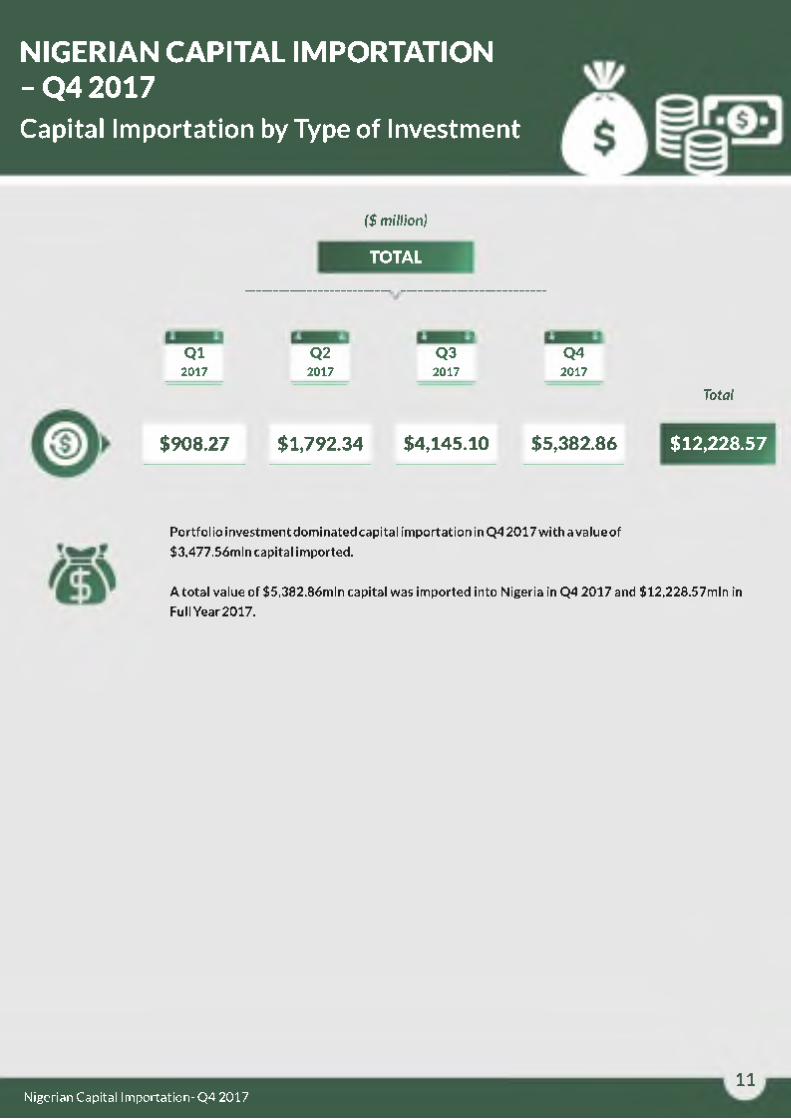
Portfolio investment dominated capital importation in Q4 2017with a value of
$3,477.56mln capital imported.
A total value of $5,382.86mln capital was imported into Nigeria in Q4 2017 and $12,228.57mln in
Full Year 2017.
11Nigerian Capital Importation- Q4 2017
Capital Importation by Sector
NIGERIAN CAPITAL IMPORTATION- Q4 2017
Q
0
($ million)
$3,680.34
Agriculture
$62.46
Banking
$543.37
Brewering
$2.3
Construction
$92.71
Consultancy
$2.06
Drilling
$0.3
©0 >
©© I
©>
©>© »
($ million)
Electrical
$5.1
Financing
$122.68
Fishing
$99.43
I T Services
$8.45
Marketing
$0.48
Oil And Gas
$23.83
Production
$317.82
0#
© I
0 '
($ million)
$216.45
Hotels
$0.03
Telecoms
$191.01
Tanning
$0.52
Trading
$12.96
Transport
$0.55
Weaving
$0
TOTAL
$5,382.85
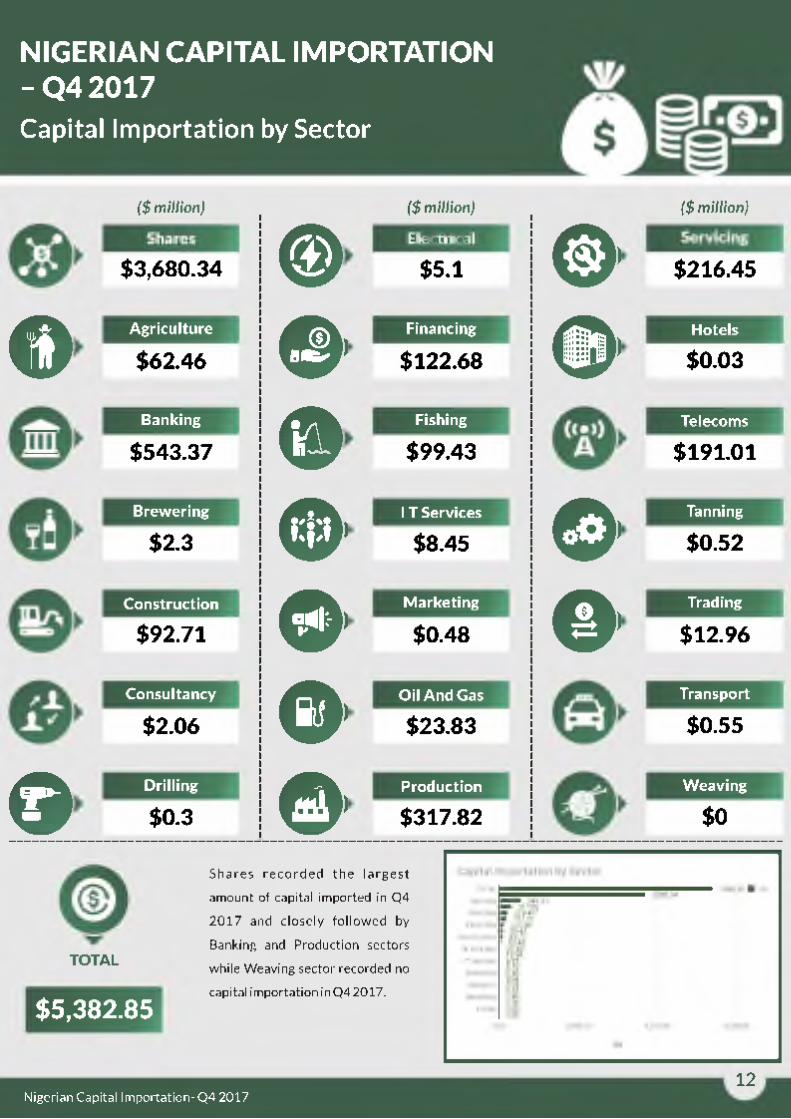
Shares recorded the largest
amount of capital imported in Q4 2017 and closely followed by
Banking and Production sectors
while Weaving sector recorded no
capital importation in Q4 2017.
12Nigerian Capital Importation- Q4 2017
Capital Importation by Country of Origin
NIGERIAN CAPITAL IMPORTATION- Q4 2017
Q O » ]
Top Ten Highest I I Top Ten Lowest
United Kingdom
United States
I I Belgium
Singapore
Switzerland
REP. OF SA
Mauritania
UAE
Cayman Islands
Netherlands
($ m illion)
$1,609.92
$1,001.35
$547.35
$412.55
$293.92
$275.1
$234.84
$223.38
$188.17
$183.44
RUSSIA
. = Malaysia
Sweden
Turkey
1 * 1 Canada
Portugal
Finland
Congo
Spain
Panama
($ million)
$0.01
$0.03
$0.03
$0.03
$0.06
$0.07
$0.11
$0.37
$0.37
$0.5
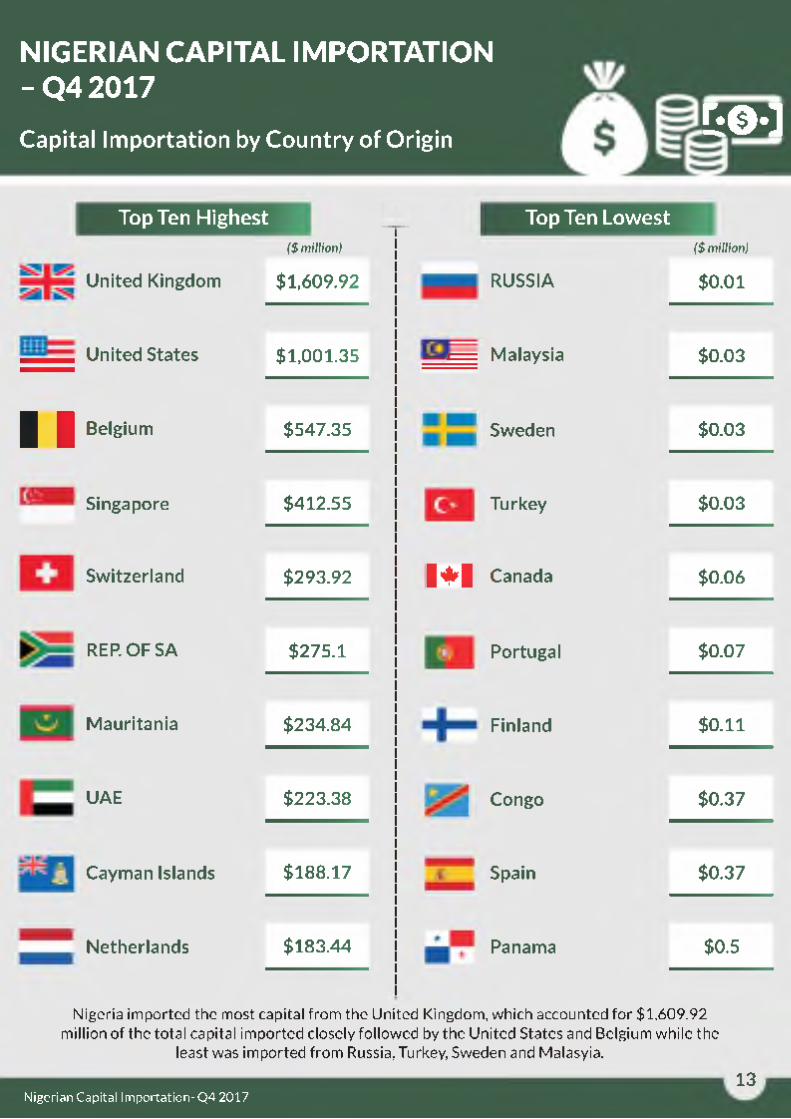
Nigeria imported the most capital from the United Kingdom, which accounted for $1,609.92 million of the total capital imported closely followed by the United States and Belgium while the
least was imported from Russia, Turkey, Sweden and Malasyia.
Nigerian Capital Importation- Q4 201713
Capital Importation by Country of Origin
NIGERIAN CAPITAL IMPORTATION- Q4 2017
14Nigerian Capital Importation- Q4 2017
Capital Importation by Country of Origin
NIGERIAN CAPITAL IMPORTATION- Q4 2017
CountryAFGHANISTAN
ARMENIAANGUILLA
AUSTRALIAAUSTRIA
BAHAMASBAHRAIN
BARBADOSBELGIUM
BENINBERMUDA
BOTSWANABRAZIL
BRITISH VIRGIN ISLANDSBRUNEI DARUSSALAM
BULGARIACANADA
CAMEROONCAYMAN ISLANDS
CHINACONGO
COTE D'IVORIECYPRUS
CZECH REPUBLICDENMARKDJIBOUTI
EGYPTFINLANDFRANCEGAMBIAGABON
GERMANY
Q4 2017
188.1712.07
CountryGIBRALTAR
GUINEAGHANAGREECE
HONG KONGHUNGARY
INDIAINDONESIA
IRELANDISLE OF MAN
ISRAEL
Q4 20176
JAPANKENYA
KIRIBATIKOREA, REPUBLIC OF
LATVIALEBANON
LIBERIALIECHTENSTEINLUXEMBOURG
MALAYSIAMALTA
MARSHALL ISLANDSMAURITANIA
MAURITIUSMONACO
MOROCCONAMIBIA
NETHERLANDSNETH.ANTILLESNEW ZEALAND
234.84116.9
ITALY
15Nigerian Capital Importation- Q4 2017
Capital Importation by Country of Origin
NIGERIAN CAPITAL IMPORTATION- Q4 2017
Country
NIGER
NORWAY
PANAMA
PITCAIRN
POLAND
PORTUGAL
PUERTO RICO
QATAR
REP. OF SA
RUSSIA
RWANDA
SAUDI ARABIA
SEYCHELLES
SINGAPORE
SLOVAKIA
SPAIN
SWEDEN
SWITZERLAND
THAILAND
TOGO
TURKEY
TUNISIA
UGANDA
UKRAINE
Q4 2017
UNITED STATES
U. REP TANZANIA
US VIRGIN ISLANDS
VIETNAM
VIRGIN ISLANDS
ZAMBIA
TOTAL
275.1
293.92
223.381,609.921,001.35
10.63
5,382.86
16Nigerian Capital Importation- Q4 2017
Capital Importation by State
NIGERIAN CAPITAL IMPORTATION- Q4 2017
Destination Of InvestmentN/"
October November December Total Q4 2017 2017 Total (%)
$1,007,626,617.46 $817,210,335.20 $855,460,975.82 $2,680,297,928.48 28.86%
October November December Total Q4 2017 2017 Total (%)
$904,189,246.71 $1,078,226,780.16 $567,463,917.96 $2,549,879,944.83 69.12%
October November December Total Q4 2017 2017 Total (%)
$105,714,258.00 $19,134,704.00 ----- $124,848,962.00 1.65%
October November December Total Q4 2017 2017 Total (%)
$4,449,950.00 $3,249,970.00 $1,097,191.00 $8,797,111.00 0.13%
17Nigerian Capital Importation- Q4 2017
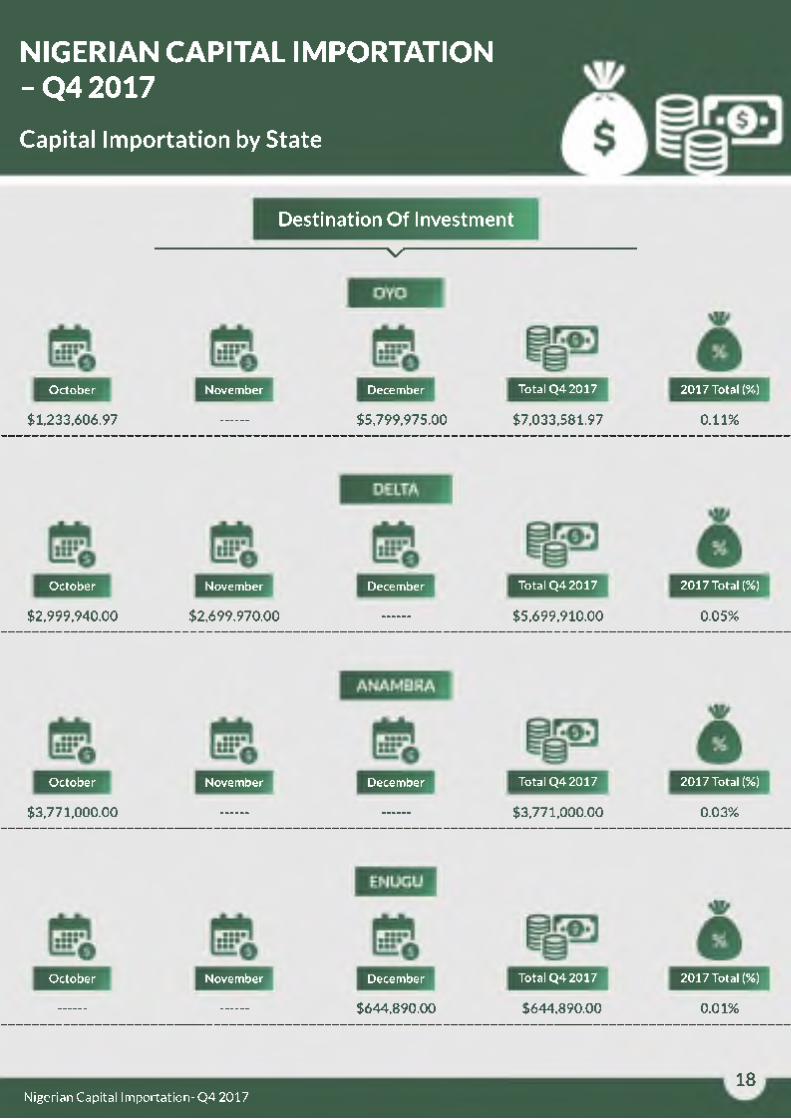
Capital Importation by State
NIGERIAN CAPITAL IMPORTATION- Q4 2017
Destination Of InvestmentN/"
October November December Total Q4 2017 2017 Total (%)
$1,233,606.97 $5,799,975.00 $7,033,581.97 0 .11%
October November December Total Q4 2017 2017 Total (%)
$2,999,940.00 $2,699,970.00 $5,699,910.00 0.05%
October November December Total Q4 2017 2017 Total (%)
$3,771,000.00 $3,771,000.00 0.03%
October November December Total Q4 2017 2017 Total (%)
$644,890.00 $644,890.00 0.01%
18Nigerian Capital Importation- Q4 2017
Capital Importation by State
NIGERIAN CAPITAL IMPORTATION- Q4 2017
19Nigerian Capital Importation- Q4 2017
Capital Importation by Banks
NIGERIAN CAPITAL IMPORTATION- Q4 2017
Stanbic IBTC Bank Plc
Total Q4 2017
$2,730,521,234.98 50.73
citibankCitibank Nigeria Limited
$378,193,318.77 7.03
W Standard 5 ^ Chartered
Standard Chartered Bank Nigeria Limited
$811,025,889.72 15.07
First City Monument Bank Plc
$9,101,587.00 0.17
Sterling Bank Plc
$17,957,495.01 0.33
ZENITH
Zenith Bank Plc
$444,819,593.40 8.26
Nigerian Capital Importation- Q4 2017
Capital Importation by Banks
NIGERIAN CAPITAL IMPORTATION- Q4 2017
Ecobank Nigeria Plc
Guaranty Trust Bank Plc
Total Q3 2017 Share of Q2 2017 Total
$114,147,237.98 2.12
$45,929,023.16 0.85
First Bank Of Nigeria Plc
$67,896,838.00 1.26
J I I Heritage I i J Bank
Heritage Banking Company Limited
Access Bank Plc
$4,349,880.00 0.08
$343,208,949.28 6.38
* * umonbank
Union Bank of Nigeria Plc
$129,044,962.00 2.40
21Nigerian Capital Importation- Q4 2017
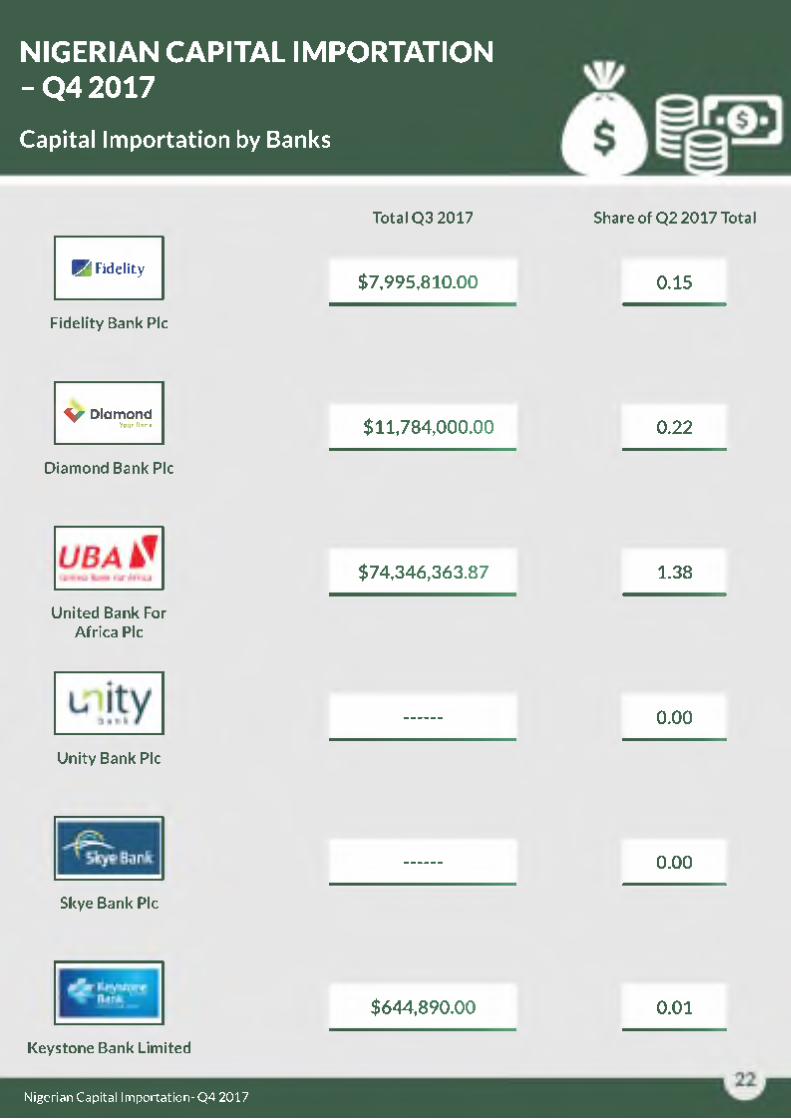
Capital Importation by Banks
NIGERIAN CAPITAL IMPORTATION- Q4 2017
H Fidelity
Fidelity Bank Plc
Total Q3 2017 Share of Q2 2017 Total
$7,995,810.00 0.15
^ DiamondYour Bank
Diamond Bank Plc
$11,784,000.00 0.22
United Bank For Africa Plc
$74,346,363.87 1.38
Unity Bank Plc
0.00
Skye Bank Plc
0.00
Keystone Bank Limited
Nigerian Capital Importation- Q4 2017
$644,890.00 0.01
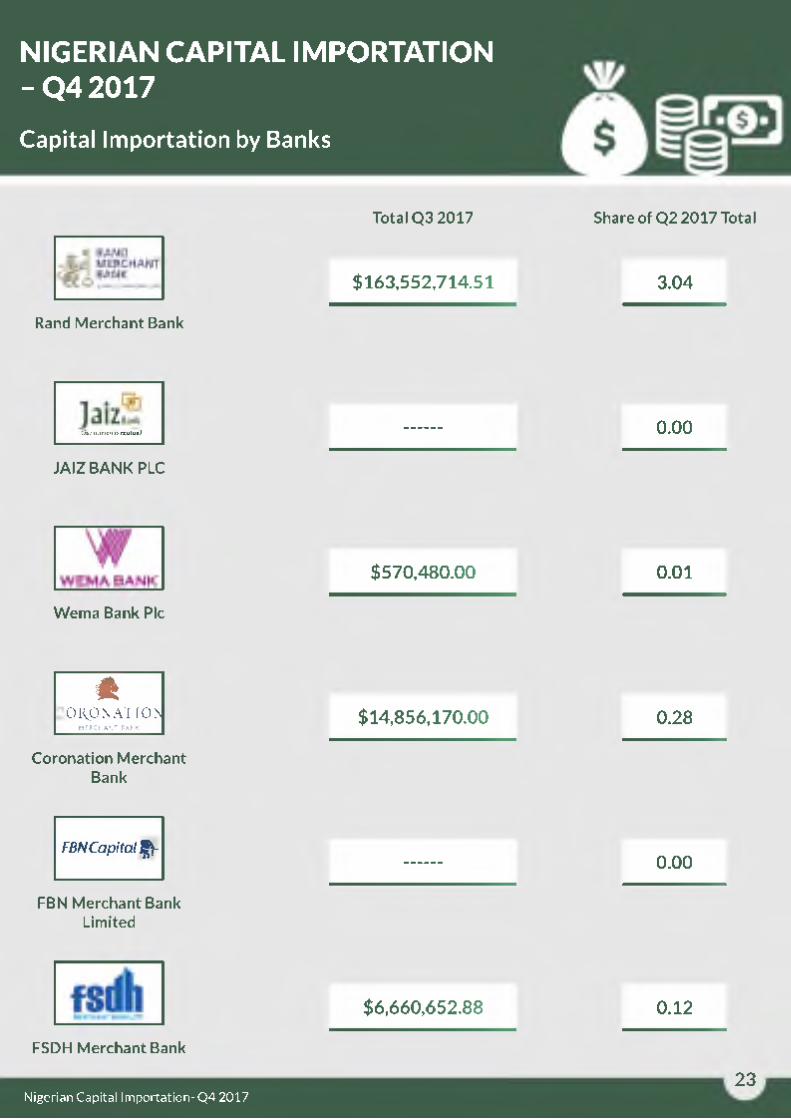
Capital Importation by Banks
NIGERIAN CAPITAL IMPORTATION- Q4 2017
Total Q3 2017 Share of Q2 2017 Total
Rand Merchant Bank
$163,552,714.51 3.04
Our interest« mutual
JA IZ BANK PLC
0.00
$570,480.00 0.01
Wema Bank Plc
f tO Z O N A T IO N
M ER C H A N T BANK
Coronation Merchant Bank
$14,856,170.00 0.28
F BN Capital ÇV
FBN Merchant Bank Limited
0.00
FSDH Merchant Bank
$6,660,652.88 0.12
23Nigerian Capital Importation- Q4 2017
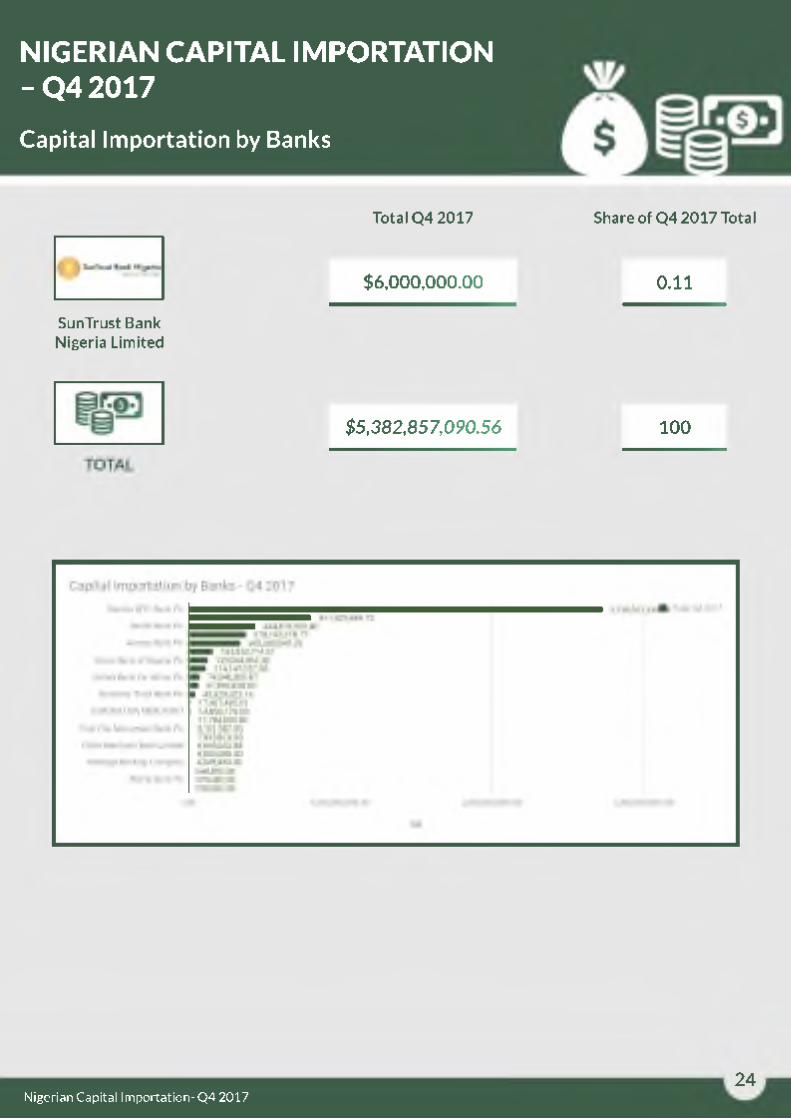
Capital Importation by Banks
NIGERIAN CAPITAL IMPORTATION- Q4 2017
SunTrust Bank Nigeria Limited
Total Q4 2017 Share of Q4 2017 Total
$6,000,000.00 0.11
$5,382,857,090.56 100
24Nigerian Capital Importation- Q4 2017
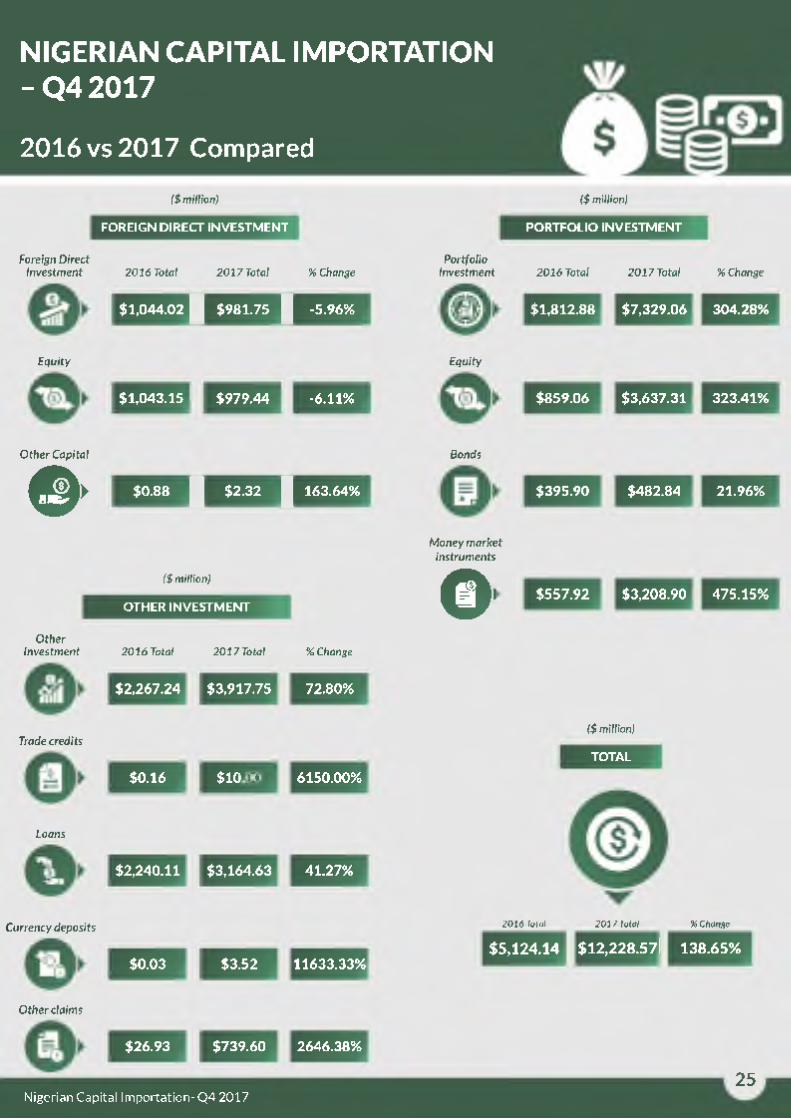
2016 vs 2017 Compared
NIGERIAN CAPITAL IMPORTATION- Q4 2017
($ million) ($ million)
Foreign Direct Investment
Equity
Other Capital
0 >
FOREIGN DIRECT INVESTMENT
2016 Total 2017 Total % Change
PORTFOLIO INVESTMENT
$1,044.02 1 $981.75 1 -5.96%
$1,043.15 $979.44 -6.11%
$0.88 1 $2.32 1 163.64%
($ million)
OTHER INVESTMENT
OtherInvestment
Trade credits
Loans
Currency deposits
Other claims
2016 Total 2017 Total % Change
$2,267.24 $3,917.75 72.80%
$0.16 .00 6150.00%
$2,240.11 $3,164.63 41.27%
$0.03 $3.52 11633.33%
$26.93 $739.60 2646.38%
PortfolioInvestment
Equity
Bonds
Money market instruments
O '
2016 Total 2017 Total % Change
$1,812.88 $7,329.06 304.28%
$859.06 $3,637.31 323.41%
$395.90 $482.84 21.96%
$557.92 $3,208.90 475.15%
($ million)
TOTAL
2016 Total 2017 Total % Change
$5,124.14 $12,228.57I 138.65%
25
$10
Nigerian Capital Importation- Q4 2017
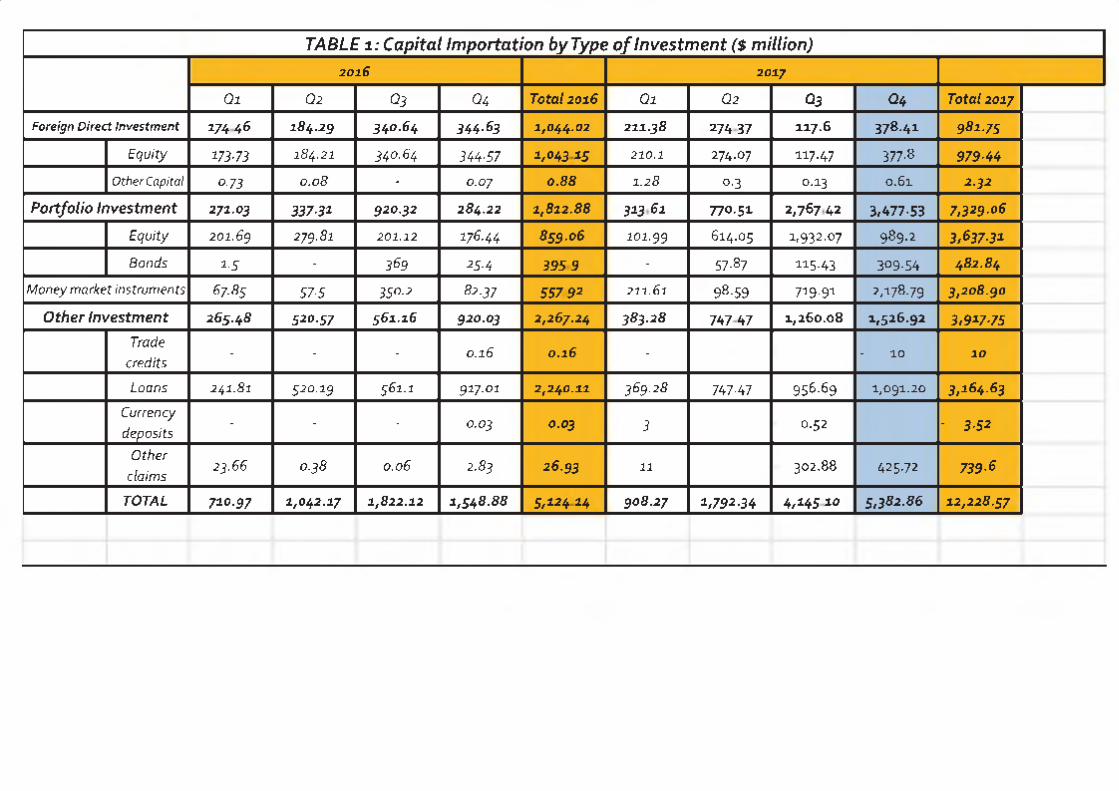
TABLE 1 : Capital Importation by Type of Investment ($ million)2016 2017
Q1 Q2 Q3 Q4 Total 2016 Q1 Q2 Q3 Q4 Total 2017
Foreign Direct Investment 1 74 4 6 184.29 340.64 344.63 1,044.02 211.38 274 37 117.6 378.41 981.75
Equity 173.73 184.21 340.64 344.57 1,04 3 15 210.1 274.07 117.47 377.8 979.44
O ther Capital 07 3 0.08 - 0.07 0.88 1.28 0.3 0.13 0.61 2.32
P ortfolio In vestm en t 271.03 337.31 920.32 284.22 1,812.88 3 1 3 6 1 770.51 2,76742 3,477.53 7,329.06
Equity 201.69 279.81 201.12 176.44 859.06 101.99 614.05 1,932.07 989.2 3,637.31
Bonds 1.5 - 3 69 25.4 3 9 5 9 - 57.87 115.43 309.54 482.84
Money market instruments 67.85 57.5 350.2 82.37 5 5 7 9 2 211.61 98.59 719.91 2,178.79 3,208.90
O th er In vestm en t 265.48 520.57 561.16 920.03 2,267.24 383.28 747 47 1,260.08 1,526.92 3,917.75
Trade
credits- - - 0.16 0.16 - - 10 10
Loans 241.81 520.19 561.1 917.01 2,240.11 369.28 747.47 956.69 1,091.20 3,164.63
Currency
deposits- - - 0.03 0.03 3 0.52 - 3.52
O ther
claim s23.66 0.38 0.06 2.83 26.93 11 302.88 425.72 739.6
TOTAL 710.97 1,042.17 1,822.12 1,548.88 5,12 4 14 908.27 1,792.34 4 ,14 510 5,382.86 12,228.57

T A B LE 2: C a pita l Im porta tion b y S ecto r/N a tu re o f B u sin ess ($ m illion)
2016 2017
Q i Q2 Q3 Q4Total
2016Q1 Q2 Q3 Q4
Total
2017
S h a re s 2 4 3-5 3 3 4 7 .9 9 6 4 6 .2 8 2 2 8 .2 4 1,46 6 .04 1 4 3 .8 1 9 3 2 .5 8 2 ,74 5 .79 3,680.34 10,104.49
A g ric u ltu re 0.2 1 10 .9 1 0 .3 7 2 2 .47 3 0 2 3.71 4 2 .8 9 62.46 19 5.6 5
B a n k in g 1 0 7 .5 8 1 0 8 .1 1 5 5 5 .5 2 1 6 1 .3 9 32.51 1 2 6 8 9 .8 1 77.9 4 543 37 1,078 .8 6
B re w e rin g 1 1 .6 4 1 1 .3 2 5 .6 3 2 5 .6 7 54 .2 6 1 6 .0 6 4 .8 3 4 2.3 19.9 6
C o n stru ctio i 1 0 .1 6 1 4 .9 5 3 .6 2 3 .7 5 3 2 .4 8 1 .5 7 1 .71 2 .3 6 92.71 100.8 5
C on sultan cy 0.14 0.2 2.14 0.4 4 2.92 4 .8 9 4.2 2.52 2.06 15.5
D rillin g - 0.4 1 0 .0 5 0 0.46 - 1.2 1 0.3 0.3 3.32
E le c tric a l 7 0 .1 5 1 2 .8 4 1 8 .6 5 23.72 125.36 1.1 6 .3 8 2 6 .34 5.1 70 .55
F in a n cin g 4 2 .5 7 1 .0 8 3 6 .5 6 1 5 .13 9 5.34 8 8 .6 5 5 7 .3 1 4 9 .9 1 122.68 337.1 2
F ish in g - 3 1 2 6 1 - - 99 43 99 .43
I T S e rv ic e s 1.02 0.63 0.03 0.0 4 1.72 0 .4 9 6 .2 8 1 2 5 8.45 23.51
M a rk e tin g 0.2 - - 0 .6 0.8 1.31 0 .0 9 0 .7 8 0.48 2.23
O il a n d G as 2 0 .8 3 2 0 0 .3 9 1 71 .6 3 3 2 7 .3 720.15 1 0 1 .0 8 1 9 0 .3 9 1 6 .0 7 23.83 436.73
P ro d u ctio n 7 7 .7 7 8 9 .4 2 6 8 .2 5 6 7.2 1 30 2 .6 5 7 9 .3 2 1 4 1 .4 2 4 4 2 .9 317.82 1,48 6 .44
S e rv ic in g 5 5 .0 5 1 1 9 .7 5 3 6 .5 5 8 7 .5 6 298.91 1 4 6 .0 5 1 4 5 .5 6 5 8 6 .9 7 216.45 1,681.52
H o te ls 0 .7 5 - - - 0.75 - 0 .1 7 - 0.03 0.38
T eleco m s 13.44 1 1 8 .71 2 4 4 .8 5 5 4 .2 5 931.2 1 4 5 .7 8 1 7 4 .1 8 3 3 .6 3 191.01 606.63
T a n n in g - - - - 0 - - - 0.52 0.52
T ra d in g 5 5 .0 8 1 2 .3 7 1 8 .9 5 3 8 .5 2 124.92 18 .72 1 2 .5 3 1 1 .4 5 12.96 60.91
T ra n sp o rt 0 .8 6 - 1 .5 5 2 .7 6 5 .1 7 2 .4 3 - - 0.55 0.55
W ea vin g - - - - 0 - - - 0 0
TOTAL 7 1 0 .9 7 1,042.17 1,822.12 1,54 8 .8 8 5,124.14 9 0 8 .26 1,79 2.34 4 ,145.10 5 ,3 8 2 .8 5 12,228.55
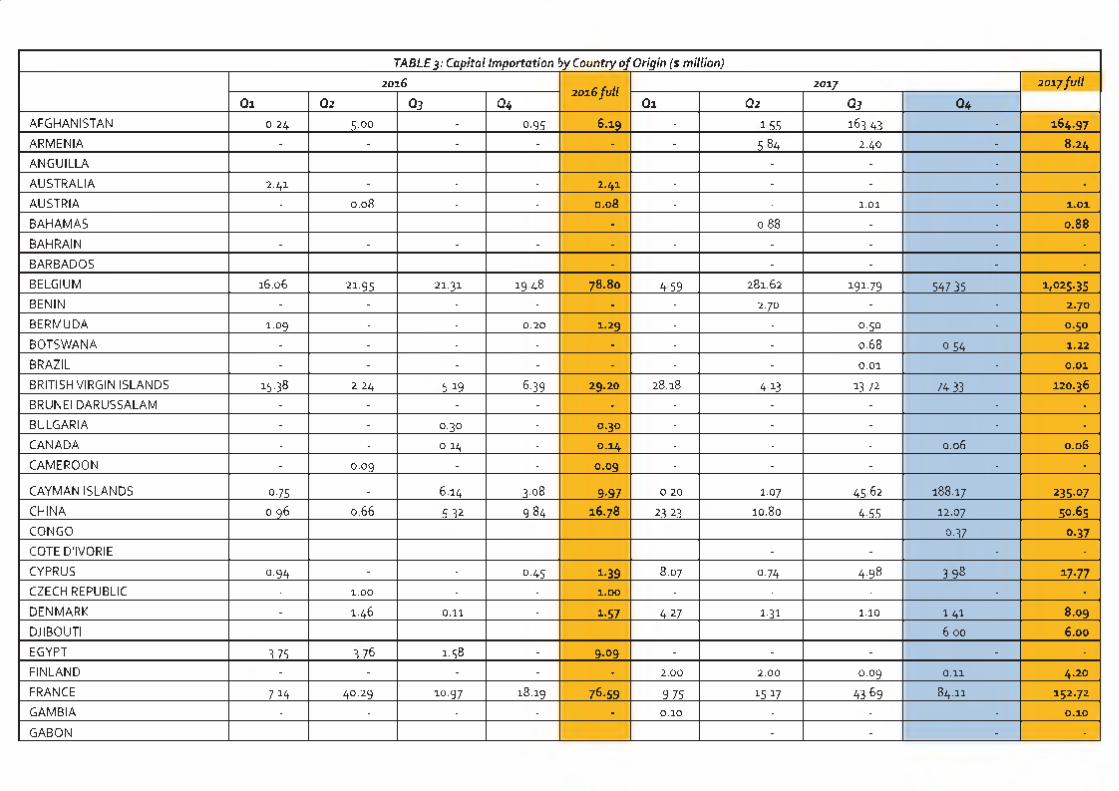
TABLE3: Capital Importation.iy Country of Origin ($ million)2016
2016 full2017 2017 full
Qi Q2 Q3 Q4 Qi Q2 Q3 Q4AFGHANISTAN 0.24 5.00 - 0.95 6.19 - 155 16343 - 164.97ARMENIA - - - - - - 584 2.40 - 8.24
ANGUILLA - - -
AUSTRALIA 2.41 - - - 2.41 - - - - -
AUSTRIA - 0.08 - - 0.08 - - 1.01 - 1.01
BAHAMAS - 0.88 - - 0.88BAHRAIN - - - - - - - - - -
BARBADOS - - - - -
BELGIUM 16.06 21.95 21.31 1948 78.80 459 281.6 2 191.79 54735 1,025.35
BENIN - - - - - - 2.70 - - 2.70BERMUDA 1.09 - - 0.20 1.29 - - 0.50 - 0.50BOTSWANA - - - - - - - 0.68 0.54 1.22
BRAZIL - - - - - - - 0.0 1 - 0.01
BRITISH VIRG IN ISLANDS 15.38 2.24 5 1 9 6.39 29.20 28.18 413 13.72 7433 120.36BRUNEI DARUSSALAM - - - - - - - - - -
BULGARIA - - 0.3 0 - 0.30 - - - - -
CANADA - - 0.14 - 0.14 - - - 0.06 0.06CAMEROON - 0.09 - - 0.09 - - - - -
CAYMAN ISLANDS 0.75 - 6.1 4 3.08 9-97 0.20 1.07 45 62 188.17 235.07CHINA 0.96 0.66 532 984 16.78 2323 10.80 4.55 12.07 50.65
CONGO 0.37 0.37COTE D'IVORIE - - - -
CYPRUS 0.94 - - 0.45 1.39 8.07 0.74 4.9 8 398 17.77CZECH REPUBLIC - 1.00 - - 1.00 - - - - -
DENMARK - 1.46 0.1 1 - 1.57 4 27 1.31 1.10 1.41 8.09DJIBOUTI 6.00 6.00EGYPT 375 3 76 1.58 - 9.09 - - - - -
FINLAND - - - - - 2.00 2.00 0.0 9 0.11 4.20FRANCE 714 40.29 10.97 18.19 76.59 975 1517 43 69 8 4.11 152.72GAMBIA - - - - - 0.10 - - - 0.10
GABON - - - -
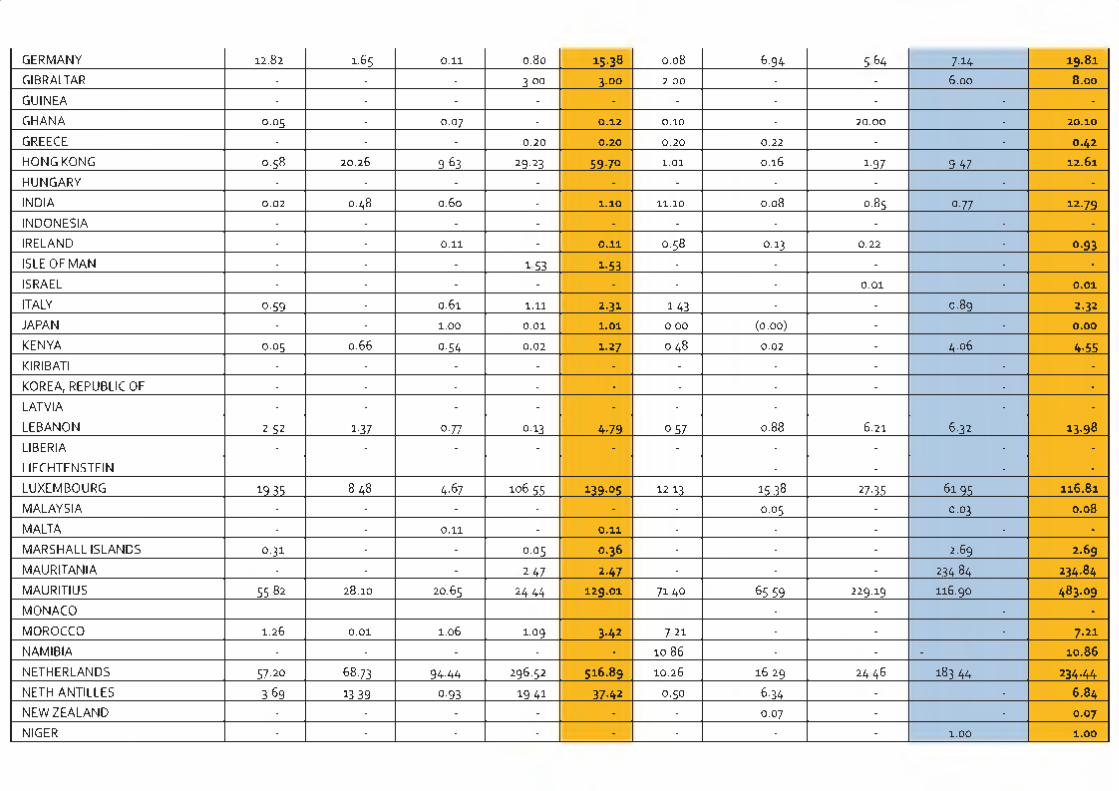
GERMANY 12.82 1.65 0.11 0.80 15-38 0.08 6.94 564 7.14 19-81GIBRALTAR - - - 3.00 3.00 2.00 - - 6.00 8-00
GUINEA - - - - - - - - - -
GHANA 0.05 - 0.07 - 0.12 0.10 - 20.00 - 20-10
GREECE - - - 0.20 0.20 0.20 0.22 - - 0-42
HONG KONG 0.58 20.2 6 9.63 29.23 59-70 1.01 0.16 1.97 947 12-61
HUNGARY - - - - - - - - - -
INDIA 0.02 0.48 0.6 0 - 1-10 11.10 0.08 0.8 5 0.77 12-79INDONESIA - - - - - - - - - -
IRELAND - - 0.11 - 0-11 0.58 0.13 0.22 - 0-93ISLE OF MAN - - - 1 53 1-53 - - - - -
ISRAEL - - - - - - - 0.01 - 0-01
ITALY 0.59 - 0.6 1 1.11 2-31 1.43 - - 0.89 2-32
JAPAN - - 1.00 0.01 1-01 0.00 (0.0 0 ) - - 0-00
KENYA 0.05 0.66 0.54 0.02 1-27 0.48 0.02 - 4.06 4-55KIRIBATI - - - - - - - - - -
KOREA, REPUBLIC OF - - - - - - - - - -
LATVIA - - - - - - - - -
LEBANON 252 1.37 0.77 0.13 4-79 0.57 0.88 6.2 1 6.3 2 13-98LIBERIA - - - - - - - - - -
LIECHTENSTEIN - - - -
LUXEMBOURG 1935 8.48 4.67 106.55 139-05 1 2.13 1538 27.35 61.95 116-81
MALAYSIA - - - - - - 0.05 - 0.03 0-08
MALTA - - 0.11 - 0-11 - - - - -
MARSHALL ISLANDS 0.31 - - 0.05 0-36 - - - 2.69 2-69
MAURITANIA - - - 247 2-47 - - - 23484 234-84MAURITIUS 55 82 28.10 20.65 24 44 1 29-01 7140 65 59 229.19 116.90 483-09MONACO - - - -
MOROCCO 1.26 0.01 1.06 1.09 3-42 721 - - - 7-21NAMIBIA - - - - - 10.86 - - - 10-86
NETHERLANDS 57.20 68.73 94.44 296.52 516- 89 10.26 16.29 24 46 183 44 234-44NETH.ANTILLES 369 1339 0.93 1941 37-42 0.50 6.34 - - 6-84NEW ZEALAND - - - - - - 0.07 - - 0-07
NIGER - - - - - - - - 1.00 1-00
NORWAY - - - - - - 4.65 1.29 - 5.94PANAMA 0.50 - - - 0.50 - - 9.50 0.50 10.00
PITCAIRN - - - - - - - - - -
POLAND - - - - - - - - - -
PORTUGAL - - - - - - - 0.0 6 0.07 0.13
PUERTO RIC O - - - -
QATAR - - - - - - - - - -
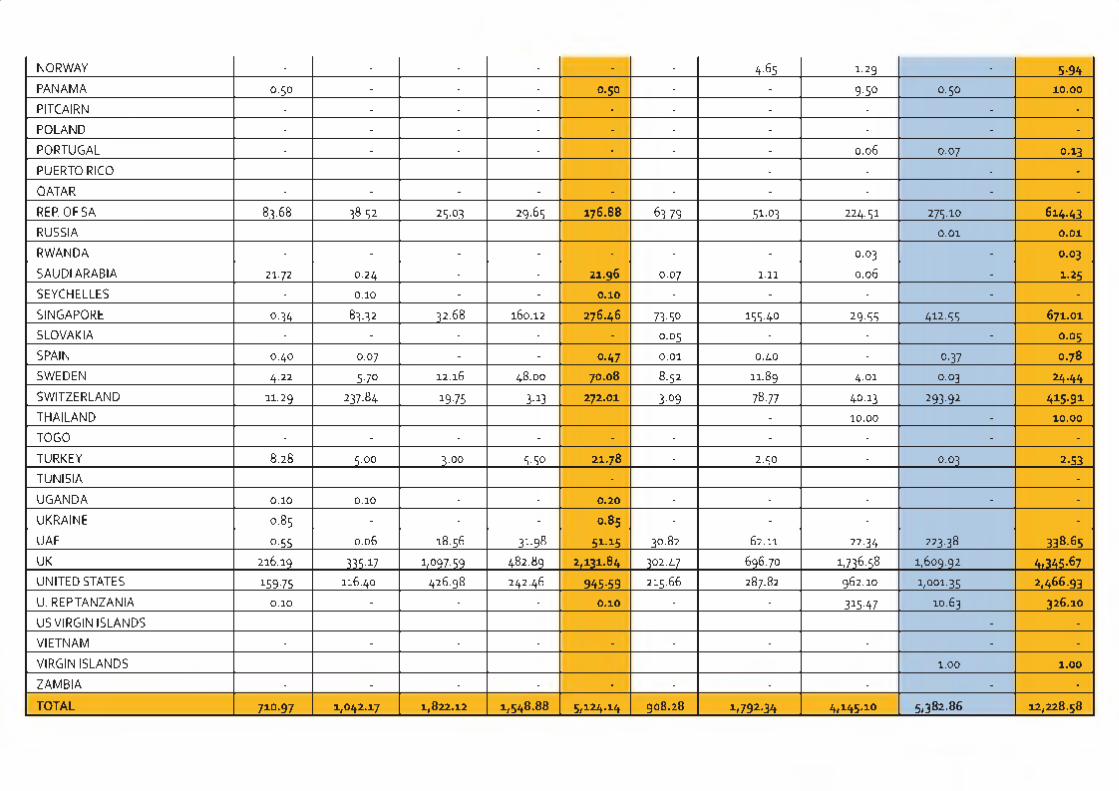
REP. OF SA 83.68 38.5 2 25.03 29.65 176.88 63.79 51.03 224.51 275.10 614.43RUSSIA 0.01 0.01
RWANDA - - - - - - - 0.03 - 0.03
SAUDI ARABIA 21.72 0.2 4 - - 21.96 0.07 1.11 0.0 6 - 1.25SEYCHELLES - 0.10 - - 0.10 - - - - -
SINGAPORE 0.34 83.3 2 3 2.68 160.12 276.46 73.50 155.40 29.55 412.55 671.01
SLOVAKIA - - - - - 0.05 - - - 0.05
SPAIN 0.40 0.07 - - 0.47 0.01 0.40 - 0.37 0.78
SWEDEN 4.22 5.70 1 2.16 48.00 70.08 8.52 11.89 4.0 1 0.03 24.44SWITZERLAND 11.2 9 237.84 19.75 3.13 272.01 3.09 78.77 40.13 293.92 415.91THAILAND - 10.00 - 10.00
TOGO - - - - - - - - - -
TURKEY 8.2 8 5.00 3.00 5.50 21.78 - 2.50 - 0.03 2.53TUNISIA - - - - - - - - - -
UGANDA 0.10 0.10 - - 0.20 - - - - -
UKRAINE 0.8 5 - - - 0.85 - - - -
UAE 0.55 0.0 6 18.56 31.98 51.15 30.82 62.11 22.34 223.38 338.65UK 216.19 335.17 1,097.59 482.89 2,131.84 302.47 696.70 1,736.58 1,609.92 4,345.67UNITED STATES 159.75 11 6.40 4 2 6.98 242.46 945.59 215.66 287.82 962.10 1,001.35 2,466.93
U. REP TANZANIA 0.10 - - - 0.10 - - 315.47 10.63 326.10
US VIRGIN ISLANDS - -
VIETNAM - - - - - - - - - -
VIRGIN ISLA NDS 1.00 1.00
ZAMBIA - - - - - - - - - -
TOTAL 710.97 1,042.17 1,822.12 1,548.88 5,124.14 908.28 1,792.34 4,145.10 5,382.86 12,228.58
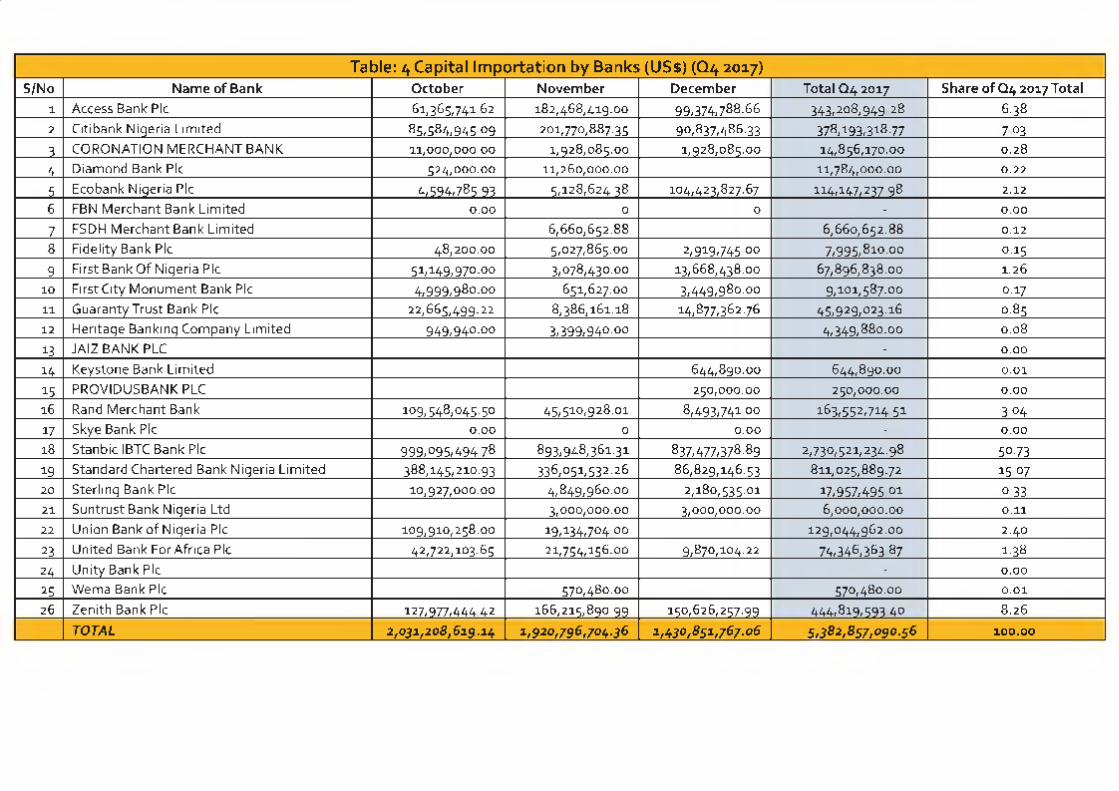
Table: 4 Capital Im portation by Banks (US$) (Q4 2017)S/No Name of Bank October November December Total Q4 2017 Share of Q4 2017 Total
1 Access Bank Plc 61,365,74162 182,468,419.00 99,374,788.66 343,208, 94928 6.382 Citibank Nigeria Limited 85,584,94509 201,770,887.35 90,837,486.33 378,193,318.77 7033 CORONATION MERCHANT B ANK 11,000,000.00 1,928,085.00 1,928,085.00 14,856,170.00 0.28
4 Diamond Bank Plc 524,000.00 11,260,000.00 11,784,000.00 0.22
5 Ecobank Nigeria Plc 4,594,785 93 5,128,624.38 104,423,827.67 114,147,23798 2.126 FBN Merchant Bank Limited 0.00 0 0 - 0.00
7 FSDH Merchant Bank Limited 6,660,652.88 6, 6 6 0, 652.88 0.128 Fidelity Bank Plc 48,200.00 5,027,865.00 2,919,745 00 7,995,810.00 0.15
9 First Bank Of Nigeria P lc 51,149,970.00 3,078,430.00 13,668,438.00 67,896,838.00 1.2610 First City Monument Bank Plc 4,999,980.00 651,627.00 3,449,980.00 9,101,587.00 0.1711 Guaranty Trust Bank Plc 22,665,499.22 8,386,161.18 14,877,362.76 45,929,023.16 0.8512 Heritage Banking Company Limited 949,940.00 3,399,940.00 4,349,880.00 0.08
13 JAIZ BANK PLC - 0.00
14 Keystone Bank Limited 644,890.00 644,89 0.00 0.01
15 PROVIDUSBANK PLC 250,000.00 250,00 0.00 0.0016 Rand Merchant Bank 109,548,045.50 45,510,928.01 8,493,74100 163,552,714 51 30 417 Skye Bank Plc 0.00 0 0.00 - 0.0018 Stanbic IBTC Bank Plc 999,095,49478 893,948,361.31 837,477,378.89 2,730,521,234.98 50.7319 Standard Chartered Bank Nigeria Limited 388,145,210.93 336,051,532.26 86,829,146.53 811,025,889.72 150720 Sterling Bank Plc 10,927,000.00 4,849,960.00 2,180,535.01 17,957,495 01 0 3321 Suntrust Bank Nigeria Ltd 3,000,000.00 3,000,000.00 6,000,000.00 0.1122 Union Bank of Nigeria Plc 109,910,258.00 19,134,70400 129,044,962.00 2.40
23 United Bank For Africa Plc 42,722,103.65 21,754,156.00 9,870,104.22 74, 346, 36387 1.38
24 Unity Bank Plc - 0.00
25 Wem a Bank Plc 570,480.00 570,480.00 0.0126 Zenith Bank Plc 127,977,444 42 166,215,890.99 150,626,257.99 444,819,593 40 8.26
TOTAL 2,031,208,619.14 1,920,796,704.36 1,430,851,767.06 5,382,857,090.56 100.00
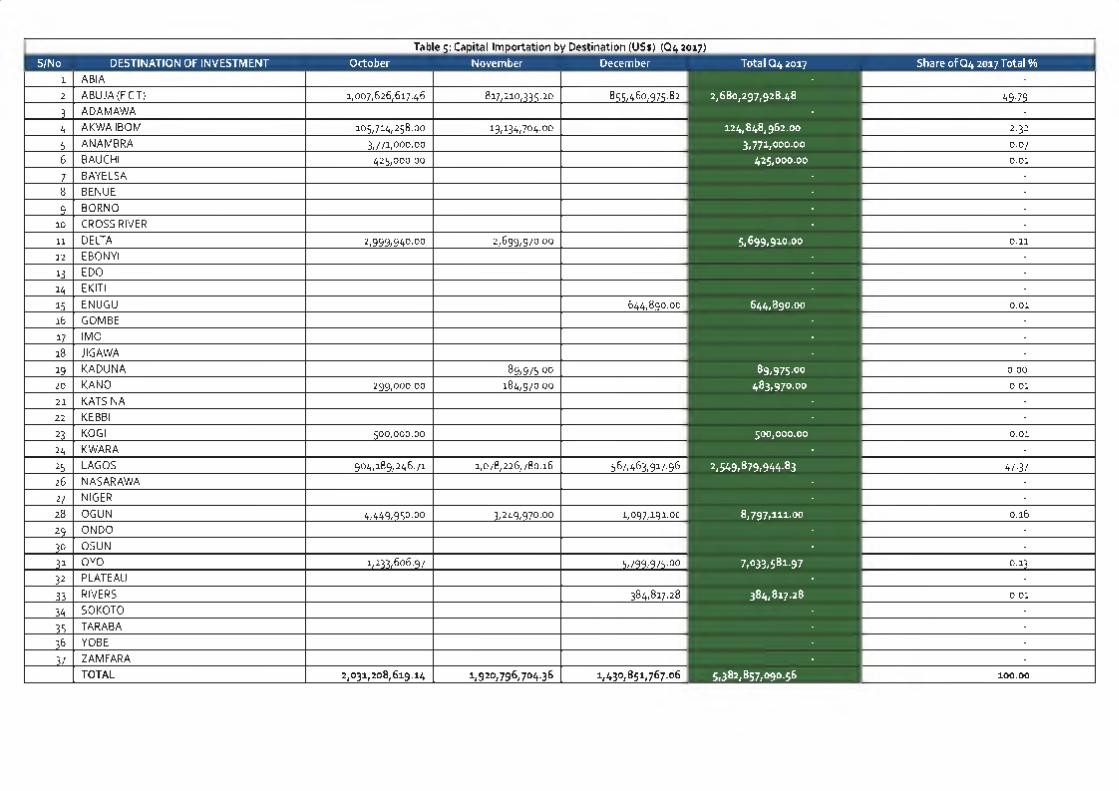
Table 5: Capital Importation by Destination (US$) (Q4 2017)S/No DESTINATION OF INVESTMENT October November December Total Q4 2017 Share of Q4 2017 Total %
1 A B IA - -
2 A B U JA (F C T) 1,007,62 6 ,6 17.46 817,2 10,335.2 0 855,46 0,9 75.82 2,680,297,928.48 4 9 .7 9
3 A D A M A W A - -
4 A K W A IBO M 105,714 ,2 58.00 19 ,134,704.00 124,848, 962.00 2.32
5 A N A M B R A 3,771,0 0 0 .0 0 3, 771, 000.00 0.07
6 BA U CH I 425,000.00 425,000.00 0.01
7 B A Y ELSA - -
8 BEN U E - -
9 B O R N O - -
10 C R O S S R IV ER - -
11 DELTA 2, 9 9 9 , 9 4 0 .0 0 2 ,6 99 ,970.00 5, 699,910 00 0.11
12 EBO N YI - -
13 EDO - -
14 EKITI - -
15 EN U G U 6 44 ,89 0.00 644,890.00 0.01
16 G O M B E - -
17 IM O - -
18 JIG A W A - -
19 K A D U N A 8 9 , 9 7 5 .0 0 89,975.00 0.00
20 K A N O 2 99 ,0 00.00 184 ,9 70.00 483,970.00 0.01
21 K A TSIN A - -
22 KEBBI - -
23 KOGI 500,000.00 500,000.00 0.01
24 K W A R A - -
25 LA G O S 9 0 4 ,18 9 ,2 4 6 .71 1,078,22 6 ,78 0.16 5 67, 4 6 3, 9 17.9 0 2, 549,879, 944.83 47.37
26 N A SA R A W A - -
27 N IG E R - -
28 O G U N 4 , 4 4 9 , 9 5 0 .0 0 3, 2 4 9 , 9 7 0 .0 0 1, 0 9 7 ,1 9 1 .0 C| 8, 7 97,111.00 0.16
29 O N D O - -
30 O SU N - -
31 OYO 1,233,6 06.9 7 5 ,7 9 9 ,9 7 5 .°0 7,033,581.97 0.13
32 PLA TEA U - -
33 R IV ER S 38 4 ,8 1 7.2 g 384,817.28 0.01
34 SO KO TO - -
35 T A R A B A - -
36 Y O B E - -
37 Z A M FA R A - -
TOTAL 2,031,208,619.14 1,920,796,704.36 1,430,851,767.06 5,382,857,090.56 100.00
Methodology
Data is supplied administratively by the Central Bank of Nigeria (CBN) and verified and validated by the National Bureau of Statistics, Nigeria (NBS).
33Nigerian Capital Importation- Q4 2017
Acknowledgements/Contacts
AcknowledgementsWe acknowledge the contributions of our strategic partner the Central Bank of Nigeria and our technical partner, Proshare in the design, concept and production of this publication.
proshare
Contact Us
@nigerianstat NBSNigeria @ www.nigerianstat.gov.ng
Head Office Address
Plot 762,IndependenceAvenue,Central Business District,FCT, Abuja Nigeria.
J +234 803 386 5388 [email protected]
34Nigerian Capital Importation- Q4 2017