Upwelling-triggered near-geostrophic recirculation in an equatorward facing embayment
10
This article appeared in a journal published by Elsevier. The attached copy is furnished to the author for internal non-commercial research and education use, including for instruction at the authors institution and sharing with colleagues. Other uses, including reproduction and distribution, or selling or licensing copies, or posting to personal, institutional or third party websites are prohibited. In most cases authors are permitted to post their version of the article (e.g. in Word or Tex form) to their personal website or institutional repository. Authors requiring further information regarding Elsevier’s archiving and manuscript policies are encouraged to visit: http://www.elsevier.com/copyright
Transcript of Upwelling-triggered near-geostrophic recirculation in an equatorward facing embayment

This article appeared in a journal published by Elsevier. The attachedcopy is furnished to the author for internal non-commercial researchand education use, including for instruction at the authors institution
and sharing with colleagues.
Other uses, including reproduction and distribution, or selling orlicensing copies, or posting to personal, institutional or third party
websites are prohibited.
In most cases authors are permitted to post their version of thearticle (e.g. in Word or Tex form) to their personal website orinstitutional repository. Authors requiring further information
regarding Elsevier’s archiving and manuscript policies areencouraged to visit:
http://www.elsevier.com/copyright

Author's personal copy
Research papers
Upwelling-triggered near-geostrophic recirculation in an equatorwardfacing embayment
Julio Moraga-Opazo a, Arnoldo Valle-Levinson b,n, Marcel Ramos c, Matıas Pizarro-Koch c
a Departamento de Biologıa Marina, Facultad de Ciencias del Mar, Universidad Catolica del Norte, Casilla 118, Coquimbo, Chileb Department of Civil and Coastal Engineering, University of Florida, 365 Weil Hall, P.O. Box 116580, Gainesville, FL 32611, USAc Centro de Estudios Avanzados en Zonas Aridas (CEAZA), Facultad de Ciencias del Mar, Universidad Catolica del Norte, Coquimbo, Chile
a r t i c l e i n f o
Article history:
Received 14 November 2010
Received in revised form
1 August 2011
Accepted 6 October 2011Available online 18 October 2011
Keywords:
Equatorward facing bay
Water exchange
Geostrophic balance
a b s t r a c t
Underway current velocity profiles were combined with hydrographic profiles at the entrance to
Tongoy Bay, an equatorward facing bay in north-central Chile, with the objective of determining its
exchange hydrodynamics. To the west, Tongoy Bay is bounded by Lengua de Vaca Point, a �6 km-long
northward protruding peninsula. Observations were obtained during three surveys (April 2005,
December 2005, May 2009) along cross-bay transects for at least one full day. During the surveys,
winds were upwelling-favorable and displayed diurnal variations. Non-tidal (tidally averaged) flows
showed a consistent clockwise or southern hemisphere cyclonic, recirculation during the three surveys.
This recirculation was likely part of a cyclonic gyre (10–20 km in diameter), not entirely resolved by the
surveys, and formed by flow separation off Lengua de Vaca Point. Estimates of the baroclinic pressure
gradient, combined with analytical solutions of density-driven and wind-driven flows, indicated that
the recirculation in Tongoy Bay was nearly in geostrophic balance. An ageostrophic contribution to the
dynamics was related to frictional effects derived from local upwelling-favorable winds. A linear
superposition of the analytically derived density-driven and wind-driven exchange resulted in a flow
pattern that resembled the observed net exchange flows at the bay mouth.
& 2011 Elsevier Ltd. All rights reserved.
1. Introduction
Tongoy Bay, in the Chilean Coquimbo Region, is in an area withseveral other bays of high biological productivity and with intenseaquaculture and other anthropogenic activities. In the last 30 years,human intervention in Tongoy Bay has increased, and the farming ofdifferent native and exotic species currently occupies half of thebay’s area (Moraga et al., 2006). Within the bay system of theCoquimbo Region a bipolar circulation was recorded in Guanaqueroand Coquimbo Bays, which are two bays to the north (Valle-Levinson and Moraga-Opazo, 2006). Upwelling-favorable windsand flow separation at headlands intensify the prominence ofupwelling centers outside some Chilean bays, e.g. Tongoy andLaguna Verde in Valparaıso (Fonseca and Farıas, 1987; Figueroaand Moffat, 2000; Aiken et al., 2008).
Scant studies address circulation in the bays of this area. Valle-Levinson et al. (2000) reported residual circulation and tidal currentsin Coquimbo Bay, �45 km north of Tongoy Bay, based on four days ofcurrent and hydrographic observations in early autumn. Later, Valle-Levinson and Moraga-Opazo (2006) depicted a bipolar circulation inCoquimbo and Guanaquero bays consisting of counterrotating gyres:
clockwise on the south of the bays and counter-clockwise on thenorth. Flow distributions were explained on the basis of theirresponse to wind and to the coastline configuration shaped by thePoints limiting these bays. Coquimbo and Guanaquero bays areapproximately westward in orientation, whereas Tongoy Bay opensto the north. Such differences imply a priori contrasts in theircirculation patterns. To date, no studies have been published forTongoy Bay regarding its circulation, dynamics, or its relationshipwith the flow over the outer shelf. The main objective of this work isto provide a dynamic explanation for a persistent recirculationobserved at the mouth of Tongoy Bay and its relationship with theflow over the continental shelf.
This paper is organized as follows. First, we describe the studyarea, wind conditions, and tides recorded during the observationperiods, along with the flows observed in Tongoy Bay. We thenanalyze and discuss the possible causes of these flows in order tocompare our observations with analytical models (dependent onwind, density gradients, and bathymetry). Finally, we conclude withthe main findings drawn from this study, including future lines ofresearch.
1.1. Study area
Tongoy Bay sits at 301150S, 711340W and is part of a larger baysystem limited on the north by Choros Point (291S) and on the
Contents lists available at SciVerse ScienceDirect
journal homepage: www.elsevier.com/locate/csr
Continental Shelf Research
0278-4343/$ - see front matter & 2011 Elsevier Ltd. All rights reserved.
doi:10.1016/j.csr.2011.10.002
n Corresponding author.
E-mail addresses: [email protected] (J. Moraga-Opazo),
[email protected] (A. Valle-Levinson).
Continental Shelf Research 31 (2011) 1991–1999

Author's personal copy
south by Lengua de Vaca Point (301180S). The bay system isoriented toward the west and its mouth has a width of�100 km. Prominent upwelling centers are located at both Pointsand these centers condition the oceanography of the bay system(Fig. 1). Geographically, the study area is in a semi-arid zone(mean of 70 mm of rain annually) influenced predominantly bysoutherly winds nearly all year due to the presence of theSoutheastern Pacific Anticyclone (Strub et al., 1998).
The mouth of Tongoy Bay opens to the north and its depthreaches a maximum of �100 m at a transect that crosses themouth, which is �11 km wide between Lengua de Vaca Point andTongoy Point. The bay area is �6.14�107 m2 and its volume is�2.0�109 m3 (Pacheco et al., 1987). Freshwater input is minimaland occurs in the form of rainfall channeled through severalravines and effluents carried by natural drainage (Moraga et al.,2006). The bathymetry shows an extension of Lengua de VacaPoint along the western part of the bay with a bottom slope thatlimits the entrance of water from the west. In the eastern part,however, the bottom slope is weaker (Fig. 1).
2. Data collection and analysis
A total of three surveys were carried out: the first two (13–15April, 13–15 December 2005) covered a transect across theentrance to Tongoy Bay (from Lengua de Vaca Point to TongoyPoint) and recorded current velocity over a time span exceeding24 h. The sampling design for the third survey (7–9 May 2009)included an additional transect to observe the flow to the north ofthe bay mouth. This survey consisted of a circuit limited by thetransects sampled (a) at the entrance to Tongoy Bay (Fig. 1),(b) from Barnes Point to the extension of Lengua de Vaca Point onthe west, and (c) at the side transects joining the previous two.Underway current velocity measurements were recorded everysecond with a 300 kHz RD Instruments acoustic Doppler currentprofiler (ADCP) mounted on the side of the R/V Stella Maris II. Thetransducers pointed downward and were located approximately0.50 m below the water surface. The bin size of the velocity datawas 1 m. The bottom was tracked by the current profiler at alltimes and instrument positioning was effected with a GarminGPSmap 60 s.
The May 2009 survey included CTD-O casts (SeaBird 25,calibrated), during which a water sample was taken with a Niskin
bottle at the maximum depth of observation to analyze dissolvedoxygen, salinity, and nutrients (Fig. 1). The hydrographic mea-surements obtained in the May CTD-O allowed estimation of thebaroclinic pressure gradient and of the geostrophic velocity field.
During each survey, the bay mouth transect was sampledbetween eight and thirteen times to calculate the residual oraverage flow in �24 h. The ADCP data were processed followingthe methodology described in Valle-Levinson et al. (2000).Moreover, wind data were recorded at a conventional meteorologi-cal station at Lengua de Vaca Point (10 m above sea level). Winddata were recorded every 20 min and averaged hourly. Comple-mentary daily average satellite wind information was gathered fromQuikSCAT (http://www.ifremer.fr/cersat) for all three surveys.
To study the exchange hydrodynamics in Tongoy Bay, a non-dimensional analysis was used after determining similarities anddifferences between mean flow patterns observed at each survey.The non-dimensional analysis yielded estimates of Reynolds,Rossby, Ekman, Wedderburn, and modified Rossby numbers, thelatter following Aiken et al. (2008). The results from the dimen-sional analysis then motivated the application of two analyticalmodels: one considering wind effects (Winant, 2004) and theother taking into account density gradients (Valle-Levinson,2008). Both models were modified to include the bathymetry atTongoy Bay mouth. The application of these analytical solutionsto the bathymetry of the bay allowed assessment of the separateeffects by wind and density gradients on the exchange flow. Italso determined the result of the combined effects of bothforcings by adding linearly both analytical solutions.
3. Results
3.1. General forcing: winds and tides
Local winds at Lengua de Vaca Point in April and December2005 were predominantly to the north and east, with hourlyvalues that exceeded 8 m s�1 on 13 and 14 April. During thesesurveys, the east–west component showed higher values than thenorth–south component, especially in the afternoon (Fig. 2c). Thiswas probably caused by differences in the wind field between thecoastline and the open ocean. In May, the north–south componentwas greater than the east–west component (Fig. 2i) and satellitewinds also showed dominant southerly and southwesterly winds
Fig. 1. Study area in north-central Chile (right frame), with bathymetry (contour labels in meters), ADCP tracks (continuous lines), CTD casts (asterisks), and weather
station position (plus sign).
J. Moraga-Opazo et al. / Continental Shelf Research 31 (2011) 1991–19991992

Author's personal copy
in the area off the bay (g,h). In brief, winds were upwelling-favorableduring all surveys (Fig. 2) with intense pulses of south-south-westerly winds in the afternoon. This agrees with an earlier analysisof the winds at Lengua de Vaca Point that showed more intensepulses in the afternoon and spectral peaks at synoptic and sub-synoptic scales (3–10 day) (Rutllant et al., 2004).
Sampling in April 2005 was carried out during neap tide, witha range of o0.70 m between high and low water. On the otherhand, sampling on 14 and 15 December 2005, was effected duringspring tide with a range of 1.1 m. The same spring tide conditionprevailed on 8 and 9 May, 2009. According to the mass conserva-tion approach proposed by Stigebrandt (1977) to determine waterexchange as a function of tidal range, bay volume, and bay mouthcross-sectional area, semidiurnal tidal current speeds areexpected to be 0.02 to 0.03 m s�1 in Tongoy Bay. Although tidesindeed drive water exchange in the bay, only the subtidalexchange component is dealt with herein. The tidal currentmagnitude estimated with Stigebrandt’s approach agreeswith the amplitude of semidiurnal tidal currents obtained withharmonic analysis at the entrance to Tongoy Bay (not shown).
Depth-averaged flows determined along the transects definingthe circuit in May 2009 (Fig. 3) revealed a southward flow overthe eastern portion of the bay mouth and a northward flow overthe western portion. The flow in the middle of the mouth waspractically zero. The two repetitions of the east–west oriented
transect sampled off Barnes Point showed a similar pattern(Fig. 3) of southward flow in the eastern part and northward flowover the western part of the transect. This structure was lessdefined in the first repetition, recorded �18 h before the secondtransect repetition. The differences between the two transectrepetitions off Barnes Point may be caused by diurnal variabilityfrom wind and tidal forcing. On the other hand, the north–southoriented transect that closed the circuit on the west, to the northof Lengua de Vaca Point, showed northwestward depth-averagedflows with the largest magnitudes sampled (40.1 m s�1). Thestructure of these depth-averaged flows observed in the circuitclearly showed a clockwise, cyclonic (in the southern hemisphere)gyre. The cyclonic circulation observed at the mouth of TongoyBay is thought to be part of a larger recirculation system – aclockwise gyre – generated by flow separation at Lengua de VacaPoint. This idea is explored further in the discussion.
The vertical structure of subtidal flows across the mouth ofTongoy Bay during the three surveys showed a consistent waterexchange distribution. In general, water flowed into the baythrough the eastern portion, underneath a surface layer (5–8 m)that most likely reacted to local wind forcing (Fig. 4a,b,c). In theApril 2005 survey, inflowing water extended up to �6 km fromTongoy Point throughout most of the water column. The core ofthe inflow (with speeds 40.05 m s�1) was centered between 300and 3700 m from Tongoy Point, and between 20 and 40 m deep.
Fig. 2. Daily satellite (maps) and local (time series) hourly averages of wind velocity (U and V components; darker lines indicate the V or north–south wind velocity
component). Arrows and components indicate the direction toward which the wind blow. Shaded area in the time series shows bay water sampling time and the dashed
horizontal line is the V average.
J. Moraga-Opazo et al. / Continental Shelf Research 31 (2011) 1991–1999 1993

Author's personal copy
The rest of the bay mouth section was influenced by surfaceoutflows (with speeds 40.06 m s�1). Outflows reached depths of25 m and extended up to �7.5 km eastward from Lengua de VacaPoint (which is on the left on Fig. 4a). It was evident that the westcomponent of the velocity dominated the entire transect (Fig. 4a),i.e., the flow was mostly westward throughout the transect,which indicated a recirculating flow structure.
In December 2005, the inflow reached a depth of 27.5 m in theregion between 3 and 6 km from Tongoy Point (Fig. 4b). Under-neath 40 m depth, subtidal flows were near zero and their patternwas ill-defined. The outflow core (40.08 m s�1) covered thewestern portion of the mouth transect, from the surface to 25 mdepth, between Lengua de Vaca Point and the 6 km tick mark onthe abscissa of Fig. 4b. An additional transect, parallel to the baymouth transect, was sampled inside the bay in an area notaffected by aquaculture. This transect confirmed that the flowsobserved at the mouth were part of a larger cyclonic gyre (d).
In May 2009, the inflow covered practically half of the easternportion of the bay mouth, with a core of maximum current alongTongoy Point (speeds 40.06 m s�1) between depths of 20 and40 m (Fig. 4c). Furthermore, the surface flow observed over thewestern part of the transect revealed an outflowing core alongLengua de Vaca Point (speeds 40.08 m s�1) between the surfaceand 40 m depth (Fig. 4c). In summary, during the three currentprofiling surveys, a cyclonic recirculation of the residual flowswas observed. This feature was relatively consistent in time andspace despite differences in the vertical current structure fromsurvey to survey. Such differences were attributed to differentlocal and remote forcing conditions that could not be discernedwith the information available. The explanation for the differentvertical structure of exchange flows at the mouth of Tongoy Bayshould be the focus of future numerical model investigations. Onthe other hand, the consistent exchange flow structures areexplored next with an analysis of the possible dynamic causesassociated with the observed circulation structures.
3.2. Dynamics
The possible dynamical influences causing the circulationobserved in Tongoy Bay include: baroclinic pressure gradients, windforcing outside the bay (producing upwelling at Lengua de VacaPoint and northward flow separation from the Point), remote forcingby continental shelf currents, and modification of flow structures byCoriolis accelerations and curvature effects around the Points.
The potential influence of baroclinic pressure gradients on theflow structures observed was first explored through the hydro-graphic conditions at Tongoy Bay mouth during the May 2009survey and then with estimates of those gradients. Thermalconditions at the bay mouth showed a relatively weak thermo-cline, which was typical for late autumn (e.g. Moraga et al., 2006).Maximum surface temperature was �14.5 1C, dropping to�12.5 1C at depths 440 m (Fig. 5a). Salinity varied from 34.2to 34.5 near the bottom, with the lowest values found in a coreover the eastern portion of the transect, between 20 and 50 mdepth. This core coincided with a region of intensified inflow tothe bay (Fig. 4c). Dissolved oxygen concentrations had a similarstructure to that of water temperature, with hypoxic conditionsobserved at depths 480 m (Fig. 5a). The hydrographic structuresobserved revealed little in terms of flow structures at the bayentrance. Only the fact that isopycnals rose slightly towardLengua de Vaca Point in the depth range between 15 and 50 msuggested upwelling-related processes within 2 km from thePoint (Fig. 5a). On the other hand, the deeper section off BarnesPoint (Fig. 5b) showed saline (434.6 psu), cold (12.0 1C), andhypoxic (o2 mg/L) waters below 120 m depth, associated withthe Equatorial Subsurface Water (ESSW); better defined than theESSW characteristics observed at the mouth of Tongoy Bay(Fig. 5a). This distinction was attributed to the different depthsof the two transects.
Estimates of the baroclinic pressure gradient (Fig. 6) revealedlaterally varying forcing throughout the transects sampled. The
Fig. 3. Depth-averaged flows along the sampling circuit for the May 2009 survey.
J. Moraga-Opazo et al. / Continental Shelf Research 31 (2011) 1991–19991994

Author's personal copy
influence of this gradient was calculated from the density field rby determining its lateral (or zonal) gradients @r/@x and integrat-ing them throughout the water column of depth H(x), where x isthe zonal direction. Thus, the subtidal accelerations produced bybaroclinic pressure gradients in Tongoy Bay were determinedwith g=r
R 0�H @r=@xdz, where g is the acceleration caused by
gravity and z is the vertical direction, positive upward. Values ofthe baroclinic pressure gradient were of order 10�5 to10�6 m s�2 and changed sign at both Tongoy Bay mouth transectand at the transect off Barnes Point. The values were greater at thetransect off Barnes Point because of its greater depth. A compar-ison of the baroclinic pressure gradient with the Coriolis accel-erations suggested that both terms were of the same order ofmagnitude, and could have dominated the dynamics as will beexplored below. On the other hand, the change of sign across thetransect of the baroclinic pressure gradients indicated that theseterms likely drove a recirculation. Indeed the recirculation drivenby these gradients should have consisted of southward flow onthe eastern portion of the transect and northward flow on thewestern portion, as observed.
In fact, the geostrophic flows calculated with these baroclinicpressure gradients via the thermal wind equation in Tongoy Bay(Fig. 7) compared favorably with the subtidal flows observed with
the towed ADCP. The comparison was favorable in both themagnitude (between 0.05 and 0.2 m s�1) and the direction (south-ward flows on the eastern portion and northward flows on thewestern portion of the transects). This flow structure was consistentwith the presence of a cyclonic gyre in near geostrophic balance asexplored with analytical solutions, presented next.
4. Discussion
This section centers on three main points: (a) a comparisonbetween the flow structure at Tongoy Bay and other morphologi-cally similar bays immediately to the north; (b) the way in whichthe recirculation observed in Tongoy Bay could be explained by aflow separation at Lengua de Vaca Point forced by upwelling-favorable winds off the bay; (c) a comparison between the observedflow structure and analytical solutions that may resemble the flowstructure observed in Tongoy Bay. The flow structures derived fromanalytical solutions are first placed in the context of the larger scale(several tens of km) circulation in the region. Then, the analyticalsolutions implemented in this case include dynamical influencesthat are justified by scaling analyses through use of non-dimen-sional numbers.
Fig. 4. Residual circulation at the entrance to Tongoy Bay (a, b, and c) and inside the bay (d). Arrows depict horizontal components of the flow at different depths.
Downward and leftward pointing arrows denote southward and westward flows, respectively. (a) and (d) represent data for April 2005, (b) for December 2005, and (c) for
May 2009.
J. Moraga-Opazo et al. / Continental Shelf Research 31 (2011) 1991–1999 1995

Author's personal copy
4.1. Comparison to circulation in other bays to the north
The half-moon shape of Tongoy Bay, the width of its mouth,and its bathymetry are similar to those of Guanaquero Bay, just10 km north of Tongoy Bay. Under similar forcing conditions tothose observed in Tongoy Bay, a pair of counter-rotating gyreswas observed within Guanaquero Bay (Valle-Levinson andMoraga-Opazo, 2006). In contrast, Tongoy Bay exhibited one
clockwise gyre consistently in three surveys. The bays orientationis different and considered to be crucial for the distinct circulationfeatures. Whereas Tongoy Bay faces northward, parallel to thepredominant northward wind-driven flow, Guanaquero Bay faceswestward, obliquely to that wind-driven flow.
The development of one or two gyres in an embayment can beobtained from the relationship proposed, on the basis of aBernoulli-type momentum balance between pressure gradient
Fig. 5. (a) Hydrography in Tongoy Bay along a bay entrance cross-section, looking seaward. (b) Hydrography for a cross section off Barnes Point, looking seaward.
Fig. 6. Vertical distribution of the baroclinic pressure gradient at (a) Tongoy Bay
entrance, and (b) cross section off Barnes Point. Both sections are looking seaward.
Negative (blue) contours denote force per unit mass directed into the bay. (For
interpretation of the references to color in this figure legend, the reader is referred
to the web version of this article).
Fig. 7. Geostrophic flows obtained from the gradients of Fig. 6(a) at Tongoy Bay
entrance, and (b) off Barnes Point, looking seaward. Negative (blue) contours
indicate geostrophic flows into the bay. (For interpretation of the references to
color in this figure legend, the reader is referred to the web version of this article.)
J. Moraga-Opazo et al. / Continental Shelf Research 31 (2011) 1991–19991996

Author's personal copy
force per unit mass and two-dimensional advection, by Valle-Levinson and Moraga-Opazo (2006):
Ly ¼ RgDn
V2þ1
� �ð1Þ
where Ly is the diameter of a gyre, R (�6 km in Tongoy Bay) is theradius of curvature of a headland, V is the flow speed (�0.1 m s�1),g (¼9.8 m s�2) is the acceleration caused by gravity, and Dn is thesurface difference between the two Points at the bay mouth(expected to be�0.001 m). The momentum balance from whichEq. (1) was derived can be related to flow separation around pointsor headlands. The size of Ly in Tongoy Bay is expected to be �12 km.In order to exhibit a double gyre, Tongoy Bay’s mouth should at leastbe twice Ly or 24 km. However, the distance between Lengua deVaca Point and Tongoy Point is �11 km (Figs. 4 and 5). Only onegyre is therefore expected in Tongoy Bay, in contrast to the twogyres in other bays of the zone where Ly is 5–7 km. This gyre isexpected to be generated by northward, upwelling-favorable, windsthat cause flow separation at Lengua de Vaca Point as explored next.
4.2. Flow separation at Lengua de Vaca Point
The clockwise recirculation observed in Tongoy Bay appears tobe part of a gyre formed by flow separation off Lengua de VacaPoint. In fact, flow separation could be occurring in both verticaland horizontal planes. Flow separation in the vertical plane maydevelop when the flow accelerates around Lengua de Vaca Pointand causes a region of relatively low pressure at the Point. Anadverse pressure gradient associated with the local low pressurearound the Point, also regarded as form drag (McCabe et al.,2006), should trigger upwelling of relatively cold, nutrient-richwaters. Flow separation in the horizontal plane also results fromflow acceleration around the Point and lateral flows, toward thePoint, responding to an adverse pressure gradient. The westwardflow within Tongoy Bay, responding to flow separation, is likelythe southern portion of the clockwise gyre mentioned above.
In general, it is well known that Lengua de Vaca Point is a keyupwelling center in the region (Neshyba and Mendez, 1976; Acunaet al., 1989; Figueroa and Moffat, 2000). The high productivitywithin Tongoy Bay is typically attributed to the nutrient-rich watersprovided by coastal upwelling at Lengua de Vaca Point, although thishas yet to be demonstrated with data. During all the surveysreported here, winds were upwelling-favorable and produced clock-wise recirculation within the bay, associated with a larger gyre. Theprocess of flow separation in the vertical plane along Lengua de VacaPoint extension, rather than Ekman dynamics, is believed todetermine the transport of nutrient-rich waters to Tongoy Bay.The influence of Ekman dynamics would drive nutrient-rich watersoffshore to the continental shelf, instead of into the bay.
During active upwelling, southerly winds produce surface flowaccelerations on the western side of Lengua de Vaca Point (Moragaet al., 2001; Marın and Delgado, 2007). Part of that wind-driven flowcould enter Tongoy Bay, after decelerating because of form drag,similarly to observations in Monterey Bay (Rosenfeld et al., 1994).Also correspondingly to Tongoy Bay, numerical model results (Tsenget al., 2003) show that equatorward flows driven by upwelling-favorable winds form a gyre within Monterrey Bay in much thesame way as depicted above. Furthermore, Rosenfeld et al. (1994)associated the frequent presence of colder, saltier waters withinMonterey Bay to upwelled waters, a mechanism that has also beenattributed to Tongoy Bay. Surface water temperature distributionsrecorded with the ADCP in May consistently showed warmer watersnear Tongoy Point and cooler waters (0.5–0.9 1C) near Lengua deVaca Point, indicative of upwelling. A more intensive study withgreater spatial and temporal resolution of hydrographic conditionsinside and outside the bay, such as that effected in Monterey Bay by
Warn-Varnas et al. (2007), should help refine these depictions ofhydrographic distributions in Tongoy Bay.
4.3. Dynamics of the flow observed
The recirculation observed between Lengua de Vaca Point andTongoy Point is expected to be part of a gyre generated by wind-driven flow separation at Lengua de Vaca Point. The dynamics ofthis recirculation are explored here by determining the dynamicalagents affecting it. As suggested in Section 3.2, the baroclinicpressure gradient is a likely agent influencing the flow, as well asCoriolis accelerations. The effects of curvature caused by thePoints can be assessed by comparing curvature (or advective)effects U2/R to wind stress accelerations t/rH. The ratio yields:
Rey ¼rHU2
tRð2Þ
which may be regarded as a ‘‘coastal’’ Reynolds number, because itcompares inertial versus frictional effects. In (2) r (¼1020 kg m�3)is the density of water, H (¼50 m) is the depth of the limitingisobath of the curvature considered, U (¼0.1 m s�1) is the typicalvelocity of the current, R (¼6 km) is the radius of the curvature ofLengua de Vaca Point, and t (¼ 0.1 Pa) is a typical wind stress. Eq.(2) yields a value of 2.5, which indicates that curvature effects aregreater than wind stress. This assessment agrees with the results ofFigueroa and Moffat (2000), considering the effect of relativevorticity generated by bathymetric gradients at Lengua deVaca Point.
Likewise, Aiken et al. (2008), based on Alaee et al. (2004),proposed that the curvature of the Points can play an importantrole in producing upwelling. Comparing inertia to Coriolis accel-erations, they proposed the modified Rossby number Rom:
Rom ¼dUs
9f 9Rsð3Þ
where
d¼1�ðU
2
s =U2s Þ
1�ðUs=UsÞð4Þ
and d¼1.5. In (4) Us (¼0.05 m s�1) is the depth-averagedvelocity, and Us (¼0.10 m s�1) is the surface streamwise velocity,f (¼2O sin y, where O is the Earth’s rotation rate and y is thelatitude of the site (f¼7.25�10�5 s�1)) is the Coriolis parameter,and Rs (¼12 km) is the radius of the gyre outside Tongoy Bay.These values yield a Rom of 0.6, a value similar to that obtained foranother Point in Central Chile, Curaumilla Point. Thus, on thebasis of results from (2) and (3), the curvature of Lengua de VacaPoint is influential in producing local upwelling but not necessa-rily influential in the circulation of the entire bay. For the entirebay, the Rossby number allows a comparison of the overall effectof inertia relative to Coriolis:
Ro ¼U
9f 9Lð5Þ
where U and L are typical scales of velocity and length, respec-tively, and f is the Coriolis parameter. If U¼0.10 m s�1, L¼10 km,and f¼7.25�10�5 s�1, then Ro¼0.14, indicating non-negligibleeffects from inertia.
The relative influence of frictional effects on the dynamics maybe determined with the vertical Ekman number:
Ez ¼Az
f H2ð6Þ
where Az (¼5�10�4 m2 s�1) is the vertical eddy viscosity coeffi-cient, H (¼50 m) is the average depth, and f is the Coriolisparameter. A rough assessment from (6) indicates that Ez is
J. Moraga-Opazo et al. / Continental Shelf Research 31 (2011) 1991–1999 1997
Author's personal copy
�0.003 at the most, suggesting a dominance of rotation overfriction. Analogously, frictional effects from wind forcing on thedynamics in Tongoy Bay can be compared to the influence of thebaroclinic pressure gradient in terms of the Wedderburn number,Wn (e.g. Valle-Levinson et al., 2003a, 2003b for Arauco Gulf,another Chilean embayment):
Wn ¼tL
gDrH2u
ð7Þ
where t is the wind stress, L is 10 km, Dr is the density contrast inthe bay (0.2 kg m�3), and Hu is the depth of the upper layer (20 m).Taking a value of t of 0.1 Pa, Wn�1, which implies that both forcingsare comparable if the wind speed reaches 10 ms�1. Thus,Eqs. (2)–(7) suggest that wind forcing, baroclinic pressure gradientand Earth’s rotation should dominate the dynamics in the bay.
The use of nondimensional numbers justifies the application oftwo analytical solutions to the mouth of Tongoy Bay, assuming thatboth can be added linearly. The analytical solutions of Winant(2004) for wind-driven flow and of Valle-Levinson (2008) fordensity-driven flows are adapted to the bathymetry of TongoyBay. In these solutions, wind-driven flows are assumed to be drivenby the balance between wind stress and pressure gradient. Density-driven flows can be modified by either Coriolis accelerations orstress divergence effects, or both. The competition between stressdivergence and Coriolis is characterized with the Ekman number Ez.Low Ez indicate negligible friction effects on the dynamics.
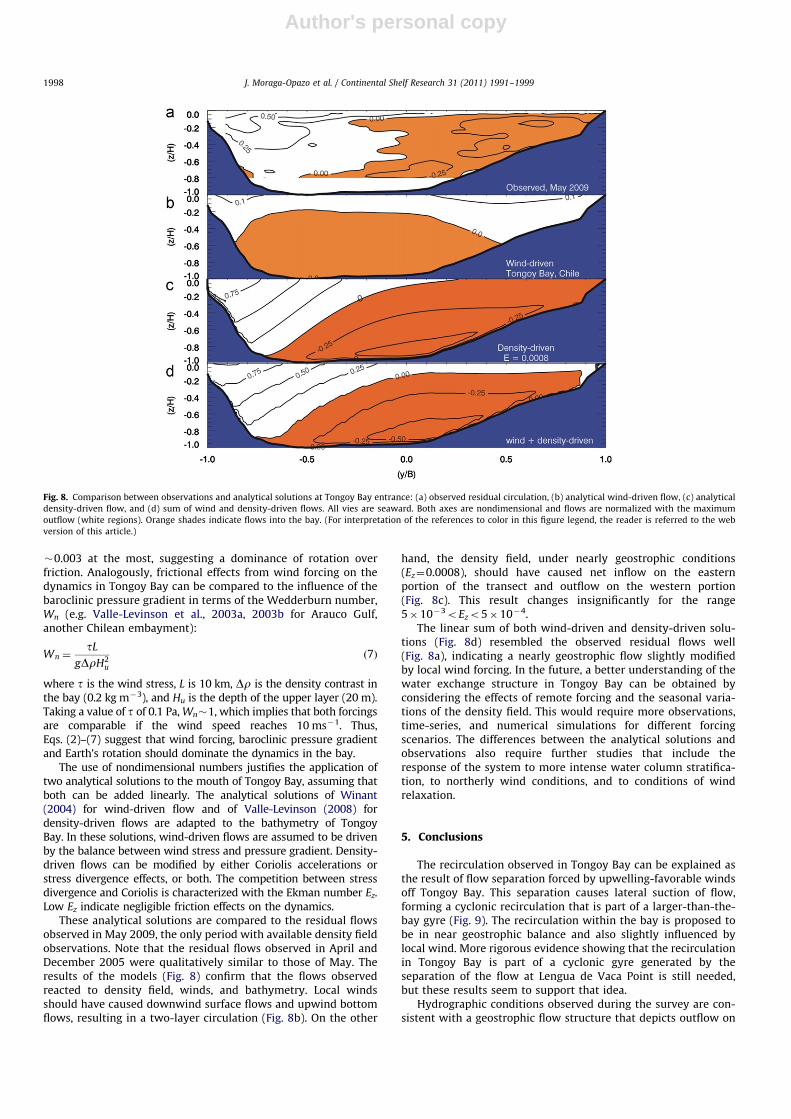
These analytical solutions are compared to the residual flowsobserved in May 2009, the only period with available density fieldobservations. Note that the residual flows observed in April andDecember 2005 were qualitatively similar to those of May. Theresults of the models (Fig. 8) confirm that the flows observedreacted to density field, winds, and bathymetry. Local windsshould have caused downwind surface flows and upwind bottomflows, resulting in a two-layer circulation (Fig. 8b). On the other
hand, the density field, under nearly geostrophic conditions(Ez¼0.0008), should have caused net inflow on the easternportion of the transect and outflow on the western portion(Fig. 8c). This result changes insignificantly for the range5�10�3oEzo5�10�4.
The linear sum of both wind-driven and density-driven solu-tions (Fig. 8d) resembled the observed residual flows well(Fig. 8a), indicating a nearly geostrophic flow slightly modifiedby local wind forcing. In the future, a better understanding of thewater exchange structure in Tongoy Bay can be obtained byconsidering the effects of remote forcing and the seasonal varia-tions of the density field. This would require more observations,time-series, and numerical simulations for different forcingscenarios. The differences between the analytical solutions andobservations also require further studies that include theresponse of the system to more intense water column stratifica-tion, to northerly wind conditions, and to conditions of windrelaxation.
5. Conclusions
The recirculation observed in Tongoy Bay can be explained asthe result of flow separation forced by upwelling-favorable windsoff Tongoy Bay. This separation causes lateral suction of flow,forming a cyclonic recirculation that is part of a larger-than-the-bay gyre (Fig. 9). The recirculation within the bay is proposed tobe in near geostrophic balance and also slightly influenced bylocal wind. More rigorous evidence showing that the recirculationin Tongoy Bay is part of a cyclonic gyre generated by theseparation of the flow at Lengua de Vaca Point is still needed,but these results seem to support that idea.
Hydrographic conditions observed during the survey are con-sistent with a geostrophic flow structure that depicts outflow on
Fig. 8. Comparison between observations and analytical solutions at Tongoy Bay entrance: (a) observed residual circulation, (b) analytical wind-driven flow, (c) analytical
density-driven flow, and (d) sum of wind and density-driven flows. All vies are seaward. Both axes are nondimensional and flows are normalized with the maximum
outflow (white regions). Orange shades indicate flows into the bay. (For interpretation of the references to color in this figure legend, the reader is referred to the web
version of this article.)
J. Moraga-Opazo et al. / Continental Shelf Research 31 (2011) 1991–19991998

Author's personal copy
the western portion of the bay. Moreover, the residual flowsobserved during the three surveys provide clear evidence of theinflows into Tongoy Bay on the eastern portion of the bay, withlocal wind-driven surface velocities toward the northwest.Furthermore, the formation of a single gyre within Tongoy Baycould be attributed to the size of the bay mouth (Valle-Levinsonand Moraga-Opazo, 2006).
Acknowledgments
Support from the Coquimbo Regional Government (FNDR) andthe Oyster Farmers Association (APOOCH) for the execution of theTongoy Larval Drift Analysis Project (BIP: 300005130-0) is grate-fully acknowledged. M. Ramos and M. Pizarro are grateful forsupport from FONDECYT grant 1080606. J. Moraga, M. Ramos andM. Pizarro are grateful for support from INNOVA-CORFOgrant (07CN13 IXM-150). AVL was supported by NSF projectOCE-0825876. Wind data were obtained from the Departmentof Geophysics, Universidad de Chile, and CERSAT, at IFREMER,Plouzane (France).
References
Acuna, E., Moraga, J., Uribe, E., 1989. La zona de Coquimbo: Un sistema neritico desurgencia de alta productividad. Revista de la Comision Permanente delPacıfico Sur (Numero Especial), 145–157.
Aiken, C.M., Castillo, M., Navarrete, S., 2008. A simulation of the Chilean CoastalCurrent and associated topografhic upwelling near Valparaıso, Chile. Conti-nental Shelf Research 28, 2371–2381.
Alaee, M.J., Ivey, G., Pattiaratchi, C., 2004. Secondary circulation induced by flowcurvature and Coriolis effects around headlands and islands. Ocean Dynamics54, 27–38.
Figueroa, D., Moffat, C., 2000. On the influence of topography in the induction ofcoastal upwelling along the Chilean coast. Geophysical Research Letters 27(23), 3905–3908.
Fonseca, T., Farıas, M., 1987. Estudio del proceso de surgencia en la costa chilenautilizando percepcion remota. Investigacion Pesquera 34, 33–46.
Marın, V., Delgado, L., 2007. Lagrangian observations of surface coastal flows northof 301S in the Humboldt Current system. Continental Shelf Research 27,731–743.
McCabe, R., MacCready, P., Pawlak, G., 2006. Form Drag due to Flow Separation at aHeadland. Journal of Physical Oceanography 36 (11), 2136–2152.
Moraga, J., Valdebenito, E., Rutllant, J., 2001. Condiciones oceanograficas durante lafase de relajacion de un evento de surgencia invernal frente a Punta Lengua deVaca, Coquimbo. Investigaciones Marinas, Valparaıso 29 (1), 59–71.
Moraga, J., Stotz, W., Berrıos, M., Munoz, P., Uribe, E., Bascunan, T., Valdebenito, E.,Valle-Levinson, A., Sepulveda, A., Ovalle, E., 2006. Informe Final Proyecto‘‘Analisis de Deriva Larval de Ostion en Bahıa Tongoy’’ Cod.BIP:30005130-0.Universidad Catolica del Norte, Facultad de Ciencias del Mar. Departamento deBiologia Marina. p. 123.
Neshyba, S., Mendez, R., 1976. Analisis de temperatura superficial del mar comoindicadores de movimientos de agua superficiales en el Pacifico Suroeste.Commision Permanente del Pacifico Sur 5, 129–137.
Pacheco, A., Olivares, J., Berrıos, M., 1987. Caracterizacion de calidad de agua ysedimentos en condiciones de invierno y verano en bahıa Tongoy. Informes deProyectos. Universidad del Norte.
Rutllant, J., Rosenbluth, B., Hormzabal, S., 2004. Intraseasonal variability of wind-forced coastal upwelling off central Chile 301S. Continental Shelf Research 24,789–804.
Rosenfeld, L.K., Schwing, F.B., Garfield, N., Tracy, D.E., 1994. Bifurcated flow froman upwelling center: a cold water source for Monterey Bay. Continental ShelfResearch 14, 931–964.
Stigebrandt, A., 1977. On the effect of barotropic current fluctuations on the two-layer transport capacity of a constriction. Journal of Physical Oceanography 7(118), 122.
Strub, P.T., Mesıas, J.M., Montecino, V., Rutllant, J., Salinas, S., 1998. Coastal oceancirculation off Wester South America. In: Robinson, A. (Ed.), The Sea, vol. 11. ,Wiley, pp. 273–313 (Chapter 13).
Tseng, T.H., Dietrich, D.E., Ferziger, J.H., 2003. Numerical simulation of regionalcirculation in the Monterey Bay region. Center for Turbulence Research,Annual Research Briefs (pp. 115–126).
Valle-Levinson, A., 2008. Density-driven exchange flow in terms of the Kelvin andEkman numbers. Journal of Geophysical Research 113, C04001. doi:10.1029/2007JC004144.
Valle-Levinson, A., Atkinson, L.P., Figueroa, D., Castro, L., 2003a. Flow induced byupwelling winds in an equatorward facing bay: Gulf of Arauco. Journal ofGeophysical Research 108 (0). doi:10.1029/2001J001272.
Valle-Levinson, A., Moraga-Opazo, J., Olivares, J., Blanco, J.L., 2000. Tidal andresidual circulation in a semi-arid bay: Coquimbo Bay, Chile. Continental ShelfResearch 20, 2009–2028.
Valle-Levinson, A., Moraga-Opazo, J., 2006. Bipolar residual circulation in twoequatorward facing bays. Continental Shelf Research 26, 179–193.
Valle-Levinson, A., Reyes, C., Sanay, R., 2003b. Effects of bathymetry, friction, androtation on estuary-ocean exchange. Journal of Physical Oceanography,2375–2393.
Warn-Varnas, A., Gangopadhyay, A., Hawkins, J.A., 2007. Water masses in theMonterey Bay during the summer of 2000. Continental Shelf Research 27,1379–1398.
Winant, C.D., 2004. Three dimensional wind-driven flow in an elongated rotatingbasin. Journal of Physical Oceanography 34 (2), 462–476.
Fig. 9. Conceptual representation of the cyclonic circulation forced by upwelling-
favorable winds over the Tongoy Bay area.
J. Moraga-Opazo et al. / Continental Shelf Research 31 (2011) 1991–1999 1999