Ridge–hotspot interaction: the Pacific–Antarctic Ridge and the foundation seamounts
JOURNAL OF GEOPHYSICAL RESEARCH, VOL. 95, NO. C1, PAGES 699-710, JANUARY 15, 1990
Geostrophic Transport Variability Along the Aves Ridge in the Eastern Caribbea Sea During 1985-1986
JOHN M. MORRISON AND ORSON P. SMITH
Department o• Marine, Earth and Atmospheric Sciences, North Carolina State University
Data from five cruises during 1985-1986 along 63.55øW, across the eastern Caribbean Sea, are examined for seasonal variability of gcostrophlc transport. A biannual maximum transport signal appears to correspond to that measured in the Florida Straits as well as to variations in the regional wind stress curl. Similar seasonal variations in the properties of water masses, entering the eastern margin of the basin and concentrated through the passages of the Lesser Antilles, are also indicated. A permanent system of strong westward flowing streams, interspersed by weaker eastward flowing streams, is shown to exist.
INTRODUCTION
Recent studies have shown that a significant uncertainty exists concerning the spatial and temporal variability of the current regime within the Caribbean Sea [e.g., Kinder et al., 1985]. Transport out of the region via the Gulf of Mex- ico through the Florida Straits has been monitored since 1982 with an accuracy of I x 10 e m a s -1 [Larsen and San- ford, 1985]. These measurements have confirmed that the Florida Current has a mean transport of 30 x 10 e m a s -• with a seasonal signal which tends to peak in early sum- mer [Larsen and Sanford, 1985], as observed previously by Nillet and Richardson [1973]. Investigators who have made measurements of the transport into the Caribbean Sea [e.g., Mazeika et al., 1980; Gordon, 1967; Morrison and Nowlin, 1982; Stalcup and Metcalf, 1972; Roernrnich, 1981] have not been fully consistent in their perceptions of spatial or tem- poral variability.
Water generally enters the Caribbean at its eastern mar- gin through the irregularly spaced passages between the Greater and Lesser Antilles islands and exits to the Gulf of Mexico through the Yucatan Straits. The Antilles are just downstream of the confluence of the westward flowing North Equatorial Current and the Guiana Current, which flows generally to the northwest from the southern hemi- sphere along the continental shelf of South America. The water of the Guiana Current is significantly influenced by the discharges of the Amazon and Orinoco rivers. The po- tential thus exists for variability to follow driving forces of both regional and hemispheric scales.
The maps of Hastenrath and Lamb [1977] show that al- though the winds over the subtropical North Atlantic are more intense during the winter, the magnitude of the wind stress curl is greater in the summer. Hellerman and Rosen- stein [1983] computed the 106-year averages of monthly wind properties for the world ocean, including surface stress, Sver- drup transport, and surface divergence. These distributions for the eastern Caribbean Sea show a maximum transport in midsummer and a greatly reduced transport in winter.
Copyright 1990 by the American Geophysical Union.
Paper number 89JC01491.
0148-0227/90/89JC-01491505.00
699
This transport variability agrees in phase with observations of the Florida Current transport.
20.0 ,, ,
' I ' I 19.0
18.0
17.0
16.0
15.0
14.0
13.0
12.0
11.0
10.0
, - 500.0 - " ' . - •. DE MARCIARITA
65.0 64.0 63.0 62.0 61.0 60.0
LONOITUDE (DEO W)
Fig. 1. Chart of the eastern Caribbean Sea, showing the track of 5 cruises of the NOAA Ship Researcher and the location of the Lesser Antilles to the east.
700 MORRISON AND SMITH: TRANSPORT VARIABILITY IN THE EASTERN CARIBBEAN SEA
1300.
1200ß
1100.
1000.
900.
DYNAMIC HEIGHTS (0/500 M)
CHARTED DEPTHS ALONG AVES S•ELL (63.55 DœO
x- • 8/85 CRUISE --x---x
•-- --+1/86 CRUISE •• • • *----* 3/86 CRUISE o c o7/86 CRUISE . • 10/86 ISE ,
,, --+., .,+ ,._ _.,--
0ß
500.
800.
700.
600.
500.
1000 :I= ß [.
400.
300.
200.
100.
1500.
2000.
11.5 12.0 12.5 13.0 13.5 14.0 14.5 15.0 15.5 16.0 16.5 17.0 LATITUDE
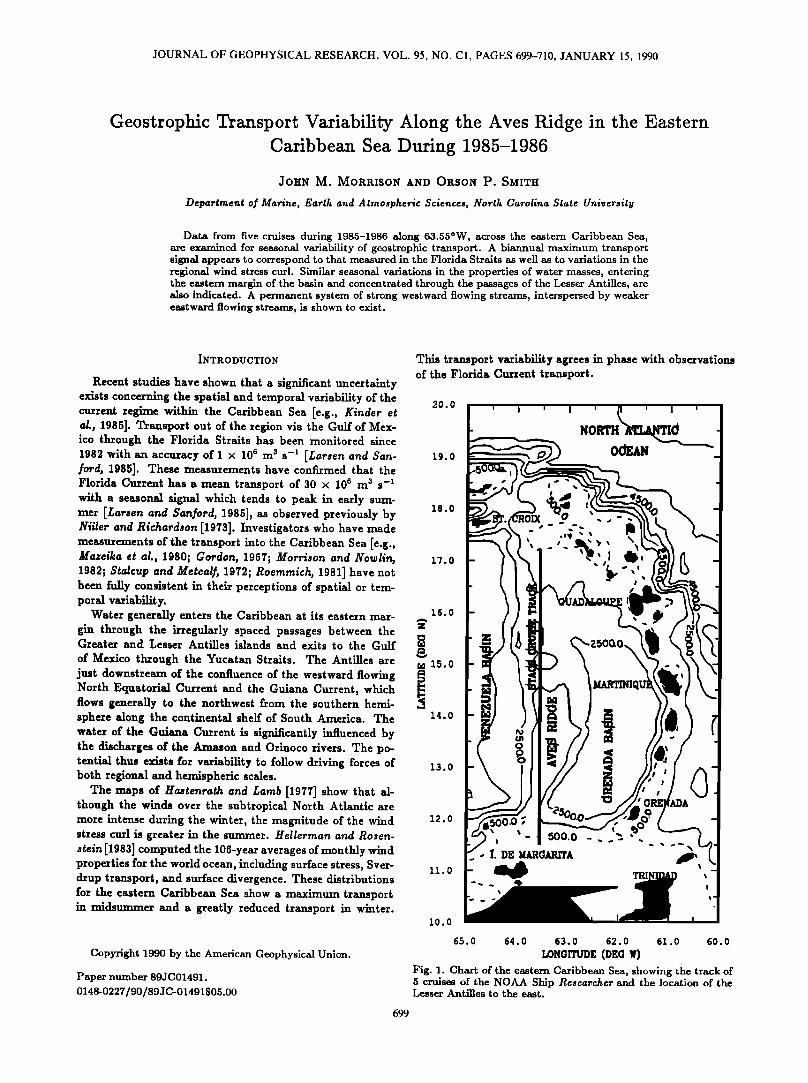
Fig. 2. Dynamic heights (0/500 m) along the Aves Ridge (63.55øW) for all five STACS Caribbean cruises. The charted bathymetry along this section is superimposed, •xs well as the approximate latitudes of the major passages through the Lesser Antilles.
The mean transport of 30 x 10 6 m s s -• for the Florida Straits is consistent with expectations based on integrat- ing the annual wind stress curl across the North Atlantic
at 31øN [Leetrnaa et al., 1977; Leetmaa and Bunker, 1978]. However, such an integration predicts a seasonal variation of the Florida Straits transport of 4- 15 x 106 m s s -• with a maximum in winter. The fact that neither the strength nor phase of the observed seasonal transport is consistent with the Sverdrup relationship implies that the dynamics gov- erning the mean flow must differ from those governing the seasonal variation lAnderson and Corry, 1985a]. Anderson and Corry [1985b] suggest that the meridional component of the wind stress forces the summer maximum, while the mean transport is forced primarily by the zonal wind stress CU/1 o
NEW MEASUREMENTS
A series of NOAA supported cruises aboard the NOAA ship Researcher were carried out as a part of the Subtropical Atlantic Climate Studies (STACS) Program. One objective of STACS is to quantify the percentage of the Florida Cur- rent transport which passes through the Lesser Antilles into the eastern Caribbean Sea. We use a subset of measure- ments from along the Aves Ridge at 63.55øW to quantify
the net westward flow through the Lesser Antilles. The data may also be indicative of the feasibility of future net trans- port measurements by monitoring the potential difference across existing telephone cables along Aves Ridge, in the manner now underway at the Straits of Florida [Larsen and Sanford, 1985]. A chart of the eastern Caribbean showing the position of this section in relation to the nearby Lesser Antilles is shown in Figure I . The section was occupied 5 times, in August 1985, January 1986, March 1986, July 1986, and October 1986, with a view toward resolution of the seasonal variability of the inflow.
CTD data were collected at 20- to 40-kin intervals along Aves Ridge and Pegasus profiles [Spain et al., 1981] of absolute velocity were collected at 12.5øN, 13.5øN, 15øN, and 16.5øN [Wilburn et al., 1987a, b]. Continuous acoustic doppler current profiles (ADCP) of the upper 200 m were also measured during each cruise, as described by Smith and Morrison [1989].
GEOSTROPHIC COMPUTATIONS
Re.•erenee Level
The most significant of the major passages through the Lesser Antilles is Grenada Passage, which has a charted sill
MORRISON AND SMITH: TRANSPORT VARIABILITY IN THE EASTERN CARIBBEAN SEA 701
20
18
16
14
12
IO 66 64 62_. 60
LONG ITUD E (DEG W)
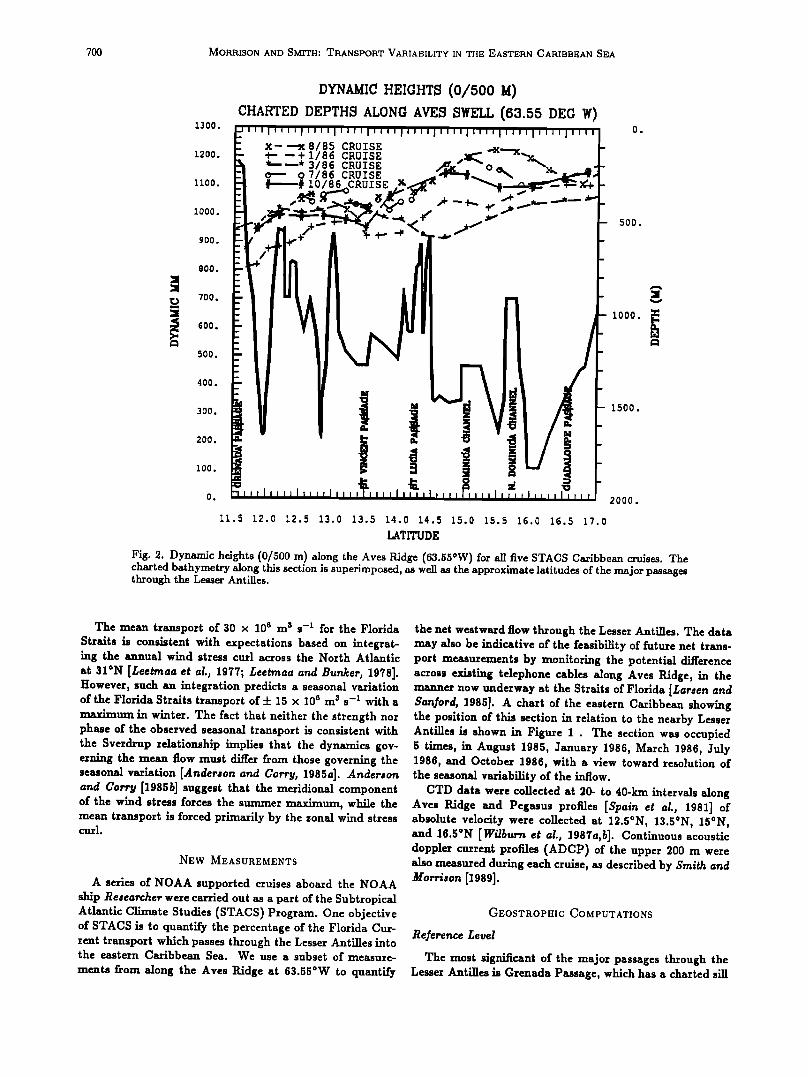
Fig. 3. Vertically averaged current vectors in the upper 200 m, measured by acoustic doppler current profiler on five cruises of the NOAA Ship Researcher along 63.55øW.
depth of approximately 740 m. Morrison and Nowlin [1982] showed that the major portion of the transport of water through the passage from the Atlantic to the Caribbean oc- curs above 625 m. In addition, the sill depth for the Florida Straits is approximately 750 m. Therefore a reference level is sought which will best resolve the transport and velocities in at least the upper 600-700 m. This is difficult along Aves Ridge, as the bottom topography is very irregular, with a number of peaks above this level (see Figures I and 2).
Figure 2 shows that dynamic heights, referenced to zero velocity at 500 dB, generally increase from south to north, indicating net westward flow through this section. Intermit- tent decreases in dynamic height indicate episodes of east- ward flow on all five cruises, approximately between 12.50 and 13.5øN, and north of 15øN, with the exception of March 1986.
The STACS Caribbean Pegasus station positions were chosen based on the findings of Morrison and Nowlin [1982], with the intent of measuring eastward flows. STACS ADCP measurements [Smith and Morrison 1989] with improved spatial resolution of mean currents in the upper 200 m show that Pegasus profiles on all five STACS cruises tended in- stead to be located at points of transition from westward flow to eastward flow. ADCP measurements also show the
currents to be consistently strongest near the surface and highly variable in mean direction and magnitude all along the nearly 700-kin cruise track. Figure 3 is an example of
average current vectors in the upper 200 m, as measured by ADCP.
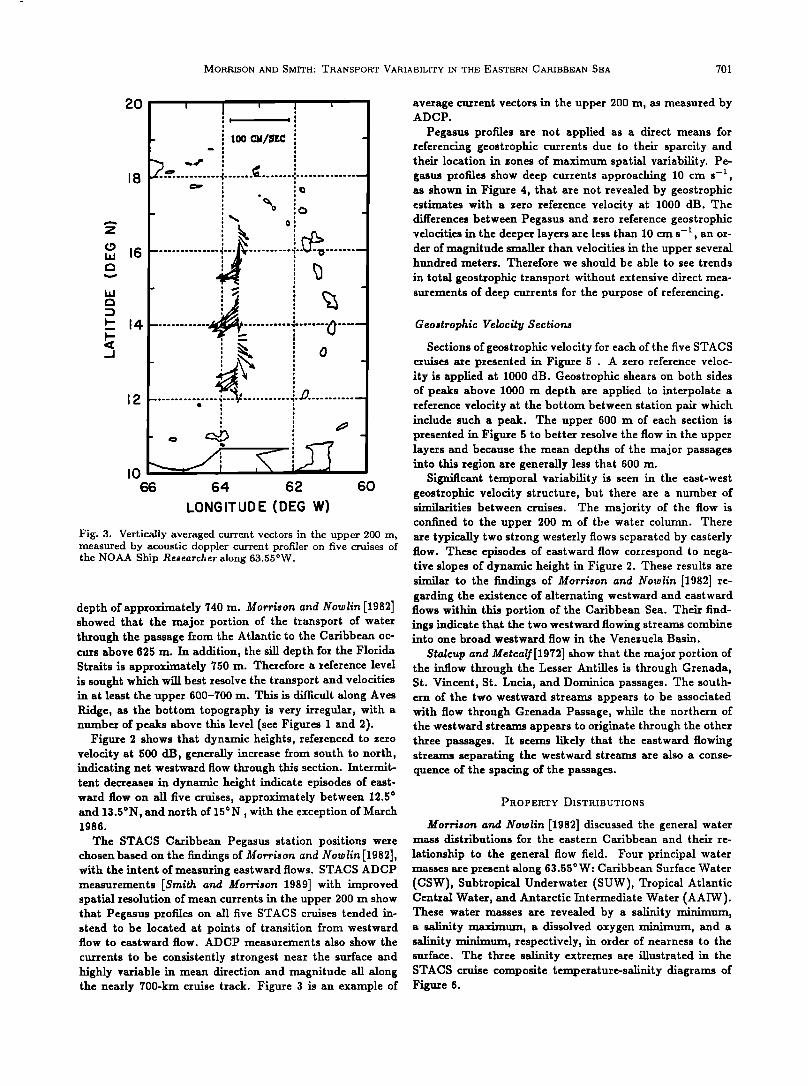
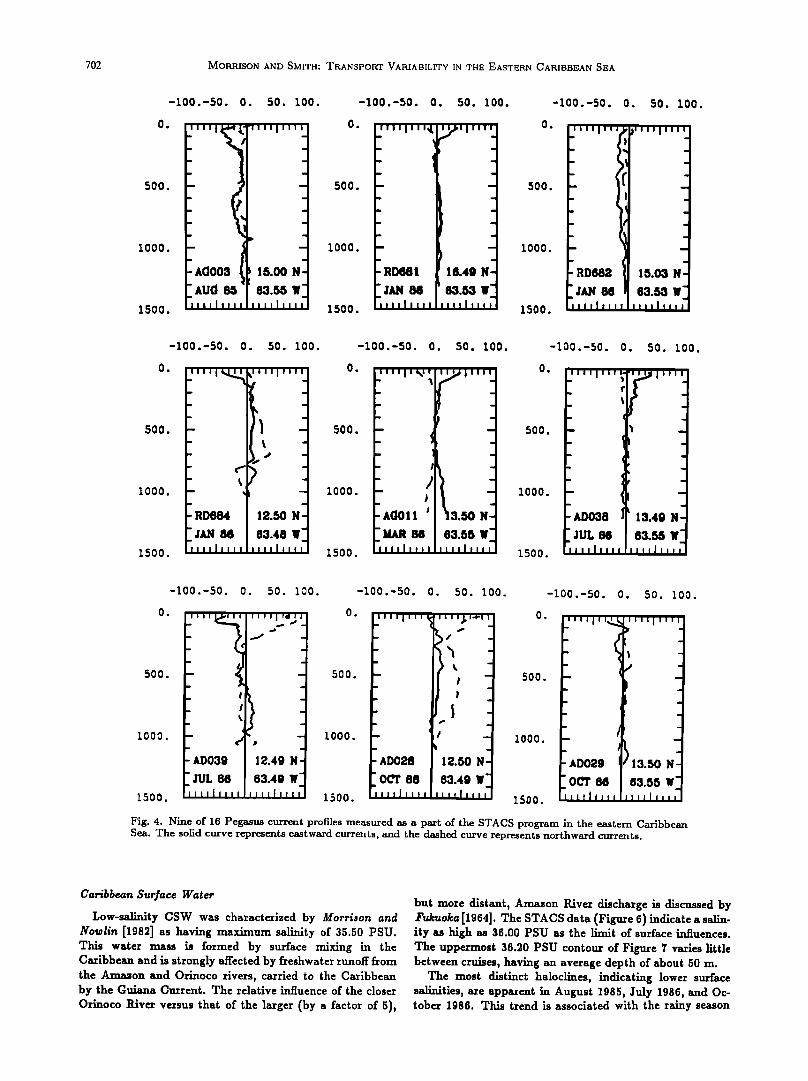
Pegasus profiles are not applied as a direct means for referencing geostrophic currents due to their sparcity and their location in zones of maximum spatial variability. Pe- gasus profiles show deep currents approaching 10 cm s -•, as shown in Figure 4, that are not revealed by geostrophic estimates with a zero reference velocity at 1000 dB. The differences between Pegasus and zero reference geostrophic velocities in the deeper layers are less than 10 cm s -• , an or- der of magnitude smaller than velocities in the upper several hundred meters. Therefore we should be able to see trends
in total geostrophic transport without extensive direct mea- surements of deep currents for the purpose of referencing.
Geostrophic Velocity Sections
Sections of geostrophic velocity for each of the five STACS cruises are presented in Figure 5 . A zero reference veloc- ity is applied at 1000 dB. Geostrophic shears on both sides of peaks above 1000 m depth are applied to interpolate a reference velocity at the bottom between station pair which include such a peak. The upper 600 m of each section is presented in Figure 5 to better resolve the flow in the upper layers and because the mean depths of the major passages into this region are generally less that 600 m.
Significant temporal variability is seen in the east-west geostrophic velocity structure, but there are a number of similarities between cruises. The majority of the flow is confined to the upper 200 m of tl;e water colunto. There are typically two strong westerly flows separated by easterly flow. These episodes of eastward flow correspond to nega- tive slopes of dynamic height in Figure 2. These results are similar to the findings of Morrison and Nowlin [1982] re- garding the existence of alternating westward and castward flows within this portion of the Caribbean Sea. Their find- ings indicate that the two westward flowing streams combine into one broad westward flow in the Venezuela Basin.
Stalcup and Metcalf [1972] show that the major portion of the inflow through the Lesser Antilles is through Grcnada, St. Vincent, St. Lucia, and Dominies passages. The south- ern of the two westward streams appears to be associated with flow through Grenada Passage, while the northern of the westward streams appears to originate through the other three passages. It seems likely that the eastward flowing streams separating the westward streams are also a conse- quence of the spacing of the passages.
PROPERTY DISTRIBUTIONS
Morrison and Nowlin [1982] discussed the general water mass distributions for the eastern Caribbean and their re-
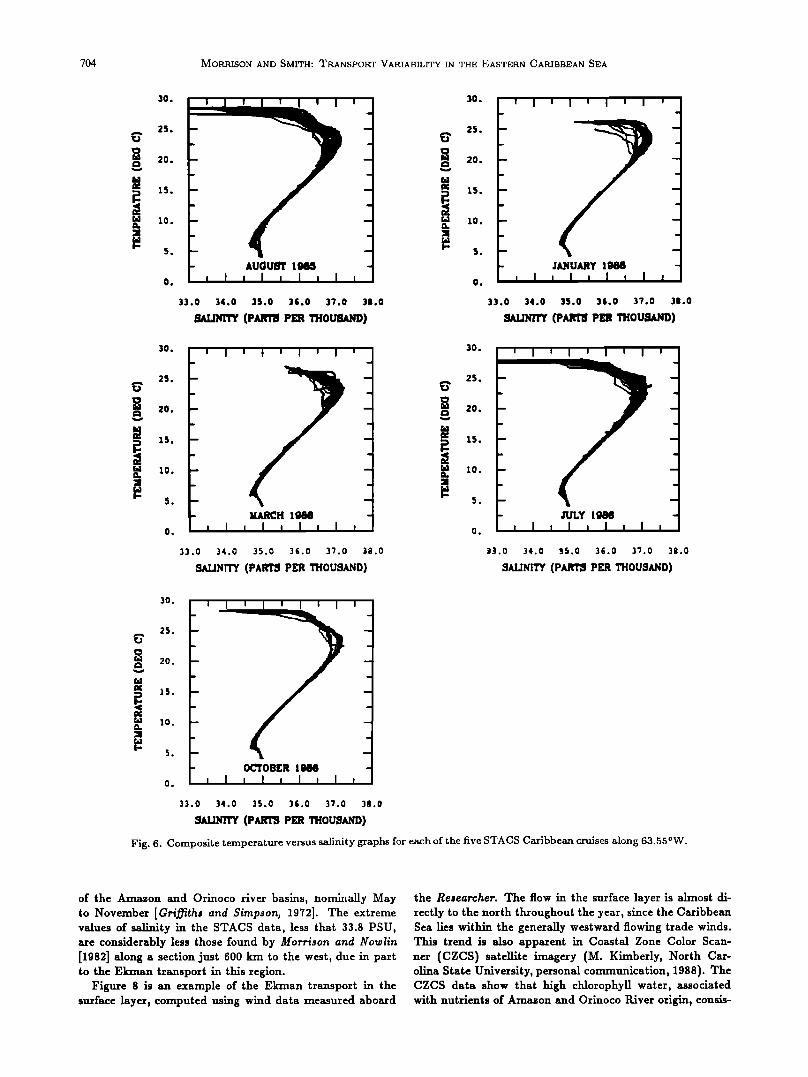
lationship to the general flow field. Four principal water masses are present along 63.55øW: Caribbean Surface Water (CSW), Subtropical Underwater (SUW), Tropical Atlantic Central Water, and Antarctic Intermediate Water (AAIW). These water masses are revealed by a salinity minimum, a salinity maximum, a dissolved oxygen minimum, and a salinity minimum, respectively, in order of nearness to the surface. The three salinity extremes are illustrated in the STACS cruise composite temperature-salinity diagrams of Figure 6.
702 MORRISON AND SMITH: TRANSPORT VARIABILITY IN THE ]•ASTERN CARIBBEAN SEA
-100.-50. O. 50. 100. 50. 100.
500. • - :
lOOO
ACIO0
150 O.
500.
1000.
-100.-50. O.
O. m
m
m
m
m
m
- RD681
JAN 88
1500.
16.4g N-
63.53 W
-100.-50. O.
O.
500.
1000.
1500.
RD682 1,5.03
JAN 88 83.53
50. 100.
-100.-50. O. 50. 100. -100.-50. O. 50. 100.
O. O.
500 500
1000 1000
L ADOII ' 3.50 1500. 1500. •.NAR 86 83.55
-100.-50. O. 50. 100.
O. ,•,1• • ll,, • 500.
-'ADO38 J 13.49 N-'
•tlll!1111 ' 1500. •l ,•1 '1•!
-100.-50. O. 50. 100. -100.-50. O. 50. 100. -100.-50. O. 50. 100.
oo. oo. oo. 1000. tOO0. 1000.
• ADO3, I 12.49 N D029 !3.5'0 N' 1500. 1500. 1500. IL•,•l,•,•!,,,ll•lt•
Fig. 4. Nine of 16 Pegasus current profiles measured as a part of the STACS program in the eastern Caribbean Sea. The solid curve represents eastward currents, and the dashed curve represents northward currents.
Caribbean Surface Water
Low-salinity CSW was characterized by Morrison and Nowlin [1982] as having maximum salinity of 35.50 PSU. This water mass is formed by surface mixing in the Caribbean and is strongly affected by freshwater runoff from the Amazon and Orinoco rivers, carried to the Caribbean by the Guiana Current. The relative influence of the closer
Orinoco PAver versus that of the larger (by a factor of 5),
but more distant, Amazon PAver discharge is discussed by Fukuoka [1964]. The STACS data (Figure 6) indicate a salin- ity as high as 36.00 PSU as the limit of surface influences. The uppermost 36.20 PSU contour of Figure 7 varies little between cruises, having an average depth of about 50 m.
The most distinct haloclines, indicating lower surface salinities, are apparent in August 1985, July 1986, and Oc- tober 1986. This trend is associated with the rainy season

MORRISON AND SMITH: TRANSPORT VARIABILITY IN THE EASTERN CARIBBEAN SEA 703
GEOS'I'ROPHIC VELOCITY (0/10OO) FOR AUGUST 198,5 D•RE• LATITUD•
11.5 12.5 13 5 14.5 15.5 16.5 •['ATIOf, I POnITlOff O.
-1oo.
-200.
-300.
-400.
-500.
-600.
-1oo
-2oo -300
-400
-500
-600
GEOSTROPHIC VELOCITY (O/IOOO) FOR JANUARY 1988
11.5 12.5 13.5 14.5 15.5' 16.5
_
CC•TOUI• FIK3N -7e.OOO 'TO llO.OO CalITOU• ll•l•f•L •' !O.OOe
GEOSTROPHIC VELOCITY (0/10OO) FOR MARCH 1986 GEOgrROPHIC VELOCITY (O/IOOO) FOR JULY 1986 DEOR[• LATrrUDg Dt•REE• LATITUD•
m.•m•m 0 11 5 12.5 13.5 14.5 15.5 16.5 •^•,m 11.5 12.5 13.5 14 5 15.5 16,5 ß ,.o..,,,,,, o. .':•" ' '.-'•:
-!0o. -lOO.
• -200. -200.
-oo. -400ß -400.
-500. -500.
-600. -600 , COtJl'•gB {"Jt•{ -•,O.#O 1'0 160.OO • m'I'•IV&L eS' 10.O•O C•g'!'•UR • •.• • 130.00
GEO•ROPHIC VE•• (0/IO•) FOR •OBER 19•
_ _ 11.5 12.5 13.5 14.5 15.5 16.5
.... / .'
-400.
-500. -600
Fig. 5. Sections of relative geostrophic speed in units of centimeters per second for the five STACS cruises along the Aves Ridge, referenced to 1000 dB or the greatest common depth between stations. The hashed portions represent flow to the east. At the bottom of each section the contour interval and the minimum (eastward flow) and maximum (westward flow) geostrophic velocities reached on each section are indicated.
704 MORRISON AND SMITH: TRANSPORT VARIABILITY IN THE EASTERN CARIBBEAN SEA
30.
25.
20.
X0.
0e
AUGUST lg•q
33.0 34.0 35.0 3&.0 37.0 38.0
NALDnTY (PART• PER THOUNAgD)
30.
25.
20.
1..5.
10.
33.0 34.0 3S.0 3&.0
30.
25. 2.0.
15.
1.0.
O.
MARCH I I
33.0 34.0 35.0 3•.0 37.0 38.0
•ALINITY (PART• PER THOUSAND)
30.
2.5.
20.
15.
lo.
0o
JULY
3:1.0 34.0 3,•.0 3&.O 3'7.0 38.0
•ALiNI• (PART8 PER THOUSAND)
30.
25.
20.
15.
]o.
OCTOBER
33.0 34.0 35.0 3&.0 37.0 38.0
SALINITY (PAR'• PER THOUSAND)
Fig. 6. Composite temperature versus salinity graphs for each of the five STACS Caribbean cruises along 63.55øW.
of the Amazon and Orinoco river basins, nominally May to November [Gri.•fiths and Simpson, 1972]. The extreme values of salinity in the STAGS data, less that 33.8 PSU, are considerably less those found by Morrison and Notolin [1982] along a section just 600 km to the west, due in part to the Ekman transport in this region.
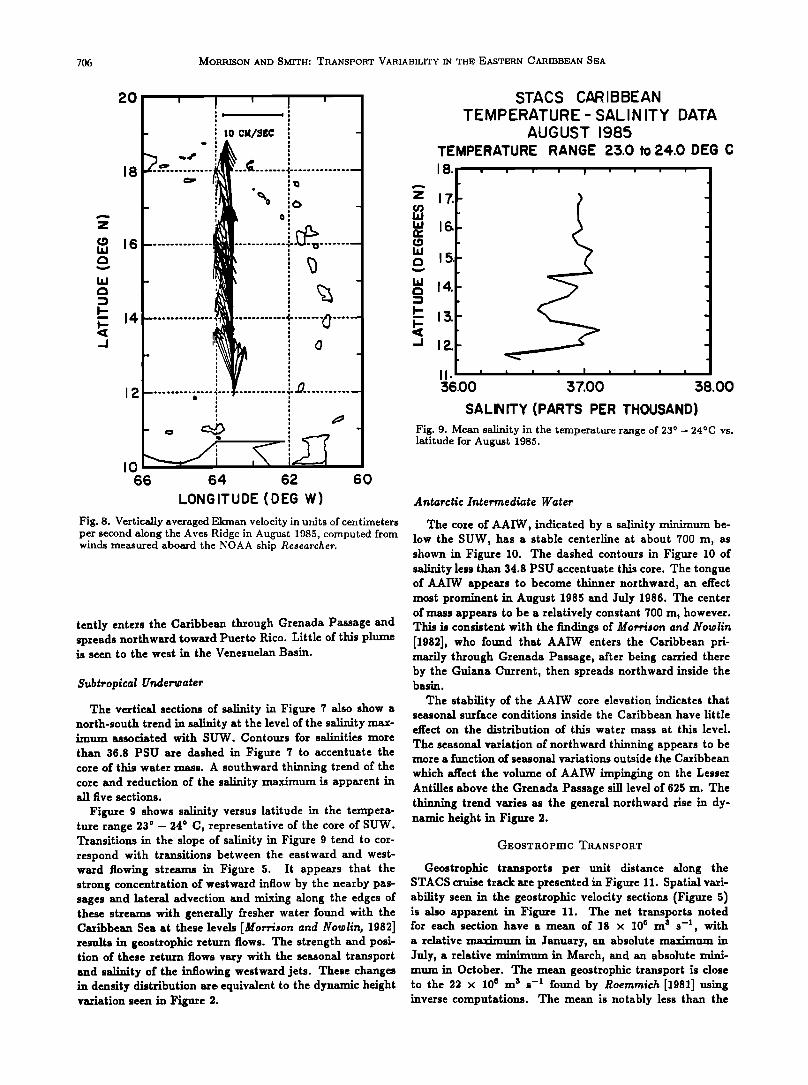
Figure 8 is an example of the Ekrnan transport in the surface layer, computed using wind data measured aboard
the Researcher. The flow in the surface layer is almost di- rectly to the north throughout the year, since the Caribbean Sea lies within the generally westward flowing trade winds. This trend is also apparent in Coastal Zone Color Scan- ner (CZCS) satellite imagery (M. Kimberly, North Car- olina State University, personal communication, 1988). The CZCS data show that high chlorophyll water, associated with nutrients of Amazon and Orinoco tLiver origin, consis-
MORRISON AND SMITH: TRANSPORT VARIABILITY IN THE EASTERN CARIBBEAN SEA 705
SALINITY (PPT) AUGUST 1985
O.
50.
z 15o.
250.
$00. 11.5 12.5 15.5 14.5 15.5 16.5
DEGREES LATITUDE
SALINITY (PPT) '-- dANMARY 1986
O.
50.
•.200.
250.
::•0. 11.5 12.5 15.5 14.5 15.5 16.5
DEGREES LATITUDE
O.
50.
z 150.
•.200.
250.
300.
SALINITY (PPT) -- MARCH 1986
H,•,','l''''l''''' I'''' I'''' I'''' I'' '' •'''' I''' ' .
--
ß
ß ,,
:•'....,'i"'::: :ø"i._,, ..--: .
11.5 12.5 13.5 14.5 15.5 16.5
DEGREES LATITUDE
SALINITY (PPT) ---OCTOBER 1986
SALINITY
ß
DEGREES LATITUDE
O.
z. •so. ",, .
,?,200.
250.
:300. ' " 11.5 12.5 13.5 14.5 15.5 16.5
DEGREES LATITUDE
JULY 1986
!•5 16.5
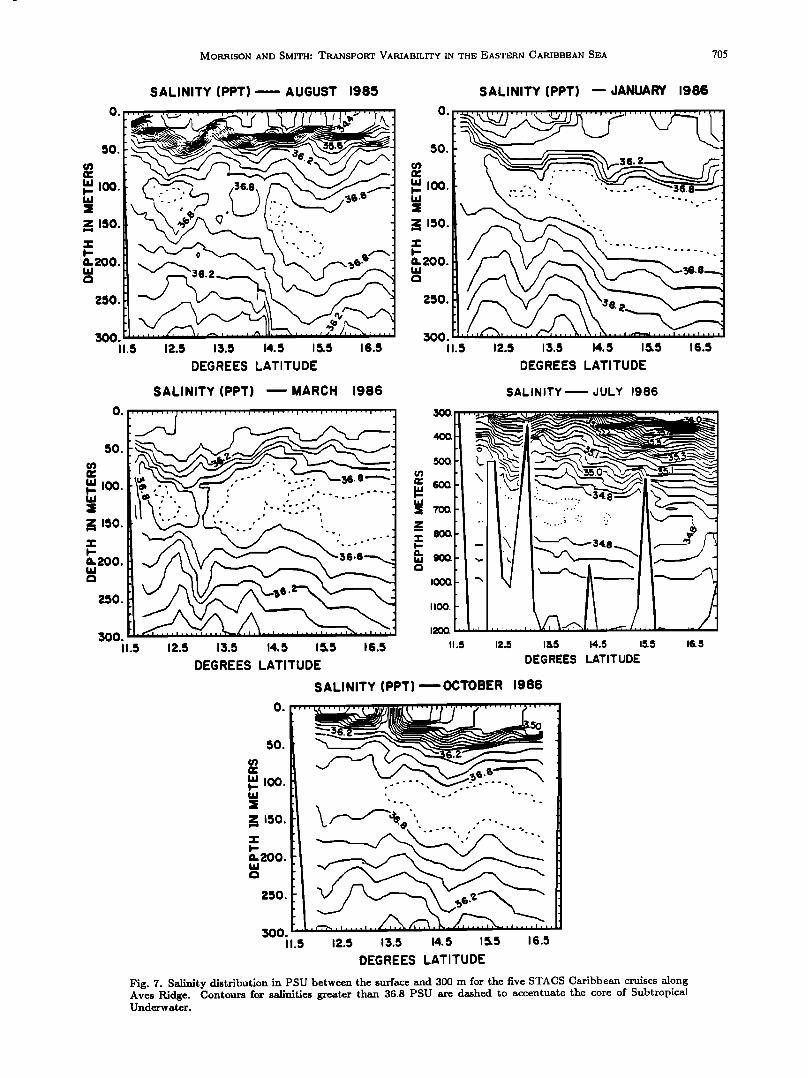
Fig. 7. Salinity distribution in PSU between the surface and 300 m for the five STACS Caribbean cruises along Aves Ridge. Contours for salinities greater than 36.8 PSU are dashed to accentuate the core of Subtropical Underwater.
706 MORRISON AND SMITH: TRANSPORT VARIABILITY IN THE EASTERN CARIBBEAN SEA
- : :o cM/•zc i -
œ
-
12 .......... • : : :
,o , 66 64 62 60
10NeItUDg W
Fig. 8. Vc•ic•]y avcragc• Ekman velocity in uMts of centimeters per sccon• along •he Aves •idgc in Au•st 1985, computed from win& mcas•c• a•o• the NOAA ship
tenfly enters the Caribbean through Grenada Passage and spreads northward toward Puerto Rico. Little of this plume is seen to the west in the Venezuelan Basin.
Subtropical Underwater
The vertical sections of salinity in Figure 7 also show a north-south trend in salinity at the level of the salinity max- imum associated with SUW. Contours for salinities more
than 36.8 PSU are dashed in Figure 7 to accentuate the core of this water mass. A southward thinning trend of the core and reduction of the salinity maximum is apparent in all •ve sections.
Figure 9 shows salinity versus latitude in the tempera- ture range 230 - 240 C, representative of the core of SUW. Transitions in the slope of salinity in Figure 9 tend to cor- respond with transitions between the eastward and west- ward flowing streams in Figure 5. It appears that the strong concentration of westward in/low by the nearby pas- sages and lateral advection and mixing along the edges of these streams with generally freshet water found with the Caribbean Sea at these levels [Morrizon and Nowlin, 1982] results in geostrophic return flows. The strength and posi- tion of these return flows vary with the seasonal transport and salinity of the inflowing westward jets. These changes in density distribution arc equivalent to the dynamic height variation seen in Figure 2.
TEMPERATURE
[
II. ' ' ' ' • 56.00 57.00
STACS CARIBBEAN TEMPERATURE - SALINITY DATA
AUGUST 1985 RANGE 2:5.0 to 24.0 DEG C
I i i
38.00
SALINITY (PARTS PER THOUSANO)
Fig. 9. Mean salinity in the temperature range of 230 - 24øC vs. latitude for August 1985.
Antarctic Intermediate Water
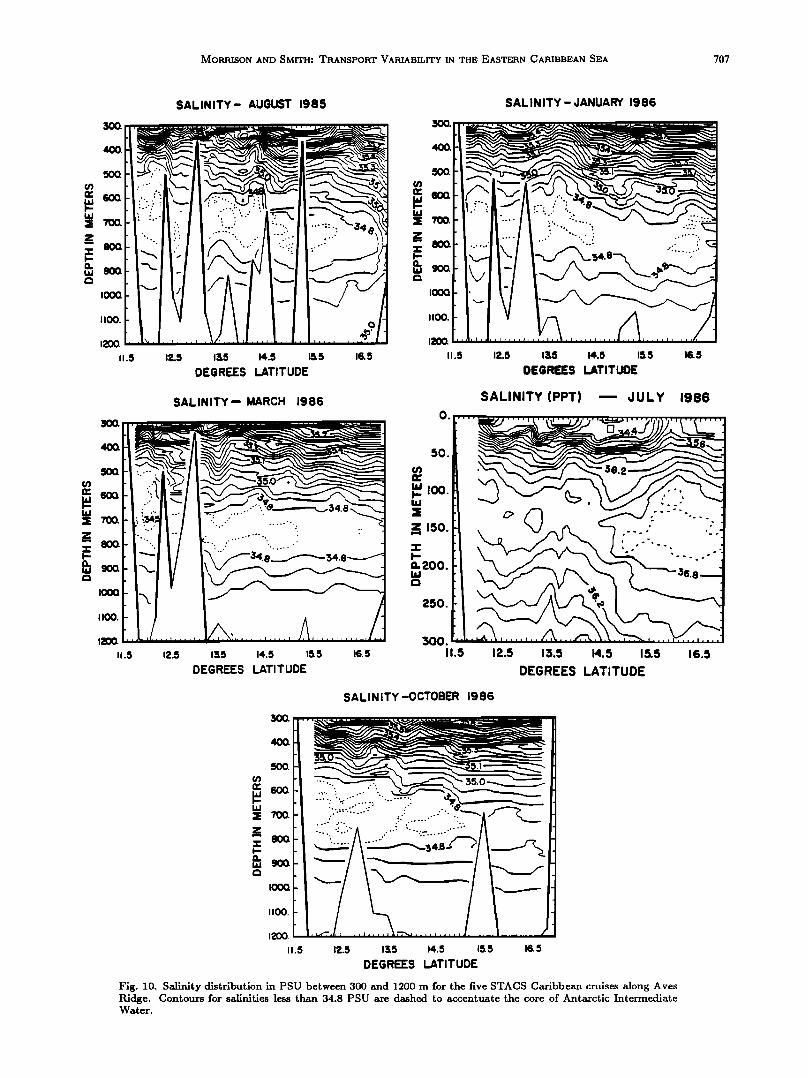
The core of AAIW, indicated by a salinity minimum be- low the SUW, has a stable centerline at about 700 m, as shown in Figure 10. The dashed contours in Figure 10 of salinity less than 34.8 PSU accentuate this core. The tongue of AAIW appears to become thinner northward, an effect most prominent in August 1985 and July 1986. The center of mass appears to be a relatively constant 700 m, however. This is consistent with the findings of Morrizon and Nowlin [1982], who found that AAIW enters the Caribbean pri- marily through Grenada Passage, after being carried there by the Guiana Current, then spreads northward inside the basin.
The stability of the AAIW core elevation indicates that seasonal surface conditions inside the Caribbean have little
effect on the distribution of this water mass at this level.
The seasonal variation of northward thinning appears to be more a function of seasonal variations outside the Caribbean
which affect the volume of AAIW impinging on the Lesser Antilles above the Grenada Passage sill level of 625 m. The thinning trend varies as the general northward rise in dy- namic height in Figure 2.
GEOSTROPHIC TRANSPORT
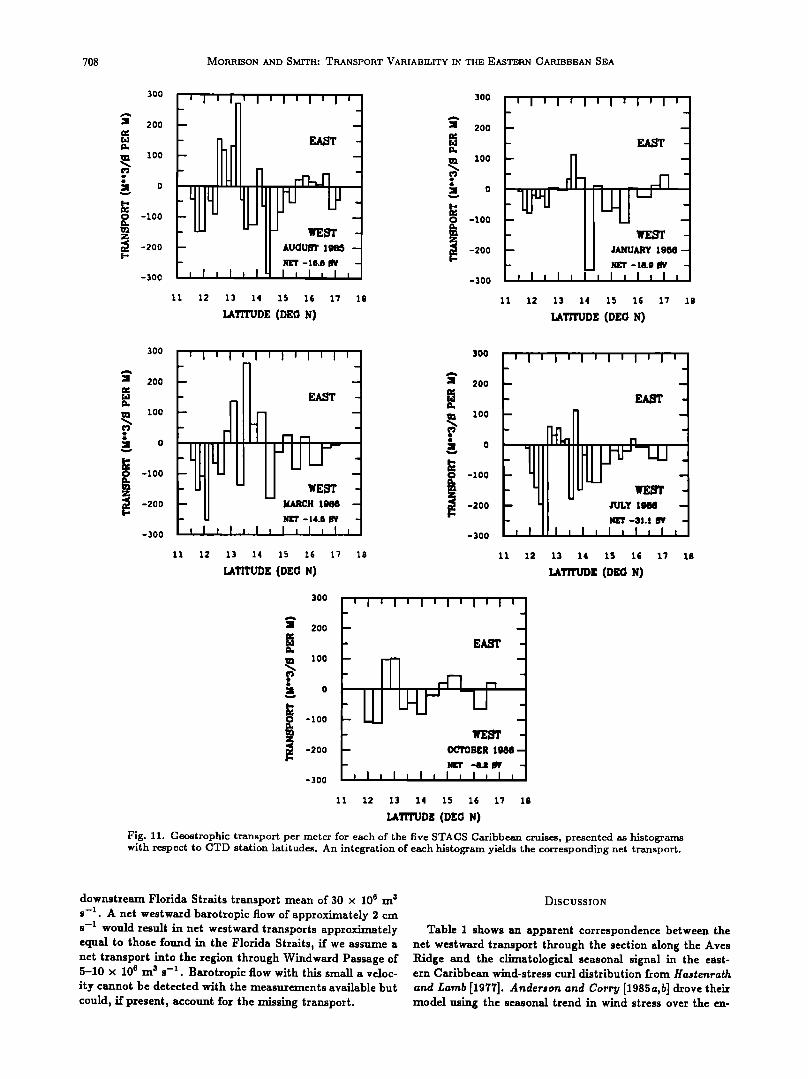
Geostrophic transports per unit distance along the STACS cruise track are presented in Figure 11. Spatial vari- ability seen in the geostrophic velocity sections (Figure 5) is also apparent in Figure 11. The net transports noted for each section have a mean of 18 x 106 m z s -•, with a relative maximum in January, an absolute maximum in July, a relative minimum in March, and an absolute mini- mum in October. The mean geostrophic transport is close to the 22 x 106 m z s -• found by Roeromich [1981] using inverse computations. The mean is notably less than the
MORRISON AND SMITH: TRANSPORT VARIABILITY IN THE EASTERN CARIBBEAN SEA 707
z
IOOO
11.5
I•X•
11.5
SALINITY- AUGUST 1985
12.5 1&5 14.5 15.5 16.5
DEGREES LATITUDE
SALINITY-- MARCH 1986
400.
z
1200.
11.5
SALINITY- JANUARY 1986
12.5 1:•5 14.5 15 5 16. 5
DEGRrI=S LATITUDE
O.
SALINITY(PPT) -- JULY 1986
12.5 1•5 14.5 15.5
DEGREES LATITUDE
50.
,so.
•.200.
250.
::•)0. 16.5 11.5 12.5 13.5 14.5 15•5 16.5
DEGREES LATITUDE
SALINITY-OCTOBER 1986
z
ILOO.
12oo.
11.5 12.5 1&5 14.5 15.5 16.5
DEGREES LATITUDE
Fig. 10. Salinity distribution in PSU between 300 and 1200 m for the five STACS Caribbean cruises along Aves Ridge. Contours for salinities less than 34.8 PSU are dashed to accentuate the core of Antarctic Intermediate Water.
708 MORRISON AND SMITH: TRANSPORT VARIABILITY IN THE EASTERN CARIBBEAN SEA
3OO
200
100
0
-lOO
-200
-300
' I , I., I , I', I t I
- ' E:A•'I' .
-- AUGUST
- NET -10.8
t I , t , I I t I S I t
11 12 13 14 15 16 17 18
lATITUDE (DEC N)
300
200
100
-lOO
-200 -300
, I I I , I I I I I , I , . --
- EAST -
: u_[_t" :
- W'E:,• - -- JANUARY 1986-
- NET -18.0 IW - I I t I I I t I I I [ I ,
11 12 13 14 15 16 17
lATITUDE (DEC N)
18
300
200
100
-lOO
-200 -300
' I I I I I I I I I I I I
_ H EAST -
NET -14.5 fly
t I I I I I I I t I I I I
11 12 13 14 15 16 17
lATITUDE (DEC N)
16
300
200
100
-100
-200 -300
'l I i I I I I I I I I I' I
JULY i088
NET-31.1 ff• I , I I I I I i I t
11 12 13 14 15 16 17 18
LATITUDE (DEO N)
300
200
lOO
o
-lOO
-200 -300
, I I I I I I I , I i I • -- .,
- IC• -
-- OCTOBER 1986--
- art -e.z OV - , I, I t I , I t I , I ,
11 12 13 14 15 16 17 18
lATITUDE (DEG N)
Fig. 11. Geostrophic transport per meter for each of the five STACS Caribbean cruises, presented as histograms with respect to CTD station latitudes. An integration of each histogram yields the corresponding net transport.
downstream Florida Straits transport mean of 30 x 106 m 3 s -z. A net westward barotropic flow of approximately 2 cm s -z would result in net westward transports approximately equal to those found in the Florida Straits, if we assume a net transport into the region through Windward Passage of 5-10 x 106 m 3 s -z. Barotropic flow with this small a veloc- ity cannot be detected with the measurements available but
could, if present, account for the missing transport.
DISCUSSION
Table 1 shows an apparent correspondence between the net westward transport through the section along the Aves Pddge and the climatological seasonal signal in the east- ern Caribbean wind-stress curl distribution from tfaatenrath
and Lamb [1977]. Anderaon and Corry [1985a, b] drove their model using the seasonal trend in wind stress over the en-
MORRISON AND SMITH: TRANSPORT VARIABILITY IN THE EASTERN CARIBBEAN SEA 709
TABLE 1. Geostrophic Net Transport across Aves Ridge versus Regional Climatic Wind Stress Curl
Net Geostrophic Regional Climatic Month Transport Sv Wind Stress Curl
January - 18.9 relative maximum March - 14.5 relative minimum
July -31.1 absolute maximum October -8.2 absolute minimum
Negative net transport indicates westward flow. These trans- ports were estimated from STACS data, applying a 1000-dB zero reference level, as described in the text. The distribution of cli- matic wind stress curl follows tIastenrath and Lamb, 1977.
tire eastern part of the North Atlantic. The seasonal signal for their simulation of inflow through the Lesser Antilles is in phase with the signal seen in the STACS geostrophic transports and has a magnitude of 4- 6 x 10⁶ m a s -•. The magnitude and phase of the seasonal transport signal is on the same order as that obtained by integrating the annual wind-stress curl across the North Atlantic at 31øN [Leerrhea et el., 1977; Leetrnaa and Bunker, 1978].
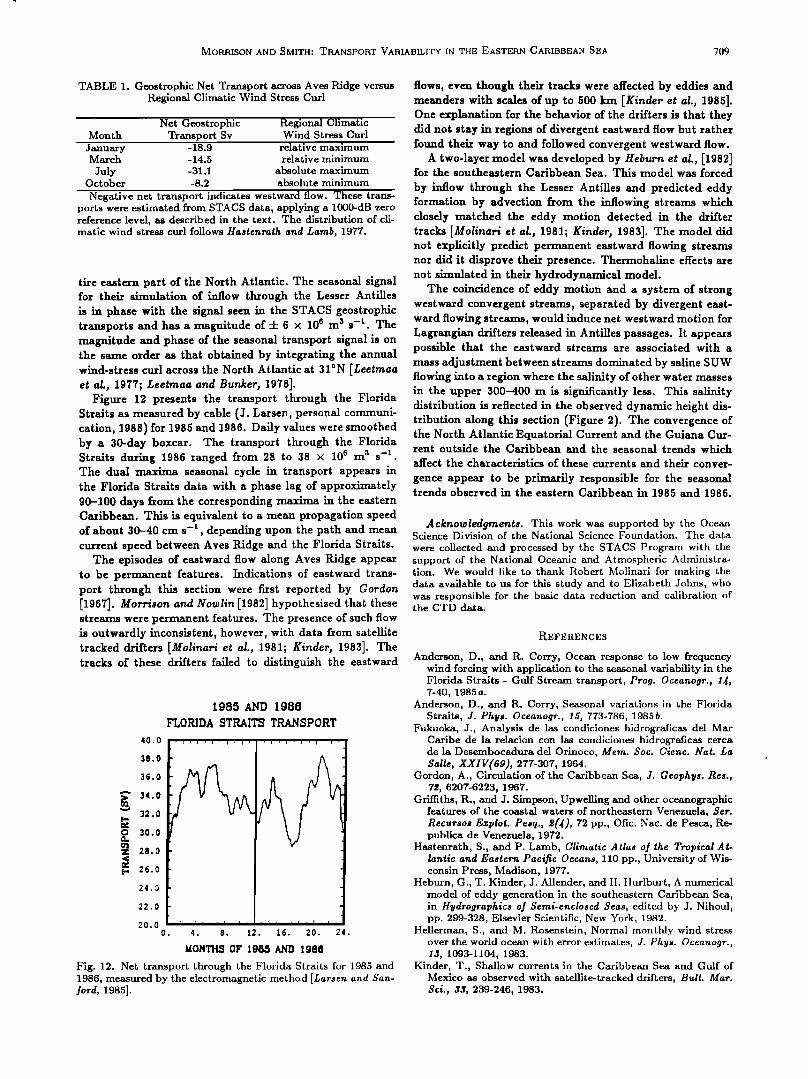
Figure 12 presents the transport through the Florida Straits as measured by cable (J. Larsen, personal communi- cation, 1988) for 1985 and 1986. Daily values were smoothed by a 30-day boxcar. The transport through the Florida Straits during 1986 ranged from 28 to 38 x 106 m a s -•. The dual maxima seasonal cycle in transport appears in the Florida Straits data with a phase lag of approximately 90-100 days from the corresponding maxima in the eastern Caribbean. This is equivalent to a mean propagation speed of about 30-40 cm s -• , depending upon the path and mean current speed between Aves Ridge and the Florida Straits.
The episodes of eastward flow along Aves Ridge appear to be permanent features. Indications of eastward trans- port through this section were first reported by Gordon [1967]. Morrison and Nowlin [1982] hypothesized that these streams were permanent features. The presence of such flow is outwardly inconsistent, however, with data from satellite tracked drifters [Molinari et el., 1981; Kinder, 1983]. The tracks of these drifters failed to distinguish the eastward
1985 AND 1986
FLORIDA STRAITS TRANSPORT
40.0
38.0
36.0
•. 34.0
"' 32.0
o 30.0
z 28.0
• 26.0
24.•
22.0
20.0 O. 4. 8. 12. 16. 20. 24.
I•ONTHS OF 1965 AND 1985
Fig. 12. Net transport through the Florida Straits for 1985 and 1986, measured by the electromagnetic method [Larsen and San- ford, 1985].
flows, even though their tracks were affected by eddies and meanders with scales of up to 500 km [Kinder et el., 1985]. One explanation for the behavior of the drifters is that they did not stay in regions of divergent eastward flow but rather found their way to and followed convergent westward flow.
A two-layer model was developed by Heburn et el., [1982] for the southeastern Caribbean Sea. This model was forced
by inflow through the Lesser Antilles and predicted eddy formation by advection from the infiowing streams which closely matched the eddy motion detected in the drifter tracks [Molinari et el., 1981; Kinder, 1983]. The model did not explicitly predict permanent eastward flowing streams nor did it disprove their presence. Thermohaline effects are not simulated in their hydrodynamical model.
The coincidence of eddy motion and a system of strong westward convergent streams, separated by divergent east- ward flowing streams, would induce net westward motion for Lagrangian drifters released in Antilles passages. It appears possible that the eastward streams are associated with a mass adjustment between streams dominated by saline SUW flowing into a region where the salinity of other water masses in the upper 300-400 m is significantly less. This salinity distribution is reflected in the observed dynamic height dis- tribution along this section (Figure 2). The convergence of the North Atlantic Equatorial Current and the Guiana Cur- rent outside the Caribbean and the seasonal trends which affect the characteristics of these currents and their conver-
gence appear to be primarily responsible for the seasonal trends observed in the eastern Caribbean in 1985 and 1986.
Acknowledgments. This work was supported by the Ocean Science Division of the National Science Foundation. The data
were collected and processed by the STACS Program with the support of the National Oceanic and Atmospheric Administra- tion. We would like to thank Robert Molinari for making the data available to us for Offs study and to Elizabeth Johns, who was responsible for the basic data reduction and calibration of the CTD data.
REFERENCES
Anderson, D., and R. Corry, Ocean response to low frequency wind forcing with application to the seasonal variability in the Florida Straits - Gulf Stream transport, Prog. Oceanogr., 14, 7-40, 1985 a.
Anderson, D., and R. Corry, Seasonal variations in the Florida Straits, J. Phys. Oceanogr., 15, 773-786, 1985b.
Fukuoka, J., Analysis de las condiciones hidrograficas del Mar Caribc de la telscion con las condiciones hidrograaqcas ceres de la Desembocadura del Orinoco, Mere. Soc. Cienc. Nat. La Salle, XXIV(69), 277-307, 1964.
Gordon, A., Circulation of the Caribbean Sea, J. Geophys. Res., 72, 6207-6223, 1967.
Griffiths, R., and J. Simpson, Upwelling and other oceanographic features of the coastal waters of northeastern Venezuela, Set. Recursos Explot. Pesq., 2(4), 72 pp., Ofic. Nac. de Pesca, Re- publics de Venezuela, 1972.
Hastenrath, S., and P. Lamb, Climatic Atlas of the Tropical A t- lantic and Eastern Pacific Oceans, 110 pp., University of Wis- consin Press, Madison, 1977.
Heburn, G., T. Kinder, J. Allender, and H. Hurlhurt, A numerical model of eddy generation in the southeastern Caribbean Sea, in Hydrographics of Semi-enclosed Seas, edited by J. Nihoul, pp. 299-328, Elsevier Scientific, New York, 1982.
Hellerman, S., and M. Rosenstein, Normal monthly wind stress over the world ocean with error estimates, J. Phys. Oceanogr., 13, 1093-1104, 1983.
Kinder, T., Shallow currents in the Caribbean Sea and Gulf of Mexico as observed with satellite-tracked drifters, Bull. Mar. Sci., 33, 239-246, 1983.
710 MORRISON AND SMITH: TRANSPORT VARIABILITY IN THE EASTERN CARIBBEAN SEA
Kinder, T., G. Heburn, and A. Green, Some aspects of the Caribbean circulation, Mar. Geol., 68, 25-52, 1985.
Larsen, J., and T. Sanford, Florida Current volume transports from voltage measurements, Science, 2•7, 302- 304, 1985.
Leetmaa, A., and A. Bunker, Updated charts of the annual mean wind stress, convergence in the Ekman layers and Sverdrup transports in the North Atlantic, J. Mar. Res., 36, 311-322, 1978.
Leetmaa, A., P. Muller, and H. Stommel, Does the Sverdrup re- lation account for the Mid-Atlantic circulation?, Y. Mar. Res., 35, 1-10, 1977.
Mazeika, P., D. Burns, and T. Kinder, Mesoscale circulation east of the Southern Lesser Antilles, J. Geophys. Res., 85, 2743- 2758, 1980.
Molinari, R., M. Spillane, I. Brooks, D. Atwood, and C. Duck- ett, Surface currents in the Caribbean Sea as deduced from Lagrangian drifters, J. Geophys. Res., 86, 4207-4229, 1982.
Morrison, J., and W. Nowlin, General distribution of water masses within the eastern Caribbean Sea during the winter of 1972 and fall of 1973, or. Geophys. Res., 87, 4207-4229, 1982.
Niiler, P., and W. Richardson, Seasonal variability of the Florida Current, or. Mar. Res., 31, 144-167, 1973.
Roemmich, D., Circulation of the Caribbean Sea: A well-resolved inverse problem, or. Geophys. Res., 86, 7993-8005, 1981.
Smith, O., and J. Morrison, Shipboard acoustic doppler current profiling in the eastern Caribbean Sea, 1985-1986, or. Geophys. Res., 94, 9713-9719, 1989.
Spain, P., D. Domon, and H. Rossby, Pegasus: A simple, acousti-
cally tracked, velocity profiler, Deep Sea Res., 28A, 1553-1567, 1981.
Stalcup, M., and W. Metcalf, Current measurements in the pas- sages of the Lesser Antilles, or. Geophys. Res., 77, 1032-1049, 1972.
Wilburn, A.M., E. Johns, and M. Bushnell, Current velocity and hydrographic observations in the Straits of Florida, the Caribbean Sea, and offshore of the Antillean Archipelago: Sub- tropical Atlantic Climate Studies (STACS) 1984 and 1985, Data Rep. ERL A OML-8, Natl. Oceanic and Atmos. Ad- min./Atlantic Oceanogr. and Meteorol. Lab., Miami, Fla., 1987a.
Wilburn, A.M., E. Johns, and M. Bushnell, Current velocity and hydrographic observations in the Straits of Florida, the Caribbean Sea, and offshore of the Antillean Archipelago: Sub- tropical Atlantic Climate Studies (STACS) 1986, Natl. Oceanic and Atmos. Admin./Atlantic Oceanogr. and Meteorol. Lab., Miami, Fla., 1987b.
J. Morrison and O. P. Smith, Department Marine, Earth, and Atmospheric Sciences, North Carolina State University, P. O. Box 8208, Raleigh, NC 27695.
(Received December 13, 1988; revised April 17, 1989; accepted June 14, 1989.)
Copyright © 2022 FDOKUMEN