Filament formation and evolution in buoyant coastal waters: Observation and modelling

Influence of a buoyant river plume on phytoplankton nutrient
dynamics: What controls standing stocks and productivity?
Raphael M. Kudela1 and Tawnya D. Peterson1,2
Received 14 May 2008; revised 26 March 2009; accepted 14 May 2009; published 24 July 2009.
[1] The influence of the Columbia River plume on phytoplankton rates and biomassaccumulation was examined using multiday deckboard incubations as part of the coastalocean processes River Influences on Shelf Ecosystems field program in August 2005. At aset of five stations encompassing the near-field plume (three stations) on the Oregonand Washington coasts, treatments consisting of control, added nitrate, and added nitratewith 0.45 mm filtered plume water were used to assess the phytoplankton communityresponse to macronutrients and micronutrients. For a subset of these stations, nutrient(nitrate, ammonium, and ammonium inhibition of nitrate) kinetics were obtained, as wellas carbon-based estimates of productivity. For all experiments, nitrogen (nitrate) wasclearly controlling both biomass accumulation and growth rates. Despite the apparentpoleward trend toward increasing biomass in this region, there were no obviousdifferences in phytoplankton physiological capacity, nor were there any symptoms of ironlimitation in the short term. We conclude that phytoplankton in this region arepredominantly nitrogen limited but that upon release from this limiting factor,phosphorous and/or silicic acid (in waters not influenced by the Columbia River plume)would quickly become limiting. Evidence suggests that the mesoscale differences inphytoplankton biomass between the Oregon and Washington coasts result from acombination of enhanced grazing downstream and the physically retentive and dispersiveeffects of the plume itself.
Citation: Kudela, R. M., and T. D. Peterson (2009), Influence of a buoyant river plume on phytoplankton nutrient dynamics: What
controls standing stocks and productivity?, J. Geophys. Res., 114, C00B11, doi:10.1029/2008JC004913.
1. Introduction
[2] The Columbia River is the single largest source offresh water in the Pacific Northwest [Barnes et al., 1972]. Itis a dominant feature off the Washington and Oregon coasts,and can clearly be distinguished in satellite imagery [Fiedlerand Laurs, 1990; Strub et al., 1990; Thomas and Strub,2001; Thomas and Weatherbee, 2006]. Canonically, theplume tends to move offshore and southward during up-welling conditions, and nearshore and northward duringdownwelling conditions [Landry et al., 1989; Thomas andBrickley, 2006], although recent evidence suggests that theplume is more dynamic than previously thought, and rapidlyalternates between northward and southward trajectories[Hickey et al., 2005]. The plume provides an importantsource of both macronutrients [Aguilar-Islas and Bruland,2006; Hill and Wheeler, 2002; Lohan and Bruland, 2006;Bruland et al., 2008] and micronutrients, particularly iron[Buck et al., 2007; Lohan and Bruland, 2006; Bruland et
al., 2008]; however, despite its acknowledged importance asa nutrient source, the Columbia River exhibits unusuallylow nitrate and N:Si levels compared to other majordrainage basins [Conomos et al., 1972] such as the Mis-sissippi [Turner and Rabalais, 1994; Turner et al., 2003],and recent evidence [Lohan and Bruland, 2006] suggeststhat the mixing associated with plume formation, rather thanthe direct nitrogen load from the river, is the critical factor insetting the nitrogen load to the coastal ocean.[3] Despite the relatively low nutrient load, numerous
investigators have noted the apparent poleward trend inbiomass (and presumably productivity), resulting in morebiological activity, from phytoplankton through highertrophic levels, on the Washington versus Oregon shelf[Landry et al., 1989; Thomas and Strub, 2001; Ware andThomson, 2005]. Various hypotheses for this pattern havebeen proposed, including increased iron availability as afunction of shelf width, river inputs, or both [Chase et al.,2007; Hickey and Banas, 2003; Ware and Thomson, 2005].Temporal (seasonal and interannual) variability can besuperimposed on this poleward gradient, with clear evi-dence for seasonal light limitation at northern latitudes[Corwith and Wheeler, 2002; Henson and Thomas, 2007;Small and Menzies, 1981; Thomas and Strub, 1989].However, in summer, evidence suggests that the Oregoncoast is actually nutrient limited, in part because of the lownutrient load from the Columbia River coupled with the
JOURNAL OF GEOPHYSICAL RESEARCH, VOL. 114, C00B11, doi:10.1029/2008JC004913, 2009
1Ocean Sciences Department and Institute for Marine Sciences,University of California, Santa Cruz, California, USA.
2Science and Technology Center for Coastal Margin Observation andPrediction, Oregon Health and Science University, Beaverton, Oregon,USA.
Copyright 2009 by the American Geophysical Union.0148-0227/09/2008JC004913
C00B11 1 of 15
stratification (and reduced upwelling of nutrient-rich deepwater) caused by the low-salinity surface waters relative tothe well-mixed, nutrient-rich, but light-limited waters southof Cape Blanco (42.9�N) where the Columbia River dis-charge is less pervasive [Huyer et al., 2005]. The warmanomaly of 2005, caused by delayed onset of upwelling-favorable winds, further highlights the importance of up-welling-driven nutrient supply to the Pacific Northwest,independent of, or perhaps modulated by, the ColumbiaRiver plume.[4] Despite the continued interest in the apparent discrep-
ancy between Oregon and Washington coastal productivityand the presumed influence of the Columbia River plume,there have been few studies that directly assess the impor-tance of this river plume on coastal productivity. Here wedirectly assess the role of nutrient limitation in coastalwaters of Washington, Oregon and the near-field plumeby conducting a series of multiday nutrient amended grow-outs during typical upwelling conditions in summer 2005 as
part of the coastal ocean processes River Influences onShelf Ecosystems (CoOP-RISE) program. We explicitlyevaluated whether Washington and Oregon coastal watershave intrinsically different responses to either added nitrateor simulated plume mixing, to identify the role of theColumbia River plume in either promoting or maintainingthe large gradient in biomass and productivity within thiscoastal region.
2. Data and Methods
2.1. Study Site
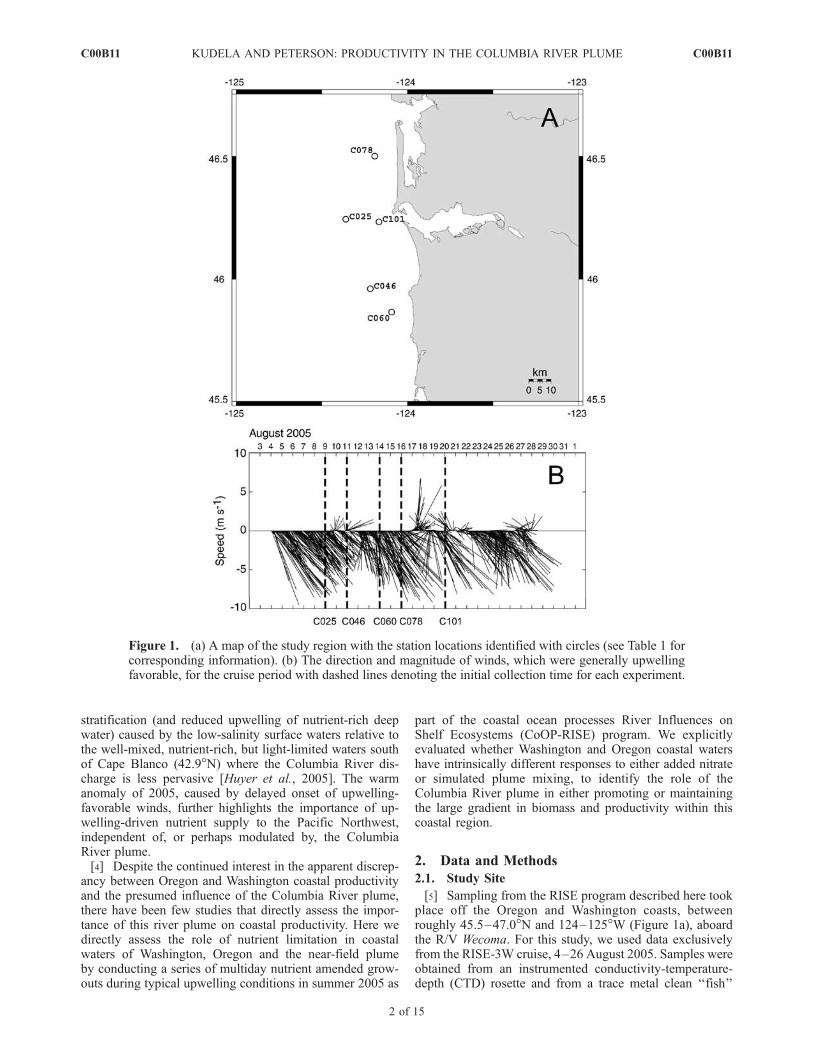
[5] Sampling from the RISE program described here tookplace off the Oregon and Washington coasts, betweenroughly 45.5–47.0�N and 124–125�W (Figure 1a), aboardthe R/V Wecoma. For this study, we used data exclusivelyfrom the RISE-3W cruise, 4–26 August 2005. Samples wereobtained from an instrumented conductivity-temperature-depth (CTD) rosette and from a trace metal clean ‘‘fish’’
Figure 1. (a) A map of the study region with the station locations identified with circles (see Table 1 forcorresponding information). (b) The direction and magnitude of winds, which were generally upwellingfavorable, for the cruise period with dashed lines denoting the initial collection time for each experiment.
C00B11 KUDELA AND PETERSON: PRODUCTIVITY IN THE COLUMBIA RIVER PLUME
2 of 15
C00B11

pumping system, described by Bruland et al. [2008] at fivestations (Figure 1a). Although 2005 exhibited unusual con-ditions associated with the delayed onset of upwelling-favorable winds [Hickey et al., 2006; Kudela et al., 2006]the RISE-3W period was dominated by more typical up-welling-favorable conditions, with occasional relaxationsand wind reversals (Figure 1b).
2.2. Deckboard Growouts
[6] A total of five multiday deckboard incubations wereconducted to characterize the biological response to varioustreatments. Our experimental design was intended to deter-mine if there are fundamental differences in growth re-sponse between Washington, Columbia River plume, andOregon coastal waters. Within that broad framework, weaddressed three more detailed questions. First, is there aresponse to added nitrate? Second, does the Columbia Riverplume water stimulate phytoplankton growth because of theaddition of nitrogen, or is there a secondary effect becauseof the presence of other compounds such as Fe, P, or organicmatter? And third, within the plume are there differencesbetween plume events? To address these questions, weconducted a matrix of growout experiments with control
(no manipulation), added nitrogen, and added plume water(filtered to remove the biological community) as summa-rized in Figure 2. At each station, water was collected fromthe near surface using a trace metal clean surface pumpingsystem when possible (Table 1) and homogenized usingacid-cleaned carboys rinsed three times with sample waterprior to filling. Reasonable (but not full trace metal clean)precautions were taken during filling and sampling tominimize contamination. Water was subsequently dispensedfrom the homogenizing carboy into acid-cleaned 4 Lpolyethylene containers for experimental deckboard grow-outs. Sampling stations are denoted by the CTD castnumber (Figure 1 and Table 1) and, for convenience, arereferred to by the location and oceanographic conditions atthe time of collection as ‘‘plume’’ (C025), ‘‘aged plume’’(C046), ‘‘Oregon plume’’ (C060), ‘‘Washington plume’’(C078) and ‘‘plume + plume’’ (C101). For each station,the vertical profile of temperature, salinity, and fluorescenceis provided (Figure 2); note that the underway data collectedat 2 m depth was inserted into the vertical profiles to capturethe presence of the shallow water lens created by theColumbia River. The fluorescence data were not correctedfor surface photoinhibition, but the beam transmissometerdata provide essentially identical (but inverse) profiles (datanot shown).[7] For the first experiment (plume) we set up duplicate
control and +nitrate containers, where the nitrate additionwas in the form of approximately 10 mM KNO3 (which wastested for Fe contamination prior to the experiments). Forsubsequent experiments, we added another treatment tomimic entrainment of plume water with coastal water. Thisthird set of containers consisted of 3 L of whole water(collected outside the plume) and 1 L of 0.45 mm filteredplume water collected from station C025 within the plume,to which we added nitrate such that the initial N concen-tration was similar in the plume and nitrate treatments. Forthe experiments conducted with Oregon and Washingtoncoastal waters, the same experimental approach was used(control, +nitrate, +plume) but we modified the initialnitrate concentration in the +nitrate and +plume treatmentsto simulate freshly upwelled waters (approximately 30 mMKNO3).[8] The 0.45 mm filtered plume water from C025 used for
the +plume treatments was kept in an acid-cleaned polycar-bonate container at 4�C in the dark prior to use. For allexperiments except the plume (C025) station, we filtered 1 L(25%) of the whole water using a 0.45 mm filter andadjusted to the same salinity (with Millipore Q-water) tomimic the same experimental conditions as the +plumetreatment. This addition of filtered water minimized anypotential bias across treatments because of grazer dilution.[9] All containers were incubated in a flowing-seawater
deckboard Plexiglas incubator attenuated to 50% surfaceirradiance with neutral-density screening. Sampling fornutrients and chlorophyll was conducted (typically daily)by subsampling the primary containers after carefully rins-ing the exterior of the container with Millipore Q-water toavoid contamination.
2.3. Analytical Methods
[10] Chlorophyll a (chl a) samples were collected onWhatman GF/F filters and Poretics 20 mm polycarbonate
Figure 2. A schematic of the experimental design. Waterwas collected from five stations and manipulated to answerthree questions (denoted by the boxes): (1) Is there aresponse to added nitrate? (2) Is there an additional responseto filtered plume water? (3) Are there differences in plumeresponses as a function of initial conditions? Plume waterwas collected and held from the first experiment (C025) foruse as a treatment in the remaining experiments (grayshading denotes added plume water). Filtered seawater(FSW) from each station (except for the plume experiment,C025) was adjusted to the same salinity as the 0.45 mmfiltered plume water and was added to each container (25%FSW to 75% whole water) to control for effects of grazerdilution.
C00B11 KUDELA AND PETERSON: PRODUCTIVITY IN THE COLUMBIA RIVER PLUME
3 of 15
C00B11

filters, extracted for approximately 24 h in 7 mL of 90%acetone (�20�C) and analyzed for chl a by in vitrofluorometry using a Turner Designs 10-AU fluorometercalibrated with pure chl a (Sigma) and using the non-acidification technique [Welschmeyer, 1994]. Nitrate plusnitrite (hereafter referred to as nitrate), phosphate, and silicicacid were analyzed using a LaChat Instruments automatedion analyzer (8000 series) as described by Bruland et al.[2008]. Samples for ammonium analysis were collectedusing 60 mL low-density polyethylene tubes, and analyzedwithin 24 h using the fluorometric ammonium technique[Holmes et al., 1999]. Nitrogenous substrate concentrationsare reported using mg-at N notation; 1 mg-at N L�1 isequivalent to 1 mM for nitrate and ammonium.
2.4. Determination of Kinetics Parameters
[11] For the plume + plume and Washington experiments,two nitrogen substrates (nitrate, ammonium) were used todetermine the uptake response kinetics of the whole water atthe end of the experiments, after nutrient exhaustion toassess both classic uptake parameters and ammonium inhi-bition of nitrate uptake. Water was dispensed into 70 mLpolycarbonate flasks at the same time that nutrient, cellabundance, and pigment samples were collected. Then 15N-ammonium chloride (99 atom %; Cambridge Isotopes) and15N-sodium nitrate (99 atom %) at a range of initialsubstrate concentrations was added to the flasks. For theammonium inhibition experiments, a constant amount of15N-sodium nitrate was added with variable additions ofunlabeled 14N-ammonium chloride. The flasks were thentransferred to the deckboard incubator where ambient sea-water temperatures were maintained and incubated under50% surface irradiance. Incubations were terminated afterapproximately 30 min by filtration (<100 mm Hg) ontoprecombusted (450�C for 4 h) GF/F filters. Filters werefrozen at �80�C pending processing in the laboratory.Ashore, the filters were dried (55�C) and acidified andsubsequently analyzed for total particulate nitrogen andisotopic enrichment on a Finnigan Delta XP mass spec-trometer coupled to a Carlo Erba CHNO-S elementalanalyzer.[12] Particulate nitrogen (PN) specific uptake rates (V [h �1])
were estimated from the accumulation of 15N in the partic-ulate material, and calculated as described in Dugdale andWilkerson [Dugdale and Wilkerson, 1986]. Rates were notcorrected for the effects of isotopic dilution [Glibert et al.,1982] because of the short (30 min) incubation. As describedby Cochlan and Bronk [2003], the use of specific (V [h�1])rather than absolute (r [mM N L�1 h�1]) uptake parametersis most commonly reported for both uptake and inhibitionstudies. However, absolute rates generally use the samesample to determine both the 15N specific activity (atom %excess) and concentration of PN, so the resultant uptakerates are not affected by any simultaneous uptake ofunlabeled 14N or nonphytoplanktonic PN [Cochlan andBronk, 2001; Dugdale and Wilkerson, 1986; Legendre andGosselin, 1997]. When one or more N substrates are takenup by the phytoplankton (as expected during inhibitionexperiments) it is necessary to correct for isotopic dilutionof the PN by the other, unlabeled substrate. Absolute ratesare not affected by this dilution effect [Cochlan and Bronk,2001], so we have chosen to report all of the kineticsT
able
1.InitialEnvironmentalConditionsofSeawater
CollectedforDeckboardIncubationsDuringRISE05–3W
a
Station(Experim
ent)
Latitude,
Longitude
Sam
plingDate
Tem
perature
(�C)
Salinityb(psu)
chla(mgL�1)chla>20mm
(mgL�1)
AmbientConcentration
At2m
At4m
At2m
At4m
NH4+(mM)NO3�
(mM)PO4�
(mM)Si(OH) 4
(mM)Dissolved
Fe(nM)
C025(plume)
46.268�N
,124.199�W
9Aug2005
14.49
12.75
20.93
27.78
7.02
3.90
0.92
13.36
1.03
64.34
6.00
C046(aged
plume)
45.962�N
,124.217�W
11Aug2005
16.81
13.42
19.81
28.45
7.64
7.57
0.62
0.00
0.06
20.27
5.34
C060(O
regon)
45.867�N
,124.042�W
13Aug2005
12.38
11.57
27.71
32.24
5.76
3.09
1.29
4.80
0.55
6.40
–C078(W
ashington)
46.500�N
,124.117�W
16Aug2005
12.75
11.70
32.36
32.53
10.81
7.55
0.10
11.18
1.43
24.79
2.52
C101(plume+plume)
46.030�N
,124.260W
19Aug2005
13.35
10.41
29.07
30.49
21.44
19.13
0.74
1.32
0.27
27.53
7.51
aWater
was
collectedfrom
4m
depth
usingeither
aninstrumentedrosette(C060)oratracemetalcleanfish.Forreference,thetemperature
andsalinitydatafrom
anunderway
mappingsystem
(2m
depth
intake)
are
shownto
illustratetheshallowsurfacelensassociated
withtheColumbiaRiver
plumewaters.Dissolved
ironvalues
areprovided
from
theclosestmatchingsamplingintervalusingthefish
pumpingsystem
andarenot
from
thegrowoutcontainers.Notethatbioavailable(acid-leachableparticulateironplusdissolved
iron)wouldbesubstantially
greaterin
concentration.Themacronutrientvalues
wereallmeasuredonthewaterusedfor
growouts.Note
that
forC060,nosurfaceFedatawereavailable.
bHerepsu
indicates
practical
salinityunits.
C00B11 KUDELA AND PETERSON: PRODUCTIVITY IN THE COLUMBIA RIVER PLUME
4 of 15
C00B11

Figure 3. Vertical profiles of temperature (�C) (solid line), salinity (heavy dashed line) and fluorescence(light dashed line) for the (a) plume, (b) aged plume, (c) Oregon, (d) Washington, and (e) plume + plumeexperiments at the time of water collection. Data from a 2 m underway system have been inserted fortemperature and salinity; all other data were obtained from the instrumented rosette. RFU, relativefluorescence units.
C00B11 KUDELA AND PETERSON: PRODUCTIVITY IN THE COLUMBIA RIVER PLUME
5 of 15
C00B11

parameters using this notation. For comparison to previousstudies, we provide the mean PN values, allowing the readerto easily convert our absolute uptake rates to specific rates ifdesirable.[13] Curve fitting was carried out using an iterative
nonlinear least squares technique (Kaleidagraph; AbelbeckSoftware) which utilizes the Levenberg-Marquardt algorithm[Press et al., 1992], to determine the half saturation (Ks, mML�1) and maximum uptake (rmax, mg-at N L�1 h�1) param-eters of a Michaelis-Menten curve for nitrogen kinetics:
r ¼ rmax � S= Ks þ Sð Þ ð1Þ
where r and rmax is described above, S is the substrateconcentration (mM N L�1), and Ks is the half-saturationparameter (mM N).[14] Four of the five stations (Table 1) had elevated
ammonium concentrations. In similar coastal [Dugdale etal., 2006] and estuarine [Dugdale et al., 2007] systems,ammonium inhibition has been suggested to modify theassimilation of nitrate, thereby impacting biomass accumu-lation and species composition. To determine whethergrowth responses across treatments might be due to variableinhibition caused by excess ammonium, we conducted alimited number of ammonium inhibition (of nitrate uptake)experiments. Inhibition parameters were determined usingtwo variants; first, a simple exponential decay model wasapplied:
rNO3� ¼ Aþ B� e�C � NHþ4
� �ð2Þ
where rNO3� is the absolute nitrate uptake rate, [NH4+] is
the total (added plus ambient) ammonium concentration,and C is the exponential decay constant. Maximal realizedinhibition (Imax; values from 0 to 1) is then calculated as:
Imax ¼ 1� A= Aþ Bð Þ½ � ð3Þ
The second variant uses a modified inverse Michaelis-Menten parameterization:
rNO3� ¼ rNmax � rNmax � Imax � NHþ4
� �� �= KI þ NHþ
4
� �� �� �
ð4Þ
where rNmax is the theoretical N uptake at zero ammoniumconcentration, and KI is the ammonium (substrate) con-centration at which nitrate uptake is reduced to 50% of itsmaximal value. To estimate the ammonium concentration atwhich nitrate uptake is reaches maximum inhibition (Ninhib
[mM NH4+ L�1]), KI can be multiplied by 9 [Cochlan and
Bronk, 2003].
2.5. Primary Production
[15] For all experiments except the plume (C025) study,productivity was estimated using the radio-tracer 14C. Waterwas dispensed into 70 mL polycarbonate flasks, to which14C-bicarbonate (Amersham) was added at 10 mCi per flask.The flasks were incubated with the experimental containersin the deckboard flowing seawater incubator at 50% surfaceirradiance for 24 h, filtered, and counted using a Beckman6500 liquid scintillation counter. Calculations accounted for
the total inorganic carbon pool using the salinity correctionof Parsons et al. [1984]. The Productivity Index wascalculated by normalizing the carbon uptake rates to thecorresponding chlorophyll concentrations. Productivityexperiments were conducted on different days for eachexperiment, corresponding to day 3.5, 1.75, 1, 4, and 3.5for the aged plume, Oregon plume, Washington plume(early and late), and plume + plume experiments, wherethe time listed is the beginning of the 24 h incubation.
2.6. Growth Rates and Statistics
[16] Estimates of community growth rates were deter-mined using linear regression of the log-transformed chl adata (typically time points from days 0 to 3; data werechosen on the basis of visual identification of the log lineargrowth phase). Graphical presentation of the data providesthe standard error of the linear regression (growth rate) aserror bars. Asterisks above each bar denote regressions withp < 0.05; all regressions except the aged plume and plume +plume Control treatments were significant at p < 0.05.Comparisons for statistically significant differences betweentreatments were calculated using paired t-tests (assumingequal variances), ANOVA, and ANCOVA (for comparisonof growth rate regressions). All statistical analyses wereperformed using SigmaStat, with a significance value set atp = 0.05. Note that net community growth describes thechange in the total community, and does not factor inchanges in assemblage. Net community growth should notbe interpreted as a species-specific intrinsic growth rate.
3. Results
3.1. Initial Sampling Conditions
[17] As described by Bruland et al. [2008], all of theexperiments were sampled during an upwelling–activephase and an intense spring tidal cycle. This resulted incold, high-salinity, nutrient-rich coastal seawater with ele-vated dissolved Fe concentrations (>40 nM) being drawninto the Columbia River estuary and subsequently formingthe plume [Bruland et al., 2008]. Water was collected at fivestations, chosen to correspond to the fresh, near-field plume(plume), far-field plume water subsequent to several days ofplume mixing with coastal waters (aged plume), transportedplume water down coast off Oregon (Oregon plume) andupcoast off Washington (Washington plume), and again inthe near-field plume (plume + plume). Figure 3 and Table 1provide the initial conditions for each experiment. Gener-ally, the Columbia River plume is apparent as a surface lensof warm (>12�C) low-salinity (<29) water in the plume,aged plume, and plume + plume stations. The Oregonplume station shows evidence of aged plume water (lowsalinity, high fluorescence) overlying a 10 m mixed layer,while the Washington plume water was more characteristicof coastal water, with a 10 m mixed layer and no evidenceof a low-salinity surface lens. Chl a was moderately tohighly (plume + plume) elevated at the beginning of eachexperiment, while the macronutrients were moderately highat all but the aged plume and plume + plume stations(Table 1). Although ammonium was not sampled at all timepoints, a striking feature was the relatively high (>0.5 mM)ammonium concentrations at all stations except C060(Washington plume). Ammonium concentrations were un-
C00B11 KUDELA AND PETERSON: PRODUCTIVITY IN THE COLUMBIA RIVER PLUME
6 of 15
C00B11

Figure 4. (left) Total chlorophyll, (middle) percent chlorophyll > 20 mm, and (right) nitrate arepresented for the (a–c) plume, (d–f) aged plume, (g–i) Oregon, (j–l) Washington, and (m–o) plume +plume experiments. Control (solid line), +nitrate (long dash), and +plume (short dash) treatments areplotted, where error bars represent the range of replicate containers. For Figures 4c, 4f, 4i, 4l, and 4o, thearrow and letter along the x axis denote the time at which phosphorous (P) or silicic acid (Si) wasdepleted in the treatments.
C00B11 KUDELA AND PETERSON: PRODUCTIVITY IN THE COLUMBIA RIVER PLUME
7 of 15
C00B11

detectable following the initial sampling event (i.e., ammo-nium was drawn down in the experimental enclosuresduring the first 24 h of incubation).
3.2. Biomass Accumulation and Growth
[18] For all experiments, regardless of treatment, biomassas determined by chl a increased from the initial time point(Figure 4), albeit not significantly for the control treatmentsin the aged plume and plume + plume experiments. In theplume experiment, there was no difference between thecontrol and +nitrate treatments for the first several days, butthe +nitrate treatment maintained higher total biomassrelative to the control following N depletion. For theremaining experiments where there was both a +nitrateand a +plume water treatment, the differences between thetwo treatments were negligible. For all experiments, thefraction of chl a that was accounted for by the >20 mm filterwas >50% at the time of enclosure. With the exception ofthe aged plume study, this fraction increased, reaching 80–100% of the GF/F chl a by the end of the experiments, withno obvious differences between treatments. The exceptionto this general pattern was the aged plume experiment,which demonstrated little total (GF/F) chl a accumulationbut a steady decrease in the >20 um fraction following day2, with reductions in all treatments from the 80–100%range to 50% by day 5.[19] Peak biomass accumulation generally correlated with
the depletion of nitrate (Figure 4). Neither silicic acid norphosphate were depleted in the plume or plume + plumeexperiments (data not shown), while phosphate was depletedto undetectable levels at about the same time as thedisappearance of nitrate in the aged plume, Oregon, and
Washington experiments (Figure 4). The Oregon experi-ment was the only station where silicic acid was alsodepleted to undetectable levels, prior to the depletion ofphosphate and at about the same time as nitrate (Figure 4).The Oregon experiment also exhibited an unusual doublepeak in GF/F chl a, with initial biomass accumulation (days0–1) followed by a decrease (days 1–2) with a subsequentsecondary peak (approximately day 3.5), well after thedepletion of macronutrients.[20] Net community growth rates were estimated using
the initial logarithmic phase of biomass accumulation fromthe GF/F chl a data (Figure 5). With the exception of theplume + plume experiment, where the control treatment wassignificantly (p < 0.05) lower than the +nitrate and +plumetreatments, estimated growth rates were similar across treat-ments. Highest growth was achieved in the Oregon exper-iment (approximately 1–1.5 d�1), followed by the plumeexperiment (1.0 d�1) and then Washington, plume + plume,and aged plume, with only the plume + plume controlshowing no net growth. In contrast to these growth rates,maximal biomass accumulation occurred in the order:plume, plume + plume, and Washington, with substantiallylower accumulation from Oregon and very little response inthe aged plume (Figure 4). To assess the limiting factor forbiomass accumulation, the data were plotted as initial nitrateconcentration versus maximum chl a for each experimentand treatment (Figure 6a). With the exception of the Oregonexperiment, increasing the initial nitrate concentrationresulted in higher total biomass, until an asymptotic valueof approximately 60 mg chl a L�1 was reached; the Oregonexperiment stands out, with a substantially reduced increasein maximum chl a as a function of initial nitrate concen-
Figure 5. Growth rates estimated from the initial (log linear) change in total chlorophyll are presentedfor control (black), +nitrate (dark gray), and +plume (white) treatments. Error bars represent the range ofreplicate containers. The number of data points used were n = 3 (plume and Oregon), n = 5 (Washingtonand plume + plume), and n = 7 (aged plume). P + P, plume + plume.
C00B11 KUDELA AND PETERSON: PRODUCTIVITY IN THE COLUMBIA RIVER PLUME
8 of 15
C00B11
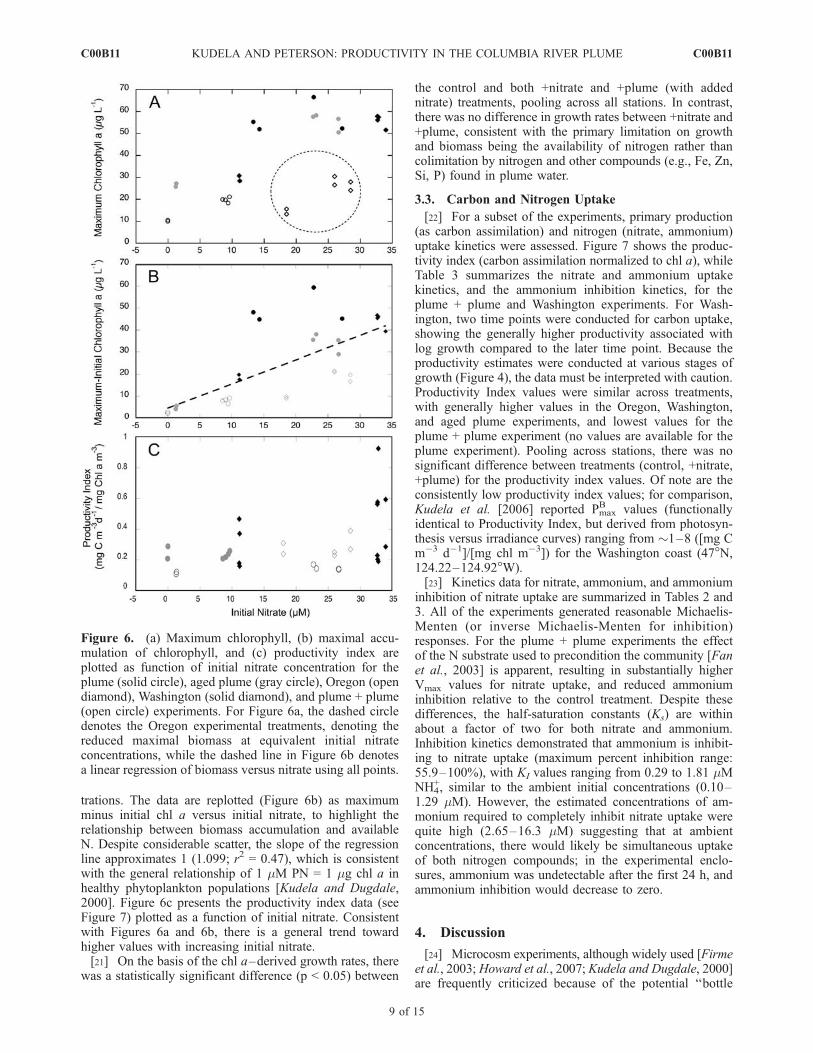
trations. The data are replotted (Figure 6b) as maximumminus initial chl a versus initial nitrate, to highlight therelationship between biomass accumulation and availableN. Despite considerable scatter, the slope of the regressionline approximates 1 (1.099; r2 = 0.47), which is consistentwith the general relationship of 1 mM PN = 1 mg chl a inhealthy phytoplankton populations [Kudela and Dugdale,2000]. Figure 6c presents the productivity index data (seeFigure 7) plotted as a function of initial nitrate. Consistentwith Figures 6a and 6b, there is a general trend towardhigher values with increasing initial nitrate.[21] On the basis of the chl a–derived growth rates, there
was a statistically significant difference (p < 0.05) between
the control and both +nitrate and +plume (with addednitrate) treatments, pooling across all stations. In contrast,there was no difference in growth rates between +nitrate and+plume, consistent with the primary limitation on growthand biomass being the availability of nitrogen rather thancolimitation by nitrogen and other compounds (e.g., Fe, Zn,Si, P) found in plume water.
3.3. Carbon and Nitrogen Uptake
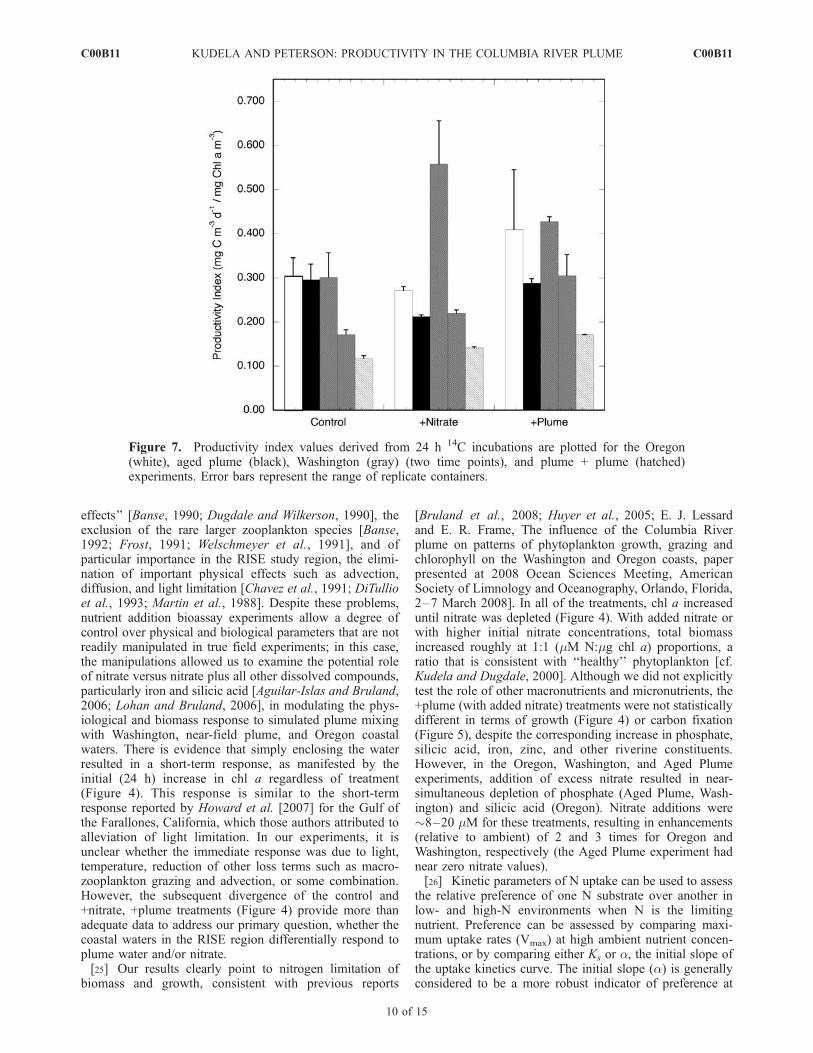
[22] For a subset of the experiments, primary production(as carbon assimilation) and nitrogen (nitrate, ammonium)uptake kinetics were assessed. Figure 7 shows the produc-tivity index (carbon assimilation normalized to chl a), whileTable 3 summarizes the nitrate and ammonium uptakekinetics, and the ammonium inhibition kinetics, for theplume + plume and Washington experiments. For Wash-ington, two time points were conducted for carbon uptake,showing the generally higher productivity associated withlog growth compared to the later time point. Because theproductivity estimates were conducted at various stages ofgrowth (Figure 4), the data must be interpreted with caution.Productivity Index values were similar across treatments,with generally higher values in the Oregon, Washington,and aged plume experiments, and lowest values for theplume + plume experiment (no values are available for theplume experiment). Pooling across stations, there was nosignificant difference between treatments (control, +nitrate,+plume) for the productivity index values. Of note are theconsistently low productivity index values; for comparison,Kudela et al. [2006] reported PBmax values (functionallyidentical to Productivity Index, but derived from photosyn-thesis versus irradiance curves) ranging from 1–8 ([mg Cm�3 d�1]/[mg chl m�3]) for the Washington coast (47�N,124.22–124.92�W).[23] Kinetics data for nitrate, ammonium, and ammonium
inhibition of nitrate uptake are summarized in Tables 2 and3. All of the experiments generated reasonable Michaelis-Menten (or inverse Michaelis-Menten for inhibition)responses. For the plume + plume experiments the effectof the N substrate used to precondition the community [Fanet al., 2003] is apparent, resulting in substantially higherVmax values for nitrate uptake, and reduced ammoniuminhibition relative to the control treatment. Despite thesedifferences, the half-saturation constants (Ks) are withinabout a factor of two for both nitrate and ammonium.Inhibition kinetics demonstrated that ammonium is inhibit-ing to nitrate uptake (maximum percent inhibition range:55.9–100%), with KI values ranging from 0.29 to 1.81 mMNH4
+, similar to the ambient initial concentrations (0.10–1.29 mM). However, the estimated concentrations of am-monium required to completely inhibit nitrate uptake werequite high (2.65–16.3 mM) suggesting that at ambientconcentrations, there would likely be simultaneous uptakeof both nitrogen compounds; in the experimental enclo-sures, ammonium was undetectable after the first 24 h, andammonium inhibition would decrease to zero.
4. Discussion
[24] Microcosm experiments, although widely used [Firmeet al., 2003; Howard et al., 2007; Kudela and Dugdale, 2000]are frequently criticized because of the potential ‘‘bottle
Figure 6. (a) Maximum chlorophyll, (b) maximal accu-mulation of chlorophyll, and (c) productivity index areplotted as function of initial nitrate concentration for theplume (solid circle), aged plume (gray circle), Oregon (opendiamond), Washington (solid diamond), and plume + plume(open circle) experiments. For Figure 6a, the dashed circledenotes the Oregon experimental treatments, denoting thereduced maximal biomass at equivalent initial nitrateconcentrations, while the dashed line in Figure 6b denotesa linear regression of biomass versus nitrate using all points.
C00B11 KUDELA AND PETERSON: PRODUCTIVITY IN THE COLUMBIA RIVER PLUME
9 of 15
C00B11
effects’’ [Banse, 1990; Dugdale and Wilkerson, 1990], theexclusion of the rare larger zooplankton species [Banse,1992; Frost, 1991; Welschmeyer et al., 1991], and ofparticular importance in the RISE study region, the elimi-nation of important physical effects such as advection,diffusion, and light limitation [Chavez et al., 1991; DiTullioet al., 1993; Martin et al., 1988]. Despite these problems,nutrient addition bioassay experiments allow a degree ofcontrol over physical and biological parameters that are notreadily manipulated in true field experiments; in this case,the manipulations allowed us to examine the potential roleof nitrate versus nitrate plus all other dissolved compounds,particularly iron and silicic acid [Aguilar-Islas and Bruland,2006; Lohan and Bruland, 2006], in modulating the phys-iological and biomass response to simulated plume mixingwith Washington, near-field plume, and Oregon coastalwaters. There is evidence that simply enclosing the waterresulted in a short-term response, as manifested by theinitial (24 h) increase in chl a regardless of treatment(Figure 4). This response is similar to the short-termresponse reported by Howard et al. [2007] for the Gulf ofthe Farallones, California, which those authors attributed toalleviation of light limitation. In our experiments, it isunclear whether the immediate response was due to light,temperature, reduction of other loss terms such as macro-zooplankton grazing and advection, or some combination.However, the subsequent divergence of the control and+nitrate, +plume treatments (Figure 4) provide more thanadequate data to address our primary question, whether thecoastal waters in the RISE region differentially respond toplume water and/or nitrate.[25] Our results clearly point to nitrogen limitation of
biomass and growth, consistent with previous reports
[Bruland et al., 2008; Huyer et al., 2005; E. J. Lessardand E. R. Frame, The influence of the Columbia Riverplume on patterns of phytoplankton growth, grazing andchlorophyll on the Washington and Oregon coasts, paperpresented at 2008 Ocean Sciences Meeting, AmericanSociety of Limnology and Oceanography, Orlando, Florida,2–7 March 2008]. In all of the treatments, chl a increaseduntil nitrate was depleted (Figure 4). With added nitrate orwith higher initial nitrate concentrations, total biomassincreased roughly at 1:1 (mM N:mg chl a) proportions, aratio that is consistent with ‘‘healthy’’ phytoplankton [cf.Kudela and Dugdale, 2000]. Although we did not explicitlytest the role of other macronutrients and micronutrients, the+plume (with added nitrate) treatments were not statisticallydifferent in terms of growth (Figure 4) or carbon fixation(Figure 5), despite the corresponding increase in phosphate,silicic acid, iron, zinc, and other riverine constituents.However, in the Oregon, Washington, and Aged Plumeexperiments, addition of excess nitrate resulted in near-simultaneous depletion of phosphate (Aged Plume, Wash-ington) and silicic acid (Oregon). Nitrate additions were8–20 mM for these treatments, resulting in enhancements(relative to ambient) of 2 and 3 times for Oregon andWashington, respectively (the Aged Plume experiment hadnear zero nitrate values).[26] Kinetic parameters of N uptake can be used to assess
the relative preference of one N substrate over another inlow- and high-N environments when N is the limitingnutrient. Preference can be assessed by comparing maxi-mum uptake rates (Vmax) at high ambient nutrient concen-trations, or by comparing either Ks or a, the initial slope ofthe uptake kinetics curve. The initial slope (a) is generallyconsidered to be a more robust indicator of preference at
Figure 7. Productivity index values derived from 24 h 14C incubations are plotted for the Oregon(white), aged plume (black), Washington (gray) (two time points), and plume + plume (hatched)experiments. Error bars represent the range of replicate containers.
C00B11 KUDELA AND PETERSON: PRODUCTIVITY IN THE COLUMBIA RIVER PLUME
10 of 15
C00B11

low (<Ks) ambient nutrient concentrations, since it is notdependent on Vmax, unlike Ks [Healey, 1980].[27] Although only a few kinetics experiments are avail-
able from this study, there are clear patterns in the data.Both nitrate and ammonium kinetics exhibit relatively highhalf-saturation values (Ks) generally indicative of coastal,high-nutrient adapted assemblages (Table 2; see alsoreviews by Kudela et al. [2008b] and Kudela and Cochlan[2000]). Nitrate and ammonium rmax and Ks values werecomparable, as were the initial slopes (a), which can becalculated by dividing rmax by Ks, or by first converting toVmax (i.e., [rmax/PN]/Ks). As expected, the plume + plumeexperiments showed a differential response for the +nitrateand control treatments. Uptake kinetics can be stronglyinfluenced by the history of the algal assemblage, includingthe past nutrient exposure (e.g., nitrate versus ammonium),temperature, and light. These effects are referred to aspreconditioning [Fan et al., 2003], and would result in aresponse such as observed in the plume + plume experi-ment. The kinetics data are also consistent with expectationsfor a phytoplankton assemblage dominated by large cells (inthis case, 80–100% >20 mm; Figure 4). In general, nutrientkinetics values and organism size scale linearly [Fan et al.,2003], while the relationship between increasingly largephytoplankton size classes and maximum standing stock (aschlorophyll) is well established [Chisholm, 1991], particu-larly for productive coastal waters [Dortch and Postel,1989b; Irwin et al., 2006; Wilkerson et al., 2000]. Asreported by Kudela et al. [2006], the Washington shelfexhibited dramatic shifts in size structure, total biomass, andproductivity during the 2005 warm anomaly, with a rapid(weeks) reversal to more ‘‘normal’’ conditions, as reportedhere, with the onset of upwelling-favorable winds, consis-tent with the observations from this study that the phyto-plankton assemblage in the RISE region is characterized ashigh nutrient adapted, with a short (days) response to addednitrogen.[28] The presence of ammonium clearly has an inhibitory
effect on nitrate uptake (Table 3), resulting in an estimated25–50% reduction in nitrate uptake rates at ambient initialammonium concentrations; the rapid (24 h) drawdown ofammonium would, however, quickly alleviate this response,and the extremely high ammonium values necessary tocompletely inhibit nitrate uptake (Table 3) suggest, if theselimited data are broadly indicative of the coastal waters inthe RISE study region, that the phytoplankton assemblagesare well adapted to simultaneous utilization of both nitrateand ammonium. Our results are similar to the findings ofDortch and Postel [1989a, 1989b], who surveyed theWashington coast for multiple seasons between 1973 and1982. Those authors reported variable ammonium inhibi-tion, with a threshold level of about 1 mM ammonium,compared to our very limited Ki values of 0.29–1.81 mM.For two stations where they conducted ammonium inhibi-tion experiments, they reported 0–100% inhibition at 1 mMammonium, with 37% and 54% inhibition for ‘‘high light’’treatments in the <20 and >20 mm size fraction, againsimilar to our reported values.[29] The Columbia River plume has historically been low
in nitrogen [Conomos et al., 1972], but the many smallerrivers in Oregon, and presumably much of the PacificNorthwest, contain relatively high concentrations (approx-T
able
2.Kinetic
Param
etersforN
UptakeforPlume+PlumeandWashingtonExperim
entsa
Experim
ent(Treatment)
Nitrate
Ammonium
r max(mM
NL�1h�1)
Ks(mM
NL�1)
MeanPN
(mM
NL�1)
r2(n)
r max(mM
NL�1h�1)
Ks(mM
NL�1)
MeanPN
(mM
NL�1)
r2(n)
Plume+plume(nitrate)
1.09(0.03)
4.72(0.45)
25.16(0.90)
0.98(12)
1.44(0.17)
1.23(0.36)
27.39(1.16)
0.90(12)
Plume+plume(control)
2.36(0.14)
5.61(0.94)
24.81(1.17)
0.96(12)
Washington(control)
0.87(0.05)
3.57(0.70)
19.39(0.97)
0.95(9)
1.25(0.04)
3.14(0.32)
20.33(1.06)
0.99(9)
aMichaelis-Mentenparam
eters:maxim
um
uptake(r
max)andhalf-saturationconstant(K
s)wereestimated
from
adirectnonlinearcurvefittingmodel(see
textfordetails).Estim
ated
standarderrorvalues
ofkinetic
param
etersaregiven
inparentheses.Ther2
columnprovides
thecoefficientofdeterminationandthesamplesize
(n).TheMeanPNcolumnprovides
themean(SD)PN
concentrationforeach
experim
ent;maxim
um
uptakevelocity
(Vmax)canbedetermined
bydividingr m
axbyPN.
C00B11 KUDELA AND PETERSON: PRODUCTIVITY IN THE COLUMBIA RIVER PLUME
11 of 15
C00B11

imately 40 mM) of nitrate, attributed to the effects ofnitrogen fixation by the large stands of Alder [cf. Wetz etal., 2006]. Our results suggest that increased nitrogenloading to the coastal ocean would result in enhancedphytoplankton growth and biomass, but that phosphorusand possibly silicic acid would quickly become limiting;results from the growouts suggest that even with excessnitrogen, a maximal biomass of 60 mg chl a L�1 isreached, at least over short (5 days) time scales. Dortchand Postel similarly concluded that ‘‘phytoplankton off theWashington coast are poised precariously between nitrogensufficiency and deficiency. . .a small change in nitrogensupply or an environmental factor. . .could alter productivityconsiderably’’ [Dortch and Postel, 1989a, p. 168].[30] In other parts of the California Current, iron limita-
tion is relatively common [Firme et al., 2003; Hutchins andBruland, 1998; Hutchins et al., 1998]. In contrast, the RISEregion [Lohan and Bruland, 2006], and more generally thePacific Northwest [Chase et al., 2005, 2007; Wetz et al.,2006] is thought not be iron limited, because of themodulating effects of the ‘‘shelf capacitor’’ benthic sourcesand the very high iron levels in the Columbia River plume.This capacitor effect describes the seasonal and interannualbuildup of bioavailable iron in the shallow sediments of theshelf. So long as this pool of iron is not depleted, the coastalsystem is buffered from iron limitation, and growth (andbiomass) can be decoupled from direct iron injectionprocesses such as riverine inputs. Our growout data areconsistent with this view; although there may be longer-term effects of iron availability, adding filtered plume waterprovided no enhanced productivity, growth, or biomassrelative to adding nitrate alone. It is possible that Felimitation still exists in the RISE region, and that weinadvertently contaminated all of the containers. Given thelarge amounts of Fe available [Bruland et al., 2008; Lohanand Bruland, 2006] and the lack of evidence for Felimitation in previous analyses [Chase et al., 2005, 2007;Wetz et al., 2006] we suggest that this scenario is unlikely.[31] The broad interpretation of our data demonstrates
that nitrogen (nitrate) is the primary limiting nutrient regu-lating phytoplankton biomass, productivity, and growthrates during August 2005, with the possibility of silicicacid colimitation off Oregon. These experimental results canbe related to the latitudinal gradients observed at both thelarge scale [Ware and Thomson, 2005] and small scale ofthe Oregon versus Washington coasts immediately adjacentto the Columbia River. Comparing the five growout experi-ments, the plume, Washington, and plume + plume experi-ments were similar (Figure 4) with a general increase in
biomass and >20 mm size fraction until nitrate was depleted.In contrast, the aged plume and Oregon experimentsshowed an initial increase in both total chl a and the>20 mm fraction, followed by either relatively flat biomasswith widely varying size distributions (aged plume) or anapparent bloom-crash-bloom cycle, somewhat independentof ambient nitrate (Oregon). These differences do notappear to be related to physiological capacity. While theaged plume growth rates are quite low (Figure 5), theOregon experiment exhibited rates that are statisticallysignificantly greater (ANCOVA; p < 0.05) than the Wash-ington experiment, despite the 2 times difference in maxi-mal biomass (Figure 6) with similar initial nutrientconditions. The productivity index (Figure 7) is also com-parable for Oregon and Washington for the control and+plume treatments, as well as for the second ProductivityIndex time point in the +nitrate Washington treatment(Figure 7). Observations of the plankton community didnot reveal any dramatic differences over the time course ofthe experiments or among treatments. Similarly, Frame andLessard [2009] also report that there are no strong differ-ences in plankton community composition between thecoastal waters of Oregon and Washington and the ColumbiaRiver plume, consistent with our findings of similar phys-iological capacity. Those authors also report that for sum-mer 2005, Si was significantly correlated with diatomcommunity structure, while both Si and N were significantlycorrelated with community structure differences betweenplume and nonplume waters. These results are consistentwith primary limitation of the entire phytoplankton commu-nity by N, with secondary control by Si in regions notstrongly influenced by the plume (which is associated withelevated Si concentrations).[32] Previous authors [Ware and Thomson, 2005] sug-
gested that the observed poleward gradient in biomass maybe attributed to increased shelf width and river runoff actingat interannual time scales. Chase et al. [2007] refined thisargument by suggesting that the shelf width and river runoffwere impacting the interannual availability of iron. Ourresults are not inconsistent with these hypotheses, but wesuggest a seasonal gradient may also exist in nitrogen,resulting in a more immediate and small-scale (RISEregion) difference in biomass and productivity. Hickeyand Banas [2008] summarized the potential sources of Nto the Washington coast, and concluded that the Strait ofJuan de Fuca and canyon-induced upwelling off Washing-ton can provide nitrogen levels comparable to or exceedinglocal upwelling, and an order of magnitude greater than theN input from the Columbia River. Moreover, these sources
Table 3. Kinetic Parameters for Ammonium Inhibition of Nitrate Uptake for Plume + Plume and Washington Experimentsa
Experiment (Treatment)
Inverse Michaelis-Menten Model Three-Parameter Model
rmax
(mM N L�1 h�1)Imax
(%)KI
(mM N L�1)9 � KI
(mM N L�1)r2
(n)rmax
(mM N L�1 h�1)Imax
(%)r2
(n)
Plume + Plume (nitrate) 1.31 109.0 1.81 2.65 0.89 (13) 1.32 77.6 0.90 (13)Plume + Plume (control) 1.14 77.8 0.29 16.3 0.89 (11) 1.15 69.2 0.90 (11)Washington (control) 0.56 67.3 0.58 5.26 0.93 (9) 0.56 55.9 0.94 (9)
aThe maximum uptake of nitrate at zero ammonium (rmax) and potential percent maximum inhibition (Imax) were calculated using an inverse Michaelis-Menten curve and three-parameter exponential decay curve as described in the text. For the inverse model, the half-saturation constant for inhibition (KI)and the ammonium concentration beyond which no nitrate is predicted to be taken up (9� KI) were also determined. The r2 column provides the coefficientof determination and the sample size (n).
C00B11 KUDELA AND PETERSON: PRODUCTIVITY IN THE COLUMBIA RIVER PLUME
12 of 15
C00B11

are more persistent temporally, and extend spatially bothdeeper and further offshore. During downwelling condi-tions, the Columbia River plume remains a source ofnitrogen [Bruland et al., 2008] and would preferentiallyfeed the Washington coast [Hickey et al., 2005]. Thus thepoleward gradient in biomass may be strongly influenced bythe relatively greater availability of N under both upwellingand downwelling conditions along the Washington coast.[33] The aged plume and Oregon experiments depleted
ambient phosphate and silicate (Oregon) at about the sametime that nitrate was depleted. Comparing Oregon versusWashington, the Oregon experiment depleted the macronu-trient pool substantially faster (day 2 versus day 2–4) thanfor Washington, without accumulating as much biomass.The secondary biomass peak in the Oregon experiment(day 3.5) as well as the rapid size-structure shifts in theaged plume experiment (Figure 4) are suggestive of bothcommunity shifts in response to changing nutrient concen-trations and greater loss terms in those experimental enclo-sures compared to the other stations. This would explain therelatively high productivity index values off Oregon withcorresponding low net community growth rates. Theseresults are consistent with a better developed micrograzercommunity in the aging plume water as well as thedownstream upwelled water (Oregon coast), results thatare generally consistent with the modeling study of Banaset al. [2009b], and Lessard and Frame (presented paper,2008), as summarized by Kudela et al. [2008a]. Althoughmesozooplankton are essentially excluded from deckboardgrowouts, Peterson and Peterson [2008] also reported abetter developed grazer community in aged plume com-pared to fresh plume waters. Frame and Lessard [2009]report that fresh plume waters exhibited lower abundancesof heterotrophic plankton (micrograzers) compared to non-plume waters. These observations may explain the strikingdifference between the aged plume and both the plume andplume + plume experiments. The aged plume showedessentially no response to added nitrate, while both the(fresh) plume and plume + plume exhibited a strong growthresponse. Assuming that salinity is a good proxy for plumemixing, the plume and aged plume were similar, while theplume + plume was mixed with coastal waters. Assumingthat fresh plume waters exhibit unusually low grazer abun-dance, we would expect low loss rates in the fresh plume,and correspondingly greater loss rates in the aged plume asthe grazer community gradually builds up. The plume +plume waters continued to increase in biomass, butexhibited net community growth rates substantially lowerthan the (fresh) plume, also consistent with the idea thatthere was relatively higher grazing pressure in the higher-salinity plume.[34] Banas et al. [2009a] suggest that the Columbia River
plume acts to both retain and disperse (cross shelf) the netsouthward transport of coastal water, resulting in longerretention off the Washington shelf, but also resulting inrelatively long (10–20 days) retention within and immedi-ately south of the Columbia River plume during upwelling-favorable conditions. Upwelling systems are somewhatunique in that the seasonal succession of algae commonlyobserved in all waters can be disrupted and restarted onshort time scales in response to changes in environmentalconditions, particularly upwelling/relaxation cycles [Kudela
et al., 2005]. In the RISE region, the river plume appears toact similarly, disrupting the mean equatorward flow result-ing in a ‘‘fresh’’ or ‘‘reset’’ biological community furthersouth and onshore along the Oregon coast, because theplume acts as a barrier to the transport of an aged-upwellingcommunity from the Washington shelf.
5. Summary
[35] Experimental enclosures from RISE-3W conductedin August 2005 provide evidence for nitrogen (nitrate) beingthe primary limiting nutrient in the vicinity of the ColumbiaRiver plume. There is no evidence for an inherent physio-logical difference in phytoplankton assemblages betweenthe Oregon and Washington shelf waters adjacent to theColumbia River plume, nor is there evidence for short-termeffects of iron limitation or enhancement by other constit-uents of the plume water (e.g., Zn, organic matter). Mod-erate nitrogen additions appear capable of pushing thesystem into secondary limitation by phosphorous or silicicacid, highlighting the potential downstream importance ofthese nutrient additions from the plume [Aguilar-Islas andBruland, 2006]. These data further suggest that the meso-scale and large-scale gradients in biomass observed alongthe Oregon and Washington coasts are likely the result ofthree factors. First, the N limitation and enhanced grazing inthe aged plume and aged upwelled waters (near field).Second, the ‘‘barrier’’ effect of the plume further down-stream off Oregon [Banas et al., 2009b]. Third, the long-term effects of a reduced iron ‘‘shelf capacitor’’ effect offOregon compared to Washington.
[36] Acknowledgments. We thank the other RISE participants andthe captain and crew of the R/V Wecoma for their assistance on this project.We gratefully acknowledge the field and laboratory assistance provided byAlice Roberts, Sherry Palacios, Misty Blakely, and Anna Rubin. BettinaSohst analyzed the nutrient data. Maeve Lohan and Ken Bruland kindlyprovided the dissolved iron data presented in Table 1. Funding wasprovided by the National Science Foundation coastal ocean processesprogram through grant OCE 0238347. This is RISE contribution 23.
ReferencesAguilar-Islas, A., and K. Bruland (2006), Dissolved manganese and silicicacid in the Columbia River plume: A major source to the CaliforniaCurrent and coastal waters off Washington and Oregon, Mar. Chem.,101, 233–247, doi:10.1016/j.marchem.2006.03.005.
Banas, N., P. MacCready, and B. Hickey (2009a), The Columbia Riverplume as cross-shelf exporter and along-coast barrier, Cont. Shelf Res.,29, 292–301, doi:10.1016/j.csr.2008.03.011.
Banas, N., E. Lessard, R. Kudela, P. MacCready, T. Peterson, B. Hickey, andE. Frame (2009b), Planktonic growth and grazing in the Columbia Riverplume region: A biophysical model study, J. Geophys. Res., 114,C00B06, doi:10.1029/2008JC004993.
Banse, K. (1990), Does iron really limit phytoplankton production in theoffshore subarctic Pacific?, Limnol. Oceanogr., 35, 772–775.
Banse, K. (1992), Grazing, temporal changes of phytoplankton concen-trations, and the microbial loop in the open sea, in Primary Produc-tivity and Biogeochemical Cycles in the Sea, edited by P. Falkowski andA. Woodhead, pp. 409–440, Plenum, New York.
Barnes, C., A. Duxbury, and B. Morse (1972), Circulation and selectedproperties of the Columbia River effluent at sea, in The Columbia RiverEstuary and Adjacent OceanWaters, edited by A. Pruter and D. Alverson,pp. 41–80, Univ. of Wash. Press, Seattle.
Bruland, K., M. Lohan, A. Aguilar-Islas, G. Smith, B. Sohst, andA. Baptista (2008), Factors influencing the chemistry and formation ofthe Columbia River plume: Nitrate, silicic acid, dissolved Fe and dissolvedMn, J. Geophys. Res., 113, C00B02, doi:10.1029/2007JC004702.
Buck, K., M. Lohan, C. Berger, and K. Bruland (2007), Dissolved ironspeciation in two distinct river plumes and an estuary: Implications forriverine iron supply, Limnol. Oceanogr., 52, 843–855.
C00B11 KUDELA AND PETERSON: PRODUCTIVITY IN THE COLUMBIA RIVER PLUME
13 of 15
C00B11

Chase, Z., B. Hales, T. Cowles, R. Schwartz, and A. van Geen (2005),Distribution and variability of iron input to Oregon coastal waters duringthe upwelling season, J. Geophys. Res., 110, C10S12, doi:10.1029/2004JC002590.
Chase, Z., P. Strutton, and B. Hales (2007), Iron links river runoff and shelfwidth to phytoplankton biomass along the U.S. West Coast, Geophys.Res. Lett., 34, L04607, doi:10.1029/2006GL028069.
Chavez, F., K. Buck, K. Coale, J. Martin, G. DiTullio, N. Welschmeyer,A. Jacobson, and R. Barber (1991), Growth-rates, grazing, sinking, andiron limitation of equatorial Pacific phytoplankton, Limnol. Oceanogr.,36, 1816–1833.
Chisholm, S. (1991), Phytoplankton size, in Primary Productivity and Bio-geochemical Cycles in the Sea, edited by P. Falkowski and A. Woodhead,pp. 213–237, Plenum, New York.
Cochlan, W., and D. Bronk (2001), Nitrogen uptake kinetics in the RossSea, Antarctica, Deep Sea Res., Part II, 48, 4127–4153, doi:10.1016/S0967-0645(01)00083-2.
Cochlan, W., and D. Bronk (2003), Effects of ammonium on nitrate utiliza-tion in the Ross Sea: Implications for f-ratio estimates, in Biogeochem-istry of the Ross Sea, Antarct. Res. Ser., vol. 78, edited by G. DiTullio andR. Dunbar, pp. 159–178, AGU, Washington, D. C.
Conomos, T., M. Gross, C. Barnes, and F. Richards (1972), River-oceannutrient relations in summer, in The Columbia River Estuary and Adja-cent Ocean Waters, edited by A. Pruter and A. Alverson, pp. 151–175,Univ. of Wash. Press, Seattle.
Corwith, H., and P. A. Wheeler (2002), El Nino related variations in nu-trient and chlorophyll distributions off Oregon, Prog. Oceanogr., 54,361–380, doi:10.1016/S0079-6611(02)00058-7.
DiTullio, G., D. Hutchins, and K. Bruland (1993), Interaction of iron andmajor nutrients controls phytoplankton growth and species compositionin the tropical North Pacific Ocean, Limnol. Oceanogr., 38, 495–508.
Dortch, Q., and J. Postel (1989a), Biochemical indicators of N utilization byphytoplankton during upwelling off the Washington coast, Limnol. Ocea-nogr., 34, 758–773.
Dortch, Q., and J. Postel (1989b), Phytoplankton-nitrogen interactions, inCoastal Oceanography of Washington and Oregon, Elsevier Oceanogr.Ser. Amsterdam, vol. 47, edited by M. Landry and B. Hickey, pp. 139–173, Elsevier, Amsterdam.
Dugdale, R., and F. Wilkerson (1986), The use of 15N to measure nitrogenuptake in eutrophic oceans: Experimental considerations, Limnol. Ocea-nogr., 31, 673–689.
Dugdale, R., and F. Wilkerson (1990), Iron addition experiments in theAntarctic: A reanalysis, Global Biogeochem. Cycles, 4, 13 – 19,doi:10.1029/GB004i001p00013.
Dugdale, R., F. Wilkerson, V. Hogue, and A. Marchi (2006), Nutrientcontrols on new production in the Bodega Bay, California, coastal upwel-ling plume, Deep Sea Res., Part II, 53, 3049 –3062, doi:10.1016/j.dsr2.2006.07.009.
Dugdale, R., F. Wilkerson, V. Hogue, and A. Marchi (2007), The role ofammonium and nitrate in spring bloom development in San FranciscoBay, Estuarine Coastal Shelf Sci., 73, 17 – 29, doi:10.1016/j.ecss.2006.12.008.
Fan, C., P. Glibert, and J. Burkholder (2003), Characterization of the affi-nity for nitrogen, uptake kinetics, and environmental relationships forProrocentrum minimum in natural blooms and laboratory cultures, Harm-ful Algae, 2, 283–299, doi:10.1016/S1568-9883(03)00047-7.
Fiedler, P., and R. Laurs (1990), Variability of the Columbia River plumeobserved in visible and infrared satellite imagery, Int. J. Remote Sens., 11,999–1010, doi:10.1080/01431169008955072.
Firme, G. F., E. L. Rue, D. A. Weeks, K. W. Bruland, and D. A. Hutchins(2003), Spatial and temporal variability in phytoplankton iron limitationalong the California coast and consequences for Si, N, and C biogeo-chemistry, Global Biogeochem. Cycles, 17(1), 1016, doi:10.1029/2001GB001824.
Frame, E., and E. Lessard (2009), Does the Columbia River plume influ-ence phytoplankton community structure along the Washington and Ore-gon coasts?, J. Geophys. Res., doi:10.1029/2008JC004999, in press.
Frost, B. (1991), The role of grazing in nutrient-rich areas of the open sea,Limnol. Oceanogr., 36, 1616–1630.
Glibert, P., F. Lipschultz, J. McCarthy, and M. Altabet (1982), Isotopedilution models of uptake and remineralization of ammonium by marineplankton, Limnol. Oceanogr., 27, 639–650.
Healey, F. (1980), Slope of the Monod equation as an indicator of advan-tage in nutrient competition, Microb. Ecol., 5, 281–286, doi:10.1007/BF02020335.
Henson, S., and A. Thomas (2007), Interannual variability in timing ofbloom initiation in the California Current System, J. Geophys. Res.,112, C08007, doi:10.1029/2006JC003960.
Hickey, B., and N. Banas (2003), Oceanography of the U.S. Pacific North-west coastal ocean and estuaries with application to coastal ecology,Estuaries, 26, 1010–1031, doi:10.1007/BF02803360.
Hickey, B., and N. Banas (2008), Why is the northern end of the CaliforniaCurrent System so productive?, Oceanography (Wash. D.C.), 21, 72–90.
Hickey, B. M., S. Geier, N. Kachel, and A. MacFadyen (2005), A bi-directional river plume: The Columbia in summer, Cont. Shelf Res., 25,1631–1656, doi:10.1016/j.csr.2005.04.010.
Hickey, B., A. MacFadyen, W. Cochlan, R. Kudela, K. Bruland, andC. Trick (2006), Evolution of chemical, biological, and physical waterproperties in the northern California Current in 2005: Remote or local windforcing?, Geophys. Res. Lett., 33, L22S02, doi:10.1029/2006GL026782.
Hill, J., and P. A. Wheeler (2002), Organic carbon and nitrogen in thenorthern California Current System: Comparison of offshore, riverplume, and coastally upwelled waters, Prog. Oceanogr., 53, 369–387,doi:10.1016/S0079-6611(02)00037-X.
Holmes, R. M., A. Aminot, R. Kerouel, B. A. Hooker, and B. J. Peterson(1999), A simple and precise method for measuring ammonium in marineand freshwater ecosystems, Can. J. Fish. Aquat. Sci., 56, 1801–1808,doi:10.1139/cjfas-56-10-1801.
Howard, M., N. Ladizinsky, W. Cochlan, and R. Kudela (2007), Nitrogen-ous preference of toxigenic Pseudo-nitzschia australis (Bacillariophy-ceae) from field and laboratory experiments, Harmful Algae, 6, 206–217, doi:10.1016/j.hal.2006.06.003.
Hutchins, D., and K. Bruland (1998), Iron-limited diatom growth and Si:Nuptake ratios in a coastal upwelling regime, Nature, 393, 561–564,doi:10.1038/31203.
Hutchins, D., G. DiTullio, Y. Zhang, and K. Bruland (1998), An ironlimitation mosaic in the California upwelling regime, Limnol. Oceanogr.,43, 1037–1054.
Huyer, A., J. Fleischbein, J. Keister, P. Kosro, N. Perlin, R. Smith, andP. Wheeler (2005), Two coastal upwelling domains in the northernCalifornia Current System, J. Mar. Res., 63, 901–929, doi:10.1357/002224005774464238.
Irwin, A., Z. Finkel, O. Schofield, and P. Falkowski (2006), Scaling-upfrom nutrient physiology to the size-structure of phytoplankton commu-nities, J. Plankton Res., 28, 459–471, doi:10.1093/plankt/fbi148.
Kudela, R. M., and W. P. Cochlan (2000), Nitrogen and carbon uptakekinetics and the influence of irradiance for a red tide bloom off southernCalifornia, Aquat. Microbiol. Ecol., 21, 31–47, doi:10.3354/ame021031.
Kudela, R., and R. Dugdale (2000), Nutrient regulation of phytoplanktonproductivity in Monterey Bay, California, Deep Sea Res., Part II, 47,1023–1053, doi:10.1016/S0967-0645(99)00135-6.
Kudela, R., G. Pitcher, T. Probyn, F. Figueiras, T. Moita, and V. Trainer(2005), Harmful algal blooms in coastal upwelling systems, Oceano-graphy (Wash. D.C.), 18, 184–197.
Kudela, R., W. Cochlan, T. Peterson, and C. Trick (2006), Impacts onphytoplankton biomass and productivity in the Pacific Northwest duringthe warm ocean conditions of 2005, Geophys. Res. Lett., 33, L22S06,doi:10.1029/2006GL026772.
Kudela, R., N. Banas, J. Barth, E. Frame, D. Jay, J. Largier, E. Lessard,T. Peterson, and A. Vander Woude (2008a), New insights into the controlsand mechanisms of plankton productivity in coastal upwelling waters ofthe northern California Current System, Oceanography (Wash. D.C.), 21,40–54.
Kudela, R., J. Lane, and W. Cochlan (2008b), The potential role of anthro-pogenically derived nitrogen in the growth of harmful algae in California,USA, Harmful Algae, 8, 103–110, doi:10.1016/j.hal.2008.08.019.
Landry, M. R., J. Postel, W. Peterson, and J. Newman (1989), Broad-scalepatterns in the distribution of hydrographic variables, in Coastal Ocea-nography of Washington and Oregon, Elsevier Oceanogr. Ser. Amster-dam, vol. 47, edited by M. R. Landry and B. M. Hickey, pp. 1–41,Elsevier, Amsterdam.
Legendre, L., and M. Gosselin (1997), Estimation of N or C uptake rates byphytoplankton using 15N or 13C: Revisiting the usual computation for-mulae, J. Plankton Res., 19, 263–271, doi:10.1093/plankt/19.2.263.
Lohan, M., and K. Bruland (2006), Importance of vertical mixing for addi-tional sources of nitrate and iron to surface waters of the Columbia Riverplume: Implications for biology, Mar. Chem., 98, 260–273, doi:10.1016/j.marchem.2005.10.003.
Martin, J., R. Gordon, S. Fitzwater, and W. Broenkow (1988), VERTEX:Phytoplankton/iron studies in the Gulf of Alaska, Deep Sea Res., Part A,35, 177–196, doi:10.1016/0198-0149(88)90035-0.
Parsons, T., Y. Maita, and C. Lalli (1984), A Manual of Chemical andBiological Methods for Seawater Analysis, 173 pp., Pergamon, Oxford,U.K.
Peterson, J., and W. Peterson (2008), Influence of the Columbia Riverplume (USA) on the vertical and horizontal distribution of mesozoo-
C00B11 KUDELA AND PETERSON: PRODUCTIVITY IN THE COLUMBIA RIVER PLUME
14 of 15
C00B11
plankton over the Washington and Oregon shelf, ICES J. Mar. Sci., 65,477–483, doi:10.1093/icesjms/fsn006.
Press, W., S. Teukolsky, W. Vetterling, and B. Flannery (1992), NumericalRecipes in C, 994 pp., Cambridge Univ. Press, New York.
Small, L., and D. Menzies (1981), Patterns of primary productivity andbiomass in a coastal upwelling region, Deep Sea Res., Part A, 28,123–149, doi:10.1016/0198-0149(81)90086-8.
Strub, P., C. James, A. Thomas, and M. Abbott (1990), Seasonal and non-seasonal variability of satellite-derived surface pigment concentrations inthe California Current, J. Geophys. Res., 95, 11,501 – 11,530,doi:10.1029/JC095iC07p11501.
Thomas, A., and P. Brickley (2006), Satellite measurements of chlorophylldistribution during spring 2005 in the California Current, Geophys. Res.Lett., 33, L22S05, doi:10.1029/2006GL026588.
Thomas, A., and P. Strub (1989), Interannual variability in phytoplanktonpigment distribution during the spring transition along the west coast ofNorth America, J. Geophys. Res., 94, 18,095–18,117, doi:10.1029/JC094iC12p18095.
Thomas, A., and P. T. Strub (2001), Cross-shelf phytoplankton pigmentvariability in the California Current, Cont. Shelf Res., 21, 1157–1190,doi:10.1016/S0278-4343(01)00006-1.
Thomas, A., and R. Weatherbee (2006), Satellite-measured temporal varia-bility of the Columbia River plume, Remote Sens. Environ., 100, 167–178, doi:10.1016/j.rse.2005.10.018.
Turner, R., and N. Rabalais (1994), Coastal eutrophication near the Mis-sissippi River delta, Nature, 368, 619–621, doi:10.1038/368619a0.
Turner, R., N. Rabalais, D. Justic, and Q. Dortch (2003), Future aquaticnutrient limitations, Mar. Pollut. Bull., 46, 1032–1034, doi:10.1016/S0025-326X(03)00049-3.
Ware, D., and R. Thomson (2005), Bottom-up ecosystem trophic dynamicsdetermine fish production in the northeast Pacific, Science, 308, 1280–1284, doi:10.1126/science.1109049.
Welschmeyer, N. A. (1994), Fluorometric analysis of chlorophyll a in thepresence of chlorophyll b and pheopigments, Limnol. Oceanogr., 39,1985–1992.
Welschmeyer, N., R. Goericke, S. Strom, and W. Peterson (1991), Phyto-plankton growth and herbivory in the subarctic Pacific: A chemotaxo-nomic analysis, Limnol. Oceanogr., 36, 1631–1649.
Wetz, M., B. Hales, Z. Chase, P. Wheeler, and M. Whitney (2006), Riverineinput of macronutrients, iron, and organic matter to the coastal ocean offOregon, U.S.A., during the winter, Limnol. Oceanogr., 51, 2221–2231.
Wilkerson, F. P., R. C. Dugdale, R. Kudela, and F. Chavez (2000), Biomassand productivity in Monterey Bay, California: Contribution of the largephytoplankton, Deep Sea Res., Part II, 47, 1003–1022, doi:10.1016/S0967-0645(99)00134-4.
�����������������������R. M. Kudela, Ocean Sciences Department, University of California,
Santa Cruz, CA 95064, USA. ([email protected])T. D. Peterson, Science and Technology Center for Coastal Margin
Observation and Prediction, Oregon Health and Science University,Beaverton, OR 97006, USA.
C00B11 KUDELA AND PETERSON: PRODUCTIVITY IN THE COLUMBIA RIVER PLUME
15 of 15
C00B11
Copyright © 2022 FDOKUMEN