Instruments Design and Testing for a Hall Thruster Plume ...
Upload
khangminh22Category
view
1download
0
atmosphere
Article
A Novel Approach for Water Conservation and PlumeAbatement in Mechanical Draft Cooling Towers
Weishu Wang 1,2,*, Xuewen Ge 2,3, Shifei Zhao 1, Haonan Zheng 1,2, Weihui Xu 1,2, Jiatong Lv 2
and Ge Zhu 1
1 School of Electric Power, North China University of Water Resources and Electric Power,Zhengzhou 450045, China; [email protected] (S.Z.); [email protected] (H.Z.);[email protected] (W.X.); [email protected] (G.Z.)
2 Institute of Engineering Thermophysics, North China University of Water Resources and Electric Power,Zhengzhou 450045, China; [email protected] (X.G.); [email protected] (J.L.)
3 School of Environmental and Municipal Engineering, North China University of Water Resources andElectric Power, Zhengzhou 450046, China
* Correspondence: [email protected]
Received: 8 November 2019; Accepted: 19 November 2019; Published: 22 November 2019 �����������������
Abstract: While the visible plume from a cooling tower is not a pollutant, it can affect the surroundingenvironment. Moreover, the accompanied evaporation loss has a great potential for wastewater recovery.In the present study, a novel coupling technology for water conservation and plume abatement wasproposed, and its feasibility was verified by using thermodynamic analysis. A surface-type heatexchanger was designed and a thermodynamic calculation model was established. Next, based on theprinciple of “no plume,” the effect of the number of heat exchanger units (N) and the circulating watervolume (G) on the water conservation and plume abatement was evaluated under design condition.Results showed that the optimized parameters for the operation of the cooling towers were N = 8 andG < 3000 m3/h, which have a good effect on water conservation and plume abatement. Furthermore, asper the condensation calculation model, the average water conservation amount was 1.105 kg/s and theannual water conservation amount reached 2.8641 × 10⁷ kg.
Keywords: cooling tower; coupling technology; plume abatement; water conservation
1. Introduction
The cooling tower is a key component of a water-cooled air conditioning plant, which removesheat from the warm water in the condenser [1]. However, evaporation loss in the cooling tower is highand difficult to recover. Meanwhile, when hot moist air emitted from the cooling tower is mixed withthe ambient air, a visible plume is generated. In most cases, the plume is not considered as a pollutant;however, it can influence the visibility of the surrounding residential areas and road traffic. Moreover,it makes the pavement around the cooling tower wet and slippery, which affects the maintenance work.
In the past, the effect of visible plumes from cooling towers has always been neglected.Veldhuizen et al. [2] considered several methods of alleviating plume generation and made costestimates for the most promising methods. Other researchers have also focused on this problem,but have not reported any effective controlling measures [3–5]. Until recently, plumes from coolingtowers had become a major concern; therefore, a large number of studies are being conducted tofind plume abatement methods. For example, Li et al. [6] proposed that cooling tower plumes usingcoaxial plume structures have more advantages when compared with the traditional approach ofcooling tower plume abatement. Tyagi et al. [7] studied the principle of generating visible plumes, andpresented a case study of the prediction, potential, and control of plumes from wet cooling towers
Atmosphere 2019, 10, 734; doi:10.3390/atmos10120734 www.mdpi.com/journal/atmosphere

Atmosphere 2019, 10, 734 2 of 15
of commercial buildings in Hong Kong, based on the weather data available for a particular year.Similarly, Xu et al. [8] evaluated the plume potential and abatement of evaporative cooling towersin a subtropical region; the results showed that the control strategies had a significant effect on theplume potential and further impacted the system design and sizing of the plume abatement system.Hu et al. [9] developed a thermodynamic coupling calculation model of hybrid cooling towers. Theyalso proposed a novel scheme to combine the advantages of both dry and wet cooling subsystems toeliminate the plume problem inherent in wet cooling towers; moreover, this could also save a largeamount of water. Further, application of renewable energy (such as heat pumps and solar collectorsin heating systems) to control the visible plume from wet cooling towers is an environment-friendlymethod. The combined option is more economical than the heating alone option, especially in the caseof heat pump systems [10,11].
In order to further solve the plume problem, it is necessary to investigate the prediction of a visibleplume. The computational fluid dynamics (CFD) method is an effective way of research and widelyused in many fields [12,13]; and it is also used to study the prediction of a visible plume. Meroney [14]used the computational fluid dynamics (CFD) method to simulate the cooling tower plume dispersionand drift; the simulation replicated the experiments carried out in the Chalk Point natural draft coolingtower (MD, USA). Takata et al. [15] used the CFD method to predict the generation and range of plumeand analyze its mechanism of abatement. Ding et al. [16] calculated the sensitivity analysis of plumerising height from cooling tower and results showed that the main factors affecting the plume risingheight is the atmospheric stability. The experiment method is also an essential part of research and itcan validate whether the numerical simulation results are correct. Michioka et al. [17] developed anew method for a wind tunnel experiment to predict a visible plume region from a wet cooling tower,and the results revealed that the visible plume length and height were nearly in agreement with theobservations. Guo [18] also used a wind tunnel experiment to predict a visible plume from the coolingtower of a nuclear power plant, and the proposed wind tunnel experiment can simulate the visibleplume region and plume rise with reasonable accuracy.
Evaporation loss is one of the important causes of plume generation, so solving the problem ofcooling tower evaporation loss can not only save water, but also contribute to solve the plume problem.Lee et al. [19] proposed a preliminary strategy involving a combination of dry and wet cooling methods,which could adequately conserve water without compromising on the performance. Other authorshave further defined this approach, demonstrating that a satisfactory amount of water conservationcould be achieved [20,21]. Askari et al. [22] examined the effect of multi-walled carbon nanotubes(MWNTs) and nanoporous graphene nanoparticles on the thermal and rheological properties of water,as well as their impact on the performance of a mechanical wet cooling tower in terms of energyand water conservation. Chang et al. [23] proposed a novel water and energy conservation methodfor a counterflow cooling tower using UV light disinfection and a variable speed fan. The authorsreported that for 50% load tests, 76% energy savings and 23% water conservation were achieved.Marcia et al. [24] proposed to use cooled porous media based on thermosiphons technology to recoverthe vapor from a cooling tower. Deziani et al. [25] developed a laboratory model of a wet cooling towerwith an air-to-air heat exchanger to study its potential for reducing water consumption, and 35% waterconservation could be expected.
From the above literature, it can be seen that the existing studies mainly pay attention to plumegeneration, plume prevention, and water conservation. However, most of the researches have onlyconsidered plume abatement or water conservation, and little attention has been paid to couple waterconservation with plume abatement. Based on the findings of these investigations, a novel couplingtechnology for water conservation and plume abatement is proposed in the present work, and a surfacetype heat exchanger is designed to realize this new coupling technology. The coupling technologycombines the advantages of hot and cold channels comprising the heat exchanger to eliminate plumeformation within the area surrounding the cooling tower. The vapor condenses into water and adheresto the channel surface to achieve the purpose of water conservation. The feasibility of this technology
Atmosphere 2019, 10, 734 3 of 15
was verified by the predicted results of theoretical calculations. We believe that the results of thepresent study could prove beneficial to protect the environment and conserve water.
2. Research Methodology
2.1. Mechanism of Plume Formation
Moist air, commonly known as air, can be found in three states: Unsaturated, saturated, andsupersaturated. As the saturated humidity ratio of moist air is closely related to temperature, when theconstituent of moist air remains unchanged, the humidity ratio increases with temperature. Moreover,once relative humidity (RH) exceeds 1, unsaturated moist air transforms into supersaturated moist air.As water vapor in the moist air is unsustainable, the excess water vapor condenses into fine dropletsthat are suspended in the air to form fog, otherwise known as a visible plume.
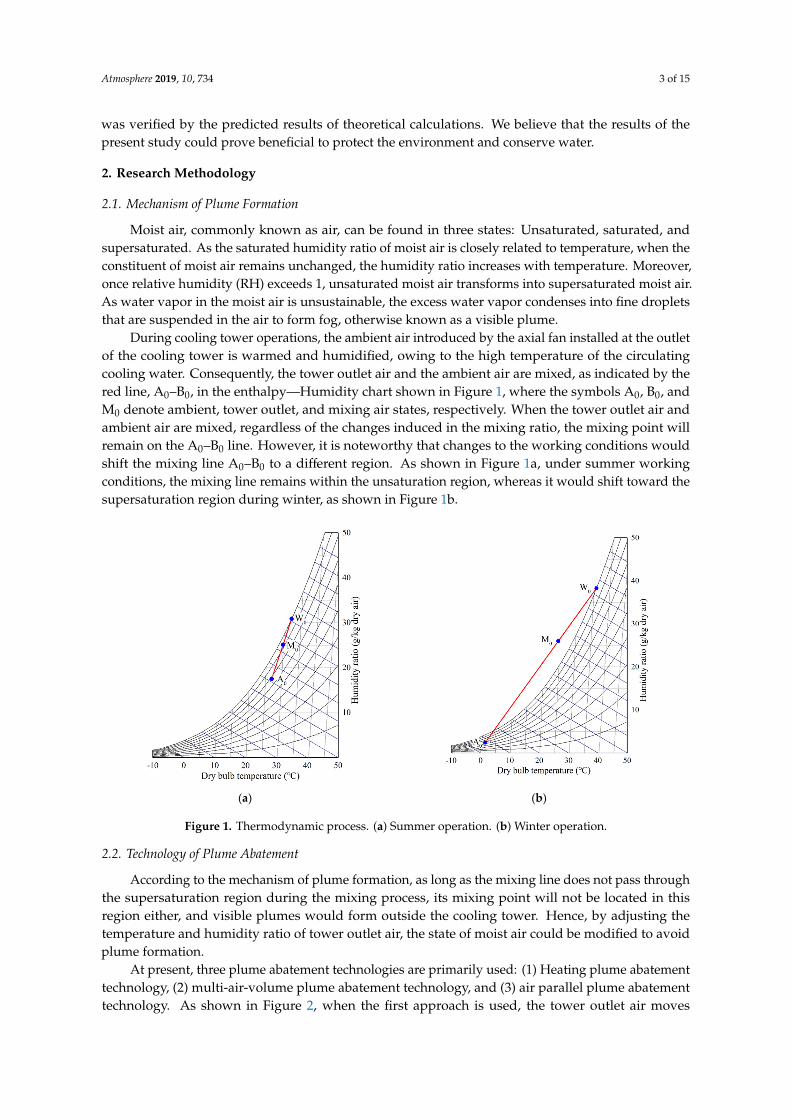
During cooling tower operations, the ambient air introduced by the axial fan installed at the outletof the cooling tower is warmed and humidified, owing to the high temperature of the circulatingcooling water. Consequently, the tower outlet air and the ambient air are mixed, as indicated by thered line, A0–B0, in the enthalpy—Humidity chart shown in Figure 1, where the symbols A0, B0, andM0 denote ambient, tower outlet, and mixing air states, respectively. When the tower outlet air andambient air are mixed, regardless of the changes induced in the mixing ratio, the mixing point willremain on the A0–B0 line. However, it is noteworthy that changes to the working conditions wouldshift the mixing line A0–B0 to a different region. As shown in Figure 1a, under summer workingconditions, the mixing line remains within the unsaturation region, whereas it would shift toward thesupersaturation region during winter, as shown in Figure 1b.
Atmosphere 2019, 10, x FOR PEER REVIEW 3 of 15
water and adheres to the channel surface to achieve the purpose of water conservation. The feasibility
of this technology was verified by the predicted results of theoretical calculations. We believe that
the results of the present study could prove beneficial to protect the environment and conserve water.
2. Research Methodology
2.1. Mechanism of Plume Formation
Moist air, commonly known as air, can be found in three states: Unsaturated, saturated, and
supersaturated. As the saturated humidity ratio of moist air is closely related to temperature, when
the constituent of moist air remains unchanged, the humidity ratio increases with temperature.
Moreover, once relative humidity (RH) exceeds 1, unsaturated moist air transforms into
supersaturated moist air. As water vapor in the moist air is unsustainable, the excess water vapor
condenses into fine droplets that are suspended in the air to form fog, otherwise known as a visible
plume.
During cooling tower operations, the ambient air introduced by the axial fan installed at the
outlet of the cooling tower is warmed and humidified, owing to the high temperature of the
circulating cooling water. Consequently, the tower outlet air and the ambient air are mixed, as
indicated by the red line, A0–B0, in the enthalpy—Humidity chart shown in Figure 1, where the
symbols A0, B0, and M0 denote ambient, tower outlet, and mixing air states, respectively. When the
tower outlet air and ambient air are mixed, regardless of the changes induced in the mixing ratio, the
mixing point will remain on the A0–B0 line. However, it is noteworthy that changes to the working
conditions would shift the mixing line A0–B0 to a different region. As shown in Figure 1a, under
summer working conditions, the mixing line remains within the unsaturation region, whereas it
would shift toward the supersaturation region during winter, as shown in Figure 1b.
(a)
(b)
Figure 1. Thermodynamic process. (a) Summer operation. (b) Winter operation.
2.2. Technology of Plume Abatement
According to the mechanism of plume formation, as long as the mixing line does not pass
through the supersaturation region during the mixing process, its mixing point will not be located in
this region either, and visible plumes would form outside the cooling tower. Hence, by adjusting the
temperature and humidity ratio of tower outlet air, the state of moist air could be modified to avoid
plume formation.
At present, three plume abatement technologies are primarily used: (1) Heating plume
abatement technology, (2) multi‐air‐volume plume abatement technology, and (3) air parallel plume
Figure 1. Thermodynamic process. (a) Summer operation. (b) Winter operation.
2.2. Technology of Plume Abatement
According to the mechanism of plume formation, as long as the mixing line does not pass throughthe supersaturation region during the mixing process, its mixing point will not be located in thisregion either, and visible plumes would form outside the cooling tower. Hence, by adjusting thetemperature and humidity ratio of tower outlet air, the state of moist air could be modified to avoidplume formation.
At present, three plume abatement technologies are primarily used: (1) Heating plume abatementtechnology, (2) multi-air-volume plume abatement technology, and (3) air parallel plume abatementtechnology. As shown in Figure 2, when the first approach is used, the tower outlet air moves

Atmosphere 2019, 10, 734 4 of 15
horizontally from point W0 to point W1, owing to sensible heating, such as that involving dry,high-efficiency heat exchanger. When the second approach is adopted, as indicated in Figure 2, thetower outlet air moves from point W0 to point A2 by increasing the air volume. This would reduce thehumidity ratio of the cooling tower outlet air. Thus, it is necessary to ensure that the state point islocated within the unsaturated region to avoid plume formation. The ambient air is forced into thecooling tower from both sides and mixed; one side of the air directly contacts with the circulatingcooling water and forms hot moist air in the cooling tower, whereas the other side of the air A0 movesto A1 by sensible heating. Finally, the two streams of air are mixed in a parallel manner, and the toweroutlet air point moves to M1.
Atmosphere 2019, 10, x FOR PEER REVIEW 4 of 15
abatement technology. As shown in Figure 2, when the first approach is used, the tower outlet air
moves horizontally from point W0 to point W1, owing to sensible heating, such as that involving dry,
high‐efficiency heat exchanger. When the second approach is adopted, as indicated in Figure 2, the
tower outlet air moves from point W0 to point A2 by increasing the air volume. This would reduce
the humidity ratio of the cooling tower outlet air. Thus, it is necessary to ensure that the state point
is located within the unsaturated region to avoid plume formation. The ambient air is forced into the
cooling tower from both sides and mixed; one side of the air directly contacts with the circulating
cooling water and forms hot moist air in the cooling tower, whereas the other side of the air A0 moves
to A1 by sensible heating. Finally, the two streams of air are mixed in a parallel manner, and the tower
outlet air point moves to M1.
Figure 2. Schematic diagram of plume abatement technology.
2.3. Technology of Water Conservation
There are two main methods employed to reduce the evaporation losses in a cooling tower: (1)
Cooling the saturated moist air formed above the cooling tower after air‐water heat exchange in the
packing to cause some water to precipitate (which could then be recovered); and (2) reducing the
temperature of the circulating cooling water before the air‐water heat exchange occurs. This would
ensure less formation of saturated moist air above the cooling tower. As indicated in Figure 3, both
these methods could be effective in conserving water by changing the condensation state of hot moist
air from W0 to W′.
Figure 3. Schematic diagram of water conservation technology.
2.4. New Coupling Technology of Water Conservation and Plume Abatement
Figure 2. Schematic diagram of plume abatement technology.
2.3. Technology of Water Conservation
There are two main methods employed to reduce the evaporation losses in a cooling tower: (1)Cooling the saturated moist air formed above the cooling tower after air-water heat exchange in thepacking to cause some water to precipitate (which could then be recovered); and (2) reducing thetemperature of the circulating cooling water before the air-water heat exchange occurs. This wouldensure less formation of saturated moist air above the cooling tower. As indicated in Figure 3, boththese methods could be effective in conserving water by changing the condensation state of hot moistair from W0 to W′.
Atmosphere 2019, 10, x FOR PEER REVIEW 4 of 15
abatement technology. As shown in Figure 2, when the first approach is used, the tower outlet air
moves horizontally from point W0 to point W1, owing to sensible heating, such as that involving dry,
high‐efficiency heat exchanger. When the second approach is adopted, as indicated in Figure 2, the
tower outlet air moves from point W0 to point A2 by increasing the air volume. This would reduce
the humidity ratio of the cooling tower outlet air. Thus, it is necessary to ensure that the state point
is located within the unsaturated region to avoid plume formation. The ambient air is forced into the
cooling tower from both sides and mixed; one side of the air directly contacts with the circulating
cooling water and forms hot moist air in the cooling tower, whereas the other side of the air A0 moves
to A1 by sensible heating. Finally, the two streams of air are mixed in a parallel manner, and the tower
outlet air point moves to M1.
Figure 2. Schematic diagram of plume abatement technology.
2.3. Technology of Water Conservation
There are two main methods employed to reduce the evaporation losses in a cooling tower: (1)
Cooling the saturated moist air formed above the cooling tower after air‐water heat exchange in the
packing to cause some water to precipitate (which could then be recovered); and (2) reducing the
temperature of the circulating cooling water before the air‐water heat exchange occurs. This would
ensure less formation of saturated moist air above the cooling tower. As indicated in Figure 3, both
these methods could be effective in conserving water by changing the condensation state of hot moist
air from W0 to W′.
Figure 3. Schematic diagram of water conservation technology.
2.4. New Coupling Technology of Water Conservation and Plume Abatement
Figure 3. Schematic diagram of water conservation technology.
2.4. New Coupling Technology of Water Conservation and Plume Abatement
Although the traditional plume abatement technology can effectively reduce the plume, the lostevaporated water cannot be easily recovered, which may negatively affect the long-term operation of

Atmosphere 2019, 10, 734 5 of 15
the cooling tower. Thus, a novel coupling technology that can save water and eliminate the plume isproposed in the present study.
Figure 4 presents the schematic diagram of a cooling tower designed for the coupling technology.In the cooling tower, a surface-type heat exchanger is set above the water collector. The surface-typeheat exchanger consists of an array of heat exchange components, each of which is composed ofmultiple cold and hot channels in an alternate manner.
Atmosphere 2019, 10, x FOR PEER REVIEW 5 of 15
Although the traditional plume abatement technology can effectively reduce the plume, the lost
evaporated water cannot be easily recovered, which may negatively affect the long‐term operation
of the cooling tower. Thus, a novel coupling technology that can save water and eliminate the plume
is proposed in the present study.
Figure 4 presents the schematic diagram of a cooling tower designed for the coupling
technology. In the cooling tower, a surface‐type heat exchanger is set above the water collector. The
surface‐type heat exchanger consists of an array of heat exchange components, each of which is
composed of multiple cold and hot channels in an alternate manner.
Figure 4. Schematic diagram of a cooling tower.
Figure 5 shows the schematic diagram of a heat exchanger unit. Here, symbols lh, x, lc, and y refer
to the length of hot channel, the width of single hot channel, the length of cold channel, and the width
of single cold channel, respectively. Hollow and solid arrows indicate cold air flow and hot air flow,
respectively. Each heat exchange channel consists of two heat exchange plates. The sealed heat
exchange channel consists of four heat exchange plates, which can be straight or corrugated.
Figure 5. Schematic diagram of the heat exchanger unit.
The principle of coupling technology is shown in Figure 6. The ambient air outside the tower at
A0 flows into the cold channel, whereas the hot moist air at W0 flows into the hot channel.
Subsequently, their heat is exchanged using a surface‐type heat exchanger, and therefore, the hot
moist drops to W′ along the saturation curve. Simultaneously, the ambient air moves to A1 by sensible
heating. The condensed water is produced during the process of reducing humidity ratio, which is
collected to save water. Next, the dry air at A1 and moist air at W′ are mixed above the surface type
heat exchanger; temperature and humidity ratio are further reduced, and the mixing point M1 falls
Figure 4. Schematic diagram of a cooling tower.
Figure 5 shows the schematic diagram of a heat exchanger unit. Here, symbols lh, x, lc, and yrefer to the length of hot channel, the width of single hot channel, the length of cold channel, and thewidth of single cold channel, respectively. Hollow and solid arrows indicate cold air flow and hot airflow, respectively. Each heat exchange channel consists of two heat exchange plates. The sealed heatexchange channel consists of four heat exchange plates, which can be straight or corrugated.
Atmosphere 2019, 10, x FOR PEER REVIEW 5 of 15
Although the traditional plume abatement technology can effectively reduce the plume, the lost
evaporated water cannot be easily recovered, which may negatively affect the long‐term operation
of the cooling tower. Thus, a novel coupling technology that can save water and eliminate the plume
is proposed in the present study.
Figure 4 presents the schematic diagram of a cooling tower designed for the coupling
technology. In the cooling tower, a surface‐type heat exchanger is set above the water collector. The
surface‐type heat exchanger consists of an array of heat exchange components, each of which is
composed of multiple cold and hot channels in an alternate manner.
Figure 4. Schematic diagram of a cooling tower.
Figure 5 shows the schematic diagram of a heat exchanger unit. Here, symbols lh, x, lc, and y refer
to the length of hot channel, the width of single hot channel, the length of cold channel, and the width
of single cold channel, respectively. Hollow and solid arrows indicate cold air flow and hot air flow,
respectively. Each heat exchange channel consists of two heat exchange plates. The sealed heat
exchange channel consists of four heat exchange plates, which can be straight or corrugated.
Figure 5. Schematic diagram of the heat exchanger unit.
The principle of coupling technology is shown in Figure 6. The ambient air outside the tower at
A0 flows into the cold channel, whereas the hot moist air at W0 flows into the hot channel.
Subsequently, their heat is exchanged using a surface‐type heat exchanger, and therefore, the hot
moist drops to W′ along the saturation curve. Simultaneously, the ambient air moves to A1 by sensible
heating. The condensed water is produced during the process of reducing humidity ratio, which is
collected to save water. Next, the dry air at A1 and moist air at W′ are mixed above the surface type
heat exchanger; temperature and humidity ratio are further reduced, and the mixing point M1 falls
Figure 5. Schematic diagram of the heat exchanger unit.
The principle of coupling technology is shown in Figure 6. The ambient air outside the tower at A0
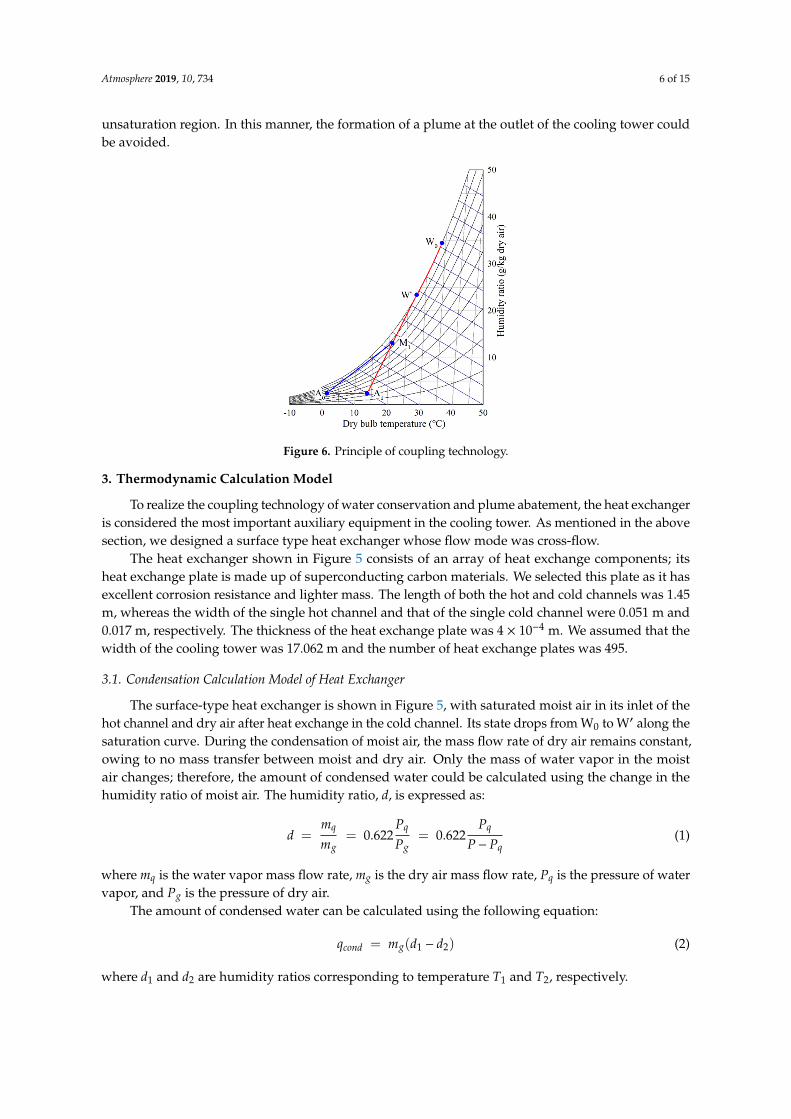
flows into the cold channel, whereas the hot moist air at W0 flows into the hot channel. Subsequently,their heat is exchanged using a surface-type heat exchanger, and therefore, the hot moist drops toW′ along the saturation curve. Simultaneously, the ambient air moves to A1 by sensible heating.The condensed water is produced during the process of reducing humidity ratio, which is collectedto save water. Next, the dry air at A1 and moist air at W′ are mixed above the surface type heatexchanger; temperature and humidity ratio are further reduced, and the mixing point M1 falls into the
Atmosphere 2019, 10, 734 6 of 15
unsaturation region. In this manner, the formation of a plume at the outlet of the cooling tower couldbe avoided.
Atmosphere 2019, 10, x FOR PEER REVIEW 6 of 15
into the unsaturation region. In this manner, the formation of a plume at the outlet of the cooling
tower could be avoided.
Figure 6. Principle of coupling technology.
3. Thermodynamic Calculation Model
To realize the coupling technology of water conservation and plume abatement, the heat
exchanger is considered the most important auxiliary equipment in the cooling tower. As mentioned
in the above section, we designed a surface type heat exchanger whose flow mode was cross‐flow.
The heat exchanger shown in Figure 5 consists of an array of heat exchange components; its heat
exchange plate is made up of superconducting carbon materials. We selected this plate as it has
excellent corrosion resistance and lighter mass. The length of both the hot and cold channels was 1.45
m, whereas the width of the single hot channel and that of the single cold channel were 0.051 m and
0.017 m, respectively. The thickness of the heat exchange plate was 4 × 10⁻⁴ m. We assumed that the
width of the cooling tower was 17.062 m and the number of heat exchange plates was 495.
3.1. Condensation Calculation Model of Heat Exchanger
The surface‐type heat exchanger is shown in Figure 5, with saturated moist air in its inlet of the
hot channel and dry air after heat exchange in the cold channel. Its state drops from W0 to W′ along
the saturation curve. During the condensation of moist air, the mass flow rate of dry air remains
constant, owing to no mass transfer between moist and dry air. Only the mass of water vapor in the
moist air changes; therefore, the amount of condensed water could be calculated using the change in
the humidity ratio of moist air. The humidity ratio, d, is expressed as:
0.622 0.622q q q
g g q
m P Pdm P P P
(1)
where qm is the water vapor mass flow rate,
gm is the dry air mass flow rate,
qP is the pressure of
water vapor, and gP is the pressure of dry air.
The amount of condensed water can be calculated using the following equation:
1 2cond g
q m d d (2)
where 1d and 2
d are humidity ratios corresponding to temperature 1T and 2
T , respectively.
3.2. Thermodynamic Calculation Model of the Heat Exchanger
Figure 6. Principle of coupling technology.
3. Thermodynamic Calculation Model
To realize the coupling technology of water conservation and plume abatement, the heat exchangeris considered the most important auxiliary equipment in the cooling tower. As mentioned in the abovesection, we designed a surface type heat exchanger whose flow mode was cross-flow.
The heat exchanger shown in Figure 5 consists of an array of heat exchange components; itsheat exchange plate is made up of superconducting carbon materials. We selected this plate as it hasexcellent corrosion resistance and lighter mass. The length of both the hot and cold channels was 1.45m, whereas the width of the single hot channel and that of the single cold channel were 0.051 m and0.017 m, respectively. The thickness of the heat exchange plate was 4 × 10⁻⁴ m. We assumed that thewidth of the cooling tower was 17.062 m and the number of heat exchange plates was 495.
3.1. Condensation Calculation Model of Heat Exchanger
The surface-type heat exchanger is shown in Figure 5, with saturated moist air in its inlet of thehot channel and dry air after heat exchange in the cold channel. Its state drops from W0 to W′ along thesaturation curve. During the condensation of moist air, the mass flow rate of dry air remains constant,owing to no mass transfer between moist and dry air. Only the mass of water vapor in the moistair changes; therefore, the amount of condensed water could be calculated using the change in thehumidity ratio of moist air. The humidity ratio, d, is expressed as:
d =mq
mg= 0.622
Pq
Pg= 0.622
Pq
P− Pq(1)
where mq is the water vapor mass flow rate, mg is the dry air mass flow rate, Pq is the pressure of watervapor, and Pg is the pressure of dry air.
The amount of condensed water can be calculated using the following equation:
qcond = mg(d1 − d2) (2)
where d1 and d2 are humidity ratios corresponding to temperature T1 and T2, respectively.
Atmosphere 2019, 10, 734 7 of 15
3.2. Thermodynamic Calculation Model of the Heat Exchanger
3.2.1. Heat Transfer Coefficient of the Cold Side
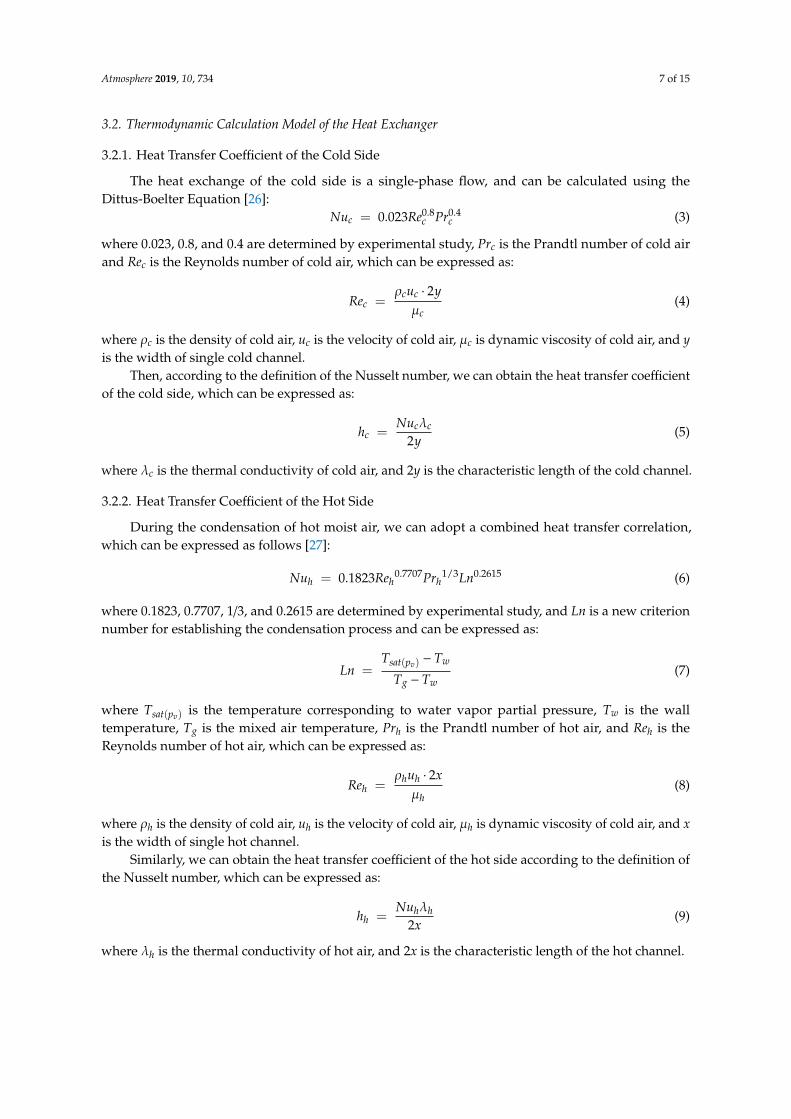
The heat exchange of the cold side is a single-phase flow, and can be calculated using theDittus-Boelter Equation [26]:
Nuc = 0.023Re0.8c Pr0.4
c (3)
where 0.023, 0.8, and 0.4 are determined by experimental study, Prc is the Prandtl number of cold airand Rec is the Reynolds number of cold air, which can be expressed as:
Rec =ρcuc · 2yµc
(4)
where ρc is the density of cold air, uc is the velocity of cold air, µc is dynamic viscosity of cold air, and yis the width of single cold channel.
Then, according to the definition of the Nusselt number, we can obtain the heat transfer coefficientof the cold side, which can be expressed as:
hc =Nucλc
2y(5)
where λc is the thermal conductivity of cold air, and 2y is the characteristic length of the cold channel.
3.2.2. Heat Transfer Coefficient of the Hot Side
During the condensation of hot moist air, we can adopt a combined heat transfer correlation,which can be expressed as follows [27]:
Nuh = 0.1823Reh0.7707Prh
1/3Ln0.2615 (6)
where 0.1823, 0.7707, 1/3, and 0.2615 are determined by experimental study, and Ln is a new criterionnumber for establishing the condensation process and can be expressed as:
Ln =Tsat(pv) − Tw
Tg − Tw(7)
where Tsat(pv) is the temperature corresponding to water vapor partial pressure, Tw is the walltemperature, Tg is the mixed air temperature, Prh is the Prandtl number of hot air, and Reh is theReynolds number of hot air, which can be expressed as:
Reh =ρhuh · 2xµh
(8)
where ρh is the density of cold air, uh is the velocity of cold air, µh is dynamic viscosity of cold air, and xis the width of single hot channel.
Similarly, we can obtain the heat transfer coefficient of the hot side according to the definition ofthe Nusselt number, which can be expressed as:
hh =Nuhλh
2x(9)
where λh is the thermal conductivity of hot air, and 2x is the characteristic length of the hot channel.

Atmosphere 2019, 10, 734 8 of 15
3.2.3. Overall Heat Transfer Calculation Equation
The heat quality during the overall heat transfer process can be determined using the followingequation:
Q = kA∆tm (10)
where ∆tm is the logarithmic mean temperature difference, A is the overall heat transfer area, and k isthe overall heat transfer coefficient, which can be expressed as:
k =1
1hh
+ δλw
+ 1hc
(11)
where hh and hc are the heat transfer coefficients of the hot and cold sides, respectively, δ is the wallthickness, and λw is the thermal conductivity of the wall. It should be pointed that the overall heattransfer coefficient does not consider the thermal resistance resulting from impurities present onboth sides of the heat exchanger wall, because in the process of heat transfer, condensed water iscontinuously formed and slides down to wash the heat exchange surface. Thus, it can be assumed thatthe exchange surface is relatively smooth and has no fouling resistance.
In the process of energy transfer, the total energy remains constant because of the energyconservation law. It can be expressed as:
Q = Qh = Qc (12)
Qh and Qc can be expressed as:Qh = mh(iA1 − iA0) (13)
andQc = mc(iW0 − iW′) (14)
3.3. Determination of the State Point and Plume Abatement Process
We first determined the state point, W0, in the enthalpy-humidity chart, which is the inlettemperature of the hot channel and can be expressed as:
TW0 = TA0 + (Tm − TA0)iW0 − iA0
i′′m − iA0
(15)
where TA0 is the temperature of ambient air, TW0 is the temperature of hot side air, Tm is the arithmeticmean of inlet and outlet water temperatures, iA0 is the enthalpy of ambient air, iW0 is the enthalpy ofhot side air, and i′′m is the enthalpy corresponding to the temperature Tm.
We next determined the state point, A1. Because there is no mass transfer between the two flows,the absolute humidity at the cold channel outlet equals to that at the cold channel inlet. Using theheat balance equation, we can also calculate the specific value of W′, which is hot moist air aftercondensation. Hot moist air mixes with the heated dry air directly, and therefore, the state point, M1,can be obtained as follows:
mhiW′ + mciA1 = miM1 (16)
andmhdW′ + mcdA1 = mdM1 (17)
where mh is the hot moist air mass flow rate, mc is the cold air mass flow rate, and m is the overall airmass flow rate.
In comparison to the original straight line A0–W0, we connected the new line through the twopoints A0 and M1. This significantly avoided generation of the plume above the cooling tower. If theline still passes the supersaturation region, the number of the heat exchanger unit, N, is increased or

Atmosphere 2019, 10, 734 9 of 15
decreased until the line does not pass this region. In this manner, the optimal number and dimensionsof the heat exchanger unit could be obtained.
4. Results and Analysis
Figure 7 shows the parameters of a typical meteorological year, including atmospheric pressure (P),relative humidity (RH), and dry bulb temperature (Td·b). The meteorological parameters of Zhengzhouwere obtained from the China standard weather database (CSWD).
Atmosphere 2019, 10, x FOR PEER REVIEW 9 of 15
line still passes the supersaturation region, the number of the heat exchanger unit, N, is increased or
decreased until the line does not pass this region. In this manner, the optimal number and dimensions
of the heat exchanger unit could be obtained.
4. Results and Analysis
Figure 7 shows the parameters of a typical meteorological year, including atmospheric pressure
( P ), relative humidity (RH ), and dry bulb temperature ( d bT ). The meteorological parameters of
Zhengzhou were obtained from the China standard weather database (CSWD).
Figure 7. Parameters of a typical meteorological year in Zhengzhou.
First, the meteorological parameters at 1.47 Cd bT (in January) were selected as the design
condition, owing to its low temperatures and considerably high RH, which is the primary cause of
plume generation. According to theoretical calculations, we could predict the optimal number and
dimensions of the heat exchanger unit. Subsequently, these dimension parameters were used to
predict the thermodynamic process in other typical months, as listed in Table 1.
Table 1. Specific meteorological parameters in several typical months.
Month 1 4 7 9 10 11 12
P (kPa) 101.38 100.15 99.06 100.12 100.66 101.08 101.68
RH (%) 57.05 54.88 77.78 74.71 74.06 76.76 51.52
Td∙b (°C) 1.47 15.28 26.99 21.61 15.28 7.49 2.85
4.1. Thermodynamic Calculation at Design Condition
Under design conditions, the heat exchange area served as the core of the design. The value of
thr heat exchange area could be determined using several other parameters, such as the amount of
condensed water ( condq ) and the cold air mass flow rate (
cm ).
We calculated the thermodynamic parameters of the heat exchanger unit. The inlet temperature
of the hot channel, W0, can be calculated using Equation (15). We assumed that the heat exchange
area was known, that is, assuming a different number of heat exchanger units, followed by solving
Equations (10)–(15), we could obtain all the inlet and outlet air parameters, such as enthalpy,
temperature, and humidity ratio. The amount of condensed water could be calculated using Equation
(1).
Figure 7. Parameters of a typical meteorological year in Zhengzhou.
First, the meteorological parameters at Td·b = 1.47 ◦C (in January) were selected as the designcondition, owing to its low temperatures and considerably high RH, which is the primary cause ofplume generation. According to theoretical calculations, we could predict the optimal number anddimensions of the heat exchanger unit. Subsequently, these dimension parameters were used to predictthe thermodynamic process in other typical months, as listed in Table 1.
Table 1. Specific meteorological parameters in several typical months.
Month 1 4 7 9 10 11 12
P (kPa) 101.38 100.15 99.06 100.12 100.66 101.08 101.68RH (%) 57.05 54.88 77.78 74.71 74.06 76.76 51.52Td·b (◦C) 1.47 15.28 26.99 21.61 15.28 7.49 2.85
4.1. Thermodynamic Calculation at Design Condition
Under design conditions, the heat exchange area served as the core of the design. The value ofthr heat exchange area could be determined using several other parameters, such as the amount ofcondensed water (qcond) and the cold air mass flow rate (mc).
We calculated the thermodynamic parameters of the heat exchanger unit. The inlet temperatureof the hot channel, W0, can be calculated using Equation (15). We assumed that the heat exchange areawas known, that is, assuming a different number of heat exchanger units, followed by solving Equations(10)–(15), we could obtain all the inlet and outlet air parameters, such as enthalpy, temperature, andhumidity ratio. The amount of condensed water could be calculated using Equation (1).
Atmosphere 2019, 10, 734 10 of 15
Specific operation parameters, including hot moist air mass flow rate, mh, hot moist air temperaturedifference, ∆T1, cold air mass flow rate, mc, cold air temperature difference, ∆T2, amount of condensedwater, qcond, and circulating water volume, G, are listed in Table 2.
Table 2. Operation parameters with different N values.
N ∆T1 (◦C) ∆T2 (◦C) mh (kg/s) mc (kg/s) m (kg/s) qcond (kg/s) G (m3/h)
4 2.71 12.50 176.07 226.16 402.23 0.91 20005 3.21 11.70 176.07 285.66 461.73 1.08 20006 3.61 11.30 176.07 331.49 507.56 1.21 20007 4.11 11.50 176.07 403.82 579.89 1.37 20008 4.51 10.00 176.07 462.75 638.82 1.49 2000
Table 2 shows certain operation parameters with different N values. Because cooling water volumeremains constant, the hot moist air mass flow rate is also constant. The hot moist air temperaturedifference increases as N increases, because the heat exchange area increases. Decrease in the coldair temperature difference is attributed not only to the increase in the heat exchange area, but alsoto the gradual increase in the opening of shutters. The amount of condensed water increases as hotmoist air temperature difference increases, because water vapor in the moist air reaches its limit atthis temperature and pressure. Therefore, with the decrease in temperature, water vapor condensesinto droplets.
4.2. Operation State Prediction
4.2.1. Influence of Different N
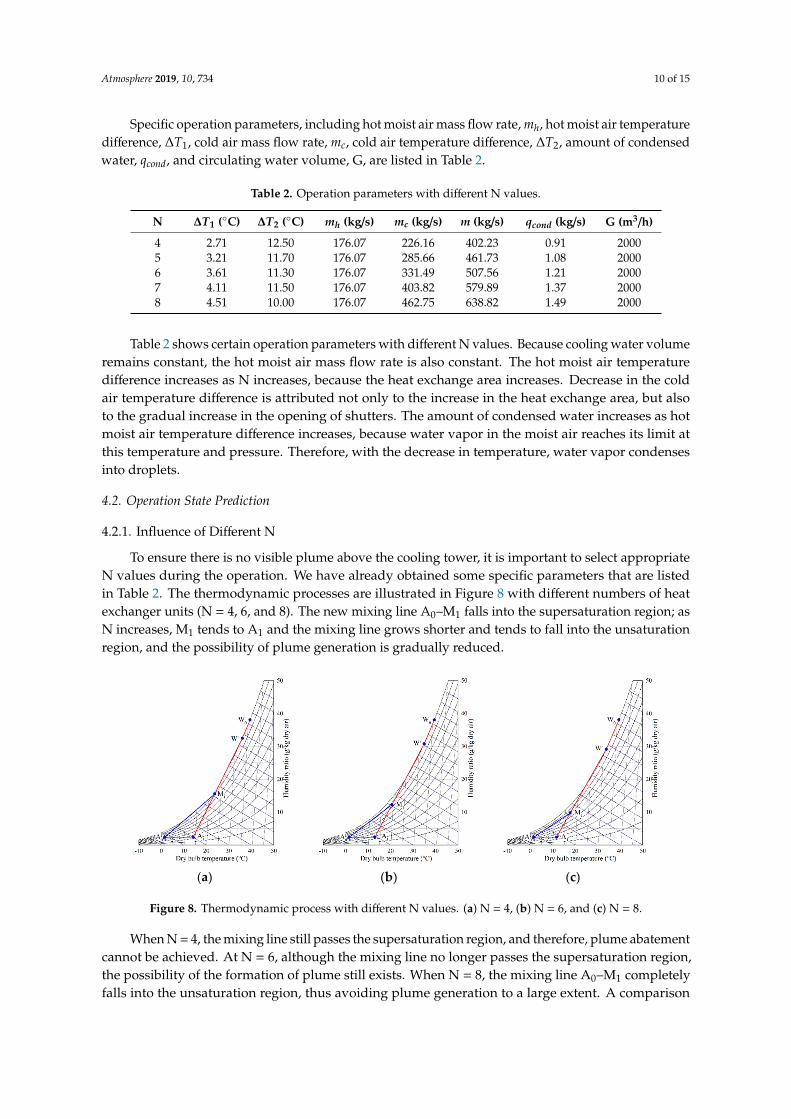
To ensure there is no visible plume above the cooling tower, it is important to select appropriateN values during the operation. We have already obtained some specific parameters that are listedin Table 2. The thermodynamic processes are illustrated in Figure 8 with different numbers of heatexchanger units (N = 4, 6, and 8). The new mixing line A0–M1 falls into the supersaturation region; asN increases, M1 tends to A1 and the mixing line grows shorter and tends to fall into the unsaturationregion, and the possibility of plume generation is gradually reduced.
Atmosphere 2019, 10, x FOR PEER REVIEW 10 of 15
Specific operation parameters, including hot moist air mass flow rate, hm , hot moist air
temperature difference, 1T , cold air mass flow rate,
cm , cold air temperature difference,
2T ,
amount of condensed water, condq , and circulating water volume, G, are listed in Table 2.
Table 2 shows certain operation parameters with different N values. Because cooling water
volume remains constant, the hot moist air mass flow rate is also constant. The hot moist air
temperature difference increases as N increases, because the heat exchange area increases. Decrease
in the cold air temperature difference is attributed not only to the increase in the heat exchange area,
but also to the gradual increase in the opening of shutters. The amount of condensed water increases
as hot moist air temperature difference increases, because water vapor in the moist air reaches its
limit at this temperature and pressure. Therefore, with the decrease in temperature, water vapor
condenses into droplets.
Table 2. Operation parameters with different N values.
N ∆T1 (°C) ∆T2 (°C) mh (kg/s) mc (kg/s) m (kg/s) qcond (kg/s) G (m3/h)
4 2.71 12.50 176.07 226.16 402.23 0.91 2000
5 3.21 11.70 176.07 285.66 461.73 1.08 2000
6 3.61 11.30 176.07 331.49 507.56 1.21 2000
7 4.11 11.50 176.07 403.82 579.89 1.37 2000
8 4.51 10.00 176.07 462.75 638.82 1.49 2000
4.2. Operation State Prediction
4.2.1. Influence of Different N
To ensure there is no visible plume above the cooling tower, it is important to select appropriate
N values during the operation. We have already obtained some specific parameters that are listed in
Table 2. The thermodynamic processes are illustrated in Figure 8 with different numbers of heat
exchanger units (N = 4, 6, and 8). The new mixing line A0–M1 falls into the supersaturation region; as
N increases, M1 tends to A1 and the mixing line grows shorter and tends to fall into the unsaturation
region, and the possibility of plume generation is gradually reduced.
(a)
(b)
(c)
Figure 8. Thermodynamic process with different N values. (a) N = 4, (b) N = 6, and (c) N = 8.
When N = 4, the mixing line still passes the supersaturation region, and therefore, plume
abatement cannot be achieved. At N = 6, although the mixing line no longer passes the
supersaturation region, the possibility of the formation of plume still exists. When N = 8, the mixing
line A0–M1 completely falls into the unsaturation region, thus avoiding plume generation to a large
extent. A comparison of thermodynamic processes of the above three graphs reveals that as N
increases, improved plume abatement is achieved.
Figure 8. Thermodynamic process with different N values. (a) N = 4, (b) N = 6, and (c) N = 8.
When N = 4, the mixing line still passes the supersaturation region, and therefore, plume abatementcannot be achieved. At N = 6, although the mixing line no longer passes the supersaturation region,the possibility of the formation of plume still exists. When N = 8, the mixing line A0–M1 completelyfalls into the unsaturation region, thus avoiding plume generation to a large extent. A comparison

Atmosphere 2019, 10, 734 11 of 15
of thermodynamic processes of the above three graphs reveals that as N increases, improved plumeabatement is achieved.
The relationship between N and qcond is shown in Figure 9; it can be seen that the amount ofcondensed water increases with the increase of N value, and they are almost in direct proportion.Therefore, taking into consideration the cost-effectiveness and safety of the operation, N = 8 isrecommended at Td·b = 1.47 ◦C, m = 638.82 kg/s, and qcond = 1.49 kg/s.
Atmosphere 2019, 10, x FOR PEER REVIEW 11 of 15
The relationship between N and condq is shown in Figure 9; it can be seen that the amount of
condensed water increases with the increase of N value, and they are almost in direct proportion.
Therefore, taking into consideration the cost‐effectiveness and safety of the operation, N = 8 is
recommended at 1.47 Cd bT , 638.82 kg/sm , and 1.49 kg/s
condq .
Figure 9. The amount of condensed water at different N values.
4.2.2. Influence of Different G
We have already discussed the thermodynamic process with different values of N, and the
results show that N = 8 is an optimal heat exchanger unit number. In this section, N is a constant
value (8), with varying values of circulating water volume (G) of 800, 1500, 2000, and 3000 m3/h. Table
3 shows certain operation parameters with different G values.
Table 3. Operation parameters with different G values.
G (m3/h) ΔT1 (°C) ΔT2 (°C) mh (kg/s) mc (kg/s) m (kg/s) qcond (kg/s) N
800 8.01 6.6 70.43 468.80 539.23 0.99 8
1500 5.41 9 132.05 456.15 588.20 1.32 8
2000 4.51 10 176.07 462.75 638.82 1.49 8
3000 3.31 11.6 264.10 445.32 709.42 1.67 8
With a gradual increase in the G values and keeping the cold air mass flow rate relatively stable,
we can conclude from Figure 10 that improved plume abatement is achieved when G is smaller;
however, when G = 3000 m3/h, there is a possibility of plume generation above the cooling tower.
The relationship between G and condq is shown in Figure 11; it can be observed that cond
q always
increases with increasing G. However, the rate of increases of condq slows as slower with G increases.
Therefore, to achieve the optimal effect of plume abatement and water conservation, N = 8 and G <
3000 m3/h are recommended.
Figure 9. The amount of condensed water at different N values.
4.2.2. Influence of Different G
We have already discussed the thermodynamic process with different values of N, and the resultsshow that N = 8 is an optimal heat exchanger unit number. In this section, N is a constant value (8),with varying values of circulating water volume (G) of 800, 1500, 2000, and 3000 m3/h. Table 3 showscertain operation parameters with different G values.
Table 3. Operation parameters with different G values.
G (m3/h) ∆T1 (◦C) ∆T2 (◦C) mh (kg/s) mc (kg/s) m (kg/s) qcond (kg/s) N
800 8.01 6.6 70.43 468.80 539.23 0.99 81500 5.41 9 132.05 456.15 588.20 1.32 82000 4.51 10 176.07 462.75 638.82 1.49 83000 3.31 11.6 264.10 445.32 709.42 1.67 8
With a gradual increase in the G values and keeping the cold air mass flow rate relatively stable,we can conclude from Figure 10 that improved plume abatement is achieved when G is smaller;however, when G = 3000 m3/h, there is a possibility of plume generation above the cooling tower.
The relationship between G and qcond is shown in Figure 11; it can be observed that qcond alwaysincreases with increasing G. However, the rate of increases of qcond slows as slower with G increases.Therefore, to achieve the optimal effect of plume abatement and water conservation, N = 8 and G <
3000 m3/h are recommended.

Atmosphere 2019, 10, 734 12 of 15Atmosphere 2019, 10, x FOR PEER REVIEW 12 of 15
(a)
(b)
(c)
(d)
Figure 10. Thermodynamic process with different G values at N = 8. (a) G = 800 m3/h. (b) G = 1500
m3/h. (c) G = 2000 m3/h. (d) G = 3000 m3/h.
Figure 10. Thermodynamic process with different G values at N = 8. (a) G = 800 m3/h. (b) G = 1500 m3/h.(c) G = 2000 m3/h. (d) G = 3000 m3/h.
Atmosphere 2019, 10, x FOR PEER REVIEW 13 of 15
Figure 11. The amount of condensed water at different G values.
4.3. Water Conservation Prediction
Compared with the traditional evaporative cooling tower, the cooling tower with a surface type
heat exchanger provides an obvious advantage of reducing the evaporation losses and conserving
water. Through the previous analysis, a large amount of condensed water could be saved at higher
values of N and G. With N = 8 and G = 2000 m3/h, condq can reach up to 1.49 kg/s. The specific cond
q
values under various conditions are listed in Table 4.
We estimated the amount of condensed water in several typical months. We found that water
savings could be increased significantly at lower temperatures and higher RH. We selected January,
April, July, and October as four seasons of the year, and the calculation results using certain specific
operation parameters are shown in Table 4. The average amount of condensed water was 1.105 kg/s.
Assuming that the cooling tower runs 7200 h per year, the annual water savings amount reached
2.8641 × 10⁷ kg.
Table 4. Specific operation parameters during typical months (N = 8, G = 2000 m3/h).
Month RH (%) Td·b (°C) mh (kg/s) mc (kg/s) m (kg/s) qcond (kg/s)
1 57.05 1.47 176.07 462.75 638.82 1.49
4 54.88 15.28 180.81 418.46 599.27 1.06
7 77.78 26.99 185.88 426.69 612.57 0.68
9 74.71 21.61 181.50 417.02 598.52 0.94
10 74.06 15.28 178.79 447.19 625.98 1.19
11 76.76 7.49 176.55 441.84 618.39 1.39
12 51.52 2.85 176.58 464.56 641.14 1.46
5. Conclusions
The present study proposed a novel coupling technology for water conservation and plume
abatement. Based on the analytical investigations presented in this study, the following preliminary
conclusions could be drawn:
(1) A novel coupling technology for water conservation and plume abatement was proposed.
The coupling technology combined the air parallel plume abatement technology with the
condensation water conservatiofin technology. The feasibility of this technology was verified by
thermodynamic analysis.
(2) A thermodynamic calculation model was established based on the designed surface type heat
exchanger and its structural dimensions. According to the theoretical calculation, the parameters of
each point in the thermodynamic process were determined. We found that compared with the
original straight line A0–W0, a new line A0–M1 could avoid the generation of plumes above the cooling
tower.
Figure 11. The amount of condensed water at different G values.

Atmosphere 2019, 10, 734 13 of 15
4.3. Water Conservation Prediction
Compared with the traditional evaporative cooling tower, the cooling tower with a surface typeheat exchanger provides an obvious advantage of reducing the evaporation losses and conservingwater. Through the previous analysis, a large amount of condensed water could be saved at highervalues of N and G. With N = 8 and G = 2000 m3/h, qcond can reach up to 1.49 kg/s. The specific qcondvalues under various conditions are listed in Table 4.
Table 4. Specific operation parameters during typical months (N = 8, G = 2000 m3/h).
Month RH (%) Td·b (◦C) mh (kg/s) mc (kg/s) m (kg/s) qcond (kg/s)
1 57.05 1.47 176.07 462.75 638.82 1.494 54.88 15.28 180.81 418.46 599.27 1.067 77.78 26.99 185.88 426.69 612.57 0.689 74.71 21.61 181.50 417.02 598.52 0.9410 74.06 15.28 178.79 447.19 625.98 1.1911 76.76 7.49 176.55 441.84 618.39 1.3912 51.52 2.85 176.58 464.56 641.14 1.46
We estimated the amount of condensed water in several typical months. We found that watersavings could be increased significantly at lower temperatures and higher RH. We selected January,April, July, and October as four seasons of the year, and the calculation results using certain specificoperation parameters are shown in Table 4. The average amount of condensed water was 1.105 kg/s.Assuming that the cooling tower runs 7200 h per year, the annual water savings amount reached 2.8641× 10⁷ kg.
5. Conclusions
The present study proposed a novel coupling technology for water conservation and plumeabatement. Based on the analytical investigations presented in this study, the following preliminaryconclusions could be drawn:
(1) A novel coupling technology for water conservation and plume abatement was proposed.The coupling technology combined the air parallel plume abatement technology with thecondensation water conservatiofin technology. The feasibility of this technology was verified bythermodynamic analysis.
(2) A thermodynamic calculation model was established based on the designed surface type heatexchanger and its structural dimensions. According to the theoretical calculation, the parameters ofeach point in the thermodynamic process were determined. We found that compared with the originalstraight line A0–W0, a new line A0–M1 could avoid the generation of plumes above the cooling tower.
(3) To ensure that no plume was formed above the cooling tower, we first studied the operationparameters under the influence of different N values. The results revealed that the possibility ofplume generation could be reduced by increasing the value of N. Taking into consideration both thecost-effectiveness and safety of the operation, N = 8 was recommended. Next, we studied the influenceof different G values for N = 8. The results revealed that the smaller the G value, the better the plumeabatement. However, G ≥ 3000 m3/h did not prove conducive for plume abatement; therefore, N = 8and G < 3000 m3/h were recommended parameters for the operation of the cooling tower.
(4) Finally, we estimated water savings using the condensation calculation model. At lowertemperatures and higher RH, water savings increased significantly, indicating that considerable watercould be saved during winters. The average amount of condensed water was 1.105 kg/s and theamount of annual water savings reached 2.8641 × 10⁷ kg.
Possible future research areas include using evaluation indexes and establishing a performanceevaluation system.

Atmosphere 2019, 10, 734 14 of 15
Author Contributions: Conceptualization, W.W., W.X. and X.G.; methodology, X.G. and H.Z.; formal analysis,X.G. and H.Z.; writing—Original draft preparation, X.G.; writing—Review and editing, W.W., S.Z., J.L. and G.Z.;supervision, W.W. and W.X.; project administration, W.W.; funding acquisition, W.X.
Funding: This research was funded by the Key Science and Technology Program of Henan Province of China (No.172102310747).
Acknowledgments: The authors would like to thank the Institute of Engineering Thermophysics of North ChinaUniversity of Water Resources and Electric Power.
Conflicts of Interest: The authors declare no conflicts of interest.
References
1. Nalik, B.K.; Muthukumar, P. A novel approach for performance assessment of mechanical draft wet coolingtowers. Appl. Therm. Eng. 2017, 121, 14–26.
2. Veldhuizen, H.; Ledbetter, J. Cooling Tower Fog: Control and Abatement. J. Air Pollut. Control Assoc. 1971,21, 21–24. [CrossRef]
3. Winter, A.R. Control of visible plumes from cooling tower. Proc. Inst. Mech. Eng. A J. Power Energy 1997, 211,67–72. [CrossRef]
4. Fisher, B.E.A. Predicting cooling tower plume dispersion. J. Air Pollut. Control Assoc. 1997, 211, 291–297.[CrossRef]
5. Corti, A.; Carnevale, E. Environmental impact from wet plumes in combined-cycle power plants. Appl.Therm. Eng. 1998, 18, 1049–1057. [CrossRef]
6. Li, S.; Moradi, A.; Vickers, B.; Flynn, M.R. Cooling tower plume abatement using a coaxial plume structure.Int. J. Heat Mass Transf. 2018, 120, 178–193. [CrossRef]
7. Tyagi, S.K.; Wang, S.; Ma, Z. Prediction, potential and control of plume from wet cooling tower of commercialbuildings in Hong Kong: A case study. Int. J. Energy Res. 2007, 31, 778–795. [CrossRef]
8. Xu, X.; Wang, S.; Ma, Z. Evaluation of plume potential and plume abatement of evaporative cooling towersin a subtropical region. Appl. Therm. Eng. 2008, 28, 1471–1484. [CrossRef]
9. Hu, H.; Jiang, Y.; Guo, C.; Li, Z. Thermodynamic coupling characteristics in hybrid (dry/wet) cooling system.Int. J. Green Energy 2018, 15, 532–543. [CrossRef]
10. Wang, J.; Wang, S.; Xu, X.; Xiao, F. Evaluation of alternative arrangements of a heat pump system for plumeabatement in a large-scale chiller plant in a subtropical region. Energy Build. 2009, 41, 596–606. [CrossRef]
11. Tyagi, S.K.; Wang, S.; Park, S.R.; Sharma, A. Economic considerations and cost comparisons between theheat pumps and solar collectors for the application of plume control from wet cooling towers of commercialbuildings. Renew. Sustain. Energy Rev. 2008, 12, 2194–2210. [CrossRef]
12. Pashchenko, D. ANSYS Fluent CFD Modeling of Solar Air-Heater Thermoaerodynamics. Appl. Sol. Energy2018, 54, 32–39. [CrossRef]
13. Wang, W.; Liao, Y.; Liu, J.; Huang, Z.; Tian, M. Numerical Simulation and Optimization of Staged Combustionand NOx Release Characteristics in Precalciner. J. Therm. Sci. 2019, 28, 1024–1034. [CrossRef]
14. Meroney, R.N. CFD prediction of cooling tower drift. J. Wind Eng. Ind. Aerodyn. 2006, 94, 463–490. [CrossRef]15. Kazutaka, T.; Takenobu, M.; Ryoichi, K. Prediction of a Visible Plume from a Dry and Wet Combined Cooling
Tower and Its Mechanism of Abatement. Atmosphere 2016, 7, 59.16. Ding, F.; Xing, K.; Li, S.; Bai, J. Sensitivity Analysis of Plume Rising Height from Cooling Tower. Procedia
Environ. Sci. 2010, 2, 1374–1379.17. Michioka, T.; Sato, A.; Kanzaki, T.; Sada, K. Wind tunnel experiment for predicting a visible plume region
from a wet cooling tower. J. Wind Eng. Ind. Aerodyn. 2007, 95, 741–754. [CrossRef]18. Guo, D.; Yao, R.; Fan, D. Wind Tunnel Experiment for Predicting a Visible Plume Region from a Nuclear
Power Plant Cooling Tower. J. Appl. Meteorol. Climatol. 2014, 53, 234–241. [CrossRef]19. Lee, G.; Ra, H.; Lee, B.; Lee, Y.; Roh, C.W.; Baik, Y.; Cho, J.; Shin, H. Preliminary study on the effect of dry/wet
cooling combinations for the sustainable management of water of cooling tower. Int. J. Low Carbon Technol.2018, 13, 61–66. [CrossRef]
20. Dehaghani, S.T.; Ahmadikia, H. Retrofit of a wet cooling tower in order to reduce water and fan powerconsumption using a wet/dry approach. Appl. Therm. Eng. 2017, 125, 1002–1014. [CrossRef]
Atmosphere 2019, 10, 734 15 of 15
21. Rezaei, E.; Shafiei, S.; Abdollahnezhad, A. Reducing water consumption of an industrial plant cooling unitusing hybrid cooling tower. Energy Convers. Manag. 2010, 51, 311–319. [CrossRef]
22. Askari, S.; Lotfi, R.; Seifkordi, A.; Rashidi, A.M.; Koolivand, H. A novel approach for energy and waterconservation in wet cooling towers by using MWNTs and nanoporous graphene nanofluids. Energy Convers.Manag. 2016, 109, 10–18. [CrossRef]
23. Chang, T.; Lin, T. Water and energy conservation for a counterflow cooling tower using UV light disinfectionand variable speed fan. Proc. Inst. Mech. Eng. E J. Process Mech. Eng. 2016, 230, 235–243. [CrossRef]
24. Mantelli, M.H.B. Development of porous media thermosyphon technology for vapor recovering incross-current cooling towers. Appl. Therm. Eng. 2016, 108, 398–413. [CrossRef]
25. Dezinai, M.; Rahmani, K.; Mirrezaei Roudaki, S.J.; Kordloo, M. Feasibility study for reduce water evaporativeloss in a power plant cooling tower by using air to Air heat exchanger with auxiliary Fan. Desalination 2017,406, 119–124. [CrossRef]
26. Dittus, F.W.; Boelter, L.M.K. Heat transfer in automobile radiators of the tubular type. Int. Commun. HeatMass Transf. 1985, 12, 3–22. [CrossRef]
27. Da, Y.; Che, D.; Zhuang, Z.; Liu, W.; Fang, S. An Experimental Study on Forced Convection-condensationHeat Transfer of the Flue Gas with High Moisture. Ind. Biol. 2003, 19, 12–15. (In Chinese)
© 2019 by the authors. Licensee MDPI, Basel, Switzerland. This article is an open accessarticle distributed under the terms and conditions of the Creative Commons Attribution(CC BY) license (http://creativecommons.org/licenses/by/4.0/).
Copyright © 2022 FDOKUMEN