Filament formation and evolution in buoyant coastal waters: Observation and modelling
43
1 Manuscript submitted to Progress in Oceanography Click here to view linked References 1 Filament formation and evolution in buoyant coastal waters: observation and 2 modelling 3 4 Ilaria Iermano 1* , Giovanni Liguori 2 , Daniele Iudicone 1 , Bruno Buongiorno Nardelli 3,4 , Simone 5 Colella 3 , Adriana Zingone 1 , Vincenzo Saggiomo 1 and Maurizio Ribera d‟Alcalà 1 6 7 1 Stazione Zoologica Anton Dohrn, Villa Comunale 80121 Napoli, Italia 8 2 Departamento de Física, Universidad de Alcalà 28871 Alcalà de Henares, Madrid, España 9 3 Istituto di Scienze dell‟Atmosfera e del Clima (ISAC-CNR), Via Fosso del Cavaliere, 100 - 00133 Roma, Italia 10 4 Istituto per l‟Ambiente Marino Costiero (IAMC-CNR), Calata Porta di Massa 80133 Napoli, Italia 11 12 *Corresponding author. Present address: Dipartimento di Scienze per l‟Ambiente (DiSAm), Università “Parthenope”, 13 Centro Direzionale - Isola C4, 80143, Napoli, Italia. Tel: +39 0815476575; fax: +39 0815476515. 14 E-mail address: [email protected] (I. Iermano). 15 16 ABSTRACT 17 This paper presents a detailed analysis of the formation and subsequent evolution of filament- 18 like structures observed in a relatively small area of the mid-Tyrrhenian Sea (Mediterranean Sea). 19 The filament dynamics and potential impact on the cross-shelf exchange budget are investigated 20 based on a combined use of remote sensing imagery, in-situ data and numerical modelling. 21 The complexity of these phenomena is shown by focusing on four distinct events that led to 22 cross-shelf transport, each representative of a different dynamic process and a distinct expected 23 impact on the coastal area. A systematic analysis of available observations for the years 1998-2006 24 underlines the role of the interplay of atmospheric freshwater fluxes, river loads and wind stress 25 variations, which may create favourable conditions for the convergence of shelf waters (particularly 26 at coastal capes) and the subsequent formation of short-lived filaments along the coast. 27 The response of the buoyant coastal waters to periods of wind reversal and fluctuating freshwater 28 discharge rates is examined through idealised Regional Ocean Modeling System (ROMS) 29 simulations. The filaments observed in remote sensing imagery were well reproduced by the 30 numerical exercise, where the filaments appear as organised sub-mesoscale structures that possess 31 high relative vorticity and develop at the river mouths or adjacent capes. In both scenarios, the 32 filaments appear largely determined by i) the presence of a buoyancy anomaly, ii) the angle 33 between the wind pulse direction and the coast and iii) irregularities in the coastal profile. 34 The ensemble of results suggests that the occurrence of such transient, intense structures may 35 contribute considerably to the biological variability and cross-shelf exchange in coastal areas with 36 similar traits. 37 38 Keywords: River plume; Filaments; Submesoscale structures; Coastal oceanography; Remote sensing; 39 Numerical modelling; Tyrrhenian Sea 40 41 1. Introduction 42 Coastal filaments are short-lived dynamical structures characterised by biogeochemical and 43 physical properties that may significantly differ from the surrounding offshore waters. The 44 filaments have the shape of elongated shelf-rooted tongues and are generally governed by 45 submesoscale, non-linear dynamics. Filaments can affect the ocean-shelf exchange, water-mass
-
Upload
independent -
Category
Documents
-
view
1 -
download
0
Transcript of Filament formation and evolution in buoyant coastal waters: Observation and modelling

1""
Manuscript submitted to Progress in Oceanography Click here to view linked References
"""
1 Filament formation and evolution in buoyant coastal waters: observation and 2 modelling 3"4 Ilaria Iermano1*, Giovanni Liguori2, Daniele Iudicone1, Bruno Buongiorno Nardelli3,4, Simone 5 Colella3, Adriana Zingone1, Vincenzo Saggiomo1 and Maurizio Ribera d‟Alcalà1
6"7 1Stazione Zoologica Anton Dohrn, Villa Comunale 80121 Napoli, Italia 8 2Departamento de Física, Universidad de Alcalà 28871 Alcalà de Henares, Madrid, España 9 3Istituto di Scienze dell‟Atmosfera e del Clima (ISAC-CNR), Via Fosso del Cavaliere, 100 - 00133 Roma, Italia
10 4Istituto per l‟Ambiente Marino Costiero (IAMC-CNR), Calata Porta di Massa 80133 Napoli, Italia 11"12 *Corresponding author. Present address: Dipartimento di Scienze per l‟Ambiente (DiSAm), Università “Parthenope”, 13 Centro Direzionale - Isola C4, 80143, Napoli, Italia. Tel: +39 0815476575; fax: +39 0815476515. 14 E-mail address: [email protected] (I. Iermano). 15"16 ABSTRACT 17 This paper presents a detailed analysis of the formation and subsequent evolution of filament- 18 like structures observed in a relatively small area of the mid-Tyrrhenian Sea (Mediterranean Sea). 19 The filament dynamics and potential impact on the cross-shelf exchange budget are investigated 20 based on a combined use of remote sensing imagery, in-situ data and numerical modelling. 21 The complexity of these phenomena is shown by focusing on four distinct events that led to 22 cross-shelf transport, each representative of a different dynamic process and a distinct expected 23 impact on the coastal area. A systematic analysis of available observations for the years 1998-2006 24 underlines the role of the interplay of atmospheric freshwater fluxes, river loads and wind stress 25 variations, which may create favourable conditions for the convergence of shelf waters (particularly 26 at coastal capes) and the subsequent formation of short-lived filaments along the coast. 27 The response of the buoyant coastal waters to periods of wind reversal and fluctuating freshwater 28 discharge rates is examined through idealised Regional Ocean Modeling System (ROMS) 29 simulations. The filaments observed in remote sensing imagery were well reproduced by the 30 numerical exercise, where the filaments appear as organised sub-mesoscale structures that possess 31 high relative vorticity and develop at the river mouths or adjacent capes. In both scenarios, the 32 filaments appear largely determined by i) the presence of a buoyancy anomaly, ii) the angle 33 between the wind pulse direction and the coast and iii) irregularities in the coastal profile. 34 The ensemble of results suggests that the occurrence of such transient, intense structures may 35 contribute considerably to the biological variability and cross-shelf exchange in coastal areas with 36 similar traits. 37"38 Keywords: River plume; Filaments; Submesoscale structures; Coastal oceanography; Remote sensing; 39 Numerical modelling; Tyrrhenian Sea 40"41 1. Introduction
"42 Coastal filaments are short-lived dynamical structures characterised by biogeochemical and 43 physical properties that may significantly differ from the surrounding offshore waters. The 44 filaments have the shape of elongated shelf-rooted tongues and are generally governed by 45 submesoscale, non-linear dynamics. Filaments can affect the ocean-shelf exchange, water-mass
2""
46 structure and circulation at the continental shelf edge (Huthnance, 1995). By moving the near-shore 47 eutrophic waters into the (often) oligotrophic offshore waters, filaments can play an important role 48 in modulating the near-shore and open-ocean ecosystems. 49 In the past two decades, several studies have aimed at characterising and explaining filament 50 structures. The studies are based on different methods, including remote sensing data analysis 51 coupled with field observations (Dewey, 1991; Haynes, 1993; Moore and Murdoch, 1993; Borzelli 52 et al., 1999; Trasviña et al., 2003; Barton et al., 2004; Bignami et al., 2008; Burrage et al., 2009) or 53 laboratory experiments and realistic or simplified numerical modelling (Haidvogel et al., 1991; 54 Garcia Berdeal et al., 2002; Choi and Wilkin, 2007; Xia et al., 2007; Peliz et al., 2009). These 55 studies have shown that several mechanisms may lead to the generation of filaments: instabilities at 56 upwelling fronts (Flament et al., 1985; Wang et al., 1988; Washburn and Armi, 1988), interactions 57 between coastal currents and uneven bottom topography or coastline (Narimousa and Maxworthy, 58 1987; Castelao and Barth, 2006), and vorticity transfer between the wind field and the sea, 59 particularly in the presence of complex or steep gradients in the coastal orography (Crépon and 60 Richez, 1982; Send, 1989; Salusti, 1998). The latter process is sometimes coupled with buoyancy 61 anomalies that result from, e.g., an intense river runoff. 62 Most studies have examined filament jets associated with coastal upwelling (Brink, 1983; 63 Shillington et al., 1990; Lutjeharms et al., 1991; Chao and Shaw, 2002; Yankosky, 2003, Lentz 64 2004). Filaments produced by freshwater shelf anomalies, e.g., associated with river runoffs, have 65 received less attention and rarely been the object of systematic observational studies. Nonetheless, 66 these transient coastal features are common and may play an important role in the dispersal of 67 suspended and dissolved material of terrigenous origin and in nutrient fluxes and sediment loads, 68 thus having a significant impact on coastal ecosystems and water quality. One reason for the scarce 69 attention paid to these filaments is that the filaments are difficult to observe. The filaments are 70 much smaller than comparable upwelling-related structures and therefore tend to vanish in a few 71 days. Furthermore, filaments originating from river runoff do not necessarily have a clear signature 72 in the sea surface temperature (SST) field and are not traceable in altimetry, at least with current 73 technology. However, the filaments can be identified and characterised with remotely sensed ocean- 74 colour data because of significant pigment concentrations and dissolved and particulate organic 75 matter. 76 Regarding their dynamics, filaments associated with river or estuary runoff are one potential 77 outcome of river plumes, particularly in the presence of wind forcing or coastal irregularities (Chao, 78 1988a; Kourafalou et al., 1996a,b; Xing and Davies, 1999; Xia et al., 2010). Runoff water can form 79 a freshwater prominence at the mouth of an estuary, which can grow without reaching a steady state 80 until an external forcing agent, such as a wind burst or an along-shelf current, transports the fresh 81 water away and disperses the buoyant plume offshore. In certain cases, the interplay between the 82 anomalous circulation under strong wind or wind with a high rotational component, off-shore 83 mesoscale features, and the buoyancy increase that results from an impulsive freshwater flow can 84 create a strong convergence of shelf waters and the subsequent formation of jets or filament-like 85 structures (Whitney and Garvine, 2005; Choi and Wilkin, 2007). This convergence can be favoured 86 by the presence of prominent coastal points, such as capes, headlands and islands (Fong and Geyer, 87 2002; Doglioli et al., 2004; Burrage et al., 2009; De Gaetano et al., 2010). Therefore, the dynamics 88 of these ephemeral features is potentially complex, and there are almost no dynamic studies that 89 consider the ensemble of the above-mentioned processes.
3""
90"91"92"93"94"95"96"97"98"99"
100"101"102"103"104"105"106"107"108"109"110"111"112"113"114"115"116"117"118"
This paper presents a systematic, detailed analysis of the formation and evolution of the filaments that occur off the southeastern coast of the Tyrrhenian Sea (Mediterranean Sea), an area that includes well-known touristic destinations such as the Capri and the Amalfi coast. Such structures (Fig. 1) have never been described in this area despite being important and frequent, as the present investigation demonstrates. Elsewhere in the Mediterranean Sea, non-upwelling filaments have been rarely addressed, despite the potential importance of the filaments to the offshore transport of nutrient and plankton biomass in this prevalently oligotrophic sea.
The characteristics (size, time scales, seasonality) of the filaments were based on the analysis of daily high-resolution satellite images obtained from the Sea-viewing Wide Field-of-view Sensor (SeaWiFS) in the period 1997–2006. These structures appear unrelated to upwelling phenomena, have short time scales, and are related to river runoff and the complicated coastal geometry. Therefore, the dynamic origin of the filaments was investigated by analysing the time series of atmospheric freshwater fluxes, river discharge and wind intensity in addition to the synoptic evolution of the atmospheric pressure associated with each filament event. When available, in-situ measurements were also used in the analysis. Additionally, the data analysis was integrated with a series of idealised numerical experiments aimed at a better understanding of the three-dimensional structure and physical nature of these coastal filaments. To this end, an ad-hoc configuration of the three-dimensional numerical model (Regional Ocean Modeling System, ROMS) was implemented for the area, and a sensitivity study was performed using simplified forcing scenarios. Specifically, our study addressed the response of the shelf freshwater excess to the passage of single weather perturbations and rainfall events in the presence of a realistic coastline.
The paper is organised as follows. Section 2 provides a short description of the study area. Section 3 presents an analysis of a few selected filament events, with the subsection 3.2 summarising statistics on filament occurrence in the study area (Fig. 2). Section 4 presents the characteristics of the circulation model and the idealised experiments that describe the filament development. In sections 5 and 6, the results are discussed and the major conclusions are summarised. Details on the datasets used are presented in the Appendix.
""
2. The study area "
"119"120"121"122"123"124"125"126"127"128"129"130"131"132"
The Tyrrhenian Sea is the deepest major basin in the western Mediterranean Sea (Astraldi, M., and G. P. Gasparini, 1994). The Tyrrhenian Sea is characterised by a complex bathymetry and connected to the other Mediterranean sub-basins through the Corsica channel to the north (approximately 80 km wide) and through the Sardinia channel to the south. The general circulation in the Tyrrhenian Sea has long been known to be organised into a series of gyres. The most important of these gyres appears to be a cyclonic gyre east of the Mouths of Bonifacio (the Corsica- Sardinia Strait). The Tyrrhenian Sea is overall cyclonic with surface water of Atlantic origin (AW) entering off the northern Sicilian coast and establishing a northward current along the western Italian coasts (Krivosheya and Ovchinnikov, 1973; Millot, 1987; Artale et al., 1994; Pierini and Simioli, 1998). However, recent studies by Poulain and Zambianchi (2007) and by Rinaldi et al. (2010) based on the analysis of Lagrangian and altimetric data have revealed a series of variable mesoscale/sub-basin structures, which are either transient or semi-permanent and whose importance largely overcomes the mean flow, particularly in the southern portion of the basin and along the basin‟s southern coasts.
174"
4"
"
133"134"135"136"137"138"139"140"141"142"143"144"145"146"147"148"149"150"151"152"153"154"155"156"157"158"159"160"
161"162"
Our analysis focuses on the area between the Gulf of Gaeta and Capri (Fig. 2), which is comprised of a large continental shelf interrupted by Ischia and the Gulf of Naples (GoN). The GoN is a small semi-closed basin opening onto the Tyrrhenian Sea, which is delimited by the Sorrento Peninsula and Capri to the south and Capo Miseno and the islands of Procida and Ischia to the north (De Maio et al., 1973, 1979; Moretti et al., 1977; Carrada et al., 1980). The GoN coasts are of particular interest from an environmental standpoint because of the peculiar ecosystem properties in the area and because the coasts sustain important touristic and commercial activities. The large population (approximately 4 million inhabitants) and intense industrial and agricultural activities particularly in Naples and the city‟s surroundings contribute significant urban loads and polluted freshwater runoff, which seriously impact the marine environment and the related tourism-based economy. Therefore, understanding the processes that drive the coast-offshore transport is of primary importance with regard to the sustainable exploitation of the environmental resources and the monitoring of the water quality in this region.
The circulation inside the GoN and in the entire region is related to the circulation of the southern and mid-Tyrrhenian Sea. However, the GoN‟s circulation is also strongly affected by a local forcing factor: the wind stress, which produces currents up to one order of magnitude larger than the mean basin circulation (Moretti et al., 1977). The wind field can be schematised as blowing mainly from the NE and SW quadrants in winter and summer, respectively. During spring and autumn, the principal directions are the NE-SW axes (Menna et al., 2007).
The two major rivers of the study area are the Garigliano and Volturno (Fig. 2). The Volturno is the longest river in southern Italy (175 km) and discharge (an estimated mean discharge of 40 m³ s-
1) and has a 5,550 km² catchment basin. Slightly to the north, the Garigliano (40 km in length) is formed by the confluence of the Gari and Liri rivers and is characterised by a catchment basin of almost 5,000 km² with an estimated mean discharge of 120 m³ s-1. This study will address the role played by wind stress and anomalous freshwater runoff in the formation and evolution of the filaments that originate on the shelf, which transport nutrient-rich, polluted waters directly offshore or into the GoN. In particular, our analyses will focus on the role played by the Volturno and Garigliano rivers in the coastal dynamics in the area.
""
3. Remote sensing and field observations "
"163"164"165"166"167"168"169"170"171"172"173"
Four specific events that lead to cross-shelf transport have been selected for description in this section. The mechanisms that underlie the origin and dynamics of these structures are discussed in section 5. The four events occurred in late spring 2002, summer 2004, June 2000 and June 2001, respectively, and were selected because almost continuous clear-sky conditions facilitated the tracking of surface waters using ocean-colour satellite data and because meteorological and in-situ data were available for those dates. In addition, these events are representative of the dynamic history and different expected impacts on the coastal area.
The satellite images of the diffuse light attenuation coefficient at 490 nm (K490) were analysed to describe the evolution of the surface field during the four events. Atmospheric freshwater fluxes, wind, river discharge data (for the Garigliano and Volturno rivers), synoptic maps of the mean surface atmospheric pressure and in-situ data were used to complete the description of the events.

5""
175" 3.1 The selected events "176"177"178"179"180"181"182"183"184"185"186"187"188"189"190"191"192"193"194"195"196"197"198"199"200"201"202"203"204"205"206"207"208"209"210"211"212"213"214"215"216"217"
The first hydrographical and satellite observations, which cover the period May 5-21 2002, display a filament unrelated to coastal upwelling, which developed from the Volturno estuary and resulted in a direct cross-shelf transport of coastal waters toward the open Tyrrhenian Sea (Figs. 3- 5).
Intense atmospheric freshwater fluxes, which were observed on May 7 and 8 (Fig. 3c) and which were associated with the passage of a low-pressure system from North Africa (Fig. 4), determined a significant and rapid increase in the river discharge. The runoff occurred as an impulse with a high initial velocity, which increased from an average of 10 and 40 m3 s-1 on May 7 to 20 and 55 m3 s-1
on May 9 at the Volturno and Garigliano river mouths, respectively (Fig. 3d). On May 12, the atmospheric low pressure moved northeast, and a rapid increase of surface
pressure was recorded with northwesterly winds reaching up to 8 m s-1 and decreasing in the following days (Fig. 3b). The Volturno river plume seemed to react quasi-instantaneously to these more intense winds. Unfortunately, a clear image for May 12 is not available. However, a filament- like structure was observed on May 13 as a thin jet that extended offshore from the Volturno river mouth (Fig. 5). This jet-like filament lasted a few days and had an alongshore length of approximately 5-10 km and extended approximately 50 km offshore, nearly reaching the island of Ventotene (May 21, Fig. 5). In its fully developed phase, the filament remained essentially unchanged over three days, whereas the filament‟s decay or disappearance started on May 16 and lead to a gradual decrease in K490 in the next days until the filament‟s complete disappearance after May 21.
The second selected event developed over three weeks in June 2004 (Figs. 6, 7). Starting on June 7, the SeaWiFS imagery shows an accumulation of turbid water along the coast from the Volturno‟s mouth offshore. The accumulation was followed by the growth of a non-upwelling cross-shelf plume in a form of a large mushroom-like structure, which was pushed off the shelf area and finally divided into two distinct filaments. Most likely, the origin of this structure was also associated with the intense atmospheric freshwater fluxes that occurred in the first 5 days of June (Fig. 6c), which determined a significant increase in the river discharge, from an average of 30 m3 s-
1 (the Volturno) and 75 m3 s-1 (the Garigliano) in the first three days of June to 180 m3 s-1 and 100 m3 s-1, respectively, on 7 June (Fig. 6d).
Between 7 and 9 June, the water that was discharged from the two rivers was rapidly pushed offshore, reaching a length of about 0-60 km and also a width of about 50-60 km. During these days, a relatively weak northwesterly wind was recorded (Fig. 6b). Between June 10th and 15th, these waters remained confined to the shelf area along the northern Ischia coast, possibly entering the GoN through the Procida Channel. The atmospheric conditions remained relatively stable until June 17, when low pressure that originated in North Africa started to move toward the Italian peninsula (not shown).
On June 17, a strong wind started to blow from the northeast, which was associated with the passage of a low-pressure system (Fig. 6a). The wind intensity remained up to 8 m s-1 for the next two days. On June 18, the wind direction reverted from NE to NW (Fig. 6b), while highly turbid water was moving south and extending offshore (Fig. 7).
Four days later, on June 22, the higher K490 waters were found more than 40 km offshore, southwest of Ischia (Fig. 7). The anomalous water was arranged as a large mushroom-like dipole

259"
6"
"
218"219"220"221"222"223"224"225"226"227"228"229"230"231"232"233"234"235"236"237"238"239"240"241"242"243"244"245"246"247"248"249"250"251"252"253"254"255"256"
257"258"
and oriented NW-SE. However, once pushed outside the shelf area, the turbid water was rapidly transported offshore, possibly because of the interaction with the larger sub-basin scale surface circulation. On June 30, two completely separated filaments were detected (Fig. 7). One filament stretched offshore southwest for approximately 130 km. The other filament extended south along the coast for approximately 100 km.
Distinct growth and evolution characterised the filament that was observed from 17 to 22 June 2000, which warranted description and analysis despite the lack of available river discharge data for that period.
In conjunction with the passage of a low-pressure system from North Africa (not shown), high values of atmospheric freshwater fluxes (>20 mm) were recorded on June 17 (Fig. 8c), which determined a significant and rapid increase in the quantity of turbid water, as is visible in the K490 image of June 17. On the 18th, a rapid increase of surface pressure was recorded (Fig. 8a), with northeasterly winds higher than 8 m s-1 (Fig. 8b) followed by weaker winds in the subsequent days.
The satellite observations for June 18 show a jet-like filament forming outside the Volturno river mouth with an alongshore length of approximately 5-10 km. This filament extended approximately 20-30 km offshore into the Tyrrhenian Sea (Fig. 9). In the next days, following the rapid decrease in the wind strength, the filament evolved into a typical mushroom-like structure, which is a highly non-linear, fast dynamical feature also known as a dipole eddy (Ikeda and Emery, 1984; Ikeda et al., 1984). Interestingly, such mushrooms can emerge as consistent structures out of a turbulent quasi- 2D flow as a direct consequence of an inverse energy cascade, as observed in the laboratory experiment by van Heijst and Flór (1989). Here, the coastal water, which was stirred offshore by the wind, could have acted as the igniter of the inverse cascade. This mushroom quickly extended offshore as far as Ventotene (Fig. 9), reaching a width of approximately 40 km. The mushroom remained essentially unchanged in the mushroom‟s fully developed phase over three days and disappeared almost completely on June 22 (Fig. 9).
The fourth analysed event (21–30 June 2001) started as an accumulation along the Ischia coasts and evolved as an eddy upon reaching the open sea. The event was associated with the passage of a low-pressure system from North Africa (not shown) and corresponded to a significant and rapid increase in the Garigliano river discharge, which increased from an average of 30 m3 s-1 up to 48 m3
s-1, whereas the Volturno river discharge remained almost unchanged (Fig. 10d). Additionally, on June 18, a rapid increase of surface pressure was recorded (Fig. 10a), with westerly winds higher than 10 m s-1. After June 18, substantially weaker winds were observed.
Unfortunately, no clear-sky satellite observations are available for June 18–20. However, the June 21 K490 image shows an elongated plume that originates from the shelf area next to Ischia and extends approximately 50 km offshore into the Tyrrhenian Sea (Fig. 11). The filament continued to spread offshore, showing a slight rotation at its edge , after evolving into a highly extended cyclonic eddy off Ischia. This event can be considered to be a typical example of a dynamical structure possibly generated or influenced by the presence of an island or a cape. After three days (June 24), the filament began to disappear, although rather slowly, losing coherence on June 30 (Fig. 11).
""3.2 Filament occurrence statistics

7""
260"261"262"263"264"265"266"267"268"269"270"271"272"273"274"275"276"277"278"279"280"281"282"283"284"285"286"287"288"289"290"291"292"293"294"295"296"297"298"299"300"301"302"303"
To evaluate the overall potential impact of cross-shelf filaments on the circulation and the cross- shelf exchange in the region, the statistics related to the occurrence of the filaments were computed. Different objective methods for the detection of filaments have been proposed in the literature (e.g., Nieto et al. 2012 and references therein). However, given the high level of noise and the intense cloud coverage in the satellite images considered here, the approach chosen consisted in the expert identification of the presence or absence of filaments in the individual satellite images. To this end, all images with either missing or flagged data or high cloud cover were first discarded. Thus, more than 60% of the data were classified as “bad” because the data exhibited high cloud cover despite the relatively dry nature of the Mediterranean Sea region. The bad data percentage ranges from 70- 80% in winter to less than 40% in July. The “good” images were classified into those showing filament-like structures (60%) and those not showing filaments (40%). This image classification enabled an initial quantification of the seasonal and inter-annual variability of the cross-shelf exchange events (Fig. 12).
A complex intra-annual pattern was identified in the distribution of the filament events, with the majority of the cases occurring during spring and early summer, from April to July. A secondary peak was found in October, whereas the absolute minimum was observed in August (Fig. 12). An empirical orthogonal function analysis of the monthly anomalies (with respect to the corresponding annual averages) showed that more than 63% of the filament occurrence variance in this region is associated with these two peaks. Correspondingly, two main signals were revealed by an autocorrelation analysis (with values significant within a 2 confidence level, estimated through a bootstrapping procedure, as in Buongiorno Nardelli, 2012) and a spectral analysis: a semi-annual signal and a 9-month signal.
This main pattern apparently does not match the patterns of atmospheric freshwater forcing and river discharge. Intense atmospheric freshwater fluxes are concentrated in fall and winter, with a maximum in November, whereas the river discharge maxima are found from January to March (Fig. 12). The delay between atmospheric freshwater fluxes and river discharge is clearly related to the large river basins, almost reaching the base of the Apennines, whereas the mismatch between the filament occurrence and the river discharge must be ascribed to the seasonal mixed layer variations and complex submesoscale dynamics in the region. Data from a large dataset (approximately 30 years) for a fixed site over a 75 m depth in the Gulf of Naples (the Long Term Ecological Research Station MareChiara) (LTER-MC) (Ribera et al. 2004; Zingone et al., 2010) show a deep mixed layer (50−70 m) from November through March, the latter being the month of the re-stratification of the water column (Fig. 12). Therefore, even if atmospheric freshwater fluxes and river discharge contribute a considerable quantity of light and nutrient-rich terrestrial inputs during winter, the strong vertical convection that is driven by the surface fluxes dominates the submesoscale mechanisms of mixing and prevents the formation of filament-like structures.
However, inter-annual variations in the filament occurrence were also found (Fig. 12), despite the stable percentage of cloudy images over the years (except for 2002) and the constantly high fractions of filament-like structures in the good images. Particularly in 1998 and 2004, a significantly higher number of events were recorded, nearly doubling the number of good data with no events (Fig. 12). Even if the time series is too short to enable the derivation of robust statistics, the inter-annual event variations appear to be correlated with variations in the yearly mean atmospheric freshwater fluxes, with a Pearson coefficient of 0.60.3 (a confidence interval of 1 was estimated through a bootstrapping procedure).

8""
304"305"306"307"308"309"
310"311"
A rainfall decrease in 2002 was reflected by a considerable decrease in the Volturno and Garigliano river discharges (Fig. 12). Among the years analysed, 2004 displayed the most intense rainfall with more than 900 mm, of which 250 mm fell only during spring months. The latter values were nearly five times those of spring 2003 (Fig. 12). Additionally, the discharge of both rivers increased significantly in 2004, particularly during spring (Fig. 12). These conditions correspond to the large filament formation at the beginning of June, which is described in chapter 3.2 (Figs. 6-7).
""4. The ocean model configuration
"312"313"314"315"316"317"318"319"320"321"322"323"324"325"326"327"328"329"330"331"332"333"334"335"336"337"338"339"340"341"
342"343"
A series of idealised numerical experiments were performed to better understand the three- dimensional structure and variability of the coastal filaments over the shelf. In particular, we addressed the response of the river plumes to the passage of single weather perturbations and rainfall events in the presence of a simplified forcing scenario. Numerical model simulations were performed using the Regional Ocean Modeling System (ROMS) (Shchepetkin and McWilliams, 2003, 2005). ROMS is a free surface, hydrostatic, primitive equation, finite difference model that is widely used by the scientific community for a diverse range of applications (Haidvogel et al., 2000; Di Lorenzo, 2003; Dinniman et al., 2003; Marchesiello et al., 2003; Budgell, 2005; Warner et al., 2005a, b; Wilkin et al., 2005).
The model domain covers mainly the entire Tyrrhenian Sea. Figure 2 shows the analysed area, and the red box in the inset depicts the entire model integration domain. The model grid has a constant horizontal resolution of 1 km and a variable vertical resolution, which is enhanced at the surface and obtained using 30 sigma levels. The bathymetry is derived from the National Geophysical Data Centre 2-minute Database and smoothed with a Shapiro filter to remove wavelengths on the order of the grid scale. The model was configured with a third-order upstream horizontal advection of 3D momentum (Shchepetkin and McWilliams, 1998), harmonic mixing of momentum and tracers, a quadratic parameterisation of bottom friction and the generalised length scale of Umlauf and Burchard (2003), which encompasses k-ε as a vertical turbulence closure. At the unique western open boundary, outflow Orlanski-type radiation conditions (Orlanski, I., 1976) were prescribed for all of the fields. As explained in Wilkin et al. (2005), these conditions enable the waves generated in the model to exit the domain with few open boundary artefacts, particularly given the short duration of the simulations (1 month). Additionally, given our focus on a coastal wind-driven dynamic, open boundary conditions that would impose the westward mean flow of the outer Tyrrhenian Sea were not incorporated.
The initial conditions that were used in the simulations were obtained from the results of the Mediterranean Forecasting System Toward Environmental Predictions (MFSTEP) project. Specifically, we computed an average temperature and salinity profile using MFSTEP analysis data relative to the months of May, June, and July over the period 2003-2004. These mean profiles were used to define the initial condition, which consisted of a horizontally homogeneous stratification with a null horizontal gradient.
""4.1 The idealised simulations

9""
344"345"346"347"348"349"350"351"352"353"354"355"356"357"358"359"360"361"362"363"364"365"366"
367"368"
Several idealised model simulations were conducted to investigate the role of the different forcing and the impulsive freshwater flux on the development of the submesoscale structures and the related cross-shelf surface dynamics (Table 1).
In this section, two main sets of experiments, which corresponded to two simplified wind regimes, will be described in detail (identified as “W-WR-2” and “NE-WR-2” in Table 1). The two experiments were planned to reproduce the typical wind regimes in this area (Menna et al., 2007). These regimes consist of a constant and weak E and SW wind for the first 10 days followed by a (Gaussian) peak of short duration (2 days) and high intensity (8 m/s), during which the wind veers to W or NW, respectively (Fig. 13). The Volturno and Garigliano rivers (Fig. 2) have been monitored by the Protezione Civile (the Italian Civil Protection Agency) of the Campania Region since 2001, and the rivers‟ discharges were incorporated in the model as a source term. The discharges were simulated using observed daily discharge matching with remote sensing events during the period 2001-2006.
Thus, the river discharges were reproduced as a background value, which was obtained considering the median of all of the available data (regarded as more representative than the mean, given the non-Gaussian distribution of the observations) and an intense Gaussian peak (σ=1.2, mean=10 and an amplitude of approximately 173 for the Volturno and 60 for the Garigliano) and which was imposed at a variable time delay with respect to wind for both rivers. The maximum values of the discharge peak were based on the event registered in June 2004 (Figs. 6-7).
In all of the simulations, a passive tracer was used to track the surface coastal water mass transport. The tracer was initialised with a constant value of 1 over the shelf (to the 50 m isobaths) and zero elsewhere. The other parameters that were considered included salinity, sea surface height and a local estimate of the scaled relative vorticity ζ (ω/f, with f the Coriolis parameter).
""4.1.1 Westerly wind forcing
"369"370"371"372"373"374"375"376"377"378"379"380"381"382"383"384"385"386"
In the first set of experiments (Figs. 14-17), the wind rotates from east to west, and various forcing scenarios are considered: one scenario that accounts only for the background river input (“W-BR”, Westerly Background River); another scenario with both the background flux and a discharge peak (“W-WR”, With River); a third scenario that includes only the discharge peak (“W- PR”, Peak River); a fourth scenario, in which no river discharge is considered (“W-NR”); and finally a scenario in which no wind forcing is applied (“NW”, No Wind) and the freshwater flux accounts only for the background value (Table 1).
During the first 10 days, in the W-WR simulation, only a slight accumulation of water in the northern part of the shelf is observed; after 10.5 days, wind inversion drives a reversal in the surface current everywhere, which appears to be now mainly directed SE (at a 45° angle) in all of the analysed simulations (not shown).
On day 12, the wind intensity increases further, and the Sea Surface Height (SSH) anomalies change from positive to negative (Fig. 14) with values approximately -1 cm in all of the different cases, limited to the inshore waters. Following the reversal and intensification of the wind, in all of the simulations, the tracer starts to be pushed south with the exception of the river estuary areas, in which the tracer extends more seaward (Fig. 15).
The modelling results after 13 days of simulation show the formation of coastal instabilities in the form of three anticyclonic structures located over the shelf: the first structure, in the form of a
10""
387"388"389"390"391"392"393"394"395"396"397"398"399"400"401"402"403"404"405"406"407"408"409"410"411"412"413"414"415"416"417"418"419"420"421"422"423"424"425"426"427"428"429"430"
weak eddy, in the northern part of the domain; the second structure in correspondence with the Volturno mouth; and the third structure slightly further south (Fig. 15). These instabilities are observed in all of the simulations in which river discharge is present, whereas the instabilities are absent in W-NR. Additionally, the instabilities are identified in Fig. 14 by a positive SSH anomaly located directly off the coast, which evolves into two eddy-like structures located directly opposite the Volturno and Garigliano estuaries.
The nature of these instabilities was investigated following the approach discussed in Thomas et al. (2008). In particular, to characterise the dynamical regime associated with the formation of these structures, the Richardson number Ri = N2H2/U2 and the Rossby number Ro = U/fL = ζ/f were estimated from the model simulations, where U, H, and L are the characteristic velocity, vertical and horizontal length scales, respectively, of the disturbances developing along the front formed by the surface freshwater, ζ is the relative vorticity, and N2 and f are the corresponding buoyancy and inertial frequencies. Thus, the values for the variables were calculated by examining the model fields that correspond to the instabilities‟ formation (on day 13 of the simulation; Fig. 15). Taking a value of ~5 m for the vertical scale H, a characteristic speed U of approximately 0.1 m/s, and the buoyancy frequency N2 ~ 4 x 10⁻⁴ gives Ri~1. In the development of baroclinic instabilities, the disturbances grow at a scale comparable with the local deformation radius, which implies that NH/fL~1. Because N2H2/f2L2=Ro2Ri, the scale of the most unstable modes is related to the Richardson number. Thus, in the present case, a Ro~1 would be expected. Following Thomas et al. (2008), Ro can be estimated from the model simulations by examining the scaled relative vorticity (Fig. 16), which gives a Ro of ~0.4-0.5. Because the gradient Rossby number and the bulk Richardson number are O(1), it follows that the observed features effectively originate from a baroclinic instability mechanism. However, the dynamics of these features classify them as submesoscale structures, where classical quasi-geostrophic approximation is not valid and growth and decay times are short: T ~ f-1Ro-1.
The evolution over the shelf of these structures is fast, and after only two days, the two northern structures already merge into a single anticyclonic eddy, located at the Volturno estuary, whereas the third structure is advected by the mean current and moves south (Fig. 14). The southern structure follows the southern steeper topography of the shelf while maintaining an anticyclonic vorticity and the particular coastline geometry leads to isopycnals crushing and the formation of a eddy dipole in correspondence to Ischia on day 17 of the simulation (Figs. 15-16). This structure appears as a eddy dipole and consists of two eddies of opposite signs (cyclonic and anticyclonic) with a mushroom-like structure (Fig. 15). The lifetime of this mushroom-like structure is observed to be approximately ten days. The structure‟s evolution is slow, gradually moving northwest until day 28, when the structure progressively loses energy and merges with the water coming from the coast (Fig. 15). The analysis of the scaled relative vorticity ζ shows high values (0.2-0.5 in absolute value) near Ischia on day 17, corresponding with the mushroom‟s formation (Fig. 16). These values imply the presence of well-defined eddy structures. However, as long as these values are <1, these structures are only mildly nonlinear. This type of mushroom-like structure may be viewed as a widespread universal form of non-stationary horizontal motion of the near-surface water of the ocean (Ginsburg and Fedorov 1984a, b; Fedorov and Ginsburg, 1992). The vertical structure of the mushroom-like feature at its maximum intensity (on day 22) is shown in Fig. 17. The currents involved concern a relatively thin near-surface ocean layer that varies from a few meters to 20 m in depth (Fig. 17) and is caused by the action of short-term, impulsive wind forcing. The core of the

11""
431"432"433"434"435"436"437"438"439"440"441"442"443"
444"445"
mushroom-like structure may be up to 10 m deep and is characterised by low-density values (sigma 25) and salinity values of approximately 37.
Comparing these results with the other simulations, we note the presence of the instabilities and a similar dynamical evolution along the shelf in all of the simulations in which freshwater is present. Analogously, the formation of a mushroom-like structure was observed in all cases except for the W-NR simulation, in which smaller velocities were present throughout the section and there was no sign of a surface mushroom.
The analysis results indicate no substantial differences between the W-WR and W-PR (only river peak) simulations. It is as if the effect of the river background value were negligible compared with the peak, indicating that these dynamics are strongly impulsive.
Many of the filament phenomena observed by satellite and described in section 3 followed the shelf and then turned seawards mainly near Ischia. In general, the correspondence between the phenomena observed by satellite imagery and the modelled phenomena is good.
""4.1.2 Northeasterly wind forcing
"446"447"448"449"450"451"452"453"454"455"456"457"458"459"460"461"462"463"464"465"466"467"468"469"470"471"472"473"
The sets of experiments described below only differ from the previous ones in the direction of the wind forcing, which now initially blows from the SW and after 10 days reverts to NE. Again, simulations with northeast no river (NE-NR), northeast with river discharge background and peak (NE-WR), northeast background river values only (NE-BR) and northeast with peak river discharge only (NE-PR) were set up. Here, we concentrate on the NE-WR, which provided the most interesting and realistic results, noting that we have already shown that the local dynamics are strongly related to impulsive forcing.
In the first 8 days, only minor differences were observed among the four simulations: surface currents are always directed southeastward (SW wind), attaining approximately 0.02 m s-1. In the presence of river discharge, starting from day 8, the SSH increases close to the shore in the area of the two river mouths because of the lighter freshwater flux, reaching values higher than 0.01 m.
After 10.5 days, the wind reversal leads to an increase in SSH values and the rotation of the surface currents at exactly 45° with respect to the wind direction already at the first time step after the reversal and subsequently NNW, with values of approximately 0.1 m s-1 (not shown). Based on the tracer field, an accumulation along the coast can be observed starting from day 10.5, followed by the northward transport of these waters by a current almost parallel to the coast.
When the wind extinguishes, a relaxation of the SSH back to negative values is observed, with characteristic spatial patterns comparable with those of the basin topography. From day 12.5, the tracer field slowly follows the southward current. Two structures with a slight rotational (anticyclonic) component are formed near the estuary of the Volturno River and slightly north of the island of Procida (Figs. 18-19). The same structures are visible in all of the simulations in which freshwater runoff is present, with a different extension of the tracer on the shelf, which is related to the presence or absence of an increased freshwater flux from the rivers (Fig. 19). In particular, the gyres are visible in the simulation with no river, which indicates that the observed structures are in this case related to the impulsive wind momentum transfer followed by the basin relaxation of the wind setup (Gravili et al., 2001).
In the following days, the SSH returns to equilibrium, and in the NE-NR case, this status persists until the end of the simulations because of the absence of any other forcing except for small SSH

12""
474"475"476"477"478"479"480"481"482"483"484"485"486"487"488"489"490"491"492"493"494"495"496"497"498"499"
500"501"
variations caused by slight and damped oscillations. Again, starting from day 14, the eddy located in the south close to the Monte di Procida cape remains trapped on the shelf most likely because of the strong coupling with the bathymetry in the absence of external forcing as a consequence of the conservation of potential vorticity. During the following days, the southern eddy gradually disappears from the tracer field, whereas the northern eddy, located close to the Volturno‟s mouth, is slightly fed by the tracer coming from the Gulf of Gaeta (Fig. 19).
In all of the simulations with river discharges, the SSH gradually relaxes. However, a small positive anomaly located in the area between the Garigliano and Volturno estuaries remains visible (Fig. 18). This anomaly, in the form of an anticyclonic eddy with a size comparable to the Rossby radius of deformation, slowly decreases in intensity and shifts a few km to the south, pushed by the southward main circulation, with values of 0.02 m s-1, until day 19. Afterward, the anomaly decreases in intensity but does not move from the shelf area in front of the Volturno‟s mouth until the end of our simulation.
In addition, these two eddies are observed in the presence of river discharge. The river runoff, particularly from the Garigliano, pushes the tracer from the Gulf of Gaeta to the south, and the eddy formed near the Volturno‟s mouth is found to be stronger than in the NE-NR case (Fig. 19). The northern eddy gradually evolves into a mushroom and then slowly widens, following the Volturno discharge, thus moving slowly south and gradually disappearing (Fig. 19). The southern eddy evolves in a manner similar to that of the no-river simulation. Additionally, the scaled relative vorticity ζ calculated at 5 m in depth shows the formation of the structures described above: a mushroom structure close to the Volturno river mouth characterised by a eddy dipole of positive and negative signs and high values (an absolute value of approximately 0.2-0.4; not shown).
Similar phenomena are common and often observed across the entire range of the analysed satellite images. A particularly clear case is shown in Fig. 20, which occurred on 26 and 27 September 2000, when a similar anticyclonic structure was present near the Volturno estuary and weak NE winds were blowing.
""5. Discussion
"502"503"504"505"506"507"508"509"510"511"512"513"514"515"516"
The impact of filaments along the southeastern Tyrrhenian Sea coast ""
The remote sensing ocean colour data over the period 1997-2006 show a large number of pigment-rich turbid water filament-like structures stretching from the Campania coast into the Tyrrhenian Sea. In this study, these structures were systematically analysed for the first time. A three-dimensional numerical model was used to study the dynamics of the filaments and their variability over the shelf. The response of the river plume to periods of wind reversal and a variety of freshwater discharge rates were examined with a set of idealised model simulations. In the investigated area, the filaments consist of a low-salinity, shallow, mixed layer plume and recur often during the year, representing an important component of the local circulation. Moreover, these structures appear to follow a complex intra-annual pattern, with the majority of the events occurring from April to July, but displaying a secondary peak in October.
The analysis of the observations revealed that atmospheric freshwater forcing, river loads and wind stress variations may have an important impact on the formation and evolution of these submesoscale structures along the northern coasts of Campania. In particular, freshwater fluxes may

13""
517"518"519"520"521"522"523"524"525"526"527"528"529"530"531"532"533"534"535"536"537"538"539"540"541"542"543"544"545"546"547"548"549"550"551"552"553"554"555"556"557"558"559"560"
create favourable conditions for the convergence of shelf waters (particularly at coastal capes) and subsequent filament formation.
Thus, the processes described here differ significantly from most filament systems described in the literature, such as the great California filament/jet systems (Flament et al., 1985; Kosro and Huyer, 1986), because of their smaller extension (on average 50-100 km in length compared with > 100 km and 5-10 km in width instead of 30-50 km), smaller thickness (on average 5-20 m instead of >300 m) and shorter lifetimes (approximately 3-5 days, compared with several weeks). Finally, they do not appear to be colder with respect to the surrounding waters, indicating that they are not related to upwelling events as for the large majority of the cases observed in the literature (Brink, 1983; Shillington et al., 1990; Dewey et al., 1991; Haidvogel et al., 1991; Haynes et al., 1993; Borzelli et al., 1999; Barth et al., 2005; Leister et al., 2009). In particular, for the Tyrrhenian Sea, researchers have previously studied the formation of cold filaments forced by intense cold winds funnelled by the coastal orography and by the intense air•sea interaction in the coastal zone that generates a particularly strong input of potential vorticity into the sea (Marullo et al., 1994; Bignami et al., 2008). In these cases, the cold filament studied has large dimensions (70-100 km), even though close to the boundaries it may develop in a mushroom-like jet, with meanders and narrow spiralling tongues. These previous studies conclude that filaments are important features modulating the dynamics of the entire Tyrrhenian Sea basin.
Our modelling focused on a series of ideal cases showing the system response to various types of ex wind forcing. These cases reproduce the typical conditions observed in the satellite images. The modelling confirms the key role of wind in forcing the coastal circulation and in the eddy generation mechanism of this area and added evidence to what was previously shown for the Gulf of Naples and the surrounding areas based on sparse in-situ observations or simplified model studies (Moretti et al., 1976-1977; De Maio et al., 1978-1979; Gravili et al., 2001). Additionally, the modelling experiments reveal that the organisation and evolution of the filament dynamics are largely determined by the particular physical configuration of the domain and the particular river mouth features., In fact, despite the presence of orographic features at the two extremes of the shelf, that might drive the generation of wind curl anomalies, the use of a zero wind curl forcing field in our tests was sufficient to reproduce the main features of the filament formation. Finally, our modelling results show that fresh water favours the formation of submesoscale structures with high relative vorticity (ω/f). In certain cases, it is observed how the filament-like structures that were rooted around Ischia and eventually evolve into a mushroom structure, generated by the vorticity anomaly just offshore of the island and the vorticity (of opposite sign) produced by the coastal current. Nevertheless, a non-zero wind stress curl due to the presence of high mountain on Ischia island could impact the local vorticity field and it could play a role in the detachment of the shelf water on the western side of the Island.
Therefore, it is the coupling between wind events and coastal morphology, namely the prominent coastal points, such as capes (the Volturno‟s mouth), headlands and islands (Procida and Ischia) and gulfs (the Gulf of Gaeta) that constitute the key factors in the settling of the general circulation and in mesoscale and sub-mesoscale features development. In fact, the role of the coastal morphology in perturbing a coastal current has been demonstrated and described several times in literature (e.g. Signell and Geyer 1991; Davies et al., 1995; MacCready and Pawlak 2001; Doglioli et al., 2004; Gacic et al., 2009). In our case, the shoreline geometry may act as a physical barrier that impedes the development of a classical coastal current and river plume, while a freshwater transport to the

14""
561"562"563"564"565"566"567"568"569"570"571"572"573"574"575"576"577"578"579"580"581""582"583"584"585"586"587"588"589"590"591"592"593"594"595"596"597"598"599"600"601"602"603"
south might be forced by specific wind condition and off-shore exchange can be enhanced through the filament formation, influencing the water quality at the northern beaches of Ischia and the island of Procida and inside the Gulf of Naples. In particular, one effect of an irregular coastline is to confine a significant fraction of the river discharge in the northern part of the area, i.e., in the Gulf of Gaeta, adjacent to the Garigliano river mouth. Thus, the Gulf becomes an important container for the eventual release of low salinity water and the consequent along-shelf accumulation that can enhance the filament formation and lead to extended water pollution events caused by riverborne material.
Due to the nature and dynamics of coastal filaments described in this paper, the amount of waters transported offshore in the course of their development is rather small (the volume transport can be estimated to be 1-20 104 m3 s-1). Nonetheless, we claim that these phenomena could be overall important since they mainly occur in late spring and summer, when the coast-offshore gradients of chemical and biological variables are particularly steep, due to the marked oligotrophy of the open waters. The amount of nutrients and biomass (including phyto-, zooplankton and fish larval stages) exported from the often highly eutrophic coastal areas into the extremely oligotrophic waters could hence be not negligible at all in terms of production processes, especially because of the high availability of light in those periods of the year. Indeed, filaments could partially explain the paradox of the relatively high Mediterranean production in terms of fisheries, that does not reflect the extremely low nutrient content of the waters of this sea (see Sioukou et al.2010). The possible shift toward longer stratified periods over the seasonal cycle at mid-latitudes in a climate change context could make these features even more prominent in the near future.
"""Specificity and relevance of freshwater filaments
""Although relatively simple, our model exercise and the complementary data analysis permit to identify and define a series of dynamical processes that could be important to explain the occurrence of buoyancy filaments in other coastal regions.
The main elements are: i) the presence of a freshwater anomaly due to a shelf which traps locally the river runoff. Indeed
the filaments are crucially related to the presence of a freshwater anomaly on the shelf. As a matter of fact, they are the product of dynamical constraints on the renewal of the shelf water masses due to a wind forcing. The sensitivity tests have also showed that, even if they can be associated to floods in areas with a weak mean river runoff, an important element for their occurrence is the amount of freshwater available on the shelf at the moment of the wind anomaly, while the exact timing of the freshwater accumulation is less relevant.
ii) the absence of strong inertial effects on the river plume at the river mouth that could produce an offshore export of the river water. Large river runoff over tight shelves have deeply different dynamical response to wind forcing.
iii) the occurrence of wind events whose directions do not favour a geostrophic adjustment of the freshwater excess over the shelf. In fact, the filaments and mushrooms are produced as the result of a perturbation of a geostrophically adjusted situation. The wind intensity has to exceed the breeze values but in general the surface forcing has not to be too intense or too extended in time, as these thin structures could be easily destroyed by an excessive vertical mixing or by the creation of local

15""
604"605"606"607"608"609"610"611"612"613"614"615"616"617"618"619"620"621"622"623"624"625"626"627"628"629"630"631"632"633"634"635"636"637"638"639"640"641"642"643"644"645"646"
recalculations. The requirement of a stratified water column is one of the reasons for their strong seasonality. By contrast, the local wind curl seems not to be an important factor, since an homogeneous wind was sufficient to reproduce them numerically. This is not the case for many other Mediterranean filaments, being this basin characterized by a complex orography which can favour wind funnelling (see for instance Bignami et al., 2008).
iv) the presence of irregularities along the shelf which favours the redistribution of vorticity that is needed to form the elongated, cross-shelf features (filaments and mushrooms).
v) while the filaments are in a submesoscale regime, baroclinic instabilities do not play a major role, since the filaments are not produced as fully developed instabilities of a coastal current. Indeed, in the case of the filaments rooted at a cape, they can act as a preconditioning factor since they influence the particular vortical pattern occurring just upstream of the cape.
vi) the presence of a background offshore flow can act as another preconditioning factor but the exported shelf water is not merely tracing this flow since its buoyancy excess is a crucial component of its dynamics. The existence of offshore coherent structures can indeed favour the elongation of the filaments, although this point requires more investigation.
Undoubtedly, this kind of filaments have received little attention in literature, probably because of their very weak (positive) anomaly in SST (and thus in the widely used IR satellite imagery), which is possibly due to small river runoff and intense solar irradiance that quickly dumps the SST anomalies of the thin freshwater layers over the shelf, i.e., of the source water. As stated above, the freshwater filaments described here are deeply different than upwelling filaments, which have intensively been studied in the literature (see introduction). Nevertheless, our results are somehow similar to those of a recent study on filament formation in an upwelling system (Meunier et al., 2010), where, in presence of a topographic irregularity in the coast, baroclinic instabilities was not the main driver of the filament formation, which in addition required short-lived winds. Interestingly, the study by Meunier et al. (2010) also showed that, rather than the presence of a cape, certain topographic structures can act as sources of anomalous potential vorticity whose rearrangement promotes the formation of the filaments.
At the same time, buoyancy filaments described in our study cannot be strictly classified as river plumes, since they are related to the river runoff dynamics per se (e.g., Garcia Berdeal et al, 2002; Banas et al., 2009). Moreover, they are submesoscale features but they are not associated to frontal instabilities as it happens to most of submesoscale processes and, finally, they are not simply the result of the stirring of river water by offshore eddies. The latter seems to be the case, for instance, of the Mississippi River water in the Gulf of Mexico, where the Loop Current eddies sometimes entrain the freshwater from the shelf and stir it over tenths to hundredths of km offshore (Morey et al., 2003; Schiller et al., 2011). Interestingly, also in the case of the Gulf of Mexico, filaments have a marked seasonal cycle, with a maximum in summer, even if this season is characterized by a low river runoff transport and it is not a peak in Loop Current eddy activity. To explain the observed seasonality, the authors argue about the role of the favourable summer wind direction, which eases the offshore export of the shelf freshwater and allows for its entrainment by the Loop Current.
In summary, wind-driven filament formation is likely to be a much more widespread phenomenon than previously thought and the use of colour images will possibly enhance the amount of observations. Specifically for the freshwater filaments, considering the conditions conducive to their formation described above, could play a non-negligible rôle in many stratified

16""
647"648"649"650"
651"
652"
areas, such as those in the mid-latitudes in spring/summer, as well as in many sub-tropical and tropical regions all over the year.
"""""6. Conclusions
"653"654"655"656"657"658"659"660"661"662"663"664"665"666"667"668"669"670"671"672"673"674"675"676"677"678"679"680"681"682"683"684"
685"686"687"688"689"
We have presented a detailed analysis of the formation and subsequent evolution of submesoscale structures that frequently occur off the southeastern coast of the Tyrrhenian Sea (Italy) combining observations and modelling exercises. An experimental analysis of the offshore filament structures was performed using high-resolution satellite images from the Sea-viewing Wide Field-of-view Sensor (SeaWiFS), observations of atmospheric freshwater fluxes, wind, and river discharge, and synoptic maps of mean surface atmospheric pressure in the period 1998–2006. The main features of the filaments were highlighted by focusing on four specific events that are representative of the dynamical process and the varying expected impacts on the coastal area. The filaments were found to evolve over time scales of a few days to a week in response to the reversal of transient winds. Overall, the statistics show patterns of variability on monthly and seasonal time scales with the major peak occurring during spring/summer (April to July) and a secondary peak in October. Additionally, we examined the origin, characteristics, and evolution of these features and considered their possible roles in cross-shelf exchange through idealised prediction simulations using a specific implementation of the Regional Ocean Modeling System (ROMS).
The filaments observed in remote sensing imagery and reproduced by the ROMS model appear as well-organised sub-mesoscale structures that develop at the river mouths or at adjacent capes in response to transient wind forcing. The results of this study indicate that the filaments could contribute considerably to cross-shelf exchange and the biological variability in coastal areas where (buoyant) riverine waters are exposed to transient winds in the presence of a coastline with capes and shelves with irregular geometry.
The occurrence of such transient, intense structures has important implications for human activities and must be considered when planning coastal pollution monitoring or local fishery management. These processes may be significant factors in determining the fate of riverborne materials, such as nutrients or sediments, particularly in a coastal area that may be fragile because located in a densely populated region with intense maritime traffic and thus extremely sensitive to pollution that may negatively affect the water quality and the state of the ecosystems. This study has taken an important step in examining the variability of river plumes and filament formation and confirmed that a combined use of remote sensing imagery and model simulations could yield valuable insight into such processes.
Further process studies and an observational programme are required to complete our understanding of the filament‟s formation and evolution mechanism, the interactions between the filaments and eddy fields and net effect of the filaments on the offshore transport of material.
""APPENDIX
""1. Ocean-colour dataset
We analysed nine years (1997–2006) of SeaWiFS daily observations of the surface K490

17""
690"691"692"693"694"695"696"697"698"699"700"701"702"703"704"705""706"707"708"709"710"711"712"713"714"715"716"717"
distribution with a spatial resolution of 1 km. The data were operationally produced by the Satellite Oceanography Group (GOS) at the Institute of Atmospheric Sciences and Climate (ISAC-CNR) in Rome. The SeaWiFS data were acquired and processed daily by the HRPT receiving station located in Rome (41.84° N, 12.65° E) managed by ISAC-GOS.
We chose to consider the diffuse attenuation coefficient K490 instead of chlorophyll-a because in coastal and estuarine waters the optical properties are significantly influenced by constituents other than chlorophyll, such as suspended sediments, dissolved organic matter and terrigenous particles (Morel and Prieur, 1977; Gordon and Morel, 1983). K490 indicates how strongly the light intensity at a specified wavelength is attenuated within the water column. Therefore, K490 is directly related to the presence of scattering particles (either organic or inorganic) in the water column, and thus K490 is an indication of water clarity.
""2. Wind data
The wind data were derived from the European Centre for Medium-range Weather Forecasts (ECMWF) forecast field (see Ruti et al., 2008, for a discussion of analyses and reanalysis products for the Mediterranean basin).
"""3. Other data
The daily river flows were obtained from the Settore Programmazione Interventi di Protezione Civile sul Territorio (the Functional Centre of the Campania Region Civil Protection Department) using the daily hydrometric height and specific runoff scales for each river.
The atmospheric freshwater fluxes were measured at Capodichino airport (data derived from the Ufficio Centrale di Ecologia Agraria APAT-UCEA).
The biological and nutrients data were obtained from the database of the Sea Defence System (Si.Di.Mar), a project of the Italian Ministry of the Environment, Land and Sea.
"""Acknowledgments
"718"719"720"721"722""723"724"725"726"727"
The authors gratefully acknowledge the MFSTEP project for the provided data, the “Settore Programmazione Interventi di Protezione Civile sul Territorio” of Campania Region for the river discharge data and the MED TOSCA project (co-funded by the European Regional Development Fund). The authors wish to thank Dr. F. Bignami and Dr. H. Van Heijst for constructive exchanges about the manuscript. I. I. was financially supported by a FISR-VECTOR (subtasks WP4) grant.
"""References
"
"Artale, V., Astraldi, M., Buffoni, G., Gasparini, G. P., 1994. Seasonal variability of gyre-scale circulation in the northern Tyrrhenian Sea. J. Geophys. Res,, 99 (C7), 14127-14137.
"728"729"730"
Astraldi, M., Gasparini, G.P., 1994. The seasonal characteristics of the circulation in the Tyrrhenian Sea. In: La Violette, P. _Ed.., Seasonal and Interannual Variability of the Western Mediterranean Sea. Coastal and Estuarine Studies, Vol. 46. American Geophysical Union, pp. 115–134.

18""
731"732"
Banas, N. S., P. MacCready, and B. M. Hickey, 2009. The Columbia River plume as cross-shelf exporter and along-coast barrier. Continental Shelf Res., doi:10.1016/j.csr.2008.03.011.
"733"734"735"736"737"
Barth, J.A., Pierce, S.D., Cowles, T.J., 2005. Mesoscale structure and its seasonal evolution in the northern California Current system. Deep Sea Research II, 52 (1–2), 5–28.
"Barton, E.D., Aristegui, J., Tett, P., Navarro-Perez, E., 2004. Variability in the Canary Island area of filament-eddy exchange. Progr. Oceanog., 62 (2-4), 71-94.
"738"739"
Bignami, F., Böhm, E., D'Acunzo, E., D'Archino, R., Salusti, E., 2008. On the dynamics of surface cold filaments in the Mediterranean Sea. J. Marine Syst., 74, 429-442.
"740"741"
Boccaletti, G., Ferrari, R., Fox-Kemper, B., (2007). Mixed Layer Instabilities and Restratification. J. Phys. Oceanogr. 37:9, 2228-2250
"742"743"
Borzelli, G., Manzella, G., Marullo, S., Santoleri, R., 1999. Observations of coastal filaments in the Adriatic Sea. J. Marine Syst., 20, 187–203.
"744"745"
Brink, K.H., 1983. The Near-Surface Dynamics of Coastal Upwelling. Prog. Oceanog., 12, 223- 257.
"746"747"
Budgell, W.P., 2005. Numerical simulation of ice-ocean variability in the Barents Sea region. Ocean Dynam., DOI 10.1007/s10236-005-0008-3.
"748"749"
Burrage, D.M., Book, J.W., Martin, P.J., 2009. Eddies and filaments of the Western Adriatic Current near Cape Gargano: Analysis and prediction. J. Marine Syst., 78, 205–226.
"750"751"752"
Carrada, G.C, Hopkins, T.S, Bonaduce. G., Ianora, A., Marino, D., Modigh, M., Ribera d'Alcalà, M., Scotto di Carlo B., 1980. Variability in the hydrographic and biological features of the Gulf of Naples. PSZNI Mar. Ecol., 1, 105–120.
"753"754"755"
Castelao, R. M., Barth, J. A., 2006. The Relative Importance of Wind Strength and Along-Shelf Bathymetric Variations on the Separation of a Coastal Upwelling Jet. J. Phys. Oceanogr., 36 (3), 412-425.
"756" Chao, S.-Y., 1988. River-forced estuarine plumes, J. Phys. Oceanogr., 18, 72-88. "757"758"
Chao, S.-Y., Shaw, P.-T., 2002. Nonhydrostatic aspects of coastal upwelling meanders and filaments off eastern ocean boundaries. Tellus A, 54 (1), 63–75.
"759"760"
Choi, B.-J., Wilkin, J. L., 2007. The effect of wind on the dispersal of the Hudson River plume, J. Phys. Ocenogr., 37(7), 1878-1897.
"761"762"
Crépon, M., Richez, C., 1982. Transient upwelling generated by twodimensional forcing and variability in the coastline. J. Phys. Oceanogr., 12, 1437–1457.
19""
763"764"
Davies, P., Dakin, J., Falconer, R., 1995. Eddy formation behind a coastal headland, J. Coastal Res., 11(1), 154–167.
"765"766"
De Gaetano, P., Burlando, M., Doglioli, A. M., Petrenko, A. A., 2010. Wind forcing effects on coastal circulation and eddy formation around a cape. Ocean Sci. Discuss., 7, 207–249.
"767"768"769"
De Maio A., Moretti, M., Sansone, E., Spezie, G., Vultaggio, M. Dinamica delle acque del Golfo di Napoli. Diffusione delle acque dolci che pervengono nel Golfo (aprile, settembre, ottobre 1977). Annali Ist. Univ. Nav. 1978-1979a, XLVII-XLVIII, 201-213.
"770"771"
De Maio.A., Moretti.M., 1973. Contributo a un progetto di studio delle correnti del Golfo di Napoli. Fondazione Politecnica per il Mezzogiomo d'ltalia. Quaderno 71.
"772"773"
Dewey, R.K., Moum, J.N., Paulson, C. A., Caldwell, D.R., Pierce, S.D., 1991. Structure and dynamics of a coastal filament. J. Geophys. Res., 96 (C8),14885-14907.
"774"775"
Di Lorenzo, E., 2003. Seasonal dynamics of the surface circulation in the southern California Current System. Deep-Sea Res. PT II, 50, 2371-2388.
"776"777"
Dinniman, M. S., Klinck, J. M., Smith Jr., W. O., 2003. Cross shelf exchange in a model of the Ross Sea circulation and biogeochemistry. Deep-Sea Res. PT II, 50, 3103-3120.
"778"779"780"
Doglioli, A.M., Griffa, A., Magaldi, M.G., 2004. Numerical study of a coastal current on a steep slope in presence of a cape: the case of the Promontorio di Portofino, J. Geophys. Res., 109, C12033, doi:10.1029/2004JC002422.
"781"782"
Fedorov, K.N., Ginsburg, A.I., 1992. The Near-Surface Layer of the Ocean. VSP, Utrecht, The Netherlands. 259 p. 1992.
"783"784"
Flament, P., Armi, L., Washburn, L., 1985. The evolving structure of an upwelling filament. J. Geophys. Res., 90 (11), 765–11778.
"785"786"
Fong, D.A., Geyer, W.R., 2002. The alongshore transport of freshwater in a surface-trapped river plume. J. Phys. Oceanogr., 32, 957–972.
"787"788"789"
Gacic, M., Kovacˇevic´, V., Cosoli, S., Mazzoldi, A., Paduan, J. D., Mancero Mosquera, I., Yari, S., 2009. Surface current patterns in front of the Venice Lagoon. Estuar. Coast. Shelf S., 82, 485- 494.
"790"791"
Garcia Berdeal, I., Hickey, B.M., Kawase, M., 2002. Influence of wind stress and ambient flow on a high discharge river plume. J. Geophys. Res., 107 (C9), 3130, doi:10.1029/2001JC000932.
"792"793"
Ginsburg A.I., Fedorov, K.N., 1984b. Evolution of mushroom-like currents in the ocean. Dokl. Acad. Sci. USSR, 276, 2: 481-484.
"794"795"
Ginsburg, A.I., Fedorov, K.N., 1984a. Mushroom-like currents in the ocean (based on the analysis of satellite images). Issled. Zemli iz Kosmosa (Earth Res. Form Space, in Russian), 3: 18-26.
20""
796"797"798"
Gordon, H. R. and Morel, A., 1983. Remote assessment of ocean color for interpretation of satellite visible imagery: A review, in Lecture Notes on Coastal and Estuarine Studies, vol. 4, edited by R. T. Barber et al., 114 pp. Springer, New York.
"799"800"
Gravili, D., Napolitano, E., Pierini, S., 2001. Barotropic aspects of the dynamics of the Gulf of Naples (Tyrrhenian Sea). Cont. Shelf Res., 21, 455-471.
"801"802"803"
Haidvogel, D. B., Arango, H. G., Hedstrom, K., Beckmann, A., Malanotte-Rizzoli, P., Shchepetkin, A. F., 2000. Model evaluation experiments in the North Atlantic Basin: Simulations in nonlinear terrain-following coordinates. Dynam. Atmos. Oceans, 32, 239-281.
"804"805"
Haidvogel, D. B., Beckmann, A., Hedstrom, K.S., 1991. Dynamical simulations of filament formation and evolution in the coastal transition zone. J. Geophys. Res., 96, 15017–15040.
"806"807"
Haynes, E., Barton, D., Pilling, I., 1993. Development, persistence, and variability of upwelling filaments off the Atlantic coast of the Iberian Peninsula. J. Geophys. Res. 98 (C12), 22681–22692.
"808"809"
Huthnance, J.M., 1995. Circulation, exchange and water masses at the ocean margin: the role of physical processes at the shelf edge. Prog. Oceanogr., 35, 353–431.
"810"811"
Ikeda, M., Emery, W. J., 1984. Satellite observations and modeling of meanders in the California Current system off Oregon and northern California. J. Phys. Oceanogr., 14, 1434-1450.
"812"813"
Ikeda, M., Mysak, L. A., Emery, W. J., 1984. Observation and modeling of satellite-sensed meanders and eddies off Vancouver Island. J. Phys. Oceanogr., 14, 3–21.
"814"815"816"
Keister, J.E., Cowles, T.J., Peterson, W.T., Morgan, C.A., 2009. Do upwelling filaments result in predictable biological distributions in coastal upwelling ecosystems? Prog. Oceanogr., 83, (1–4), 303–313.
"817"818"
Kosro, P. M., Huyer, A., 1986. CTD and velocity surveys of seaward jets off Northern California. J. Geophys. Res., 91, 7680–7690.
"819"820"821"
Kourafalou, V.H., Oey, L.-Y., Lee, T. N., Wang, J. D., 1996b. The fate of river discharge on the continental shelf, II, Transport of coastal low-salinity waters under realistic wind and tidal mixing. J. Geophys. Res., 101(C2), 3435-3455.
"822"823"824"
Kourafalou, V.H., Oey, L.-Y., Wang, J.D., Lee, T. N., 1996a. The fate of river discharge on the continental shelf, I, Modeling the river plume and the inner-shelf coastal current. J. Geophys. Res., 101(C2), 3415-3434.
"825"826"
Krivosheya, V.G., Ovchinnikov, I.M., 1973. Properties of the geostrophic circulation of the Tyrrhenian Sea. Oceanology+, 13, 996–1002.
"827"828"
Lentz, S., 2004. The Response of Buoyant Coastal Plumes to Upwelling-Favorable Winds. J. Phys. Oceanogr., 34, 2458–2469. doi: 10.1175/JPO2647.1

21""
829"830"831"
Lutjeharms, J. R. E., Shillington, F. A., Duncombe, C. M., 1991. Observations of Extreme Upwelling Filaments in the Southeast Atlantic Ocean. Science, New Series, 253, No. 5021, 774- 776.
"832"833"
MacCready, P. and Pawlak, G., 2001. Stratified flow along a corrugated slope: separation drag and wave drag, J. Phys. Oceanogr., 31, 2824–2839.
"834"835"
Marchesiello, P., McWilliams, J.C., Shchepetkin, A., 2003. Equilibrium structure and dynamics of the California Current System. J. Phys. Oceanogr., 33, 753-783.
"836"837"838"839"
Marullo, S., R. Santoleri, and F. Bignami (1994), The surface characteristics of the Tyrrhenian Sea: Historical satellite data analysis, in Seasonal and Interannual Variability of the Western Mediterranean Sea, Coastal Estuarine Stud., vol. 46, edited by P. E. La Viollette, pp. 135–154, AGU, Washington, D. C., doi:10.1029/CE046p0135.
"840"841"842"
Menna, M., Mercatini, A., Uttieri, M., Buonocore, B., Zambianchi E., 2007. Wintertime transport processes in the Gulf of Naples investigated by HF radar measurements of surface currents. Nuovo Cimento, 30 (C) 605-622.
"843" Millot, C., 1987. Circulation in the western Mediterranean Sea. Oceanol. Acta, 10, 143–149. "844"845"
Moore, M.I., and Murdoch, R.C., 1993. Physical and biological observation of coastal squirts under nonupwelling conditions. J. Geophys. Res., 98, 20043–20061.
"846" Morel, A., Prieur, L., 1977. Analysis of variations in ocean color. Limnol. Oceanogr., 22, 709– 722. "847"848"
Moretti, M., Sansone, E., Spezie, G., Vultaggio, M., De Maio, A., Alcuni aspetti del movimento delle acque del Golfo di Napoli. Annali I.U.N., 1976-1977, XLV-XLVI, 207-217.
"849"850"851"
Morey, S. L. Schroeder, W.W., O‟Brien, J. J., and Zavala-Hidalgo, J., 2003. The annual cycle of riverine influence in the eastern Gulf of Mexico basin. Geophys. Res. Lett., 30, 16, 1867, doi:10.1029/2003GL017348.
"852"853"
Meunier, V. Rossi, Y. Morel, X. Carton, 2010. Influence of bottom topography on an upwelling current : generation of long trapped filaments. Ocean Mod., 35, 277-303
"854"855"
Narimousa, S., Maxworthy, T., 1987. Coastal upwelling on a sloping bottom: the formation on plumes, jets and pinched-off cyclones. J. Fluid Mech., 176, 169–190.
"856"857"858"
Nieto K., H. Demarcq, S. McClatchie, 2012. Mesoscale frontal structures in the Canary Upwelling System: New front and filament detection algorithms applied to spatial and temporal patterns, Remote Sensing of Environment, 123, 339-346, 10.1016/j.rse.2012.03.028.
"859"860"
Orlanski, I., 1976: A simple boundary condition for unbounded hyperbolic flows. J. Comp. Sci., 21(3), 251-269.
22""
861"862"863"
Peliz, A., Teles-Machado, A., Marchesiello, P., Dubert, J., Garcia Lafuented, J., 2009. Filament generation off the Strait of Gibraltar in response to Gap winds. Dynam. Atmos. Oceans, 46, (1- 4), 36-45.
"864"865"
Pierini, S. and Simioli A., 1998. A wind-driven circulation model of the Tyrrhenian Sea area. J. Marine Syst., 18(1-3), 161-178.
"866"867"
Poulain, P.M., Zambianchi, E., 2007. Surface circulation in the central Mediterranean Sea as deduced from Lagrangian drifters in the 1990s. Cont. Shelf Res., 27(7), 981–1001.
"868"869"870"
Rinaldi E., Buongiorno Nardelli, B., Zambianchi, E., Santoleri, R., Poulain, P.-M., 2010. Lagrangian and Eulerian observations of the surface circulation in the Tyrrhenian Sea, J. Geophys. Res., 115, C04024, doi:10.1029/2009JC005535.
"871"872"
Robinson, A.R., Leslie, W.G., Theocharis, A., Lascaratos, A., 2001. Mediterranean Sea Circulation. Encyclopedia of Ocean Sciences, Academic Press, 1689-1706.
"873"874"875"
Ruti, P. M., Marullo S., D'Ortenzio, F., Tremant , M., 2008. Comparison of analyzed and measured wind speeds in the perspective of oceanic simulations over the Mediterranean basin: Analyses, QuikSCAT and buoy data. J. Marine Syst., 70, 33–48.
"876"877"878"
Salusti, E., 1998. Satellite images of upwellings and cold filament dynamics as transient effects of violent air–sea interactions downstream from the Island of Sardinia (western Mediterranean Sea). J. Geophys. Res., 103 (C2), 3013–3031.
"879"880"881"
Schiller, R. V., Kourafalou, V. H., Hogan, P. , and Walker N. D., 2011. The dynamics of the Mississippi River plume: Impact of topography, wind and offshore forcing on the fate of plume waters. J. Geophys. Res., 116, C06029, doi:10.1029/2010JC006883.
"882"883"
Send, U., 1989. Vorticity and instabilities during flow reversal on the continental shelf. J. Phys. Oceanogr., 19, 1620–1633.
"884"885"
Shchepetkin, A. F., McWilliams, J. C., 2003. A method for computing horizontal pressure-gradient force in an oceanic model with a nonaligned vertical coordinate. J. Geophys. Res., 108(C3), 3090.
"886"887"
Shchepetkin, A. F., McWilliams, J. C., 2005. The Regional Ocean Modeling System: A split- explicit, free-surface, topography following coordinates ocean model,. Ocean Model., 9, 347-404.
"888"889"890"
Shillington, F., Peterson, W., Hutchings, L., Probyn, T., Waldron, N., Agenbag, J., 1990. A cool upwelling filament off Namibia, southwest Africa: preliminary measurements of physical and biological properties. Deep-Sea Res., 37, 1753-1772.
"891"892"
Signell, R., Geyer, W., 1991. Transient eddy formation around headlands, J. Geophys. Res., 96(C2), 2561– 2575.

23""
893"894"895"
Siokou-Frangou, I., Christaki, U., Mazzocchi, M. G., Montresor, M., Ribera d'Alcalá, M., Vaqué, D., and Zingone, A.: Plankton in the open Mediterranean Sea: a review, Biogeosciences, 7, 1543- 1586, doi:10.5194/bg-7-1543-2010, 2010.
"896"897"898"
Thomas, L. N., A. Tandon, and A. Mahadevan, 2008. Sub-mesoscale processes and dynamics. In M. W. Hecht, and H. Hasumi (Eds.), Ocean Modeling in an Eddying Regime, Geophysical Monograph Series, Volume 177, American Geophysical Union, Washington DC, pages 17-38.
"899"900"
Trasviña, A., Ortiz-Figueroa, M., Herrera, H., Cos´ıo, M.A., González, E., 2003. „Santa Ana‟ winds and upwelling filaments off Northern Baja California. Dynam. Atmos. Oceans, 37, 113–129.
"901"902"903"904"905"
Umlauf, L., and H. Burchard (2003), A generic length-scale equation for geophysical turbulence models, J. Mar. Res., 61, 235– 265.
"van Heijst and G.J.F., Flór, J.B., 1989. Dipole formation and collisions in a stratified fluid. Nature, 340, 212-215.
"906"907"
Wang, D., Vieira, M.E.C., Salat, J., Tintoré, J., La Violette, P.E., 1988. A shelf/slope frontal filament off the northeast Spanish coast. J. Mar. Res., 46, 321–332.
"908"909"
Warner, J. C., Geyer, W. R., Lerczak, J. A., 2005b. Numerical modeling of an estuary: A comprehensive skill assessment. J. Geophys. Res., 110, C05001, doi: 10.1029/2004JC002691.
"910"911"
Warner, J.C., Sherwood, C.R., Arango, H.G., Signell, R.P., 2005a. Performance of four Turbulence Closure Methods Implemented using a Generic Length Scale Method. Ocean Model., 8, 81-113.
"912"913"
Washburn, L., Armi, L., 1988. Observation of frontal instabilities of an upwelling filament. J. Phys. Oceanogr., 18, 1075–1092.
"914"915"
Whitney, M. M., Garvine, R. W., 2005. Wind influence on a coastal buoyant outflow. J. Geophys. Res., 110, C03014, doi:10.1029/2003JC002261.
"916"917"918"
Wilkin, J.L., Arango, H.G. , Haidvogel, D.B., Lichtenwalner, C.S., Durski, S.M., Hedstrom, K.S., 2005. A regional Ocean Modeling System for the Long-term Ecosystem Observatory. J. Geophys. Res., 110, C06S91, doi:10.1029/2003JC002218.
"919"920"
Xia, M., Xie, L., Pietrafesa, L. J., 2007. Modeling of the Cape Fear River estuary plume. Estuaries Coasts, 30, 698–709.
"921"922"
Xia, M., Xie, L.,Pietrafesa, L. J., 2010. Winds and the orientation of a coastal plane estuary plume. Geophys. Res. Lett., 37, L19601, doi:10.1029/2010GL044494.
"923"924"
Xing, J., Davies, A. M., 1999. The effect of wind direction and mixing upon the spreading of a buoyant plume in a non-tidal regime. Cont. Shelf Res., 19, 1437-1483.
"925"926"
Zingone, A., Dubroca L., Iudicone D., Margiotta F., Corato F., Ribera d‟Alcalà M., Saggiomo V., Sarno, D., 2010. Coastal phytoplankton do not rest in winter. Estuaries Coasts, 33, 342-361.

24""
927"928"
""""""""""""""""""""""""""""929"
""
Figure Captions
"930"931"932""933"934"
Figure 1. A distinctive filament event along the Italian coast of the South Tyrrhenian Sea as viewed in diffuse light attenuation coefficient (K490, m-1) data from SeaWiFS imagery, observed on 10 October 2003.

25""
"""""""""""""""""""""""""""""""""935"
"936"937"938"939""940"941"942"943"944"
Figure 2. A map of a portion of the southeastern coast of the Tyrrhenian Sea (Mediterranean Sea) with bathymetry. The positions of the major rivers and geographical locations are mentioned in the text. The black box in the inset represents the analysed area and the red box the entire model integration domain.

26""
""""""""""""""""""""""""""""""945"
"946"947"948"949""950"951"952"953"954"
""""""""""""""""955"
Figure 3. Time series of a) pressure and b) wind components u and v during May 2002 extracted from the ECMWF forecast field at 13.5°E-40.4°N; c) time series of atmospheric freshwater fluxes measured at Capodichino airport (APAT-UCEA data); d) the Garigliano and Volturno river discharge during May 2002.
"956" Figure 4. Synoptic maps of the mean surface atmospheric pressure (mbar) on 8 and 12 May 2002.

27""
957"958"
"""""""""""""""""""""""""""""959"
"960"961"962"963""964"965"966"
""Figure 5. The filament event as observed in K490 (m-1) satellite images of the South Tyrrhenian Sea during the period 5-21 May 2002. The black and red arrows indicate the daily wind direction and intensity (red arrow) with respect to wind scale (the black arrow represents a wind speed of 5 m/s).

28""
"""""""""""""""""""""""""""""""967"
"968"969"970"971""972"973"
Figure 6. Time series of a) pressure and b) wind components u and v during June 2004 extracted from the ECMWF forecast field at 13.5°E-40.4°N; c) time series of atmospheric freshwater fluxes measured at Capodichino airport (APAT-UCEA data); d) the Garigliano and Volturno river discharge during June 2004.

29""
"
"""""""""""""""""""""""""""""""""""""""""""974"
"975"976"977"978""979"980"981"982"
""Figure 7. The filament event as observed in K490 (m-1) satellite images of the South Tyrrhenian Sea during the period 7-30 June 2004. The black and red arrows indicate the daily wind direction and intensity (red arrow) with respect to wind scale (the black arrow represents a wind speed of 5 m/s).
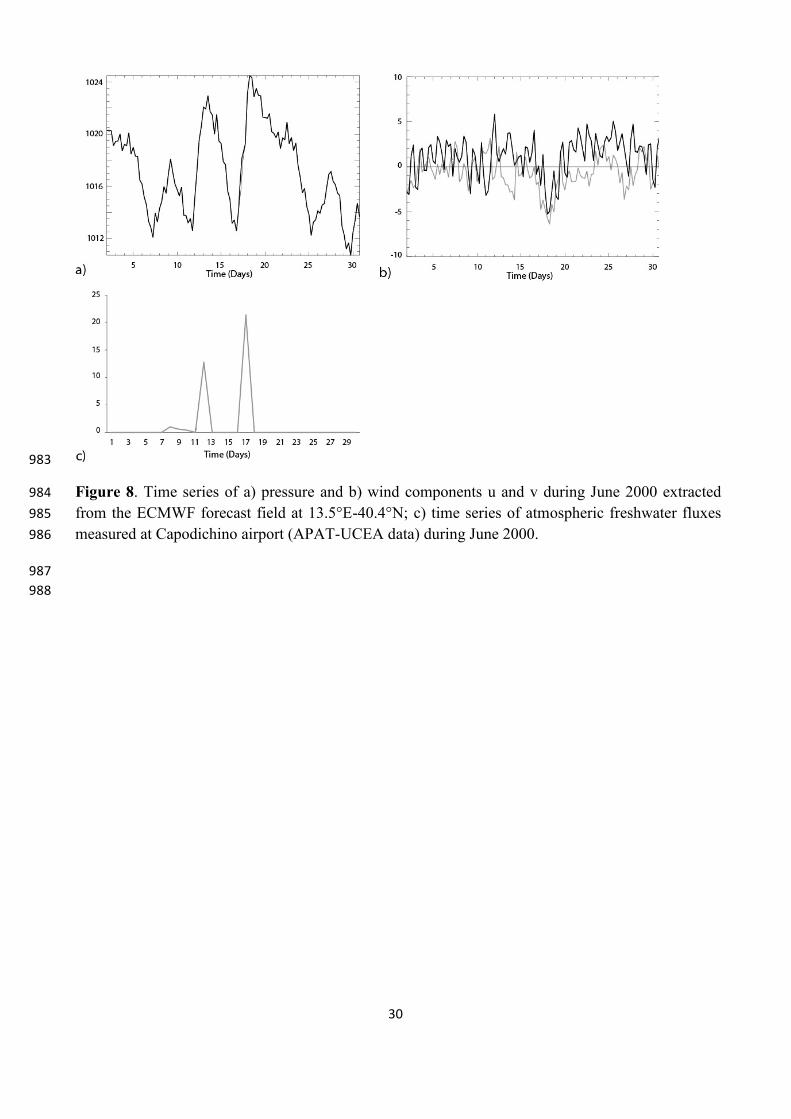
30""
"""""""""""""""""""""""""""""983"
"984"985"986""987"988"
Figure 8. Time series of a) pressure and b) wind components u and v during June 2000 extracted from the ECMWF forecast field at 13.5°E-40.4°N; c) time series of atmospheric freshwater fluxes measured at Capodichino airport (APAT-UCEA data) during June 2000.

31""
""""""""""""""""""""""""""""""
989""
990"991"992"993"
"994"995"996"997"998"999"
1000"
""Figure 9. The filament event as observed on K490 (m-1) satellite images of the South Tyrrhenian Sea during the period 17-22 June 2000. The black and red arrows indicate the daily wind direction and intensity (red arrow) with respect to wind scale (the black arrow represents a wind speed of 5 m/s).

32""
"""""""""""""""""""""""""""""1001"
"1002"1003"1004"1005""1006"1007"
Figure 10. Time series of a) pressure and b) wind components u and v during June 2001 extracted from the ECMWF forecast field at 13.5°E-40.4°N; c) time series of atmospheric freshwater fluxes measured at Capodichino airport (APAT-UCEA data); d) the Garigliano and Volturno rivers discharge (m3/s) during June 2001.

33""
""""""""""""""""""""""""""""""1008""1009"1010"1011"1012""1013"
""Figure 11. The filament event as observed in K490 (m-1) satellite images of the South Tyrrhenian Sea during the period 14-30 June 2001. The black and red arrows indicate the daily wind direction and intensity (red arrow) with respect to wind scale (the black arrow represents a wind speed of 5 m/s).

!
1014!
1015! !1016!
!!!!!
34!

35##
1017#1018#1019#1020#1021#1022#1023#1024#1025#1026##1027##1028#1029#1030#
####################1031#
Figure 12. A set of graphs showing a) the seasonal variability of filament events (in %) from SeaWiFS good data images in the period 1998–2006; b) seasonal time series of atmospheric freshwater fluxes (mm) in the period 1998-2006; c) the seasonal variability of the Volturno and Garigliano river discharges (m3/s) in the period 2001-2006; d) the mixed-layer depth (MLD) at the Long Term Ecological Research Station MareChiara (LTER-MC); e) the inter-annual variability of filament events (in %) from SeaWiFS good data images in the period 1998–2006; f) the inter- annual variability of atmospheric freshwater fluxes (mm) in the period 1998-2006; g) the inter- annual variability of the Volturno and Garigliano river discharge (m3/s) in the period 2001-2006; the inter-annual distribution for spring (April to June) of h) atmospheric freshwater fluxes (mm) and i) the Volturno and Garigliano river discharge.
#
1032#1033##1034#
Figure 13. The time series of wind speed (m/s) used as forcing in the model simulations; wind reversals at day 10 also shown.
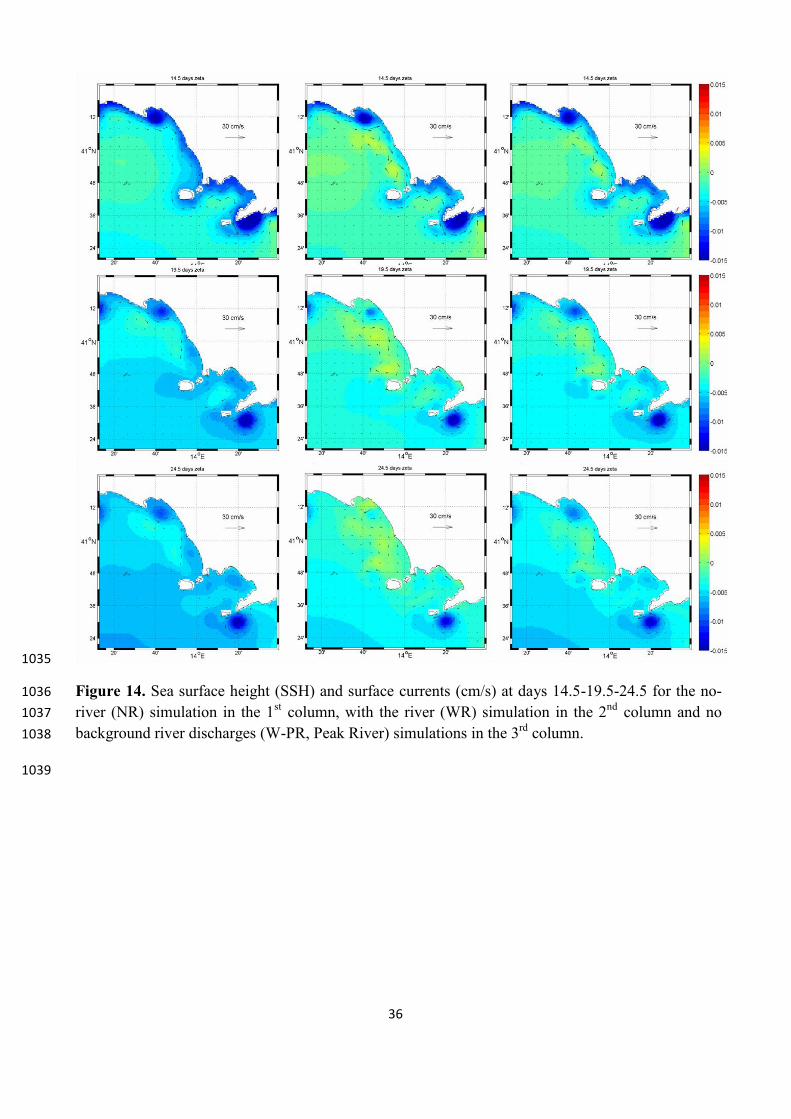
36##
############################################1035#
#1036#1037#1038##1039#
Figure 14. Sea surface height (SSH) and surface currents (cm/s) at days 14.5-19.5-24.5 for the no- river (NR) simulation in the 1st column, with the river (WR) simulation in the 2nd column and no background river discharges (W-PR, Peak River) simulations in the 3rd column.

37##
############################################1040##1041#1042#1043##1044#
##Figure 15. The passive tracer at days 14.5-19.5-24.5 for the no-river (NR) simulation in the 1st
column, with the river (WR) simulation in the 2nd column and the no background river discharges (W-PR, Peak River) simulations in the 3rd column.

38##
############################################1045#
#1046#1047#1048##1049#1050#
Figure 16. Scaled relative vorticity (ω/f) at days 14.5-19.5-24.5 for the no-river (NR) simulation in the 1st column, with the river (WR) simulation in the 2nd column and the no background river discharges (W-PR, Peak River) simulations in the 3rd column.
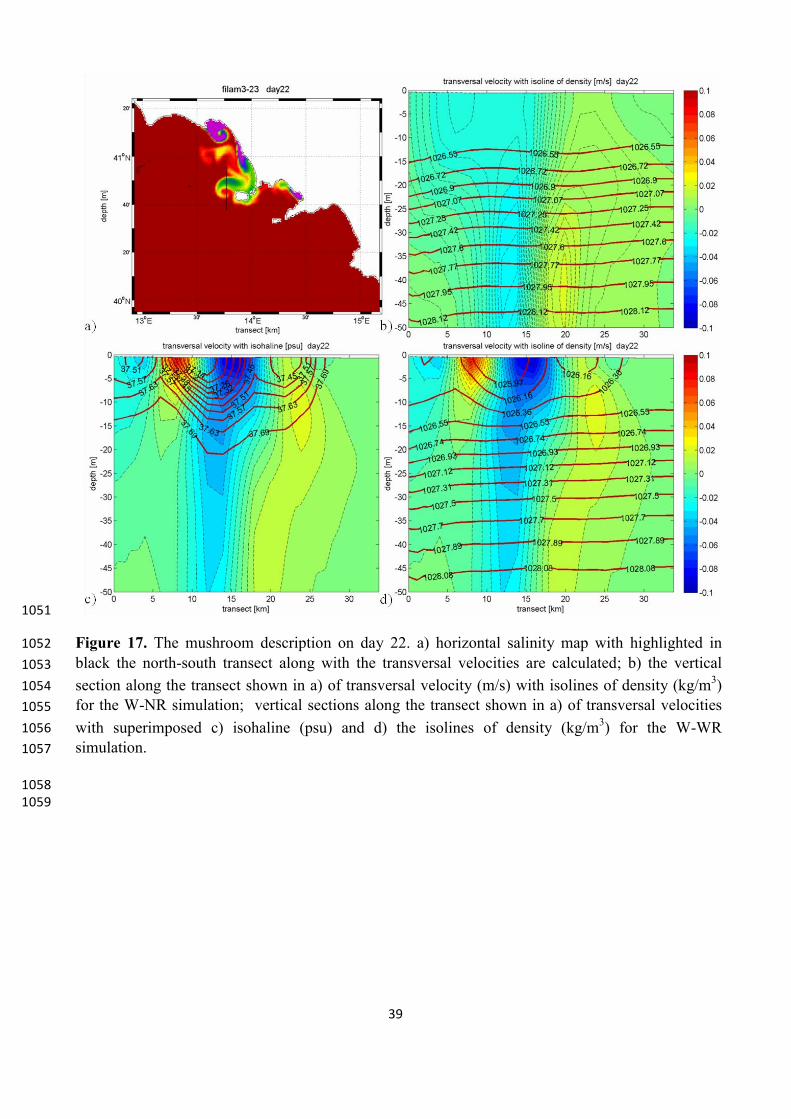
39##
########################################1051#
#1052#1053#1054#1055#1056#1057##1058#1059#
Figure 17. The mushroom description on day 22. a) horizontal salinity map with highlighted in black the north-south transect along with the transversal velocities are calculated; b) the vertical section along the transect shown in a) of transversal velocity (m/s) with isolines of density (kg/m3) for the W-NR simulation; vertical sections along the transect shown in a) of transversal velocities with superimposed c) isohaline (psu) and d) the isolines of density (kg/m3) for the W-WR simulation.

40##
############################################1060#
#1061#1062#1063##1064#
##Figure 18. The sea surface height (SSH) and surface currents (cm/s) at days 14.5-19.5-24.5 for the no-river (NR) simulation in the 1st column, with the river (WR) simulation in the 2nd column and the no background river discharges (W-PR, Peak River) simulations in the 3rd column.
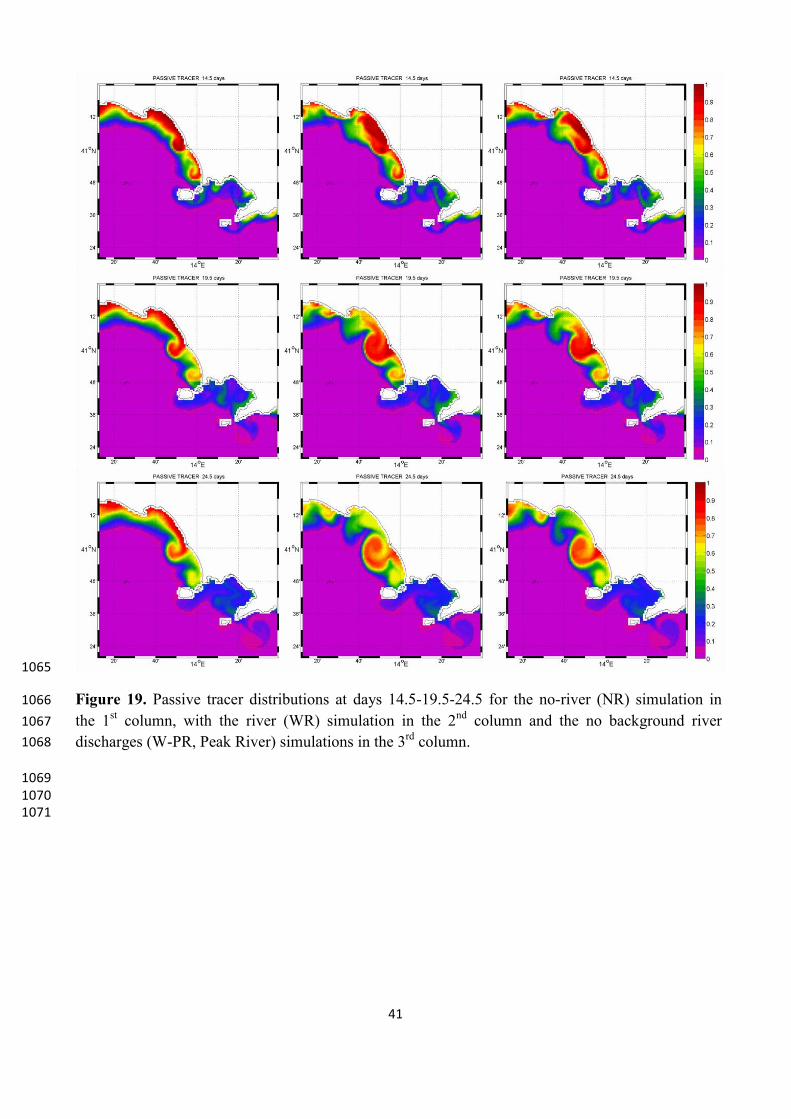
41##
############################################1065#
#1066#1067#1068##1069#1070#1071#
Figure 19. Passive tracer distributions at days 14.5-19.5-24.5 for the no-river (NR) simulation in the 1st column, with the river (WR) simulation in the 2nd column and the no background river discharges (W-PR, Peak River) simulations in the 3rd column.

42##
########################1072#
#1073#1074#1075##1076#1077#1078#1079#1080#1081#
##Figure 20. Two filament snapshots in K490 (m-1) satellite images of the South Tyrrhenian Sea with the daily wind direction and intensity (red arrow) with respect to the wind scale (the black arrow equals to 5 m/s) for 26 and 27 September 2000.
####Table 1. A summary of the idealised simulations. In the 1st column, the names of simulations; in the 2nd
column, the presence of river as only background value, only peak value or both; in the 3rd column, the wind direction; in the 4th column, the delay time τ of the river discharge peak with respect to the wind peak.

43#
#
Model simulation Rivers Wind τ (delay time of river discharge peak)
W-BR Background Westerly - W-WR -0 Yes Westerly 0 days W-WR -2 Yes Westerly 2 days W-WR -4 Yes Westerly 4 days W-WR -7 Yes Westerly 7 days NE-BR Background Northeasterly - NE-WR -0 Yes Northeasterly 0 days NE-WR -2 Yes Northeasterly 2 days NE-WR -4 Yes Northeasterly 4 days NE-WR -7 Yes Northeasterly 7 days W-NR - Westerly - NE-NR - Northeasterly - NW Yes - - W-PR Only peak Westerly 2 days NE-PR Only peak Northeasterly 2 days
1082