Collisional heating as the origin of filament emission in galaxy clusters
28
arXiv:0810.5372v1 [astro-ph] 29 Oct 2008 Mon. Not. R. Astron. Soc. 000, 1–27 () Printed 29 October 2008 (MN L A T E X style file v2.2) Collisional heating as the origin of filament emission in galaxy clusters ⋆ G.J. Ferland 1,2 †, A.C. Fabian 1 , N.A. Hatch 3 , R.M. Johnstone 1 , R.L. Porter 1,2 , P. A. M. van Hoof 4 and R.J.R. Williams 5 1 Institute of Astronomy, University of Cambridge, Madingley Road, Cambridge CB3 0HA 2 Department of Physics, University of Kentucky, Lexington, KY 40506, USA 3 Leiden Observatory, University of Leiden, P.B. 9513, Leiden 2300 RA, The Netherlands 4 Royal Observatory of Belgium, Ringlaan 3, 1180 Brussels, Belgium 5 AWE plc, Aldermaston, Reading RG7 4PR Received ABSTRACT It has long been known that photoionization, whether by starlight or other sources, has diffi- culty in accounting for the observed spectra of the optical filaments that often surround central galaxies in large clusters. This paper builds on the first of this series in which we examined whether heating by energetic particles or dissipative MHD wave can account for the observa- tions. The first paper focused on the molecular regions which produce strong H 2 and CO lines. Here we extend the calculations to include atomic and low-ionization regions. Two major im- provements to the previous calculations have been made. The model of the hydrogen atom, along with all elements of the H-like iso-electronic sequence, is now fully nl-resolved. This allows us to predict the hydrogen emission-line spectrum including excitation by suprathermal secondary electrons and thermal electrons or nuclei. We show how the predicted H I spectrum differs from the pure recombination case. The second update is to the rates for H 0 –H 2 inelas- tic collisions. We now use the values computed by Wrathmall et al. The rates are often much larger and allow the ro-vibrational H 2 level populations to achieve a thermal distribution at substantially lower densities than previously thought. We calculate the chemistry, ionization, temperature, gas pressure, and emission-line spec- trum for a wide range of gas densities and collisional heating rates. We assume that the fil- aments are magnetically confined. The gas is free to move along field lines so that the gas pressure is equal to that of the surrounding hot gas. A mix of clouds, some being dense and cold and others hot and tenuous, can exist. The observed spectrum will be the integrated emis- sion from clouds with different densities and temperatures but the same pressure P/k = nT . We assume that the gas filling factor is given by a power law in density. The power-law index, the only free parameter in this theory, is set by matching the observed intensities of IR H 2 lines relative to optical H I lines. We conclude that the filaments are heated by ionizing parti- cles, either conducted in from surrounding regions or produced in situ by processes related to MHD waves. Key words: galaxies: clusters: general – galaxies: clusters: individual: NGC 1275 – galaxies: clusters: individual: NGC 4696 – intergalactic medium – infrared: galaxies 1 INTRODUCTION The central galaxies in large clusters are frequently surrounded by a system of filaments that emit strong molecular, atomic, and low-ionization emission lines. Understanding the origin of this line emission has been a long-standing challenge (Johnstone et al 2007). The line luminosities are too great for the filaments to be powered by known sources of radiation such as the central AGN ⋆ Contains material c British Crown copyright 2008/MoD † E-mail: [email protected] or the diffuse emission from the surrounding hot gas. The evolu- tionary state of the gas is totally unknown. Two possibilities are that they form from surrounding hot gas or by ejection from the central galaxy in the cluster. Star formation may occur in the fila- ments although the emission-line spectra do not resemble those of Galactic H II regions near early-type stars. Questions concerning the origin, energy source, and evolutionary history are important, in part because of the large mass that may be involved, as high as ∼ 4 × 10 10 M ⊙ according to Salom´ e et al (2006). Infrared spectra show H 2 lines which are far stronger rela- tive to H I lines than those emitted by molecular gas near O stars. c RAS
Transcript of Collisional heating as the origin of filament emission in galaxy clusters

arX
iv:0
810.
5372
v1 [
astr
o-ph
] 29
Oct
200
8Mon. Not. R. Astron. Soc.000, 1–27 () Printed 29 October 2008 (MN LATEX style file v2.2)
Collisional heating as the origin of filament emission in galaxyclusters⋆
G.J. Ferland1,2†, A.C. Fabian1, N.A. Hatch3, R.M. Johnstone1,R.L. Porter1,2, P. A. M. van Hoof4 and R.J.R. Williams51Institute of Astronomy, University of Cambridge, Madingley Road, Cambridge CB3 0HA2Department of Physics, University of Kentucky, Lexington,KY 40506, USA3Leiden Observatory, University of Leiden, P.B. 9513, Leiden 2300 RA, The Netherlands4Royal Observatory of Belgium, Ringlaan 3, 1180 Brussels, Belgium5AWE plc, Aldermaston, Reading RG7 4PR
Received
ABSTRACTIt has long been known that photoionization, whether by starlight or other sources, has diffi-culty in accounting for the observed spectra of the optical filaments that often surround centralgalaxies in large clusters. This paper builds on the first of this series in which we examinedwhether heating by energetic particles or dissipative MHD wave can account for the observa-tions. The first paper focused on the molecular regions whichproduce strong H2 and CO lines.Here we extend the calculations to include atomic and low-ionization regions. Two major im-provements to the previous calculations have been made. Themodel of the hydrogen atom,along with all elements of the H-like iso-electronic sequence, is now fullynl-resolved. Thisallows us to predict the hydrogen emission-line spectrum including excitation by suprathermalsecondary electrons and thermal electrons or nuclei. We show how the predicted HI spectrumdiffers from the pure recombination case. The second updateis to the rates for H0 – H2 inelas-tic collisions. We now use the values computed by Wrathmall et al. The rates are often muchlarger and allow the ro-vibrational H2 level populations to achieve a thermal distribution atsubstantially lower densities than previously thought.
We calculate the chemistry, ionization, temperature, gas pressure, and emission-line spec-trum for a wide range of gas densities and collisional heating rates. We assume that the fil-aments are magnetically confined. The gas is free to move along field lines so that the gaspressure is equal to that of the surrounding hot gas. A mix of clouds, some being dense andcold and others hot and tenuous, can exist. The observed spectrum will be the integrated emis-sion from clouds with different densities and temperaturesbut the same pressureP/k = nT.We assume that the gas filling factor is given by a power law in density. The power-law index,the only free parameter in this theory, is set by matching theobserved intensities of IR H2lines relative to optical HI lines. We conclude that the filaments are heated by ionizing parti-cles, either conducted in from surrounding regions or producedin situby processes related toMHD waves.
Key words: galaxies: clusters: general – galaxies: clusters: individual: NGC 1275 – galaxies:clusters: individual: NGC 4696 – intergalactic medium – infrared: galaxies
1 INTRODUCTION
The central galaxies in large clusters are frequently surroundedby a system of filaments that emit strong molecular, atomic, andlow-ionization emission lines. Understanding the origin of thisline emission has been a long-standing challenge (Johnstone et al2007). The line luminosities are too great for the filaments to bepowered by known sources of radiation such as the central AGN
⋆ Contains materialc© British Crown copyright 2008/MoD† E-mail: [email protected]
or the diffuse emission from the surrounding hot gas. The evolu-tionary state of the gas is totally unknown. Two possibilities arethat they form from surrounding hot gas or by ejection from thecentral galaxy in the cluster. Star formation may occur in the fila-ments although the emission-line spectra do not resemble those ofGalactic H II regions near early-type stars. Questions concerningthe origin, energy source, and evolutionary history are important,in part because of the large mass that may be involved, as highas∼ 4×10¹⁰ M⊙ according to Salome et al (2006).
Infrared spectra show H2 lines which are far stronger rela-tive to H I lines than those emitted by molecular gas near O stars.
c© RAS

2 G.J. Ferland et al.
Attempts at reproducing the spectra assuming starlight photoion-ization are largely unsuccessful, as reviewed by Johnstoneet al(2007). Hybrid models, in which starlight produces the opticalemission while other energy sources produce the molecular emis-sion, appear necessary. The fact that optical and molecularemissionluminosities trace one another (Jaffe et al 2005) would require thatthese independent energy sources have correlated luminosities.
Since photoionization by O and B stars does not appear ableto account for the spectrum, Paper 1 (Ferland et al 2008) consid-ered whether purely collisional heating sources can reproduce theobserved spectrum. Magnetic fields occur in the environmentandwave energy is likely to be associated with the field. Dissipation ofthis wave energy could heat the gas. Cosmic rays are also present(Sanders & Fabian 2007). These would heat and ionize the gas andproduce strong low-ionization emission. MHD waves may alsoac-celerate low-energy cosmic rays within a filament. Similar particleand wave processes occur in stellar coronae where they are collec-tively referred to as non-radiative energy sources, a term we shalluse in the remainder of this paper.
Paper 1 focused on H2 lines produced in molecular regionsthat are well shielded from light. Johnstone et al (2007) detectedH2 lines with a wide range of excitation potential and found a cor-relation between excitation and the derived population temperature.We found that non-radiative heating with a range of heating ratescan reproduce the observed H2 spectrum. In this paper we con-centrate on atomic and low-ionization emission and developthemethodology needed to predict the spectrum of gas with a range ofdensities but a single gas pressure. We find that cosmic-ray heatingproduces a spectrum that is in general agreement with a wide rangeof observations. Purely thermalized energy injection cannot repro-duce the spectrum. This does not rule out MHD wave heating butdoes require that they produce or accelerate high-energy particlesin addition to other forms of energy. The resulting model, whileempirical, points the way for a physical model of the origin of thefilament emission.
2 SPECTRAL SIMULATIONS
2.1 The basic model
Starlight photoionization has long been known to have difficultyin reproducing observations of cluster filaments. Hybrid models, inwhich different energy sources produce the molecular and atomicemission are more successful but have problems accounting forwhy different energy sources would correlate with one another.Here we assume thatonly non-radiative heating, by either cosmicrays or dissipative MHD waves is important. The entire spectrumis produced by these energy sources.
For simplicity we assume that the gas is well shielded fromsignificant sources of radiative heating. In reality light from thecentral galaxy or the surrounding hot gas will photoionize athinskin on the surface of a cloud but will have little effect on the ma-jority of the cloud’s core. The emission lines emitted by theionizedlayer will be faint. In the calculations that follow we include themetagalactic radiation background, including the CMB, so that thecontinuum is fully defined from the gamma-ray through the radio.As described in Paper 1 this external continuum is extinguishedby a cold neutral absorber with a column density of 1021 cm−2 toapproximate the radiation field deep within the filaments. This con-tinuum is faint enough to have little effect on the predictions in thispaper.
Table 1. Assumed gas-phase abundances by log nucleon number density[cm−3] relative to hydrogen.
He −1.022 Li −10.268 Be −20.000B −10.051 C −3.523 N −4.155O −3.398 F −20.000 Ne −4.222Na −6.523 Mg −5.523 Al −6.699Si −5.398 P −6.796 S −5.000Cl −7.000 Ar −5.523 K −7.959Ca −7.699 Sc −20.000 Ti −9.237V −10.000 Cr −8.000 Mn −7.638Fe −5.523 Co −20.000 Ni −7.000Cu −8.824 Zn −7.6990
In keeping with our assumption that the regions we model arewell shielded, resonance lines such as the Lyman lines of HI or theLyman-Werner electronic systems of H2 are assumed to be opti-cally thick. Because of this continuum fluorescent excitation of H0
and H2 does not occur. With these assumptions the conditions in thecloud are mainly determined by the non-radiative heating sourceswhich are the novel aspect of this work.
For simplicity we assume that the chemical composition isthe same as the Local ISM. The detailed gas-phase abundancesarebased on emission-line observations of the Orion star-forming en-vironment and are given in Table 1. A Galactic dust-to-gas ratio isassumed. Refractory elements are depleted from the gas phase inkeeping with our assumption that dust is present.
Grains have several effects on the gas. H2 forms by catalyticreactions on grain surfaces in dusty environments. Collisions be-tween gas and dust tend to bring them to the same temperature.This process either heats or cools the gas depending on whether thegrain temperature is above or below the gas temperature. Moleculescan condense as ices coating the grains if the dust becomes coldenough. Each of these processes is considered in detail in Cloudy,the spectral synthesis code we use here, but the underlying graintheory depends on knowing the grain material, its size distribution,and the dust to gas ratio. The grain temperature depends on theUV–IR radiation field within the core, which in turn depends onwhetherin situ star formation has occurred. Rather than introduceall of these as additional free parameters we simply adopt the grainH2 catalysis rate measured in the Galactic ISM (Jura 1975). We donot consider grain-gas energy exchange and neglect condensationsof molecules onto grain ices. Tests show that these assumptionsmainly affect the details of the H0 – H2 transition. One goal of ourwork is to develop a physical model that accounts for the spectralobservations. A long-term goal is to use such a model to determinethe grain properties from observations of line extinction and theinfrared continuum.
Substantial uncertainties are introduced by the need to assumea specific gas-phase composition and dust properties. It would besurprising if the gas and dust composition happened to matchthatof the local ISM, although it would also be surprising if it weregreatly different. The molecular collision rates, described in Sec-tion 2.4, have their own substantial uncertainties, probably 0.3 dexor more. These considerations suggest that there is roughlya factor-of-two uncertainty in the results we present below. This is intendedas a ‘proof of concept’ calculation aimed at identifying what phys-ical processes may power the observed emission. If successful, wecan then invert the problem and determine the composition orevo-lutionary history from the spectrum.
c© RAS, MNRAS000, 1–27

Collisional heating of cool cluster filaments 3
2.2 Non-radiative energy sources
Paper 1 considered two cases, heating by dissipative MHD waveenergy, which we assumed to be deposited as thermal energy, andcosmic rays, which both heat and ionize the gas. We refer to theseas the ‘extra heating’ and ‘cosmic ray’ cases below. The effects ofthese energy sources on the microphysics are fundamentallydiffer-ent.
Supersonic line widths, often thought to be due to MHD wavesassociated with the magnetic field, are observed in the ISM ofourgalaxy (Dyson & Williams 1997). The field and wave kinetic en-ergy are often in rough energy equipartition (Myers & Goodman1998) although the details remain uncertain. Heiles & Crutcher(2005) review the extensive numerical simulations of MHD waves.Waves can be damped by processes such as ion-neutral drift,which convert wave energy into other forms of kinetic energy, al-though the details are uncertain and the process may be unstable(Tytarenko et al 2002). In this exploratory work we simply want toquantify the effects of such heating on otherwise well-shielded gas.We adopt a heating rate that is proportional to density,
H = H0 [n(H)/n0] [erg cm−3 s−1]. (1)
This form, modified from that used in Paper 1, includes the ratio ofthe hydrogen densityn(H) to a scale densityn0 which we take as1cm−3. This density dependence causes the wave-heating rate togo to zero as the gas density goes to zero.
We parameterize the extra heating rate as the leading coeffi-cient in the heating rateH0. We assume that the heating simplyadds to the thermal energy of the gas so that the velocity distribu-tion remains a Maxwellian with a well-defined kinetic temperature.With these assumptions the only collisional processes which occurare those which are energetically possible at the local gas kinetictemperature. This is a major distinction between the extra-heatingcase and the cosmic-ray case described next.
The second case we consider is energy deposition by ioniz-ing particles. These particles could be related to the high-energyparticles which are known to exist in the hot gas surroundingthefilaments (Sanders & Fabian 2007), or could be caused by MHD-related phenomena like magnetic reconnection (Lazarian 2005).Whatever their fundamental source we will refer to this as thecosmic-ray case for simplicity. As in Paper 1 we specify the ion-izing particle density in terms of the equivalent cosmic-ray den-sity relative to the Galactic background. We adopt the backgroundcosmic ray H2 dissociation rate of 3× 10⁻¹⁷ s−1 (Williams et al1998). Sanders & Fabian (2007) find an electron energy densitythat is roughly 103 times the galactic background in inner regionsof the Perseus cluster. This value guided our choice of the range ofcosmic-ray densities shown in the calculations which follow.
There is some evidence that this Galactic background cosmicray H2 dissociation rate may be substantially too low. Shaw et al(2008) found a cosmic-ray ionization rate forty times higheralong the sight line to Zeta Per from detailed modeling whileIndriolo et al (2007) derived a value ten times higher from thechemistry of H+3 along fourteen different sight lines. If these newer,substantially higher, Galactic background rates are accepted as typ-ical then the ratio of the cosmic ray rate to the Galactic backgroundgiven below would be reduced by about an order of magnitude. Thisis clearly an area of active research (Dalgarno 1996). We adopt theGalactic cosmic-ray background quoted in Paper 1 for consistencywith that work. We will express the particle ionization ratein termsof the Galactic cosmic ray background rate.
Cosmic rays both heat and ionize the emitting gas. Their inter-
actions with low-density gas are described in Spitzer & Tomasko(1968), Ferland & Mushotzky (1984), Osterbrock & Ferland(2006), Xu & McCray (1991), Xu & McCray (1991),Dalgarno et al (1999), Tine et al (1997), and many more pa-pers. Abel et al (2005) describe our implementation of this physicsin the current version of Cloudy. Briefly, if the gas is ionized (theelectron fractionne/nH > 0.9) cosmic rays give most of theirenergy to free electrons which are then thermalized by elasticcollisions with other electrons. In this highly-ionized limit cosmicrays mainly heat the gas. In neutral gas, with low electron fraction,some of the cosmic-ray energy goes into heating the gas but muchgoes into the creation of a population of suprathermal secondaryelectrons. These secondaries cause direct ionization as well asexcitation of UV resonance lines. These excitation and ionizationrates depend on the cosmic-ray density and the electron fractionbut not on the kinetic temperature of the thermal gas.
These two cases behave quite differently in the cold molec-ular limit and in the nature of the transition from the molecularto atomic and ionized states. In a cosmic-ray energized gas thesuprathermal secondary electrons will cause ionization and exciteresonance lines even when the gas is quite cold. As the cosmic-raydensity is increased the transition from the fully molecular limitto the atomic or ionized states is gradual since the ionization rate,in the low electron-fraction limit, is proportional to the cosmic-raydensity and has little dependence on temperature. Thus a very coldcosmic-ray energized gas will have a significant level of ioniza-tion, dissociation, and excitation of the HI, He I, and H2 resonancetransitions. The UV lines, being optically thick in a well-shieldedmedium, undergo multiple scatterings with most lines beingab-sorbed by dust or gas. Some emission in infrared and optical sub-ordinate lines, and in ro-vibrational transitions in the ground elec-tronic state of H2, occurs.
In the extra-heating case the thermal gas has a single kinetictemperature. As the extra-heating rate increases the temperaturerises but the gas remains fully molecular until the kinetic temper-ature rises to the point where dissociation is energetically possi-ble. The transition from molecular to atomic phase occurs abruptlywhen the gas kinetic temperature approaches the H2 dissociationenergy. The gas will be in one of three distinct phases, with es-sentially all H in the form of H2, H0, or H+. As the heating rateand kinetic temperature increase the gas will go from one form toanother in abrupt transitions which occur where the temperaturereaches the appropriate value.
These two models mainly differ in how energy is deposited inmolecular or atomic gas. The energy of a cosmic ray will eventuallyappear as heat, internal excitation, or as an ionizing particle, whilein the wave-heating case the energy deposition is purely as heat.The cosmic-ray case does not exclude MHD effects as the funda-mental energy source since MHD waves can produce low-energycosmic rays within a filament (Lazarian 2005).
2.3 A fully l-resolved H-like iso-sequence
The calculations presented here use version C08.00 of the spec-tral synthesis code Cloudy, last described by Ferland et al (1998).There have been several improvements to the simulations since Pa-per 1. These are described next.
The hydrogen recombination spectrum is special because itcan be predicted with great precision. Two of the most importantrates, radiative recombination and transition probabilities betweenbound levels, are known to a precision of several percent. Ifthe H I
lines form by recombination in an ionized gas that is optically thick
c© RAS, MNRAS000, 1–27

4 G.J. Ferland et al.
in the Lyman continuum then the emission-line spectrum should beclose to Case B of Baker & Menzel (1938). Collisional excitationof excited levels from the ground state of H0 are a complicationsince their contribution to the observed HI spectrum depends ondensity, temperature, and ionization in ways that are fundamentallydifferent from the recombination Case B.
The computed HI emission-line spectrum presented here isthe result of a full calculation of the formation of the lines, in-cluding radiative and three-body recombination, collisional ioniza-tion, collisional coupling betweennl terms, and spontaneous andinduced transitions between levels. For much of its historyCloudyhas used the compact model of the H-like iso sequence describedby Ferguson & Ferland (1997) with the rate formalism described byFerland & Rees (1988). That model resolved the 2s and 2p levelsbut assumed thatl-terms within higher-n configurations were popu-lated according to their statistical weights. This is formally correctonly at high densities. Various approximations were introduced toallow the model to work well in the low-density limit.
Our treatment of the entire He-like iso-electronic sequencewas recently enhanced to resolve any number ofnl levels, resultingin a far better representation of the physics of the resulting emis-sion. Applications to He I are discussed by Porter et al (2005) whilePorter & Ferland (2007) describe ions of the He-like sequence.This same methodology has now been applied to the H-like isosequence. Levels can now be fullyl-resolved and any number canbe considered. The methods used to calculate rates forl-changingcollisions are given in Porter et al (2005).
A very large number of levels, and resulting high precision,were used in Porter et al (2005). The was possible because of theoverall simplicity of that study. The temperature and electron den-sity were specified so a single calculation of the level populationswas sufficient to obtain the HeI spectrum. The calculations pre-sented below self-consistently solve for the temperature,ionization,and chemistry, which requires that the model atom be reevaluateda very large number of times for each point in the cloud. An in-termediate model must be adopted with a small enough number oflevels to make the problem solvable with today’s computers but yetexpandable to have more levels and become more accurate whenmore power becomes available or high precision is needed. A hy-brid approach was chosen. The lowestn’ configurations arenl re-solved. They are supplemented with anothern” configurations, re-ferred to as collapsed levels, which do not resolve thenl terms.The number of resolved and collapsed levels can be adjusted with atradeoff between accuracy and speed. In the following calculationslevelsn 6 15 arenl resolved with another ten collapsed levels rep-resenting higher states. This is sufficient to achieve a convergenceaccuracy of better than 2% for the HI lines we predict. Larger er-rors are introduced by uncertainties in the collisional rates. Theseare difficult to quantify but probably produce errors of∼ 20% inthe line emissivities and∼ 5% in relative intensities of HI lines.
Resolving thenl terms makes it possible to predict the de-tailed effects of thermal and cosmic-ray excitation of optical andinfrared H I lines because the resulting emission spectrum is sen-sitive to the precisenl populations. High-energy particles willmainly excitenp levels from the ground 1s term because mostatoms are in the ground state and electric-dipole allowed transi-tions have larger collisional excitation cross sections athigh ener-gies (Spitzer & Tomasko 1968). After excitation, thenp level willdecay to a variety of lowers or d terms because of selection rulesfor optically-allowed transitions. The HI Lyman lines are assumedto be optically thick so thatnp→1s transitions scatter often enoughto be degraded into Balmer lines plus Lα. The resulting Lα pho-
tons will largely be absorbed by grains rather than emerge from thecloud.
State-specific cosmic-ray excitation rates tonp from groundare derived from the Born approximation. This is appropriate due tothe high energy of a typical secondary electron (Spitzer & Tomasko1968). The theory described in Abel et al (2005) and Shaw et al(2008) is used to derive a secondary excitation rate of Lα, qsec
1s→2p.The secondary excitation rate of any permitted line,qsec
E1 is given interms of the Lα rate by
qsecE1 = qsec
1s→2p
(
g fE1
g f1s→2p
)(
ε1s→2p
εE1
)
cm3 s−1 (2)
where ε is the energy of the transition andg f is its oscillatorstrength (Shemansky et al 1985).
Quantal calculations of collisional excitation rates for exci-tation of nl terms by thermal electrons are used (Anderson et al2000). There is no favored finall term, another distinction betweenthe cosmic ray and extra heating case. Details of the resulting opti-cal and infrared HI emission will be discussed below.
2.4 Revised H –H2 collision rates
The rates for collisions between H and H2 have been updated fromthose used in Shaw et al (2005). We had used the fits given byLe Bourlot et al (1999) in Paper 1. Allers et al (2005) noted thatobservations of H2 emission from the Orion Bar suggested thatthese rates were two small by nearly 2 dex. Wrathmall et al (2007)confirmed this and presented a new set of collisional rate coeffi-cients using an improved interaction potential and scattering theory.These rate coefficients for excited vibrational levels are systemati-cally larger, often by 2 to 3 dex. These rates are employed in thiswork.
The critical density of a level is the density wereradiative and collisional deexcitation are equally probable(Osterbrock & Ferland 2006). The total radiative rate out ofleveli, Ai , is the sum of the transition probabilities out of the level,Ai = ∑
l<iAi,l . If the total deexcitation rate [s−1] due to collisions
with speciesSwith densityn(S) is n(S)qi = ∑l<i
n(S)qi,l , whereqi,l
is the collisional deexcitation rate coefficient (units cm3 s−1), thenthe critical density of a molecule in leveli colliding with speciesSis given by
n(S, i) = Ai/qi = ∑l<i
Ai,l
/
∑l<i
qi,l (3)
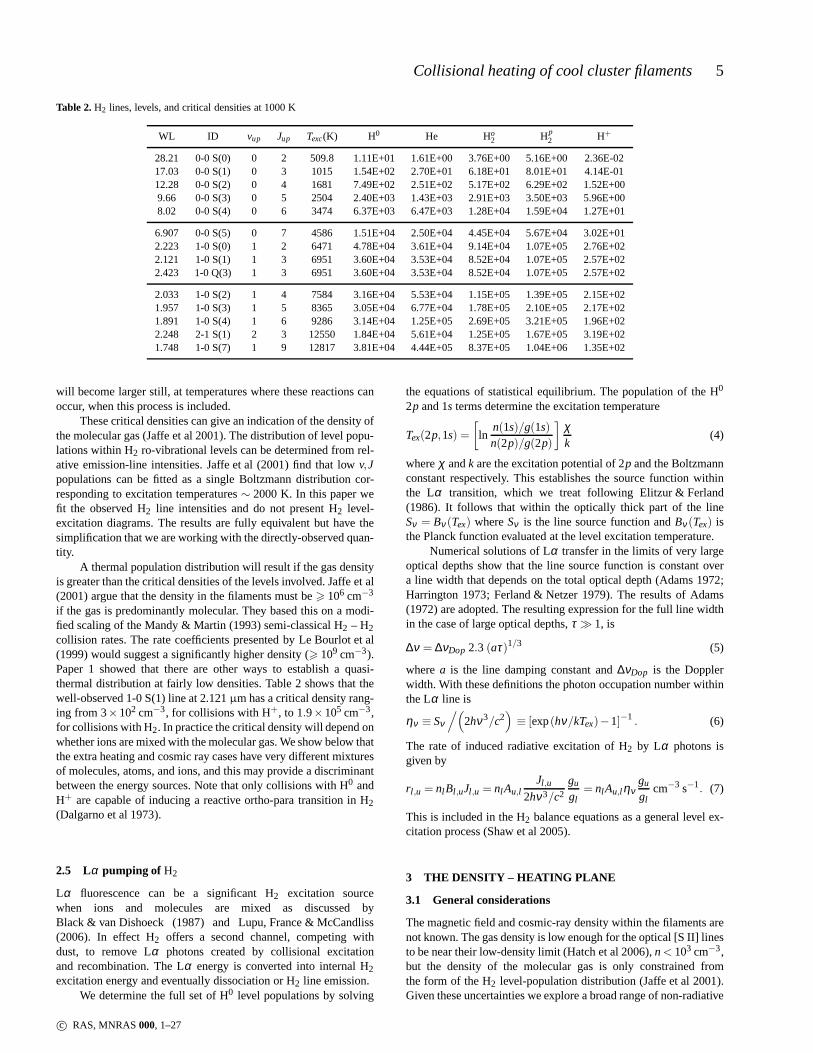
The large increase in the H0 – H2 collision rate coefficients forvibrationally-excited levels in the new data lowers the critical den-sities of most levels by a large amount. Table 2 gives critical den-sities for the upper levels of the H2 lines analyzed in this pa-per. The rates are evaluated at 1000 K, a typical H2 temperature.Each collider considered in our calculations is listed. This tableshould be compared with Table 1 of Le Bourlot et al (1999) orSternberg & Dalgarno (1989). Our critical densities are substan-tially smaller. This means that a Boltzmann level population dis-tribution will be established at considerably lower densities thanwas previously thought necessary.
There is likely to be a substantial uncertainty in all molecularcollision rates. This is partially because molecular collisions arecomplicated many-body problems. The current H0 - H2 rates, whilesometimes substantially larger than the previously published set, donot yet include reactive channels (Wrathmall et al 2007). The rates
c© RAS, MNRAS000, 1–27
Collisional heating of cool cluster filaments 5
Table 2.H2 lines, levels, and critical densities at 1000 K
WL ID vup Jup Texc(K) H0 He Ho2 Hp
2 H+
28.21 0-0 S(0) 0 2 509.8 1.11E+01 1.61E+00 3.76E+00 5.16E+002.36E-0217.03 0-0 S(1) 0 3 1015 1.54E+02 2.70E+01 6.18E+01 8.01E+01 4.14E-0112.28 0-0 S(2) 0 4 1681 7.49E+02 2.51E+02 5.17E+02 6.29E+02 1.52E+009.66 0-0 S(3) 0 5 2504 2.40E+03 1.43E+03 2.91E+03 3.50E+03 5.96E+008.02 0-0 S(4) 0 6 3474 6.37E+03 6.47E+03 1.28E+04 1.59E+04 1.27E+01
6.907 0-0 S(5) 0 7 4586 1.51E+04 2.50E+04 4.45E+04 5.67E+04 3.02E+012.223 1-0 S(0) 1 2 6471 4.78E+04 3.61E+04 9.14E+04 1.07E+05 2.76E+022.121 1-0 S(1) 1 3 6951 3.60E+04 3.53E+04 8.52E+04 1.07E+05 2.57E+022.423 1-0 Q(3) 1 3 6951 3.60E+04 3.53E+04 8.52E+04 1.07E+05 2.57E+02
2.033 1-0 S(2) 1 4 7584 3.16E+04 5.53E+04 1.15E+05 1.39E+05 2.15E+021.957 1-0 S(3) 1 5 8365 3.05E+04 6.77E+04 1.78E+05 2.10E+05 2.17E+021.891 1-0 S(4) 1 6 9286 3.14E+04 1.25E+05 2.69E+05 3.21E+05 1.96E+022.248 2-1 S(1) 2 3 12550 1.84E+04 5.61E+04 1.25E+05 1.67E+053.19E+021.748 1-0 S(7) 1 9 12817 3.81E+04 4.44E+05 8.37E+05 1.04E+061.35E+02
will become larger still, at temperatures where these reactions canoccur, when this process is included.
These critical densities can give an indication of the density ofthe molecular gas (Jaffe et al 2001). The distribution of level popu-lations within H2 ro-vibrational levels can be determined from rel-ative emission-line intensities. Jaffe et al (2001) find that low v,Jpopulations can be fitted as a single Boltzmann distributioncor-responding to excitation temperatures∼ 2000 K. In this paper wefit the observed H2 line intensities and do not present H2 level-excitation diagrams. The results are fully equivalent but have thesimplification that we are working with the directly-observed quan-tity.
A thermal population distribution will result if the gas densityis greater than the critical densities of the levels involved. Jaffe et al(2001) argue that the density in the filaments must be> 106 cm−3
if the gas is predominantly molecular. They based this on a modi-fied scaling of the Mandy & Martin (1993) semi-classical H2 – H2collision rates. The rate coefficients presented by Le Bourlot et al(1999) would suggest a significantly higher density (> 109 cm−3).Paper 1 showed that there are other ways to establish a quasi-thermal distribution at fairly low densities. Table 2 showsthat thewell-observed 1-0 S(1) line at 2.121µm has a critical density rang-ing from 3×102 cm−3, for collisions with H+, to 1.9×105 cm−3,for collisions with H2. In practice the critical density will depend onwhether ions are mixed with the molecular gas. We show below thatthe extra heating and cosmic ray cases have very different mixturesof molecules, atoms, and ions, and this may provide a discriminantbetween the energy sources. Note that only collisions with H0 andH+ are capable of inducing a reactive ortho-para transition inH2(Dalgarno et al 1973).
2.5 Lα pumping of H2
Lα fluorescence can be a significant H2 excitation sourcewhen ions and molecules are mixed as discussed byBlack & van Dishoeck (1987) and Lupu, France & McCandliss(2006). In effect H2 offers a second channel, competing withdust, to remove Lα photons created by collisional excitationand recombination. The Lα energy is converted into internal H2excitation energy and eventually dissociation or H2 line emission.
We determine the full set of H0 level populations by solving
the equations of statistical equilibrium. The population of the H0
2p and 1s terms determine the excitation temperature
Tex(2p,1s) =
[
lnn(1s)/g(1s)n(2p)/g(2p)
]
χk
(4)
whereχ andk are the excitation potential of 2p and the Boltzmannconstant respectively. This establishes the source function withinthe Lα transition, which we treat following Elitzur & Ferland(1986). It follows that within the optically thick part of the lineSν = Bν (Tex) whereSν is the line source function andBν (Tex) isthe Planck function evaluated at the level excitation temperature.
Numerical solutions of Lα transfer in the limits of very largeoptical depths show that the line source function is constant overa line width that depends on the total optical depth (Adams 1972;Harrington 1973; Ferland & Netzer 1979). The results of Adams(1972) are adopted. The resulting expression for the full line widthin the case of large optical depths,τ ≫ 1, is
∆ν = ∆νDop 2.3 (aτ)1/3 (5)
wherea is the line damping constant and∆νDop is the Dopplerwidth. With these definitions the photon occupation number withinthe Lα line is
ην ≡ Sν/(
2hν3/c2)
≡ [exp(hν/kTex)−1]−1 . (6)
The rate of induced radiative excitation of H2 by Lα photons isgiven by
r l ,u = nl Bl ,uJl ,u = nl Au,lJl ,u
2hν3/c2gu
gl= nl Au,l ην
gu
glcm−3 s−1. (7)
This is included in the H2 balance equations as a general level ex-citation process (Shaw et al 2005).
3 THE DENSITY – HEATING PLANE
3.1 General considerations
The magnetic field and cosmic-ray density within the filaments arenot known. The gas density is low enough for the optical [S II]linesto be near their low-density limit (Hatch et al 2006),n< 103 cm−3,but the density of the molecular gas is only constrained fromthe form of the H2 level-population distribution (Jaffe et al 2001).Given these uncertainties we explore a broad range of non-radiative
c© RAS, MNRAS000, 1–27

6 G.J. Ferland et al.
heating rates and gas densities, compute the thermal and chemicalstate of the gas, and predict the resulting emission-line spectrum tocompare with observations. Results are presented below as aseriesof contour diagrams showing various predictions.
The non-radiative energy sources are the dominant heatingagents for most conditions shown here. For the very lowest val-ues of the heating rates the background metagalactic radiation field,described above, becomes significant. The resulting emission willbe unobservably faint in this limit, however, as shown in diagramsbelow and in Paper1.
Figure 1 shows the gas kinetic temperature, Figure 2 showsthe hydrogen molecular fraction, and Figure 3 shows the fractionof H in H+. In all pairs of figures the upper and lower panels showthe cosmic ray and extra-heating cases respectively.
An ‘effective’ ionization parameter, given by the ratio of thenon-radiative heating to the gas densityunr = rnr/n(H), character-izes physical conditions in these environments. The non-radiativeheating acts to heat and ionize the gas, while cooling and recombi-nation processes are often two-body processes which increase withdensity. The ionization and temperature tend to increase with unr
along a diagonal running from low heating and high density, thelower right corner, to high heating and low density, the upper leftcorner. The temperature and molecular fractions tend to changealong diagonals from the lower left to upper right corners. Theseare along lines of roughly constantunr .
The lower right and upper left corners of the plane have themost extreme conditions. Gas is cold and molecular in the lowerleft high density, low heating, corner. The kinetic temperature hasfallen to nearly that of the CMB in this region. A small degreeofionization is maintained by background light or cosmic rays. This isto be contrasted with gas in the upper left high-heating, low-density,corner. That gas is hot, withT ≫ 104 K, and highly ionized. Gasin either region would emit little visible/IR light and so would bedifficult to detect.
3.2 TheH2 emission spectrum
Paper 1 described the H2 emission spectrum in some detail. Al-though the detailed predictions have changed due to the improvedcollisional rate coefficients used in this paper, the overall trends ofH2 emission shown in that paper have remained the same.
The full H2 spectrum is presented below. Here we concentrateon the H2 0-0 S(2)λ12.28µm line which we will combine withoptical H I lines to set constraints on our simulations. The log ofthe emissivity 4π j (erg cm−3 s−1) of the H2 line is shown in Fig-ure 4. H2 emission occurs within regions where the H2 molecularfraction, shown in Figure 2, is significant. Other factors besides theH2 density determine the line’s brightness.
The emissivity of an H2 line that is excited by thermal colli-sions is proportional to
4π j (H2) ∝ n(H2)nSexp(−χ/kT) (8)
wherenS is the density of all colliders andχ is the excitation po-tential of the upper level of the transition. Higher temperatures andH2 densities tend to make the line more emissive. Figures 1 and2 show thatn(H2) andT are anti-correlated. From this result, to-gether with the form of equation 8, it follows that there willbe aband of peak emission that runs from the upper right to lower leftin Figure 4. This is parallel to contours of constant temperature andmolecular fraction shown in Figures 1 and 2.
Theλ12.28µm line is a pure rotational transition with an levelexcitation energy of 1681 K. The line is excited by two processes
Figure 1. The log of the gas kinetic temperature is shown as a function ofthe hydrogen density, the independent variable, and (top panel) the cosmic-ray density relative to the Galactic background and (bottompanel) the lead-ing term in the extra-heating rate. The temperature is near the CMB in thelower right corner and rises along a diagonal from lower right to upper leftas the heating increases and the gas density decreases. There are discontin-uous jumps in the temperature as the gas changes thermal phase.
in our simulations. The line is emitted efficiently when the gas be-comes warm enough for thermal particles to collisionally excitethe upper level but not so warm as to dissociate the H2. This pro-duces the region of peak emission that tracks the contour givingT ∼ 2000 K in Figure 1.
The H2 line remains emissive in much cooler regions in thecosmic-ray case. Here suprathermal electrons excite the line by atwo-step mechanism that is analogous to the Solomon processinstarlight-excited PDRs. The first step is a suprathermal excitation
c© RAS, MNRAS000, 1–27
Collisional heating of cool cluster filaments 7
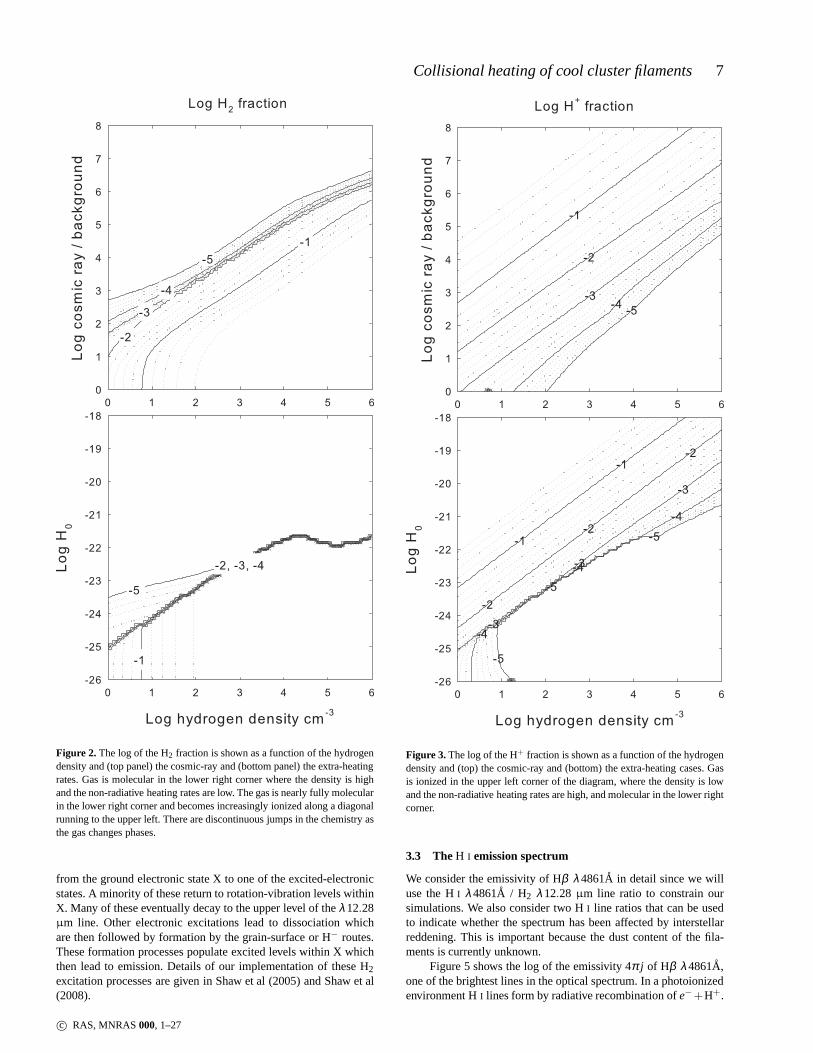
Figure 2. The log of the H2 fraction is shown as a function of the hydrogendensity and (top panel) the cosmic-ray and (bottom panel) the extra-heatingrates. Gas is molecular in the lower right corner where the density is highand the non-radiative heating rates are low. The gas is nearly fully molecularin the lower right corner and becomes increasingly ionized along a diagonalrunning to the upper left. There are discontinuous jumps in the chemistry asthe gas changes phases.
from the ground electronic state X to one of the excited-electronicstates. A minority of these return to rotation-vibration levels withinX. Many of these eventually decay to the upper level of theλ12.28µm line. Other electronic excitations lead to dissociation whichare then followed by formation by the grain-surface or H− routes.These formation processes populate excited levels within Xwhichthen lead to emission. Details of our implementation of these H2excitation processes are given in Shaw et al (2005) and Shaw et al(2008).
Figure 3.The log of the H+ fraction is shown as a function of the hydrogendensity and (top) the cosmic-ray and (bottom) the extra-heating cases. Gasis ionized in the upper left corner of the diagram, where the density is lowand the non-radiative heating rates are high, and molecularin the lower rightcorner.
3.3 TheH I emission spectrum
We consider the emissivity of Hβ λ4861A in detail since we willuse the HI λ4861A / H2 λ12.28 µm line ratio to constrain oursimulations. We also consider two HI line ratios that can be usedto indicate whether the spectrum has been affected by interstellarreddening. This is important because the dust content of thefila-ments is currently unknown.
Figure 5 shows the log of the emissivity 4π j of Hβ λ4861A,one of the brightest lines in the optical spectrum. In a photoionizedenvironment HI lines form by radiative recombination ofe−+H+.
c© RAS, MNRAS000, 1–27

8 G.J. Ferland et al.
Figure 4. The log of the emissivity 4π j (erg cm−3 s−1) of the H2 0-0 S(2)12.28µm line is shown as a function of cloud parameters. This figure isto be contrasted with the next figure showing the HI line emissivity over asimilar range of parameters.
H I lines also form by recombination if the gas is collisionallyheated to a temperature so warm that nearly all H is ionized. Theemissivity of an HI recombination line is proportional to
4π j (H I) ∝ n(
H+)
neT−0.8 (9)
whereT is the gas kinetic temperature and the inverse temperaturedependence is a fit to recombination coefficients in the neighbor-hood of 104 K. H I recombination lines are emitted most efficientlyby gas that is dense, ionized, and cool.
H I lines can also form by collisional excitation in regionswhere H is mostly atomic. The gas must be warm enough to excitethe upper levels of the optical or IR HI lines, requiring a tempera-
Figure 5. The log of the emissivity 4π j (erg cm−3 s−1) of Hβ λ4861A isshown as a function of cloud parameters. This figure is to be contrasted withthose in Paper 1 which show the H2 line emissivity over a similar range ofparameters.
tureT > 4000 K, although collisional excitation is important at lowtemperatures in the cosmic ray case when suprathermal secondaryelectrons are present. The emissivity of a collisionally excited H I
line is proportional ton(H0)nx f (T) wheren(H0) is the atomic hy-drogen density, mostly in the ground state, andnx is the density ofthe colliding species. The functionf (T) is the Boltzmann factor ofthe upper level of the HI line for the case of excitation by thermalparticles and is a constant for excitation by secondary electrons.Collisionally excited HI lines are emitted most efficiently by gasthat is dense, atomic, and warm.
The extra heat case is relatively simple since only thermal pro-cesses affect the excitation and ionization of the gas. The lower
c© RAS, MNRAS000, 1–27

Collisional heating of cool cluster filaments 9
panel of Figure 5 shows that the line has a ridge of relativelyhighemissivity which corresponds to moderate ionization and tempera-ture. The HI lines along this ridge are mainly produced by colli-sional excitation with a contribution from recombination followingcollisional ionization. The emission falls off dramatically when thegas becomes molecular in the lower right corner or very hot intheupper left corner.
Figure 5 shows the Hβ emissivity in the cosmic-ray case. Col-lisional excitation is also a dominant contributor to the line. Theridge of peak emission occurs for the same reason as in the ex-tra heating case. Significant HI emission occurs in the lower rightcorner since the dissociative cosmic rays prevent the gas from be-coming fully molecular even when it is quite cold. The populationof secondary electrons produces a significant collisional excitationcontribution to the HI lines across most of the lower right half ofFigure 5.
In both heating cases the emissivity tends to rise along a diag-onal from the lower left to upper right. This corresponds to risingnenp at nearly constantT. This figure clearly indicates that power-ful selection effects operate in this environment. As we show below,the emissivity of the HI lines is substantially higher than producedin the pure-recombination case due to the collisional contribution.This affects the use of HI lines as indicators or the gas of ionizedgas.
The H I lines are often used to measure the amount of in-terstellar extinction. It is unusual for the HI recombination spec-trum to deviate very far from Case B for moderate densities andoptical depths in the Lyman continuum in a photoionized cloud(Osterbrock & Ferland 2006). This is because the relative HI lineintensities are mainly determined by the transition probabilities.These determine which lines are emitted as the electrons cascadeto ground after capture from the continuum. The result is that thespectrum depends mainly on atomic constants and less so on thephysical conditions in the gas.
The ratio of the intensity of Hα λ6563A relative toHβ λ4861A, two of the strongest lines in the optical spectrum anda possible reddening indicator, is shown in Figure 6. The Hα/Hβintensity ratio is∼ 2.8 for Case B in low-density photoionized gas(Osterbrock & Ferland 2006). The predicted ratio is significantlylarger than this in most regions where the HI lines have a largeemissivity.
It is possible to measure intensities of HI lines that originatein a common upper atomic level with spectra that cover both theoptical and infrared. The Pα λ1.87µm and Hβ λ4861A lines, witha commonn = 4 upper configuration, is an example. Each of theselines is actually a multiplet with 4nl terms within the upper level.At conventional spectroscopic resolution the lines withinthe mul-tiplet appears as a single HI line. The transition probability of thismultiplet depends on the distribution ofnl populations with the up-per terms, which in turn depend on the gas density (Pengelly 1964).Such line ratios are not expected to depend on the physical condi-tions as much as lines that originate in different configurations.
Figure 7 shows the computed Pα λ1.87µm / Hβ λ4861A in-tensity ratio. It is not constant because of the changing populationsof nl terms within then = 4 configuration of H0. At high densitiesthe l terms will be populated according to their statistical weightand the level populations are said to be welll-mixed. The line in-tensity ratio is then a constant that is determined by the ratio oftransition probabilities and photon energies. Cloudy treated n > 2configurations in this welll-mixed limit in versions before C08, theversion described in this paper. As described above, these calcula-
Figure 6. The ratio of emissivities of HI Hα λ6563 to Hβ λ4861 is shownas a function of cloud parameters. The ratio is∼ 2.8 under the Case Bconditions expected for photoionized nebulae. It is significantly larger formost parameters shown here because of collisional contributions to the line.
tions use an improved H0 model which fully resolves thenl termswithin a configuration.
When the density is too low to collisionally mix thenl termstheir populations tend to peak at smallerl since recombinationsfrom the continuum and suprathermal excitation from groundtendto populate low-l levels. It is only when the density becomes largeenough forl-changing collisions to mix thel levels that the welll-mixed limit is reached. This makes the Pα λ1.87µm / Hβ λ4861Aintensity ratio depend on density.
Figure 7 shows that the Pα / Hβ intensity ratio does not varyover a broad range. The extra-heating case, shown in the lowerpanel, has a Pα / Hβ ratio in the range of 0.2−0.3, below the Case
c© RAS, MNRAS000, 1–27

10 G.J. Ferland et al.
Figure 7. The H I Pα λ1.87µm to Hβ λ4861 emissivity ratio is shown asa function of cloud parameters. These lines have a common upper n = 4configuration so changes in the relative intensities are dueto changes in thenl populations within then = 4 configuration. The Case B value is 0.34.
B ratio of 0.34 at 104 K and low densities. The cosmic ray case hasa Pα / Hβ intensity ratio that varies between∼ 0.2− 0.4, withina factor of two of the Case B ratio. The range is larger becausesuprathermal electrons excite the atom for nearly all temperatures.These non-thermal excitations are mainly tonp terms and create adistribution ofnl populations that differs from the recombinationcase. This line ratio remains a good reddening indicator because ofthe relatively modest range in the predicted values when combinedwith the very wide wavelength separation of the two lines.
Table 3.Physical conditions for the two cases at a range of kinetic temper-atures.
Species T = 102 K T ∼ 700 K T = 104 K
ne(Heat, cm−3) 0.013 0.0089 0.59ne(CR, cm−3) 0.92 9.3 155
n(H2)(Heat, cm−3) 952 940 -n(H2)(CR, cm−3) 232 16 -
n(H0)(Heat, cm−3) 48 60 999n(H0)(CR, cm−3) 768 975 863
n(H+)(Heat, cm−3) - - 0.0004n(H+)(CR, cm−3) 0.80 8.4 137
3.4 Chemical and ionization state of the gas
The two non-radiative heating cases, while having similar overalltrends, have very different detailed properties, which we examinenext. Figure 8 shows predictions for a vertical line in Figures 1 –3 corresponding tonH = 103 cm−3 and varying non-radiative heat-ing rates. The independent axis gives the extra heating ratepre-coefficient and the cosmic-ray density relative to the Galactic back-ground. These parameters were chosen to cross the region wherethe physical conditions in Figures 1, 2 and 3 change abruptly. Theleft panels show the extra heating case and the right panels the cos-mic ray case. The second from the bottom panels of Figure 8 showthe kinetic temperature. The discontinuous jump in temperature,the regions where the contouring in Figures 1 – 3 become ragged,is clear. The lowest panels show the molecular, atomic, and ion-ized fractions of hydrogen. The upper right panel of Figure 8showssome heating and excitation efficiencies for the cosmic-raycase. Inall cases the temperature and ionization of the gas increases to theright as non-radiative energy sources become more important.
Both non-radiative heating cases have discontinuous jumpsintemperature. These are due to inflection points in the gas coolingfunction that occur when more than one solution is possible.Thesestability issues are discussed further below. We first focuson thechanges in the ionization of the gas shown in the lower two panels.
Table 3 compares physical conditions at three temperatures.The low and high temperatures of 100 K and 104 K are near theextremes of the regions which produce the molecular and low-ionization emission. The mid-temperature was evaluated ascloseto 103 K as possible. This is a typical temperature for H2– emittinggas, as shown in Paper 1. No stable thermal phase exists at exactlythis temperature so the conditions at 700 K, the warmest stable re-gion below 103 K, is given.
In the extra-heating case thermal collisions are the only ion-ization source. The result is that at low temperatures the gas is pre-dominantly molecular with a trace of H0. As the heating rate andtemperature increase there is anabruptchange in the chemical statewhen the kinetic temperature approaches the dissociation potentialof H2. The dissociation of H2 causes the particle density to increaseand the mean molecular weight to decrease. Both cause the colli-sional rates, excitations, cooling, and ionization, to increase. Theresult is a positive feed-back process that causes an abruptphasetransition from H2 to H0 . This is the reason that contours overlapin the lower panel of Figures 1 – 3.
This behavior is in sharp contrast with the cosmic-ray case.The effects of relativistic particles on a predominantly thermal gashas been well documented in a number of papers starting with
c© RAS, MNRAS000, 1–27

Collisional heating of cool cluster filaments 11
Figure 8. This shows the thermal and physical state along a vertical line atnH = 103 cm−3 in the previous contour plots. The left panels are the extra-heatingcase while the right panels are the cosmic-ray case. The non-radiative rates are the independent axis in each panel. The range in both was adjusted so that thephase transition, where many physical quantities change abruptly, occurs near the middle of the independent axis. The ionization and temperature increase tothe right as the non-radiative heating rates increase. The top right panel shows the cosmic ray heating, ionization, andline-excitation efficiencies. Cosmic raysionize and excite predominantly neutral gas and heat ionized gas. The abrupt change in temperature, shown in the second to bottom pair of panels, is moreextreme in the extra-heating case. The two lower panels showthe physical state of hydrogen. There is a mix of atomic and molecular gas in the cosmic-raycase due to the ionization and dissociation that they produce in cold neutral gas.
Spitzer & Tomasko (1968) and most recently by Xu & McCray(1991) and Dalgarno et al (1999). As shown in the upper right panelof Figure 8, cosmic rays excite, heat, and ionize the gas. Thecurvesmarked ‘Ionization’ and ‘excitation’ show the ionization and ex-citation rate ( s−1) but have been divided by the cosmic-ray-to-background ratio to remove the effects of increasing cosmic-raydensities. The curve marked ‘heating’ has been similarly scaled and
further multiplied by 107 to facilitate plotting. The fraction of thecosmic-ray energy that goes into each process depends mainly onthe electron fraction,ne/nH, the ratio of the thermal electron to totalhydrogen densities. This electron fraction increases as the cosmic-ray rate increases.
For low electron fractions a cosmic ray produces a first gen-eration secondary electron that is more likely to strike atoms or
c© RAS, MNRAS000, 1–27

12 G.J. Ferland et al.
molecules causing secondary excitations or ionizations. Radiationproduced by line excitation or recombination following ionizationwill be absorbed by dust which then reradiates the energy in theFIR. Relatively little of the cosmic-ray energy goes into directlyheating the gas. As the electron fraction increases, movingto theright in Figure 8, more of the cosmic-ray energy goes into heatingrather than exciting or ionizing the gas. This is because forlargerelectron fractions the secondary electrons have a greater probabil-ity of undergoing an elastic collision with a thermal electron. Thisadds to the thermal energy of the free electrons and so heats thegas.
The effect is to produce a more gentle change in the ioniza-tion of the gas as the cosmic-ray rate is increased. Ionization anddissociation are mainly caused by non-thermal secondary particles.Significant levels of dissociation or ionization exist at temperaturesthat are too low to produce these effects by thermal collisions. Thelower two panels of Figure 8 show how the H2 and H0 fractionschange . In the cosmic-ray case they change continuously untilthe thermal instability point is reached. Although a jump still oc-curs, the change in temperature is mitigated by the more continuouschange in ionization and molecular fractions. This is to be con-trasted with the extra-heating case where the gas is almost entirelymolecular or atomic with little mixing of the two phases.
Some specific values are given in Table 3. At the lowest tem-perature, 100 K, nearly all H is molecular in the extra-heating case,while in the cosmic-ray case substantial amounts of H0 are present.There are even significant amounts of H+ at this temperature be-cause of the ionization produced by the cosmic ray secondaries. Atthe highest temperature shown, 104 K, nearly all H is atomic in theextra heating case while a substantial amount of H+ is present inthe cosmic-ray case.
A substantial population of H0 and H+ is mixed with H2 inthe cosmic-ray heated gas. Molecular regions become far warmerand have far fewer H+ ions mixed with H2 in the extra-heatingcase. This leads to the most important distinctions betweenthe twocases. Ions have larger collision cross sections so are moreactivein altering the level populations of H2, as shown in Table 2. TheH2 populations will be different as a result. Further, H0 and H+
can underdo orth-para exchange collisions with H2. This processwill be far more rapid in the cosmic-ray case and will be anotherdistinction between the two cases.
3.5 Thermal state of the gas
Figure 8 shows that both cases have temperatures that changedis-continuously. The origin of these jumps is described here. We con-centrate on the extra-heating case where the effects are thelargest.
Figure 9 shows gas coolants as the extra heating rate is var-ied across Figure 8. The coolants leftward of the discontinuousbreak are classical atomic and molecular ‘PDR’ coolants. A Galac-tic PDR is the H0 region adjacent to galactic regions of star for-mation (Tielens 2005). These lines can be detected by current andplanned IR instrumentation.
The gas abruptly changes from H0 to H+ at the discontinu-ity where the temperature jumps from ‘warm’ (∼ 103 K) to ‘hot’(∼ 104 K). The coolants on the hot side are mainly emission linesof atoms and ions of the more common elements. The strongestcoolant, marked ‘HI lines’, is the set of Lyman lines that are col-lisionally excited from the ground state. Although their intrinsicintensity is large they do not escape the cloud because of thelargeH I line optical depths and the presence of dust. These lines areabsorbed by dust as the photons undergo multiple scattering. This
Figure 9. This identifies the most important cooling transitions for theextra-heating case shown in Figure 8. The cooling shifts from the IR whenthe gas is cold and molecular, regions with logH0 < −23, into the opticaland UV when the gas is warm and ionized.
is an example of a process that cools the gas by initially convert-ing free electron kinetic energy into line emission which isthenabsorbed by, and heats, the dust. The energy eventually escapes asreprocessed FIR emission. Note that the gas and dust temperaturesare not well coupled for the low densities found in these filaments.The dust is generally considerably cooler than the gas.
The behavior shown in the two previous figures, with discon-tinuous jumps in the physical conditions, is due to well-known ther-mal instabilities in interstellar clouds. Figure 10 shows the calcu-lated cooling rate for a unit density and, again, the extra heatingcase. The heating rate is varied and the temperature determined bybalancing heating and cooling. We plot the cooling as a function oftemperature rather than the heating rate to make it easier tocom-pare these results with previous calculations.
The overall shape of the cooling function is discussed, forinstance, in the review by Dalgarno & McCray (1972). At lowtemperatures cooling is mainly by molecules and low-lying lev-els within ground terms of atoms and first ions of the abundantelements. At low temperatures cooling usually involves changes inlevels which have excitation energies of6 103 K. The cooling in-creases as the Boltzmann factor for excitation increases and reachesa peak at∼ 103 K where the Boltzmann factor reaches unity. Thecooling then declines asT increases further due to theT−1/2 depen-dence of the Coulomb focusing factor. Starting at roughly 5000 Klines involving changes in term become energetically accessible,increasing the cooling, and producing a peak at∼ 104 K. The de-cline after the peak is again due to theT−1/2 dependence of thecollision rate coefficient when the Boltzmann factor has reachedunity. The similar peak at∼ 105 K is due to transitions involvingchanges in electronic configuration in ions of second and third-rowelements.
The form of the cooling curve is affected by the presence ofdust. Many of the most important coolants in a dust-free mixture,such as iron, calcium, silicon, and others, are strongly depletedwhen dust forms. The result is that cooling is less efficient due tothe loss of these gas-phase coolants. This is the major reason thatthe cooling curve differs from the solar-abundance case.
The condition for thermal stability of a constant-density gas is
c© RAS, MNRAS000, 1–27

Collisional heating of cool cluster filaments 13
Figure 10. The cooling function for gas with unit density and a range ofextra-heating rates. The heating is varied and the equilibrium temperaturedetermined. The derived gas kinetic temperature is used as the independentvariable to better compare with previous calculations and so that thermalstability can be judged. The arrows indicate regions where the gas will un-dergo a discontinuous jump in temperature to avoid thermally instable re-gions. A gas that was originally cold and molecular would follow the curvemoving from left to the right while initially hot gas would move from rightto left.
[
∂ (C−H)
∂T
]
ρ> 0 (10)
(Field 1965). HereC andH are the cooling and heating rates, ergcm−3 s−1, andρ indicates that the derivative is at constant density.Small perturbations in the temperature cause the temperature tocontinue to change in the direction of the perturbation if the deriva-tive is negative. Our hypothesized non-radiative heating processeshave no explicit temperature dependence so the partial derivativewith respect to temperature simplifies to the derivative of the cool-ing. The portions of the cooling curve shown in Figure 10 withnegative slope are thermally unstable.
Thermal instabilities cause the gas to have a memory of itshistory. The present state of the gas will depend on whether itapproaches thermal equilibrium from the high or low-temperaturestate. One possibility is that the filaments cooled down fromthe sur-rounding hot-ionized plasma (Revaz et al 2008). They would havereached their current state after moving from right to left in Fig-ure 10. In this case the gas would follow the leftward-pointing ar-rows when it passed the unstable regions. Filaments originating ascold molecular gas, perhaps in the interstellar medium of the cen-tral galaxy, would move from left to right and would follow therightward-pointing arrows. Different regions of the cooling curveare reached by a heating or cooling gas. This difference could pro-vide a signature of the history of the gas.
3.6 The grain/molecule inventory and the history of the gas
The dust content and molecular inventory provides a constraint onthe history of the filaments. If the filaments formed from the sur-rounding hot X-ray plasma they would likely be dust free. Proper-ties of dust-free clouds within a galaxy cluster were examined byFerland et al (1994) and Ferland et al (2002). If the gas originatedin the interstellar medium of the central galaxy it would most likelycontain dust, as we have assumed so far.
The timescales required to form the observed molecules pro-
vide a clue to the origin of the gas. The slowest step is the for-mation of H2. There are no direct formation processes because thehomonuclear molecule has no permanent dipole moment. In dustyenvironments H2 forms by catalysis on grain surfaces. We haveadopted the rate derived by Jura (1975) for the galactic ISM.TheH2-formation timescale is then
τgrain ∼ 106
[
n(
H0)
103cm−3
Adust
AISM
]−1
years (11)
wheren(H0) is the atomic hydrogen density andAdust/AISM is thefilament dust to gas ratio relative to the ISM value.
If grains are not present then H2 will mainly form by asso-ciative detachment of H− (Ferland et al 1994). This process is lim-ited by the rate of the slowest step, radiative association to formH−. This has a rate coefficient given byr = 8×10⁻¹⁶t0.87
3 ne s−1
in the neighborhood of 103 K. Carbon is the most abundant electrondonor in H0 regions where this process is fast. The timescale canbe posed in terms of the hydrogen density by assuming a solar C/Hratio and that all C is singly ionized. The H2 formation timescale ina dust-free environment is then
τe ∼ 2×10⁸
[
n(
H0)
103 cm−3
]−1
t−0.873
(
C/HC/H⊙
)−1
years (12)
where the density, temperature, and C/H abundance are giveninunits of 103 cm−3, 103 K, and solar, respectively.
The dust-free H2 formation timescales are∼ 2.5 dex longerthan those in a dusty environment. Unfortunately the ages ofthefilaments are poorly constrained. Hatch et al (2006) find thata fila-ment in the Perseus cluster with a projected length of∼ 25 kpc anda velocity spread of∼ 400 km s−1 . The corresponding expansionage is> 7×10⁷ yr. This is comfortably longer than the formationtime for a dusty gas. H2 could only form in the dust-free case if thedensity is considerably higher than expected from typical pressures.This is possible but unlikely. We return to this question below.
The stable thermal solutions presented in the remainder of thispaper are limited to those on the rising-temperature branchof thecooling curve. This, together with our assumed dust content, im-plicitly assumes that the gas was originally cold and dusty.In prac-tice this means that the temperature solver determines the initialtemperature with a search that starts at low temperatures and in-creasesT to reach thermal equilibrium.
4 PROPERTIES OF CONSTANT-PRESSURE CLOUDS
4.1 Equation of state
The equation of state, the relationship between gas densityand thetemperature or pressure, is completely unknown for the filaments.Possible contributors to the total pressure include gas, turbulent,magnetic, cosmic ray, and radiation pressures. The gross structureof the filaments, forming large lines or arcs, is reminiscentof mag-netic phenomena like coronal loops. This suggests that magneticfields guide the gas morphology with the field lines lying along thearc. Gas would then be free to flow along field lines, the long axisof the filaments, but not across them.
We assume that the gas pressure within the filaments isthe same as the gas pressure in the surrounding hot gas,nT =106.5 cm−3 K, found by Sanders & Fabian (2007) in the Perseuscluster. The magnetic field must then be strong enough to guide the
c© RAS, MNRAS000, 1–27

14 G.J. Ferland et al.
cool material and so maintain the linear geometry despite any mo-tion with respect to the surrounding hot gas. A magnetic fieldof∼ 100µG has an energy density equivalent to a thermal gas withnT = 106.5 cm−3 K so a field stronger than this is needed. Little isknown about the filament geometry at the sub-arcsec (δ r 6 35 pcat Perseus) level and nothing is known about the magnetic fieldstrength within the filaments. Magnetic confinement does providea plausible explanation for the observed geometry however.
Figure 11 shows the gas pressure in conventional ISMunit (P/k = nT cm−3 K) for the two cases. If individual sub-components that make up the filaments have constant pressurethenthey will lie along one of these contour lines.
The dynamic range in Figure 11 is large. The solid line in Fig-ure 12 corresponds to our preferred pressure ofnT = 106.5 cm−3 K.The dashed lines in the figure show pressures 0.5 dex to eithersideof this value. As we show next, regions where the contours exceeda 45 degree angle, and where the±0.5 dex contours nearly overlap,are thermally unstable.
4.2 Thermal stability
The criterion for thermal stability in a constant-pressuregas is[
∂ (C−H)
∂T
]
P=
[
∂ (C−H)
∂T
]
ρ− ρ0
T0
[
∂ (C−H)
∂ρ
]
T> 0 (13)
(Field 1965), where the equality assumes constant mean molecularmass. The first term on the right is the same as that consideredinthe constant-density case discussed in the Section 3.5. Both of theheating sources considered here have linear density dependenciesand no explicit dependence on temperature. At constant pressurethis will carry over into a heating rate that is inversely proportionalto the temperature so the second term is non-zero.
The upper panel of Figure 13 shows the gas cooling rate alongthe isobaric lognT = 6.5 contour in Figure 12. Both heating casesare drawn in each panel. The figure shows the cooling as a functionof temperature rather than the heating rate so that the gas stabil-ity can be more easily judged. The detailed cooling properties ofthe two sources of non-radiative heating are quite different, as canbe seen from the physical properties shown in Figure 8 and listedin Table 3. The line marked ‘temperature−1’ shows the approxi-mate form of the second term in equation 13. Regions where theslope of the cooling function is steeper than this are unstable. Thelower panel of Figure 13 shows the product of the cooling and thetemperature. Expressed this way, regions with negative slope areunstable. Two distinct phases, corresponding to cold molecular andwarm atomic/ionized, exist.
The upper axis in Figure 13, and the figures that follow, givesthe particle density along the isobaric line while the loweraxisgives the kinetic temperature. Temperature and density arerelatedsince the productnT is constant. Note that the densityn is theto-tal particle density not the hydrogen density. For molecular regionsthe total particle density is about half the hydrogen density whilein ionized regions it is about twice due to the presence of free elec-trons.
Figure 14 shows the cooling time for the cases shown in Fig-ure 13 The cooling time will determine how quickly the gas canrespond to changes in the environment. It also determines howquickly thermally unstable gas will heat or cool and reach stableregions of the cooling curve. These times are short comparedwithtimescales over which the galaxy cluster changes and are farshorterthan the H2 formation timescales mentioned above.
Figure 11. The log of the gas pressure, expressed asP/k = nT( K cm−3),is shown as a function of the hydrogen density and (top panel)the cosmic-ray rate relative to the Galactic background and (bottom panel) the extra-heating rate. For comparison inner regions of the Perseus cluster havenT ≈106.5 cm−3 K.
4.3 Spectrum emitted by a homogeneous cloud
The full emitted spectrum is computed for each point along theisobaric line in Figure 12. Emissivities 4π j of a few representativelines are shown in Figure 15. The luminosity of a line will be theintegral of 4π j over the volume of the emitting region.
Most of the lines shown in Figure 15 will be optically thin forany reasonable column density. In this case their emissivity has noexplicit dependence on column density. If we can neglect internalreddening, a good approximation for the IR and radio lines but anadditional uncertainty for optical or UV transitions, thenthe line
c© RAS, MNRAS000, 1–27
Collisional heating of cool cluster filaments 15
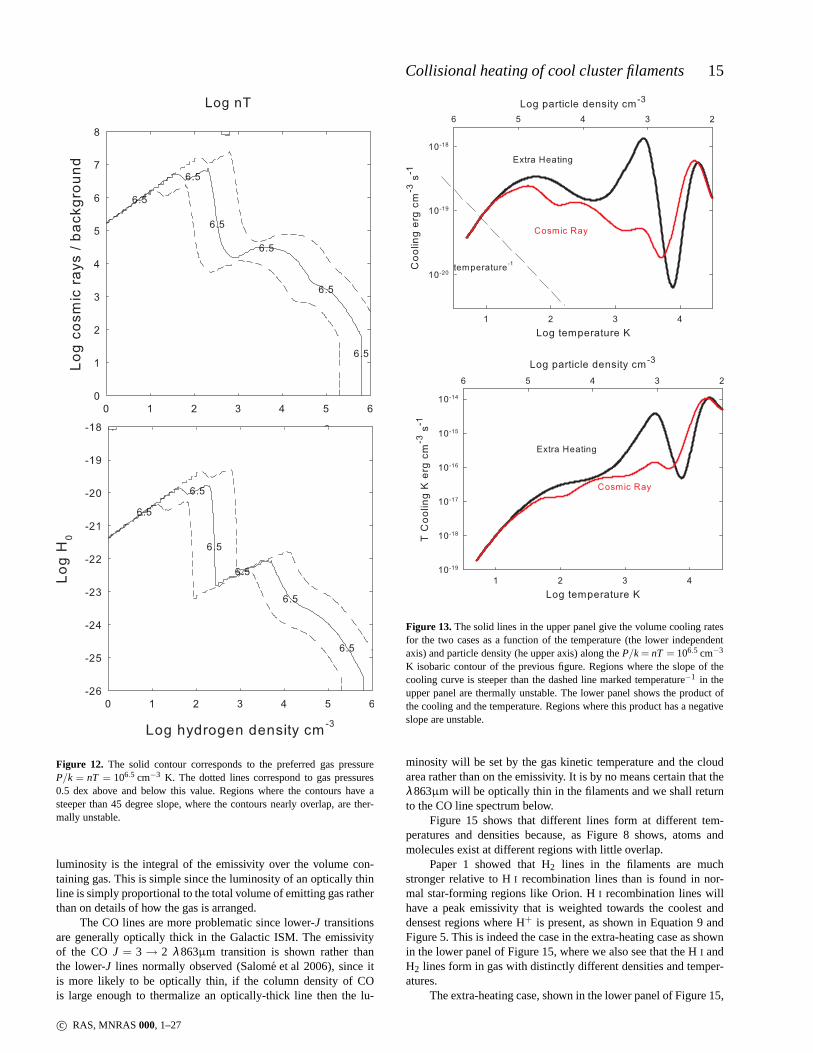
Figure 12. The solid contour corresponds to the preferred gas pressureP/k = nT = 106.5 cm−3 K. The dotted lines correspond to gas pressures0.5 dex above and below this value. Regions where the contours have asteeper than 45 degree slope, where the contours nearly overlap, are ther-mally unstable.
luminosity is the integral of the emissivity over the volumecon-taining gas. This is simple since the luminosity of an optically thinline is simply proportional to the total volume of emitting gas ratherthan on details of how the gas is arranged.
The CO lines are more problematic since lower-J transitionsare generally optically thick in the Galactic ISM. The emissivityof the CO J = 3 → 2 λ863µm transition is shown rather thanthe lower-J lines normally observed (Salome et al 2006), since itis more likely to be optically thin, if the column density of COis large enough to thermalize an optically-thick line then the lu-
Figure 13.The solid lines in the upper panel give the volume cooling ratesfor the two cases as a function of the temperature (the lower independentaxis) and particle density (he upper axis) along theP/k = nT = 106.5 cm−3
K isobaric contour of the previous figure. Regions where the slope of thecooling curve is steeper than the dashed line marked temperature−1 in theupper panel are thermally unstable. The lower panel shows the product ofthe cooling and the temperature. Regions where this producthas a negativeslope are unstable.
minosity will be set by the gas kinetic temperature and the cloudarea rather than on the emissivity. It is by no means certain that theλ863µm will be optically thin in the filaments and we shall returnto the CO line spectrum below.
Figure 15 shows that different lines form at different tem-peratures and densities because, as Figure 8 shows, atoms andmolecules exist at different regions with little overlap.
Paper 1 showed that H2 lines in the filaments are muchstronger relative to HI recombination lines than is found in nor-mal star-forming regions like Orion. HI recombination lines willhave a peak emissivity that is weighted towards the coolest anddensest regions where H+ is present, as shown in Equation 9 andFigure 5. This is indeed the case in the extra-heating case asshownin the lower panel of Figure 15, where we also see that the HI andH2 lines form in gas with distinctly different densities and temper-atures.
The extra-heating case, shown in the lower panel of Figure 15,
c© RAS, MNRAS000, 1–27

16 G.J. Ferland et al.
Figure 14.The cooling timescales for the two cases shown in the previousfigure is shown. Gas in unstable regions of the previous figurewill move toa stable portion of the cooling curve on this timescale.
is simplest and we consider it first. Lines excited by thermalcolli-sions tend to form in warmer gas because of the exponential Boltz-mann factor. Low-excitation H2 lines such asλ12.28µm form incooler gas than the H2 λ2.12µm, which has an upper level with anexcitation potential of∼ 7000 K, in the extra-heating case.
The emissivities of the Hα and H2 lines have two local peaksin the cosmic-ray case, as shown in the upper panel of Figure 15.The lower-temperature peak is due to the direct excitation of H I
and H2 lines by secondary electrons. Excitation to H2 electroniclevels that then decay into excited states of the H2 ground state,a process analogous to the photon Solomon process (Shaw et al2005), contributes to the H2 emission. The higher-temperature peakoccurs when cosmic rays heat the gas to a warm enough tempera-ture to excite H2 transitions with thermal collisions. Eventually, inthe highest-T regions of the figure, the gas becomes warm enoughto be predominantly ionized and the HI lines begin to form by re-combination.
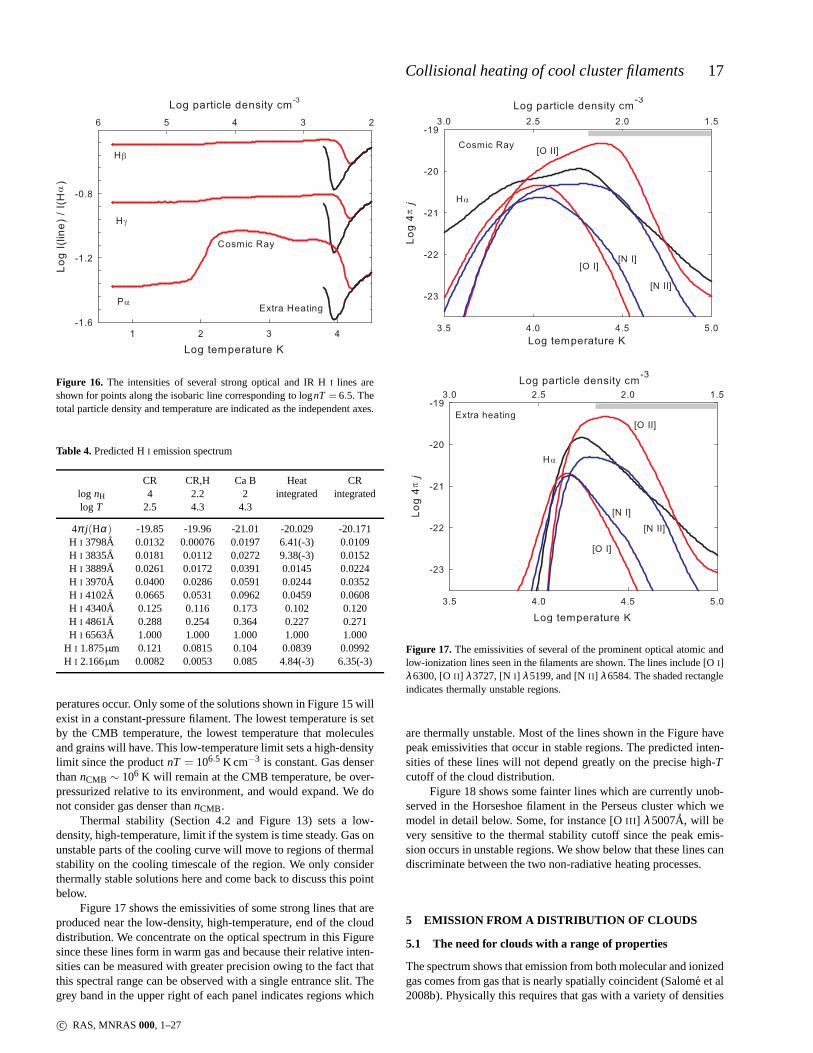
The hydrogen emission-line spectrum is predicted to be differ-ent from Case B relative intensities in regions where the lines formby collisional excitation of H0 rather than by recombination of H+.Figure 16 shows the predicted intensities of the brighter optical andIR lines relative to Hα. There are two reasons for differences fromsimple Case B, the first being the large range in kinetic temperaturealong the isobaric line. The standard Case B spectrum is mostoftenquoted forT = 104 K, appropriate for a photoionized cloud. Thefact that collisional processes excite the lines in this environmentcause further deviations from Case B.
Table 4 compares the HI spectrum for two points along theconstant-nT line with Case B predictions. Little HI emission oc-curs for the extra-heating case atT ≈ 300 K so only the cosmic-raycase is given. The extra heating and cosmic ray predictions agreeat T ≈ 2×10⁴ K because the gas is warm enough to collisionallyexcite the HI lines. The emissivity 4π j is ∼ 1 dex brighter thana pure recombination HI spectrum because of the contribution ofcollisional excitation of H0 . Note that the quantities given in Table4 are the emissivity 4π j and not the emission coefficient 4π j/nenp
given in, for instance, Osterbrock & Ferland (2006) The relative in-tensities of the HI lines are also different in the two cases. The HI
Figure 15. The emissivities, the emission per unit volume, are shown forseveral emission lines along the isobaric line corresponding toP/k = nT =106.5 cm−3 K. The total particle density and temperature are indicatedasthe independent axes. The upper panel is the cosmic ray case and the lowerpanel is for extra heating.
lines atT ≈ 300 K are mainly excited by non-thermal secondaryelectrons with collision rates that are proportional to theoscilla-tor strength of the Lyman line. The emission atT ≈ 2×10⁴ K ismainly produced by collisions with thermal electrons whoseratesare dominated by the near-threshold cross section. Case B applieswhen the lines form by recombination, which is not the case here.
Table 4 shows that, although the HI lines have a far greateremissivity than is given by Case B, the relative intensitiesare nottoo dissimilar. This is because the relative intensities ofthe H I
spectrum are most strongly affected by the transition probabili-ties that determine how a highly-excited electron decays togroundrather than detail detains of how the electron became excited.
4.4 Allowed range of cloud density and temperature
The observed spectrum has a wide range of molecular and atomicemission, requiring that cloudlets with a range of densities and tem-
c© RAS, MNRAS000, 1–27
Collisional heating of cool cluster filaments 17
Figure 16. The intensities of several strong optical and IR HI lines areshown for points along the isobaric line corresponding to lognT = 6.5. Thetotal particle density and temperature are indicated as theindependent axes.
Table 4.Predicted HI emission spectrum
CR CR,H Ca B Heat CRlog nH 4 2.2 2 integrated integratedlog T 2.5 4.3 4.3
4π j(Hα) -19.85 -19.96 -21.01 -20.029 -20.171H I 3798A 0.0132 0.00076 0.0197 6.41(-3) 0.0109H I 3835A 0.0181 0.0112 0.0272 9.38(-3) 0.0152H I 3889A 0.0261 0.0172 0.0391 0.0145 0.0224H I 3970A 0.0400 0.0286 0.0591 0.0244 0.0352H I 4102A 0.0665 0.0531 0.0962 0.0459 0.0608H I 4340A 0.125 0.116 0.173 0.102 0.120H I 4861A 0.288 0.254 0.364 0.227 0.271H I 6563A 1.000 1.000 1.000 1.000 1.000
H I 1.875µm 0.121 0.0815 0.104 0.0839 0.0992H I 2.166µm 0.0082 0.0053 0.085 4.84(-3) 6.35(-3)
peratures occur. Only some of the solutions shown in Figure 15 willexist in a constant-pressure filament. The lowest temperature is setby the CMB temperature, the lowest temperature that moleculesand grains will have. This low-temperature limit sets a high-densitylimit since the productnT = 106.5 K cm−3 is constant. Gas denserthannCMB ∼ 106 K will remain at the CMB temperature, be over-pressurized relative to its environment, and would expand.We donot consider gas denser thannCMB.
Thermal stability (Section 4.2 and Figure 13) sets a low-density, high-temperature, limit if the system is time steady. Gas onunstable parts of the cooling curve will move to regions of thermalstability on the cooling timescale of the region. We only considerthermally stable solutions here and come back to discuss this pointbelow.
Figure 17 shows the emissivities of some strong lines that areproduced near the low-density, high-temperature, end of the clouddistribution. We concentrate on the optical spectrum in this Figuresince these lines form in warm gas and because their relativeinten-sities can be measured with greater precision owing to the fact thatthis spectral range can be observed with a single entrance slit. Thegrey band in the upper right of each panel indicates regions which
Figure 17.The emissivities of several of the prominent optical atomicandlow-ionization lines seen in the filaments are shown. The lines include [OI]λ6300, [OII ] λ3727, [N I] λ5199, and [NII ] λ6584. The shaded rectangleindicates thermally unstable regions.
are thermally unstable. Most of the lines shown in the Figurehavepeak emissivities that occur in stable regions. The predicted inten-sities of these lines will not depend greatly on the precise high-Tcutoff of the cloud distribution.
Figure 18 shows some fainter lines which are currently unob-served in the Horseshoe filament in the Perseus cluster whichwemodel in detail below. Some, for instance [OIII ] λ5007A, will bevery sensitive to the thermal stability cutoff since the peak emis-sion occurs in unstable regions. We show below that these lines candiscriminate between the two non-radiative heating processes.
5 EMISSION FROM A DISTRIBUTION OF CLOUDS
5.1 The need for clouds with a range of properties
The spectrum shows that emission from both molecular and ionizedgas comes from gas that is nearly spatially coincident (Salome et al2008b). Physically this requires that gas with a variety of densities
c© RAS, MNRAS000, 1–27

18 G.J. Ferland et al.
Figure 18. The emissivities of several optical atomic and low-ionizationlines that are either sensitive to the thermal stability cutoff or which mightdiscriminate between the two non-radiative heating modelswe discuss. Thelines include [OIII ] λ5007, [NeIII ] λ3869, and HeI λ5876. Hα is shownfor reference. The shaded rectangle indicates thermally unstable regions.
contributes to the net emission detected by the entrance aperture ofa spectrometer.
No one choice of cloud parameters can reproduce the fullrange of molecular, atom, and ionic emission. Figures 4 and 5showthat H I and H2 emission originate in warm and hot regions respec-tively. The observed [NII ] or [O II ] emission cannot originate inthe H2 region. Gas with a range of temperature and ionization mustcontribute to the observed emission.
The Galactic ISM has two or more thermally distinct phasesthat are in pressure equilibrium (Field et al. 1969). Figure12 showsthat gas with two temperatures but the same pressure exist for somevalues of the non-radiative heating rates. This occurs for cosmic rayfluxes≈ 4.2 dex times the Galactic background and for heating ratepre-coefficients of logHo ≈−22.5. The range in gas properties forthese two points is not broad enough to produce the observed rangeof emission however. For instance, in the cosmic-ray case the twohydrogen densities are≈ 103 cm−3 and≈ 104.3 cm−3, correspond-ing to kinetic temperatures ofT ≈ 103.5 K and T ≈ 102.2 K. Gas
with this pair of densities, when co-added in the appropriate mix offilling factors, can account for some of the HI and H2 emission butnone of the optical forbidden lines, as shown in Figure 17.
The full range of thermally stable clouds shown in Figure 13must exist and contribute to the spectrum. It is then necessary toadopt a weighting function, as described next, to decide howtoco-add clouds with different conditions. This weighting function isnot a physical model for why this mix of clouds exist. Rather itrepresents a parametric way of solving the spectroscopic problemby specifying how the volume of clouds depends on density. Wewill end up with an empirical fit to the spectrum and finally discussvarious scenarios that might establish this range of conditions.
5.2 Formalism
We assume that the filaments are composed of cloudlets with arange of densityn. The cumulative filling factorf (n) of materialwith density belown (i.e. fractional volume filled by material withthis density or less) is
f (n) =
0 n 6 nlowk∣
∣nα −nαlow
∣
∣ nlow < n 6 nhigh,α 6= 0k log(n/nlow) nlow < n 6 nhigh,α ≡ 0
1 n > nhigh,
(14)
wheren is the total hydrogen density,α is a parameter to be de-termined by fitting the observed spectrum, andk is a normalizationconstant. The constant value 1 for densities abovenhigh correspondsto the observation that the whole volume is filled by materialoflower densities. The more commonly-used filling factor, describedin Section 5.9 of Osterbrock & Ferland (2006), is the dimension-less fraction of space that is filled with a particular phase of mate-rial. For a continuous density distribution, which we consider here,it is more useful to define a differential filling factor whichwill bea function of density. This is most easily defined in this cumulativeform.
The physical picture is that the aperture of the spectrometertakes in emitting material with a range of densities and correspond-ing temperatures but a single pressure. This might occur, for in-stance, if the non-radiative heating rate is not uniform in space ortime. Gas would heat up or cool down, on the cooling timescalegiven in Figure 14, in response to changes in the heating. Theden-sity and temperature would change to maintain constant pressurebut clouds with a variety of densities and temperature wouldcon-tribute to the emission from a region on the sky.
With these assumptions the line emissivity 4π j (ergcm−3 s−1) integrated over a distribution of clouds is given by
4π j =∫ 1
04π j (n) d f (15)
=
∫ nhigh
nlow
4π j (n) nα−1 dn
/
∫ nhigh
nlow
nα−1 dn , (16)
where the integration is over the physical limits to the filling factor,0 6 f (n) 6 1, and the integration over filling factor is rewritten interms of an integral over density. Herenlow andnhigh are the lowerand upper density bounds to the integration. In practice we simulatephysical conditions and emission from clouds for a wide range ofspecific densitiesn and replace the integral with the sum
4π j ≃i= j
∑i=0
4π j i (ni) nα−1i ∆ni
/
i= j
∑i=0
nα−1i ∆ni , (17)
where the density bins are separated byδn/n∼ 0.1 dex.
c© RAS, MNRAS000, 1–27

Collisional heating of cool cluster filaments 19
The hydrogen density averaged over the cloud distribution,n( cm−3), is similarly defined as
n =∫ 1
0n d f. (18)
This becomes
n =α
α +1
nα+1high −nα+1
low
nαhigh−nα
low(19)
With these definitions the luminosity of a lineLline ( erg s−1 )is related to the emissivity 4π j and the total volume containing gasV ( cm3) by
Lline = V4π j (20)
The mass contained in this volume is given by
M = Vnµ (21)
whereµ is the mean mass per proton which we take to be 1.4u.The line surface brightness is then
Sline = 1.8704×10−12×4π j dl (22)
The physical meaning of these quantities is as follows. ThevolumeV is the total volume containing gas. The gas within thisvolume has a range of density and temperature and may be molec-ular, atomic, or ionized. The line emissivity 4π j takes into accountboth the atomic physics of the emission process and the fact that aline is only emitted for certain combinations of density andtemper-ature. The weighting parameterα determines the amounts of gas atvarious densities. The density ¯n depends onα since this sets howmuch weight is given to gas at various densities. It further dependson thermal stability criterion which setsnlow.
There are three free parameters, the lower and upper densityboundsnlow andnhigh and the power-law indexα. Physically mo-tivated limits are used to set the density bounds in Equation17. Asdescribed in Section 4.4, thermally unstable densities areexcludedfrom the integrals. This is equivalent to assuming that gas that lieson unstable portions of the cooling curve, shown in Figure 13, willquickly move to stable regions so that the volume is fully filled bystable gas. The CMB temperature is assumed to set a lower limit tothe kinetic temperature which then sets the upper limit to the den-sity since the productnT is held fixed. This leaves onlyα as a freeparameter.
5.3 Dependence onα
The full emission-line spectrum, with many hundreds of thousandsof lines, is computed for each point along the isobaric curveil-lustrated by Figure 15. The emissivity of each line is storedandintegrated over density using Equation 17. Integrated predictionsare presented relative to Hα since it is easily observed and, of thebright optical lines, is the least affected by reddening.
Figure 15 shows that different lines have emissivities thatpeakin different regions along the isobaric line. Lines that areformedin warm or hot ionized gas, such as the [S II] or [O II] opticallines, will form in nearly the same region as Hα itself as shownin Figures 17 and 18. We expect that the intensities of such linesrelative to Hα will have little dependence onα but will depend onthe chemical composition and the energy source. This is in contrastwith molecular lines, such as the CO or H2 lines shown in Figure15, which form in gas that is much colder and denser that the gasproducing the HI emission. Because of the form of the filling factor
Figure 19. The integrated intensities of some strong lines are shown asa function of the power-law indexα . The upper panel shows the HI Hαemissivity 4π j . The middle and lower panels show the predicted intensitiesof other lines relative to Hα for the cosmic ray (middle panel) and extraheating (lower panel) cases.
function we expect that molecular lines will be stronger relative toHα for α close to 0 and that the intensity ratio decreases asαbecomes more negative.
Figure 19 shows the predicted line intensities as a functionofα. Lines that form along with Hα, such as [SII ] λλ6716, are notstrongly sensitive to the value ofα. The line ratio is constant inthe extra-heating case because Hα forms only in ionized gas alongwith the [SII ] lines. The ratio decreases for large values ofα in thecosmic-ray case because this gives strongest weight to the molecu-lar regions where the HI lines form by suprathermal excitation ofH0 . For the regions where the line ratio is a constant the intensitiesreflect the abundances of the elements and the underlying heatingprocess rather than the integration process.
The intensities of molecular lines relative to Hα have a strongdependence onα. The power-law indexα affects how the denseand cold molecular regions are added to the hotter ionized gas. Fig-ure 19 shows that such lines as [OI] λ63µm, H2 2.12µm, and COλ863µm have powerful dependencies onα. We will use these linesto determineα in the following section.
Figure 20 shows the Hα emissivity and mean density as afunction of α. The upper panel shows the emissivity 4π j of H I
Hα as defined by Equation 16. The emissivities are quite similarfor whenα is very small since this give greatest weight to the warmionized regions where the emissivities are similar. They differ forlargeα since this weights the cold dense regions where suprather-mal excitation of HI is important in the cosmic-ray case. The total
c© RAS, MNRAS000, 1–27
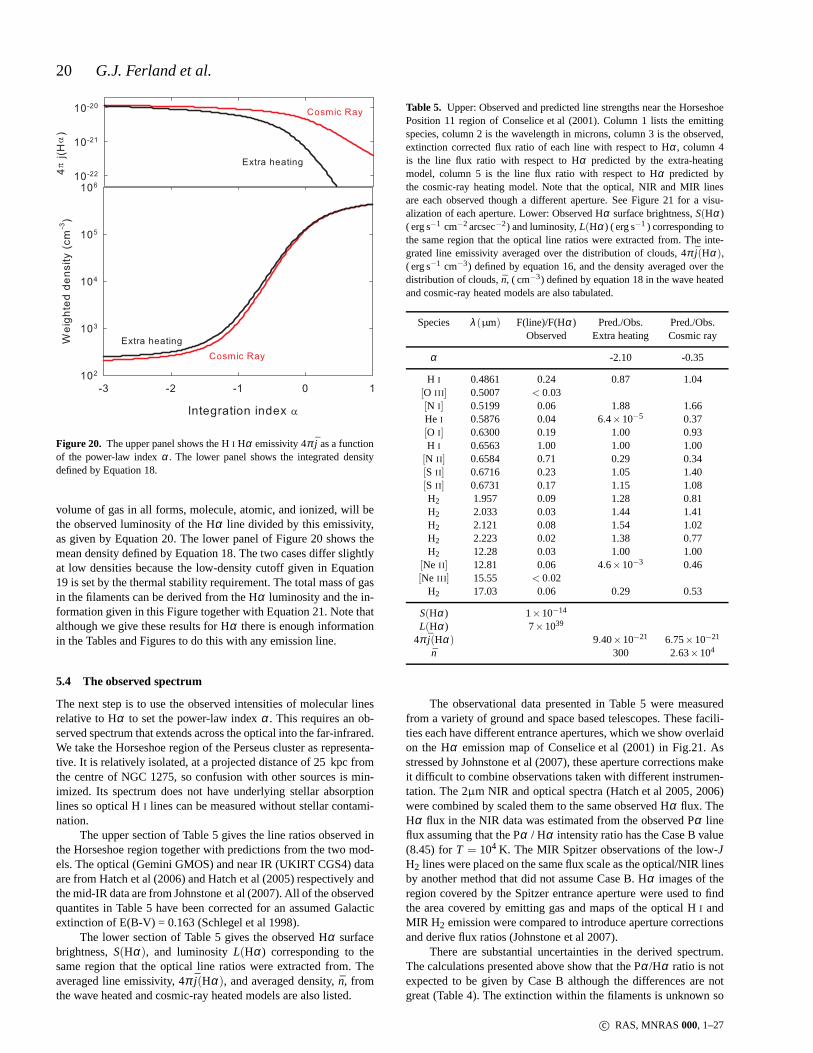
20 G.J. Ferland et al.
Figure 20. The upper panel shows the HI Hα emissivity 4π j as a functionof the power-law indexα . The lower panel shows the integrated densitydefined by Equation 18.
volume of gas in all forms, molecule, atomic, and ionized, will bethe observed luminosity of the Hα line divided by this emissivity,as given by Equation 20. The lower panel of Figure 20 shows themean density defined by Equation 18. The two cases differ slightlyat low densities because the low-density cutoff given in Equation19 is set by the thermal stability requirement. The total mass of gasin the filaments can be derived from the Hα luminosity and the in-formation given in this Figure together with Equation 21. Note thatalthough we give these results for Hα there is enough informationin the Tables and Figures to do this with any emission line.
5.4 The observed spectrum
The next step is to use the observed intensities of molecularlinesrelative to Hα to set the power-law indexα. This requires an ob-served spectrum that extends across the optical into the far-infrared.We take the Horseshoe region of the Perseus cluster as representa-tive. It is relatively isolated, at a projected distance of 25 kpc fromthe centre of NGC 1275, so confusion with other sources is min-imized. Its spectrum does not have underlying stellar absorptionlines so optical HI lines can be measured without stellar contami-nation.
The upper section of Table 5 gives the line ratios observed inthe Horseshoe region together with predictions from the twomod-els. The optical (Gemini GMOS) and near IR (UKIRT CGS4) dataare from Hatch et al (2006) and Hatch et al (2005) respectively andthe mid-IR data are from Johnstone et al (2007). All of the observedquantites in Table 5 have been corrected for an assumed Galacticextinction of E(B-V) = 0.163 (Schlegel et al 1998).
The lower section of Table 5 gives the observed Hα surfacebrightness,S(Hα), and luminosityL(Hα) corresponding to thesame region that the optical line ratios were extracted from. Theaveraged line emissivity, 4π j(Hα), and averaged density, ¯n, fromthe wave heated and cosmic-ray heated models are also listed.
Table 5. Upper: Observed and predicted line strengths near the HorseshoePosition 11 region of Conselice et al (2001). Column 1 lists the emittingspecies, column 2 is the wavelength in microns, column 3 is the observed,extinction corrected flux ratio of each line with respect to Hα , column 4is the line flux ratio with respect to Hα predicted by the extra-heatingmodel, column 5 is the line flux ratio with respect to Hα predicted bythe cosmic-ray heating model. Note that the optical, NIR andMIR linesare each observed though a different aperture. See Figure 21for a visu-alization of each aperture. Lower: Observed Hα surface brightness,S(Hα)( erg s−1 cm−2 arcsec−2) and luminosity,L(Hα) ( erg s−1 ) corresponding tothe same region that the optical line ratios were extracted from. The inte-grated line emissivity averaged over the distribution of clouds, 4π j(Hα),( erg s−1 cm−3) defined by equation 16, and the density averaged over thedistribution of clouds, ¯n, ( cm−3) defined by equation 18 in the wave heatedand cosmic-ray heated models are also tabulated.
Species λ(µm) F(line)/F(Hα) Pred./Obs. Pred./Obs.Observed Extra heating Cosmic ray
α -2.10 -0.35
H I 0.4861 0.24 0.87 1.04[O III ] 0.5007 < 0.03[N I] 0.5199 0.06 1.88 1.66He I 0.5876 0.04 6.4×10⁻⁵ 0.37[O I] 0.6300 0.19 1.00 0.93H I 0.6563 1.00 1.00 1.00
[N II ] 0.6584 0.71 0.29 0.34[S II ] 0.6716 0.23 1.05 1.40[S II ] 0.6731 0.17 1.15 1.08H2 1.957 0.09 1.28 0.81H2 2.033 0.03 1.44 1.41H2 2.121 0.08 1.54 1.02H2 2.223 0.02 1.38 0.77H2 12.28 0.03 1.00 1.00
[Ne II ] 12.81 0.06 4.6×10⁻³ 0.46[Ne III ] 15.55 < 0.02
H2 17.03 0.06 0.29 0.53
S(Hα) 1×10⁻¹⁴
L(Hα) 7×1039
4π j(Hα) 9.40×10⁻²¹ 6.75×10⁻²¹
n 300 2.63×10⁴
The observational data presented in Table 5 were measuredfrom a variety of ground and space based telescopes. These facili-ties each have different entrance apertures, which we show overlaidon the Hα emission map of Conselice et al (2001) in Fig.21. Asstressed by Johnstone et al (2007), these aperture corrections makeit difficult to combine observations taken with different instrumen-tation. The 2µm NIR and optical spectra (Hatch et al 2005, 2006)were combined by scaled them to the same observed Hα flux. TheHα flux in the NIR data was estimated from the observed Pα lineflux assuming that the Pα / Hα intensity ratio has the Case B value(8.45) forT = 104 K. The MIR Spitzer observations of the low-JH2 lines were placed on the same flux scale as the optical/NIR linesby another method that did not assume Case B. Hα images of theregion covered by the Spitzer entrance aperture were used tofindthe area covered by emitting gas and maps of the optical HI andMIR H2 emission were compared to introduce aperture correctionsand derive flux ratios (Johnstone et al 2007).
There are substantial uncertainties in the derived spectrum.The calculations presented above show that the Pα/Hα ratio is notexpected to be given by Case B although the differences are notgreat (Table 4). The extinction within the filaments is unknown so
c© RAS, MNRAS000, 1–27

Collisional heating of cool cluster filaments 21
-150 -100 -50 0 50 100 150
-150 -100 -50 0 50 100 150
Figure 21.Entrance apertures of the various instruments used to determinethe line ratios presented in Table 5 and in the text. Gemini GMOS: longthin rectangle, UKIRT CGS4: small rectangle centred on brightest knot.The two larger overlapping rectangles are the positions of the Spitzer IRSSH aperture. Line fluxes were averaged between these two nod positions.The large circle is the beam of the IRAM (CO 1–0) observations.
no correction is made. Renormalizing the optical / NIR HI spec-trum to agree with Case B intensities largely removes the effects ofreddening. Given the uncertainties in both the observed andtheo-retical predictions our goal is to reproduce the spectrum towithin afactor of two.
Salome et al (2008b) detect the CO 1-0 line in the Horseshoeand note that the line is optically thick. This is in contrastto theoptically thin optical and IR lines that are the focus of thispaper.The observed flux of an optically thick line depends on the geome-try while that of an optically thin line depends only on the volumeof emitting gas.
Salome et al (2008b) derive a mass of 108 M⊙ for the re-gion of the Horseshoe included in their 11 arcsec radius beam(seeFig.21). We can derive the total mass from the luminosity of anyemission line using Equation 21. We measured the Hα luminos-ity in the IRAM beam from the data of (Conselice et al 2001) asL(Hα) = 5.5×1040 erg s−1 .
5.5 The predicted spectrum
We varyα to match the observed H2 12.28µm/Hα intensity ratio of0.03 (Table 5). This line ratio has several advantages. It has one ofthe widest ranges in excitation and ionization in the spectrum andso is a strong function ofα. The IR H2 lines are, like the opticalH I lines, optically thin so geometric effects do not enter. Finally, bycomparing emission from an ion and molecule of the same elementthere are no additional uncertainties introduced by that fact that thecomposition is unknown. The uncertainty in the ratio is likely to bedominated by systematic errors which we cannot quantify.
This procedure givesα = −0.35 for the cosmic ray andα = −2.10 for the extra heating cases. Both cases have negativeαwhich, as Equation 14 shows, means that the lowest-density gas hasthe largest volume. We are led to a picture in which the moleculargas lies in cold and dense cores while the low-ionization emissionoriginates in extended low-density regions. The ionized materialmay be located in extended envelopes surrounding the molecularcores.
The last two columns of Table 5 give the predicted line in-tensities relative to the observed values. A more complete set ofpredicted intensities is given in Appendix A. Our goal is to matchthe spectrum to within a factor of two. Both heating cases do thisfor the majority of lines. The discriminants between the twocasesare described in the next section.
The last two columns of Table 4 give the integrated HI spectrafor the two cases. The predicted Pα/Hα ratio is 0.0839 and 0.0992for the extra heating and cosmic ray cases, not greatly differentfrom the Case B ratio of 0.104. The Pα/Hβ is 0.37 for both heatingcases and is 0.29 for Case B. These differences are significant butthe wide wavelength separation of the line pairs make them usefulreddening indicators.
5.6 The need for ionizing particles
Several emission lines indicate that the cosmic-ray case best de-scribes the heating and ionization of the gas. Most lines arematchedby both cases to within our desired factor of two. It is not possi-ble to formally quantify a goodness of fit in Table 5 because theuncertainties are dominated by systematic errors which we cannotquantify. Rather we point to a few lines which clearly indicate thatthe cosmic-ray case applies.
Figures 17 and 18 show the critical distinction between thetwo cases. The extra-heating case behaves as expected for acollisionally-excited thermal gas. As the temperature increases, go-ing from left to right in the figures, we see lines of [OI], [N I],[N II ], [O II ], [O III ], He I, and eventually [NeIII ], increasing inintensity. This corresponds to increasing ionization and excitationpotentials as expected for a collisionally-ionized gas. Asstressed inthe discussion of Figure 8 the distribution of ions and molecules inthe extra-heating case is sharply defined by temperature. Ata giventemperature hydrogen will be nearly all ionized, atomic, ormolec-ular with the change from one species to the next occurring over arelatively small range in temperature.
This behavior is to be contrasted with the cosmic-ray case.Here a certain level of ionization and excitation is presentat all gaskinetic temperatures because the cosmic-ray ionization rates areonly indirectly related to temperature. The result is that some H0
is present in regions that are predominantly H2 or H+. We find thesomewhat paradoxical result that the higher-ionization (3.00 Rydto create) [NeIII ] λ3869A line becomes strong at lower tempera-tures than the lower-ionization (2.58 Ryd) [OIII ] λλ5007,4959A
c© RAS, MNRAS000, 1–27

22 G.J. Ferland et al.
lines. This is because of the importance of charge-transferrecom-bination in setting the ionization distribution of O. The processO+n + H0 → O+n−1 + H+ is very fast for both O+ and O+2 butis slow for He+, Ne+, and Ne+2. Larger amounts of H0 are presentin the cosmic-ray case because of the mixing of different ioniza-tion species in the same region. The result is that the cosmic-raycase produces significant [NeII ] λ12.81µm and [NeIII ] λ3869Aemission without exceeding the upper limit to [OIII ] λ5007A.
He I λ5876A provides another distinction between the cos-mic ray and extra-heat cases. He0 is more efficiently ionized bysuprathermal than by lower-energy thermal particles due toits largeionization potential. Theλ5876A line is in fair agreement with theobserved value in the cosmic ray case while it is underpredicted bymore than 4 dex in the extra heating case.
Figure 18 shows the fundamental tension experienced by thetwo cases. We do not include the thermally unstable temperaturesindicated by the grey bar in the Figure. The extra-heating casecould only produce significant HeI and [NeIII ] emission by in-cluding large amounts of unstable gas. This would overpredict theunobserved [OIII ] λ5007A line by large factors. The cosmic-raycase produces strong He and Ne emission while not overproducing[O III ].
Johnstone et al (2007) discuss the puzzle posed by the ob-served [NeIII ] emission from filaments that do not show signifi-cant [OIII ] λ5007A. Neon is special because of the high ionizationpotentials compared with other second row elements like N orO.[Ne III ] was not detected in the Horseshoe but was seen in anotherregion where [OIII ] was weak. Johnstone et al (2007) suggestedthat a low kinetic temperature in the ionized gas, perhaps the resultof enhanced abundances and cooling efficiency, might be the cause.Cosmic-ray ionization is another possibility.
These calculations demonstrate that cosmic rays are neededto account for the spectrum. Suprathermal particles such asthoseproduced by cosmic rays create a gas with a broad range of ion-ization at any one point. Charge transfer recombination then pro-duces the observed unusual ionization distribution of the heavy ele-ments. Although we have explicitly considered cosmic rays,whichare known to exist in the cluster environment, any source of ion-izing particles would work as well. Although gentle heatingbyMHD waves is ruled out, MHD waves could still be the funda-mental source of the ionization since high-energy particles may beproducedin situ by MHD phenomena such as magnetic reconnec-tion (Lazarian 2005).
Crawford & Fabian (1992) showed that photoionization by avery hard continuum source can produce the optical spectrum.High-energy photons produce primary and Auger electrons thathave very high energies and so behave as ionizing particles.Theirmodel worked for the same reasons that the cosmic-ray model dis-cussed above works. The ionizing particles generate a gas with amix of molecules, atoms and ions, charge transfer effects are impor-tant, and a peculiar low-ionization spectrum is produced. Photoion-ization by very hot objects is another viable source of the deducedpopulation of suprathermal particles.
A form of mixing layers might also produce the ionizing par-ticles. If hot ionized gas were to mix with cold molecular gastheresulting physical state would be determined by the microphysicsof the collisional interactions rather than by the ratio of kinetic tem-peratures. Any energy source that deposits its energy as ionizingparticles rather than as heat can produce the observed spectrum.Our predictions do not depend on the fundamental energy injec-tion, only on the eventual production of a population of suprather-mal particles. We shall refer to this as ionizing particle heating in
the remainder of this paper to reflect the fact that there are manypossible sources of these particles.
6 DISCUSSION
6.1 The geometry
Our deduced value ofα =−0.35 corresponds to the majority of thevolume being filled by low-density ionized gas. The density of themolecular regions is typically ¯nmole/nion ∼ 103 times higher thanthe density of the ionized gas (Figure 15). The ratio of volumes isthenVmole/Vion ∼ 103α ∼ 0.09. By contrast, most of the mass is indense molecular cores. The mass depends onnα+1 so the ratio ofmasses isMmole/Mion ∼ 103(α+1) ∼ 90. The small dense molecularcores may provide the reservoir of material for an extended halo oflow-density ionized gas. If the gas is constrained to followmagneticfield lines then the individual clouds may resemble comets with acold dense core and extended warm low-density tail.
The observed surface brightness in Hα and the predicted4π j(Hα), both listed in Table 5, can be combined with Equation22 to find the line-of-sight thickness of emitting material.The de-duced thickness isdl = 1.0×1018 cm= 0.3 pc. Note that this is thethickness of the entire cloud, not just the H+ region, although mostof this is filled by ionized gas.
This depth is similar to that found by Fabian et al (2003) fromfundamentally different assumptions. They assumed that the opti-cal H I lines are formed by recombination with Case B intensities,that the pressure of the HI-emitting gas was equal to that of the sur-rounding hot gas, and that the gas was fully ionized with a temper-ature of∼ 104 K. If the gas is excited by ionizing particles then HI
is far more emissive than predicted by Case B due to the enhance-ment by collisional excitation (Table 4). This large enhancementmakes up for the fact that hydrogen is not fully ionized across thevolume so the HI emission measure, the productnenp dl, is muchsmaller. These two factors nearly cancel leading to a similar depth.
For this surface brightness argument to work the entire en-trance aperture of the spectrometer must be covered by emittinggas. A slit width of 1′′ corresponds to a projected width of∼ 350 pcat the distance of Perseus. Each cloud is∼ 0.3 pc thick along theline of sight but must cover a region of the sky∼ 350 pc across. Theaspect ratio of the width to depth of the emitting gas is> 103 : 1since the region of the Horseshoe we observed is well resolved onthe sky. This aspect ratio, although surprising, is similarto othergeometric quantities in the system. HST observations show that theprojected width of the narrowest parts of the filaments is∼ 70 pc(Fabian et al 2008) while they have lengths of tens of kpc. Thefil-aments are composed of remarkably thin and long clouds.
The filaments are most likely composed of a network of muchsmaller threads. In the magnetic-field dominated constant-pressurecase assumed here gas is free to move along but not across fieldlines. The line surface brightness suggests that individual threadshave a width of a fraction of a pc. We view this geometry from adirection that is nearly orthogonal to the field lines. This is an ob-servational selection effect introduced by the way that isolated fila-ments were chosen for study. The narrowest filaments, with a widthof 70 pc, must be composed of∼ 102−103 of these thin threads.If the threads are uniformly distributed across the filaments, andthe filaments have a depth equal to their observed width, thenthemean separation between threads is∼ 10 pc, about thirty times theirthickness.
There are two possible physical interpretations for ourα
c© RAS, MNRAS000, 1–27

Collisional heating of cool cluster filaments 23
power-law index. It could represent a radial gradient in densityacross a thread normal to the field lines. In this case the densemolecular regions would form a very small linear core with thelower-density ionized gas surrounding it in a much larger cylin-der. We consider this unlikely since gas could not move across fieldlines to change its density in response to changes in the heating. Themore likely possibility is that theα index represents the variation ofthe density along magnetic field lines. In this picture the ionizing-particle density would vary with position or time, the temperatureof the gas would adjust itself in response, and then expand orcon-tract to maintain constant pressure. A magnetic field line wouldthen have most of its volume occupied by lower-density ionized gasintermixed with dense molecular regions. The cold dense molecu-lar regions could become warm and ionized, and return to beingcold and molecular, as the heating rate changes.
6.2 Internal extinction across a thread
The hydrogen column density through a thread normal to its surfaceis N(H) ∼ ndl≈ 1022.5 cm−2 . If the gas has a Galactic dust to gasratio, as we have assumed, then the total visual extinction across athread will beAv ∼ 17 mag. The effects of this extinction dependson the geometry. The dense molecular regions, having most ofthecolumn density, would also be most extinguished. This region de-tected emits MIR and sub-mm emission where the extinction willhave little effect. The column density through the partially ionizedgas which produces most of the optical emission is small so thisemission is not directly affected by internal extinction. We couldnot detect optical emission from ionized regions which happenedto lie on the far side of the molecular cores of course.
6.3 The total mass at position 11
The total mass can be derived from the luminosity of any emissionline using the formalism derived in Section 5.2. Section 5.4derivedanL(Hα) of 5.5×1040 erg s−1 for position 11 and the beam usedby Salome et al (2008b). Equation 21 gives a total mass of 2.1×10⁸ M⊙. This is in reasonable agreement with the mass of 108 M⊙derived by Salome et al (2008b) from observations of the CO 1-0transition.
The mass of 2.1×10⁸ M⊙ derived from emission lines countsonly the spectroscopically active gas. As Figure 15 shows, littleemission is produced by cold gas at the high-density end of the dis-tribution. Gas denser than our high-density limit cannot exist andbe in pressure equilibrium because the CMB sets the lowest possi-ble temperature. However there is no observational constraint thatactually limits the amount of material that could be at this highestdensity and the CMB temperature. A large reservoir of very coldhigh density gas could exist and remain undetected. Our derivedmass is a lower limit as a result. Gas at the very coldest limitofthe distribution could serve as the source of fresh materialfor thespectroscopically active regions.
6.4 The pressure of the molecular cores
A number of studies have estimated the pressure of the moleculargas. Next we compare these with our derived temperature and den-sity which assume a pressure equal to that of the surroundinghotgas.
Jaffe et al (2001) found a densitynH > 105 cm−3 and T ∼103.2 K from the distribution of H2 level populations. The gas pres-
sure,nT > 108.2 K, was substantially higher than the pressure ofthe surrounding hot gas. For our best fitting ionizing particle modelmost of thev = 0, low-J, H2 emission originates in gas with a tem-perature of aboutT ∼ 101.3 K and a densitynH ∼ 105.2 cm−3, asshown in Figure 15. Excited-v emission occurs at a higher temper-ature,T ∼ 103.2 K, and lower density,nH ∼ 103.3 cm−3. We do notpresent level-excitation diagrams in this paper but note that we havefitted the observed H2 spectrum, from which the H2 level-excitationpopulations were derived, to within a factor of two. Our model pro-duces a population distribution that is consistent with these obser-vations.
Salome et al (2008a) argue that the filaments are composed ofan ensemble of Galactic Giant Molecular Cloud-like components.By analogy with GMCs they argue that the density in the CO re-gion is several hundred particles per cubic centimeter and that thegas has a kinetic temperature ofT ≈ 20−40 K. The resulting pres-sure,nT ≈ 103.3 cm−3 K, is 3.2 dex smaller than the pressure of thesurrounding hot gas.
We avoid geometrical complexities by focusing on opticallythin emission lines. Figure 15 shows that the optically thinemis-sivity of the COλ863 µm line peaks atTk,CO ≈ 20 K andn ≈104.2 cm−3. This temperature is similar to the CO temperaturequoted by Salome et al (2008a) but the density is considerablyhigher in keeping with our assumed high gas pressure. The dif-ference is due to the higher cosmic ray density in our simulations.Well-shielded regions of Galactic GMCs are similarly heated bycosmic rays but with a considerably lower intensity equal totheGalactic background. The cosmic ray density that produced thepeak in our simulations is∼ 104 times the Galactic background.This accounts for the GMC-like temperatures at such a high pres-sure. It is not possible to make a specific prediction of the CO1-0brightness temperature without first deriving an explicit geometricmodel of the cloud, a task beyond the scope of this paper.
We conclude that both the H2 spectrum and CO bright-ness temperature are consistent with a gas pressure ofnT =106.5 K cm−3 and excitation by ionizing particles.
6.5 Gravitational stability
The stability of the material in the filaments to gravitational col-lapse may be influenced by a number of factors: basic geometry,turbulence and magnetic fields.
If the support of the filaments is purely by thermal pressure,then they will be liable to collapse when their size becomes greaterthan the Jeans length,
RJ ≃ 1018c5n−1/25 cm, (23)
wherec5 is the sound speed (or effective virial velocity) in kms−1
and the density is 105n5 cm−3. Forc5 = 1, n5 = 1 the thickness ofthe molecular material will be 0.3pc, a similar scale to that inferredfor the Hα emitting region. We infer above that the molecular mate-rial has a volume filling fraction about one tenth that of the ionizedgas, so the size scale of the molecular material will be comparableto this. This suggests that the gravitational stability of the molecularcomponent may have a significant role in determining the structureof the filaments.
Magnetic fields and turbulence may play a significant role insupporting the molecular material against gravitational collapse.The standard criterion for support against collapse by uniform mag-netic fields is to compare the column density along a flux line tothe critical valueB/2πG1/2. If the dense material is threaded along
c© RAS, MNRAS000, 1–27

24 G.J. Ferland et al.
flux tubes, this is not a significant constraint as is stands. Likelymore important is the coupled effects of turbulence and randomlydirected internal magnetic fields. These will act to increase the ef-fective virial velocity of the material, and so support it against col-lapse.
However, both turbulence and random magnetic fields are in-herently transient, and so must be driven in some fashion to main-tain their role in supporting the material. In the local interstellarmedium, this driving is achieved by a number of processes, in-cluding star formation. While there is some evidence of starfor-mation in the filaments, this appears to be a relatively localisedphenomenon.
What will happen if part of the molecular material in a fila-ment starts to undergo a gravitational collapse? We find thatthecooling timescale (∼ 102 yr) is significantly smaller than the dy-namical timescale (∼ 3×10⁵ yr), so the material may initially frag-ment. However, the enhanced density will mean that the net tidalforce between the material and the surrounding diffuse envelopewill increase, both allowing the filament to break up, and enhanc-ing the net heating. This process may thus naturally maintain thefilaments with marginal gravitational stability, in a similar fashionto that in which galactic disks are maintained with a Toomre Qpa-rameter around unity. Note that if this is the case, it requires that theheating rate is determined bylocal processes, such as drag-drivenreconnection.
6.6 The energy budget
The energy dissipation timescale for the line-emitting material isshort, requiring that the energy be replenishedin situ. While it isclear from Figure 15 that below 104 K the detailed cooling mech-anisms depend on the temperature, from Figure 13 the overallcooling rates do not depend strongly on these details. The heat-ing need to power the emission regions in steady state rangesfromΛ ∼ 10−19±1 erg cm−3 s−1 while the thermal timescale of the gasis∼ 102 yr (Figure 14).
A lower limit to the energy density of MHD waves in equipar-tition with a magnetic field of 100µG, the weakest B capable ofconfining the clouds, is
Uwave= 4.4×10⁻¹⁰(B/100µG)2 erg cm−3.
For the quoted heating rate this energy will be dissipated inatimescale
τwave= Uwave/Λ = 102±1 (B/100µG)2 yr
over which the wave energy has to be replenished.The timescales for the cosmic-ray heated case are somewhat
longer. The Galactic background cosmic-ray density correspondsto an energy density of∼ 1.8 eV cm−3 (Webber 1998), mostly inhigh-energy nuclei. The cosmic-ray intensity required to maintainthe material atnT ∼ 106.5 cm−3 K ranges between 102–106 timesthe Galactic background value, depending on the filament density(Figure 12). Molecular regions are predicted to have a density ofnH ∼ 105 cm−3 and require a cosmic-ray∼ 103 times the back-ground. The low-ionization gas requires a rate∼ 106 times thebackground with a density ofnH ∼ 102.5 cm−3. For these valuesthe energy dissipation time for the molecular and low-ionizationregions are∼ 103 yr and∼ 5×10⁵ yr respectively.
These replenishment timescales are generally of order orlonger than the cooling time (Figure 14), the time required for thegas to adjust itself to a changing heating rate. This means that non-equilibrium effects, in which the ionization, heating, andcooling
decouple from one another, may be important. The short heating/ cooling times suggests that the gas pressure can fluctuate aboutits equilibrium value in response to variations in the environmentalheating, and may drive sound waves. The resulting structures maybe intrinsically quite dynamic and disequilibrium.
The size scale of a thread appears to be∼ 0.3pc. Assumingthat they are cylindrical, then if they are heated through their sur-faces the energy flux required to keep them in equilibrium is
F ≃ rfil
2Λ ≃ 0.05ergcm−2 s−1. (24)
If the field which provides this energy has an energy densityXtimes the thermal energy density inferred for the surrounding X-raybright gas, the net speed of energy transport through the surface ofthe filaments must be
v≃ 108 rfil
X0.3pccms−1. (25)
While this suggests that it is easier to heat more narrow filaments,the same energetic constraints will apply to an assembly of fila-ments if the observed surface brightness is to be produced. Forcomparison, the Alfven velocity is
vA =B
(4πρ)1/2(26)
≃ 7×10⁴n−1/25 (B/100µG) cms−1, (27)
and the sound speed will also be of order 1kms−1. This suggeststhat the energy required to heat the filaments can only be trans-ported through the molecular material by non-thermal particlesor radiation. However, this does not rule out it being convertedinto this form locally to the filaments, as energy transport is eas-ier through the more diffuse components with higher characteristictransport speeds.
The filament material does not appear to be supported againstgravity by lateral kinetic energy, as the observed speeds are belowthe local Keplerian velocity, and the filaments are being draggedaway from the stellar populations which are believed to haveformed within them. If this is the case, the net rate of drag heat-ing of the material per unit mass will be approximately
Γtidal ≃ gvdrag≃v2
Kepvdrag
r(28)
≃ 0.3ergg−1 s−1 ≃ 5×10⁻²⁰n5 ergcm−3 s−1 (29)
assumingvKep≃ 103 kms−1, vdrag≃ 102 kms−1 and that the mate-rial has a density of 105n5 cm−1. This energy input rate is in therange of interest for heating the filaments, as already suggestedfrom the overall energy budget by Pope et al (2008). Note thatthespatial distribution of this energy input will be determined by thedetails of the drag processes between the phases, so that theresult-ing energy input may appear either in the dense material or withinthe halo of the material.
Note that these scaling values can be formed into a simpleestimate of the rate at which mass passes through the system offilaments, by dividing the total mass inferred for the molecular fil-aments by the dynamical timescale of the material, i.e.
≃ MCOvdrag/r ≃ 50M⊙ yr−1, (30)
which is similar to the mass processing rate inferred for theradia-tive cooling of the hot material in these regions.
At high Reynolds number, the drag force is roughly equal tothe ram pressure between the phases. At the relative densityof theX-ray hot medium and the molecular gas, this would suggest that to
c© RAS, MNRAS000, 1–27

Collisional heating of cool cluster filaments 25
prevent the dense material moving at free fall velocities, the relativemotion of the hot material must be at(nmol/nhot)
1/2vff , which arenot likely to be the case. The filament material may be transitoryon a timescale∼ vfil /g ≃ 3× 10⁶ yr, in which time the filamentmaterial will travel∼ 1/2(v/vKep)
2 of the distance to the core of thecluster. Alternatively, their effective cross section maybe increasedeither by an effective viscosity or by magnetic fields.
The interphase drag will lead to magnetic field lines in thediffuse phases becoming wrapped around the dense material.Thissuggests that the magnetic structure may be somewhat like the bub-ble in the solar wind maintained by the earth’s magnetosphere.The resulting magnetic segregation would limit high energypar-ticle transport into the molecular material. It is likely that somehigh energy particles will be able to leak in, either throughmag-netic neutral points, as a result of turbulent motions, or bydiffusionresulting from field inhomogeneities. Alternatively, the drag-driventurbulence may itself be the source of the high-energy particle flux,as a result of reconnection events.
Overall, it is clear that the dissipation of the energy resultingfrom buoyancy has potential as a source of heating for the fila-ments. However, if this is the source of the heating, the means bywhich the energy is transformed into the non-thermal ionizationswhich we infer are the immediate means by which the molecularmaterial is heated must be complex.
6.7 What is the source of the ionizing particles?
The chemical-ionization state of the gas strongly suggeststhat thethe heating and ionization is produced by ionizing particles. Severalconsiderations suggest that the population of ionizing particles isnot produced by a strongly enhanced version of Galactic cosmicrays.
The energy density Galactic cosmic rays is dominated byparticles with energies around 1GeV in the solar neighbor-hood (where at higher energies the energy spectrum is∝ E−2.5,Spitzer & Tomasko (1968)). Most of the energy is in high-energyprotons which have a long range and do not interact strongly withmatter. The CR particles lose energy by ionizing the material theypass through, primarily by producing secondary electrons with en-ergies around 50eV. These secondary electrons further ionize andheat the gas, but they will be transported by relatively small dis-tances.
As a rough estimate of their range, the velocity of CR protonsat 1GeV isv=
√3/2c, so from equation (3) of Spitzer & Tomasko
(1968) the interaction cross section with atomic hydrogen is ∼10−19 cm2. Each interaction causes the particle to lose∼ 50eV ofits energy. The range of the CR heating particles is therefore
LCR ≃ Enσ∆E
≃ 700n−15 pc. (31)
However, this range may be significantly reduced by the magneticfield. The gyroradius of the protons in a 100µG = 10nT field is
rg =γmveB
= 3×10¹⁰γβ cm (32)
so the protons will be tightly coupled to the magnetic field lines, but(at least at first order) free to travel along them. Non-uniformitiesin the field geometry will allow particles to diffuse across the fieldlines.
The distance which the particles can travel in a dissipationtime is∼ 30pc in the molecular gas and∼ 150kpc in the atomicgas. This suggests that the cosmic rays can travel with little reduc-tion in intensity across the size scale of an individual thread. It is
difficult to see how the flux of cosmic rays could be modulated tothe extent that we need to produce the range in density shown inFigure 12.
Even if we were to assume that the large flux of CR requiredto heat the ionized material could be excluded from the molecu-lar core, this would result on a pressure acting on the molecularmaterial which would be inconsistent with our models. The Galac-tic background cosmic ray energy density of∼ 1.8 eV cm−3 cor-responds to a pressure of∼ 2× 104 cm−3 K. Our spectral modelrequires a range of ionization rates between 102 − 106 timesthe background. The corresponding pressure is between 106.3 −1010.3 cm−3 K, with the top of this range being far larger than thatinferred for the molecular material. The logical conclusion is thatthe inferred suprathermal ionization is not associated with a popu-lation of relativistic nuclei that is similar to Galactic cosmic rays.
As described above, other possible sources of suprathermalelectrons include magnetic reconnection, mixing layers, and pho-toionization by very hard radiation fields.
6.8 The history of the gas
The origin of the filaments is unknown. Two possibilities arethatmolecular gas was ejected from the ISM of the central galaxy orthat they formed from the surrounding hot gas which fills the cluster(Revaz et al 2008).
We have shown that the filaments are energized by a popula-tion of ionizing particles. High-energy particles destroymoleculesin addition to heating the gas. Figure 15 shows the the peak COand H2 line emission occurs atn ∼ 105.3 cm−3 while Figure 12shows that this occurs at a cosmic ray ionization rate of∼ 102.5
times the Galactic background, which Williams et al (1998) give as5×10−17 s−1. The corresponding H2 dissociation rate of∼ 1.6×10¹⁴ s−1 corresponds to an H2 survival time of only∼ 2×10⁶ yr.This is very close to the H2 formation timescale for the dusty case,as give in Section 3.5 above, but far shorter than the formationtimescale in the dust-free case. We conclude that that gas must bedusty to support the observed molecular inventory against rapid de-struction by ionizing particles.
Perhaps surprisingly, the abundances are fairly close to thatof the ISM of our galaxy. In photoionization equilibrium the‘ther-mostat effect’ governs the strength of forbidden lines relative tohydrogen lines.Their intensity ratio has no direct dependence onthe abundances (Ferland 2003). In the non-radiatively heated casesconsidered here the strength of the forbidden lines is a product ofboth the temperature of the gas and the abundance of the element.In this case the intensities of forbidden lines relative to hydrogenlines depends linearly on the abundance of the heavy elementrela-tive to hydrogen. This suggests that the metallicity of the filamentsis within a factor of two of solar.
The [Ca II] doublet nearλ7320A is strong if grain are notpresent (Kingdon et al 1995). The absence of this line shows thatCa is depleted by at least an order of magnitude, also suggestingthat dust is present.
7 CONCLUSIONS
(1) We propose a model in which the filaments have a constantgas pressure that is set by the pressure of the surrounding hot gas.The overall geometry is set by magnetic field lines. Gas is freed tomove along field lines but not across them.
c© RAS, MNRAS000, 1–27

26 G.J. Ferland et al.
(2) We consider gas heating by dissipation of MHD wave en-ergy and by cosmic rays. If a range of heating rates occur thenthegas will expand or contract along field lines to maintain constantpressure. Low heating rates result in dense molecular coreswhilehigh heating rates produce an extended warm ionized gas.
(3) The relative proportions of molecular and low-ionizationemission is set by the proportion of high and low density gas that ispresent. In our final best-fitting model most of the volume is filledby low-density ionized gas while most of the mass is in dense coldmolecular cores.
(4) Both wave and cosmic-ray heating can match most emis-sion line intensities within a factor of two. The distribution of low-ionization emission lines shows that charge transfer strongly affectsthe ionization. This is only produced in the cosmic-ray case, wherea population of suprathermal electrons produces a gas with awidemix of ionization. Although we explicitly consider cosmic rays anysource of ionizing particles would work as well.
(5) The emission measure shows that the filaments are com-posed of a network of much smaller threads, each∼ 0.3 pc in ra-dius and separated by∼ 10 pc. A single filament is composed ofhundreds to thousands of these threads.
(6) The mass we derive from fitting the entire spectrum is inreasonable agreement with mass estimates from optically thick COlines. There may be an even larger reservoir of dense moleculargas at the CMB temperature which would not be spectroscopicallyactive.
(7) The observed molecular inventory requires that dust bepresent to sustain the needed H2 formation rate. The presence ofdust suggests that the filaments have not been strongly shocked anddid not form out of the surrounding hot and presumably dust-freegas.
(8) The metallicity is within a factor of two of solar. Both thisand the presence of dust suggests that the gas originated in the ISMof the central galaxy.
(9) The calculations presented here use the development versionof Cloudy, which we have expanded to include new H2 collisionrates and resolve H0 configurations intonl terms. The critical densi-ties of the H2 levels which produce the observed emission are con-siderably lower than previously estimated. The ionizing particle-excited HI spectrum has relative intensities that are not too differ-ent from Case B but has emissivities which are far higher.
8 ACKNOWLEDGMENTS
We thank Steven A. Wrathmall and David Flower for providinganalytical fits to their new H – H2 collision rate coefficients andPhilippe Salome for comments on the manuscript. ACF acknowl-edges support by the Royal Society. RMJ acknowledges supportby the Science and Technology Facilities Council. GJF thanks theNSF (AST 0607028), NASA (NNG05GD81G), STScI (HST-AR-10653) and the Spitzer Science Center (20343) for support. PvH ac-knowledges support from the Belgian Science Policy Office (grantMO/33/017).
REFERENCES
Abel, N.P., Ferland, G.J., Shaw, G. & van Hoof, P.A.M. 2005,ApJS, 161, 65
Adams, T. 1972, ApJ, 174, 439
Allers, K. N., Jaffe, D. T., Lacy, J. H., Draine, B. T. & Richter, M.J. 2005, ApJ, 630, 368
Anderson, H., Ballance, C.P., Badnell, N.R., & Summers, H.P2000, J Phys B, 33, 1255
Baker, J.G., & Menzel, D.H. 1938, ApJ, 88, 52Baldwin, J. A., Ferland, G. J., Korista K. T., & Verner, D. 1995,ApJ, 455, L119
Black, John H. & van Dishoeck, E.F. 1987, ApJ, 322, 412Cazaux, S., & Tielens, A.G.G.M., 2002, ApJ, 575, L29-L32Conselice, C.J., Gallagher, J.S. & Wyse, R.F.G. 2001, AJ, 122,2281
Crawford, C.S., & Fabian, A.C. 1992, MNRAS, 259, 265Dalgarno, A., 1996, PNAS 10312269Dalgarno, A., & McCray, R. A. 1972, ARA&A, 10, 375Dalgarno, A., Black, J.H., & Weisheit, J.C. 1973, ApL, 14, 77Dalgarno, A., Yan, Min, & Liu, Weihong 1999, ApJS, 125, 237Dyson, J.E., & Williams, D.A. 1997, The Physics of the Interstel-lar Medium (Bristol; Institute of Physics Publishing)
Elitzur, M., & Ferland, G. J. 1986, ApJ, 305, 35Fabian, A.C., Johnstone, R.M., Sanders, J.S., Conselice, C.J.,Crawford, C.S., Gallagher III, J.S. & Zweibel, E., 2008, Naturesubmitted
Fabian, A.C., Sanders, J.S., Crawford, C.S., Conselice, C.J., Gal-lagher III, J.S. & Wyse, R.F.G., 2008, MNRAS 344, L48
Ferland, G.J., 2003, ARA&A, 41, 517Ferguson J.W., & Ferland G.J., 1997, ApJ, 479, 363Ferland G.J., Korista K.T., Verner D.A., Ferguson J.W., KingdonJ.B., Verner E.M., 1998, PASP, 110, 761
Ferland, G.J., Fabian, A.C., Hatch, N., Johnstone, R., Porter, R.L.,van Hoof, P.A.M., & Williams, R.J.R. 2008, MNRAS 386, 72L
Ferland, G. J., Fabian, A. C., & Johnstone, R.M. 1994, MNRAS,266, 399
Ferland, G. J., Fabian, A. C., & Johnstone, R.M. 2002, MNRAS,333, 876
Ferland, G. J., & Mushotzky, R. F. 1984, ApJ, 286, 42Ferland, G. J., & Netzer, H. 1979, ApJ, 229, 274Ferland, G. J., & Rees, M. J. 1988, ApJ, 332, 141Fernandes, A.J.L., Brand, P.W.J.L. & Burton, M.G. 1997, MN-RAS, 290, 216
Field, G. B. 1965, ApJ, 142, 431Field, G.B., Goldsmith, D.W. & Habing, H.J. 1969, ApJ, 155L,149
Guidetti, D., Murgia, M., Govoni, F., Parma, P., Gregorini,L., deRuiter, H.R., Cameron, R.A. & Fanti, R. 2008, A&A, 483, 699
Haardt, F., & Madau, P., 1996, ApJ, 461, 20Harrington, J. P. 1973, MNRAS, 162, 43Hatch, N.A., Crawford, C.S., Fabian, A.C., & Johnstone, R.M.2005, MNRAS 358, 765
Hatch, N.A., Crawford, C.S., Johnstone, R.M. & Fabian, A.C.,2006, MNRAS 367, 433
Heiles, C. & Crutcher, R. 2005, Magnetic Fields in Diffuse H IandMolecular Clouds, Chapter in Cosmic Magnetic Fields, astro-ph/0501550
Indriolo, N., Geballe, T.R., Oka, Takesi, & McCall, B.J. 2007,ApJ, 671, 1736
Jaffe, W., Bremer, M.N. & Baker, K. 2005, MNRAS 360, 748Jaffe, W., Bremer, M.N. & van der Werf, P. P. 2001, MNRAS 324,443
Johnstone, R., Hatch, N., Ferland, G.J., Fabian, A.C., Crawford,C., & Wilman, R. 2007, MNRAS 382, 1246
Jura, M., 1975, ApJ, 197, 575
c© RAS, MNRAS000, 1–27

Collisional heating of cool cluster filaments 27
Kingdon, J., Ferland, G.J., & Feibelman, W.A. 1995, ApJ, 439,793
Lazarian, A., 2005, in Magnetic Fields in the Universe: FromLab-oratory and Stars to Primordial Structures, edited by de Gouveiadal Pino, E. M., Lugones, G., Lazarian, A., AIP Conference Pro-ceedings, 784, pp. 42-53
Le Bourlot, J.; Pineau des Forts, G.; Flower, D. R. 1999, MNRAS,305, 802
Loewenstein, M. & Fabian, A.C. 1990, MNRAS, 242, 120Lupu, R.E., France, K. & McCandliss, S.R. 2006, ApJ, 644, 981LMandy, M.E. & Martin, P.G. 1993, ApJS, 86, 119Myers, P.C. & Goodman, A.A. 1998, ApJ, 326, L27Osterbrock D., Ferland G.J., 2006, Astrophysics of gaseousneb-ulae and active galactic nuclei, 2nd. ed . by D.E. OsterbrockandG.J. Ferland. Sausalito, CA: University Science Books,
Pengelly, R. M. 1964, MNRAS, 127, 145Pengelly, R. M. & Seaton, M.J. 1964, MNRAS, 127, 165Pope, E. C. D., Hartquist, T. W. & Pittard, J. M., 2008. MNRAS,389, 1259
Porter, R.L., Bauman, R.P., Ferland, G.J., & MacAdam, K. B.2005, ApJ, 622, 73L (astro-ph/0502224)
Porter, R.L., & Ferland, G.J. 2007, ApJ, 664, 586 (astro-ph/0704.2642)
Revaz, Y., Combes, F., & Salome, P. 2008, A&A, 477, L33Rollig, M., Abel, N. P. Bell, T. Bensch, F. Black, J. Ferland, G.J. Jonkheid, B. Kamp, I. Kaufman, M.J. Le Bourlot, J. Le Petit,F. Meijerink, R. Morata, O. Ossenkopf, V. Roueff, E. Shaw, G.Spaans, M. Sternberg, A. Stutzki , J. Thi, W.-F. van Dishoeck, E.F. van Hoof, P. A. M. Viti, S. & Wolfire, M.G. A&A, 2007, 467,187
Salome, P., Combes, F., Edge, A.C. et al 2006, A&A, 454, 437Salome, P., Revaz, Y., Combes, F., Pety, J., Downes, D., Edge,A.C., & Fabian, A.C., 2008a, A&A, 483, 793
Salome, P., Combes, F., Revaz, Y., Edge, A.C., Hatch, N.A.,Fabian, A.C. & Johnstone, R.M., 2008b, A&A, 484, 317
Sanders, J.S. & Fabian, A.C. 2007, MNRAS, 381, 1381 (astro-ph0705.2712)
Schlegel, D. J., Finkbeiner, D. P. & Davis, M. 1998, ApJ, 500,525S
Sellgren, K., Tokunaga, A. T., & Nakada, Y. 1990, ApJ, 349, 120Shaw, G., Ferland, G.J. Abel, N.P., Stancil, P.C. & van Hoof,P.A.M. 2005, ApJ, 624, 794
Shaw, G., Ferland, G. J., Srianand, R., & Abel, N. P. 2006, ApJ,639, 941
Shaw, G., Ferland, G. J., Srianand, R., Abel, N. P., van Hoof ,P.A. M. & Stancil P. C. 2008, ApJ 675, 405
Shemansky, D.E., Ajello, J.M., & Hall, D. T. 1985, ApJ, 296,765Spitzer, L., & Tomasko, M. G. 1968, ApJ, 152, 971Sternberg, A., 2005, Astrochemistry: Recent Successes andCur-rent Challenges, Proceedings of the 231st Symposium of theInternational Astronomical Union, Edited by Lis, Dariusz C.;Blake, Geoffrey A.; Herbst, Eric. Cambridge: Cambridge Uni-versity Press, 2005., pp.141-152
Sternberg, A., & Dalgarno, A. 1989, ApJ, 338, 197Sternberg, A., Dalgarno, A. & Lepp, S. 1987, ApJ, 320, 676Taylor, G.B., Fabian, A.C., Bentile, G., Allen, S.W., Crawford, C.& Sanders, J.S. 2007, MNRAS 382, 67
Tielens, A. G. G. M., 2005, The Physics and Chemistry of the In-terstellar Medium, Cambridge, UK: Cambridge University Press
Tine, S.,; Lepp, S., Gredel, R. & Dalgarno, A., 1997, ApJ, 481,282
Tytarenko, P. V., Williams, R. J. R., & Falle, S. A. E. G., 2002,
Table A1. Predicted UV and optical line ratios.
Line λ(µm) Extra Heat Cosmic Ray
Mg II 0.2798 1.64E-01 1.04E-01[O II ] 0.3727 1.18E+00 1.27E+00H I 0.3798 6.41E-03 1.09E-02H I 0.3835 9.38E-03 1.52E-02
[Ne III ] 0.3869 1.28E-10 1.32E-02He I 0.3889 7.45E-06 9.01E-03H I 0.3889 1.45E-02 2.24E-02H I 0.3970 2.44E-02 3.52E-02
[S II ] 0.4074 4.78E-02 4.16E-02H I 0.4102 4.59E-02 6.08E-02H I 0.4340 1.02E-01 1.20E-01He I 0.4471 8.51E-07 5.39E-03He II 0.4686 1.40E-13 4.36E-03H I 0.4861 2.27E-01 2.71E-01νFν 0.4885 2.39E+00 1.43E+00
[O III ] 0.5007 9.73E-10 2.01E-03[N I] 0.5199 1.13E-01 1.02E-01[N II ] 0.5755 7.15E-03 7.24E-03He I 0.5876 3.19E-06 1.83E-02[O I] 0.6300 1.91E-01 1.76E-01H I 0.6563 1.00E+00 1.00E+00
[N II ] 0.6584 2.15E-01 2.49E-01He I 0.6678 1.84E-06 5.41E-03[S II ] 0.6716 2.30E-01 2.37E-01[S II ] 0.6731 1.72E-01 1.78E-01He I 0.7065 8.36E-06 1.75E-03
[Ar III ] 0.7135 1.77E-06 8.57E-03[Ca II ] 0.7306 9.39E-04 2.17E-03[O II ] 0.7325 4.48E-02 4.95E-02[S III ] 0.9532 4.90E-05 8.43E-03
MNRAS, 337, 117van Dishoeck, E.F. 2004, ARA&A, 42, 119Webber, W.R. 1998, ApJ, 506, 329Williams, J.P., Bergin, E.A., Caselli, P., Myers, P.C., & Plume, R.1998, ApJ, 503, 689
Wrathmall, S.A., Gusdorf, A., & Flower. D.R. 2007, MNRAS382, 133
Xu, Y., & McCray, R. 1991, ApJ, 375, 190
This paper has been typeset from a TEX/ LATEX file prepared by theauthor.
APPENDIX A: THE EMISSION-LINE SPECTRUM
Table A1 lists the intensities of some of the brighter optical emis-sion lines while Tables A2 and A3 give the predicted lines in thenear IR through sub-mm regions.
c© RAS, MNRAS000, 1–27

28 G.J. Ferland et al.
Table A2. Predicted near IR line ratios.
Line λ(µm) Extra Heat Cosmic Ray
He I 1.083 7.72E-05 2.37E-02H2 1.631 4.45E-06 2.64E-04H2 1.636 5.55E-07 1.63E-04H2 1.639 9.00E-06 2.00E-04H2 1.645 1.62E-06 2.58E-04H2 1.650 2.05E-04 4.82E-03H2 1.658 1.83E-07 2.29E-04H2 1.666 2.80E-04 4.77E-03H2 1.675 6.16E-07 1.61E-03H2 1.687 2.58E-03 3.13E-02H2 1.695 2.28E-07 5.78E-04H2 1.714 2.32E-03 1.68E-02H2 1.719 6.73E-07 6.18E-04H2 1.747 2.43E-07 3.69E-04H2 1.748 1.58E-02 6.32E-02H2 1.748 1.58E-02 6.32E-02H2 1.780 5.95E-07 3.60E-04H2 1.787 1.05E-02 4.35E-02H2 1.835 5.57E-02 6.37E-02H I 1.875 8.39E-02 9.92E-02H2 1.891 2.83E-02 6.50E-02H2 1.957 1.15E-01 7.26E-02H2 2.033 4.33E-02 4.24E-02H2 2.121 1.23E-01 8.17E-02H I 2.166 4.84E-03 6.35E-03H2 2.201 1.50E-03 3.16E-03H2 2.223 2.76E-02 6.17E-02H2 2.247 1.12E-02 2.46E-02H2 2.286 5.77E-04 6.93E-03H2 2.406 9.16E-02 7.88E-02H2 2.413 3.05E-02 6.81E-02H2 2.423 8.65E-02 5.73E-02H2 2.437 2.41E-02 2.35E-02H2 2.454 5.57E-02 3.50E-02H2 2.475 1.26E-02 2.90E-02H2 2.499 2.42E-02 2.77E-02H2 2.527 4.69E-03 1.94E-02H2 2.550 8.45E-03 2.52E-02H2 2.558 3.09E-03 9.46E-03H2 2.595 1.30E-03 9.44E-03H2 2.626 2.18E-02 4.93E-02H2 2.710 9.63E-04 2.06E-02H2 2.718 3.59E-04 5.05E-03H2 2.719 1.27E-03 8.02E-03H2 2.730 1.03E-03 7.14E-03H2 2.802 7.75E-02 6.66E-02
Table A3. Predicted mid IR – sub-mm line ratios.
Line λ(µm) Extra Heat Cosmic Ray
H2 5.051 1.66E-02 3.70E-02H2 5.510 1.06E-01 1.57E-01H2 5.810 2.89E-03 1.16E-02H2 6.107 6.63E-02 7.30E-02H2 6.907 2.97E-01 2.47E-01H2 8.024 1.04E-01 1.04E-01H2 9.662 2.16E-01 1.83E-01H2 12.28 2.97E-02 3.15E-02
[Ne II ] 12.81 2.74E-04 2.78E-02[Ne III ] 15.55 3.17E-10 8.17E-03
H2 17.03 1.79E-02 1.94E-02[S III ] 18.67 1.48E-05 3.72E-03
H2 28.21 3.12E-04 2.07E-03[S III ] 33.47 2.89E-05 7.82E-03[SiIII ] 34.81 2.30E-02 8.98E-01[Ne III ] 36.01 2.76E-11 7.31E-04[O III ] 51.80 8.15E-11 1.29E-04[O I] 63.17 7.52E-02 2.75E+00[SiI] 68.40 1.43E-04 4.06E-03
[O III ] 88.33 1.16E-10 1.81E-04[N II ] 121.7 4.79E-03 7.83E-03[O I] 145.5 7.48E-03 1.43E-01[C II ] 157.6 2.57E-02 1.31E-01CO 323.6 4.17E-04 4.11E-02[C I] 609.2 2.75E-04 1.77E-02CO 647.2 1.60E-03 7.05E-01CO 863.0 1.07E-03 5.94E-01
c© RAS, MNRAS000, 1–27