Home Fires Involving Heating Equipment
74
Home Fires Involving Heating Equipment March 2016 Richard Campbell © March 2016 National Fire Protection Association
-
Upload
khangminh22 -
Category
Documents
-
view
2 -
download
0
Transcript of Home Fires Involving Heating Equipment

Home Fires Involving Heating Equipment
March 2016
Richard Campbell
© March 2016 National Fire Protection Association

Home Fires Involving Heating Equipment, 3/16 i NFPA Fire Analysis & Research Division
Abstract In 2009-2013, U.S. fire departments responded to an estimated average of 56,000 structure fires per year in homes that involved heating equipment. These fires resulted in annual losses of 470 civilian deaths, 1,490 civilian injuries, and $1.0 billion in direct property damage. These homes included one- and two-family homes (including manufactured homes) and apartments (including townhouses and other multi-family dwellings).
Space heaters are the type of equipment most often involved in home heating equipment fires, figuring in two of every five fires (40%). The fires involving space heaters accounted for 84% of the civilian deaths and 75% of civilian injuries in home fires caused by heating equipment, as well as over half (52%) of direct property damage. Another one-third (32%) of fires involved a fireplace or chimney, but these fires accounted for a much smaller share of civilian fatalities (5%) and civilian injuries (6%). Central heat and water heaters were responsible for 12% and 10% of home fires caused by heating equipment, respectively.
Keywords: fire statistics, home heating fires, space heater fires, fireplace and chimney fires, central heating fires, Acknowledgements The National Fire Protection Association thanks all the fire departments and state fire authorities who participate in the National Fire Incident Reporting System (NFIRS) and the annual NFPA fire experience survey. These firefighters are the original sources of the detailed data that make this analysis possible. Their contributions allow us to estimate the size of the fire problem. We are also grateful to the U.S. Fire Administration for its work in developing, coordinating, and maintaining NFIRS. For more information about the National Fire Protection Association, visit www.nfpa.org or call 617-770-3000. To learn more about the One-Stop Data Shop go to www.nfpa.org/osds or call 617-984-7451. Copies of this analysis are available from: National Fire Protection Association One-Stop Data Shop 1 Batterymarch Park Quincy, MA 02169-7471 www.nfpa.org E-mail: [email protected] Phone: 617-984-7451 NFPA No. USS09

Home Fires Involving Heating Equipment, 3/16 ii NFPA Fire Analysis & Research Division
Executive Summary
In 2009-2013, U.S. fire departments responded to an estimated average of 56,000 structure fires per year in homes that involved heating equipment. These fires resulted in annual losses of 470 civilian deaths, 1,490 civilian injuries, and $1.0 billion in direct property damage. These homes included one- and two-family homes (including manufactured homes) and apartments (including townhouses and other multi-family dwellings).
Heating equipment is a leading cause of fires in U.S. homes. Heating equipment caused 16% of home structure fires in 2009-2013, ranking as the second leading cause behind fires caused by cooking equipment. Home heating equipment fires also accounted for nearly one-fifth (19%) of civilian deaths (second behind fires caused by smoking materials), 12% of civilian injuries (second behind cooking equipment), and 15% of direct property damage (third behind electrical distribution and lighting equipment and cooking equipment).
Space heaters are the type of equipment most often involved in home heating equipment fires, figuring in two of every five fires (40%). Significantly, the fires involving space heaters accounted for 84% of the civilian deaths and 75% of civilian injuries in home fires caused by heating equipment, as well as over half (52%) of direct property damage. Another one-third (32%) of fires involved a fireplace or chimney, but these fires accounted for a much smaller share of civilian fatalities (5%) and civilian injuries (6%). Central heat and water heaters were responsible for 12% and 10% of home fires caused by heating equipment, respectively.
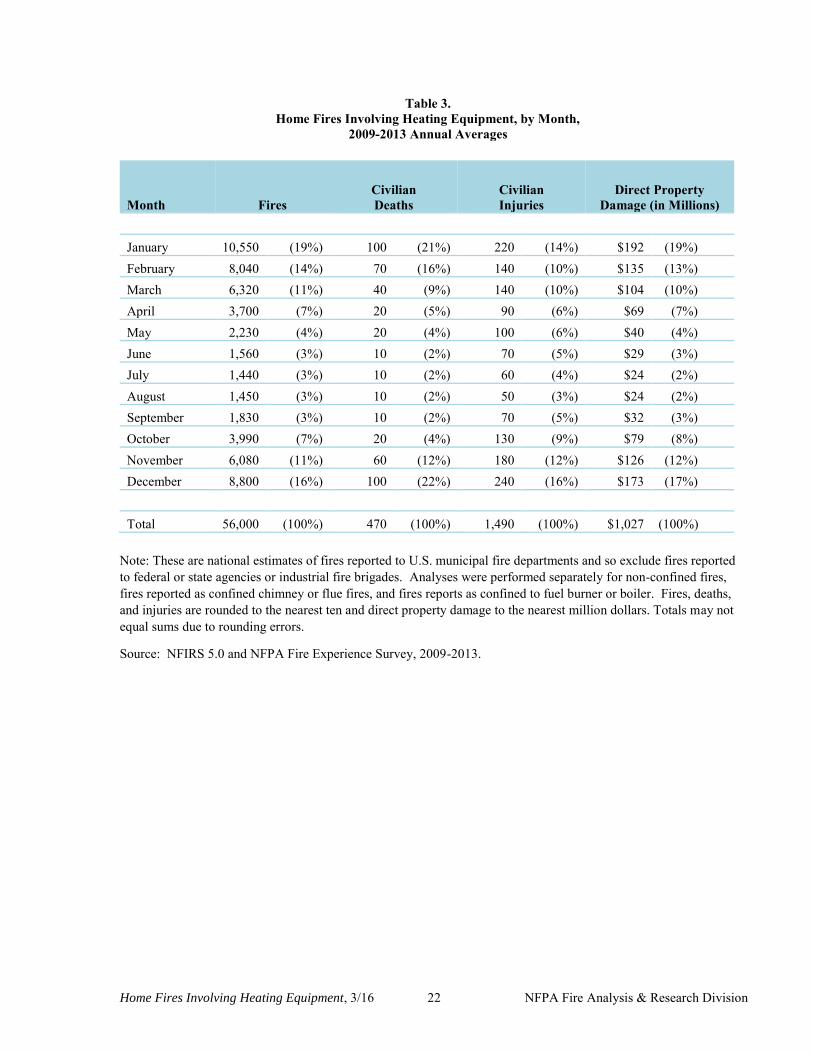
Home fires caused by heating equipment are influenced by seasonal changes and time of day. The peak months for home heating fires are the cold weather months of December, January, and February, which together account for nearly one-half (49%) of the annual total. (Figure 2) Three out of five (59%) of home heating fire deaths occur in these months. Fires in March and November, each with 11% of fires, also experienced a disproportionate share of heating equipment fires by month.
A variety of factors were identified as contributing to the ignition of home heating equipment fires. The leading factor that contributed to the failure of home heating equipment fires was “failure to clean,” accounting for 30% of fires, the majority of which were confined fires (27% of total). The second leading factor, “heat source too close to combustibles,” accounted for 14% of fires, but was responsible for the greatest share of heating fire losses – 56% of civilian deaths, 31% of civilian injuries, and 31% of direct property damage. A mechanical failure or malfunction (14%), unattended equipment (6%), electrical failures or malfunctions (5%), and unclassified use of materials or products (3%) were other leading factors contributing to ignition.
Fuel and power sources. Heating equipment powered by a solid-fueled source accounted for over two of every five home fires (43%) attributed to heating equipment, and these fires were associated with 25% of civilian deaths, 12% of civilian injuries, and 33% of direct property damage. Electric-powered heating equipment was responsible for a smaller share of the fires (32%), but a larger share of civilian fatalities (46%), civilian injuries (54%), and direct property damage (41%). Gas-fueled heating equipment accounted for another 18% of fires, 19% of civilian deaths, 27% of civilian injuries, and 22% of direct property damage.

Home Fires Involving Heating Equipment, 3/16 iii NFPA Fire Analysis & Research Division
Table of Contents
Page Abstract i Acknowledgements i Executive Summary ii Fact Sheet vii Section 1: Home Fire Involving Heating Equipment 1 Section 2: Home Structure Fires Involving Space Heaters 7 Section 3. Home Structure Fires Involving Fireplaces, Chimneys, and Chimney 11 Connectors Section 4. Home Structure Fires Involving Water Heaters 17 Appendix A. How National Estimates Statistics Are Calculated 59

Home Fires Involving Heating Equipment, 3/16 iv NFPA Fire Analysis & Research Division
List of Tables and Figures
Figures Page Figure 1. Home Structure Fires Involving Heating Equipment by Type of Equipment 1 Figure 2. Home Structure Fires Involving Heating Equipment, by Month 2 Figure 3. Home Structure Fires Involving Heating Equipment by Hour 2 Figure 4. Number of Home Structure Fires Involving Heating Equipment by Year 5 Figure 5. Civilian Deaths in Home Structure Fires Involving Heating Equipment 6 Figure 6. Civilian Injuries in Home Structure Fires Involving Heating Equipment 6 Figure 7. Home Structure Fires Involving Space Heaters, by Month 9 Figure 8. Home Structure Fires Involving Space Heaters, by Hour 9 Figure 9. Home Structure Fires Involving Space Heaters by Factor Contributing to Ignition 10 Figure 10. Home Structure Fires Involving Fireplaces, Chimneys, and Chimney Connectors 12 by Alarm Hour Figure 11. Home Structure Fires Involving Fireplaces, Chimneys, and Chimney Connectors 12 by Factor Contributing to Ignition Figure 12. Home Structure Fires Involving Central Heating Units by Month 14 Figure 13. Home Structure Fires Involving Central Heating Units by Time of Day 15 Figure 14. Home Fires Involving Water Heaters by Leading Factors Contributing to Ignition 18
Tables
Table A. Home Fires Involving Heating Equipment, by Equipment Involved in Ignition 3 Table B. Home Fires Involving Heating Equipment, by Fuel or Power Source 5 Table C. Home Space Heater Fires, by Type of Device 7 Table D. Home Space Heater Fires by Fuel or Power Source 8 Table E. Home Fires Involving Fireplaces, Chimneys or Chimney Connectors, by Type 11 of Fuel or Power Table F. Home Fires Involving Water Heaters, by Type of Fuel or Power 17 Table 1. Home Fires Involving Heating Equipment by Year 19 Table 2. Home Fires Involving Heating Equipment by Type of Equipment 21 Table 3. Home Fires Involving Heating Equipment, by Month 22 Table 4. Home Fires Involving Heating Equipment, by Day of Week 23 Table 5. Home Fires Involving Heating Equipment, by Alarm Time 24 Table 6. Home Fires Involving Heating Equipment, by Factor Contributing to Ignition 25 Table 7. Home Fires Involving Heating Equipment, by Item First Ignited 26 Table 8. Home Fires Involving Heating Equipment, by Heat Source 27

Home Fires Involving Heating Equipment, 3/16 v NFPA Fire Analysis & Research Division
List of Tables and Figures (Continued)
Tables
Page Table 9. Home Fires Involving Heating Equipment, by Area of Origin 28 Table 10. Home Fires Involving Heating Equipment, by Type of Fuel or Power 29 Table 11. Home Fires Involving Space Heaters, by Type of Fuel or Power and 30 Portability Table 12. Home Fires Involving Space Heaters, by Month 31 Table 13. Home Fires Involving Space Heaters, by Day of Week 32 Table 14. Home Fires Involving Space Heaters, by Alarm Time 33 Table 15. Home Fires Involving Space Heaters, by Type of Device 34 Table 16. Home Fires Involving Space Heaters, by Factor Contributing to Ignition 35 Table 17. Home Fires Involving Space Heaters, by Item First Ignited 36 Table 18. Home Fires Involving Space Heaters, by Area of Origin 37 Table 19. Home Fires Involving Fireplaces, Chimneys or Chimney Connectors, by 38 Type of Fuel or Power Table 20. Home Fires Involving Fireplaces, Chimneys or Chimney Connectors, by 39 Month Table 21. Home Fires Involving Fireplaces, Chimneys or Chimney Connectors, by 40 Day of Week Table 22. Home Fires Involving Fireplaces, Chimneys or Chimney Connectors, by 41 Alarm Time Table 23. Home Fires Involving Fireplaces, Chimneys or Chimney Connectors, by 42 Factor Contributing to Ignition Table 24. Home Fires Involving Fireplaces, Chimneys or Chimney Connectors, by 43 Item First Ignited Table 25. Home Fires Involving Fireplaces, Chimneys or Chimney Connectors by 44 Area of Origin Table 26. Home Fires Involving Central Heating Equipment Fires, by Type of Fuel 45 or Power Table 27. Home Fires Involving Central Heat, by Month 46 Table 28. Home Fires Involving Central Heat, by Day of Week 47

Home Fires Involving Heating Equipment, 3/16 vi NFPA Fire Analysis & Research Division
List of Tables and Figures (Continued)
Tables
Page Table 29. Home Fires Involving Central Heat, by Alarm Time 48 Table 30. Home Fires Involving Central Heat, by Factor Contributing to Ignition 49 Table 31. Home Fires Involving Central Heat, by Item First Ignited 50 Table 32. Home Fires Involving Central Heat, by Area of Origin 51 Table 33. Home Fires Involving Water Heaters, by Type of Fuel or Power 52 Table 34. Home Fires Involving Water Heaters, by Month 53 Table 35. Home Fires Involving Water Heaters, by Day or Week 54 Table 36. Home Fires Involving Water Heaters, by Alarm Type 55 Table 37. Home Fires Involving Water Heaters, by Factor Contributing to Ignition 56 Table 38. Home Fires Involving Water Heaters, by Item First Ignited 57 Table 39. Home Fires Involving Water Heaters, by Area of Origin 58

Home Fires Involving Heating Equipment, 3/16 vii NFPA Fire Analysis & Research Division
U.S. Home Heating Equipment Fires Fact Sheet
In 2009-2013, U.S. fire departments responded to 56,000 home1 structure fires that involved heating
equipment.
These fires caused
470 civilian fire deaths
1,490 civilian fire injuries
$1.0 billion in direct property damage
Heating equipment fires accounted for 16% of all reported home fires in 2009-2013 (second behind cooking) and 19% of home fire deaths.
The leading factor contributing to home heating fires (30%) was failure to clean, principally from solid-fueled heating equipment, primarily chimneys.
The leading factor contributing to ignition for home heating fire deaths (56%) was heating equipment too close to things that can burn, such as upholstered furniture, clothing, mattress, or bedding.
Most home heating fire deaths (84%) involved stationary or portable space heaters.
Nearly half (49%) of all home heating fires occurred in December, January and February.
Home heating fires peak during 5:00 to 8:00 p.m.
¹Homes are dwellings, duplexes, manufactured homes, apartments, townhouses, rowhouses and condominiums.
9%
56%
1%
14%
14%
30%
0% 20% 40% 60%
Mechanical failure ormalfunction
Heater too close tocombustibles
Failure to clean
Leading Factors in Home Heating Fires2009-2013
Fires
Civilian Deaths4%
5%
84%
5%
10%
12%
40%
32%
0% 20% 40% 60% 80% 100%
Water heater
Central heating unit
Space heater
Fireplace, chimney orchimney connector
U.S. Home Heating Fires by Equipment Involved: 2009-2013
Fires CivilianDeaths

Home Fires Involving Heating Equipment, 3/16 1 NFPA Fire Analysis & Research Division
Section 1: Home Fires Involving Heating Equipment
In 2009-2013, U.S. fire departments responded to an estimated average of 56,000 structure fires per year in homes that involved heating equipment. These fires resulted in annual losses of 470 civilian deaths, 1,490 civilian injuries, and $1.0 billion in direct property damage. These homes included one- and two-family homes (including manufactured homes) and apartments (including townhouses and other multi-family dwellings).
Heating equipment is a leading cause of fires in U.S. homes. As indicated in a separate report, Home Structure Fires by Marty Ahrens, heating equipment caused 16% of home structure fires in 2009-2013, ranking as the second leading cause behind fires caused by cooking equipment.1 Home heating equipment fires also accounted for nearly one-fifth (19%) of civilian deaths (second behind fires caused by smoking materials), 12% of civilian injuries (second behind cooking equipment), and 15% of direct property damage (third behind electrical distribution and lighting equipment and cooking equipment).
Space heaters are the type of equipment most often involved in home heating equipment fires, figuring in two of every five fires (40%) (See Figure 1 below). Significantly, the fires involving space heaters accounted for 84% of the civilian deaths and 75% of civilian injuries in home fires caused by heating equipment, as well as over half (52%) of direct property damage. Another one-third (32%) of fires involved a fireplace or chimney, but these fires accounted for a much smaller share of civilian fatalities (5%) and civilian injuries (6%). Central heat and water heaters were responsible for 12% and 10% of home fires caused by heating equipment, respectively.
Note and Source: See Table 2. Home fires caused by heating equipment are influenced by seasonal changes and time of day. The peak months for home heating fires are the cold weather months of December, January, and February, which together account for nearly one-half (49%) of the annual total. (Figure 2) Three out of five (59%) of home heating fire deaths occur in these months. Fires in March and
1 Marty Ahrens, Home Structure Fires, Quincy, MA: National Fire Protection Association, Fire Analysis and Research Division, 2015.
40%32%
12% 10%1%
84%
5% 5% 4% 1%
75%
6% 5%10%
2%
52%
25%
8% 11%3%
0%
20%
40%
60%
80%
100%
Space Heater Fireplace, chimney Central Heat Water heater Heat lamp
Figure 1. Home Structure Fires Involving Heating Equipment by Type of Equipment, 2009-2013 Annual Averages
Fires Civilian Deaths Civilian Injuries Direct Property Damage

Home Fires Involving Heating Equipment, 3/16 2 NFPA Fire Analysis & Research Division
November, each with 11% of fires, also experienced a disproportionate share of heating equipment fires by month.
Note and Source: See Table 3. The peak time of day for home heating equipment fires are the hours between 5:00 p.m. and 8:00 p.m. (21% of fires), with another 15% of fires occurring between 2:00 p.m. and 5:00 p.m. (Figure 3). The fewest fires occurred in the hours between 2:00 a.m. and 5:00 a.m. The timing of fires is likely to reflect a decrease in the use of heating equipment during the overnight hours. However, it should be noted that the greatest share of civilian deaths occur during the times of day that accounted for the fewest fires, with 68% of civilian deaths recorded in the hours between 11:00 p.m. and 11:00 a.m., which accounted for 34% of fires.
Note and Source: See Table 5.
19%
14%
11%
7%
4%3%
3% 3%3%
7%
11%
16%
21%
16%
9%
5%
4% 2%
2%2%
4%
12%
22%
14%
10%10%
6% 6%
5% 4% 3% 5%
9%
12%
16%
19%
13%
10%
7%
4%3%
2% 2%3%
8%
12%
17%
0%
5%
10%
15%
20%
25%
Figure 2. Home Structure Fires Involving Heating Equipment, by Month, 2009-2013 Annual Averages
Fires Civilian Deaths Civilian Injuries Direct Property Damage
8%
5%
8%
12%13%
15%
21%
17%
14%16%
19% 19%
8%
5%
9%11%
13%
9%10%
14%12%
16%14%
12%
9%10%
10%
11%
13% 13%15% 15%
0%
5%
10%
15%
20%
25%
11 p.m.-2 a.m. 2 a.m. -5 a.m. 5-8 a.m. 8 -11 a.m. 11 a.m. - 2 p.m. 2 -5 p.m. 5 -8 p.m. 8 -11 p.m.
Figure 3. Home Structure Fires Involving Heating Equipment by Time of Day, 2009-2013 Annual Averages
Fires Civilian Deaths Civilian Injuries Direct Property Damage

Home Fires Involving Heating Equipment, 3/16 3 NFPA Fire Analysis & Research Division
Home heating fires show little variation by day of week, although Saturday and Sunday had a slightly higher share of fires – each with 15% -- than the remaining days of the week, which each recorded 14% of fires, indicating that people are more likely to be home and using heating equipment over the weekend.
Home structure fires and heating equipment. Fires caused by heating equipment include fires that the National Fire Incident Reporting System (NFIRS 5.0) distinguishes as “non-confined” and “confined” fires. Confined heating equipment fires include: 1) confined chimney or flue fires, and 2) confined fuel burner or boiler fires. Losses are generally minimal in these fires, which are by definition assumed to be limited to the object of fire origin. Table A below shows that 55% of home heating equipment fires involved confined heating equipment, primarily confined chimney or flue fires (37%), but that all of the associated civilian deaths, 96% of civilian injuries, and 99% of direct property damage were associated with non-confined fires caused by heating equipment. A small number of fires that were confined to either the chimney/flue or fuel burner/boiler were coded as not involving heating equipment.
Table A. Home Fires Involving Heating Equipment, By Equipment Involved in Ignition, Annual Average of 2009-2013 Structure Fires Reported to U.S. Fire Departments
Equipment Involved in Ignition Fires Civilian Deaths
Civilian Injuries
Direct Property Damage (in Millions)
Non-confined heating equipment 25,120 (45%) 470 (100%) 1,430 (96%) $1,019 (99%)
Confined heating equipment 30,880 (55%) 0 (0%) 60 (4%) $8 (1%) Confined chimney, flue 20,550 (37%) 0 (0%) 20 (1%) $6 (1%) Confined chimney, flue, with
heating equipment 19,770 (35%) 0 (0%) 10 (1%) $6 (1%) Confined to chimney, flue, no
heating equipment 790 (1%) 0 (0%) 10 (0%) $0 (0%) Confined fuel burner, boiler 10,330 (18%) 0 (0%) 30 (2%) $2 (0%) Confined fuel burner, boiler, with
heating equipment 8,990 (16%) 0 (0%) 30 (2%) $2 (0%) Confined fuel burner, boiler, no
heating equipment 1,330 (2%) 0 (0%) 10 (0%) $0 (0%)
Total 56,000 (100%) 470 (100%) 1,490 (100%) $1,027 (100%)
Note: These are national estimates of fires reported to U.S. municipal fire departments and so exclude fires reported to federal or state agencies or industrial fire brigades. Analyses were performed separately for non-confined fires, fires reported as confined chimney or flue fires, and fires reports as confined to fuel burner or boiler. Fires, deaths, and injuries are rounded to the nearest ten and direct property damage to the nearest million dollars. Totals may not equal sums due to rounding errors.
A variety of factors were identified as contributing to the ignition of home heating equipment fires. The leading factor that contributed to the failure of home heating equipment fires was “failure to clean,” accounting for 30% of fires, the majority of which were confined fires (27% of total). The second leading factor, “heat source too close to combustibles,” accounted for 14% of fires, but was responsible for the greatest share of heating fire losses – 56% of civilian deaths, 31% of civilian injuries, and 31% of direct property damage. A mechanical failure or malfunction (14%), unattended equipment (6%), electrical failures or malfunctions (5%), and unclassified use of materials or products (3%) were other leading factors contributing to ignition.

Home Fires Involving Heating Equipment, 3/16 4 NFPA Fire Analysis & Research Division
Unattended equipment was a factor associated with a disproportionate share of civilian heating equipment deaths (11%), injuries (18%), and direct property damage (10%). See Table 6.
The leading item first ignited in home fires caused by heating equipment was flammable and combustible liquids and gases, piping and filter, which accounted for 12% of fires and 14% of civilian deaths, as well as 17% of civilian injuries and 7% of direct property damage. Other leading items first ignited were unclassified organic materials (10%), structural member or framing (8%), cooking materials (7%), and film or residue, including paint, resin, and creosote (6%). Fires in which a structural member of framing was first ignited had the largest share of direct property damage (27%), while one-quarter of civilian injuries (24%) occurred when cooking materials were first ignited. See Table 7. In some cases, fire places, wood stoves, or other heating equipment may have been used to cook food. It is also possible that some kitchen ranges were erroneously coded heating stoves.
The primary heat sources for home fires caused by heating equipment were hot ember or ash (19% of fires), radiated or conducted heat from operating equipment (18%), a spark, ember, or flame from operating equipment (13%), and unclassified heat from operating equipment (12%). Fires caused by radiated or conducted heat from operating equipment accounted for 42% of civilian deaths, 35% of civilian injuries, and 36% of direct property damage. Fires in which a spark, ember, or flame from operating equipment acted as the heat source were associated with 19% of civilian deaths, 18% of civilian injuries, and 14% of direct property damage. See Table 8.
Excluding confined chimney or flue fires, the leading area of origin for heating equipment fires in the home was a heating equipment room, with 14% of fires. As shown in Table 9, a kitchen or cooking area was the area of origin in 12% of fires, followed by a living room, family room or den, and bedroom, each with 4% of fires. The fires originating in the kitchen or cooking area were associated with 14% of civilian deaths, 38% of civilian injuries, and 14% of direct property damage, while those originating in the living room, family room, or den caused 31% of civilian deaths, as well as 12% of civilian injuries and 12% of direct property damage. Fires originating in the bedroom accounted for 20% of civilian deaths, 13% of civilian injuries, and 10% of direct property damage.
Type of fuel or power with heating equipment fires. Heating equipment powered by a solid-fueled source accounted for over two of every five home fires (43%) attributed to heating equipment, and these fires were associated with 25% of civilian deaths, 12% of civilian injuries, and 33% of direct property damage. See Table B and Table 10. Electric-powered heating equipment was responsible for a smaller share of the fires (32%), but a larger share of civilian fatalities (46%), civilian injuries (54%), and direct property damage (41%). Gas-fueled heating equipment accounted for another 18% of fires, 19% of civilian deaths, 27% of civilian injuries, and 22% of direct property damage.

Home Fires Involving Heating Equipment, 3/16 5 NFPA Fire Analysis & Research Division
Table B. Home Fires Involving Heating Equipment, by Fuel or Power Source, 2009-2013 Annual Averages
Fuel or Power Fires Civilian Deaths
Civilian Injuries
Direct Property Damage (in Millions)
Solid-fueled 24,040 (43%) 120 (25%) 180 (12%) $342 (33%) Electric-powered 17,680 (32%) 220 (46%) 800 (54%) $422 (41%) Gas-fueled 9,980 (18%) 90 (19%) 410 (27%) $228 (22%) Liquid-fueled 3,820 (7%) 50 (11%) 100 (6%) $30 (3%) Other 490 (1%) 0 (0%) 10 (1%) $5 (0%)
Total 56,000 (100%) 470 (100%) 1,490 (100%) $1,027 (100%)
Note and Source: See Table 10.
Trends in Home Heating Fires, 1980-2013
Since 1980, there has been a substantial decline in the estimated number of home structure fires involving heating equipment each year, as shown in Figure 4 and Table 1. Between 1980 and 1985, over 200,000 home fires were attributed to heating equipment each year, while an estimated 128,700 fires in 1989 represented the fewest number of fires during the 1980s. The number of home heating equipment fires dropped below 100,000 in 1990 for the first time (with 97,500), and they have since continued to decline, despite occasional yearly fluctuations. There have been fewer than 60,000 home fires due to heating equipment each year since 2009 -- approximately one-quarter of the totals recorded in the first six years of NFIRS from 1980 to 1985.
Note and Source: See Table 1.
230,000200,900
128,700
97,200
57,100
66,40056,800
0
50,000
100,000
150,000
200,000
250,000
1980 1982 1984 1986 1988 1990 1992 1994 1996 1998 2000 2002 2004 2006 2008 2010 2012
Nu
mb
er o
f Fi
res
Axis Title
Figure 4. Number of Home Structure Fires Involving Heating Equipment by Year, 1980-2013

Home Fires Involving Heating Equipment, 3/16 6 NFPA Fire Analysis & Research Division
There have also been substantial reductions in civilian deaths and injuries associated with home heating equipment fires since 1980. As shown in Figure 5, civilian deaths have fallen from annual death totals over 1,000 in the early 1980s to fewer than 500 in more recent years. Civilian injuries also declined, albeit with fluctuations, from well over 3,000 a year to approximately 1,500 or fewer since 2009, as shown in Figure 6. As shown in Table 1 at the back of this report, the trend in direct property damage when adjusted for inflation has been inconsistent since the early 1990s and does not show a clear decline.
Note and Source: See Table 1. Because of low participation in NFIRS Version 5.0 during 1999-2001, data for those years must be treated with caution and is not reported in these tables.
3,510 3,650
3,350
2,830
1,400
1,470
0
500
1,000
1,500
2,000
2,500
3,000
3,500
4,000
19
80
19
82
19
84
19
86
19
88
19
90
19
92
19
94
19
96
19
98
20
00
20
02
20
04
20
06
20
08
20
10
20
12
Figure 6. Civilian Injuries in Home Structure Fires Involving Heating Equipment,
1980-2013
1,190
860
900800
540400
0
200
400
600
800
1,000
1,200
1,400
19
80
19
82
19
84
19
86
19
88
19
90
19
92
19
94
19
96
19
98
20
00
20
02
20
04
20
06
20
08
20
10
20
12
Figure 5. Civilian Deaths in Home Structure Fires Involving Heating Equipment,
1980-2013

Home Fires Involving Heating Equipment, 3/16 7 NFPA Fire Analysis & Research Division
Section 2. Home Structure Fires Involving Space Heaters
Space heaters account for the vast majority of civilian deaths and injuries associated with home structure fires involving heating equipment, as well as just over half of the direct property damage. In the 2009-2013 period, there were an estimated 22,640 home structure fires involving space heaters each year, resulting in 400 civilian deaths, 1,120 civilian injuries, and $538 million in direct property damage. Non-confined fires accounted for all of the civilian deaths and nearly all of the civilian injuries and direct property damage from these incidents.
As Table C. below indicates, heating stoves are responsible for the largest share of space heater fires, 45% of the total. These fires accounted for one-third (33%) of civilian deaths and 56% of civilian injuries, as well as 40% of direct property damage. Heaters, including catalytic and oil-filled heaters, were involved in 26% of fires involving space heaters, but they resulted in disproportionately higher shares of losses -- 58% of civilian deaths, as well as 36% of civilian injuries, and 41% of direct property damage. Fires involving a fireplace with insert accounted for 16% of space heater fires, with 5% of civilian deaths, 3% of civilian injuries, and 11% of direct property damage associated with these fires. A local furnace was involved in 12% of space heater fires. These fires also accounted for 5% of civilian deaths, as well as 5% of civilian injuries and 9% of direct property damage.
Table C. Home Space Heater Fires, By Type of Device Annual Average of 2009-2013 Home Structure Fires Reported to U.S. Fire Departments
Type of Device Fires Civilian Deaths
Civilian Injuries
Direct Property Damage (in Millions)
Heating stove 10,260 (45%) 130 (33%) 630 (56%) $216 (40%) Non-confined 7,480 (33%) 130 (33%) 620 (55%) $216 (40%) Confined 2,780 (12%) 0 (0%) 0 (0%) $0 (0%) Heater (including catalytic
5,920 (26%) 230 (58%) 400 (36%) $218 (41%) and oil-filled) Non-confined 4,720 (21%) 230 (58%) 400 (36%) $218 (41%) Confined 1,190 (5%) 0 (0%) 0 (0%) $0 (0%) Fireplace with insert 3,640 (16%) 20 (5%) 30 (3%) $58 (11%) Non-confined 850 (4%) 20 (5%) 30 (3%) $57 (11%) Confined 2,790 (12%) 0 (0%) 0 (0%) $1 (0%) Local furnace 2,820 (12%) 20 (5%) 60 (5%) $46 (9%) Non-confined 1,300 (6%) 20 (5%) 50 (4%) $46 (8%) Confined 1,520 (7%) 0 (0%) 10 (1%) $0 (0%)
Total 22,640 (100%) 400 (100%) 1,120 (100%) $538 (100%) Non-confined 14,350 (63%) 400 (100%) 1,100 (98%) $537 (100%) Confined 8,280 (37%) 0 (0%) 10 (1%) $2 (0%)
Note and Source: See Table 15.
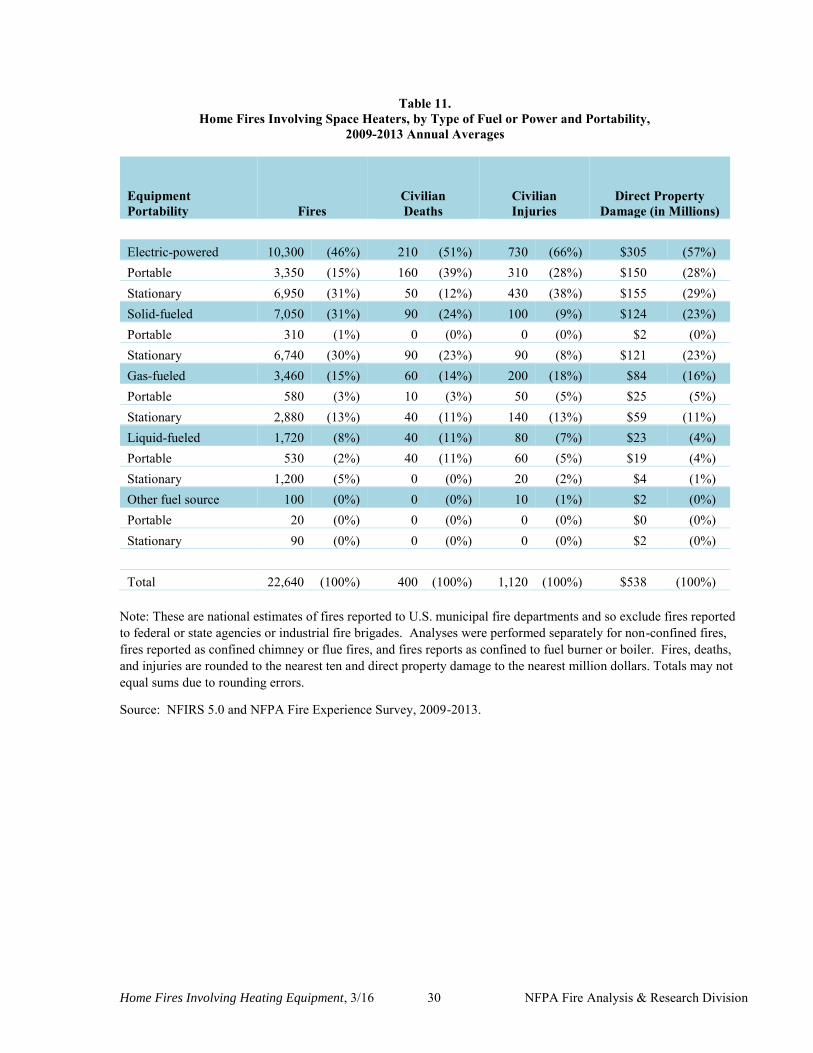
Almost one-half of the space heater fires (46%) involved electric-powered equipment, as shown in Table D and Table 11. These fires accounted for half of civilian deaths (51%), 66% of civilian deaths, and 57% of direct property damage. Solid-fueled devices were involved in 31% of space heater fires, accounting for 24% of civilian deaths, 9% of civilian injuries, and 23% of direct

Home Fires Involving Heating Equipment, 3/16 8 NFPA Fire Analysis & Research Division
property damage. Space heaters that were gas-fueled were involved in 15% of space heater fires, accounting for 14% of civilian deaths, 18% of civilian injuries, and 16% of direct property damage. Liquid-fueled space heaters were involved in 8% of space heater fires. These fires accounted for 11% of civilian deaths, 7% of civilian injuries, and 4% of direct property damage.
Table D. Home Space Heater Fires, By Fuel or Power Source
Fuel or Power Fires Civilian Deaths
Civilian Injuries
Direct Property Damage (in Millions)
Electric-powered 10,300 (46%) 210 (51%) 730 (66%) $305 (57%) Portable 3,350 (15%) 160 (39%) 310 (28%) $150 (28%) Stationary 6,950 (31%) 50 (12%) 430 (38%) $155 (29%) Solid-fueled 7,050 (31%) 90 (24%) 100 (9%) $124 (23%) Portable 310 (1%) 0 (0%) 0 (0%) $2 (0%) Stationary 6,740 (30%) 90 (23%) 90 (8%) $121 (23%) Gas-fueled 3,460 (15%) 60 (14%) 200 (18%) $84 (16%) Portable 580 (3%) 10 (3%) 50 (5%) $25 (5%) Stationary 2,880 (13%) 40 (11%) 140 (13%) $59 (11%) Liquid-fueled 1,720 (8%) 40 (11%) 80 (7%) $23 (4%) Portable 530 (2%) 40 (11%) 60 (5%) $19 (4%) Stationary 1,200 (5%) 0 (0%) 20 (2%) $4 (1%) Other fuel source 100 (0%) 0 (0%) 10 (1%) $2 (0%)
Total 22,640 (100%) 400 (100%) 1,120 (100%) $538 (100%)
Note and Source: See Table 11.
Timing of Home Structure Fires Involving Space Heaters Home structure fires involving space heaters follow a monthly pattern similar to home fires involving all categories of heating equipment, peaking in the cold weather months of December (16% of yearly total), January (18%), and February (14%), followed by March and November, each with 11% of the total. A disproportionate share of civilian deaths (45%) occurred in the 34% of annual space heater fires in December and January. Civilian injuries and direct property damage were generally proportional to the monthly share of annual fires. See Figure 7 below and Table 12.

Home Fires Involving Heating Equipment, 3/16 9 NFPA Fire Analysis & Research Division
Note and Source: See Table 12.
Home structure fires involving space heaters peaked in the early evening and late night hours, much as they did with overall home fires involving heating equipment. Figure 8 and Table 14 show that 13% of fires occurred between 6 p.m. and 8 p.m., 12% of fires between 4 p.m. and 6 p.m. and 11% of fires between 6 p.m. and 8 p.m. Fires in the overnight and early morning hours were associated with a higher proportion of civilian deaths: 58% of deaths occurred in fires between 12 a.m. and 10 a.m., a period which recorded 28% of fires. No clear trend was apparent in civilian injuries and direct property damage by time of day. Table 13 shows that fires involving space heaters showed little variation by day of week.
Notes and Source: See Table 14.
18%
14%
11%
7%
4%3%
3%3%
4%
8%
11%
16%
22%
17%
10%
4%
2% 2% 2%0%
2% 3%
13%
23%
14%
10%10%
6%7%
4% 4%
2%
4%
9%
11%
18%19%
14%
10%
6%
4%3%
2% 2%
4%
7%
12%
18%
0%
5%
10%
15%
20%
25%
Figure 7. Home Structure Fires Involving Space Heaters, by Month, 2009-2013
Fires Civilian Deaths Civilian Injuries Direct Property Damage
5%4% 4%
6%
8%
9%10% 10%
12%13%
11%
8%
11% 11%
9%
16%
11%
9%
6%
3%
4%
6%
4%
10%
8%
7%5%
7%
10%
7%
9%
10% 10%
8%
9%
8%9%7%
5%
6%
7%
9%
11%
9%10%
9% 9%
8%
0%
2%
4%
6%
8%
10%
12%
14%
16%
18%
12 a.m. -2a.m.
2 - 4 a.m. 4 -6 a.m. 6 -8 a.m. 8 -10 a.m. 10 a.m.-12p.m.
12 -2 p.m. 2 -4 p.m. 4 - 6 p.m. 6 -8 p.m. 8 -10 p.m. 10 -12 a.m.
Figure 8. Home Structure Fires Involving Space Heaters by Time of Day, 2009-2013
Fires Civilian Deaths Civilian Injuries Direct Property Damage

Home Fires Involving Heating Equipment, 3/16 10 NFPA Fire Analysis & Research Division
The leading factors contributing to the ignition of home fires caused by space heaters were failure to clean (22% of fires) and heat source too close to combustibles (21%). See Figure 9 and Table 16. Failure to clean fires were primarily confined fires (20%) and losses in this category accounted for just 1% of space heater deaths, 1% of injuries, and 2% of direct property damage. Fires associated with a heat source too close to combustibles were much more consequential, accounting for 59% of the civilian heating equipment deaths, 34% of civilian injuries, and 39% of direct property damage from home space heater fires. Other leading factors contributing to the ignition of space heater fires were mechanical failure or malfunction (15% of fires) and equipment unattended (14%), with the latter accounted for almost one-quarter of civilian injuries (24%).
Note and Source: See Table 16.
Cooking materials, including food were the leading item identified as first ignited in home fires involving space heaters, with 16% of the space heater total. These fires accounted for 4% of civilian deaths, 32% of civilian injuries, and 14% of direct property damage. Another 12% of fires occurred when flammable and combustible liquids and gases, piping and filter were first ignited, with 6% of civilian deaths, 10% of civilian injuries, and 5% of direct property damage. A structural member of framing accounted for 6% of space heater fires, as did unclassified organic materials, but the former resulted in greater losses, including 17% of direct property damage. Fires in which a mattress or bedding was the item first ignited represented just 3% of space heater fires, but these resulted in 19% of deaths and 8% of civilian injuries. See Table 17.
A kitchen or cooking area was the area of origin for 27% of home fires involving space heaters, and these fires accounted for half of civilian injuries, as well as 16% of civilian deaths and 26% of direct property damage. One-quarter of the fires were confined originating in the chimney or flue, with minimal losses. Fires originating in a bedroom accounted for 8% of space heater fires, 23% of civilian deaths, 15% of civilian injuries, and 16% of direct property damage. Another 8% of fires originated in a living room, family room, or den, and these fires accounted for the greatest share of civilian deaths (35%), as well as 12% of civilian injuries and 14% of direct property damage. See Table 18.
22% 21%15% 14%
7%1%
59%
6%
13% 12%
1%
34%
8%
24%
5%2%
39%
10%
18%
10%
0%
10%
20%
30%
40%
50%
60%
70%
Failure to clean Heat source too closeto combustibles.
Mechanical failure ormalfunction
Equipment unattended Electrical failure ormalfunction
Figure 9. Home Structure Fires Involving Space Heaters by Factor Contributing to Ignition
Fires Civilian Deaths Civilian Injuries Direct Property Damage

Home Fires Involving Heating Equipment, 3/16 11 NFPA Fire Analysis & Research Division
Section 3. Home Structure Fires Involving Fireplaces, Chimneys, and Chimney Connectors
In the 2009 to 2013 period, there were an estimated annual average of 17,910 home structure fires involving fireplaces, chimneys, and chimney connectors, resulting in an estimated 30 deaths, 90 civilian injuries, and $25 million in direct property damage each year. Fires involving fireplaces, chimneys, and chimney connectors comprised 32% of the 2009-2013 home fires involving heating equipment, as well as 5% of the associated civilian deaths, 6% of civilian injuries, and 25% of direct property damage. The vast majority of these fires (94%) involved solid-fueled equipment. These fires accounted for 93% of civilian deaths, 90% of civilian injuries, and 86% of direct property damage, as indicated in Table E below and Table 19.
Table E. Home Fires Involving Fireplaces, Chimneys or Chimney Connectors, by Type of Fuel or Power, 2009-2013 Annual Averages
Fuel or Power Fires Civilian Deaths
Civilian Injuries
Direct Property Damage (in Millions)
Solid-fueled 16,770 (94%) 20 (93%) 80 (90%) $218 (86%) Gas-fueled 580 (3%) 0 (7%) 10 (9%) $22 (9%) Electric-powered 260 (1%) 0 (0%) 0 (0%) $10 (4%) Liquid-fueled 60 (0%) 0 (0%) 0 (0%) $0 (0%) Other power source 250 (1%) 0 (0%) 0 (1%) $3 (1%)
Total 17,910 (100%) 30 (100%) 90 (100%) $250 (100%)
Note and Source: See Table 19.
Nearly three-fifths of home structure fires involving fireplaces, chimneys, and chimney connectors occurred in December, January, and February (57%). The fires in December and January alone accounted for 63% of civilian deaths, although these results should be interpreted cautiously due to the comparatively small number of deaths. January was the peak month for civilian injuries (23% of yearly total), followed by December (19%) and November (18%). The warm weather months of June, July, and August combined to account for just 2% of fires, 2% of civilian injuries, and 2% of direct property damage, with no civilian fatalities. See Table 20.
The peak period for fires involving fireplaces, chimneys, and chimney connectors was between 6:00 p.m. and 8:00 p.m., with 18% of fires, followed by 8:00 p.m. to 10:00 p.m. (17%), and 4:00 p.m. to 6:00 p.m. (14%). As shown in Figure 10 and Table 22, just 9% of fires occurred between midnight and 6:00 a.m., but these overnight fires accounted for 29% of civilian deaths, 35% of civilian injuries, and 25% of direct property damage. Saturday (2,740 fires, 15%) and Sunday (2,930 fires, 16%) were the days of the week with the highest number of fires, followed by Monday (2,610 fires, (15%). The remaining days each had 13% to 14% of fires.

Home Fires Involving Heating Equipment, 3/16 12 NFPA Fire Analysis & Research Division
Note and Source: See Table 22.
Failure to clean was a factor contributing to the ignition of 68% of home structure fires involving fireplaces, chimneys, or chimney connectors. These fires were not associated with any civilian deaths, and just 10% of civilian injuries from fires involving fireplaces, chimneys, or chimney connectors, as well as 17% of direct property damage. A mechanical failure or malfunction contributed to 7% of the fires, but these fires accounted for 21% of civilian deaths, 21% of civilian injuries, and 18% of direct property damage. Fires in which a heat source too close to combustibles was a factor contributing to ignition – 5% of total – accounted for 39% of civilian deaths, 23% of civilian injuries, and 17% of direct property damage. Equipment not operated properly was a factor in 2% of fires involving fireplaces, chimneys or chimney connectors, but were associated with a disproportionate share of the civilian deaths (20%) and injuries (6%). See Figure 11 and Table 23.
Note and Source: See Table 23.
4%
2% 2%
5%
7% 7% 7%8%
14%
18%
17%
8%
15%
0%
15% 14%
21%
14%
0% 0% 0%
14%
0%
8%
16%
9%11%
6%
9%
4%
0%
9%
7% 7%8%
16%
11%
8% 7%
6%6% 5% 5%
6%
8%
14%14%
12%
0%
5%
10%
15%
20%
25%
12 a.m.-2a.m.
2-4 a.m. 4-6 a.m. 6-8 a.m. 8-10 a.m. 10 a.m-12p.m.
12-2 p.m. 2-4 p.m. 4-6 p.m. 6-8 p.m. 8-10 p.m. 10 p.m.-12 a.m.
Figure 10. Home Structure Fires Involving Fireplaces, Chimneys, and Chimney Connectors, by Time of Day, 2009-2013 Annual Averages
Fires Civilian Deaths Civilian Injuries Direct Property Damage
2% 3% 3% 4% 5% 7%
68%
20%
0%
20%
39%
21%
0%6%
3%6%
2%
23%21%
10%
2%
10% 9%4%
17% 18% 17%
0%
10%
20%
30%
40%
50%
60%
70%
80%
Equipment notoperated properly
Constructiondeficiency
Installationdeficiency
Unspecified factorcontributing to
ignition
Heat source tooclose to
combustibles
Mechanical failureor malfunction
Failure to clean
Figure 11. Home Structure Fires Involving Fireplaces, Chimneys, and Chimney Connectors, by Factor Contributing to Ignition, 2009-2013 Annual Averages
Fires Civilian Deaths Civilian Injuries Direct Property Damage

Home Fires Involving Heating Equipment, 3/16 13 NFPA Fire Analysis & Research Division
The leading items first ignited in home fires involving fireplaces, chimneys, or chimney connectors were film or residue, including pain, resin and creosote (19%) and unclassified organic materials (also 19%). As shown in Table 24, these fires were associated with minimal losses, with film or residue accounting for 1% of direct property damage and unclassified organic materials with 2% of direct property damage. The items first ignited associated with the greatest losses were structural member or framing (11% of fires), which accounted for 40% of civilian deaths, 26% of civilian losses, and 54% of direct property damage and unclassified structural components or finish (3% of fires), which was associated with 15% of civilian deaths, 10% of civilian injuries, and 9% of direct property damage.
Most of the home structure fires involving fireplaces, chimneys, or chimney connectors were confined fires originating in the chimney or flue (79%). These fires were associated with 10% of civilian injuries and 2% of direct property damage. A wall assembly or concealed space was the area of origin in 5% of fires, accounting for 16% of civilian deaths, 11% of civilian injuries, and 23% of direct property damage, while 4% of fires originated in a living room, family room, or den, with 23% of civilian deaths, 39% of civilian injuries, and 17% of direct property damage. See Table 25.

Home Fires Involving Heating Equipment, 3/16 14 NFPA Fire Analysis & Research Division
Section 4. Home Structure Fires Involving Central Heating Units
In 2009-2013, there were an estimated 6,970 home structure fires each year that involved central heating units. These fires resulted in an estimated 20 civilian deaths, 80 civilian injuries, and $81 million in direct property damage each year. The fires involving central heating units comprised 12% of the home structure fires involving heating equipment during this period, as well as 5% of civilian deaths, 5% of civilian injuries, and 8% of direct property damage arising from home heating equipment fires.
Electric-powered equipment accounted for 37% of home structure fires involving central heating units during 2009-2013. These fires accounted for 16% of the civilian deaths, 16% of civilian injuries, and 35% of direct property damage from central heating unit fires. Another 31% of central heating unit fires involved gas-fueled equipment, and these fires accounted for 53% of civilian deaths, 67% of civilian injuries, and 50% of direct property damage. Liquid-fueled central heating units accounted for 29% of central heating unit fires, 31% of associated civilian deaths, 18% of civilian injuries, and 7% of direct property damage. Only 2% of these fires involved solid-fueled equipment, accounting for 8% of direct property damage. See Table 26.
Timing of home structure fires involving central heating units. Consistent with seasonal trends already observed, fires involving home heating units peak in cold weather months, with 45% of these fires occurring in December through February, with another 32% of fires in March, October, and November. Fires from October through February accounted for 70% of civilian injuries, while 75% of direct property damage came in fires between November and March, as shown in Figure 12 and Table 27.
Note and Source: See Table 27.
The peak period for home structure fires involving central heating units by time of day came in the hours between 4 p.m. and 6 p.m. (11%) and 6 p.m. and 8 p.m. (12%). The fewest fires occurred from midnight to 2 a.m. (4%), 2 a.m. to 4 a.m. (5%), and 4 a.m. to 6 a.m. (6%). This is consistent with the timing of heating equipment fires more generally in reflecting a decrease in use during overnight hours. The high point for civilian injuries came in the hours between 10 p.m. and midnight, 15% of the total, but there is no apparent trend with the timing of
17%
14%
10%7%
4% 3% 3% 2%4%
11%12%
14%
0%
5%
10%
15%
20%
Figure 12. Home Structure Fires Involving Central Heating Units by Month, 2009-2013 Annual Averages

Home Fires Involving Heating Equipment, 3/16 15 NFPA Fire Analysis & Research Division
injuries, with another 14% of injuries occurring between noon and 2 p.m. and 10% between 8:00 a.m. and 10:00 a.m. Over one-fifth of direct property damage resulted from fires occurring between 10:00 a.m. and 2:00 p.m. See Figure 13 and Table 29.
Note and Source: See Table 29.
Factors contributing to the ignition of home fires involving central heating units. As shown in Table 30, mechanical failure or malfunction was the predominant factor contributing to ignition of fires involving central heating units (58% of fires), as well as associated losses in all categories (60% of civilian deaths, 32 % of civilian injuries, and 60% of direct property damage). An electrical failure or malfunction was a factor in 13% of fires, accounting for 8% of civilian injuries and 15% of direct property damage, while failure to clean was a factor in another 9% of fires, with 7% of civilian injuries and just 1% of direct property damage. A heat source too close to combustibles was a factor in 5% of fires, but these fires accounted for 10% of civilian deaths, 18% of civilian injuries, and 16% of direct property damage.
The leading item first ignited in home fires involving central heating units was flammable and combustible liquids and gases, piping and filter, figuring in 51% of the fires. These fires accounted for the vast majority of civilian deaths (83%) in fires involving central heating units, as well as 51% of civilian injuries and 15% of direct property damage. Electrical wire or cable insulation was the item first ignited in 14% of the fires (9% of civilian deaths, 10% of civilian injuries, and 5% of direct property damage), while a structural member or framing was first ignited in 5% of fires (29% of direct property damage, as well as 8% of civilian deaths and 7% of civilian injuries). See Table 31. Almost three of five fires involving central heating units (56%) originated in a heating equipment room. These fires accounted for 53% of the civilian deaths, 51% of civilian injuries, and 37% of the direct property damage. A duct for HVAC, cable, exhaust, or air conditioning was the area of origin in 11% of fires, with 20% of civilian injuries and 8% of direct property damage, followed by a crawl space or substructure space (7% of fires, 16% of civilian deaths, 4% of civilian injuries, and 9% of direct property damage). Just 3% of central heating unit fires
4%5% 6%
9%10%
9% 8%10% 11%
12%
9%
7%8%
0%
8%
15%
24%
0%
23%
8%
0%
16%
0% 0%
8%
5%
9%
3%
10%
4%
14%
8% 9% 9%7%
15%
7%8%
9% 9% 9%11%
12%
8%6%
9%
5%
8%
0%
5%
10%
15%
20%
25%
12 a.m.-2a.m.
2-4 a.m. 4-6 a.m. 6-8 a.m. 8-10 a.m. 10 a.m-12p.m.
12-2 p.m. 2-4 p.m. 4-6 p.m. 6-8 p.m. 8-10 p.m. 10 p.m.-12 a.m.
Figure 13. Home Structure Fires Involving Central Heating Units by Time of Day, 2009-2013
Fires Civilian Deaths Civilian Injuries Direct Property Damage

Home Fires Involving Heating Equipment, 3/16 16 NFPA Fire Analysis & Research Division
originated in an attic or ceiling/roof assembly or concealed space, but they were responsible for 14% of direct property damage. See Table 32.

Home Fires Involving Heating Equipment, 3/16 17 NFPA Fire Analysis & Research Division
Section 5. Home Structure Fires Involving Water Heaters
In 2009-2013, there were an estimated average of 5,440 home fires involving water heaters each year, resulting in annual losses of 20 civilian deaths, 160 civilian injuries, and $111 million in direct property damage. As shown in Table F below and Table 33, just over half (53%) of these fires involved gas-fueled equipment, and these fires accounted for all of the fatalities, 83% of civilian injuries, and 70% of the direct property damage. Electric-powered water heaters were involved in 45% of the fires, with 17% of water heater injuries and 29% of direct property damage associated with these fires.
Table F. Home Fires Involving Water Heaters, by Type of Fuel or Power, Annual Average of 2009-2013 Structure Fires Reported to U.S. Fire Departments
Fuel or Power Fires Civilian Deaths
Civilian Injuries
Direct Property Damage (in Millions)
Gas-fueled 2,900 (53%) 20 (100%) 130 (83%) $78 (70%) Electric-powered 2,450 (45%) 0 (0%) 30 (17%) $32 (29%) Liquid-fueled 70 (1%) 0 (0%) 0 (0%) $1 (1%) Solid-fueled 10 (0%) 0 (0%) 0 (0%) $0 (0%) Other 10 (0%) 0 (0%) 0 (0%) $0 (0%)
Total 5,440 (100%) 20 (100%) 160 (100%) $111 (100%)
Note and Source: See Table 33.
Home fires involving water heaters did not follow as strong a seasonal pattern as fires involving other types of heating equipment. January recorded the highest share of fires, 10%, but December and February each recorded 8% of fires, fewer than the share of fires in March, April, May, or June, each of which had 9% of the annual total. See Table 34.
An electrical failure or malfunction was a factor in 32% of home fires involving water heaters, accounting for no civilian deaths, 12% of civilian injuries, and 22% of direct property damage. A mechanical failure or malfunction was a factor contributing to 29% of fires (17% of civilian deaths, 18% of civilian injuries, 25% of direct property damage), while a heat source too close to combustibles was a factor in 21% of fires (50% of civilian deaths, 23% of civilian injuries, 26% of direct property damage). Flammable or liquid gas spilled was a factor in just 2% of fires, but these fires accounted for 33% of civilian deaths, 18% of civilian injuries, and 14% of direct property damage. See Figure 14 and Table 37.

Home Fires Involving Heating Equipment, 3/16 18 NFPA Fire Analysis & Research Division
Note and Source: See Table 37.
An electrical wire or cable insulation was the item first ignited in approximately one-quarter (24%) of water heater fires, accounting for 4% of civilian injuries and 9% of direct property damage. See Table 38. Fires in which flammable and combustible liquids and gases, piping and filter were the item first ignited represented 19% of water heater fires, but these were associated with a disproportionate losses in all categories -- 86% of civilian deaths, 62% of civilian injuries, and 28% of direct property damage.
Almost two of five home fires involving water heaters originated in a heating equipment room (38%). As shown in Table 39, these fires accounted for 44% of civilian deaths, 41% of civilian injuries, and 39% of direct property damage. Almost one-quarter of the fires were confined chimney or flue fires with minimal losses. A laundry room or area was the area of origin for 14% of fires (22% of civilian deaths, 13% of civilian injuries, 14% of direct property damage).
32%29%
21%
3% 3%0%
17%
50%
0% 0%
12%
18%23%
2%
15%
22%25% 26%
2% 4%
0%
10%
20%
30%
40%
50%
60%
Electrical failure ormalfunction
Mechanical failure ormalfunction
Heat source too closeto combustibles
Installation deficiency Misuse of material orproduct, other
Figure 14. Home Fires Involving Water Heaters by Leading Factors Contributing to Ignition, 2009-2013 Annual Averages
Fires Civilian Deaths Civilian Injuries Direct Property Damage

Home Fires Involving Heating Equipment, 3/16 19 NFPA Fire Analysis & Research Division
Table 1. Home Fires Involving Heating Equipment, by Year, 1980-2013
Year Fires Civilian Deaths
Civilian Injuries
Direct Property Damage (in Millions of Current Dollars)
Direct Property Damage (in Millions of
2013 Dollars)
1980 230,000 1,000 3,510 $760 $2,152 1981 228,200 990 2,990 $620 $1,587 1982 232,900 1,190 3,430 $847 $2,043 1983 230,400 1,110 3,650 $842 $1,969 1984 209,700 860 2,830 $777 $1,741 1985 200,900 1,180 3,200 $884 $1,912 1986 167,000 810 2,650 $692 $1,473 1987 147,700 840 2,790 $652 $1,337 1988 138,900 900 3,350 $809 $1,595 1989 128,700 780 2,890 $822 $1,546 1990 97,500 800 2,400 $732 $1,307 1991 98,200 660 2,500 $1,027 $1,757 1992 96,500 640 2,510 $703 $1,168 1993 97,200 680 2,830 $715 $1,153 1994 85,100 610 2,240 $726 $1,142 1995 78,400 560 2,060 $733 $1,121 1996 73,300 800 2,010 $825 $1,227 1997 68,600 570 1,550 $735 $1,067 1998 57,100 490 1,670 $648 $927 1999 78,700 180 (180) 2,080 (2,080) $813 ($756) $1,137 ($1,057) 2000 72,500 810 (810) 1,980 (1,890) $929 ($908) $1,258 ($1,230) 2001 71,900 410 (410) 1,670 (1,580) $849 ($830) $1,118 ($1,093) 2002 73,600 660 (660) 1,580 (1,550) $1,310 ($1,288) $1,698 ($1,669) 2003 71,000 550 (550) 1,750 (1,620) $961 ($940) $1,219 ($1,192) 2004 69,500 670 (670) 1,660 (1,520) $922 ($907) $1,139 ($1,121) 2005 64,900 730 (730) 1,630 (1,510) $966 ($943) $1,153 ($1,125) 2006 64,100 540 (540) 1,400 (1,300) $943 ($937) $1,090 ($1,083) 2007 66,400 580 (580) 1,850 (1,710) $608 ($601) $683 ($675) 2008 66,100 480 (480) 1,660 (1,570) $1,090 ($1,081) $1,181 ($1,172) 2009 58,900 480 (480) 1,520 (1,470) $1,053 ($1,043) $1,144 ($1,133) 2010 57,100 490 (490) 1,530 (1,470) $1,072 ($1,064) $1,147 ($1,138) 2011 53,600 400 (400) 1,520 (1,480) $893 ($886) $926 ($919) 2012 51,800 470 (470) 1,380 (1,320) $938 ($930) $953 ($945) 2013 56,800 510 (510) 1,470 (1,430) $1,133 ($1,125) $1,133 ($1,125)

Home Fires Involving Heating Equipment, 3/16 20 NFPA Fire Analysis & Research Division
Note: These are national estimates of fires reported to U.S. municipal fire departments and so exclude fires reported only to federal or state agencies or industrial fire brigades. Numbers in parentheses exclude confined fires. Analyses were performed separately for non-confined fires, fires reported as confined chimney or flue fires, and fires reports as confined to fuel burner or boiler. Fires reported as confined to cooking vessel, trash container, incinerator, or commercial compactor are not included in these estimates. Fires, deaths, and injuries are rounded to the nearest ten and direct property damage to the nearest million dollars. Totals may not equal sums due to rounding errors. Figures reflect a proportional share of home fires with equipment involved in ignition unknown or reported as heating or air conditioning equipment of unknown type. Fires reported as “no equipment” but lacking a confirming specific heat source (codes 40-99) are also treated as unknown equipment and allocated. Because of low participation in NFIRS Version 5.0 during 1999-2001, estimates for those years are highly uncertain and must be used with caution. Inflation adjustment to 2013 dollars is calculated using the Consumer Price Index.
Source: NFIRS 5.0 and NFPA Fire Experience Survey, 2009-2013

Home Fires Involving Heating Equipment, 3/16 21 NFPA Fire Analysis & Research Division
Table 2. Home Fires Involving Heating Equipment by Type of Equipment,
2009-2013 Annual Averages
Equipment Fires Civilian Deaths
Civilian Injuries
Direct Property Damage (in Millions)
Space heater 22,640 (40%) 400 (84%) 1,120 (75%) $538 (52%) Fireplace or chimney 17,910 (32%) 30 (5%) 90 (6%) $254 (25%) Central heat 6,970 (12%) 20 (5%) 80 (5%) $81 (8%) Water heater 5,440 (10%) 20 (4%) 160 (10%) $111 (11%) Heat lamp 640 (1%) 10 (1%) 20 (2%) $35 (3%) Heat tape 230 (0%) 0 (0%) 0 (0%) $6 (1%) Steamline, heat pipe, hot air duct 50 (0%) 0 (0%) 0 (0%) $1 (0%) Confined fuel burner/boiler, no heating equipment 1,330 (2%) 0 (0%) 7 (0%) $0 (0%) Confined to chimney/flue, no heating equipment 790 (1%) 0 (0%) 7 (0%) $0 (0%) Total 56,000 (100%) 470 (100%) 1,490 (100%) $1,027 (100%)
Note: These are national estimates of fires reported to U.S. municipal fire departments and so exclude fires reported to federal or state agencies or industrial fire brigades. Analyses were performed separately for non-confined fires, fires reported as confined chimney or flue fires, and fires reports as confined to fuel burner or boiler. Fires, deaths, and injuries are rounded to the nearest ten and direct property damage to the nearest million dollars. Totals may not equal sums due to rounding errors.
Source: NFIRS 5.0 and NFPA Fire Experience Survey, 2009-2013.
Home Fires Involving Heating Equipment, 3/16 22 NFPA Fire Analysis & Research Division
Table 3. Home Fires Involving Heating Equipment, by Month,
2009-2013 Annual Averages
Month Fires Civilian Deaths
Civilian Injuries
Direct Property Damage (in Millions)
January 10,550 (19%) 100 (21%) 220 (14%) $192 (19%) February 8,040 (14%) 70 (16%) 140 (10%) $135 (13%) March 6,320 (11%) 40 (9%) 140 (10%) $104 (10%) April 3,700 (7%) 20 (5%) 90 (6%) $69 (7%) May 2,230 (4%) 20 (4%) 100 (6%) $40 (4%) June 1,560 (3%) 10 (2%) 70 (5%) $29 (3%) July 1,440 (3%) 10 (2%) 60 (4%) $24 (2%) August 1,450 (3%) 10 (2%) 50 (3%) $24 (2%) September 1,830 (3%) 10 (2%) 70 (5%) $32 (3%) October 3,990 (7%) 20 (4%) 130 (9%) $79 (8%) November 6,080 (11%) 60 (12%) 180 (12%) $126 (12%) December 8,800 (16%) 100 (22%) 240 (16%) $173 (17%)
Total 56,000 (100%) 470 (100%) 1,490 (100%) $1,027 (100%)
Note: These are national estimates of fires reported to U.S. municipal fire departments and so exclude fires reported to federal or state agencies or industrial fire brigades. Analyses were performed separately for non-confined fires, fires reported as confined chimney or flue fires, and fires reports as confined to fuel burner or boiler. Fires, deaths, and injuries are rounded to the nearest ten and direct property damage to the nearest million dollars. Totals may not equal sums due to rounding errors.
Source: NFIRS 5.0 and NFPA Fire Experience Survey, 2009-2013.

Home Fires Involving Heating Equipment, 3/16 23 NFPA Fire Analysis & Research Division
Table 4. Home Fires Involving Heating Equipment, by Day of Week,
2009-2013 Annual Averages
Day of Week Fires Civilian Deaths
Civilian Injuries
Direct Property Damage (in Millions)
Sunday 8,350 (15%) 70 (14%) 230 (15%) $146 (14%) Monday 7,920 (14%) 70 (16%) 230 (15%) $149 (14%) Tuesday 7,800 (14%) 50 (10%) 220 (15%) $140 (14%) Wednesday 7,590 (14%) 60 (13%) 190 (13%) $135 (13%) Thursday 7,770 (14%) 70 (14%) 200 (14%) $155 (15%) Friday 8,070 (14%) 70 (15%) 200 (13%) $153 (15%) Saturday 8,500 (15%) 80 (17%) 230 (15%) $149 (15%)
Total 56,000 (100%) 470 (100%) 1,490 (100%) $1,027 (100%)
Note: These are national estimates of fires reported to U.S. municipal fire departments and so exclude fires reported to federal or state agencies or industrial fire brigades. Analyses were performed separately for non-confined fires, fires reported as confined chimney or flue fires, and fires reports as confined to fuel burner or boiler. Fires, deaths, and injuries are rounded to the nearest ten and direct property damage to the nearest million dollars. Totals may not equal sums due to rounding errors.
Source: NFIRS 5.0 and NFPA Fire Experience Survey, 2009-2013.

Home Fires Involving Heating Equipment, 3/16 24 NFPA Fire Analysis & Research Division
Table 5. Home Fires Involving Heating Equipment, by Time of Day,
2009-2013 Annual Averages
Time of Day Fires Civilian Deaths
Civilian Injuries
Direct Property Damage (in Millions)
Midnight-12:59 a.m. 1,520 (3%) 20 (5%) 70 (5%) $46 (5%) 1:00-1:59 a.m. 1,270 (2%) 30 (6%) 60 (4%) $44 (4%) 2:00-2:59 a.m. 1,030 (2%) 30 (6%) 50 (3%) $35 (3%) 3:00-3:59 a.m. 1,010 (2%) 20 (5%) 50 (3%) $39 (4%) 4:00-4:59 a.m. 950 (2%) 20 (5%) 40 (2%) $28 (3%) 5:00-5:59 a.m. 1,080 (2%) 20 (4%) 50 (3%) $34 (3%) 6:00-6:59 a.m. 1,490 (3%) 40 (9%) 50 (4%) $30 (3%) 7:00-7:59 a.m. 2,010 (4%) 30 (6%) 40 (3%) $34 (3%) 8:00-8:59 a.m. 2,180 (4%) 20 (4%) 80 (5%) $36 (4%) 9:00-9:59 a.m. 2,240 (4%) 40 (8%) 70 (5%) $39 (4%) 10:00-10:59 a.m. 2,350 (4%) 30 (7%) 50 (3%) $41 (4%) 11:00-11:59 a.m. 2,380 (4%) 10 (1%) 50 (3%) $45 (4%) 12:00-12:59 p.m. 2,460 (4%) 10 (2%) 60 (4%) $40 (4%) 1:00-1:59 p.m. 2,410 (4%) 20 (4%) 70 (5%) $52 (5%) 2:00-2:59 p.m. 2,590 (5%) 10 (1%) 80 (5%) $48 (5%) 3:00-3:59 p.m. 2,690 (5%) 10 (2%) 80 (5%) $43 (4%) 4:00-4:59 p.m. 3,190 (6%) 10 (2%) 80 (5%) $44 (4%) 5:00-5:59 p.m. 3,720 (7%) 10 (2%) 80 (6%) $49 (5%) 6:00-6:59 p.m. 4,050 (7%) 20 (4%) 70 (5%) $53 (5%) 7:00-7:59 p.m. 4,060 (7%) 20 (3%) 60 (4%) $50 (5%) 8:00-8:59 p.m. 3,770 (7%) 0 (1%) 60 (4%) $61 (6%) 9:00-9:59 p.m. 3,130 (6%) 20 (4%) 60 (4%) $44 (4%) 10:00-10:59 p.m. 2,540 (5%) 30 (6%) 60 (4%) $49 (5%) 11:00-11:59 p.m. 1,900 (3%) 10 (3%) 60 (4%) $42 (4%)
Total 56,000 (100%) 470 (100%) 1,490 (100%) $1,027 (100%)
Note: These are national estimates of fires reported to U.S. municipal fire departments and so exclude fires reported to federal or state agencies or industrial fire brigades. Analyses were performed separately for non-confined fires, fires reported as confined chimney or flue fires, and fires reports as confined to fuel burner or boiler. Fires, deaths, and injuries are rounded to the nearest ten and direct property damage to the nearest million dollars. Totals may not equal sums due to rounding errors.
Source: NFIRS 5.0 and NFPA Fire Experience Survey, 2009-2013.

Home Fires Involving Heating Equipment, 3/16 25 NFPA Fire Analysis & Research Division
Table 6. Home Fires Involving Heating Equipment, by Factor Contributing to Ignition,
2009-2013 Annual Averages
Factor Contributing to Ignition Fires
Civilian Deaths
Civilian Injuries
Direct Property Damage (in Millions)
Failure to clean 16,600 (30%) 0 (1%) 30 (2%) $57 (6%) Heat source too close to
combustibles. 7,940 (14%) 260 (56%) 460 (31%) $318 (31%) Mechanical failure or
malfunction 7,660 (14%) 40 (9%) 140 (9%) $166 (16%) Equipment unattended 3,440 (6%) 50 (11%) 260 (18%) $105 (10%) Electrical failure or malfunction 2,870 (5%) 40 (9%) 80 (5%) $84 (8%) Unclassified misuse of material
or product 1,880 (3%) 10 (2%) 90 (6%) $29 (3%) Unclassified operational
deficiency 1,510 (3%) 10 (2%) 30 (2%) $33 (3%) Installation deficiency 1,470 (3%) 0 (1%) 40 (2%) $44 (4%) Abandoned or discarded
materials or products 1,080 (2%) 0 (1%) 40 (3%) $19 (2%) Accidentally turned on, not
turned off 1,020 (2%) 10 (2%) 60 (4%) $27 (3%) Equipment not being operated
properly 920 (2%) 10 (1%) 40 (2%) $20 (2%) Other known factor
contributing to ignition 9,180 (16%) 60 (13%) 320 (22%) $216 (21%) Other unspecified factor
contributing to ignition 3,320 (6%) 10 (3%) 60 (4%) $38 (4%)
Total fires 56,000 (100%) 470 (100%) 1,490 (100%) $1,027 (100%) Total factors contributing to
ignition* 58,890 (105%) 515 (109%) 1,644 (110%) $1,154 (112%) *Multiple entries are allowed, which can result in sums higher than totals. Note: These are national estimates of fires reported to U.S. municipal fire departments and so exclude fires reported to federal or state agencies or industrial fire brigades. Analyses were performed separately for non-confined fires, fires reported as confined chimney or flue fires, and fires reports as confined to fuel burner or boiler. Fires, deaths, and injuries are rounded to the nearest ten and direct property damage to the nearest million dollars. Totals may not equal sums due to rounding errors.
Source: NFIRS 5.0 and NFPA Fire Experience Survey, 2009-2013.

Home Fires Involving Heating Equipment, 3/16 26 NFPA Fire Analysis & Research Division
Table 7. Home Fires Involving Heating Equipment, by Item First Ignited, Annual Average of 2009-2013
Structure Fires Reported to U.S. Fire Departments
Item First Ignited Fires Civilian Deaths
Civilian Injuries
Direct Property Damage (in Millions)
Flammable and combustible
liquids and gases, piping and filter 6,690 (12%) 60 (14%) 250 (17%) $73 (7%)
Unclassified organic materials 5,790 (10%) 0 (1%) 10 (1%) $6 (1%) Structural member or framing 4,310 (8%) 30 (6%) 70 (4%) $273 (27%) Cooking materials, including
food 3,780 (7%) 10 (3%) 350 (24%) $74 (7%) Film or residue, including paint,
resin and creosote 3,570 (6%) 0 (0%) 0 (0%) $2 (0%) Electrical wire or cable
insulation 2,810 (5%) 0 (1%) 50 (3%) $28 (3%) Appliance housing or casing 1,370 (2%) 0 (0%) 30 (2%) $13 (1%) Interior wall covering. excluding
drapes 1,340 (2%) 20 (5%) 50 (3%) $68 (7%) Unclassified structural
component or finish 1,240 (2%) 10 (1%) 30 (2%) $59 (6%) Heavy vegetation including trees 1,090 (2%) 0 (0%) 10 (0%) $2 (0%) Dust, fiber, lint, including
sawdust or excelsior 1,080 (2%) 10 (1%) 10 (1%) $6 (1%) Clothing 1,020 (2%) 40 (9%) 70 (5%) $35 (3%) Magazine, newspaper, writing
paper 1,020 (2%) 20 (3%) 20 (1%) $10 (1%) Floor covering rug, carpet, or
mat 940 (2%) 40 (8%) 40 (3%) $31 (3%) Chips, including wood chips 860 (2%) 0 (0%) 0 (0%) $1 (0%) Unclassified item first ignited 9,550 (17%) 10 (1%) 40 (3%) $32 (3%) Other known item first ignited 9,580 (17%) 220 (47%) 460 (31%) $314 (31%)
Total 56,000 (100%) 470 (100%) 1,490 (100%) $1,027 (100%)
Note: These are national estimates of fires reported to U.S. municipal fire departments and so exclude fires reported to federal or state agencies or industrial fire brigades. Analyses were performed separately for non-confined fires, fires reported as confined chimney or flue fires, and fires reports as confined to fuel burner or boiler. Fires, deaths, and injuries are rounded to the nearest ten and direct property damage to the nearest million dollars. Totals may not equal sums due to rounding errors. Source: NFIRS 5.0 and NFPA Fire Experience Survey, 2009-2013.

Home Fires Involving Heating Equipment, 3/16 27 NFPA Fire Analysis & Research Division
Table 8. Home Fires Involving Heating Equipment, by Heat Source, Annual Average of 2009-2013
Structure Fires Reported to U.S. Fire Departments
Heat Source Fires Civilian Deaths
Civilian Injuries
Direct Property Damage (in Millions)
Hot ember or ash 10,520 (19%) 20 (4%) 50 (3%) $71 (7%) Radiated, conducted heat
from operating equipment 10,290 (18%) 200 (42%) 530 (35%) $368 (36%) Spark, ember or flame from
operating equipment 7,390 (13%) 90 (19%) 260 (18%) $145 (14%) Unclassified heat from
powered equipment 6,880 (12%) 70 (15%) 330 (22%) $156 (15%) Heat from direct flame or
convection currents 3,350 (6%) 10 (2%) 40 (3%) $38 (4%) Arcing 2,880 (5%) 20 (5%) 60 (4%) $51 (5%) Unclassified hot or
smoldering object 2,760 (5%) 10 (1%) 40 (2%) $37 (4%) Match 1,820 (3%) 10 (2%) 30 (2%) $9 (1%) Unclassified heat source 4,010 (7%) 20 (4%) 70 (5%) $50 (5%) Other specified heat source 6,090 (11%) 30 (6%) 80 (6%) $100 (10%)
Total 56,000 (100%) 470 (100%) 1,490 (100%) $1,027 (100%)
Note: These are national estimates of fires reported to U.S. municipal fire departments and so exclude fires reported to federal or state agencies or industrial fire brigades. Analyses were performed separately for non-confined fires, fires reported as confined chimney or flue fires, and fires reports as confined to fuel burner or boiler. Fires, deaths, and injuries are rounded to the nearest ten and direct property damage to the nearest million dollars. Totals may not equal sums due to rounding errors. Source: NFIRS 5.0 and NFPA Fire Experience Survey, 2009-2013.

Home Fires Involving Heating Equipment, 3/16 28 NFPA Fire Analysis & Research Division
Table 9. Home Fires Involving Heating Equipment, by Area of Origin, Annual Average of 2009-2013
Structure Fires Reported to U.S. Fire Departments
Area of Origin Fires Civilian Deaths
Civilian Injuries
Direct Property Damage (in Millions)
Confined chimney or flue fire* 20,550 (37%) 0 (0%) 20 (1%) $6 (1%) Heating equipment room 7,790 (14%) 20 (5%) 140 (9%) $97 (9%) Kitchen or cooking area 6,850 (12%) 70 (14%) 570 (38%) $148 (14%) Living room, family room, or
den 2,490 (4%) 150 (31%) 180 (12%) $121 (12%) Bedroom 2,070 (4%) 90 (20%) 190 (13%) $98 (10%) Unclassified function area 1,690 (3%) 40 (8%) 60 (4%) $43 (4%) Duct for HVAC, cable, exhaust,
heating, or AC 1,530 (3%) 0 (1%) 20 (1%) $20 (2%) Wall assembly or concealed
space 1,500 (3%) 10 (1%) 30 (2%) $89 (9%) Crawl space substructure 1,330 (2%) 10 (2%) 30 (2%) $38 (4%) Laundry room or area 1,230 (2%) 0 (1%) 30 (2%) $23 (2%) Attic or ceiling/roof assembly or
concealed space 1,130 (2%) 0 (0%) 20 (1%) $75 (7%) Other known area of origin 7,000 (13%) 80 (17%) 200 (13%) $261 (25%) Unclassified area of origin 830 (1%) 0 (0%) 0 (0%) $8 (1%)
Total 56,000 (100%) 470 (100%) 1,490 (100%) $1,027 (100%)
*NFIRS 5.0 does not have a separate area of origin code for fires starting in chimneys. Any home fire with NFIRS incident type 114 (Chimney or flue fire originating in and confined to a chimney or flue) is captured here. Note: These are national estimates of fires reported to U.S. municipal fire departments and so exclude fires reported to federal or state agencies or industrial fire brigades. Analyses were performed separately for non-confined fires, fires reported as confined chimney or flue fires, and fires reports as confined to fuel burner or boiler. Fires, deaths, and injuries are rounded to the nearest ten and direct property damage to the nearest million dollars. Totals may not equal sums due to rounding errors. Source: NFIRS 5.0 and NFPA Fire Experience Survey, 2009-2013.

Home Fires Involving Heating Equipment, 3/16 29 NFPA Fire Analysis & Research Division
Table 10. Home Fires Involving Heating Equipment, by Type of Fuel or Power,
2009-2013 Annual Averages
Fuel or Power Fires Civilian Deaths
Civilian Injuries
Direct Property Damage (in Millions)
Solid-fueled 24,040 (43%) 120 (25%) 180 (12%) $342 (33%) Electric-powered 17,680 (32%) 220 (46%) 800 (54%) $422 (41%) Gas-fueled 9,980 (18%) 90 (19%) 410 (27%) $228 (22%) Liquid-fueled 3,820 (7%) 50 (11%) 100 (6%) $30 (3%) Other 490 (1%) 0 (0%) 10 (1%) $5 (0%)
Total 56,000 (100%) 470 (100%) 1,490 (100%) $1,027 (100%)
Note: These are national estimates of fires reported to U.S. municipal fire departments and so exclude fires reported to federal or state agencies or industrial fire brigades. Analyses were performed separately for non-confined fires, fires reported as confined chimney or flue fires, and fires reports as confined to fuel burner or boiler. Fires, deaths, and injuries are rounded to the nearest ten and direct property damage to the nearest million dollars. Totals may not equal sums due to rounding errors.
Source: NFIRS 5.0 and NFPA Fire Experience Survey, 2009-2013.
Home Fires Involving Heating Equipment, 3/16 30 NFPA Fire Analysis & Research Division
Table 11. Home Fires Involving Space Heaters, by Type of Fuel or Power and Portability,
2009-2013 Annual Averages
Equipment Portability Fires
Civilian Deaths
Civilian Injuries
Direct Property Damage (in Millions)
Electric-powered 10,300 (46%) 210 (51%) 730 (66%) $305 (57%) Portable 3,350 (15%) 160 (39%) 310 (28%) $150 (28%) Stationary 6,950 (31%) 50 (12%) 430 (38%) $155 (29%) Solid-fueled 7,050 (31%) 90 (24%) 100 (9%) $124 (23%) Portable 310 (1%) 0 (0%) 0 (0%) $2 (0%) Stationary 6,740 (30%) 90 (23%) 90 (8%) $121 (23%) Gas-fueled 3,460 (15%) 60 (14%) 200 (18%) $84 (16%) Portable 580 (3%) 10 (3%) 50 (5%) $25 (5%) Stationary 2,880 (13%) 40 (11%) 140 (13%) $59 (11%) Liquid-fueled 1,720 (8%) 40 (11%) 80 (7%) $23 (4%) Portable 530 (2%) 40 (11%) 60 (5%) $19 (4%) Stationary 1,200 (5%) 0 (0%) 20 (2%) $4 (1%) Other fuel source 100 (0%) 0 (0%) 10 (1%) $2 (0%) Portable 20 (0%) 0 (0%) 0 (0%) $0 (0%) Stationary 90 (0%) 0 (0%) 0 (0%) $2 (0%)
Total 22,640 (100%) 400 (100%) 1,120 (100%) $538 (100%)
Note: These are national estimates of fires reported to U.S. municipal fire departments and so exclude fires reported to federal or state agencies or industrial fire brigades. Analyses were performed separately for non-confined fires, fires reported as confined chimney or flue fires, and fires reports as confined to fuel burner or boiler. Fires, deaths, and injuries are rounded to the nearest ten and direct property damage to the nearest million dollars. Totals may not equal sums due to rounding errors.
Source: NFIRS 5.0 and NFPA Fire Experience Survey, 2009-2013.

Home Fires Involving Heating Equipment, 3/16 31 NFPA Fire Analysis & Research Division
Table 12. Home Fires Involving Space Heaters, by Month,
2009-2013 Annual Averages
Month Fires Civilian Deaths
Civilian Injuries
Direct Property Damage (in Millions)
January 4,000 (18%) 90 (22%) 160 (14%) $101 (19%) February 3,120 (14%) 70 (17%) 120 (10%) $74 (14%) March 2,470 (11%) 40 (10%) 110 (10%) $52 (10%) April 1,500 (7%) 20 (4%) 70 (6%) $34 (6%) May 970 (4%) 10 (2%) 80 (7%) $21 (4%) June 670 (3%) 10 (2%) 40 (4%) $15 (3%) July 660 (3%) 10 (2%) 50 (4%) $11 (2%) August 630 (3%) 0 (0%) 30 (2%) $12 (2%) September 810 (4%) 10 (2%) 40 (4%) $22 (4%) October 1,700 (8%) 10 (3%) 90 (9%) $40 (7%) November 2,490 (11%) 50 (13%) 130 (11%) $64 (12%) December 3,610 (16%) 90 (23%) 200 (18%) $94 (18%)
Total 22,640 (100%) 400 (100%) 1,120 (100%) $538 (100%)
Note: These are national estimates of fires reported to U.S. municipal fire departments and so exclude fires reported to federal or state agencies or industrial fire brigades. Analyses were performed separately for non-confined fires, fires reported as confined chimney or flue fires, and fires reports as confined to fuel burner or boiler. Fires, deaths, and injuries are rounded to the nearest ten and direct property damage to the nearest million dollars. Totals may not equal sums due to rounding errors.
Source: NFIRS 5.0 and NFPA Fire Experience Survey, 2009-2013.

Home Fires Involving Heating Equipment, 3/16 32 NFPA Fire Analysis & Research Division
Table 13. Home Fires Involving Space Heaters, by Day of Week,
2009-2013 Annual Averages
Day of Week Fires Civilian Deaths
Civilian Injuries
Direct Property Damage (in Millions)
Sunday 3,170 (14%) 60 (15%) 170 (16%) $75 (14%) Monday 3,320 (15%) 60 (16%) 170 (16%) $75 (14%) Tuesday 3,250 (14%) 40 (10%) 140 (13%) $81 (15%) Wednesday 3,090 (14%) 40 (11%) 150 (13%) $73 (14%) Thursday 3,240 (14%) 60 (14%) 160 (14%) $84 (16%) Friday 3,260 (14%) 70 (18%) 140 (13%) $78 (15%) Saturday 3,310 (15%) 70 (17%) 180 (16%) $72 (13%)
Total 22,640 (100%) 400 (100%) 1,120 (100%) $538 (100%)
Note: These are national estimates of fires reported to U.S. municipal fire departments and so exclude fires reported to federal or state agencies or industrial fire brigades. Analyses were performed separately for non-confined fires, fires reported as confined chimney or flue fires, and fires reports as confined to fuel burner or boiler. Fires, deaths, and injuries are rounded to the nearest ten and direct property damage to the nearest million dollars. Totals may not equal sums due to rounding errors. Source: NFIRS 5.0 and NFPA Fire Experience Survey, 2009-2013.

Home Fires Involving Heating Equipment, 3/16 33 NFPA Fire Analysis & Research Division
Table 14. Home Fires Involving Space Heaters, by Time of Day,
2009-2013 Annual Averages
Time of Day Fires Civilian Deaths
Civilian Injuries
Direct Property Damage (in Millions)
Midnight-12:59 a.m. 620 (3%) 20 (5%) 50 (5%) $24 (4%) 1:00-1:59 a.m. 560 (2%) 20 (6%) 40 (4%) $22 (4%) 2:00-2:59 a.m. 490 (2%) 30 (7%) 40 (3%) $20 (4%) 3:00-3:59 a.m. 490 (2%) 20 (4%) 40 (4%) $19 (4%) 4:00-4:59 a.m. 460 (2%) 20 (5%) 20 (2%) $13 (2%) 5:00-5:59 a.m. 480 (2%) 20 (4%) 30 (3%) $15 (3%) 6:00-6:59 a.m. 610 (3%) 40 (10%) 40 (4%) $17 (3%) 7:00-7:59 a.m. 820 (4%) 20 (6%) 40 (3%) $16 (3%) 8:00-8:59 a.m. 850 (4%) 20 (4%) 60 (5%) $20 (4%) 9:00-9:59 a.m. 860 (4%) 30 (7%) 50 (5%) $20 (4%) 10:00-10:59 a.m. 1,030 (5%) 30 (7%) 40 (4%) $23 (4%) 11:00-11:59 a.m. 1,070 (5%) 10 (1%) 40 (3%) $28 (5%) 12:00-12:59 p.m. 1,080 (5%) 10 (2%) 50 (4%) $23 (4%) 1:00-1:59 p.m. 1,110 (5%) 20 (4%) 50 (5%) $34 (6%) 2:00-2:59 p.m. 1,080 (5%) 10 (1%) 60 (5%) $26 (5%) 3:00-3:59 p.m. 1,130 (5%) 10 (1%) 60 (5%) $23 (4%) 4:00-4:59 p.m. 1,340 (6%) 10 (1%) 60 (5%) $25 (5%) 5:00-5:59 p.m. 1,450 (6%) 10 (3%) 60 (5%) $30 (6%) 6:00-6:59 p.m. 1,560 (7%) 10 (3%) 60 (5%) $23 (4%) 7:00-7:59 p.m. 1,430 (6%) 10 (2%) 40 (3%) $25 (5%) 8:00-8:59 p.m. 1,370 (6%) 0 (1%) 50 (4%) $28 (5%) 9:00-9:59 p.m. 1,050 (5%) 10 (3%) 60 (5%) $23 (4%) 10:00-10:59 p.m. 1,000 (4%) 30 (7%) 50 (4%) $23 (4%) 11:00-11:59 p.m. 710 (3%) 10 (3%) 40 (4%) $19 (4%) Total 22,640 (100%) 400 (100%) 1,120 (100%) $538 (100%)
Note: These are national estimates of fires reported to U.S. municipal fire departments and so exclude fires reported to federal or state agencies or industrial fire brigades. Analyses were performed separately for non-confined fires, fires reported as confined chimney or flue fires, and fires reports as confined to fuel burner or boiler. Fires, deaths, and injuries are rounded to the nearest ten and direct property damage to the nearest million dollars. Totals may not equal sums due to rounding errors. Source: NFIRS 5.0 and NFPA Fire Experience Survey, 2009-2013.

Home Fires Involving Heating Equipment, 3/16 34 NFPA Fire Analysis & Research Division
Table 15. Home Fires Involving Space Heaters, by Type of Device, Annual Average of 2009-2013
Structure Fires Reported to U.S. Fire Departments
Type of Device Fires Civilian Deaths
Civilian Injuries
Direct Property Damage (in Millions)
Space heater 22,640 (40%) 400 (84%) 1,120 (75%) $538 (52%) Heating stove 10,260 (45%) 130 (33%) 630 (56%) $216 (40%) Heater (including catalytic and oil-filled) 5920 (26%) 230 (58%) 400 (36%) $218 (41%) Local furnace 2820 (12%) 20 (5%) 60 (5%) $46 (9%) Fireplace with insert 3,640 (16%) 20 (5%) 30 (3%) $58 (11%)
Total 22,640 (100%) 400 (100%) 1,120 (100%) $538 (100%)
Note: These are national estimates of fires reported to U.S. municipal fire departments and so exclude fires reported to federal or state agencies or industrial fire brigades. Analyses were performed separately for non-confined fires, fires reported as confined chimney or flue fires, and fires reports as confined to fuel burner or boiler. Fires, deaths, and injuries are rounded to the nearest ten and direct property damage to the nearest million dollars. Totals may not equal sums due to rounding errors. Source: NFIRS 5.0 and NFPA Fire Experience Survey, 2009-2013.

Home Fires Involving Heating Equipment, 3/16 35 NFPA Fire Analysis & Research Division
Table 16. Home Fires Involving Space Heaters, by Factor Contributing to Ignition,
2009-2013 Annual Averages
Factor Contributing to Ignition Fires
Civilian Deaths
Civilian Injuries
Direct Property Damage (in Millions)
Failure to clean 4,950 (22%) 0 (1%) 10 (1%) $12 (2%) Heat source too close to
combustibles. 4,670 (21%) 230 (59%) 380 (34%) $208 (39%) Mechanical failure or
malfunction 3,450 (15%) 20 (6%) 90 (8%) $53 (10%) Equipment unattended 3,110 (14%) 50 (13%) 270 (24%) $95 (18%) Electrical failure or malfunction 1,630 (7%) 50 (12%) 50 (5%) $56 (10%) Accidentally turned on, not
turned off 950 (4%) 10 (2%) 60 (5%) $25 (5%) Abandoned or discarded
materials or products 720 (3%) 0 (1%) 30 (3%) $16 (3%) Misuse of material or product,
other 670 (3%) 10 (2%) 60 (6%) $14 (3%) Installation deficiency 520 (2%) 0 (1%) 20 (2%) $16 (3%) Equipment not being operated
properly 460 (2%) 0 (1%) 30 (2%) $11 (2%) Operational deficiency, other 390 (2%) 10 (2%) 20 (2%) $13 (2%) Unclassified factor contributed
to ignition 680 (3%) 10 (3%) 60 (5%) $19 (4%) Other known factor
contributing to ignition 1,830 (8%) 40 (9%) 140 (13%) $60 (11%)
Total fires 22,640 (100%) 400 (100%) 1,120 (100%) $538 (100%)
Total factors contributing to ignition* 24,050 (106%) 440 (109%) 1,230 (110%) $600 (111%)
*Multiple entries are allowed, which can result in sums higher than totals. Note: These are national estimates of fires reported to U.S. municipal fire departments and so exclude fires reported to federal or state agencies or industrial fire brigades. Analyses were performed separately for non-confined fires, fires reported as confined chimney or flue fires, and fires reports as confined to fuel burner or boiler. Fires, deaths, and injuries are rounded to the nearest ten and direct property damage to the nearest million dollars. Totals may not equal sums due to rounding errors. Source: NFIRS 5.0 and NFPA Fire Experience Survey, 2009-2013. Source: NFIRS 5.0 and NFPA Fire Experience Survey, 2009-2013.

Home Fires Involving Heating Equipment, 3/16 36 NFPA Fire Analysis & Research Division
Table 17. Home Fires Involving Space Heaters, by Item First Ignited,
2009-2013 Annual Averages
Item First Ignited Fires Civilian Deaths
Civilian Injuries
Direct Property Damage (in Millions)
Cooking materials, including
food 3,680 (16%) 10 (4%) 360 (32%) $76 (14%) Flammable and combustible
liquids and gases, piping and filter 2,720 (12%) 20 (6%) 110 (10%) $25 (5%)
Structural member or framing 1,440 (6%) 10 (3%) 20 (2%) $92 (17%) Unclassified organic materials 1,420 (6%) 0 (1%) 10 (1%) $2 (0%) Film or residue, including
paint, resin and creosote 1,110 (5%) 0 (0%) 0 (0%) $0 (0%) Electrical wire or cable
insulation 840 (4%) 0 (0%) 30 (3%) $11 (2%) Interior wall covering.
excluding drapes 780 (3%) 20 (6%) 30 (3%) $36 (7%) Appliance housing or casing 710 (3%) 0 (0%) 30 (3%) $8 (2%) Mattress or bedding 710 (3%) 80 (19%) 90 (8%) $38 (7%) Cabinetry 630 (3%) 10 (2%) 40 (4%) $22 (4%) Clothing 550 (2%) 40 (9%) 50 (4%) $20 (4%) Floor covering rug, carpet, or
mat 530 (2%) 40 (10%) 30 (3%) $20 (4%) Upholstered furniture or
vehicle seat 390 (2%) 30 (9%) 30 (3%) $20 (4%) Unclassified structural
component or finish 380 (2%) 0 (0%) 20 (2%) $22 (4%) Magazine, newspaper, writing
paper 380 (2%) 20 (4%) 10 (1%) $8 (2%) Unspecified item first ignited 2,020 (9%) 10 (2%) 20 (2%) $12 (2%) Other known item first ignited 4,360 (19%) 110 (26%) 220 (20%) $125 (23%)
Total 22,640 (100%) 400 (100%) 1,120 (100%) $538 (100%)
Note: These are national estimates of fires reported to U.S. municipal fire departments and so exclude fires reported to federal or state agencies or industrial fire brigades. Analyses were performed separately for non-confined fires, fires reported as confined chimney or flue fires, and fires reports as confined to fuel burner or boiler. Fires, deaths, and injuries are rounded to the nearest ten and direct property damage to the nearest million dollars. Totals may not equal sums due to rounding errors. Source: NFIRS 5.0 and NFPA Fire Experience Survey, 2009-2013.

Home Fires Involving Heating Equipment, 3/16 37 NFPA Fire Analysis & Research Division
Table 18. Home Fires Involving Space Heaters, by Area of Origin,
2009-2013 Annual Averages
Area of Origin Fires Civilian Deaths
Civilian Injuries
Direct Property Damage (in Millions)
Kitchen or cooking area* 6,140 (27%) 60 (16%) 560 (50%) $142 (26%) Bedroom 1,820 (8%) 90 (23%) 170 (15%) $84 (16%) Living room, family room,
or den 1,770 (8%) 140 (35%) 140 (12%) $74 (14%) Heating equipment room 1,650 (7%) 0 (0%) 30 (3%) $20 (4%) Unclassified function area 1,150 (5%) 30 (8%) 50 (5%) $32 (6%) Wall assembly or
concealed space 600 (3%) 0 (1%) 10 (1%) $29 (5%) Lavatory, bathroom, locker
room or check room 510 (2%) 10 (2%) 10 (1%) $11 (2%) Duct for HVAC, cable,
exhaust, heating, or AC 430 (2%) 0 (0%) 0 (0%) $6 (1%) Crawl space or substructure
space 370 (2%) 0 (0%) 10 (1%) $18 (3%) Garage or vehicle storage
area 340 (2%) 0 (0%) 30 (3%) $29 (5%) Unclassified area of origin 200 (1%) 0 (0%) 0 (0%) $4 (1%) Confined chimney or flue
fire 5,370 (24%) 0 (0%) 0 (0%) $1 (0%) Other known area of origin 2,290 (10%) 60 (14%) 90 (8%) $89 (17%)
Total 22,640 (100%) 400 (100%) 1,120 (100%) $538 (100%)
*NFIRS 5.0 does not have a separate area of origin code for fires starting in chimneys. Any home fire with NFIRS incident type 114 (Chimney or flue fire originating in and confined to a chimney or flue) is captured here. Note: These are national estimates of fires reported to U.S. municipal fire departments and so exclude fires reported to federal or state agencies or industrial fire brigades. Analyses were performed separately for non-confined fires, fires reported as confined chimney or flue fires, and fires reports as confined to fuel burner or boiler. Fires, deaths, and injuries are rounded to the nearest ten and direct property damage to the nearest million dollars. Totals may not equal sums due to rounding errors. Source: NFIRS 5.0 and NFPA Fire Experience Survey, 2009-2013.

Home Fires Involving Heating Equipment, 3/16 38 NFPA Fire Analysis & Research Division
Table 19. Home Fires Involving Fireplaces, Chimneys or Chimney Connectors, by Type of Fuel or Power,
2009-2013 Annual Averages
Fuel or Power Fires Civilian Deaths
Civilian Injuries
Direct Property Damage (in Millions)
Solid-fueled 16,770 (94%) 20 (93%) 80 (90%) $218 (86%) Gas-fueled 580 (3%) 0 (7%) 10 (9%) $22 (9%) Electric-powered 260 (1%) 0 (0%) 0 (0%) $10 (4%) Liquid-fueled 60 (0%) 0 (0%) 0 (0%) $0 (0%) Other power source 250 (1%) 0 (0%) 0 (1%) $3 (1%)
Total 17,910 (100%) 30 (100%) 90 (100%) 254 (100%)
Note: These are national estimates of fires reported to U.S. municipal fire departments and so exclude fires reported to federal or state agencies or industrial fire brigades. Analyses were performed separately for non-confined fires, fires reported as confined chimney or flue fires, and fires reports as confined to fuel burner or boiler. Fires, deaths, and injuries are rounded to the nearest ten and direct property damage to the nearest million dollars. Totals may not equal sums due to rounding errors.
Source: NFIRS 5.0 and NFPA Fire Experience Survey, 2009-2013.
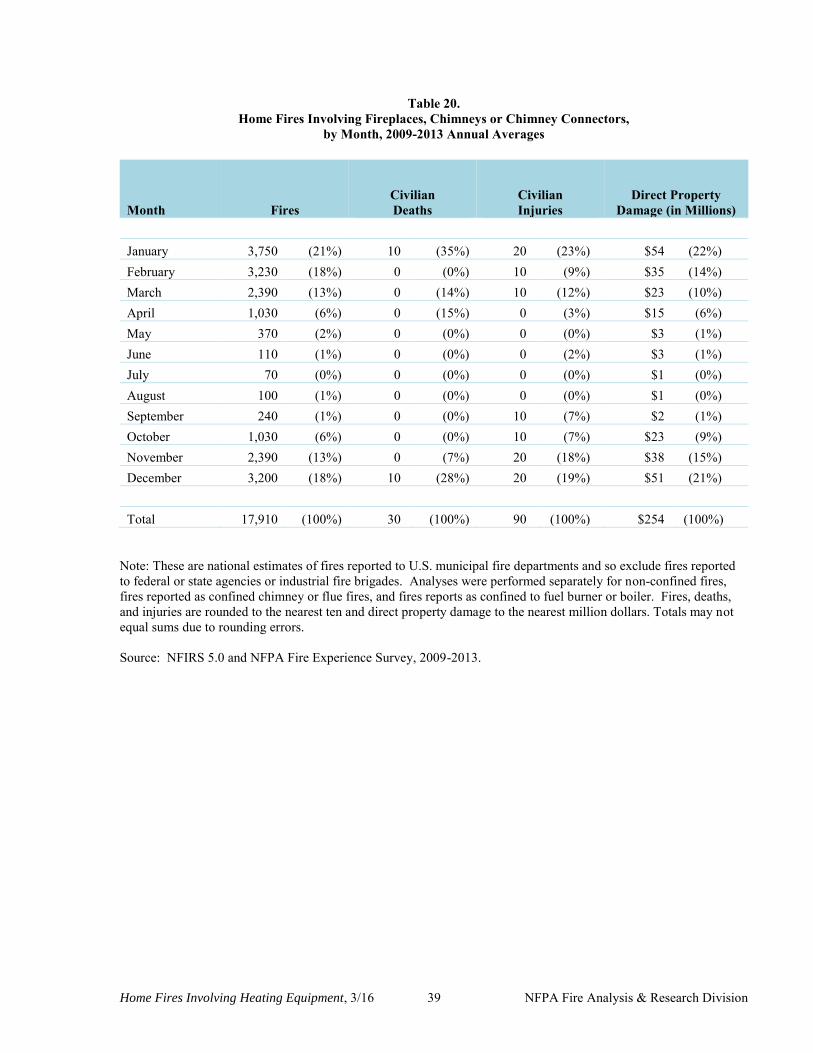
Home Fires Involving Heating Equipment, 3/16 39 NFPA Fire Analysis & Research Division
Table 20. Home Fires Involving Fireplaces, Chimneys or Chimney Connectors,
by Month, 2009-2013 Annual Averages
Month Fires Civilian Deaths
Civilian Injuries
Direct Property Damage (in Millions)
January 3,750 (21%) 10 (35%) 20 (23%) $54 (22%) February 3,230 (18%) 0 (0%) 10 (9%) $35 (14%) March 2,390 (13%) 0 (14%) 10 (12%) $23 (10%) April 1,030 (6%) 0 (15%) 0 (3%) $15 (6%) May 370 (2%) 0 (0%) 0 (0%) $3 (1%) June 110 (1%) 0 (0%) 0 (2%) $3 (1%) July 70 (0%) 0 (0%) 0 (0%) $1 (0%) August 100 (1%) 0 (0%) 0 (0%) $1 (0%) September 240 (1%) 0 (0%) 10 (7%) $2 (1%) October 1,030 (6%) 0 (0%) 10 (7%) $23 (9%) November 2,390 (13%) 0 (7%) 20 (18%) $38 (15%) December 3,200 (18%) 10 (28%) 20 (19%) $51 (21%)
Total 17,910 (100%) 30 (100%) 90 (100%) $254 (100%)
Note: These are national estimates of fires reported to U.S. municipal fire departments and so exclude fires reported to federal or state agencies or industrial fire brigades. Analyses were performed separately for non-confined fires, fires reported as confined chimney or flue fires, and fires reports as confined to fuel burner or boiler. Fires, deaths, and injuries are rounded to the nearest ten and direct property damage to the nearest million dollars. Totals may not equal sums due to rounding errors. Source: NFIRS 5.0 and NFPA Fire Experience Survey, 2009-2013.

Home Fires Involving Heating Equipment, 3/16 40 NFPA Fire Analysis & Research Division
Table 21. Home Fires Involving Fireplaces, Chimneys or Chimney Connectors, by Day of Week,
2009-2013 Annual Averages
Day of Week Fires Civilian Deaths
Civilian Injuries
Direct Property Damage (in Millions)
Sunday 2,930 (16%) 0 (7%) 10 (9%) $42 (17%) Monday 2,610 (15%) 0 (0%) 10 (10%) $37 (14%) Tuesday 2,340 (13%) 0 (7%) 10 (10%) $28 (11%) Wednesday 2,390 (13%) 20 (64%) 10 (10%) $32 (13%) Thursday 2,480 (14%) 0 (7%) 20 (20%) $32 (13%) Friday 2,420 (13%) 0 (7%) 20 (17%) $41 (16%) Saturday 2,740 (15%) 0 (7%) 20 (24%) $41 (16%)
Total 17,910 (100%) 30 (100%) 90 (100%) $254 (100%)
Note: These are national estimates of fires reported to U.S. municipal fire departments and so exclude fires reported to federal or state agencies or industrial fire brigades. Analyses were performed separately for non-confined fires, fires reported as confined chimney or flue fires, and fires reports as confined to fuel burner or boiler. Fires, deaths, and injuries are rounded to the nearest ten and direct property damage to the nearest million dollars. Totals may not equal sums due to rounding errors. Source: NFIRS 5.0 and NFPA Fire Experience Survey, 2009-2013.

Home Fires Involving Heating Equipment, 3/16 41 NFPA Fire Analysis & Research Division
Table 22. Home Fires Involving Fireplaces, Chimneys, or Chimney Connectors, by Time of Day,
2009-2013 Annual Averages
Time of Day Fires Civilian Deaths
Civilian Injuries
Direct Property Damage (in Millions)
Midnight-12:59 a.m. 440 (2%) 0 (0%) 10 (12%) $14 (6%) 1:00-1:59 a.m. 360 (2%) 0 (15%) 0 (3%) $13 (5%) 2:00-2:59 a.m. 210 (1%) 0 (0%) 10 (5%) $8 (3%) 3:00-3:59 a.m. 180 (1%) 0 (0%) 0 (3%) $12 (5%) 4:00-4:59 a.m. 200 (1%) 0 (7%) 0 (3%) $8 (3%) 5:00-5:59 a.m. 210 (1%) 0 (7%) 10 (8%) $10 (4%) 6:00-6:59 a.m. 370 (2%) 0 (14%) 0 (3%) $7 (3%) 7:00-7:59 a.m. 570 (3%) 0 (0%) 0 (2%) $7 (3%) 8:00-8:59 a.m. 600 (3%) 0 (14%) 10 (6%) $8 (3%) 9:00-9:59 a.m. 670 (4%) 0 (7%) 0 (3%) $8 (3%) 10:00-10:59 a.m. 620 (3%) 0 (14%) 0 (1%) $6 (2%) 11:00-11:59 a.m. 630 (4%) 0 (0%) 0 (2%) $7 (3%) 12:00-12:59 p.m. 620 (3%) 0 (0%) 0 (0%) $7 (3%) 1:00-1:59 p.m. 580 (3%) 0 (0%) 0 (0%) $5 (2%) 2:00-2:59 p.m. 660 (4%) 0 (0%) 10 (6%) $5 (2%) 3:00-3:59 p.m. 800 (4%) 0 (0%) 0 (3%) $9 (3%) 4:00-4:59 p.m. 1,040 (6%) 0 (0%) 0 (2%) $12 (5%) 5:00-5:59 p.m. 1,390 (8%) 0 (0%) 0 (5%) $9 (3%) 6:00-6:59 p.m. 1,690 (9%) 0 (0%) 0 (3%) $18 (7%) 7:00-7:59 p.m. 1,600 (9%) 0 (14%) 0 (4%) $17 (7%) 8:00-8:59 p.m. 1,630 (9%) 0 (0%) 0 (4%) $21 (8%) 9:00-9:59 p.m. 1,330 (7%) 0 (0%) 0 (4%) $15 (6%) 10:00-10:59 p.m. 890 (5%) 0 (8%) 10 (9%) $15 (6%) 11:00-11:59 p.m. 610 (3%) 0 (0%) 10 (7%) $14 (6%)
Total 17,910 (100%) 30 (100%) 90 (100%) $254 (100%)
Note: These are national estimates of fires reported to U.S. municipal fire departments and so exclude fires reported to federal or state agencies or industrial fire brigades. Analyses were performed separately for non-confined fires, fires reported as confined chimney or flue fires, and fires reports as confined to fuel burner or boiler. Fires, deaths, and injuries are rounded to the nearest ten and direct property damage to the nearest million dollars. Totals may not equal sums due to rounding errors. Source: NFIRS 5.0 and NFPA Fire Experience Survey, 2009-2013.

Home Fires Involving Heating Equipment, 3/16 42 NFPA Fire Analysis & Research Division
Table 23. Home Fires Involving Fireplaces, Chimneys or Chimney Connectors,
by Factor Contributing to Ignition, 2009-2013 Annual Averages
Factor Contributing to Ignition Fires
Civilian Deaths
Civilian Injuries
Direct Property Damage
(in Millions) Failure to clean 12,160 (68%) 0 (0%) 10 (10%) $44 (17%) Mechanical failure or
malfunction 1,210 (7%) 10 (21%) 20 (21%) $47 (18%) Heat source too close to
combustibles. 870 (5%) 10 (39%) 20 (23%) $44 (17%) Unspecified factor contributing
to ignition 710 (4%) 10 (20%) 0 (2%) $9 (4%) Installation deficiency 580 (3%) 0 (0%) 10 (6%) $22 (9%) Construction deficiency 470 (3%) 0 (0%) 0 (3%) $25 (10%) Equipment not operated
properly 350 (2%) 10 (20%) 10 (6%) $5 (2%) Unspecified operational
deficiency 410 (2%) 0 (0%) 0 (5%) $15 (6%) Other known factor
contributing to ignition 2,070 (12%) 0 (0%) 30 (30%) $78 (31%)
Total fires 17,910 (100%) 30 (100%) 90 (100%) $254 (100%) Total factors contributing to
ignition* 18,840 (105%) 30 (100%) 100 (106%) $289 (114%) *Multiple entries are allowed, which can result in sums higher than totals.
Note: These are national estimates of fires reported to U.S. municipal fire departments and so exclude fires reported to federal or state agencies or industrial fire brigades. Analyses were performed separately for non-confined fires, fires reported as confined chimney or flue fires, and fires reports as confined to fuel burner or boiler. Fires, deaths, and injuries are rounded to the nearest ten and direct property damage to the nearest million dollars. Totals may not equal sums due to rounding errors.
Source: NFIRS 5.0 and NFPA Fire Experience Survey, 2009-2013.

Home Fires Involving Heating Equipment, 3/16 43 NFPA Fire Analysis & Research Division
Table 24. Home Fires Involving Fireplaces, Chimneys or Chimney Connectors, by Item First Ignited,
2009-2013 Annual Averages
Item First Ignited Fires Civilian Deaths
Civilian Injuries
Direct Property Damage
(in Millions) Film or residue, including paint,
resin and creosote 3,320 (19%) 0 (0%) 0 (0%) $2 (1%) Unclassified organic materials 3,320 (19%) 0 (0%) 0 (0%) $4 (2%) Structural member or framing 1,960 (11%) 10 (40%) 20 (26%) $136 (54%) Flammable and combustible
liquids and gases, piping and filter 1,110 (6%) 0 (0%) 0 (4%) $4 (1%)
Heavy vegetation including trees 830 (5%) 0 (0%) 0 (3%) $1 (0%) Unclassified structural
component or finish 450 (3%) 0 (15%) 10 (10%) $24 (9%) Chips, including wood chips 410 (2%) 0 (0%) 0 (2%) $0 (0%) Rubbish, trash, or waste 330 (2%) 0 (0%) 0 (1%) $1 (0%) Insulation within structural area 290 (2%) 0 (0%) 10 (10%) $8 (3%) Exterior wall covering or finish 280 (2%) 0 (0%) 0 (2%) $11 (4%) Magazine, newspaper, writing
paper 270 (2%) 0 (0%) 0 (3%) $1 (0%) Unspecified item first ignited 3,500 (20%) 0 (0%) 0 (2%) $9 (4%) Other known item first ignited 1,860 (10% 10 (45%) 30 (37%) $50 (21%)
Total 17,910 (100%) 30 (100%) 90 (100%) $254 (100%)
Note: These are national estimates of fires reported to U.S. municipal fire departments and so exclude fires reported to federal or state agencies or industrial fire brigades. Analyses were performed separately for non-confined fires, fires reported as confined chimney or flue fires, and fires reports as confined to fuel burner or boiler. Fires, deaths, and injuries are rounded to the nearest ten and direct property damage to the nearest million dollars. Totals may not equal sums due to rounding errors. Source: NFIRS 5.0 and NFPA Fire Experience Survey, 2009-2013.

Home Fires Involving Heating Equipment, 3/16 44 NFPA Fire Analysis & Research Division
Table 25. Home Fires Involving Fireplaces, Chimneys, or Chimney Connectors, by Area of Origin,
2009-2013 Annual Averages
Area of Origin Fires Civilian Deaths
Civilian Injuries
Direct Property Damage (in Millions)
Confined chimney or flue
fire* 14,120 (79%) 0 (0%) 10 (10%) $4 (2%) Wall assembly or concealed
space 840 (5%) 0 (16%) 10 (11%) $58 (23%) Living room, family room, or
den 670 (4%) 10 (23%) 40 (39%) $43 (17%) Attic or ceiling/roof assembly
or concealed space 540 (3%) 0 (0%) 10 (11%) $43 (17%) Unspecified area of origin 90 (1%) 0 (0%) 0 (0%) $3 (1%) Other known area of origin 1,640 (9%) 20 (61%) 30 (29%) $103 (40%)
Total 17,910 (100%) 30 (100%) 90 (100%) $254 (100%)
*NFIRS 5.0 does not have a separate area of origin code for fires starting in chimneys. Any home fire with NFIRS incident type 114 (Chimney or flue fire originating in and confined to a chimney or flue) is captured here. Note: These are national estimates of fires reported to U.S. municipal fire departments and so exclude fires reported to federal or state agencies or industrial fire brigades. Analyses were performed separately for non-confined fires, fires reported as confined chimney or flue fires, and fires reports as confined to fuel burner or boiler. Fires, deaths, and injuries are rounded to the nearest ten and direct property damage to the nearest million dollars. Totals may not equal sums due to rounding errors. Source: NFIRS 5.0 and NFPA Fire Experience Survey, 2009-2013.

Home Fires Involving Heating Equipment, 3/16 45 NFPA Fire Analysis & Research Division
Table 26. Home Fires Involving Central Heating Equipment Fires, by Type of Fuel or Power,
2009-2013 Annual Averages
Fuel or Power Fires Civilian Deaths
Civilian Injuries
Direct Property Damage (in Millions)
Electric-powered 2,600 (37%) 0 (16%) 10 (16%) $29 (35%) Gas-fueled 2,170 (31%) 10 (53%) 50 (67%) $40 (50%) Liquid-fueled 2,010 (29%) 10 (31%) 10 (18%) $6 (7%) Solid-fueled 170 (2%) 0 (0%) 0 (0%) $6 (8%) Other fuel source 20 (0%) 0 (0%) 0 (0%) $0 (0%)
Total 6,970 (100%) 20 (100%) 80 (100%) $80 (100%)
Note: These are national estimates of fires reported to U.S. municipal fire departments and so exclude fires reported to federal or state agencies or industrial fire brigades. Analyses were performed separately for non-confined fires, fires reported as confined chimney or flue fires, and fires reports as confined to fuel burner or boiler. Fires, deaths, and injuries are rounded to the nearest ten and direct property damage to the nearest million dollars. Totals may not equal sums due to rounding errors.
Source: NFIRS 5.0 and NFPA Fire Experience Survey, 2009-2013.

Home Fires Involving Heating Equipment, 3/16 46 NFPA Fire Analysis & Research Division
Table 27. Home Fires Involving Central Heat, by Month,
2009-2013 Annual Averages
Month Fires Civilian Deaths
Civilian Injuries
Direct Property Damage (in Millions)
January 1,190 (17%) 0 (8%) 10 (14%) $18 (23%) February 950 (14%) 10 (22%) 10 (14%) $10 (13%) March 660 (10%) 0 (0%) 0 (1%) $9 (11%) April 500 (7%) 0 (0%) 10 (6%) $6 (8%) May 280 (4%) 0 (16%) 10 (8%) $3 (4%) June 220 (3%) 0 (0%) 0 (5%) $0 (1%) July 180 (3%) 0 (0%) 0 (2%) $1 (1%) August 170 (2%) 0 (0%) 0 (1%) $2 (2%) September 280 (4%) 0 (0%) 10 (6%) $2 (3%) October 740 (11%) 10 (31%) 10 (15%) $5 (7%) November 800 (12%) 0 (8%) 10 (13%) $11 (14%) December 990 (14% 0 (16%) 10 (13%) $12 (15%)
0 Total 6,970 (100%) 20 (100%) 80 (100%) $81 (100%)
Note: These are national estimates of fires reported to U.S. municipal fire departments and so exclude fires reported to federal or state agencies or industrial fire brigades. Analyses were performed separately for non-confined fires, fires reported as confined chimney or flue fires, and fires reports as confined to fuel burner or boiler. Fires, deaths, and injuries are rounded to the nearest ten and direct property damage to the nearest million dollars. Totals may not equal sums due to rounding errors. Source: NFIRS 5.0 and NFPA Fire Experience Survey, 2009-2013.

Home Fires Involving Heating Equipment, 3/16 47 NFPA Fire Analysis & Research Division
Table 28. Home Fires Involving Central Heat, by Day of Week,
2009-2013 Annual Averages
Day of Week Fires Civilian Deaths
Civilian Injuries
Direct Property Damage (in Millions)
Sunday 890 (13%) 0 (7%) 10 (18%) $9 (11%) Monday 1,190 (17%) 10 (22%) 10 (15%) $15 (19%) Tuesday 960 (14%) 0 (15%) 20 (23%) $12 (15%) Wednesday ,1040 (15%) 0 (8%) 10 (10%) $11 (14%) Thursday 990 (14%) 10 (32%) 0 (5%) $9 (11%) Friday 940 (14%) 0 (0%) 10 (15%) $12 (14%) Saturday 950 (14%) 0 (16%) 10 (14%) $13 (16%)
Total 6,970 (100%) 20 (100%) 80 (100%) $81 (100%)
Note: These are national estimates of fires reported to U.S. municipal fire departments and so exclude fires reported to federal or state agencies or industrial fire brigades. Analyses were performed separately for non-confined fires, fires reported as confined chimney or flue fires, and fires reports as confined to fuel burner or boiler. Fires, deaths, and injuries are rounded to the nearest ten and direct property damage to the nearest million dollars. Totals may not equal sums due to rounding errors. Source: NFIRS 5.0 and NFPA Fire Experience Survey, 2009-2013.

Home Fires Involving Heating Equipment, 3/16 48 NFPA Fire Analysis & Research Division
Table 29. Home Fires Involving Central Heat, by Time of Day,
2009-2013 Annual Averages
Time of Day Fires Civilian Deaths
Civilian Injuries
Direct Property Damage (in Millions)
Midnight-12:59 a.m. 170 (2%) 0 (8%) 0 (4%) $3 (4%) 1:00-1:59 a.m. 110 (2%) 0 (0%) 0 (4%) $3 (4%) 2:00-2:59 a.m. 180 (3%) 0 (0%) 0 (3%) $3 (4%) 3:00-3:59 a.m. 200 (3%) 0 (0%) 0 (3%) $3 (4%) 4:00-4:59 a.m. 160 (2%) 0 (0%) 0 (5%) $2 (3%) 5:00-5:59 a.m. 230 (3%) 0 (8%) 0 (4%) $5 (6%) 6:00-6:59 a.m. 270 (4%) 0 (0%) 0 (0%) $3 (4%) 7:00-7:59 a.m. 350 (5%) 0 (15%) 0 (3%) $4 (5%) 8:00-8:59 a.m. 340 (5%) 0 (0%) 0 (1%) $3 (3%) 9:00-9:59 a.m. 370 (5%) 10 (24%) 10 (9%) $5 (6%) 10:00-10:59 a.m. 340 (5%) 0 (0%) 0 (3%) $5 (6%) 11:00-11:59 a.m. 300 (4%) 0 (0%) 0 (1%) $4 (5%) 12:00-12:59 p.m. 300 (4%) 0 (0%) 10 (7%) $4 (5%) 1:00-1:59 p.m. 280 (4%) 10 (23%) 10 (6%) $6 (7%) 2:00-2:59 p.m. 350 (5%) 0 (0%) 0 (4%) $2 (3%) 3:00-3:59 p.m. 360 (5%) 0 (8%) 0 (4%) $4 (5%) 4:00-4:59 p.m. 390 (6%) 0 (0%) 0 (4%) $1 (2%) 5:00-5:59 p.m. 350 (5%) 0 (0%) 0 (5%) $3 (4%) 6:00-6:59 p.m. 430 (6%) 0 (8%) 0 (5%) $5 (6%) 7:00-7:59 p.m. 370 (5%) 0 (8%) 0 (4%) $3 (3%) 8:00-8:59 p.m. 370 (5%) 0 (0%) 0 (5%) $2 (2%) 9:00-9:59 p.m. 280 (4%) 0 (0%) 0 (3%) $2 (2%) 10:00-10:59 p.m. 250 (4%) 0 (0%) 0 (3%) $3 (4%) 11:00-11:59 p.m. 230 (3%) 0 (0%) 10 (13%) $3 (4%)
Total 6,970 (100%) 20 (100%) 80 (100%) $81 (100%)
Note: These are national estimates of fires reported to U.S. municipal fire departments and so exclude fires reported to federal or state agencies or industrial fire brigades. Analyses were performed separately for non-confined fires, fires reported as confined chimney or flue fires, and fires reports as confined to fuel burner or boiler. Fires, deaths, and injuries are rounded to the nearest ten and direct property damage to the nearest million dollars. Totals may not equal sums due to rounding errors. Source: NFIRS 5.0 and NFPA Fire Experience Survey, 2009-2013.
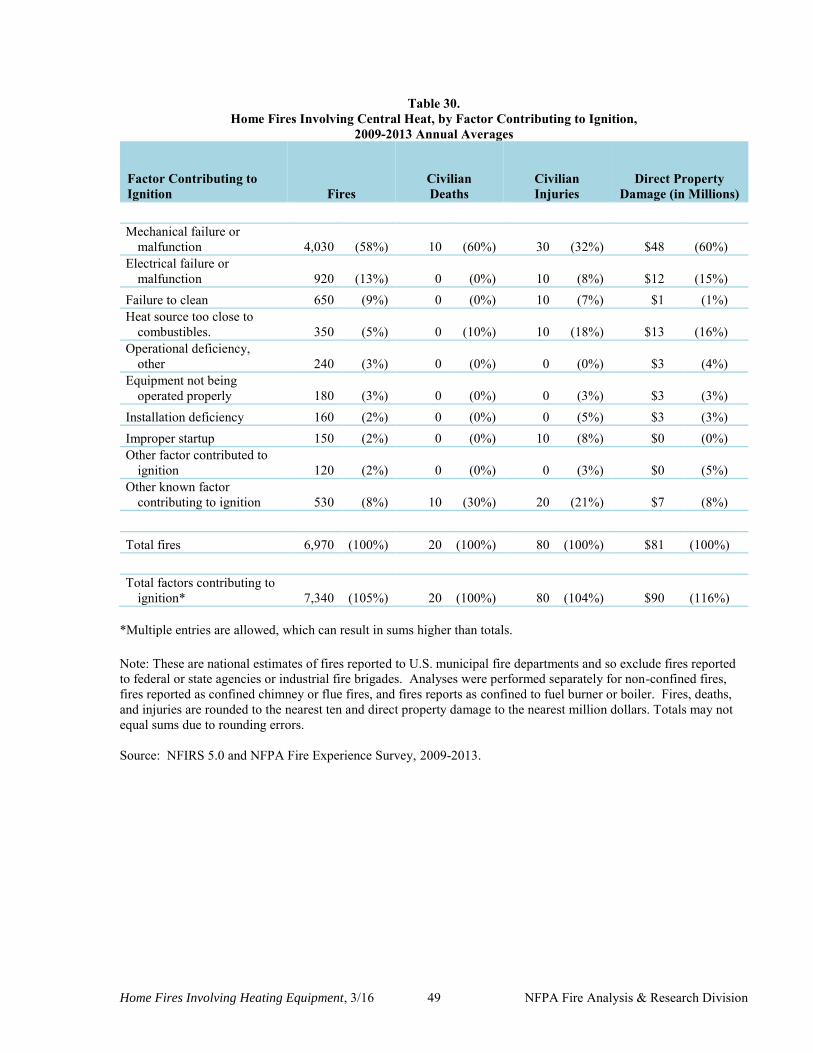
Home Fires Involving Heating Equipment, 3/16 49 NFPA Fire Analysis & Research Division
Table 30. Home Fires Involving Central Heat, by Factor Contributing to Ignition,
2009-2013 Annual Averages
Factor Contributing to Ignition Fires
Civilian Deaths
Civilian Injuries
Direct Property Damage (in Millions)
Mechanical failure or
malfunction 4,030 (58%) 10 (60%) 30 (32%) $48 (60%) Electrical failure or
malfunction 920 (13%) 0 (0%) 10 (8%) $12 (15%) Failure to clean 650 (9%) 0 (0%) 10 (7%) $1 (1%) Heat source too close to
combustibles. 350 (5%) 0 (10%) 10 (18%) $13 (16%) Operational deficiency,
other 240 (3%) 0 (0%) 0 (0%) $3 (4%) Equipment not being
operated properly 180 (3%) 0 (0%) 0 (3%) $3 (3%) Installation deficiency 160 (2%) 0 (0%) 0 (5%) $3 (3%) Improper startup 150 (2%) 0 (0%) 10 (8%) $0 (0%) Other factor contributed to
ignition 120 (2%) 0 (0%) 0 (3%) $0 (5%) Other known factor
contributing to ignition 530 (8%) 10 (30%) 20 (21%) $7 (8%)
Total fires 6,970 (100%) 20 (100%) 80 (100%) $81 (100%)
Total factors contributing to ignition* 7,340 (105%) 20 (100%) 80 (104%) $90 (116%)
*Multiple entries are allowed, which can result in sums higher than totals. Note: These are national estimates of fires reported to U.S. municipal fire departments and so exclude fires reported to federal or state agencies or industrial fire brigades. Analyses were performed separately for non-confined fires, fires reported as confined chimney or flue fires, and fires reports as confined to fuel burner or boiler. Fires, deaths, and injuries are rounded to the nearest ten and direct property damage to the nearest million dollars. Totals may not equal sums due to rounding errors. Source: NFIRS 5.0 and NFPA Fire Experience Survey, 2009-2013.

Home Fires Involving Heating Equipment, 3/16 50 NFPA Fire Analysis & Research Division
Table 31. Home Fires Involving Central Heat, by Item First Ignited,
2009-2013 Annual Averages
Item First Ignited Fires Civilian Deaths
Civilian Injuries
Direct Property Damage (in Millions)
Flammable and combustible
liquids and gases, piping and filter 3,540 (51%) 20 (83%) 40 (51%) $12 (15%)
Electrical wire or cable insulation 990 (14%) 0 (9%) 10 (10%) $4 (5%)
Unspecified item first ignited 600 (9%) 0 (0%) 0 (5%) $5 (7%) Structural member or framing 340 (5%) 0 (8%) 10 (7%) $23 (29%) Dust, fiber, lint, including
sawdust or excelsior 260 (4%) 0 (0%) 0 (6%) $2 (3%) Appliance housing or casing 250 (4%) 0 (0%) 0 (0%) $2 (2%) Other known item first ignited 990 (14%) 0 (0%) 20 (20%) $32 (39%)
Total 6,970 (100%) 20 (100%) 80 (100%) $81 (100%)
Note: These are national estimates of fires reported to U.S. municipal fire departments and so exclude fires reported to federal or state agencies or industrial fire brigades. Analyses were performed separately for non-confined fires, fires reported as confined chimney or flue fires, and fires reports as confined to fuel burner or boiler. Fires, deaths, and injuries are rounded to the nearest ten and direct property damage to the nearest million dollars. Totals may not equal sums due to rounding errors. Source: NFIRS 5.0 and NFPA Fire Experience Survey, 2009-2013.

Home Fires Involving Heating Equipment, 3/16 51 NFPA Fire Analysis & Research Division
Table 32. Home Fires Involving Central Heat, by Area of Origin,
2009-2013 Annual Averages
Area of Origin Fires Civilian Deaths
Civilian Injuries
Direct Property Damage (in Millions)
Heating equipment room 3,910 (56%) 10 (53%) 40 (51%) $30 (37%) Duct for HVAC, cable,
exhaust, heating, or AC 760 (11%) 0 (0%) 20 (20%) $7 (8%) Crawl space or substructure
space 510 (7%) 0 (16%) 0 (4%) $7 (9%) Unclassified equipment or
service area 230 (3%) 0 (0%) 0 (2%) $2 (2%) Confined chimney or flue
fire* 220 (3%) 0 (0%) 0 (0%) $0 (0%) Unclassified function area 200 (3%) 0 (9%) 0 (3%) $1 (1%) Attic or ceiling/roof
assembly or concealed space 190 (3%) 0 (0%) 0 (1%) $12 (14%)
Laundry room or area 140 (2%) 0 (0%) 0 (3%) $3 (3%) Closet 130 (2%) 0 (0%) 0 (0%) $2 (3%) Unspecified area of origin 170 (2%) 0 (0%) 0 (0%) $0 (0%) Other known area of origin 520 (8%) 10 (23%) 10 (15%) $17 (21%)
Total 6,970 (100%) 20 (100%) 80 (100%) $81 (100%)
*NFIRS 5.0 does not have a separate area of origin code for fires starting in chimneys. Any home fire with NFIRS incident type 114 (Chimney or flue fire originating in and confined to a chimney or flue) is captured here. Note: These are national estimates of fires reported to U.S. municipal fire departments and so exclude fires reported to federal or state agencies or industrial fire brigades. Analyses were performed separately for non-confined fires, fires reported as confined chimney or flue fires, and fires reports as confined to fuel burner or boiler. Fires, deaths, and injuries are rounded to the nearest ten and direct property damage to the nearest million dollars. Totals may not equal sums due to rounding errors. Source: NFIRS 5.0 and NFPA Fire Experience Survey, 2009-2013.

Home Fires Involving Heating Equipment, 3/16 52 NFPA Fire Analysis & Research Division
Table 33. Home Fires Involving Water Heaters, by Type of Fuel or Power,
2009-2013 Annual Averages
Fuel or Power Fires Civilian Deaths
Civilian Injuries
Direct Property Damage (in Millions)
Gas-fueled 2,900 (53%) 20 (100%) 130 (83%) $78 (70%) Electric-powered 2,450 (45%) 0 (0%) 30 (17%) $32 (29%) Liquid-fueled 70 (1%) 0 (0%) 0 (0%) $1 (1%) Solid-fueled 10 (0%) 0 (0%) 0 (0%) $0 (0%) Other 10 (0%) 0 (0%) 0 (0%) $0 (0%)
Total 5,440 (100%) 20 (100%) 160 (100%) $111 (100%)
Note: These are national estimates of fires reported to U.S. municipal fire departments and so exclude fires reported to federal or state agencies or industrial fire brigades. Analyses were performed separately for non-confined fires, fires reported as confined chimney or flue fires, and fires reports as confined to fuel burner or boiler. Fires, deaths, and injuries are rounded to the nearest ten and direct property damage to the nearest million dollars. Totals may not equal sums due to rounding errors. Source: NFIRS 5.0 and NFPA Fire Experience Survey, 2009-2013.

Home Fires Involving Heating Equipment, 3/16 53 NFPA Fire Analysis & Research Division
Table 34. Home Fires Involving Water Heaters, by Month,
2009-2013 Annual Averages
Month Fires Civilian Deaths
Civilian Injuries
Direct Property Damage (in Millions)
January 540 (10%) 0 (0%) 10 (7%) $12 (10%) February 440 (8%) 0 (0%) 0 (2%) $8 (7%) March 520 (9%) 0 (10%) 20 (12%) $16 (15%) April 500 (9%) 0 (10%) 20 (10%) $9 (8%) May 490 (9%) 0 (20%) 10 (3%) $10 (9%) June 480 (9%) 0 (0%) 10 (9%) $9 (8%) July 420 (8%) 0 (10%) 10 (9%) $10 (9%) August 380 (7%) 10 (30%) 20 (12%) $8 (8%) September 400 (7%) 0 (10%) 10 (7%) $5 (4%) October 440 (8%) 0 (0%) 20 (13%) $7 (6%) November 390 (7%) 0 (0%) 20 (13%) $9 (8%) December 450 (8%) 0 (10%) 10 (5%) $8 (7%)
Total 5,440 (100%) 20 (100%) 160 (100%) $111 (100%)
Note: These are national estimates of fires reported to U.S. municipal fire departments and so exclude fires reported to federal or state agencies or industrial fire brigades. Analyses were performed separately for non-confined fires, fires reported as confined chimney or flue fires, and fires reports as confined to fuel burner or boiler. Fires, deaths, and injuries are rounded to the nearest ten and direct property damage to the nearest million dollars. Totals may not equal sums due to rounding errors. Source: NFIRS 5.0 and NFPA Fire Experience Survey, 2009-2013.

Home Fires Involving Heating Equipment, 3/16 54 NFPA Fire Analysis & Research Division
Table 35. Home Fires Involving Water Heaters, by Day of Week,
2009-2013 Annual Averages
Day of Week Fires Civilian Deaths
Civilian Injuries
Direct Property Damage (in Millions)
Sunday 760 (14%) 0 (0%) 20 (11%) $15 (14%) Monday 730 (13%) 10 (30%) 30 (16%) $14 (12%) Tuesday 810 (15%) 0 (10%) 40 (23%) $15 (13%) Wednesday 780 (14%) 0 (10%) 20 (12%) $14 (13%) Thursday 780 (14%) 0 (10%) 20 (12%) $23 (21%) Friday 770 (14%) 0 (0%) 30 (18%) $15 (14%) Saturday 810 (15%) 10 (40%) 10 (7%) $15 (13%)
Total 5,440 (100%) 20 (100%) 160 (100%) $111 (100%)
Note: These are national estimates of fires reported to U.S. municipal fire departments and so exclude fires reported to federal or state agencies or industrial fire brigades. Analyses were performed separately for non-confined fires, fires reported as confined chimney or flue fires, and fires reports as confined to fuel burner or boiler. Fires, deaths, and injuries are rounded to the nearest ten and direct property damage to the nearest million dollars. Totals may not equal sums due to rounding errors. Source: NFIRS 5.0 and NFPA Fire Experience Survey, 2009-2013.

Home Fires Involving Heating Equipment, 3/16 55 NFPA Fire Analysis & Research Division
Table 36. Home Fires Involving Water Heaters, by Time of Day,
Annual Average of 2009-2013 Structure Fires Reported to U.S. Fire Departments
Time of Day Fires Civilian Deaths
Civilian Injuries
Direct Property Damage (in Millions)
Midnight-12:59 a.m. 160 (3%) 0 (0%) 0 (2%) $3 (3%) 1:00-1:59 a.m. 140 (2%) 0 (0%) 10 (3%) $4 (3%) 2:00-2:59 a.m. 90 (2%) 0 (0%) 0 (1%) $2 (2%) 3:00-3:59 a.m. 100 (2%) 0 (10%) 0 (1%) $3 (2%) 4:00-4:59 a.m. 90 (2%) 0 (10%) 0 (1%) $4 (4%) 5:00-5:59 a.m. 120 (2%) 0 (0%) 0 (2%) $2 (2%) 6:00-6:59 a.m. 130 (2%) 0 (10%) 0 (3%) $1 (1%) 7:00-7:59 a.m. 220 (4%) 0 (0%) 0 (1%) $5 (4%) 8:00-8:59 a.m. 220 (4%) 0 (0%) 10 (5%) $4 (4%) 9:00-9:59 a.m. 220 (4%) 0 (20%) 10 (9%) $5 (4%) 10:00-10:59 a.m. 290 (5%) 0 (0%) 10 (5%) $4 (3%) 11:00-11:59 a.m. 250 (5%) 0 (0%) 10 (5%) $6 (5%) 12:00-12:59 p.m. 290 (5%) 0 (0%) 10 (6%) $4 (3%) 1:00-1:59 p.m. 260 (5%) 0 (0%) 10 (7%) $5 (4%) 2:00-2:59 p.m. 270 (5%) 0 (0%) 10 (5%) $13 (12%) 3:00-3:59 p.m. 290 (5%) 0 (10%) 10 (7%) $5 (4%) 4:00-4:59 p.m. 290 (5%) 0 (10%) 10 (8%) $5 (4%) 5:00-5:59 p.m. 330 (6%) 0 (0%) 10 (9%) $7 (6%) 6:00-6:59 p.m. 290 (5%) 0 (10%) 10 (9%) $6 (6%) 7:00-7:59 p.m. 330 (6%) 0 (0%) 10 (5%) $5 (4%) 8:00-8:59 p.m. 290 (5%) 0 (0%) 0 (1%) $8 (7%) 9:00-9:59 p.m. 320 (6%) 0 (20%) 0 (0%) $4 (3%) 10:00-10:59 p.m. 270 (5%) 0 (0%) 10 (3%) $5 (5%) 11:00-11:59 p.m. 190 (3%) 0 (0%) 10 (3%) $3 (3%)
Total 5,440 (100%) 20 (100%) 160 (100%) $111 (100%)
Note: These are national estimates of fires reported to U.S. municipal fire departments and so exclude fires reported to federal or state agencies or industrial fire brigades. Analyses were performed separately for non-confined fires, fires reported as confined chimney or flue fires, and fires reports as confined to fuel burner or boiler. Fires, deaths, and injuries are rounded to the nearest ten and direct property damage to the nearest million dollars. Totals may not equal sums due to rounding errors. Source: NFIRS 5.0 and NFPA Fire Experience Survey, 2009-2013.

Home Fires Involving Heating Equipment, 3/16 56 NFPA Fire Analysis & Research Division
Table 37. Home Fires Involving Water Heaters, by Factor Contributing to Ignition,
Annual Average of 2009-2013 Structure Fires Reported to U.S. Fire Departments
Factor Contributing to Ignition Fires
Civilian Deaths
Civilian Injuries
Direct Property Damage (in Millions)
Electrical failure or
malfunction 1,720 (32%) 0 (0%) 20 (12%) $24 (22%) Mechanical failure or
malfunction 1,570 (29%) 0 (17%) 30 (18%) $27 (25%) Heat source too close to
combustibles 1,150 (21%) 10 (50%) 40 (23%) $29 (26%) Installation deficiency 180 (3%) 0 (0%) 0 (2%) $3 (2%) Unclassified misuse of
material or product 150 (3%) 0 (0%) 20 (15%) $4 (4%) Improper container or
storage 140 (2%) 0 (0%) 10 (8%) $6 (5%) Failure to clean 120 (2%) 0 (0%) 0 (1%) $1 (1%) Other factor contributed
to ignition 120 (2%) 0 (0%) 0 (1%) $3 (3%) Flammable liquid or gas
spilled 120 (2%) 10 (33%) 30 (18%) $15 (14%) Other known factor
contributing to ignition 520 (10%) 0 (17%) 30 (18%) $10 (9%)
Total fires 5,440 (100%) 20 (100%) 160 (100%) $111 (100%) Total factors contributing
to ignition* 5,780 (106%) 20 (117%) 180 (117%) $122 (110%) *Multiple entries are allowed, which can result in sums higher than totals. Note: These are national estimates of fires reported to U.S. municipal fire departments and so exclude fires reported to federal or state agencies or industrial fire brigades. Analyses were performed separately for non-confined fires, fires reported as confined chimney or flue fires, and fires reports as confined to fuel burner or boiler. Fires, deaths, and injuries are rounded to the nearest ten and direct property damage to the nearest million dollars. Totals may not equal sums due to rounding errors. Source: NFIRS 5.0 and NFPA Fire Experience Survey, 2009-2013.

Home Fires Involving Heating Equipment, 3/16 57 NFPA Fire Analysis & Research Division
Table 38. Home Fires Involving Water Heaters, by Item First Ignited,
Annual Average of 2009-2013 Structure Fires Reported to U.S. Fire Departments
Item First Ignited Fires Civilian Deaths
Civilian Injuries
Direct Property Damage (in Millions)
Electrical wire or cable
insulation 1,300 (24%) 0 (0%) 10 (4%) $10 (9%) Flammable and
combustible liquids and gases, piping and filter 1,010 (19%) 20 (86%) 100 (62%) $31 (28%)
Appliance housing or casing 470 (9%) 0 (0%) 0 (2%) $3 (3%)
Unclassified item first ignited 360 (7%) 0 (0%) 0 (2%) $3 (2%)
Clothing 320 (6%) 0 (0%) 10 (5%) $12 (11%) Structural member or
framing 310 (6%) 0 (0%) 10 (4%) $9 (8%) Interior wall covering.
excluding drapes 200 (4%) 0 (0%) 10 (4%) $8 (7%) Floor covering rug, carpet,
or mat 160 (3%) 0 (0%) 0 (2%) $2 (1%) Insulation within structural
area 150 (3%) 0 (0%) 0 (1%) $1 (1%) Unclassified structural
component or finish 140 (3%) 0 (0%) 0 (1%) $4 (4%) Multiple items first ignited 130 (2%) 0 (0%) 0 (3%) $8 (7%) Unclassified soft goods or
wearing apparel 90 (2%) 0 (0%) 0 (3%) $3 (3%) Box, carton, bag, basket,
barrel 90 (2%) 0 (0%) 0 (1%) $4 (4%) Dust, fiber, lint, including
sawdust or excelsior 80 (2%) 0 (0%) 0 (0%) $0 (0%) Other known item first
ignited 640 (12%) 0 (14%) 10 (7%) $13 (12%)
Total 5,440 (100%) 20 (100%) 160 (100%) $111 (100%) Note: These are national estimates of fires reported to U.S. municipal fire departments and so exclude fires reported to federal or state agencies or industrial fire brigades. Analyses were performed separately for non-confined fires, fires reported as confined chimney or flue fires, and fires reports as confined to fuel burner or boiler. Fires, deaths, and injuries are rounded to the nearest ten and direct property damage to the nearest million dollars. Totals may not equal sums due to rounding errors. Source: NFIRS 5.0 and NFPA Fire Experience Survey, 2009-2013.

Home Fires Involving Heating Equipment, 3/16 58 NFPA Fire Analysis & Research Division
Table 39. Home Fires Involving Water Heaters, by Area of Origin,
2009-2013 Annual Averages
Area of Origin Fires Civilian Deaths
Civilian Injuries
Direct Property Damage (in Millions)
Heating equipment room 2,080 (38%) 10 (44%) 60 (41%) $43 (39%) Confined chimney or flue
fires* 1,270 (23%) 0 (0%) 0 (2%) $0 (0%) Laundry room or area 760 (14%) 0 (22%) 20 (13%) $16 (14%) Closet 570 (11%) 0 (0%) 10 (3%) $6 (5%) Garage or vehicle storage
area 320 (6%) 0 (0%) 20 (10%) $19 (17%) Kitchen or cooking area 210 (4%) 0 (11%) 10 (5%) $2 (2%) Crawl space or substructure
space 200 (4%) 0 (0%) 10 (4%) $3 (3%) Storage room, area, tank, or
bin 180 (3%) 0 (22%) 0 (3%) $4 (4%) Unclassified function area 140 (3%) 0 (0%) 0 (2%) $1 (1%) Lavatory, bathroom, locker
room or check room 140 (2%) 0 (0%) 0 (2%) $2 (1%) Unclassified storage area 130 (2%) 0 (0%) 0 (1%) $2 (1%) Unspecified area of origin 50 (1%) 0 (0%) 0 (1%) $0 (0%) Other known area of origin 630 (12%) 0 (0%) 20 (14%) $14 (12%)
Total 5,440 (100%) 20 (100%) 160 (100%) $111 (100%)
*NFIRS 5.0 does not have a separate area of origin code for fires starting in chimneys. Any home fire with NFIRS incident type 114 (Chimney or flue fire originating in and confined to a chimney or flue) is captured here. Note: These are national estimates of fires reported to U.S. municipal fire departments and so exclude fires reported to federal or state agencies or industrial fire brigades. Analyses were performed separately for non-confined fires, fires reported as confined chimney or flue fires, and fires reports as confined to fuel burner or boiler. Fires, deaths, and injuries are rounded to the nearest ten and direct property damage to the nearest million dollars. Totals may not equal sums due to rounding errors. Source: NFIRS 5.0 and NFPA Fire Experience Survey, 2009-2013.

Home Fires Involving Heating Equipment, 3/16 59 NFPA Fire Analysis & Research Division
Appendix A. How National Estimates Statistics Are Calculated The statistics in this analysis are estimates derived from the U.S. Fire Administration’s (USFA’s) National Fire Incident Reporting System (NFIRS) and the National Fire Protection Association’s (NFPA’s) annual survey of U.S. fire departments. NFIRS is a voluntary system by which participating fire departments report detailed factors about the fires to which they respond. Roughly two-thirds of U.S. fire departments participate, although not all of these departments provide data every year. Fires reported to federal or state fire departments or industrial fire brigades are not included in these estimates. NFIRS provides the most detailed incident information of any national database not limited to large fires. NFIRS is the only database capable of addressing national patterns for fires of all sizes by specific property use and specific fire cause. NFIRS also captures information on the extent of flame spread, and automatic detection and suppression equipment. For more information about NFIRS visit http://www.nfirs.fema.gov/. Copies of the paper forms may be downloaded from http://www.nfirs.fema.gov/documentation/design/NFIRS_Paper_Forms_2008.pdf. NFIRS has a wide variety of data elements and code choices. The NFIRS database contains coded information. Many code choices describe several conditions. These cannot be broken down further. For example, area of origin code 83 captures fires starting in vehicle engine areas, running gear areas or wheel areas. It is impossible to tell the portion of each from the coded data. Methodology may change slightly from year to year. NFPA is continually examining its methodology to provide the best possible answers to specific questions, methodological and definitional changes can occur. Earlier editions of the same report
may have used different methodologies to produce the same analysis, meaning that the estimates
are not directly comparable from year to year.
NFPA’s fire department experience survey provides estimates of the big picture. Each year, NFPA conducts an annual survey of fire departments which enables us to capture a summary of fire department experience on a larger scale. Surveys are sent to all municipal departments protecting populations of 50,000 or more and a random sample, stratified by community size, of the smaller departments. Typically, a total of roughly 3,000 surveys are returned, representing about one of every ten U.S. municipal fire departments and about one third of the U.S. population. The survey is stratified by size of population protected to reduce the uncertainty of the final estimate. Small rural communities have fewer people protected per department and are less likely to respond to the survey. A larger number must be surveyed to obtain an adequate sample of those departments. (NFPA also makes follow-up calls to a sample of the smaller fire departments that do not respond, to confirm that those that did respond are truly representative of fire departments their size.) On the other hand, large city departments are so few in number and protect such a large proportion of the total U.S. population that it makes sense to survey all of them. Most respond, resulting in excellent precision for their part of the final estimate. The survey includes the following information: (1) the total number of fire incidents, civilian deaths, and civilian injuries, and the total estimated property damage (in dollars), for each of the major property use classes defined in NFIRS; (2) the number of on-duty firefighter injuries, by type of duty and nature of illness; 3) the number and nature of non-fire incidents; and (4)

Home Fires Involving Heating Equipment, 3/16 60 NFPA Fire Analysis & Research Division
information on the type of community protected (e.g., county versus township versus city) and the size of the population protected, which is used in the statistical formula for projecting national totals from sample results. The results of the survey are published in the annual report Fire Loss
in the United States. To download a free copy of the report, visit http://www.nfpa.org/assets/files/PDF/OS.fireloss.pdf. Projecting NFIRS to National Estimates As noted, NFIRS is a voluntary system. Different states and jurisdictions have different reporting requirements and practices. Participation rates in NFIRS are not necessarily uniform across regions and community sizes, both factors correlated with frequency and severity of fires. This means NFIRS may be susceptible to systematic biases. No one at present can quantify the size of these deviations from the ideal, representative sample, so no one can say with confidence that they are or are not serious problems. But there is enough reason for concern so that a second database -- the NFPA survey -- is needed to project NFIRS to national estimates and to project different parts of NFIRS separately. This multiple calibration approach makes use of the annual NFPA survey where its statistical design advantages are strongest. Scaling ratios are obtained by comparing NFPA’s projected totals of residential structure fires, non-residential structure fires, vehicle fires, and outside and other fires, and associated civilian deaths, civilian injuries, and direct property damage with comparable totals in NFIRS. Estimates of specific fire problems and circumstances are obtained by multiplying the NFIRS data by the scaling ratios. Reports for incidents in which mutual aid was given are excluded from NFPA’s analyses. Analysts at the NFPA, the USFA and the Consumer Product Safety Commission developed the specific basic analytical rules used for this procedure. “The National Estimates Approach to U.S. Fire Statistics,” by John R. Hall, Jr. and Beatrice Harwood, provides a more detailed explanation of national estimates. A copy of the article is available online at http://www.nfpa.org/osds or through NFPA's One-Stop Data Shop. Version 5.0 of NFIRS, first introduced in 1999, used a different coding structure for many data elements, added some property use codes, and dropped others. The essentials of the approach described by Hall and Harwood are still used, but some modifications have been necessary to accommodate the changes in NFIRS 5.0. Figure A.1 shows the percentage of fires originally collected in the NFIRS 5.0 system. Each year’s release version of NFIRS data also includes data collected in older versions of NFIRS that were converted to NFIRS 5.0 codes. From 1999 data on, analyses are based on scaling ratios using only data originally collected in NFIRS 5.0:
NFPA survey projections NFIRS totals (Version 5.0)
For 1999 to 2001, the same rules may be applied, but estimates for these years in this form will be less reliable due to the smaller amount of data originally collected in NFIRS 5.0; they should be viewed with extreme caution.
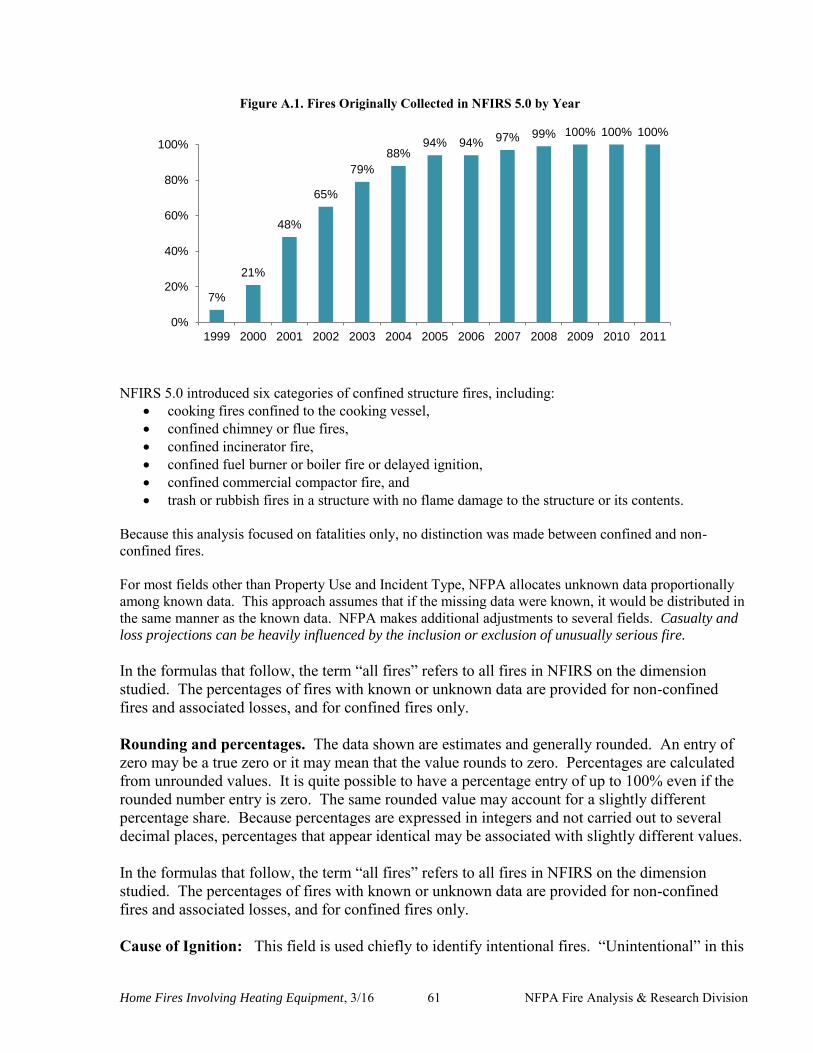
Home Fires Involving Heating Equipment, 3/16 61 NFPA Fire Analysis & Research Division
Figure A.1. Fires Originally Collected in NFIRS 5.0 by Year
NFIRS 5.0 introduced six categories of confined structure fires, including:
cooking fires confined to the cooking vessel, confined chimney or flue fires, confined incinerator fire, confined fuel burner or boiler fire or delayed ignition, confined commercial compactor fire, and trash or rubbish fires in a structure with no flame damage to the structure or its contents.
Because this analysis focused on fatalities only, no distinction was made between confined and non-confined fires. For most fields other than Property Use and Incident Type, NFPA allocates unknown data proportionally among known data. This approach assumes that if the missing data were known, it would be distributed in the same manner as the known data. NFPA makes additional adjustments to several fields. Casualty and
loss projections can be heavily influenced by the inclusion or exclusion of unusually serious fire.
In the formulas that follow, the term “all fires” refers to all fires in NFIRS on the dimension studied. The percentages of fires with known or unknown data are provided for non-confined fires and associated losses, and for confined fires only. Rounding and percentages. The data shown are estimates and generally rounded. An entry of zero may be a true zero or it may mean that the value rounds to zero. Percentages are calculated from unrounded values. It is quite possible to have a percentage entry of up to 100% even if the rounded number entry is zero. The same rounded value may account for a slightly different percentage share. Because percentages are expressed in integers and not carried out to several decimal places, percentages that appear identical may be associated with slightly different values. In the formulas that follow, the term “all fires” refers to all fires in NFIRS on the dimension studied. The percentages of fires with known or unknown data are provided for non-confined fires and associated losses, and for confined fires only. Cause of Ignition: This field is used chiefly to identify intentional fires. “Unintentional” in this
7%
21%
48%
65%
79%
88%94% 94% 97% 99% 100% 100% 100%
0%
20%
40%
60%
80%
100%
1999 2000 2001 2002 2003 2004 2005 2006 2007 2008 2009 2010 2011
Home Fires Involving Heating Equipment, 3/16 62 NFPA Fire Analysis & Research Division
field is a specific entry and does not include other fires that were not intentionally set: failure of equipment or heat source, act of nature, or “other” (unclassified).” The last should be used for exposures but has been used for other situations as well. Fires that were coded as under investigation and those that were coded as undetermined after investigation were treated as unknown. Factor Contributing to Ignition: In this field, the code “none” is treated as an unknown and allocated proportionally. For Human Factor Contributing to Ignition, NFPA enters a code for “not reported” when no factors are recorded. “Not reported” is treated as an unknown, but the code “none” is treated as a known code and not allocated. Multiple entries are allowed in both of these fields. Percentages are calculated on the total number of fires, not entries, resulting in sums greater than 100%. Although Factor Contributing to Ignition is only required when the cause of ignition was coded as: 2) unintentional, 3) failure of equipment or heat source; or 4) act of nature, data is often present when not required. Consequently, any fire in which no factor contributing to ignition was entered was treated as unknown. In some analyses, all entries in the category of mechanical failure, malfunction (factor contributing to ignition 20-29) are combined and shown as one entry, “mechanical failure or malfunction.” This category includes:
21. Automatic control failure; 22. Manual control failure; 23. Leak or break. Includes leaks or breaks from containers or pipes. Excludes operational
deficiencies and spill mishaps; 25. Worn out; 26. Backfire. Excludes fires originating as a result of hot catalytic converters; 27. Improper fuel used; Includes the use of gasoline in a kerosene heater and the like; and 20. Mechanical failure or malfunction, other.
Entries in “electrical failure, malfunction” (factor contributing to ignition 30-39) may also be combined into one entry, “electrical failure or malfunction.” This category includes:
31. Water-caused short circuit arc; 32. Short-circuit arc from mechanical damage; 33. Short-circuit arc from defective or worn insulation; 34. Unspecified short circuit arc; 35. Arc from faulty contact or broken connector, including broken power lines and loose
connections; 36. Arc or spark from operating equipment, switch, or electric fence; 37. Fluorescent light ballast; and 30. Electrical failure or malfunction, other.
Heat Source. In NFIRS 5.0, one grouping of codes encompasses various types of open flames and smoking materials. In the past, these had been two separate groupings. A new code was added to NFIRS 5.0, which is code 60: “Heat from open flame or smoking material, other.”
Home Fires Involving Heating Equipment, 3/16 63 NFPA Fire Analysis & Research Division
NFPA treats this code as a partial unknown and allocates it proportionally across the codes in the 61-69 range, shown below.
61. Cigarette; 62. Pipe or cigar; 63. Heat from undetermined smoking material; 64. Match; 65. Lighter: cigarette lighter, cigar lighter; 66. Candle; 67 Warning or road flare, fuse; 68. Backfire from internal combustion engine. Excludes flames and sparks from an exhaust
system, (11); and 69. Flame/torch used for lighting. Includes gas light and gas-/liquid-fueled lantern.
In addition to the conventional allocation of missing and undetermined fires, NFPA multiplies fires with codes in the 61-69 range by
All fires in range 60-69 All fires in range 61-69
The downside of this approach is that heat sources that are truly a different type of open flame or smoking material are erroneously assigned to other categories. The grouping “smoking materials” includes codes 61-63 (cigarettes, pipes or cigars, and heat from undetermined smoking material, with a proportional share of the code 60s and true unknown data. Equipment Involved in Ignition (EII). NFIRS 5.0 originally defined EII as the piece of equipment that provided the principal heat source to cause ignition if the equipment malfunctioned or was used improperly. In 2006, the definition was modified to “the piece of equipment that provided the principal heat source to cause ignition.” However, much of the data predates the change. Individuals who have already been trained with the older definition may not change their practices. To compensate, NFPA treats fires in which EII = NNN and heat source is not in the range of 40-99 as an additional unknown. To allocate unknown data for EII, the known data is multiplied by
All fires (All fires – blank – undetermined – [fires in which EII =NNN and heat source <>40-99])
In addition, the partially unclassified codes for broad equipment groupings (i.e., code 100 - heating, ventilation, and air conditioning, other; code 200 - electrical distribution, lighting and power transfer, other; etc.) were allocated proportionally across the individual code choices in their respective broad groupings (heating, ventilation, and air conditioning; electrical distribution, lighting and power transfer, other; etc.). Equipment that is totally unclassified is not allocated further. This approach has the same downside as the allocation of heat source 60 described above. Equipment that is truly different is erroneously assigned to other categories.
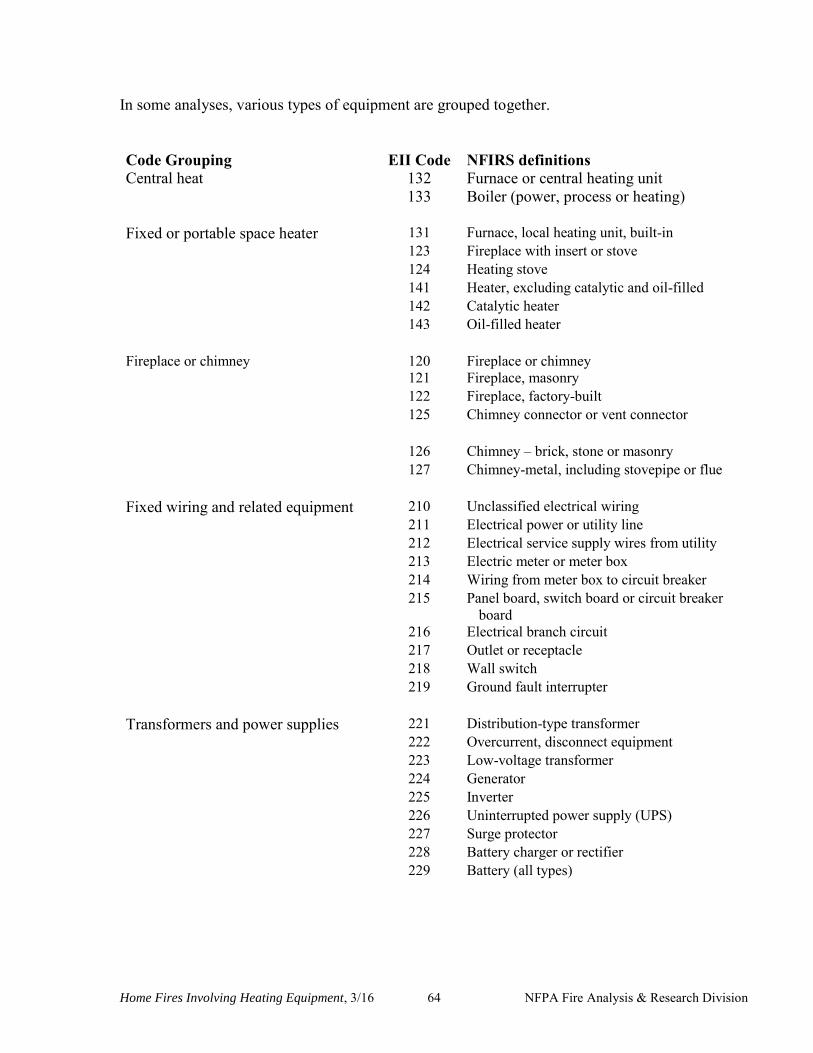
Home Fires Involving Heating Equipment, 3/16 64 NFPA Fire Analysis & Research Division
In some analyses, various types of equipment are grouped together. Code Grouping EII Code NFIRS definitions Central heat 132 Furnace or central heating unit 133 Boiler (power, process or heating) Fixed or portable space heater 131 Furnace, local heating unit, built-in 123 Fireplace with insert or stove 124 Heating stove 141 Heater, excluding catalytic and oil-filled 142 Catalytic heater 143 Oil-filled heater Fireplace or chimney 120 Fireplace or chimney 121 Fireplace, masonry 122 Fireplace, factory-built 125 Chimney connector or vent connector 126 Chimney – brick, stone or masonry 127 Chimney-metal, including stovepipe or flue Fixed wiring and related equipment 210 Unclassified electrical wiring 211 Electrical power or utility line 212 Electrical service supply wires from utility 213 Electric meter or meter box 214 Wiring from meter box to circuit breaker 215 Panel board, switch board or circuit breaker
board 216 Electrical branch circuit 217 Outlet or receptacle 218 Wall switch 219 Ground fault interrupter Transformers and power supplies 221 Distribution-type transformer 222 Overcurrent, disconnect equipment 223 Low-voltage transformer 224 Generator 225 Inverter 226 Uninterrupted power supply (UPS) 227 Surge protector 228 Battery charger or rectifier 229 Battery (all types)
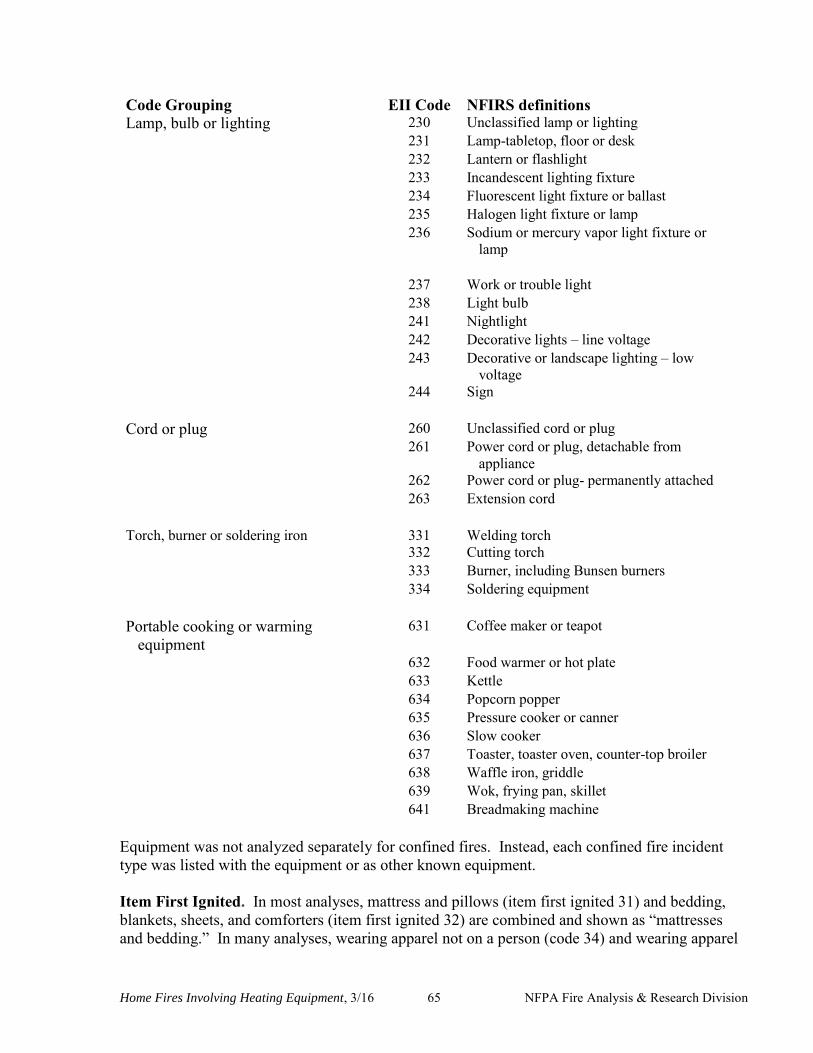
Home Fires Involving Heating Equipment, 3/16 65 NFPA Fire Analysis & Research Division
Code Grouping EII Code NFIRS definitions Lamp, bulb or lighting 230 Unclassified lamp or lighting 231 Lamp-tabletop, floor or desk 232 Lantern or flashlight 233 Incandescent lighting fixture 234 Fluorescent light fixture or ballast 235 Halogen light fixture or lamp 236 Sodium or mercury vapor light fixture or
lamp 237 Work or trouble light 238 Light bulb 241 Nightlight 242 Decorative lights – line voltage 243 Decorative or landscape lighting – low
voltage 244 Sign Cord or plug 260 Unclassified cord or plug 261 Power cord or plug, detachable from
appliance 262 Power cord or plug- permanently attached 263 Extension cord Torch, burner or soldering iron 331 Welding torch 332 Cutting torch 333 Burner, including Bunsen burners 334 Soldering equipment Portable cooking or warming
equipment 631 Coffee maker or teapot
632 Food warmer or hot plate 633 Kettle 634 Popcorn popper 635 Pressure cooker or canner 636 Slow cooker 637 Toaster, toaster oven, counter-top broiler 638 Waffle iron, griddle 639 Wok, frying pan, skillet 641 Breadmaking machine
Equipment was not analyzed separately for confined fires. Instead, each confined fire incident type was listed with the equipment or as other known equipment. Item First Ignited. In most analyses, mattress and pillows (item first ignited 31) and bedding, blankets, sheets, and comforters (item first ignited 32) are combined and shown as “mattresses and bedding.” In many analyses, wearing apparel not on a person (code 34) and wearing apparel

Home Fires Involving Heating Equipment, 3/16 66 NFPA Fire Analysis & Research Division
on a person (code 35) are combined and shown as “clothing.” In some analyses, flammable and combustible liquids and gases, piping and filters (item first ignited 60-69) are combined and shown together. Area of Origin. Two areas of origin: bedroom for more than five people (code 21) and bedroom for less than five people (code 22) are combined and shown as simply “bedroom.” Chimney is no longer a valid area of origin code for non-confined fires. Rounding and percentages. The data shown are estimates and generally rounded. An entry of zero may be a true zero or it may mean that the value rounds to zero. Percentages are calculated from unrounded values. It is quite possible to have a percentage entry of up to 100% even if the rounded number entry is zero. The same rounded value may account for a slightly different percentage share. Because percentages are expressed in integers and not carried out to several decimal places, percentages that appear identical may be associated with slightly different values.