Characterizing iron oxides from coastal and central plain soils

ARTICLE IN PRESS
0022-4596/$ - se
doi:10.1016/j.jss
�CorrespondE-mail addryDeceased.
Journal of Solid State Chemistry 179 (2006) 2511–2520
www.elsevier.com/locate/jssc
Properties of cerium–zirconium mixed oxides partially substituted byneodymium: Comparison with Zr–Ce–Pr–O ternary oxides
Jana Mikulova, Sylvie Rossignol�, Francois Gerardy, Danielle Mesnard,Charles Kappenstein, Daniel Duprez
Laboratoire de Catalyse en Chimie Organique, UMR 6503, CNRS et Universite de Poitiers, 40 Avenue du Recteur Pineau, 86022 Poitiers, France
Received 20 February 2006; received in revised form 6 April 2006; accepted 8 April 2006
Available online 20 May 2006
Abstract
CeO2 doped with praseodymium, neodymium and/or zirconium atoms were prepared by coprecipitation and by the sol–gel method.
Structural properties were investigated by in situ XRD and Raman spectroscopy while oxygen storage capacity (OSC) was measured by
transient CO oxidation. All the compounds, except pure Nd2O3, have a fluorite-type structure as well as a Raman band at 560 cm�1
characteristic of the oxygen vacancies involving non-stoichiometric oxides. The lattice parameter under hydrogen, being dependent on
the temperature, revealed two reduction mechanisms: one at a low temperature at the surface and another at a high temperature in the
bulk. Ce–Nd binary oxides show a strong tendency towards crystallite aggregation, which reduces accessibility to gases and OSC
properties. Zirconium improves the thermal resistance to sintering of both Ce–Nd and Ce–Pr oxides. The Zr–Ce–Pr–O followed by
Zr–Ce–Nd–O compounds displaying high oxygen mobility at a low temperature, appear to be very promising for practical applications
such as OSC materials.
r 2006 Elsevier Inc. All rights reserved.
Keywords: Oxides; Chemical synthesis; Sol–gel chemistry; In situ X-ray diffraction; Oxygen mobility
1. Introduction
Ceria-based materials displaying high oxygen mobilityand oxygen storage capacity (OSC) have been extensivelyinvestigated due to their wide application in the field ofcatalysis [1–3]. In the 1990s, many studies were devoted toZrO2–CeO2 oxides, notably to their synthesis and theircatalytic properties [4–6]. Nanocrystalline powders of ceriadoped with various rare earth cations have been synthe-sized by coprecipitation using ammonium carbonate as aprecipitant [7–10]. Several other mixed oxides Ce–M–O(with M ¼ Eu, Pr, Sm, Nd) were recently investigated withthe aim of improving oxygen mobility [11–15]. These oxideswere prepared by different ways: (i) Ce–Sm–O oxides by acitrate route [16], (ii) Ce–Eu–O compounds by a hydro-thermal route 11, (iii) Ce–Pr–O compounds by coprecipita-
e front matter r 2006 Elsevier Inc. All rights reserved.
c.2006.04.051
ing author. Fax: +335 49 45 40 20.
ess: [email protected] (S. Rossignol).
tion 12, and (iv) Ce–Nd–O compounds by the sol–gelmethod [14]. In many studies, M cations have been used internary systems as dopant in Ce–Zr–O mixed oxides.To characterize the oxygen vacancies due to the
aliovalent doping cations, various techniques can beemployed, including Raman spectroscopy and in situXRD studies [17–19]. These aliovalent doping cations,whose valence state is different from that of zirconium ions,preserve the formation of a fluorite-type structure. Therange of existence depends on the nature of the cation; forexample, the solubility of Sm3+ and Nd3+ ions is limited tox ¼ 0:40 in the Ce1�xMxO2 system, while that of Pr ions(mainly Pr4+) is limited to x ¼ 0:75 in the Ce1�xPrxO2
oxides [14,17] Moreover, the thermal expansion coefficientincreases with the substitution percentage of the dopant,also creating greater formation of oxygen vacancy. Thesefeatures may also be confirmed by a Raman band at560 cm�1 mainly ascribed to these oxygen vacancies [20,21].Previous work on Ce–Pr–O and Zr–Ce–Pr–O mixed
oxides, prepared either by the sol–gel method or by

ARTICLE IN PRESSJ. Mikulova et al. / Journal of Solid State Chemistry 179 (2006) 2511–25202512
coprecipitation, has shown that the substitution of ceriumwith praseodymium atoms leads to materials with veryhigh OSC. The simultaneous presence of Pr3+ and Pr4+
cations, which induce oxygen vacancies, significantlyincreases oxygen mobility. The purpose of this study is (i)to understand the role played by the substitution of ceriumwith neodymium cations in CeO2 and Zr–Ce–O mixedoxides synthesized by coprecipitation or by the sol–gelmethod and (ii) to compare the behaviour of Nd-contain-ing materials with Zr–Ce–Pr–O oxides. The solids werecharacterized by in situ powder X-ray diffraction underhydrogen, Raman spectroscopy and BET surface area.OSC was also determined for some samples.
2. Experimental
2.1. Preparation
Two types of oxides were prepared (i) Ce1�xNdxO2 bycoprecipitation and (ii) Zr0.10(Ce1�xMx)0.90O2 (M ¼ Pr orNd) by the sol–gel method previously described [12]. In thiswork, it was been proved that the use of the sol–gel methodfor the preparation of Zr-based mixed oxides gives bettersamples in terms of homogeneity and OSC than copreci-pitation. It must be pointed out that only Zr-alkoxideswere employed in the preparation while other elementswere introduced as nitrates. The relatively low rate ofhydrolysis and polycondensation of Zr-alkoxide makes it avery good control of the preparation. To confirm thesefeatures two new samples containing zirconium atoms wereprepared by coprecipitation using zirconyl and rare-earthnitrate as precursors. However Ce–Nd–O oxides notcontaining Zr were prepared by the conventional copreci-pitation technique. All reactants and solvents were Aldrichproducts, 99% purity. They were used without any furtherpurification. The amounts of reactants were adjusted so asto obtain 3 g of solid.
2.1.1. Sol–gel method
After being dissolved in 20 cm3 of isopropyl alcohol (RP,H2Op0.5%), zirconium n-propoxide precursor Zr(OC3H7)4(70% in 1-propanol) was slowly added (1 cm3min�1,ambient temperature) to an aqueous solution ofCe(NO3)3 � 6H2O and Pr(NO3)3 � 6H2O or Nd(NO3)3 � 6H2O(20 cm3, stirring speed: 500 rpm). A pseudo-gel formedimmediately as the reactant mixture undergone hydrolysis.
2.1.2. Coprecipitation method
Cerium–neodymium oxides were prepared by co-pre-cipitation according to the following procedure. In all,12 cm3 of aqueous ammonia (14.7M) was slowly added toan aqueous solution of zirconyl nitrate or Ce(NO3)3, �6H2O and Nd(NO3)3 � 6H2O (40 cm3 in distilled water). Theprecipitates were filtered, re-dispersed in 100 cm3 of theammonia solution (0.25M) and filtered again.
The samples were dried for 1 h at 333K in a sand bathand dried for 12 h at 413K in a ventilated oven andcalcined under air for 4 h at 1173K.
2.2. Characterization
Specific surface areas were determined by N2 (AirLiquide, 30% N2 in He) adsorption at 77K with aMicromeritics Flow Sorb II.Structure and crystallite sizes were determined by X-ray
diffraction carried out on a Siemens D 5005 powder y–ydiffractometer using the CuKa radiation (lKa ¼
0:15418 nm) and a secondary graphite back monochroma-tor. The diffractograms were obtained under the followingconditions: dwell time: 2 s; step: 0.041 2y; divergence slit: 11.The crystalline phases were identified by comparison withICDD standards. In situ X-ray measurements were carriedout in a HTK16 high-temperature stainless steel chamberlinked to a D500 diffractometer. The diffractograms wererecorded by increments of 0.0281 with a dwell time of 10 s.The powdered oxides (about 20mg) were suspended inethanol and deposited as a thin layer on a Kanthal foilwhich supported the sample and heated by the Joule effect.The oxides were heated under air or hydrogen from 298 to1273K at a heating rate of 0.10K s�1. They weresubsequently cooled down at 0.16K s�1 (normal cooling)or at E3K s�1 (quenching mode) in the presence ofhydrogen.Raman spectra were collected using a Perkin Elmer
spectrometer equipped with an Nd-YAG laser (1064.4 nm).Experimental conditions were: laser power ¼ 100mW,acquisition time ¼ 120 s, number of scans ¼ 20 and re-solution ¼ 4 cm�1. For FT-IR spectra, the same apparatuswas used but in IR mode.OSC was measured at 673 and 773K under atmospheric
pressure. A 20mg sample was continuously purged withhelium (30 cm3min�1). Alternate pulses (0.265 cm3) of O2
(Air Liquide, p5 ppm total impurities) and CO (AirLiquide) were injected every minute in order to simulatelean and rich operating conditions such as those encoun-tered in an Otto engine coupled with a three-way catalyticconverter. The OSC was calculated from CO consumptionor CO2 formation after the first CO pulse.
3. Results
3.1. Oxygen deficiency of the compounds
The chemistry of neodymium mainly in its +IIIoxidation state leads to materials with an oxygen contentwhich takes into account the simultaneous presence ofCe4+, Ce3+ and Nd3+ ions generating oxygen defectððO=CeþNdÞo2Þ. Consequently, the Ce–Nd–O samplesshould be written Ce1�xNdxO2�x. Let a be the fraction ofCe3+ in the (1�x) cerium ions. If all the neodymium ionsare in the +III oxidation state, then x ¼ 0:5 [x+a(1�x)]. Itcan be verified that x ¼ 0:5 for x ¼ 1 (pure Nd oxide) and

ARTICLE IN PRESS
Fig. 1. Room temperature X-ray pattern of Ce–Nd–O compounds
calcined at 1173K (ICCD files 34-0394 for CeO2 and 41-1089 for Nd2O3).
J. Mikulova et al. / Journal of Solid State Chemistry 179 (2006) 2511–2520 2513
x ¼ 0:5a for x ¼ 0 (pure ceria). The previous formula canalso be written as Ce1�xNdxO2�0.5x�d with d ¼ 0:5a (1�x).For instance, the solid with x ¼ 0:5 is Ce0.5Nd0.5O1.75�d
with d ¼ 0:25a.For the same reason, the ternary oxides (CP or SG)
should be written Zr0.10(Ce0.75M0.25)0.90O2�x (M ¼ Nd orPr). Let a be the fraction of Ce3+ in the 0.675 cerium ions.For the neodymium compound, x ¼ 0.1125+0.3375a andits approximated formula is Zr0.10(Ce0.75M0.25)0.90O1.89�d
with d ¼ 0:337a. For the praseodymium compound, bothCe and Pr may have two oxidation states: +III and +IV.If b is the faction of Pr3+ in the 0.225 praseodymium ions,then x ¼ 0.3375a+0.1125b.
3.2. Structural data: XRD at ambient temperatures
Nomenclature and characteristics of the binaryCe–Nd–O and the ternary Zr–Ce–Pr–O or Zr–Ce–Nd–Ooxides are listed in Table 1. The colour of Ce–Nd–O mixedoxides changes from yellow for cerium oxide to purple forthe neodymium oxide. Substitution of cerium withneodymium atoms in ceria does not improve the thermalstability: BET values are very small, in the range of a fewm2 g�1. In the presence of zirconium atoms, a significantimprovement of the BET surface area values can beobserved which is emphasized with sol–gel samples [22].For the same preparation procedure, the addition ofneodymium or praseodymium cations in the Zr–Ce–Ooxides gives a very similar BET area [17], which suggeststhat the high stability of Zr–Ce oxides are virtually notaffected by the presence of these rare earth elements. Onthe contrary, for the same sample prepared by the sol–gelor coprecipitation mode, the difference observed agreeswith results observed in previous work [12].
Fig. 1 shows the room temperature XRD patterns ofCe1�xNdxO2�x oxides calcined at 1173K. Single oxideshave been indexed respectively by the ICCD files 34-0394for CeO2 and 41-1089 for Nd2O3. In previous studieson Pr-promoted Ce–Zr–O oxides, the Pr6O11 sub-oxidewas clearly identified in pure praseodymium oxide [17].
Table 1
Colour, oxygen storage capacity values, BET area and crystallite size for vari
Samples Colour BET area m2 g�1 O
6
Nd2O3 Purple o1
Ce0.25Nd0.75O1.62�d Grey 3
Ce0.50Nd0.50O1.75�d Olive green 4
Ce0.75Nd0.25O1.88�d Almond 5
CeO2�x Yellow 3SGZr0.10(Ce0.75Nd0.25)0.90O1.89�d Straw-coloured 28 1SGZr0.10(Ce0.75Pr0.25)0.90O2�x Crimson 26 1CPZr0.10(Ce0.75Nd0.25)0.90O1.89�d Straw-coloured 6CPZr0.10(Ce0.75Pr0.25)0.90O2�x Crimson 10
*Phase mixture, SG: sol–gel, CP: coprecipitation.
Contrary to PrOx, neodymium sub-oxide (such as Nd6O11)is not detected, which gives evidence that only Nd3+ ionsare present instead of a mixture of Nd3+/Nd4+. As it wasalready observed with Ce–Pr–O oxides, the Ce-rich sample(Ce0.75Nd0.25O1.88�d) displays a solid solution with afluorite-type structure. For the other compounds(Ce1�xNdxO2; x ¼ 0:50 and 0.75), the highest peaks canbe attributed to both the fluorite-type structure and Nd2O3
phase. Consequently, the formation of a pure crystal-lographic phase seems limited to x ¼ 0:25 in theCe1�xNdxO2�x oxide series. In the Ce1�xPrxO2�x system,no phase demixion was observed and pure solid solutionscould be obtained up to x ¼ 0:75. For other Ce–M–Osystems with M ¼ Eu or Sm, the domain of existence of thesolid solution seemed limited to x ¼ 0.40 [11,13]. For thetwo preparation procedures (CP or SG), in the
ous samples calcined at 1173K
SCmmol at .0 g�1 Lattice
parameter (nm)
Crystallite
size (nm)
73K 773K
2 70
5 0.5528 42*
15 0.5494 53*
17 0.5459 45
78 0.5411 70
07 125 0.5415 30
17 275 0.5422 40
79 0.5417 28
188 0.5423 30

ARTICLE IN PRESSJ. Mikulova et al. / Journal of Solid State Chemistry 179 (2006) 2511–25202514
Zr0.10(Ce0.75M0.25)0.90O2�x (M ¼ Nd or Pr) ternary oxides,a pure fluorite-like phase was observed (X-ray patterns notshown).
At room temperature, the substitution of cerium withneodymium atoms causes the lattice parameter to increase.The addition of Zr atoms in the ternary mixtures causes thelattice to decrease. This feature is less pronounced in thepresence of praseodymium atoms in which Pr may be at thetwo oxidation states Pr4+ and Pr3+. The increase of latticeparameter in Zr–Ce–Pr–O with respect to Zr–Ce–Nd–Osuggests (i) the presence of Pr4+–Pr3+ ions and (ii), thatthe greater radius of Pr3+ ions determines the final cellvolume in the cubic structure. This variation of latticeparameter will be discussed in term of ionic radius andvalence state (see paragraph 2 of Section 4).
The crystallite size determined by XRD (Table 1) islarger in single oxides than in mixed oxides. For binary orternary oxides, these values crystallite size agree well withthe values found for other mixed oxides [13], and arecharacteristic of less crystallized materials. This may be dueto a disorder induced by Pr4+/Pr3+ and Nd3+ aliovalentcations.
3.3. Structural data: Raman spectroscopy
The Raman spectrum of CeO2 (Fig. 2) shows only theband at 464 cm�1 attributed to the T2g mode in the Fm3m
space group [23]. The bands at 270 and 315 cm�1,characteristic of small crystallites (4 nm or less) are notobserved, which agree with the crystallite size calculated byX-ray line broadening [20]. For the Nd2O3 compound, allthe Raman shift bands (0–1000 cm�1) can be attributed tothe A-type structure (space group P3m1) [24]. The Ramanspectrum of the Ce0.75Nd0.25O1.88�d sample mainly consists
Fig. 2. Room temperature Raman spectra of C
of two bands: one at 464 cm�1 ascribed to the fluorite-typestructure which agrees with XRD data, and another at560 cm�1. The latter last has been attributed to thepresence of oxygen vacancies in the fluorite-type structureand may indicative of significant oxygen mobility in thissolid [25]. The Raman spectra of the Ce0.50Nd0.50O1.75�d
and Ce0.25Nd0.75O1.62�d samples show features character-istic of a phase mixture of Nd2O3 and mixed oxide with afluorite-type structure (band at 464 cm�1) which agreeswith XRD data. Whatever the rare-earths (Nd or Pr)atoms, the Raman spectra of Zr0.10(Ce0.75M0.75)0.90O2
sol–gel and coprecipated samples consist of two mainbands at 464 and 560 cm�1 (Fig. 3a), which confirm thepresence of a fluorite-type structure; even the band at560 cm�1 is more pronounced for compounds containingpraseodymium cations. With a weak amount of zirconium,the preparation mode results in compounds with similarstructural data.In order to confirm the presence of these bands, one
experiment recorded at another excitation line (l ¼ 525 nm)was performed on the SGZr0.10(Ce0.75Nd0.75)0.90O1.89�d
compound (Fig. 3b). The main bands at 464 and560 cm�1 are invariant when the frequency of the excita-tion line is changed and they may definitively be ascribedto the fluorite structure and oxygen vacancies, exactly as itwas for the spectra recorded at l ¼ 1064:4 nm. To over-come possible ambiguities in the structural informationextracted from the Raman spectra, at least two laserexcitation lines must be used as described by Fornasieroet al. [26]. All these results show that compounds based onpraseodymium or neodymium cations display the samestructural features with respect to oxygen vacancies. Thiswould suggest that the solids can possess relatively highoxygen mobility.
e–Nd–O compounds under air atmosphere.

ARTICLE IN PRESS
Fig. 3. (a) Raman spectra of Zr0.10(Ce0.75M0.25)0.90O2�x (M ¼ Pr or Nd), CeO2 and Nd2O3 compounds under air at room temperature (l ¼ 1064:4 nm),
(b) Raman spectrum of SGZr0.10(Ce0.75Nd0.25)0.90O1.89�d sample (l ¼ 525nm).
Fig. 4. Temperature dependence of the lattice parameter under air or
hydrogen atmosphere for the Ce0.75Nd0.25O1.88�d compound.
J. Mikulova et al. / Journal of Solid State Chemistry 179 (2006) 2511–2520 2515
3.4. In situ XRD studies
Several samples displaying a solid solution (fluorite-typestructure) were further investigated by in situ XRD, whichallowed the lattice parameter at temperatures ranging from298 to 1273K to be determined. The results obtained forthe Ce0.75Nd0.25O1.88�d sample under air or hydrogen arereported in Fig. 4.
In an oxidizing atmosphere, this sample shows uniquethermal behaviour over the entire range of temperatures.The thermal expansion coefficient (aT ¼ 1.27� 10�5K�1)is close to that of pure ceria or that of Ce0.90Zr0.10O2
(aT ¼ 1.24� 10�5K�1) and slightly lower than that ofCe0.70Pr0.30O2 (2.53� 10�5K�1) in previous studies [17].Indeed, in this latter compound, several oxygen vacanciesare in evidence at room temperature, predicting moresignificant oxygen mobility. Consequently, weak oxygenmobility is suspected in Ce–Nd–O oxide whose thermal

ARTICLE IN PRESSJ. Mikulova et al. / Journal of Solid State Chemistry 179 (2006) 2511–25202516
expansion coefficient is close to that of ceria. These resultsshow that the rare earth-mixed oxides under study exhibitvery similar behaviour under air with a linear increase ofthe lattice parameter over the entire range of temperatures[17].
In a reducing atmosphere, two temperature ranges canbe observed for the variation of lattice parameter with aninflexion point at about 700K (Fig. 4). There is nohysteresis in this expansion phenomenon. The samebehaviour with the same slope can also be observed uponslow cooling in H2. From 298 to 700K, the changes oflattice parameter are very similar in air and in H2 and maybe ascribed to a mere thermal expansion of the lattice.Above 700K the lattice parameter increases more rapidlyin H2 than in air. This feature can be attributed to a bulkreduction of the compound (Ce4+ into Ce3+) whichapplies to the thermal linear expansion of the cell.
The temperature dependence of the lattice parameter in ahydrogen atmosphere is shown in Fig. 5, for the threecompounds as well as for pure ceria. Whatever the mixedoxide, the same behaviour can be observed: (i) at lowtemperatures, there is a linear thermal expansion closeto that of ceria and (ii) at high temperatures, an increaseof the thermal expansion coefficient is observed, whichis characteristic of sample reduction with the forma-tion of anionic vacancies [17] The transitional tempe-ratures between the two dilatation regimes (A–C inFig. 5) depend on the nature of the oxide and vary from580K for Zr0.10(Ce0.75Pr0.25)0.90O2�x (B) to 670K forZr0.10(Ce0.75Nd0.25)0.90O1.89�d (A) and 780K for Ce0.75Nd0.25O1.88�d (C). These reduction steps occurred atrelatively different temperatures, which emphasize the roleplayed by the rare earth element added to Ce and Zr (ionicradius, possibility of various oxidation states). However,the behaviour of the binary and ternary oxides contrasts
Fig. 5. Temperature dependence of the lattice parameter under h
B:Zr0.10(Ce0.75Pr0.25)0.90O2�x; C: Ce0.75Nd0.25O1.88�d).
with that of pure ceria. Whereas CeO2 exhibits a sharpincrease of its lattice parameter between 900 and 1000K,there is a smoother transition for the mixed oxides. It seemsas if the bulk reduction in the binary and ternary oxidesstarts at lower temperatures and much more gradually thanin pure ceria. The materials displaying the lowest transitiontemperature should possess the highest oxygen mobility inthe bulk. This was tentatively verified by measuring theoxygen storage capacities of the mixed oxides.
3.5. Oxygen storage capacity
3.5.1. Fast oxygen storage (first pulse)
The comparison of in situ XRD data with OSC valueswould have required that storage experiments be carriedout with H2 as reducing gas. Carbon monoxide washowever chosen for the following reasons: (i) CO iscurrently used in most OSC measurements [27–30] and(ii) there are many similarities between OSC(CO) andOSC(H2) [29]. Moreover, it has been demonstrated thatCO is a more effective reducing agent than H2 for mixedoxide. The same results were observed with TPR measure-ments [31]. Some works have been performed with H2-OSCand reveal the complexity of this mechanism and highlightthe necessity of comparing both interactions of CO and ofH2 with material surfaces [32].As a rule, two mechanisms can account for oxygen
storage in oxide materials: (i) either there is diffusion ofoxygen species from the bulk to the surface and thereaction with the reducer (H2 or CO) takes place at thesurface or (ii) the reaction takes place in the bulk, whichimplies that there is bulk diffusion of the reducer and back-diffusion of the reaction products (H2O or CO2). Thesecond mechanism is quite unlikely for OSC(CO) while itcannot be excluded for OSC(H2): hybrid species have been
ydrogen for the mixed oxides (A: Zr0.10(Ce0.75Nd0.25)0.90O1.89�d;

ARTICLE IN PRESS
Table 2
OSC measurements at 773K over SGZr0.10(Ce0.75Pr0.25)0.90O2�x (sample
weight: 20mg; pulses of 12mmol of gas)
Pulse
number
Treatment under CO Treatment under O2
CO
consumed
(mmol g�1)
CO2 formed
(mmol g�1)
O atoms
consumed
(mmol g�1)
CO2 formed
(mmol g�1)
Step 1: 10 pulses CO followed by 10 pulses O2
1 274 274 622 0
2 201 197 15 0
3 64 52 4 0
4 31 19 8 0
5 18 0 11 0
6 17 0 0 0
7 15 0 0 0
8 12 0 0 0
9 13 0 0 0
10 11 0 0 0
Total 656 542 660 0
Step 2: Alternate pulses of CO and O2 (3 pulses of each gas)
1 275 268 312 0
2 273 272 298 0
3 274 276 296 0
Table 3
OSC measurements at 773K over SGZr0.10(Ce0.75Nd0.25)0.90O1.89�d
(sample weight: 20mg; pulses of 12 mmol of gas).
Pulse
number
Treatment under CO Treatment under O2
CO
consumed
(mmol g�1)
CO2 formed
(mmol g�1)
O atoms
consumed
(mmol g�1)
CO2 formed
(mmol g�1)
Step 1: 10 pulses CO followed by 10 pulses O2
1 88 79 100 0
2 23 21 17 0
3 14 0 12 0
4 6 0 11 0
5 6 0 10 0
6 6 0 2 0
7 1 0 0 0
8 0 0 0 0
9 0 0 0 0
10 0 0 0 0
Total 144 100 150 0
Step 2: Alternate pulses of CO and O2 (3 pulses of each gas)
1 94 76 100 0
2 94 77 103 0
3 95 78 104 0
J. Mikulova et al. / Journal of Solid State Chemistry 179 (2006) 2511–2520 2517
observed with the reaction of rare earth oxides withhydrogen [18] and the back-diffusion of water via hydroxylgroups is a common phenomenon in oxide dehydration. Insummary, OSC(CO) is mainly controlled by oxygenmobility while more complex mechanisms can occur aslong as OSC(H2) is concerned.
OSC expressed in mmol at. O g�1 for the differentsamples measured at 663K are reported in Table 1.Substituting cerium with neodymium cations in ceriadecreases oxygen mobility, which can be ascribed to theunique oxidation state (+III) of neodymium in thesecompounds. The+III neodymium cation has a negativeeffect on Ce reduction and the redox process is virtuallysuppressed despite the oxygen vacancies observed byRaman spectroscopy. On the contrary, replacing ceriumwith praseodymium cations increases oxygen mobilityowing to the presence of both Pr4+ and Pr3+ cations [12].
Whatever samples to which zirconium is added, theCe–Nd–O stabilizes the structure and enhances oxygenmobility [33]. However, the preparation mode results inclear differences, sol–gel samples being better thancoprecipitated samples [22]. Remarkably, Zr4+ restoresOSC properties of Ce–Nd oxides. The very different valuesobtained at 773K for the two materials containing thesame amounts of zirconium and cerium atoms areobviously linked to the nature of the second rare earthelement. Praseodymium ability is to rapidly change itsoxidation state seems to favour a greater reduction of Ce4+
into Ce3+ and to improve oxygen mobility.
3.5.2. Oxygen storage capacity complete (OSCC, 10 pulses
at 773 K)
In order to give a better overview of the redox process inthe ternary oxides, the experimental data obtained at 773Kin all experiments (10 pulses of CO, then 10 pulses of O2,and finally alternate pulses of CO and O2) are reported inTable 2 for Zr0.10(Ce0.75Pr0.25)0.90O2�x and in Table 3 forthe Zr0.10(Ce0.75Nd0.25)0.90O1.89�d solid. With the ternaryZr–Ce–Pr oxide, the amount of CO2 produced after thefirst pulse of CO exactly matches with the amount ofCO consumed. In the following pulses, some carbonseems to be trapped on or in the materials with a cumu-lated deficit of CO2 formed with respect to the COconsumed. Nevertheless, this left over carbon is not totallyeliminated during oxidation treatment. Some amountof CO can be stored on the surface in a non-oxidizedform (e.g. formates), which can be oxidized into carbonac-eous species during O pulses. Consequently these species donot leave the surface and no CO2 is produced. Afteralternate pulses of CO and O2, CO2 production and COconsumption agree well. Furthermore, the O2 uptakecorresponds to a complete re-oxidation of the surface[Eqs. (1) and (2)]:
COðgÞ þ 2CeO2ðsÞ ! 2CeO2�xðsÞ þ 2xCO2ðgÞ; (1)
2CeO2�x ðsÞ þ xO2!þ2CeO2ðsÞ: (2)
The non-stoichiometric phase 2CeO2�d (s) is betterdescribed as [12]:
½CeIV1�2xCeIII2x �½O2�xðV
��O Þx�, (3)
where V ��O represent oxygen vacancies.Contrasting with the Pr-containing oxide, the
Zr0.10(Ce0.75Nd0.25)0.90O1.89�d solid shows unusual oxygen
ARTICLE IN PRESSJ. Mikulova et al. / Journal of Solid State Chemistry 179 (2006) 2511–25202518
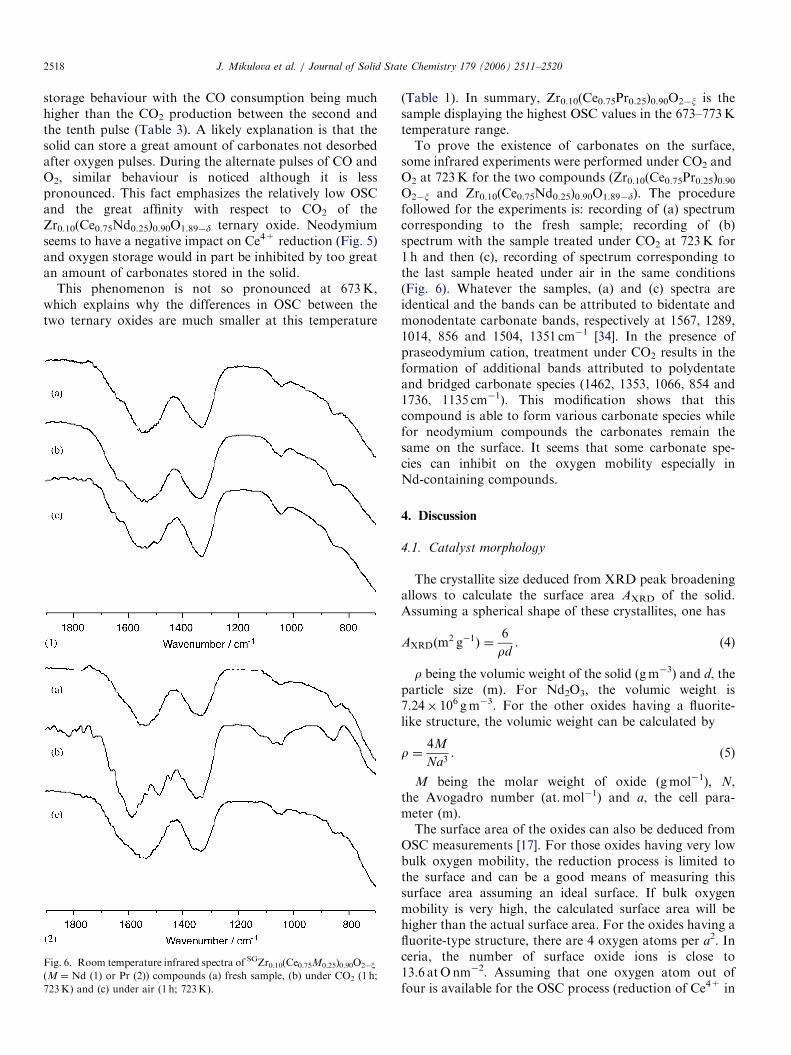
storage behaviour with the CO consumption being muchhigher than the CO2 production between the second andthe tenth pulse (Table 3). A likely explanation is that thesolid can store a great amount of carbonates not desorbedafter oxygen pulses. During the alternate pulses of CO andO2, similar behaviour is noticed although it is lesspronounced. This fact emphasizes the relatively low OSCand the great affinity with respect to CO2 of theZr0.10(Ce0.75Nd0.25)0.90O1.89�d ternary oxide. Neodymiumseems to have a negative impact on Ce4+ reduction (Fig. 5)and oxygen storage would in part be inhibited by too greatan amount of carbonates stored in the solid.
This phenomenon is not so pronounced at 673K,which explains why the differences in OSC between thetwo ternary oxides are much smaller at this temperature
Fig. 6. Room temperature infrared spectra of SGZr0.10(Ce0.75M0.25)0.90O2�x
(M ¼ Nd (1) or Pr (2)) compounds (a) fresh sample, (b) under CO2 (1 h;
723K) and (c) under air (1 h; 723K).
(Table 1). In summary, Zr0.10(Ce0.75Pr0.25)0.90O2�x is thesample displaying the highest OSC values in the 673–773Ktemperature range.To prove the existence of carbonates on the surface,
some infrared experiments were performed under CO2 andO2 at 723K for the two compounds (Zr0.10(Ce0.75Pr0.25)0.90O2�x and Zr0.10(Ce0.75Nd0.25)0.90O1.89�d). The procedurefollowed for the experiments is: recording of (a) spectrumcorresponding to the fresh sample; recording of (b)spectrum with the sample treated under CO2 at 723K for1 h and then (c), recording of spectrum corresponding tothe last sample heated under air in the same conditions(Fig. 6). Whatever the samples, (a) and (c) spectra areidentical and the bands can be attributed to bidentate andmonodentate carbonate bands, respectively at 1567, 1289,1014, 856 and 1504, 1351 cm�1 [34]. In the presence ofpraseodymium cation, treatment under CO2 results in theformation of additional bands attributed to polydentateand bridged carbonate species (1462, 1353, 1066, 854 and1736, 1135 cm�1). This modification shows that thiscompound is able to form various carbonate species whilefor neodymium compounds the carbonates remain thesame on the surface. It seems that some carbonate spe-cies can inhibit on the oxygen mobility especially inNd-containing compounds.
4. Discussion
4.1. Catalyst morphology
The crystallite size deduced from XRD peak broadeningallows to calculate the surface area AXRD of the solid.Assuming a spherical shape of these crystallites, one has
AXRDðm2 g�1Þ ¼
6
rd. (4)
r being the volumic weight of the solid (gm�3) and d, theparticle size (m). For Nd2O3, the volumic weight is7.24� 106 gm�3. For the other oxides having a fluorite-like structure, the volumic weight can be calculated by
r ¼4M
Na3. (5)
M being the molar weight of oxide (gmol�1), N,the Avogadro number (at. mol�1) and a, the cell para-meter (m).The surface area of the oxides can also be deduced from
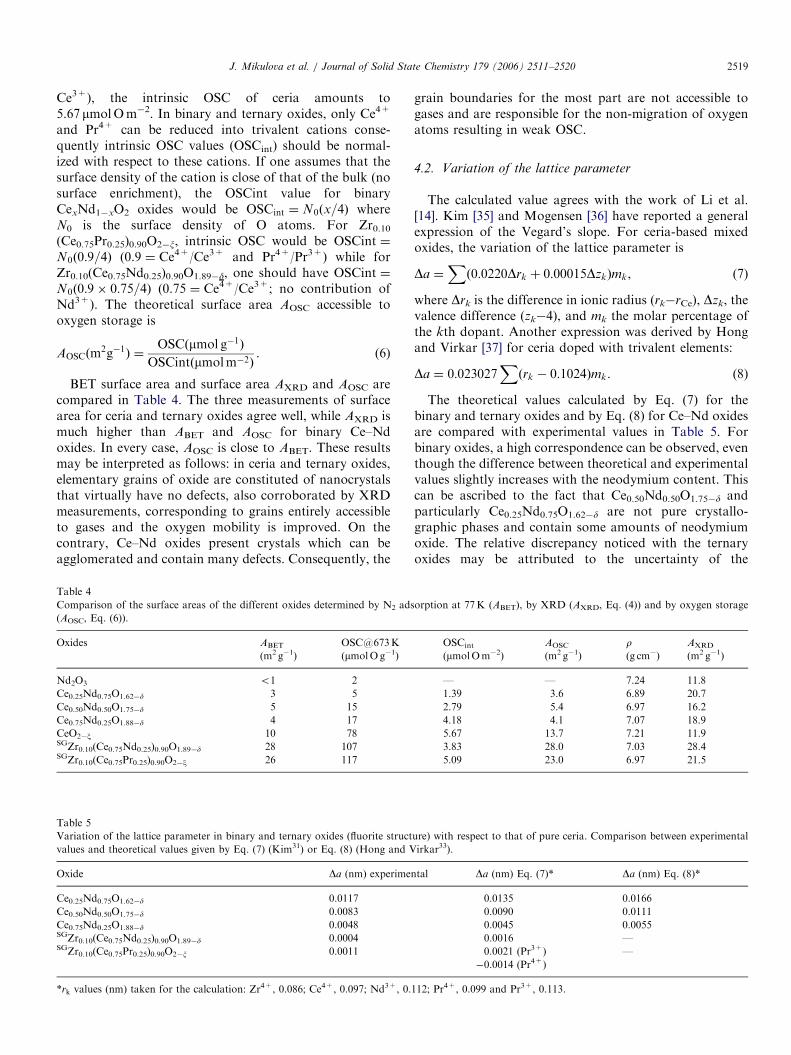
OSC measurements [17]. For those oxides having very lowbulk oxygen mobility, the reduction process is limited tothe surface and can be a good means of measuring thissurface area assuming an ideal surface. If bulk oxygenmobility is very high, the calculated surface area will behigher than the actual surface area. For the oxides having afluorite-type structure, there are 4 oxygen atoms per a2. Inceria, the number of surface oxide ions is close to13.6 atOnm�2. Assuming that one oxygen atom out offour is available for the OSC process (reduction of Ce4+ in
ARTICLE IN PRESSJ. Mikulova et al. / Journal of Solid State Chemistry 179 (2006) 2511–2520 2519
Ce3+), the intrinsic OSC of ceria amounts to5.67 mmolOm�2. In binary and ternary oxides, only Ce4+
and Pr4+ can be reduced into trivalent cations conse-quently intrinsic OSC values (OSCint) should be normal-ized with respect to these cations. If one assumes that thesurface density of the cation is close of that of the bulk (nosurface enrichment), the OSCint value for binaryCexNd1�xO2 oxides would be OSCint ¼ N0ðx=4Þ whereN0 is the surface density of O atoms. For Zr0.10(Ce0.75Pr0.25)0.90O2�x, intrinsic OSC would be OSCint ¼N0ð0:9=4Þ (0.9 ¼ Ce4+/Ce3+ and Pr4+/Pr3+) while forZr0.10(Ce0.75Nd0.25)0.90O1.89�d, one should have OSCint ¼N0ð0:9� 0:75=4Þ (0.75 ¼ Ce4+/Ce3+; no contribution ofNd3+). The theoretical surface area AOSC accessible tooxygen storage is
AOSCðm2g�1Þ ¼
OSCðmmol g�1Þ
OSCintðmmolm�2Þ. (6)
BET surface area and surface area AXRD and AOSC arecompared in Table 4. The three measurements of surfacearea for ceria and ternary oxides agree well, while AXRD ismuch higher than ABET and AOSC for binary Ce–Ndoxides. In every case, AOSC is close to ABET. These resultsmay be interpreted as follows: in ceria and ternary oxides,elementary grains of oxide are constituted of nanocrystalsthat virtually have no defects, also corroborated by XRDmeasurements, corresponding to grains entirely accessibleto gases and the oxygen mobility is improved. On thecontrary, Ce–Nd oxides present crystals which can beagglomerated and contain many defects. Consequently, the
Table 4
Comparison of the surface areas of the different oxides determined by N2 ads
(AOSC, Eq. (6)).
Oxides ABET
(m2 g�1)
OSC@673K
(mmolO g�1)
Nd2O3 o1 2
Ce0.25Nd0.75O1.62�d 3 5
Ce0.50Nd0.50O1.75�d 5 15
Ce0.75Nd0.25O1.88�d 4 17
CeO2�x 10 78SGZr0.10(Ce0.75Nd0.25)0.90O1.89�d 28 107SGZr0.10(Ce0.75Pr0.25)0.90O2�x 26 117
Table 5
Variation of the lattice parameter in binary and ternary oxides (fluorite struct
values and theoretical values given by Eq. (7) (Kim31) or Eq. (8) (Hong and V
Oxide Da (nm) experimen
Ce0.25Nd0.75O1.62�d 0.0117
Ce0.50Nd0.50O1.75�d 0.0083
Ce0.75Nd0.25O1.88�d 0.0048SGZr0.10(Ce0.75Nd0.25)0.90O1.89�d 0.0004SGZr0.10(Ce0.75Pr0.25)0.90O2�x 0.0011
*rk values (nm) taken for the calculation: Zr4+, 0.086; Ce4+, 0.097; Nd3+, 0.
grain boundaries for the most part are not accessible togases and are responsible for the non-migration of oxygenatoms resulting in weak OSC.
4.2. Variation of the lattice parameter
The calculated value agrees with the work of Li et al.[14]. Kim [35] and Mogensen [36] have reported a generalexpression of the Vegard’s slope. For ceria-based mixedoxides, the variation of the lattice parameter is
Da ¼Xð0:0220Drk þ 0:00015DzkÞmk, (7)
where Drk is the difference in ionic radius (rk�rCe), Dzk, thevalence difference (zk�4), and mk the molar percentage ofthe kth dopant. Another expression was derived by Hongand Virkar [37] for ceria doped with trivalent elements:
Da ¼ 0:023027Xðrk � 0:1024Þmk. (8)
The theoretical values calculated by Eq. (7) for thebinary and ternary oxides and by Eq. (8) for Ce–Nd oxidesare compared with experimental values in Table 5. Forbinary oxides, a high correspondence can be observed, eventhough the difference between theoretical and experimentalvalues slightly increases with the neodymium content. Thiscan be ascribed to the fact that Ce0.50Nd0.50O1.75�d andparticularly Ce0.25Nd0.75O1.62�d are not pure crystallo-graphic phases and contain some amounts of neodymiumoxide. The relative discrepancy noticed with the ternaryoxides may be attributed to the uncertainty of the
orption at 77K (ABET), by XRD (AXRD, Eq. (4)) and by oxygen storage
OSCint
(mmolOm�2)
AOSC
(m2 g�1)
r(g cm�)
AXRD
(m2 g�1)
— — 7.24 11.8
1.39 3.6 6.89 20.7
2.79 5.4 6.97 16.2
4.18 4.1 7.07 18.9
5.67 13.7 7.21 11.9
3.83 28.0 7.03 28.4
5.09 23.0 6.97 21.5
ure) with respect to that of pure ceria. Comparison between experimental
irkar33).
tal Da (nm) Eq. (7)* Da (nm) Eq. (8)*
0.0135 0.0166
0.0090 0.0111
0.0045 0.0055
0.0016 —
0.0021 (Pr3+) —
�0.0014 (Pr4+)
112; Pr4+, 0.099 and Pr3+, 0.113.
ARTICLE IN PRESSJ. Mikulova et al. / Journal of Solid State Chemistry 179 (2006) 2511–25202520
predictive equation for such small Da values. However, thesame tendency between theoretical and experimental valuesis observed, which confirms that Eq. (7) can be used for theestimation of Vegard’s slopes in complex oxides. Thebehaviour of the ZrCePr ternary oxide is also worthy ofnote: while the calculation with Pr4+ cations gives negativeDa values, only those obtained with Pr3+ cations lead topositive values agreeing with experimental data. Mostlikely, Pr ions are present as trivalent and tetravalentdoping in this ternary oxide. This feature, as well as thetemperature dependence of the Pr-containing oxides (Fig. 5and Ref. [17]) illustrates the difference between Ce dopingwith Pr or with Nd.
5. Conclusion
Binary Ce–Nd and ternary Zr–Ce–Nd and Zr–Ce–Proxides were prepared by the sol–gel method and calcined at1173K. The binary Ce–Nd oxides are characterized by asolid solution with a fluorite-type structure until x ¼ 0:25and by relatively weak oxygen mobility, in spite of thepresence of oxygen vacancies characterized by a Ramanband at 560 cm�1. This effect is also observed after theaddition of zirconium ions in the fluorite structure,although Zr atoms significantly improve thermal resistanceto sintering. Neodymium cations in the valence state +IIIslightly inhibit oxygen mobility even though the structure isnon-stoichiometric. This behaviour contrasts with that ofpraseodymium-doped ceria. Simultaneously at the PrIII
and PrIV valence state, Pr ions are able to promote oxygenmobility in the bulk starting at 500K, with oxygenvacancies pre-existing at room temperature.
References
[1] A. Trovarelli, Structural properties and nonstoichiometric behavior
of CeO2, in: A. Trovarelli (Ed.), Catalysis by Ceria and Related
Materials, Catalysis Science Series, Imperial College Press, 2002, p. 2
(Chapter 2).
[2] A. Trovarelli, Catal. Rev. Sci. Eng. 38 (1996) 439.
[3] J. Kaspar, P. Fornasiero, M. Graziani, Catal. Today 50 (1999) 285.
[4] M. Thammachart, V. Meeyo, T. Risksomboon, S. Osuwann, Catal.
Today 68 (2001) 53.
[5] A. Cabana, J.A. Darr, E. Lester, M. Poliakoff, J. Mater. Chem. 11
(2001) 561.
[6] E. Rohart, O. Larcher, C. Hedouin, M. Allain, P. Macaudiere, SAE
Int. Pape 1 (2001) 1274.
[7] J.-G. Li, T. Ikegami, T. Mori, Acta Mater. 52 (8) (2004) 2221.
[8] J.-G. Li, T. Ikegami, Y. Wang, T. Mori, J. Am. Ceram. Soc. 86 (6)
(2003) 915.
[9] J.-G. Li, T. Ikegami, Y. Wang, T. Mori, J. Solid State Chem. 168 (1)
(2002) 52.
[10] J.-G. Li, T. Ikegami, T. Mori, T. Wada, Chem. Mater. 13 (9) (2001) 13.
[11] P. Shuk, M. Greenblatt, M. Croft, J. Alloys Compd. 303 (2000) 465.
[12] S. Rossignol, C. Descorme, C. Kappenstein, D. Duprez, J. Mater.
Chem. 11 (2001) 2587.
[13] C. Peng, Y. Wang, K. Jiang, B.Q. Bin, H.W. Liang, J. Feng, J. Meng,
J. Alloys Compd. 349 (2000) 273.
[14] L. Li, X. Li, G. Li, H. Inimota, J. Mater. Res. 16 (11) (2001) 3207.
[15] W. Chun, G.W. Graham, J.A. Lupescu, R.W. McCabe,
M.M. Koranne, R. Brezny, Catal. Lett. 106 (3–4) (2006) 95.
[16] W. Huang, P. Shuk, M. Greenblatt, Solid State Ion. 113 (1998) 305.
[17] S. Rossignol, D. Mesnard, F. Gerard, C. Kappenstein, D. Duprez,
J. Mater. Chem. 13 (2003) 3017.
[18] C. Lamonier, G. Wrobel, J.P. Bonnelle, J. Mater. Chem. 4 (1994)
1927.
[19] F. Sadi, D. Duprez, F. Gerard, A. Miloudi, J. Cata 26 (2003) 226.
[20] S. Wang, W. Wang, J. Zuo, Y. Qian, Mater. Chem. Phys. 68 (2001)
246.
[21] S. Zha, Q. Fu, Y. Lang, C. Xia, G. Meng, Mater. Lett. 47 (2001) 351.
[22] S. Rossignol, F. Gerard, D. Duprez, J. Mater. Chem. 7 (1999) 1615.
[23] T. Biljan, S. Roncevic, Z. Meic, K. Kovac, Chem. Phys. Lett. 395
(2004) 246.
[24] A.M. Heyns, K.J. Range, J. Raman Spectroscopy 25 (1994) 855.
[25] A. Minesshige, T. Taji, Y. Muroi, M. Kobune, S. Fujii, N. Nishi,
M. Inaba, Z. Ogumi, Solid State Ion. 135 (2000) 481.
[26] P. Fornasiero, A. Speghini, R. Di Monte, M. Bettinelli, J. Kaspar,
A. Bigotto, V. Sergo, M. Graziani, Chem. Mater. 16 (10) (2004) 1938.
[27] H.C. Yao, Y.F. Yu Yao, J. Catal. 86 (1984) 254.
[28] P. Fornasiero, R. Di Monte, G. Ranga Rao, J. Kaspar, S. Meriani,
A. Trovarelli, M. Graziani, J. Catal. 151 (1995) 168.
[29] D. Duprez, C. Descorme, Oxygen storage/Redox capacity and related
phenomena on ceria-based catalysts, in: A. Trovarelli (Ed.), Catalysis
by Ceria and Related Materials, Catalysis Science Series, Imperial
College Press, 2002, pp. 243–280 (Chapter 7).
[30] M. Boaro, F. Giordano, S. Recchia, V. Dal Santo, M. Giona,
A. Trovarelli, Appl. Catal. B 52 (2004) 225.
[31] N. Hickey, P. Fornasiero, R. Di. Monte, J. Kaspar, M. Graziani,
G. Dolcetti, Catal. Lett. 72 (1) (2001) 45.
[32] R. Di. Monte, J. Kaspar, Top. Catal. 28 (1) (2004) 47.
[33] M. Ozawa, M. Kimura, A. Isogai, J. Alloys Compd. 193 (1993) 73.
[34] C. Binet, M. Daturi, J.C. Lavalley, Catal. Today 50 (1999) 207.
[35] D.-J. Kim, J. Am. Ceram. Soc. 72 (1989) 1415.
[36] M. Mogensen, Ceria-base electrodes, in: A. Trovarelli (Ed.), Catalysis
by Ceria and Related Materials, Catalysis Science Series, Imperial
College Press, 2002, pp. 453–481 (Chapter 15).
[37] S.J. Hong, A.V. Virkar, J. Am. Ceram. Soc. 78 (1995) 433.
Copyright © 2022 FDOKUMEN