separation of zirconium from uranium in u-zr alloys using a
153
SEPARATION OF ZIRCONIUM FROM URANIUM IN U-ZR ALLOYS USING A CHLORINATION PROCESS A Dissertation by ADAM JOSEPH PARKISON Submitted to the Office of Graduate Studies of Texas A&M University in partial fulfillment of the requirements for the degree of DOCTOR OF PHILOSOPHY Chair of Committee, Sean M. McDeavitt Committee Members, William Charlton Simon North Lin Shao Head of Department, Yassin Hassan August 2013 Major Subject: Nuclear Engineering Copyright 2013 Adam Joseph Parkison
-
Upload
khangminh22 -
Category
Documents
-
view
0 -
download
0
Transcript of separation of zirconium from uranium in u-zr alloys using a
SEPARATION OF ZIRCONIUM FROM URANIUM IN U-ZR ALLOYS USING A
CHLORINATION PROCESS
A Dissertation
by
ADAM JOSEPH PARKISON
Submitted to the Office of Graduate Studies of
Texas A&M University
in partial fulfillment of the requirements for the degree of
DOCTOR OF PHILOSOPHY
Chair of Committee, Sean M. McDeavitt
Committee Members, William Charlton
Simon North
Lin Shao
Head of Department, Yassin Hassan
August 2013
Major Subject: Nuclear Engineering
Copyright 2013 Adam Joseph Parkison

ii
ABSTRACT
The fundamental behavior underpinning a new processing concept was
demonstrated which is capable of separating uranium from zirconium in U-Zr alloys
through the formation and selective volatilization of their respective chlorides. Bench-
scale chlorination and volatilization experiments were conducted on uranium, zirconium,
and a U-50 wt% Zr alloy in order to gather the data needed to develop processing
methods and equipment. It is also proposed that the demonstrated chlorination process
may be coupled to a hydride/dehydride pulverization process, resulting in increased
process efficiencies and simplified equipment design.
Process variables such as temperature, pressure, surface area, and reaction time
were studied in an iterative manner until the variables needed for selective volatilization
were discovered. This began with the design and assembly of an experimental apparatus
which was capable of surviving a hot chlorine atmosphere. It was found that standard
glass test-tubes were suitable as reaction vessels for these experiments. Heated and non-
heated regions were established within the glass reaction vessels to allow for
volatilization and condensation of the volatile chlorides through natural convection. The
volatilized and non-volatilized products were collected and analyzed using EPMA to
determine the relative uranium and zirconium compositions.
It was found that chlorination reactions on gram-size samples at temperatures of
320, 340, 360 °C generated a uranium product with 89.9, 95.0, and 98.8% purity, and a
zirconium product with 82.1, 85.1, and 84.2% purity, respectively. These separations
iii
were achieved through a single distillation with a U-50 wt% Zr starting material. It is
anticipated that further distillations could be used to achieve increased uranium and
zirconium purity, and changes in system geometry could also significantly increase these
purities, specifically with the zirconium product stream.

iv
ACKNOWLEDGEMENTS
I would like to thank my committee for their support throughout the course of
this research. I would also like to thank Ray Guillemette, “The Fifth Beatle”. Thanks go
to my colleagues Aaron Totemeier, Brandon Blamer, Grant Helmreich, Jeff Clemens,
and Miguel Holgado who each provided their own unique contribution. I would like to
extend a special thanks to Sean McDeavitt for giving me the freedom and the
opportunity to pursue this research in my own way.

v
TABLE OF CONTENTS
Page
ABSTRACT ....................................................................................................................... ii
ACKNOWLEDGEMENTS .............................................................................................. iv
LIST OF FIGURES.......................................................................................................... vii
LIST OF TABLES ............................................................................................................ xi
1. INTRODUCTION......................................................................................................... 1
1.1 Context and Motivation ....................................................................................... 1 1.2 Hydride/Dehydride Pulverization ........................................................................ 3
1.3 Chloride Volatilization ........................................................................................ 5
2. BACKGROUND........................................................................................................... 7
2.1 Hydride Formation .............................................................................................. 7
2.1.1 Zirconium Hydride Formation ..................................................................... 8 2.1.2 Uranium Hydride Formation ...................................................................... 10
2.1.3 Uranium-Zirconium Hydride Pulverization Process .................................. 11 2.2 Halide Processing of Group-4 Elements ........................................................... 12
2.2.1 Chloride Processing ................................................................................... 13 2.2.2 Fluoride Processing .................................................................................... 15 2.2.3 Bromide Processing ................................................................................... 17
2.2.4 Iodide Processing ....................................................................................... 18 2.2.5 Uranium-Zirconium Chloride Volatilization Process ................................ 20
3. EXPERIMENTAL DESIGN AND PROCEDURE ..................................................... 22
3.1 Experimental Design ......................................................................................... 22 3.1.1 System 1 - All-Metal System ..................................................................... 22
3.1.2 System 2 - Long Glass Tube ...................................................................... 25 3.1.3 System 3 - Hastelloy C-22 Vessel .............................................................. 28 3.1.4 System 4 - Narrow Glass Tube ................................................................. 31 3.1.5 System 5 - Glass Test-Tube Systems ......................................................... 32
3.2 Experimental Procedure .................................................................................... 35 3.2.1 ZRT Series ................................................................................................. 36 3.2.2 Uranium Test (UT) Series .......................................................................... 39

vi
Page
3.2.3 U50Zr Series .............................................................................................. 41 3.2.4 Zirconium (Zr) Series ................................................................................. 48
3.2.5 U50ZrFinal ................................................................................................. 51
4. RESULTS .................................................................................................................... 56
4.1 Preliminary Experiments: Temperature, Pressure, and Time (ZRT Series) ...... 56
4.1.1 Impact of Temperature (ZRT-1 to ZRT-9) ................................................ 57 4.1.2 Impact of Pressure (ZRT-10 to ZRT-14) ................................................... 59
4.1.3 Impact of Time (ZRT-15 to ZRT-21) ........................................................ 61 4.2 Initial Reactions to Compare Zr, U and Zr-50Zr Reactions (UT Series) .......... 63 4.3 Uranium-Zirconium Separation Demonstration (U50Zr) ................................. 69
4.3.1 U-50Zr Alloy Characterization .................................................................. 71
4.3.2 Separation Results ...................................................................................... 76 4.4 Series Zr........................................................................................................... 100
4.4.1 Rate Study (Zr1 to Zr8) ............................................................................ 100 4.4.2 Surface Area Study (Zr9 to Zr20) ............................................................ 105 4.4.3 Study of Composition and Physical Shape (Zr14) ................................... 110
4.4.4 Zr Conclusion ........................................................................................... 111 4.5 Series U50ZrFinal ........................................................................................... 112
4.5.1 Variable Selection and Justifications ....................................................... 113 4.5.2 U50Zr Final Results ................................................................................. 116
5. SUMMARY OF EXPERIMENTAL RESULTS ....................................................... 126
5.1 Motivation ....................................................................................................... 126 5.2 Pulverization Process....................................................................................... 129
5.2.1 Rate of Pulverization ................................................................................ 129 5.2.2 Criticality Limits ...................................................................................... 131
5.3 Separation Process ........................................................................................... 134 5.4 Conclusion ....................................................................................................... 137
REFERENCES ............................................................................................................... 139

vii
LIST OF FIGURES
Page
Figure 1: Comparison of hydride formation along the β-path (left) and α-path
(right). The sample on the left was produced at 582 °C with a
hydrogen pickup of 90%. The sample on the right was produced at
432 °C with a hydrogen pickup of 86%. ....................................................... 9
Figure 2: Zr-H phase diagram. Early onset of the δ-phase along the α-pathway
results in a dramatically increased pulverization rate. ................................ 10
Figure 3: Zirconium crystal bar process flow diagram. .............................................. 19
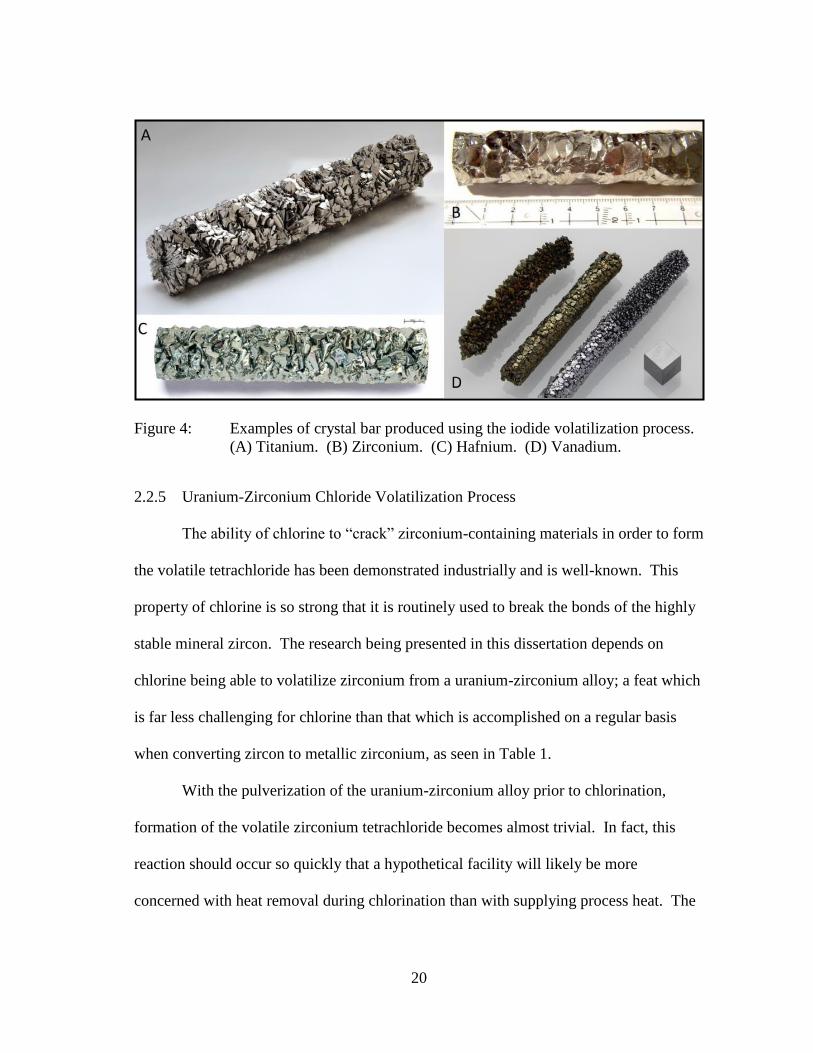
Figure 4: Examples of crystal bar produced using the iodide volatilization
process. (A) Titanium. (B) Zirconium. (C) Hafnium. (D) Vanadium. .... 20
Figure 5: Schematic diagram of the initial all-metal system constructed using the
Ni-based Alloy-625. .................................................................................... 24
Figure 6: Schematic diagram of the second experimental system constructed
using a long glass tube. ............................................................................... 27
Figure 7: Schematic diagram of the horizontal two-test-tube system assembled
for the UT chlorination test series. (Insulation not shown.) ....................... 33
Figure 8: Schematic diagram of the horizontal four-test-tube system assembled
for the U50Zr and Zr chlorination test series. (Insulation not shown.) ...... 34
Figure 9: Schematic diagram of the final horizontal one-test-tube system
assembled for the U50ZrFinal chlorination test series. (Insulation not
shown.) ........................................................................................................ 35
Figure 10: Schematic of narrow glass tube system used for the ZRT experiments. ..... 37
Figure 11: Process to physically separate volatilized and non-volatilized material. .... 44
Figure 12: Mass loss of zirconium metal after 60 minute reaction time vs.
temperature at 14 psig. ................................................................................ 58
Figure 13: Mass loss of zirconium metal vs. chlorine pressure at 375 °C. ................... 60

viii
Page
Figure 14: Mass loss of zirconium metal vs. time at 375 °C and 14 psi chlorine. ....... 62
Figure 15: Reaction vessel containing U-50Zr (UT-2) in heated aluminum block;
discoloration from suspended vapor deposited chloride solids. .................. 64
Figure 16: Reaction vessel for UT-5 showing clogging due to deposition of
product from chlorinated crystal-bar zirconium. ......................................... 65
Figure 17: Reaction vessel from experiment UT-2 showing the remnant of the U-
50Zr alloy and the purple product on the cold zone wall. ........................... 67
Figure 18: Reaction vessel from experiment UT-2 showing and the white product
on the cold zone wall; the Zr sample was completely gone. ....................... 67
Figure 19: Reaction vessel as removed from heated block. Sample is uranium
from experiment UT-3. ............................................................................... 68
Figure 20: Reaction vessel as removed from heated block. Sample is U-50Zr
from experiment UT-3. ............................................................................... 69
Figure 21: Variation of uranium-zirconium ratio along length of as-cast alloy.
Slice 1 was at the top of the alloy, while slice 7 was at the bottom of
the alloy. ...................................................................................................... 72
Figure 22: Backscattered electron images of the U-50Zr material (Slice 1)
showing a representative microstructure which is common to all slices. ... 73
Figure 23: Colorized image (center) from U-50Zr sample in Figure 22-B along
with X-ray maps showing the locations of uranium (left) and
zirconium (right). ........................................................................................ 74
Figure 24: Low magnification backscattered electron images of the U-50Zr alloy
slices showing macroscopic homogeneity: The faces of Slice 1 are
shown in A-B, Slice 2 in C-D, and Slice 3 in E-F. ...................................... 75
Figure 25: Uranium and zirconium X-ray maps of U-10Zr alloy system showing
macroscopic inhomogeneity. ....................................................................... 75
Figure 26: Uranium and Zirconium X-ray maps of U-10Zr alloy-system showing
macroscopic inhomogeneity. ....................................................................... 76
ix
Page
Figure 27: Energy-dispersive X-ray spectrum of volatilized portion of samples 1-
3 in experiment U50Zr1 showing sodium contamination and varying
U-Zr compositions. ...................................................................................... 78
Figure 28: BSE images of volatilized portions of U50Zr1 samples 1(A), 2(B), and
3(C) showing sodium contamination (dark regions), heterogeneity, and
increased uranium content (bright regions) in sample 3. ............................ 80
Figure 29: Backscattered electron images of samples 1-4 from the U50Zr2
experiment showing variation in sample homogeneity. .............................. 82
Figure 30: EDS data showing difference in homogeneity between samples 1 and 3
in experiment U50Zr2. ................................................................................ 83
Figure 31: Backscattered electron images of samples 1-4 from the U50Zr5
experiment. .................................................................................................. 86
Figure 32: Energy dispersive spectra of sample 1 in experiment U50Zr5 shown in
Figure 31. Light phase region (Left). Dark phase region (Right).
Light/dark comparison (Center). ................................................................. 87
Figure 33: Energy dispersive spectra of sample 2 in experiment U50Zr5. .................. 88
Figure 34: Electron dispersive spectra of sample 4 in experiment U50Zr5. ................ 89
Figure 35: X-ray map of Slice 1 showing presence of yttrium oxide rind. .................. 90
Figure 36: Backscattered electron image of volatilized material from experiment
U50Zr6. ....................................................................................................... 93
Figure 37: Energy dispersive spectra of volatilized material from experiment
U50Zr6. ....................................................................................................... 94
Figure 38: Backscattered electron image of non-volatilized material from
experiment U50Zr7. .................................................................................... 95
Figure 39: Energy dispersive spectra of non-volatilized material from experiment
U50Zr7. ....................................................................................................... 96
Figure 40: Backscattered electron image of volatilized material from experiment
U50Zr7. ....................................................................................................... 97

x
Page
Figure 41: Energy dispersive spectrum of volatilized material from experiment
U50Zr7. ....................................................................................................... 98
Figure 42: Summary of zirconium volatilization from U-50Zr alloys showing the
relative percent of zirconium remaining in non-volatilized products. ........ 99
Figure 43: Results from probing experiments showing inconclusive rate study
plotted as a function of time. ..................................................................... 101
Figure 44: Chloride formation rate from probing experiments. ................................. 104
Figure 45: Mass change data from Zr8 showing reproducibility of chloride
formation for samples with a similar surface area. ................................... 105
Figure 46: Plot showing relative variance between a 2 minute and 10 minute
reaction time. ............................................................................................. 108
Figure 47: Summary of surface area study showing accelerating reaction rate as a
function of surface area, and a decreased reaction rate as a function of
temperature. ............................................................................................... 109
Figure 48: Backscattered electron image of non-volatilized samples. Experiment
U50ZrFinal-8 on left, experiment U50ZrFinal-10 on right. ...................... 117
Figure 49: Typical backscattered electron image of volatilized samples.
Experiment U50ZrFinal-7 on left, experiment U50ZrFinal-10 on right. .. 118
Figure 50: Energy dispersive spectra of non-volatilized samples, volatilized
samples, and the bright portion within the volatilized samples. Plots
are from experiment U50ZrFinal-4. .......................................................... 119
Figure 51: EDS spectrum showing contamination of volatilized samples from
stainless steel fittings. Plots are from experiment U50ZrFinal-5. ............ 122
Figure 52: U50ZrFinal data plotted as a function of temperature. ............................. 125

xi
LIST OF TABLES
Page
Table 1: Comparison of exiting process to proposed process. ......................................... 5
Table 2: Summary of data from ZRT series. ................................................................. 57
Table 3: Summary of data from U50Zr series. .............................................................. 70
Table 4: Summary of alloy characterization. ................................................................. 71
Table 5: Summary of separation effectiveness from U50Zr1 experiment. .................... 77
Table 6: Summary of separation effectiveness from U50Zr2 experiment. .................... 81
Table 7: Summary of separation effectiveness from U50Zr4 experiment. .................... 85
Table 8: Summary of separation effectiveness from U50Zr5 experiment. .................... 86
Table 9: Summary of data from rate study. ................................................................. 102
Table 10: Summary of data from surface area study. ................................................... 106
Table 11: Volatilization onset temperature. .................................................................. 110
Table 12: Summary of data from U50ZrFinal series. ................................................... 113
1
1. INTRODUCTION
1.1 Context and Motivation
The development of new nuclear energy systems and advanced fuel cycles
creates a unique set of challenges. The challenge being considered in this research is the
establishment of a strategy for the disposal and/or reprocessing of uranium-zirconium
alloy nuclear fuel that has been burned to relatively high burnup. Such enabling
strategies are being considered to address the sustainability of nuclear power for
centuries to come. The particular process being considered here enables zirconium, and
perhaps other volatile species, to be separated from the uranium through selective
volatilization of the chlorides of zirconium and uranium. These chlorides can be
separated using a simple distillation process based on their respective boiling points of
331 and 791 °C [1].
Chemical processing of U-xZr alloys is challenging because of issues related to
material handling on industrial scales which arise due to the chemistry of these two
elements. The worldwide standard for reprocessing oxide fuel is the Plutonium
URanium EXtraction (PUREX) process. The PUREX process consists of first
dissolving the nuclear fuel in nitric acid. This acid solution is then mixed with a tributyl
phosphate (TBP)/kerosene mixture in order to extract the uranium, plutonium, thorium,
or whatever else might be of interest, from the waste-stream [2]. Problems arise during
aqueous processing of uranium-zirconium alloys due to the relative “nobility” of
zirconium in nitric acid [3]. This nobility results in sludge formation within the

2
reprocessing equipment. Not only does this sludge clog equipment, but it also impedes
the extraction process.
The PUREX process was designed to produce pure plutonium as a product [4].
This can be viewed as a drawback when nuclear fuel reprocessing is considered.
Therefore, the recovery of a “dirty” product certainly has its advantages. It should also
be noted that PUREX results in an oxide product after the aqueous effluent is calcined.
It can be viewed as being somewhat counterproductive from a processing standpoint to
process a metal fuel into an oxide, only to reconvert the oxide back into a metal. Many
of the loosely defined pyroprocessing methods, including the one being proposed, allow
for the recovery of “dirty” metallic products.
The fundamental chemical behavior of uranium and zirconium enables the use of
halide-based separation methods. In this study, a chloride volatilization process was
demonstrated that is effective in separating zirconium from uranium-zirconium metal
alloys, resulting in both uranium-rich and zirconium-rich product streams. While the
project focuses on the uranium-zirconium system, the results of this study may be
applied to uranium alloyed with any group-4 (e.g., Ti, Zr, Hf) species and may also have
relevance to the separation of other types of alloy mixtures where there is a range of
chloride species vapor pressures. This study may be used as a basis to begin
development of an industrial-scale process capable of selective separation of any group-
4 species from uranium alloys.
There is a strong interest in the use of metal-alloy fuels in nuclear energy
systems, especially in fast reactors, where a higher uranium-density is required when

3
compared to conventional oxide nuclear fuels. While metallic fuels have been used in
experimental fast reactors for decades, the design requirement for high uranium density
fuels has recently been a key component for two applications. The first arises from the
desire to convert research reactors from High Enriched Uranium (HEU) fuel to Low
Enriched Uranium (LEU) fuel. A fuel with a high uranium-density is required in order
for some of the higher power density reactors to maintain operation at the same power
output, and/or to have neutron flux levels which meet their continued mission
requirements after being converted from HEU to LEU fuel. Much of this work has been
performed under the Reduced Enrichment for Research and Test Reactors (RERTR)
program [5].
The second application is more relevant to this project and is related to the need
for development of fuels that can survive and enable ultra-high burnup requirements. At
the forefront of this need are the requirements of the Traveling Wave Reactor (TWR)
concept [6]. The TWR is an ultra-high burnup reactor that requires a high uranium
density fuel for a more efficient conversion of U-238 to Pu-239 as well as for the ability
to counteract the neutron poison effect from buildup of fission products. The uranium-
zirconium alloy system has been directly considered for use in TWR’s.
1.2 Hydride/Dehydride Pulverization
The chloride volatilization project considered here may be part of a sequence of
steps that will begin with a hydride pre-treatment of the alloy to be processed. It is
known that both uranium and zirconium readily form brittle hydrides [7-12]. It has also
been shown that hydride formation in both of these elements results in a fine hydride

4
powder which is easily dehydrided through heating under vacuum [13]. Formation of a
powdered alloy prior to processing with chlorine should greatly increase the chlorination
rate due to the dramatically increased surface area which is formed during the
hydride/dehydride process. This increased reaction rate was observed in the experiments
performed for this research, as discussed in Sections 3.1.2, 4.4.2, and 4.4.3, where it was
shown that formation of zirconium chloride has a strong dependence on surface area.
Perhaps the greatest advantage that a hydride pulverization process offers is that
it fundamentally changes the equipment required for handling and processing this
material in future stages. Pulverization would allow the material to be handled in a
continuous or semi-continuous manner through fluidization of the powder, which offers
clear advantages when compared to other processes where batch handling of bulk alloy
material is required. The advantage of processing a fluidized powder are perhaps best
demonstrated in Section 3.1.2 where it is shown that prohibitively high temperatures
may be reached if a bulk alloy is processed using a chlorination process.
In addition to the aforementioned advantages of handling a pulverized material
when compared to a bulk alloy, it cannot be ignored that a similar fluidization process is
already in use for the purification of Group-4 species. This existing process begins with
a fluidized zircon (ZrSiO4) feed material, and produces a purified zirconium product.
The process being proposed for this research is compared to the existing process in
Table 1.

5
Table 1: Comparison of exiting process to proposed process.
Existing Chlorination Process Proposed Chlorination Process
Starting Material Crushed Zircon (ZrSiO4) Pulverized U-Zr Alloy
Chlorination Reaction
ZrSiO4 + 2C + 4Cl
2(g) =
ZrCl4(g) + SiCl
4(g) + 2CO
2(g)
U + Zr + 4Cl2(g) =
UCl4 + ZrCl
4(g)
Reaction Temperature ~1,000 °C ~200 °C
Enthalpy Change -307 kJ -1883 kJ
Off Gasses CO2 and SiCl
4 Fission Products (If Present)
Reduction Agent Magnesium Magnesium
Reduction Products (Zr) Zirconium Sponge Zirconium and FPs (If Present)
Reduction Products (U) NA Uranium and FPs (If Present)
1.3 Chloride Volatilization
Following hydride/dehydride pulverization, the powderized alloy would be
processed using the chloride volatilization method demonstrated for this work. The
dramatically increased surface area of the metal powder, when compared to an intact
bulk alloy, will result in a rapid chlorination reaction. The near-instantaneous, highly
exothermic, chloride formation will enable the system to be operated at lower overall
system temperatures than would be otherwise required. It was demonstrated, and is
discussed in Section 4.4.3, that zirconium chloride formation and volatilization would
occur at a system temperature of 310 °C for bulk zirconium, but could be reduced to as
low as 195 °C for a zirconium powder. This would allow an industrial vessel to be
maintained at a lower temperature than would otherwise be possible if bulk material

6
were to be in contact with the vessel walls during its exothermic conversion to the
volatile chloride, which would undoubtedly result in high local temperatures.
The majority of experiments performed for this project were ultimately focused
on studying the chlorination and selective volatilization of zirconium from U-50Zr (all
compositions will be reported in weight-percent from this point onward) bulk alloys.
The results of these selective volatilization experiments show great promise that chlorine
may be used to produce purified uranium and zirconium product streams from this and
similar alloys. For example, it was observed that at 360 °C this chlorination process is
capable of producing a uranium and zirconium product stream each with a purity of
98.8% and 84.2%, respectively, through a single distillation. These separation
efficiencies are likely to be increased if a powder feed material is used instead of a bulk
alloy because of the increased chloride formation rate which will result in greater control
over the volatilization process.
The following chapters contain the literature foundation (Ch. 2), experimental
equipment and methods (Ch. 3), and a detailed and complete presentation of the
experimental results (Ch. 4). Chapter 5 contains a discussion of the implications and the
potential impact of these results as they may apply to future research and/or industrial
systems which utilize this or a similar process.

7
2. BACKGROUND
The Sections below contain descriptions of the conversion of metals to powder
via hydride formation (Section 2.1), the chlorination and volatilization of metals (Section
2.2), as well as a brief description of methods involving other halides (I, Br, and F)
(Section 2.3).
2.1 Hydride Formation
As noted in Section 1.2, the hydride/dehydride method may be used prior to the
chlorination process evaluated in this study to significantly increase the surface area of
the material. Therefore, this section will review the fundamental aspects of this method.
The chemical reaction of an active metal with hydrogen is a common method for
producing reactive metal powder [14]. This method begins by hydriding the metal(s) of
interest, usually via reaction with hydrogen gas at an elevated temperature, to form a
brittle metal hydride which has a lower density than the original material. The formation
of a low density metal hydride phase introduces stresses in the embrittled structure
which results in the metal being reduced to a hydride powder. The hydride powder may
then be dehydrided to produce a relatively pure metal powder, although complete
removal of the hydrogen is a challenge. The dehydride process typically takes place
under sub-atmospheric pressures and at even higher temperatures than the hydride
formation reaction. The product of this coupled hydride/dehydride process is a powder
(pure metal or alloy) that has been produced from a bulk solid piece of metal. While not
8
suitable for all metals, a hydride/dehydride process is capable of reducing the materials
of interest to this project, namely uranium and zirconium, to a fine metal powder.
2.1.1 Zirconium Hydride Formation
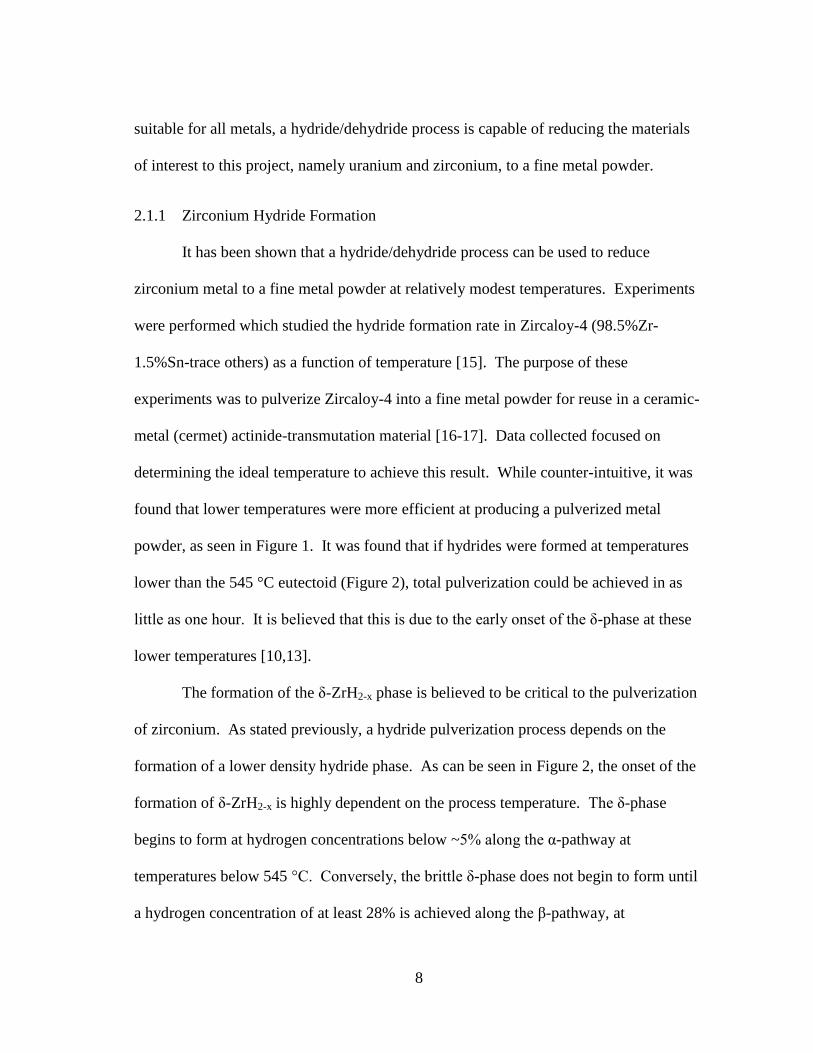
It has been shown that a hydride/dehydride process can be used to reduce
zirconium metal to a fine metal powder at relatively modest temperatures. Experiments
were performed which studied the hydride formation rate in Zircaloy-4 (98.5%Zr-
1.5%Sn-trace others) as a function of temperature [15]. The purpose of these
experiments was to pulverize Zircaloy-4 into a fine metal powder for reuse in a ceramic-
metal (cermet) actinide-transmutation material [16-17]. Data collected focused on
determining the ideal temperature to achieve this result. While counter-intuitive, it was
found that lower temperatures were more efficient at producing a pulverized metal
powder, as seen in Figure 1. It was found that if hydrides were formed at temperatures
lower than the 545 °C eutectoid (Figure 2), total pulverization could be achieved in as
little as one hour. It is believed that this is due to the early onset of the δ-phase at these
lower temperatures [10,13].
The formation of the δ-ZrH2-x phase is believed to be critical to the pulverization
of zirconium. As stated previously, a hydride pulverization process depends on the
formation of a lower density hydride phase. As can be seen in Figure 2, the onset of the
formation of δ-ZrH2-x is highly dependent on the process temperature. The δ-phase
begins to form at hydrogen concentrations below ~5% along the α-pathway at
temperatures below 545 °C. Conversely, the brittle δ-phase does not begin to form until
a hydrogen concentration of at least 28% is achieved along the β-pathway, at

9
temperatures above 545 °C. The effect of such a result is dramatic when the desired goal
is pulverization of the material because of the strong dependence of surface area on the
hydride reaction rate. The formation of a brittle hydride causes the material to fracture,
thereby increasing the surface area, which accelerates the formation of the brittle
hydride. The rapid onset of δ-phase formation for the α-phase pathway results in a
dramatically increased pulverization rate when compared to the β-phase pathway.
Figure 1: Comparison of hydride formation along the β-path (left) and α-path
(right). The sample on the left was produced at 582 °C with a hydrogen
pickup of 90%. The sample on the right was produced at 432 °C with a
hydrogen pickup of 86% [15].

10
Figure 2: Zr-H phase diagram. Early onset of the δ-phase along the α-pathway
results in a dramatically increased pulverization rate [13].
2.1.2 Uranium Hydride Formation
Uranium is also known to form a brittle hydride; a property which is commonly
used in the creation of uranium metal powder through a hydride/dehydride process. A
hydride/dehydride process is even more effective for the production of metallic uranium
powder than for the production of metallic zirconium powder. This is because of the
very low solubility of hydrogen in uranium metal, which results in an early formation of
the brittle uranium hydride phase. While this hydride phase has been shown to naturally
spall off of bulk uranium metal, mechanical action applied to the material during hydride
formation would undoubtedly increase the rate of pulverization [13,18].
11
It has been demonstrated by Garnetti and Sames that the ideal temperature for
pulverization of uranium via hydride formation is 233 °C [18]. This is in agreement
with previously published rate information by Chiotti and Rogers [19]. Garnetti and
Sames also demonstrated that uranium hydride powder can be easily converted to pure
uranium metal by heating said powder under vacuum [18]. Uranium hydride begins the
conversion to metallic uranium at temperatures of ~430 °C at atmospheric pressures.
This conversion can be accelerated through heating of the material under dynamic
vacuum and was found to take less than 30 minutes for nominally complete conversion
to uranium metal at temperatures as low as 325 °C. This suggests that the material can
be dehydrided during a preheating/purge process prior to introducing the material to the
chlorination vessel which will likely be operated at ~330 °C.
2.1.3 Uranium-Zirconium Hydride Pulverization Process
For this research, it was postulated that the reaction rate for hydride formation in
U-xZr alloys will more closely resemble that of pure uranium [20]. This would result in
a process which can be operated at lower temperatures, similar to those encountered
during uranium hydride formation processes. However, this assumption is highly
dependent on the microstructure of the uranium-zirconium alloy being processed.
Ideally, the pulverization process will not require the formation of zirconium hydride,
but will be driven by the ease of uranium hydride formation. This is where the
microstructure of the U-xZr alloy being processed is crucial.
In order for this proposed hydride pulverization process to be useful in a coupled
hydride-dehydride-chlorination process, the material does not need to be fully converted

12
to hydride. The material only needs to be reduced to particle sizes small enough to allow
near-instantaneous chloride formation once introduced into the chlorination vessel. This
suggests that U-Zr alloys can be heat treated to produce microstructures which are ideal
for hydride pulverization.
2.2 Halide Processing of Group-4 Elements
Processes which utilize halide volatilization of group-4 (e.g., Ti, Zr, and Hf)
elements for the purpose of purification or separation have been used for well over 100
years [21,22]. The process most directly analogous to this work is the Kroll process,
which is used industrially for the production of ductile zirconium and titanium [23,24].
This process utilizes the concept of chloride volatility for the formation of purified
metallic titanium or zirconium.
The enabling characteristic of halide processing begins with the extreme
reactivity of the halogens when in their elemental form (e.g., F, Cl, Br, and I). This
reactivity is capable of separating the group-IV elements even from their stable,
naturally-occurring minerals. The second enabling characteristic of halide processing is
that the group-4 halides are volatile at relatively modest temperatures. All halide
processing techniques of the group-4 species take advantage of these two properties.
The material of interest is halogenated to form a volatile halide which is separated from
its feed material through volatilization.
There have been numerous methods developed since the late 18th century which
use halide processing for the purification of materials of all types. An exhaustive list of

13
halide methods is not practical here, so a review of selected processes deemed to be most
relevant is presented in the following sections.
2.2.1 Chloride Processing
Chlorine was selected as the process halogen for this present study for several
reasons. First, the proposed process is intended to be coupled to a hydride/dehydride
process similar to the methods described in Section 2.1. The temperatures most likely
required to hydride and dehydride a uranium-zirconium alloy (225-400 °C) are very near
the temperatures needed to form and volatilize zirconium tetrachloride (331 °C). While
this similarity in processing temperature may not be a prerequisite for a
hydride/halogenation process to be successful, it could simplify the design of a coupled
hydride-pulverization/chlorination system. The second advantage in using chlorine as
the halogenating agent is that it is less reactive than fluorine, yet maintains the ability to
react quickly with materials to form volatile chlorides. The construction materials for a
chlorination system may also be composed of less expensive materials when compared
to a fluorination system. Perhaps the most important advantage is the extensive
industrial experience that has been gathered over the years in the production of titanium
and zirconium sponge.
The benefits of this industrial experience with chloride volatilization of group-4
elements will be exceptionally useful if the reactions studied in Section 4 are ever
reduced to practice in an industrial process and scaled up for practical use. If a new
reprocessing technology is to be implemented, there is a strong advantage to basing this

14
new technology on industrial systems that currently exist with decades of industrial-scale
operation. The Kroll process is an example of such a system [22,24].
Chloride volatility of titanium was first used to produce ductile metal with the
development of the Hunter process in 1910. This process utilized the concept of
chloride volatility and distillation of titanium-containing ores. The distilled chlorides
were then reduced with liquid sodium, resulting in a purified titanium metal [23]. The
Kroll process improved upon the Hunter process and can be credited with the
widespread availability of relatively inexpensive, high purity titanium, zirconium, and
hafnium [23]. This process also involves chloride volatilization of selected elements
from their respective ores in order to separate and purify them. These chlorides are
separated via distillation and reduced using liquid magnesium, instead of liquid sodium,
resulting in a highly purified metal sponge [1]. The feed materials for the Kroll process
are the naturally occurring ores of the element of interest. The most common mineral
used in the production of titanium metal is rutile (TiO2) [25]. This material is fluidized
in the presence of both chlorine and carbon to form the volatile tetrachloride via
(1) ( ) → ( ) ( )
Likewise, zirconium metal is typically produced by the carbothermic processing of
zircon (ZrSiO4) [25] to form the volatile tetrachloride as shown in
(2) ( ) → ( ) ( ) ( )
Both TiCl4 and ZrCl4 may then be reduced using liquid magnesium (as well as
the SiCl4), which typically results in the formation of Ti or Zr metal sponge and MgCl2.

15
The magnesium chloride is separated by volatile distillation and the metal is collected.
This process is shown in Equation 3 where “X” represents any Group-4 species. This
magnesium reduction is the heart of the Kroll process [1].
(3) ( ) ( ) → ( )
The Kroll process produces high purity, ductile metal which is fully suited for
use in most applications. However, upon its initial implementation, the Kroll process
was incapable of producing reactor-grade zirconium due to issues with ductility and the
nuclear industry’s high standards for quality control [1]. For this reason, the already
purified metal sponge had to be further processed into ultra-high purity zirconium using
the van Arkel crystal-bar process [1,26]. The van Arkel process will be discussed in
Section 2.2.4.
2.2.2 Fluoride Processing
Fluoride volatility has been used in nuclear applications since the birth of the
nuclear industry during World War 2 [27-29]. Perhaps the most visible use is in the
formation of UF6 for uranium enrichment. Production of UF6 begins with the formation
of UF4. Uranium tetrafluoride for use in UF6 fabrication is typically produced through
hydrofluorination of the oxides of uranium as shown in Equations 4 through 6.
Following the formation of UF4, this material is further reacted with elemental fluorine
resulting in the highly volatile UF6 by way of Equation 7. The hexafluoride can then be
distilled from the feed material to be used in various enrichment processes [11,30]. The

16
distillation of uranium hexafluoride is an example of halide volatility being used to
purify a feed material.
(4) ( ) → ( ) ( )
(5) ( ) → ( ) ( )
(6) ( ) → ( ) ( ) ( )
(7) ( ) → ( )
Instead of being used in uranium hexafluoride production, uranium tetrafluoride
is often reduced to metallic uranium through reduction using liquid magnesium
following Equation 8 [30]. This is directly analogous to the Kroll process discussed in
Section 2.2.1, and is very similar to the reduction process which will likely be used in
the chloride process being considered in this dissertation.
(8) →
Fluoride volatility has been considered for reprocessing applications [31-37].
There are potentially promising applications for fluoride volatilization processes;
however, fluorine may not be the best halogen for processing the uranium-zirconium
alloy system. Fluoride processing is most useful when the materials to be reacted are in
such a chemically stable form that an extremely reactive species, such as fluorine, is
required. This is not the case when the starting material is metallic uranium and

17
zirconium. The extreme reactivity of fluorine introduces equipment design challenges to
the implementation of a fluoride volatilization process.
2.2.3 Bromide Processing
While not the topic of this research, selective volatilization of group-4 metals
from uranium alloys through formation of their bromides has potential. Many of the
processing methods suited for chloride volatilization are also applicable for bromide
processing. This includes the carbothermic reduction and volatilization of group-4
metals from their respective ores, as well as a process directly analogous to the Kroll
process [38].
It may be possible that a process similar to that which is being presented in this
research can be created using elemental bromine instead of elemental chlorine. The use
of bromine has some advantages upon first inspection. The most obvious advantage to
using bromine when compared to either fluorine or chlorine is that it is much less
corrosive than either of its cousins. This would allow a bromide system to be
constructed using less expensive materials. However, the decreased reactivity of
bromine could result in slower reactions between the elemental bromine and the species
to be volatilized. Bromide volatilization is intriguing from a theoretical standpoint;
however, the advantage of having facilities which utilize chloride volatilization presently
in operation and with decades of experience is hard to ignore. It is primarily for this
reason that bromide volatilization was not pursued here and will not be discussed further
other than to say that it is a promising concept that requires further research.

18
2.2.4 Iodide Processing
The final halogen to be discussed is iodine. Elemental iodine and its
corresponding group-4 halides are perhaps the most unique among the four halogens.
Carbothermic reduction of the oxides of titanium or zirconium, while possible with the
other three halogens, cannot be done using iodine. This is a result of the much lower
comparative reactivity of elemental iodine. Iodine should not be considered for, and is
not suited for, any process resembling the Kroll process. That being said, iodide
volatility has been used industrially for the production of certain Ultra High Purity
(UHP) metals. These processes take advantage of the low stability of many iodides at
high temperatures and low pressures. The van Arkel process is the most noteworthy
process which utilizes iodide volatility.
The van Arkel process has been used industrially to create UHP titanium,
zirconium, hafnium, vanadium, thorium, protactinium, etc. [39,40]. This industrial
process relies on a semi-pure feed material to produce a truly UHP metal product. To
produce reactor-grade zirconium, a reaction vessel is loaded with zirconium metal
sponge created from the Kroll process. The vessel is then baked out under vacuum
before pure, elemental iodine is introduced. The iodine is allowed to react with the
zirconium at relatively low temperatures under reduced pressure forming the volatile
ZrI4. The zirconium tetraiodide is then allowed to naturally pass over a resistively
heated hot wire (~1350 °C) where the molecule is decomposed, resulting in a
continuously growing UHP metal crystal bar. The liberated iodine is then able to react
with more impure metal, thus completing the cycle as seen in Figure 3 [1,39]. Examples

19
of crystal-bar produced using this method are shown in Figure 4. For the nuclear
industry, the van Arkel process was later superseded by improvements in the Kroll
process for the production of high-ductility, high-purity zirconium.
Figure 3: Zirconium crystal bar process flow diagram.
20
Figure 4: Examples of crystal bar produced using the iodide volatilization process.
(A) Titanium. (B) Zirconium. (C) Hafnium. (D) Vanadium.
2.2.5 Uranium-Zirconium Chloride Volatilization Process
The ability of chlorine to “crack” zirconium-containing materials in order to form
the volatile tetrachloride has been demonstrated industrially and is well-known. This
property of chlorine is so strong that it is routinely used to break the bonds of the highly
stable mineral zircon. The research being presented in this dissertation depends on
chlorine being able to volatilize zirconium from a uranium-zirconium alloy; a feat which
is far less challenging for chlorine than that which is accomplished on a regular basis
when converting zircon to metallic zirconium, as seen in Table 1.
With the pulverization of the uranium-zirconium alloy prior to chlorination,
formation of the volatile zirconium tetrachloride becomes almost trivial. In fact, this
reaction should occur so quickly that a hypothetical facility will likely be more
concerned with heat removal during chlorination than with supplying process heat. The

21
result is a process which will likely be capable of a high conversion rate when compared
to the chlorination of bulk material.

22
3. EXPERIMENTAL DESIGN AND PROCEDURE
3.1 Experimental Design
One of the greatest challenges encountered in the development of this chloride
volatilization system was in designing a system capable of surviving an environment
containing hot chlorine gas. Not only must the system be able to survive this harsh
environment, but it also must be designed in such a way that useful and reliable data can
be extracted. The following sections describe the system details for each of the
experimental configurations that were used to explore the chlorination process.
3.1.1 System 1 - All-Metal System
The initial system designs were assembled using all metal components, which
turned out to be an incorrect methodology. All-metal systems do have clear advantages
over glass and ceramic systems for several reasons. The first is that the majority of the
metal components that may be used for assembly are standard parts which are relatively
inexpensive and can be readily purchased from several manufacturers. This allows for
rapid construction, deployment, and alteration of an experimental system, all of which
are useful in designing a system whose purpose is to get preliminary data. Another
advantage of an all-metal system is that it can operate at high pressures and relatively
high temperatures, allowing for a wide range of variables to be studied within a single
system.
The first system was designed to operate with a flowing Ar-Cl2 mixture into a
heated alloy-625 reaction zone. The argon and chlorine were supplied from

23
independent, pure gas supplies. Their respective flow rates were controlled using
separate mass flow controllers prior to their mixture and introduction into the reaction
zone. The argon was preheated by passing it through a copper coil of tubing which
wrapped around an alloy-625 chlorine preheating coil. A 0.75 inch alloy-625 tube was
used as the reaction zone and it was nested inside of both the alloy 625 chlorine
preheater and the copper argon preheater. This system is depicted in Figure 5. The
gasses were allowed to mix just prior to entering the reaction zone, where the mixture
would flow over the sample and exit the heated zone to then be scrubbed for the removal
of chlorine and chlorides.
This system underwent preliminary testing designed to determine the suitability
of the materials involved for this application, including the SS304 Swagelok fittings. It
was soon discovered that SS304, while suitable at lower temperatures in a chlorine
atmosphere, is not suitable at elevated temperatures. Once operations began at elevated
temperatures (~300 °C), it was noted that SS304 is rapidly and exothermically attacked
by hot chlorine when the T-fitting connecting the preheated argon, chlorine, and reaction
zone began glowing bright orange and ignited. The threshold temperature of this
reaction was not determined because this particular design was never used again for
safety reasons as well as for the fact that the system was completely destroyed.

24
Figure 5: Schematic diagram of the initial all-metal system constructed using the
Ni-based Alloy-625.
While this system may have been a technical failure, many lessons were learned.
The most obvious was an appreciation by the operator for the extreme reactivity of hot
elemental chlorine gas. The gas rapidly volatilized the iron in the SS304, and would
have continued destroying the rest of the system if the chlorine supply had not been
immediately turned off. (It was at this point that decladding of iron based steel clad
nuclear fuel was seriously considered as a potential application of this process.) It
naturally followed that iron-based steels should never be used, under any circumstances,
in a chlorine system at elevated temperatures. In spite of the obvious incompatibility of

25
iron-based steels in these systems, it was observed that the alloy-625 reaction zone
remained totally intact, even though this material saw a much higher temperature. It was
concluded that nickel-based alloys may be considered as potential materials to be used in
this chloride process.
The concept of mixing the reaction gas with a preheated carrier gas was
abandoned after this initial system failure. It proved too challenging to verify exact gas
flow rates. This also removed the carrier-gas to reaction-gas ratio from the list of
variables which must be studied, making a more in depth study of some of the more
intrinsic variables possible. This was acceptable because if this system is to be scaled up
to an industrial system, the desired carrier-gas to reaction-gas ratio will likely be largely
dependent on the specific equipment and process being performed.
3.1.2 System 2 - Long Glass Tube
Following the failure of the all-metal system, a series of tests were performed to
qualitatively study the effects of hot chlorine on various materials. This system
consisted of a three foot long, one inch diameter borosilicate glass tube connected to a
pure chlorine gas supply with PTFE tubing and fittings, shown in Figure 6. The exhaust
was passed through two glass water-filled vessels to filter the chlorine exhaust. The
motivation behind this setup was that the glass tube would be slowly filled with a liquid
capable of dissolving the chlorides, such as hydrochloric acid, to capture the volatilized
material after the reaction was completed by pressurizing the glass vessels. This would
result in two product streams. The first being the volatilized material in the fluid, the
second being the non-volatilized material, which could then be collected separately. At
26
the time, it was believed that this material would need to be collected prior to its
exposure to air. This ended up not being the case, as the chlorides are more stable in air
than initially anticipated.
As stated previously, a select group of materials were chosen to have their
behavior qualitatively studied. The purpose was to determine appropriate materials for
construction of the next systems. The materials tested include crystal-bar zirconium,
zirconium powder, Zircaloy-4, zirconium hydride, iron, SS316, alloy 625, copper, and
molybdenum. It was found that all materials containing zirconium or iron were rapidly
destroyed through volatilization. The copper was seen to react with hot chlorine, but this
reaction appeared to proceed slowly, and may have been limited to a surface reaction.
The molybdenum, graphite, and alloy-625 all appeared to remain totally intact.
However, it was later found conclusively in Section 3.1.3 that molybdenum is not
suitable for systems containing hot chlorine.

27
Figure 6: Schematic diagram of the second experimental system constructed using
a long glass tube.
These tests showed that the only reasonable materials suitable for construction of
the heated reaction zone are borosilicate glass, oxides such as alumina, alloy-625, and
molybdenum. (As stated previously, molybdenum was incorrectly identified as being
compatible.) This information put boundaries on the design requirements of the final

28
system. A glass or oxide system, while relatively inexpensive, is not suited for
pressurization since these materials are brittle and can fail dramatically. Therefore,
pressure could not be studied as a variable in a glass or oxide system. A system
constructed of alloy-625 would likely function well, but components made from this
material were prohibitively expensive for this study. Molybdenum was also considered
as unreasonable as a construction material due to its cost and machinability.
In spite of the challenges which were identified here, a very promising result was
obtained. It was observed that the chlorine reaction rate of bulk zirconium metal and
zirconium metal powder were significantly different. The chlorine reaction with bulk
zirconium metal took several minutes to complete, while the reaction with zirconium
powder could be considered to be instantaneous. The reaction was so fast in fact, that
the 1/8 inch thick glass tube was deformed beyond repair as a result of the rapid
exothermic reaction of chlorine with zirconium powder. This was a conclusive
demonstration of the potential advantages of a pulverization method such as hydriding
prior to its chlorination. This idea will be further supported in future sections.
3.1.3 System 3 - Hastelloy C-22 Vessel
A system was created for a separate research project involving a similar zirconium
iodide volatilization experiment. This system was capable of surviving repeated long-
term exposures to elemental iodine at temperatures up to 500 °C. This custom vessel
was correctly believed to be capable of surviving the harsh conditions of hot elemental
chlorine. This was further supported by the results of the previous tests which indicated
that an alloy related to C-22, alloy-625, is compatible with hot elemental chlorine. The
29
head of the C-22 vessel contained an electrical feed-through with molybdenum
electrodes. The previous tests performed in a long glass tube seemed to show that
molybdenum was compatible with chlorine, but tests in this C-22 system decisively
proved otherwise. It was found that molybdenum would react with chlorine to form a
black liquid even at modest temperatures. This black liquid deposited itself over nearly
every surface within the vessel in the form of splattered drops. In spite of the problems
related to molybdenum chloride formation, information which proved to be very useful
was gathered using this system.
This large C-22 vessel was heated from the bottom only, using a high-temperature
hot-plate. The reason for this orientation is because it was considered necessary to
physically separate the volatilized phase from the non-volatilized phase, and heating
from the bottom would set up distinct hot and cold zones. A zirconium sample was
placed on the heated bottom surface throughout each test. Chlorine was introduced, and
any material which volatilized would condense on the walls of the vessel where the
temperature was below the volatilization temperature of 331 °C. This was observed as a
ring of zirconium chloride being deposited above an area which was totally void of all
volatiles. This was the first full demonstration during this project that chlorine could be
used to controllably volatilize and deposit zirconium, that the chlorides could then be
condensed in a controlled predictable manner, and that both of these phases could be
separately collected.
A non-flowing system was also considered as a result of this series of tests. This
arose due to the large size of the C-22 vessel. It was reasonable to regulate the pressure

30
of the system using the regulator connected to the gas cylinder, and allow gas to flow in
as it is consumed. The reason that a constant-pressure system was not considered before
was because of the requirement to predictably deposit the volatilized material in such a
way that both the volatilized material and non-volatilized material could be recovered
separately. A flowing system would transport all volatiles down-stream where they can
be collected. However, the large size of the C-22 vessel made this unnecessary, because
natural convection could produce the needed physical separation. Changing the system
from a flowing system to an isostatic system dramatically reduced the filtration
requirements of the exhaust gasses. Instead of being required to have an attached system
capable of continuous filtration, it only became necessary to filter the volume of gas
which was contained in the C-22 vessel. This greatly increased the level of experimental
control over the system. This constant-pressure method was found to be so far superior
to a flowing system that it was used throughout the remaining system iterations.
In spite of its advantages, this large C-22 system had some drawbacks. The most
significant drawback was its size. The large thermal mass of the system greatly reduced
the rate at which experiments could be performed. The system would take several hours
to reach temperature before an experiment could begin, and it would have to cool
overnight before the vessel could be opened. This is not just an inconvenience.
Uranium and zirconium are both very reactive metals, and maintaining experimental
accuracy is difficult if these highly reactive metals are subjected to elevated
temperatures for several hours prior to the reaction even beginning. Another
disadvantage with the C-22 system again has to do with its large size. Collection of the

31
non-volatile material is rather straightforward, but collection of the volatile material
proved to be difficult for several reasons. First, the entire vessel is to be thoroughly
washed out, and all of this liquid collected for analysis. This proved to be very difficult
simply because of the awkwardness in physically handling such a massive object. This
would have been compounded further in later experiments if radioactive material was
introduced. Even with the system cleaned out, one then has to deal with the large
volume of liquid which results from this cleansing. The sheer size of this system was
prohibitive and a smaller system was considered.
3.1.4 System 4 - Narrow Glass Tube
A small reusable reaction vessel was created using a 3/8 inch glass tube which
was flame-sealed at one end. The purpose of this system was to gather data needed for
proper experimental design so that a final system could be constructed. This system
combined the lessons learned from the previous designs, resulting in a system which was
capable of gathering preliminary data.
The glass reaction vessel was designed to be partially inserted into a custom-made
aluminum block which was heated using cartridge heaters, resulting in a reaction vessel
with both a heated and non-heated zone. As was seen in the C-22 vessel, the volatilized
chlorides would deposit on a cooler surface through natural convection, and this effect
was taken advantage of in the design of the narrow glass tube system. This is the system
that was used in the “ZRT” series, the results of which are presented in Section 4.1. It
should be noted that the experiments conducted for the “ZRT” series were oriented in a
vertical position. All other experimental series were oriented in a horizontal position.

32
The horizontal position was determined to be ideal for these experiments because it
prevented volatilized material from falling back into the heated zone during the
experiments. It was found that this system was capable of achieving the volatilization
needed, but would be improved with a larger diameter glass tube.
3.1.5 System 5 - Glass Test-Tube Systems
The glass test-tube system took several forms depending on the experiment being
conducted. It began as a glass test-tube containing an inner glass tube used for
introducing fresh chlorine gas directly to the sample. It was quickly found that this inner
glass tube was unnecessary because the system would be operated in a constant pressure
condition. This made direct application of chlorine unnecessary. The presence of the
inner glass tube was seen to inhibit the volatilization process because it clogged up the
deposition zone.
The test-tube system was initially constructed to obtain volatilization data for two
materials simultaneously. The system was arranged so that two test-tubes could be
placed horizontally inside of the heated aluminum block with the bottoms of the test
tubes butted against a thermocouple, as shown in Figure 7. The advantage of this
double-test-tube arrangement is that all variables between samples are eliminated
allowing for a direct comparison between materials. This orientation was used for the
“UT” series discussed in Section 4.2.

33
Figure 7: Schematic diagram of the horizontal two-test-tube system assembled for
the UT chlorination test series. (Insulation not shown.)
Following the success of the double-test-tube design, a four-test-tube design was
constructed as shown in Figure 8. This design contained additional valves which
allowed individual samples to be isolated from one another. The advantage of this
design is that it allows time information to be obtained for four samples simultaneously
while holding all variables constant among samples in each batch. This arrangement
was used for the “U50Zr” and “Zr” series described in Sections 4.3 and 4.4.
34
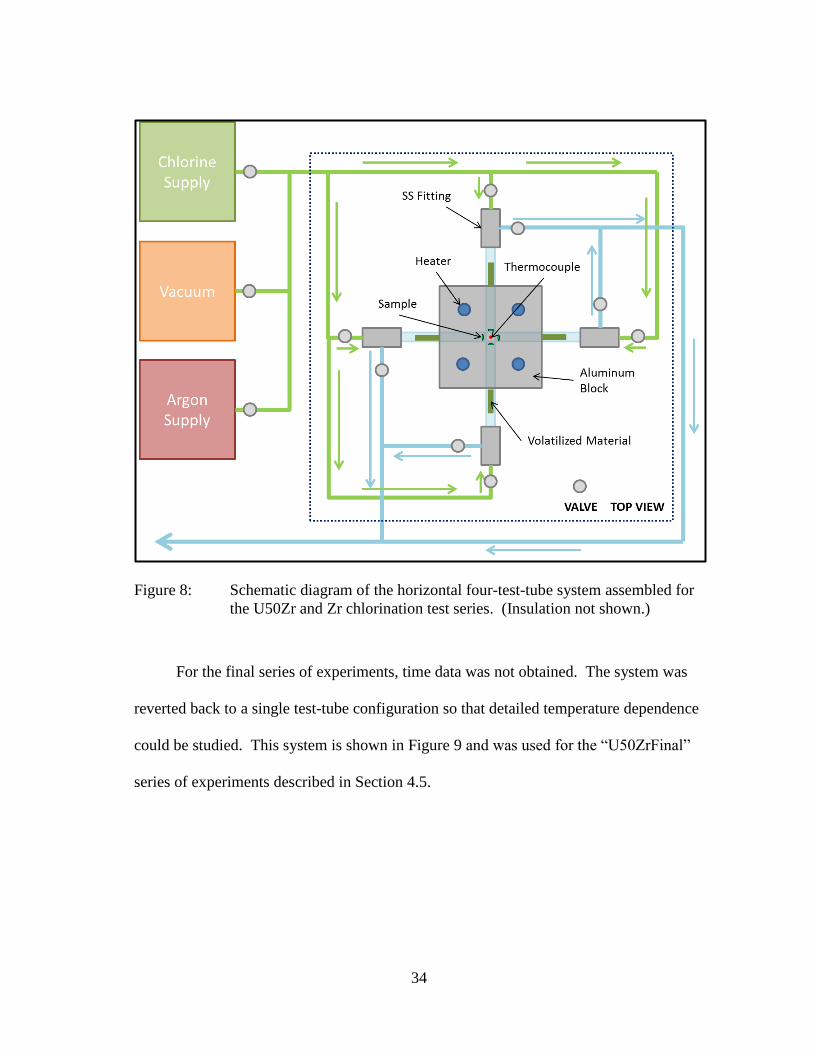
Figure 8: Schematic diagram of the horizontal four-test-tube system assembled for
the U50Zr and Zr chlorination test series. (Insulation not shown.)
For the final series of experiments, time data was not obtained. The system was
reverted back to a single test-tube configuration so that detailed temperature dependence
could be studied. This system is shown in Figure 9 and was used for the “U50ZrFinal”
series of experiments described in Section 4.5.

35
Figure 9: Schematic diagram of the final horizontal one-test-tube system assembled
for the U50ZrFinal chlorination test series. (Insulation not shown.)
3.2 Experimental Procedure
As noted in Section 3.1, five experiment configurations were used in the evolution
of these processing experiments. The first three configurations (Sections 3.1.1 to 3.1.3)
yielded important information, but were not usable for systematic studies. The last two
configurations (Sections 3.1.4 and 3.1.5) were used for a sequence of five systematic
studies (also noted above) with similar, yet distinct, procedures. The following sections

36
describe the procedures employed for each of the five systematic studies: 1) Zirconium
Test “ZRT” (Section 3.2.1), 2) Uranium Test “UT” (Section 3.2.2), 3) Uranium-
50Zirconium “U50Zr” (Section 3.2.3), 4) Zirconium “Zr” (Section 3.2.4), and 5)
Uranium-50Zirconium Final “U50ZrFinal” (Section 3.2.5).
The reaction vessels used for the individual tests in each of these series were
borosilicate glass tubes contained within a heated aluminum block. All experiments were
operated in a static constant-pressure condition. The chlorination reaction was allowed
to proceed on solid metal samples, unless otherwise noted, and the volatilized chloride
material was deposited on the cold region of the reaction vessel. However, there were
some differences among these series. Specific procedures for each of these series are
summarized and presented below.
3.2.1 ZRT Series
The ZRT series was carried out using the apparatus described in Section 3.1.4.
The purpose was to obtain preliminary data on the volatilization of zirconium in the
presence of chlorine. The narrow glass tube reaction vessel system was connected to the
gas supply system using stainless steel (SS304) fittings with fluoroelastomer O-ring
seals. The reaction vessel was heated by inserting it into a heated aluminum cylinder.
The aluminum cylinder contained a K-type thermocouple at its midpoint. This allowed
the temperature to be measured at the bottom of the reaction vessel where the sample
was located. This system is shown in Figure 10. The samples were prepared from
crystal-bar zirconium disks which had been cut into nine pieces. Each disk had a
thickness of roughly one millimeter.

37
Figure 10: Schematic of narrow glass tube system used for the ZRT experiments.

38
3.2.1.1 ZRT Procedure
Each test began by recording the mass of the sample to be processed. The sample
was loaded into the vessel which was then evacuated using a dry-scroll pump. The
vessel was then backfilled with argon. After this purge process was repeated three
times, the reaction vessel was pressurized with 14 psig argon. The reaction vessel was
then inserted into the preheated aluminum heating block where it was allowed to come
to thermal equilibrium at the desired temperature. It was then evacuated using the dry-
scroll pump, and the vacuum pressure and sample temperature were recorded. The
system was then immediately filled with elemental chlorine gas to the required pressure
and the reaction was allowed to proceed. Once the desired reaction time had elapsed, the
chlorine gas was shut off, argon gas flow began, and the reaction vessel was removed
from the heated zone. The system was cooled under flowing argon until it reached room
temperature. The cool-down time was approximately 10 minutes.
3.2.1.2 ZRT Sample Collection
The samples were collected simply by separating the glass reaction vessel from
the SS304 fitting. The system was thoroughly washed with ethanol in order to remove
all soluble chlorides and any loose material. In the event of volatilized material being
stuck to the surface of the narrow tube, which happened often, the tube would be
partially filled with ethanol and placed into a sonicator to dissolve all soluble material
and to dislodge any insoluble material.

39
3.2.1.3 ZRT Sample Analysis
The soluble material was physically separated from the insoluble material. The
intact solid zirconium left over from the chlorination reaction was weighed using a
Mettler Toledo AB204-S scale (0.0001 grams). This enabled the calculation of the
measured mass change corresponding to the amount of material which was converted to
chloride. Using this method, it was possible to perform a preliminary study of mass
change as a function of time, pressure, and temperature, the results of which is presented
in Section 4.1. The information was used to guide future system and experimental
design.
3.2.2 Uranium Test (UT) Series
The UT series was the first test series carried out using the apparatus described in
Section 3.1.5. The purpose was to compare the relative volatilization of the U-50Zr alloy
with either uranium or zirconium. A double-test-tube system was used so that two
samples could simultaneously be reacted under conditions which would be identical
between the two samples, as shown in Figure 7. Experiments UT-1, UT-2, and UT-5
studied the difference in volatilization between U-50Zr and zirconium metal, while
experiments UT-3 and UT-4 studied the difference in volatilization between U-50Zr and
uranium metal.
3.2.2.1 UT Procedure
The step-by-step procedure for the UT series was identical to that for the ZRT
series. Each test began by recording the mass of the samples to be processed. The
vessels were then evacuated using a dry-scroll pump and backfilled with argon. This

40
process was repeated three times and then the reaction vessels were pressurized with 14
psig argon. The reaction vessels were then inserted into the preheated aluminum heating
block, and the system was allowed to come to thermal equilibrium at the desired
temperature. It was then evacuated again using the dry-scroll pump, and the pressure
and sample temperature were recorded. The system was then filled with elemental
chlorine gas to the desired pressure and the reaction was allowed to proceed. Once the
desired reaction time had elapsed, the chlorine gas was shut off, argon gas flow began,
and the reaction vessel was removed from the heated zone. The system was allowed to
cool under flowing argon until it reached room temperature. The cool-down time was
also approximately 10 minutes.
3.2.2.2 UT Sample Collection
The samples were collected in the same way as in the ZRT series. The glass
reaction vessels were both separated from the SS304 fittings. The system was then
thoroughly washed with ethanol in order to remove all soluble chlorides as well as any
loose material. In the event of material being stuck to the surface of the test tube, the
tube would be partially filled with ethanol and placed into a sonicator to dissolve all
material. This method also dislodged any intact metal from the walls of the vessel.
3.2.2.3 UT Sample Analysis
The product materials from this series were analyzed in a similar manner as the
ZRT series. The intact solid zirconium, uranium, or U-50Zr left over from the
chlorination reaction was weighed using a high-precision scale. This resulted in a
known mass change corresponding to the amount of material which was converted to

41
chloride. However, the qualitative comparison between the U-50Zr alloy with pure
zirconium or pure uranium was the most useful information gathered in this series. This
comparison was largely visual with little meaningful quantitative results.
3.2.3 U50Zr Series
The U50Zr series was designed to enable the performance of a rate study on the
volatilization of U-50Zr alloys. The modified four-sample system described in Sect.
3.1.5 was created. An important difference between the U50Zr series and the UT series
was that each of the four reaction vessels was able to be isolated from the rest of the
system using a system of valves; thus, samples could be selectively isolated and
removed from the system at different times. This system is depicted in Figure 8.
3.2.3.1 U50Zr Procedure
Tests U50Zr1-U50Zr5 began by recording the mass of the U-50Zr samples to be
processed. The vessels were evacuated using a dry-scroll pump and then backfilled with
argon. This process was repeated three times and then the reaction vessels were
pressurized with 14 psig argon. The reaction vessels were then inserted into the
preheated aluminum heating block, and the system was allowed to come to thermal
equilibrium at the desired temperature. It was then evacuated using the dry scroll pump,
and the vacuum pressure and sample temperature were recorded. The system was then
filled with chlorine gas to the desired pressure and the reaction was allowed to proceed.
This series deviates from the previous two series in that the inlet and outlet valves for
each independent reaction vessel were closed once the sample of interest had reacted for
the desired amount of time. The reaction times were 15, 30, 60, and 120 minutes. After

42
each time-step, a sample would be isolated and removed from the heated zone. It should
be noted that the cooling process took place in the presence of the gasses that were in the
reaction vessel prior to isolation instead of cooling under flowing argon as the previous
experiments.
Test U50Zr6 was intended to be performed at 250 °C, but it was observed that
volatilization would not occur at this low temperature. The temperature was slowly
increased so that the onset of volatilization could be recorded. The temperature as a
function of time was recorded as was the temperature at which volatilization was first
observed. The single sample was then allowed to react for 100 minutes. Test U50Zr7
was designed to more precisely study the onset of volatilization. The single sample was
inserted into the reaction vessel in the same way as tests U50Zr1-U50Zr5. The
temperature was then increased more slowly than in test U50Zr6, and the volatilization
temperature was recorded. The temperature was then increased to 300 °C and the
sample was allowed to react for a 90 minutes.
3.2.3.2 U50Zr Sample Collection
The samples in this series were collected in a different manner compared to the
previous experimental series noted above. As stated previously, material that becomes
volatile during the chloride formation reaction deposits on the region of the reaction
vessel which was not heated. This resulted in a separation of the volatile and non-
volatile species. It then became necessary to separate these two materials which were
both deposited within the same test tube. A method was developed that allowed the test
tube to be cleanly fractured in-between the volatile and non-volatile materials, resulting

43
in 100% segregation of these two types of materials. This method is illustrated in Figure
11. The tube was first scored with a file at a location between the volatilized and non-
volatilized material. A heated glass rod was applied at this location, fracturing the test
tube; thus, providing a physical separation of the two product streams.
Once this physical separation was complete, the respective chlorides were washed
and collected from the reaction vessel using ethanol. The non-volatile species were
dissolved from the heated end of the vessel using ethanol, and any solid material was
separated by decanting. The mass of this solid material was then recorded. The
volatilized species were also collected from the test tube and SS304 fitting by washing
with ethanol. Any solids were then decanted away. The solids in this stream were most
likely composed of iron oxide, originating from the chlorine attacking the SS304 fitting.
This iron oxide is not relevant to the current study, so its removal and disposal was
appropriate.

44
Figure 11: Process to physically separate volatilized and non-volatilized material.
The ethanol containing dissolved chlorides from the two streams was gently
evaporated at ambient temperatures. The chlorides were left behind as a crystalline layer
at the bottom of glass beakers. The chlorine was removed from this material by adding
an excess of aqueous sodium hydroxide. The solids that resulted from the reaction with

45
sodium hydroxide were allowed to precipitate, and the aqueous phase was decanted.
The solids were then washed and decanted with deionized water until the water was no
longer basic. Ethanol (200 proof) was then added and decanted away until most of the
water was removed. The material was then dried further by adding and decanting away
pure acetone. The dry oxide material of both the volatile and non-volatile streams was
ground to a fine powder using a mortar and pestle, and collected for analysis.
3.2.3.3 U50Zr Sample Analysis
Several methods were considered for quantitative analysis of the two product
streams. The first method considered was ICP-MS. This method was eliminated for
three reasons. First, the samples must be acidified using, preferably, nitric acid. The
nobility of zirconium in nitric acid makes this impossible. Second, the samples must be
free of chlorides to be used in the available ICP-MS equipment. This eliminates
dissolving the zirconium in aqua regia as an option. Third, the presence of radioactive
material greatly limited the number of facilities willing to handle these materials.
Therefore, ICP-MS was removed from consideration.
The second method considered was Neutron Activation Analysis (NAA). This
method was demonstrated to be capable of providing a reasonably accurate mass
measurement of the amount of zirconium and uranium in a given sample. However, this
method has several drawbacks which made it unreasonable for this project. The first
drawback is that this is a destructive method of sample analysis. It therefore makes it
impossible to perform an analysis on the starting alloy prior to being processed with
chlorine. That is unless a small sample is taken from the starting alloy and analyzed

46
using NAA. At the time of these experiments, there was a lab-wide shortage of uranium,
so sacrificing any material for destructive analysis became unreasonable. The main
factor that eliminated NAA from consideration was the time that must pass between
performing an experiment and receiving results. The only way to make NAA
economically feasible was to analyze a large number of samples at a time. This meant
that a large number of experiments would have to be conducted before any feedback is
received. On top of this, NAA requires that samples sit for extended periods of time,
often weeks, for the radioactivity to subside to safe levels before an analysis can even be
performed. The result would have been an experiment with feedback times on the order
of many weeks. This would have made intelligent experimental design virtually
impossible within a reasonable timeframe. Therefore, NAA was not used.
The next technique considered was directly counting the gamma rays emitted
from uranium in the products. This could be used to determine the amount of uranium
contained within a given sample. The zirconium content could then be found by
subtracting the mass of uranium from the total mass of the sample. One problem with
this technique is that one would have to assume that each sample contains only uranium
and zirconium both in their stoichiometric oxide form, which may not be true. One must
also assume that the samples contain exclusively uranium and zirconium oxides; this
was ultimately proven to be far from true as shown in Section 4.3.2. Even if the samples
contained pure uranium and zirconium oxides, a detailed study on matrix correction
would have been required to account for gamma shielding as a function of U/Zr ratio.
Regardless of these shortcomings, a preliminary study of this technique was conducted.

47
During this study, it was decided that Wavelength Dispersive X-ray Spectroscopy
(WDS) would be used for all analysis in this project.
Wavelength Dispersive X-ray Spectroscopy was selected because of its ability to
quantify precise mass-fractions for all elemental species within a given sample. The
uranium/zirconium mass fraction obtained using this technique was used as an indicator
of the separation that occurred during the chloride volatilization process.
The oxide powders produced during the recovery of the volatilized and non-
volatilized product streams were each prepared for WDS analysis by pelletization. The
oxide powders were pressed between two polished hardened-steel cylinders. This
resulted in a reasonably dense and handleable powder compact with parallel surfaces
mirroring the polished surface of the hardened steel cylinders. Each powder compact
was secured onto a sample mount using carbon tape and was carbon coated prior to its
insertion into the WDS microprobe.
Analysis of the powder samples was primarily accomplished by performing a
wide-beam line scan1. This was done by moving a 20 micron beam up to 20 steps in one
direction so that a compositional average was obtained along this 400 micron line. This
procedure was used because many of the pressed-powder samples were heterogeneous
on the 20 micron scale. Therefore, analysis of single points would not produce results
representative of the powder as a whole. This line-scanning technique was found to
produce results which were reproducible and were considered to be reliable.
1 The microprobe was operated by Dr. Ray Guillemette, Research Associate Professor at Texas A&M’s
Department of Geology & Geophysics.

48
The alloys used in the U50Zr series were also analyzed prior to reaction using the
same line-scanning analytical technique. However, the preparation of this material
differed from the preparation method employed for producing a pressed-powder sample.
A uranium-zirconium alloy was cast and was then remelted to ensure homogeneity. This
casting was sectioned into slices with an approximate thickness of one millimeter.
These slices were mounted in epoxy and polished so that they could be non-destructively
characterized using the microprobe. Once these slices had been characterized, they were
removed from the epoxy and quartered for use in the four-reaction-vessel system.
3.2.4 Zirconium (Zr) Series
The Zr series was designed to study the rate of volatilization of pure zirconium
metal. The system used was identical to the system used in the U50Zr series and is
shown in Figure 8. A four-reaction-vessel system was used which allowed individual
reaction vessels to be isolated from the system as needed.
3.2.4.1 Procedure
The Zr series used several different materials and processing methods. Tests Zr-1
through Zr-7 began by recording the masses of the crystal-bar zirconium samples to be
processed. The vessels were evacuated using a dry-scroll pump and then backfilled with
argon. This process was repeated three times and then the reaction vessels were
pressurized with 14 psig argon. The reaction vessels were then inserted into the
preheated aluminum heating block, and the system was allowed to come to thermal
equilibrium at the desired temperature. It was then evacuated using the dry scroll pump,
and the vacuum pressure and sample temperature were recorded. The system was then

49
filled with chlorine gas to the desired pressure and the reaction was allowed to proceed.
The inlet and outlet valves for each independent reaction vessel were closed once the
sample of interest had reacted for the desired amount of time. The reaction times were
5, 10, 20, and 40 minutes, later changed to 5, 10, 15, and 20 minutes. After each time-
step, one sample would be isolated and removed from the heated zone. It should be
noted that the cooling process took place in the presence of the gasses that were in the
reaction vessel prior to isolation instead of flowing argon.
Test Zr8 was performed by reacting large sections of crystal-bar zirconium with
chlorine gas. The lengths and diameters of the four samples were measured prior to and
after the chlorination reaction. The use of large bulk samples was an attempt to gauge
the magnitude of the effect of surface area on the reaction rate. The system operation
was identical to tests Zr-1 to Zr-7.
Tests Zr-9 through Zr-20 were performed on four machined crystal-bar zirconium
samples of near identical starting diameters but with intentionally varied thicknesses,
and thus surface areas. The samples were created by machining a section of crystal-bar
zirconium into a cylindrical shape. Samples were created by sectioning this large
cylinder into smaller cylinders to the desired thickness in order to achieve the required
sample surface area. The geometric surface area was determined by taking five diameter
and thickness measurements of each of the four samples prior to and after the
chlorination reaction. These measurements were collected using a micrometer.
Tests Zr-17 and Zr-20 consisted of one of the four samples being composed of a
rectangular prism of Zircaloy-4. The dimensions of these prisms were found by taking

50
five measurements of each of the three lengths using a micrometer before and after the
chlorination reaction. The starting dimensions used for tests Zr-19 and Zr-20 were the
final dimensions for tests Zr-18 and Zr-19 respectively. The starting dimensions for the
Zircaloy-4 prism used in test Zr-20 was the final dimensions for test Zr-17. This
technique allowed samples to be reused between experiments.
Test Zr-14 deviated from the rest in this series in that the purpose of this test was
to find the temperature at which chloride volatilization begins for four different samples.
The four samples used in this test were a Zircaloy-4 tube, a zirconium crystal-bar disk,
zirconium metal powder, and crystal-bar zirconium turnings. The physical dimensions
and masses of the Zircaloy-4 tube and crystal-bar disk were recorded both before and
after the reaction. The masses were recorded for the zirconium powder and crystal-bar
zirconium turnings before the reaction.
Test Zr-14 began by a vacuum-purge process as described previously. The
vessels were then filled with chlorine, inserted into the aluminum block at room
temperature, and then heaters were then turned on. The temperature was allowed to
increase slowly and the temperature was recorded as a function of time. The
volatilization temperatures were recorded as soon as chloride deposition was observed
on the non-heated zone of the reaction vessels. The reaction rates of both the powder
and turnings were so high that these reaction vessels were isolated from the system
shortly after volatilization was observed for safety reasons. The system was shut off
after all four samples had begun to volatilize, and final dimension measurements were
collected for the crystal-bar disk.

51
3.2.4.2 Zr Sample Collection
The samples were collected in the same way as the ZRT series by separating the
glass reaction vessel from the SS304 fitting. The system was thoroughly washed with
ethanol in order to remove all soluble chlorides and any loose material. In the event of
material being stuck to the surface of the test tube, the tube would be partially filled with
ethanol and placed into a sonicator to dissolve all material. This method also dislodged
any intact metal from the walls of the vessel.
3.2.4.3 Zr Sample Analysis
The intact solid zirconium samples left over from the chlorination reaction were
weighed. This resulted in a known mass change corresponding to the amount of material
which was converted to chloride. Where relevant, the dimensions of the samples were
measured using a micrometer. The results of these measurements were used to study the
effect of surface area on reaction rate.
3.2.5 U50ZrFinal
The U50ZrFinal series was conducted using the system described in Section 3.1.5
and was designed as the definitive demonstration of the ability of the chloride
volatilization process to separate zirconium from a uranium-zirconium alloy. Each
experiment was conducted on a U-50Zr disk for 45 minutes at varying temperatures.
3.2.5.1 U50ZrFinal Procedure
The alloy samples for the U50ZrFinal tests were created from a melt-cast U-50Zr
alloy. This alloy was created by weighing out equal masses of uranium and crystal-bar
zirconium. The oxide layer was removed from the uranium through acid-washing in
52
concentrated nitric acid prior to its placement into the yttrium oxide crucible used to
contain the melt. The uranium and zirconium materials were placed into the yttrium
oxide crucible with the uranium on top. The uranium was placed on top because of its
lower melting point of 1132 °C compared to the melting point of zirconium which is
1855 °C. This has been shown to produce a more homogeneous final alloy because the
uranium wets the zirconium prior to the zirconium reaching its melting temperature.
The materials were melted in a high-temperature furnace under flowing argon at 1900
°C. After the initial melt, the alloy was removed by fracturing the crucible. Any
residual yttrium oxide was removed by sanding the surface of the alloy until all visual
indication of yttrium oxide was removed. Experience has shown that it is necessary to
remelt U-Zr alloys in order to achieve a fully homogeneous alloy. The alloy was
therefore placed upside-down from its previous orientation inside of a new yttrium oxide
crucible. The remelt was also performed in a high-temperature furnace under flowing
argon at 1900 °C.
The alloy was removed from the crucible by fracture, and any residual yttrium
oxide was removed by sanding the surface of the alloy. This final alloy was then cut
into slices with an approximate thickness of one millimeter using a diamond saw. These
alloys were not characterized by WDS analysis as was done with the U50Zr series,
because the results of the U50Zr series indicated that a melt-remelt process produced a
homogeneous alloy. It was also believed that the error in U/Zr ratio which may have
been introduced during the melt-remelt process is negligible for this series of tests.

53
Each experiment began by recording the mass of one of the slices. This sample
was placed into a reaction vessel which was then evacuated using a dry-scroll pump and
backfilled with argon. This vacuum/backfill process was repeated three times and then
the reaction vessel was filled with chlorine gas at 6 psig. The reaction vessel was then
inserted into the preheated aluminum heating block. This procedure differed from the
U50Zr series in that only one vessel was used at a time for the U50ZrFinal series, while
four vessels were used simultaneously for the U50Zr series. The samples for the U50Zr
series were also preheated before chlorine was introduced. The samples for the
U50ZrFinal series were heated under a chlorine atmosphere. The procedure was
changed because it was felt that heating the samples under vacuum or argon could
potentially affect the alloy due to oxygen and/or nitrogen contamination. This change
was further justified because the chlorination reaction shows an incubation period of
roughly a minute before any reaction begins. The incubation period was on the order of
that required for the sample to reach thermal equilibrium.
The samples were allowed to react with chlorine for 45 minutes at which time the
reaction vessel would be removed from the heating block, and argon gas flow was
immediately begun. The samples were allowed to cool to room temperature under
flowing argon before the vessel was opened and the samples collected.
3.2.5.2 U50ZrFinal Sample Collection
The post-test samples in this series were collected in exactly the same way as in
the U50Zr series. As before, material that became volatile during the chloride formation
reaction would deposit on the cold region of the reaction vessel. This resulted in a

54
separation of the volatile and non-volatile species. It then became necessary to separate
these two materials which were both deposited within the same test tube. The same
process which is shown in Figure 11 was used to separate the volatilized and non-
volatilized material. Once this physical separation was complete, the respective
chlorides were washed from the reaction vessel using ethanol. The non-volatile species
were dissolved in ethanol, and any solid material was separated by decanting. The mass
of this solid material was then recorded. The volatile species were also removed from
the test tube and SS304 fitting by washing with ethanol. Any solids were then separated
by decanting.
The ethanol containing dissolved chlorides from the two streams was then
allowed to evaporate. The chlorides would be left behind as a crystalline layer at the
bottom of the glass beakers. The chlorine was removed from this material by adding an
excess of aqueous sodium hydroxide. The solids that resulted from the reaction with
sodium hydroxide were allowed to precipitate out, and the aqueous phase was decanted
off. The solids would then be washed and decanted with deionized water until the water
was no longer basic. Ethanol (200 proof) was then added and decanted away until most
of the water was removed. The material was then dried further by adding and decanting
away pure acetone. The dry oxide material of both the volatile and non-volatile streams
was finally ground to a fine powder using a mortar and pestle, and collected for analysis.
This process is identical to that which was used in the U50Zr series.

55
3.2.5.3 U50ZrFinal Sample Analysis
The oxide powders which were produced during the recovery of the volatilized
and non-volatilized product streams were each prepared for WDS analysis by first
producing suitable samples. The oxide powder was pressed between two polished
hardened steel cylinders. This resulted in a pressed powder with a surface mirroring the
polished surface of the polished hardened steel cylinders. The pressed powder was
placed and secured onto a sample mount using carbon tape. The sample was then carbon
coated prior to its insertion into the WDS microprobe.
Analysis of the powder samples was accomplished by performing a line scan.
This was done by moving a 20 micron beam up to 20 steps in one direction so that a
compositional average was obtained along this 400 micron line. This line-scanning
technique was found to produce results which were reproducible and were believed to be
reliable. The sample preparation and analysis processes used for the U50ZrFinal series
were identical to the U50Zr series.

56
4. RESULTS
The following chapter will describe the results obtained from the five
experimental series conducted as a part of the research presented here. The first series,
the ZRT Series, gathered preliminary data on chlorination of pure zirconium to facilitate
the design of future series. The second series, the UT series, qualitatively compared the
volatilization behavior between zirconium and U-50Zr alloys, as well as between
uranium and U-50Zr alloys. The third series, the U50Zr Series, began to study the
selective volatilization of zirconium from U-50Zr alloys. The fourth series, the ZR
Series, studies the volatilization of zirconium in greater detail. The fifth and final series,
the U50ZrFinal Series, studied the ability of a chlorination process to separate zirconium
and uranium from U-50Zr alloys.
4.1 Preliminary Experiments: Temperature, Pressure, and Time (ZRT Series)
The experiments reported in this section (i.e., the ZRT series) were performed to
provide parametric data on chloride formation in pure crystal-bar zirconium. While Zr
to ZrCl4 volatilization was observed, it was not the focus of this series. The variables of
temperature, pressure, and time were systematically studied so that the final effective
experimental series (Section 4.5) could be designed and performed. This was
accomplished by measuring mass changes as a function of these variables. As described
in section 3.2.1, the mass change was measured by weighing the zirconium samples
prior to reacting with chlorine and then weighing the mass of the zirconium that was not
soluble in ethanol after the chlorine reaction. This provided a measure of the mass of

57
zirconium which had been transformed into chloride as a function of the variables of
interest. This data is presented below in Table 2.
Table 2: Summary of data from ZRT series.
Series Name mI (g) mF (g) T (C) Pressure (psi) Time (min)
Temp ZRT-1 0.1764 0.1308 588 14 60
Temp ZRT-2 0.2168 0.1797 450 14 60
Temp ZRT-3 0.1769 0.1043 350 14 60
Temp ZRT-4 0.1677 0.0636 237 14 60
Temp ZRT-5 0.1378 0.0482 286 14 60
Temp ZRT-6 0.1744 0.1363 400 14 60
Temp ZRT-7 0.2001 0.1612 531 14 60
Temp ZRT-8 0.1744 0.103 337 14 60
Temp ZRT-9 0.1749 0.1393 379 14 60
Pressure ZRT-10 0.1219 0.1008 371 14 30
Pressure ZRT-11 0.111 0.0871 376 28 30
Pressure ZRT-12 0.1208 0.0935 377 42 30
Pressure ZRT-13 0.1565 0.1124 372 56 30
Pressure ZRT-14 0.1571 0.14 368 2 30
Time ZRT-15 0.1446 0.1125 366 14 45
Time ZRT-16 0.1776 0.1638 363 14 15
Time ZRT-17 0.2213 0.194 364 14 35
Time ZRT-18 0.2225 0.1848 372 14 60
Time ZRT-19 0.2134 0.1656 368 14 75
Time ZRT-20 0.1245 0.0673 371 14 90
4.1.1 Impact of Temperature (ZRT-1 to ZRT-9)
This sequence of tests studied the effect of temperature on the chloride formation
rate. The focus was to study the difference in chloride formation at temperatures above
the zirconium tetrachloride volatilization temperature (331 °C) and below this
temperature. A summary plot showing the composite information from this study is

58
shown in Figure 12. The experiments in this sequence were conducted at 14 psig and
were reacted for 60 minutes.
Figure 12: Mass loss of zirconium metal after 60 minute reaction time vs.
temperature at 14 psig.
The information in Figure 12 shows a clear difference between behavior that
occurred above the volatilization temperature and that which occurred below this
temperature. It appears anomalous that the change in behavior occurs at a temperature
near ~350 °C, above the 331 °C volatilization temperature of ZrCl4. However, it is most
likely due to inaccurate temperature readings caused by poor contact between the vessel
59
and the heater-block. The result could be an observed temperature at the thermocouple
which was not necessarily equal to the sample temperature. Further, and more
important, these results are in opposition to expectations. It was expected that there
would be increased chloride formation (and mass loss) at temperatures above the 331 °C.
The data in Figure 12 show just the opposite. This seemingly contradictory behavior
may be explained by considering the geometry of the system. As described in section
3.1.4, these experiments were oriented vertically in a relatively narrow glass tube (Figure
10). This orientation enabled the volatilized material to solidify and fall back into the
heated area and onto the sample. This was observed visually as rain-like precipitation of
zirconium tetrachloride (speculated composition) within the reaction vessel. In addition
to the problems associated with vertical orientation, the narrowness of the reaction vessel
resulted in the deposition zone becoming quickly clogged with deposited material. This
closed the heated zone and established a reaction zone saturated with gaseous zirconium
tetrachloride which may have inhibited the formation of further chloride.
4.1.2 Impact of Pressure (ZRT-10 to ZRT-14)
The desired outcome of this sequence of experiments was to evaluate the need
for highly accurate pressure measurement. If the reaction rate remained relatively
invariant as a function of pressure, then crude pressure maintenance would be sufficient.
However, if the chloride formation rate was highly dependent on system pressure, then
the equipment would need to be altered accordingly. The results of these experiments
are shown in Figure 13.

60
Figure 13: Mass loss of zirconium metal vs. chlorine pressure at 375 °C.
With the exception of the high pressure (56 psig) data point, it is observed that
the reaction rate is only weakly dependent on the chlorine pressure. Based on this
observation, pressure was eliminated as a variable to be studied in the later experiments
and system pressure was regulated and measured using the regulator connected to the
gas supply. This pressure sequence was conducted at ~375 °C (tests varied from 368 to
377 °C) which was selected based on the results obtained in the temperature study in
Section 4.1.1 (Figure 12). The operating temperature was selected to ensure that
temperature fluctuations from the exothermic reaction would have negligible impact. In

61
an effort to minimize the effect of the tube clogging and influencing results, as was
observed in the previous sequence, the reaction time was set at 30 minutes, as opposed to
the 60 minute reaction time in the Section 4.1.1.
4.1.3 Impact of Time (ZRT-15 to ZRT-21)
The final sequence of ZRT experiments were performed to investigate the time-
dependence of chloride formation. The variables of temperature and pressure were
maintained at values which, at the time, were believed to render these variables
relatively constant. The temperature was successfully held between 363 and 372 °C and
the system pressure was held at 14 psig.
The results in Figure 14 appear to show a linear relation between chloride
formation and reaction time. This implies a constant chloride formation rate, which is
likely true as long as the volatile chloride is able to freely leave the reaction zone.
However, as discussed earlier, the tube was seen to clog once about 40 mg of metal had
been turned to chloride. This raises questions regarding the 75 and 90 minute data
points, which seem to contradict the “clogging” theory.

62
Figure 14: Mass loss of zirconium metal vs. time at 375 °C and 14 psi chlorine.
It can be concluded from the ZRT series that a reaction vessel must be used
which allows the volatilized material to freely leave the heated reaction zone. Data
gathered from any system which does not allow this, as in this ZRT series, should be
interpreted cautiously. That being said, the ZRT data series did provide valuable
observations to enable subsequent experiment designs. These observations include (1)
the need for a larger diameter reaction vessel, (2) the weak dependence of the chloride
reaction rate on system pressure, and (3) the need for more accurate temperature
measurement.

63
4.2 Initial Reactions to Compare Zr, U and Zr-50Zr Reactions (UT Series)
The experiments described in this section (i.e., the UT Series) were performed to
generate qualitative understanding of the differences between chloride formation
behavior in the U-50Zr alloy along with direct companion experiments with pure
zirconium and uranium. As described in Section 3.1.5, the experiments performed in
this series took place within the horizontal glass test tube system. This orientation was
believed to reduce the “clogging” effect that was seen in the previous ZRT series
because of the vessel’s larger diameter. All experiments in this series were conducted at
6 psig for one hour and at temperatures ranging between 335 and 370 °C.
Each experiment was set up so that one reaction vessel contained a U-50Zr
sample, and the other reaction vessel contained either a uranium or a crystal-bar
zirconium sample. The data gathered in this series mostly dealt with visual comparisons
between the chloride formation and volatilization of the three materials. Prior to this
series, it was not established that chlorine gas would completely extract the zirconium
contained within a U-50Zr alloy. It was also not known if the chlorides of uranium
would volatilize or if they would stay behind. It was established that the zirconium did
indeed volatilize and transport from heated U-50Zr samples and that uranium did remain
in the heated zone. The following images and discussion provide the details to support
this conclusion and Section 4.5.2 provides data regarding the effectiveness of the
separation.
As observed in the ZRT Series, volatilized material would begin depositing
immediately after leaving the heated portion of the reaction vessel. Figure 15 shows an

64
image from test UT-2 showing the volatilized material condensed on the outside of the
heated zone. While the larger reaction vessel used here clearly increased the amount of
material that could be volatilized before the tube would become clogged, the presence of
the internal gas inlet tube that delivered the chlorine gas to the heated end of the vessel
limited the amount of material that could be volatilized for each experiment. Figure 16
shows the reaction vessel becoming clogged with material. The gas inlet tube was
subsequently removed from all future tests and material was allowed to freely volatilize
and deposit.
Figure 15: Reaction vessel containing U-50Zr (UT-2) in heated aluminum block;
discoloration from suspended vapor deposited chloride solids.

65
Figure 16: Reaction vessel for UT-5 showing clogging due to deposition of product
from chlorinated crystal-bar zirconium.
The original purpose of the gas inlet tube was to provide a gas source directly to
the sample in a flowing system. The use of a flowing system was discarded as
unreasonable since the flowing supply of chlorine provided a constant feed to the highly
exothermic chloride formation reaction that created uncontrollable temperature
conditions. Experiment UT-1 allowed chlorine gas to flow for a few seconds into the
already heated reaction vessel in an effort to purge the system of gas impurities. Both
the U-50Zr and crystal-bar zirconium samples immediately began to glow a bright
orange, which was visible even though the reaction vessels remained inside of the heated
block. The zirconium sample was completely consumed and volatilized, and the U-50Zr

66
sample was attacked and reduced to an unrecognizable mass; likely a mixture of
chlorides and oxides.
Several important lessons were learned from this series. The first is that a system
with flowing chlorine was unreasonable due to safety concerns and because the samples
would become uncontrollably heated making it impossible to measure their actual
temperature. If the alloy reaches a high, unknown temperature, the uranium chloride may
also transport from the hot zone even though the apparent temperature being tested
indicates that it should not be volatile. It was also concluded from this series that the gas
inlet tube was unnecessary and could be removed from the system, thus removing
system clogs for the volatilization of all but the largest masses.
Figure 17 and Figure 18 show the results of the UT-2 test which compared the
volatilization of U-50Zr and crystal-bar zirconium. The vessel containing U-50Zr
produced a purple product that had volatilized and transported from the hot zone, while
the reaction vessel containing zirconium produced a white product typical of zirconium
tetrachloride. The purple color is indicative of uranium chlorides being present, and was
seen whenever U-50Zr was reacted with chlorine.

67
Figure 17: Reaction vessel from experiment UT-2 showing the remnant of the U-
50Zr alloy and the purple product on the cold zone wall.
Figure 18: Reaction vessel from experiment UT-2 showing and the white product on
the cold zone wall; the Zr sample was completely gone.

68
Figure 19 and Figure 20 show the results of the UT-3 test which compared the
volatilization of pure uranium and U-50Zr. It is evident in Figure 19 that very little, if
any, of the pure uranium was volatilized due to chloride formation. In fact, the material
which can be seen deposited on the reaction vessel in Figure 19 is very likely due to
residual zirconium chloride from the system not being thoroughly cleaned in-between
experiments as opposed to material being volatilized from the uranium sample. The
sample shown in Figure 20 is identical in appearance to that shown in Figure 17, both of
which were volatilization experiments of U-50Zr alloy.
Figure 19: Reaction vessel as removed from heated block. Sample is uranium from
experiment UT-3.

69
Figure 20: Reaction vessel as removed from heated block. Sample is U-50Zr from
experiment UT-3.
As a whole, the UT experiments showed that chlorine could indeed be used to
volatilize and separate the components of U-50Zr alloys. These tests demonstrated the
resistance of uranium to volatilization by chloride formation. The next step was to
perform a quantitative study of the ability of chlorine to separate zirconium from
uranium in uranium-zirconium alloys.
4.3 Uranium-Zirconium Separation Demonstration (U50Zr)
The U50Zr series was designed to quantify the selective chloride volatilization of
zirconium from uranium-zirconium alloys. The uranum-50 wt% zirconium (U-50Zr)
alloy was selected for this study because it contains the δ-phase of the alloy in high
concentrations [41]. The δ-phase was anticipated to be the more challenging U-Zr phase
to separate Zr from U over uranium and zirconium solid solutions or eutectic 2-phase

70
mixtures. This is due to the added thermodynamic barrier needed to break the
intermetallic bonds. The results of this series are presented below in Table 3.
Table 3: Summary of data from U50Zr series.
Sample Name %U %Zr T Time (Minutes)
U50Zr1-1NV 99.5 0.5 374 15
U50Zr1-2NV 97.4 2.6 374 30
U50Zr1-2V 58.8 41.2 374 30
U50Zr1-3V 60.0 40.0 378 60
U50Zr2-1NV 77.5 22.5 300 15
U50Zr2-2NV 98.8 1.2 303 30
U50Zr2-3NV 98.4 1.6 312 60
U50Zr2-4NV 99.8 0.2 306 120
U50Zr4-1NV 96.1 3.9 340 15
U50Zr4-2NV 99.7 0.3 340 30
U50Zr4-3NV 99.9 0.1 340 60
U50Zr4-4NV 99.8 0.2 340 120
U50Zr5-1NV 95.3 4.7 360 15
U50Zr5-2NV 96.1 3.9 359 30
U50Zr5-3NV 99.9 0.1 362 60
U50Zr5-4NV 99.9 0.1 360 120
U50Zr6-V 25.8 74.2 265 120
U50Zr7-NV 96.5 3.5 285 90
U50Zr7-V 21.1 78.9 285 90
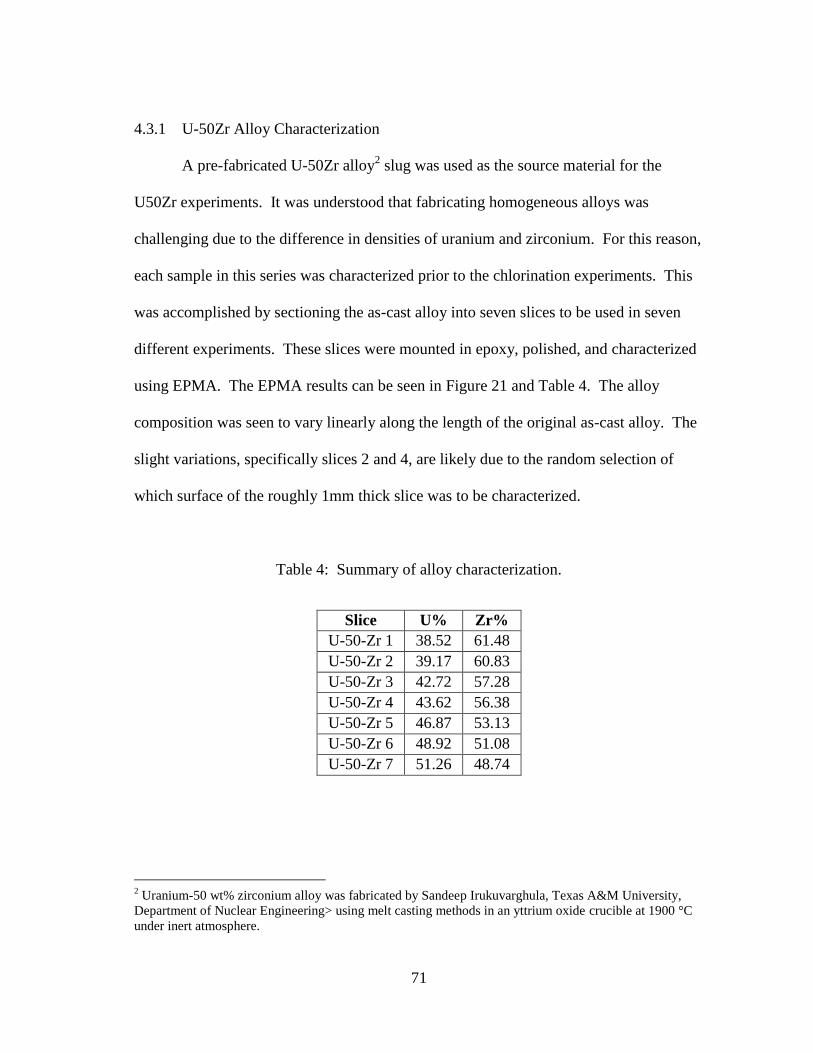
71
4.3.1 U-50Zr Alloy Characterization
A pre-fabricated U-50Zr alloy2 slug was used as the source material for the
U50Zr experiments. It was understood that fabricating homogeneous alloys was
challenging due to the difference in densities of uranium and zirconium. For this reason,
each sample in this series was characterized prior to the chlorination experiments. This
was accomplished by sectioning the as-cast alloy into seven slices to be used in seven
different experiments. These slices were mounted in epoxy, polished, and characterized
using EPMA. The EPMA results can be seen in Figure 21 and Table 4. The alloy
composition was seen to vary linearly along the length of the original as-cast alloy. The
slight variations, specifically slices 2 and 4, are likely due to the random selection of
which surface of the roughly 1mm thick slice was to be characterized.
Table 4: Summary of alloy characterization.
Slice U% Zr%
U-50-Zr 1 38.52 61.48
U-50-Zr 2 39.17 60.83
U-50-Zr 3 42.72 57.28
U-50-Zr 4 43.62 56.38
U-50-Zr 5 46.87 53.13
U-50-Zr 6 48.92 51.08
U-50-Zr 7 51.26 48.74
2 Uranium-50 wt% zirconium alloy was fabricated by Sandeep Irukuvarghula, Texas A&M University,
Department of Nuclear Engineering> using melt casting methods in an yttrium oxide crucible at 1900 °C
under inert atmosphere.
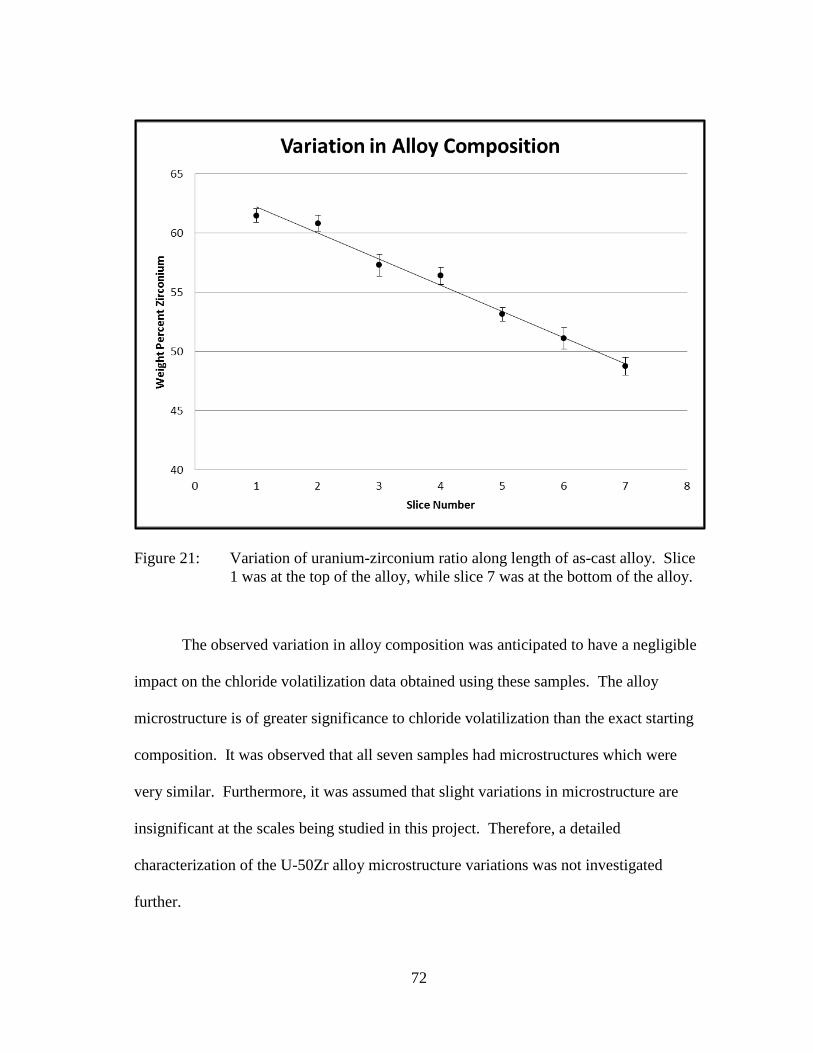
72
Figure 21: Variation of uranium-zirconium ratio along length of as-cast alloy. Slice
1 was at the top of the alloy, while slice 7 was at the bottom of the alloy.
The observed variation in alloy composition was anticipated to have a negligible
impact on the chloride volatilization data obtained using these samples. The alloy
microstructure is of greater significance to chloride volatilization than the exact starting
composition. It was observed that all seven samples had microstructures which were
very similar. Furthermore, it was assumed that slight variations in microstructure are
insignificant at the scales being studied in this project. Therefore, a detailed
characterization of the U-50Zr alloy microstructure variations was not investigated
further.

73
Even so, the microstructure was examined in some detail for Slice 1, as shown in
Figure 22 and Figure 23. It was found that fine α-zirconium phases were present in
these samples. These phases were composed of greater than 98% zirconium, with the
remaining ~2% being uranium. However, the uranium composition of these precipitates
was likely detected erroneously due to the electron beam interaction zone being
significant at these scales. It is therefore assumed that the observed zirconium
precipitates contain no uranium, although the validity of this assumption is not very
important to the outcome of the experiments performed.
Figure 22: Backscattered electron images of the U-50Zr material (Slice 1) showing a
representative microstructure which is common to all slices.

74
Figure 23: Colorized image (center) from U-50Zr sample in Figure 22-B along with
X-ray maps showing the locations of uranium (left) and zirconium (right).
As a further check on the bulk sample uniformity, the U-50Zr slices were
compared and found to be homogenous on the macro-scale. This can be seen in Figure
24 for Slices 1-3. This homogeneity is in contrast to that observed for two separate U-
10Zr alloys (Figure 25 and Figure 26), neither of which underwent a second remelt step.

75
Figure 24: Low magnification backscattered electron images of the U-50Zr alloy
slices showing macroscopic homogeneity: The faces of Slice 1 are shown
in A-B, Slice 2 in C-D, and Slice 3 in E-F.
Figure 25: Uranium and zirconium X-ray maps of U-10Zr alloy system showing
macroscopic inhomogeneity.

76
Figure 26: Uranium and Zirconium X-ray maps of U-10Zr alloy-system showing
macroscopic inhomogeneity.
4.3.2 Separation Results
After characterization, each disc from the U-50Zr alloy was sectioned into
quarters and each quarter was inserted into its own independent glass tube reaction
vessel. The samples were then reacted with elemental chlorine for predetermined
temperatures and lengths of time according to the procedure in Section 3.2. Each sample
was then physically separated into a volatilized portion and a non-volatilized portion.

77
This section will present the results of the EPMA analysis for this series of experiments
in the order that they were performed.
4.3.2.1 U50Zr-1
This was the first experiment which quantitatively studied the ability of chlorine
to separate zirconium from uranium-zirconium alloys. The results are presented in
Table 5. Slice 1 of the U-50Zr alloy was sectioned into 4 pieces and exposed to chlorine
for 15, 30, 60 and 120 minutes according to the procedures in Section 3.2.3. The non-
volatile chlorides formed in samples 1-2 were analyzed and was found to contain at least
97% uranium compared to zirconium. This result indicated that the chloride
volatilization process is capable of providing some separation in uranium-zirconium
alloys.
Table 5: Summary of separation effectiveness from U50Zr1 experiment.
Experiment U50Zr1 U50Zr1 U50Zr1 U50Zr1
Sample 1 2 3 4
Initial Mass (g) 0.1499 0.1658 0.1259 0.1592
Final Mass (g) 0.0330 0.0079 0.0000 0.0000
Time (Min) 15 30 60 120
Temperature (°C) 374 374 378 381
Percent Zr (Non-Volatilized) 0.5 2.6 NA NA
Percent U (Non-Volatilized) 99.5 97.4 NA NA
Percent Zr (Volatilized Grey) NA 81.5 73.8 NA
Percent U (Volatilized Grey) NA 18.5 26.2 NA
Percent Zr (Volatilized Bright) NA 1.9 5.6 NA
Percent U (Volatilized Bright) NA 98.1 94.4 NA

78
Figure 27: Energy-dispersive X-ray spectrum of volatilized portion of samples 1-3 in
experiment U50Zr1 showing sodium contamination and varying U-Zr
compositions.
There was some difficulty in analyzing the volatilized portions of the samples
within this experiment, however. It was observed that the oxide formation process,
which utilizes aqueous sodium hydroxide, resulted in a volatilized portion which was
heavily contaminated with sodium which came from the sodium hydroxide precipitation
79
process as described in Section 3.2.3.2. This can be seen in Figure 27 which shows the
EDS spectrum from the volatilized portions of samples 1-3. The sodium contamination
is most dramatically seen in sample 1, but was also seen in samples 2 and 3. Greater
care was taken to eliminate the effect of sodium contamination in future experiments.
The increasing presence of uranium in the volatilized portion of sample 3 can
also be seen in Figure 27. This result is expected because nearly 100% of the zirconium
is volatilized immediately from the sample, resulting in nearly pure uranium chloride
being left behind. The longer the remaining uranium chloride is heated, the more it will
move to the volatilized zone simply. In other words, the uranium does transport but at a
slower rate to that of zirconium. Therefore, the principal observations from this
experiment were the discovery that it is difficult to produce a homogeneous product and
that careful kinetic information will be required to optimize the separations. This is
important if a reliable measurement of uranium and zirconium content is to be obtained.
Table 5 illustrates this by tabulating the difference in composition between the
“bright” and “grey” regions of the volatilized portions of samples 2 and 3. Greater care
was taken in future experiments to produce a homogeneous product. This was done by
grinding the material in a mortar and pestle before being mounted for EPMA analysis.
In spite of the dramatic difference in composition between the “bright” and ”grey”
regions shown in Figure 28, it is believed that the grey regions provide a close
approximation to the actual uranium and zirconium content.
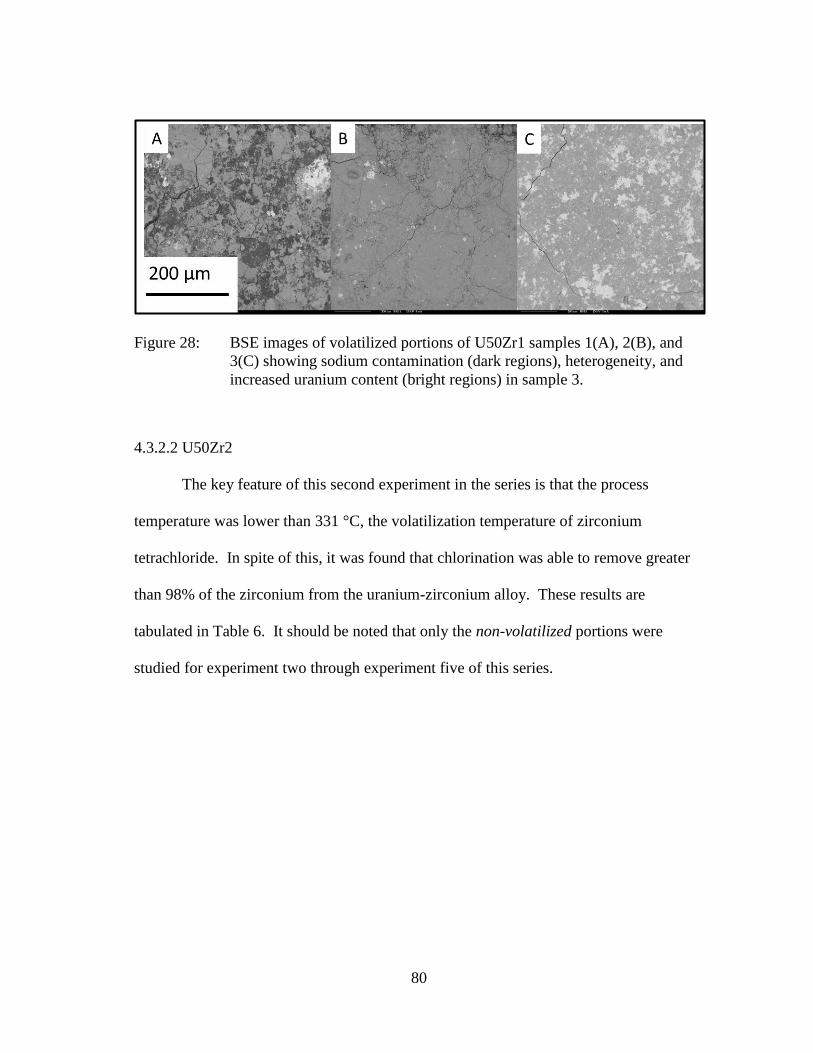
80
Figure 28: BSE images of volatilized portions of U50Zr1 samples 1(A), 2(B), and
3(C) showing sodium contamination (dark regions), heterogeneity, and
increased uranium content (bright regions) in sample 3.
4.3.2.2 U50Zr2
The key feature of this second experiment in the series is that the process
temperature was lower than 331 °C, the volatilization temperature of zirconium
tetrachloride. In spite of this, it was found that chlorination was able to remove greater
than 98% of the zirconium from the uranium-zirconium alloy. These results are
tabulated in Table 6. It should be noted that only the non-volatilized portions were
studied for experiment two through experiment five of this series.

81
Table 6: Summary of separation effectiveness from U50Zr2 experiment.
Experiment U50Zr2 U50Zr2 U50Zr2 U50Zr2
Sample 1 2 3 4
Initial Mass (g) 0.2180 0.2467 0.2810 0.2303
Final Mass (g) 0.1934 0.0951 0.1112 0.0577
Time (Min) 15 30 60 120
Temperature (°C) 300 302 312 306
Percent Zr 43.6 1.4 1.6 0.2
Percent U 56.4 98.6 98.4 99.8
Percent Zr (Bright) 2.2 0.9 NA NA
Percent U (Bright) 97.8 99.1 NA NA
Sample 1 was found to be very heterogeneous as seen in Figure 29, so both the
dark and light regions were analyzed using EPMA and were seen to be composed of
very different ratios of uranium and zirconium. This inhomogeneity is likely caused by
insufficient mixing of the powdered product, and results in a product which is nearly
impossible to accurately characterize. Figure 29 also shows samples 2-4 and the
corresponding homogeneity of the product. This is the desired physical appearance of
all samples to be analyzed, and this level of uniformity was achieved for the majority of
future samples throughout this project. It was found that the heterogeneity seen in
sample 1 can be eliminated by thoroughly mixing the products using a mortar and pestle.
(Later samples contained small areas of heterogeneity, but the impact on accurate results
was negligible.)

82
Figure 29: Backscattered electron images of samples 1-4 from the U50Zr2
experiment showing variation in sample homogeneity.
The composition of the sample and homogeneity of the uranium and zirconium
can be determined in a rather straightforward manner using EDS. Inspection of Sample
1 in Figure 29 shows clear differences in composition. However, visual inspection of
the BSE image is not sufficient to determine if the sample is heterogeneous with respect
to uranium and zirconium, only that it is heterogeneous with respect to something. It is
possible to use EDS to quickly determine the homogeneity of various regions with
respect to uranium and zirconium, as seen in Figure 30. The “bright” and “dark” regions
of sample 1 were also analyzed using WDS which, as tabulated in Table 6. It can be
seen in Figure 30 that the differences in contrast seen in samples 2-4 are likely not due to
actual composition differences between the uranium and zirconium. This is further
supported by WDS analysis of the “bright” regions in sample 2 as shown in Table 6, and
one can conclude that the contrast differences are unrelated to uranium and zirconium
composition. For example, the contrast difference in sample 3 is due to slight variations
in sodium composition as seen in Figure 30.

83
Figure 30: EDS data showing difference in homogeneity between samples 1 and 3 in
experiment U50Zr2.
The results obtained in this experiment revealed that obtaining a homogeneous
product for analysis is relatively straightforward and that techniques are available to
demonstrate the consistent production of homogeneous products. Producing a
homogeneous product for composition analysis became routine and will not be discussed
further unless it is directly relevant to the results. It was also shown that zirconium can
be selectively removed from uranium-zirconium alloys at temperatures below the
volatilization temperature of zirconium tetrachloride.
4.3.2.3 U50Zr3 Results
Experiment U50Zr3 was a failed experiment but it will be discussed for the sake
of completeness and to illustrate some of the difficulties encountered during the
operating the chlorination system. This was the first 4-sample experiment using the
setup in Figure 8. Experiments U50Zr1 and U50Zr2 were conducted with sample pairs

84
while awaiting parts to complete the four-reaction-vessel system. As mentioned above,
these systems were operated such that each reaction vessel can be isolated from the rest
of the system using a system of valves. All samples were exposed to chlorine
simultaneously and the reaction vessels were then isolated from the system at the
appropriate time, resulting in a time study of the chloride reaction.
This experiment was abandoned because when it came time to isolate the 15
minute sample, it was noticed that the 120 minute sample was already isolated, and
therefore, had never been exposed to chlorine. This means that this 120 minute sample
was potentially picking up contaminates from air for 15 minutes while it was not being
chlorinated. The 120 minute sample was then opened to the system, thereby introducing
chlorine to the 120 minute sample. It was soon decided that this was a mistake because
the 120 minute reaction vessel may or may not have contained air contamination which
would influence the results obtained for the 30 and 60 minute samples. The entire
experiment was therefore shut down and discarded as inconclusive.
4.3.2.4 U50Zr4 Results
Experiment U50Zr2 demonstrated the separation of uranium and zirconium at
temperatures below the volatilization temperature of zirconium tetrachloride.
Experiment 4 demonstrated separation at a temperature slightly above the volatilization
temperature of zirconium tetrachloride. The data shown in Table 7 show that this
separation occurs very quickly and results in the effective removal of zirconium (i.e.,
>96%) from the material in less than 15 minutes. It is worth repeating that the material
analyzed to characterize this result is the non-volatilized material that was converted to
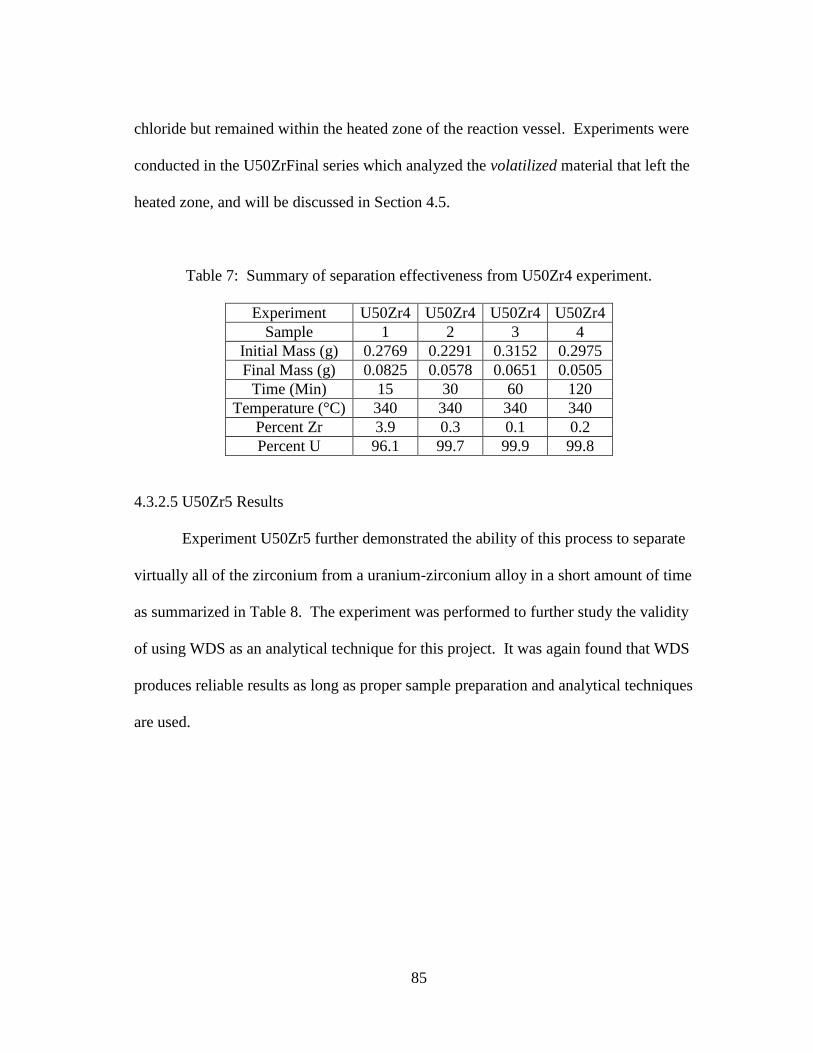
85
chloride but remained within the heated zone of the reaction vessel. Experiments were
conducted in the U50ZrFinal series which analyzed the volatilized material that left the
heated zone, and will be discussed in Section 4.5.
Table 7: Summary of separation effectiveness from U50Zr4 experiment.
Experiment U50Zr4 U50Zr4 U50Zr4 U50Zr4
Sample 1 2 3 4
Initial Mass (g) 0.2769 0.2291 0.3152 0.2975
Final Mass (g) 0.0825 0.0578 0.0651 0.0505
Time (Min) 15 30 60 120
Temperature (°C) 340 340 340 340
Percent Zr 3.9 0.3 0.1 0.2
Percent U 96.1 99.7 99.9 99.8
4.3.2.5 U50Zr5 Results
Experiment U50Zr5 further demonstrated the ability of this process to separate
virtually all of the zirconium from a uranium-zirconium alloy in a short amount of time
as summarized in Table 8. The experiment was performed to further study the validity
of using WDS as an analytical technique for this project. It was again found that WDS
produces reliable results as long as proper sample preparation and analytical techniques
are used.

86
Table 8: Summary of separation effectiveness from U50Zr5 experiment.
Experiment U50Zr5 U50Zr5 U50Zr5 U50Zr5
Sample 1 2 3 4
Initial Mass (g) 0.2833 0.2798 0.3172 0.4087
Final Mass (g) 0.0000 0.0000 0.0000 0.0000
Time (Min) 15 30 60 120
Temperature (°C) 360 359 362 360
Percent Zr 8.4 7.5 0.1 0.1
Percent U 91.6 92.5 99.9 99.9
Percent Zr (Bright) 1.0 2.1 NA 0.1
Percent U (Bright) 99.0 97.9 NA 99.9
It was noted previously that uncertainties complicate the data analysis when
analyzing a heterogeneous product due to the phase composition variations (Figure 28
and Figure 29). While large composition differences were not seen in this experiment,
there existed were subtle differences in composition across the sample surfaces observed
using BSE imaging. These slight differences in composition are evident in Figure 31 as
varying shades of grey.
Figure 31: Backscattered electron images of samples 1-4 from the U50Zr5
experiment.

87
Sample 1 (Figure 31) contains a light phase as well as a darker grey phase.
Before further analysis was performed comparing these two phases, it was important to
verify that these phases are consistent within a single sample. Figure 32 shows EDS
spectra between two random light phase regions, two random dark phase regions, and a
comparison between the light and dark regions. It can be seen that the light and dark
phases are indeed consistent when examined independent of one another, but differ
between each other. This difference was shown to be significant using WDS analysis
and is tabulated in Table 8.
Figure 32: Energy dispersive spectra of sample 1 in experiment U50Zr5 shown in
Figure 31. Light phase region (Left). Dark phase region (Right).
Light/dark comparison (Center).
Sample 2 can be seen to contain a light area, a grey area, and also a minority
darker grey area. The darker grey area was seen to be slightly enriched in zirconium,
while the two grey phases were seen to be virtually identical in composition. This can
be seen in the EDS spectra shown in Figure 33.

88
Figure 33: Energy dispersive spectra of sample 2 in experiment U50Zr5.
The pressed product from U50Zr5-3 was clearly observed to be homogeneous.
The pressed product from U50Zr5-4, however, appeared heterogeneous with BSE
imaging. Backscattered electron observation suggests a product which is heterogeneous
in uranium and zirconium; however this is not the case. Upon EDS analysis it was seen
that the bright regions were bright only because the rest of the material contained
elevated levels of yttrium. This can be seen in Figure 34.
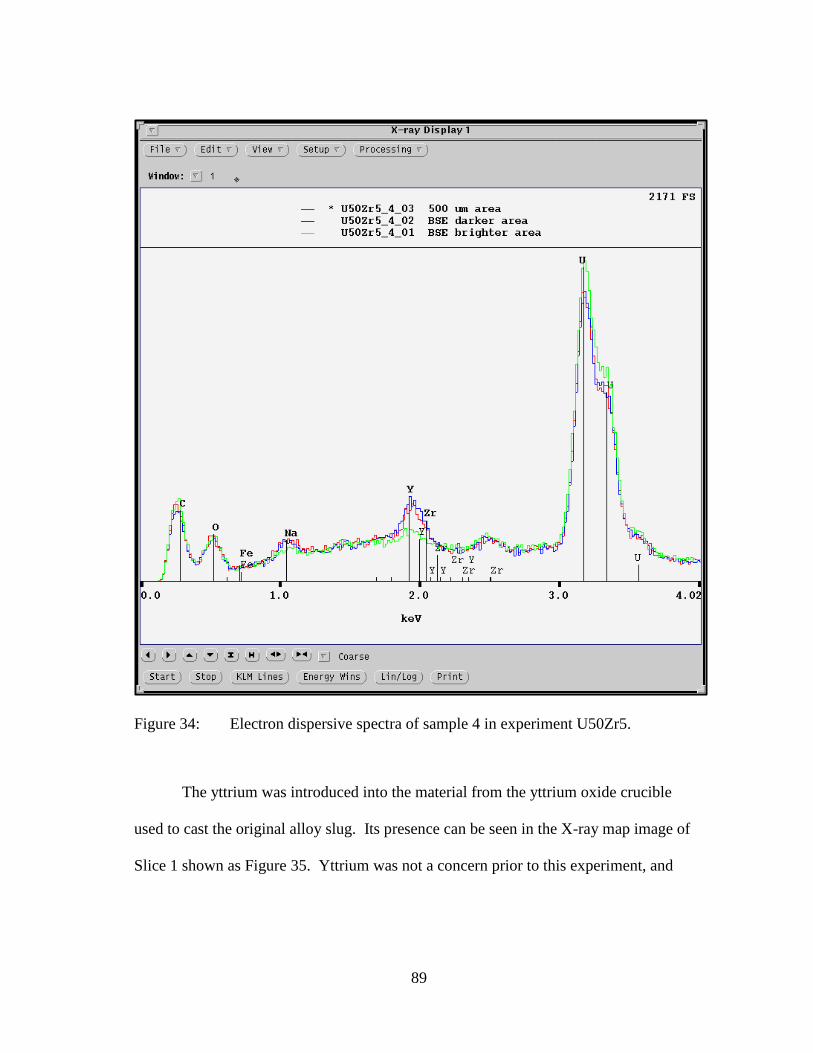
89
Figure 34: Electron dispersive spectra of sample 4 in experiment U50Zr5.
The yttrium was introduced into the material from the yttrium oxide crucible
used to cast the original alloy slug. Its presence can be seen in the X-ray map image of
Slice 1 shown as Figure 35. Yttrium was not a concern prior to this experiment, and

90
does not affect any previous results. This is because the WDS peak of yttrium does not
interfere with either the uranium or zirconium peak.
Figure 35: X-ray map of Slice 1 showing presence of yttrium oxide rind.
Even though the heterogeneity of the samples in this experiment was slight, it
was present. Therefore a line-scan method was used which produces results
representative of the material being examined. A line-scan adds the information
gathered over several data points which all lay along a single line. This effectively
“smears” any slight heterogeneity which may be present within a sample.
A technique used to determine whether or not a line-scan can be used to produce
representative results is to perform an EDS analysis on each region of interest followed
by an EDS analysis of a larger representative region that contains all phases in
representative area fractions. This technique can be explained using Figure 34 as an

91
example where it is seen that the bright regions are not likely to contribute much to the
bulk analysis of the sample. These comparatively bright regions are in the small
minority and are easily avoided with a line-scan of the product, which results in an
accurate analysis of the bulk material.
4.3.2.6 U50Zr6 and U50Zr7 Results
These two experiments were single reaction vessel tests performed to determine
the temperature at which volatilization would begin in a U-50Zr alloy. This was
accomplished by introducing chlorine to a single sample at a temperature where
volatilization was not expected. The vessels were then slowly heated to until volatilized
material began to deposit on the unheated portion of the reaction vessel. Experiment
U50Zr6 began 250 °C and volatilization was noted at temperature of 278 °C after being
exposed to chlorine for 20 minutes. The material was then held at 280 °C for 100
minutes. Experiment U50Zr7 was started at 270 °C and volatilization was noted at 271
°C after being exposed to chlorine for two minutes.
This information is useful for establishing the lower temperature limit for the
final separation series described in Section 4.5. The fact that experiment U50Zr6 was
exposed to chlorine for 20 minutes before it began to volatilize at 278 °C indicates that
experiments performed below this temperature will likely have large systematic errors
caused by significant differences in onset of chloride formation. Subsequent U-50Zr
alloy exposure experiments were therefore performed at temperatures above 280 °C.
While these two experiments were not intended to be processed for EPMA
analysis, a rapid characterization was performed. The products were not carefully
92
prepared but the EPMA results are worth discussing. The conversion to pressed powder
was performed in an expedited manner to quickly confirm the qualitative observations.
In retrospect, a full conversion would have been preferred, but these imperfect results are
worth reporting.
The volatilized material from experiment U50Zr6 was processed and analyzed
using the method described in Section 3.2.3. A backscattered electron image of this
material can be seen in Figure 36. An unusual feature of this product is the presence of
large quantities of silicon observed as large darker patches in the image. It is likely that
this silicon originates from the glass test-tube used to contain this material in-between its
volatilization and eventual analysis. The material was stored in a concentrated sodium
hydroxide solution for two weeks. It is possible that the solution leached silicon from
the glass test-tube, and this silicon remained in the product as it was washed and dried.
The silicon is in the dark regions of Figure 36 were examined using EDS and the
resulting spectra is shown in Figure 37. The bright regions in Figure 36 are uranium-
rich.
Even though the products of this experiment were not processed carefully, the
final uranium-zirconium ratio was very close to that observed in the sixth experiment in
the U50ZrFinal series which had similar experimental conditions. The products for the
current experiment were found to have a uranium-zirconium ratio of 25.8% uranium to
74.2% zirconium. The products for the sixth experiment in the U50ZrFinal series were
found to have a uranium-zirconium ratio of 26.3% uranium to 73.7% zirconium. This

93
seems to imply that even with large quantities of impurities the uranium-zirconium ratio
may be correctly obtained.
Figure 36: Backscattered electron image of volatilized material from experiment
U50Zr6.

94
Figure 37: Energy dispersive spectra of volatilized material from experiment
U50Zr6.
Both the volatilized and non-volatilized portions were analyzed from U50Zr7.
While this material was not stored in a sodium hydroxide solution as was U50Zr6, it was
not washed as thoroughly as the analytical samples noted in previous and subsequent
tests. This resulted in a product which was heavily contaminated in sodium. This can be
seen as the black phase in Figure 38, which is verified to be sodium-rich in Figure 39. In
spite of this heavy sodium contamination, the relative uranium and zirconium
concentrations for this non-volatilized material were seen to be 96.5% uranium and 3.5%
zirconium. This result is consistent with similar experiments.

95
Figure 38: Backscattered electron image of non-volatilized material from experiment
U50Zr7.

96
Figure 39: Energy dispersive spectra of non-volatilized material from experiment
U50Zr7.
The processed product from the volatilized portion of U50Zr7 also shows heavy
sodium contamination. This can be seen in Figure 40 as dark patches and was confirmed
as containing large amounts of sodium via EDS analysis as shown in Figure 41.
Wavelength dispersive x-ray spectroscopy analysis of these dark areas show a relative
sodium and oxygen mass percentage of 73.7% sodium and 26.3% oxygen. This
corresponds to sodium oxide which has a relative sodium and oxygen mass percentage
of 74.2% sodium and 25.8% oxygen. This result indicated that the sodium can easily be
removed from the product through washing with water. All subsequent products were
thoroughly washed in order to convert the sodium oxide to sodium hydroxide and the
dissolved sodium hydroxide was then decanted away. Therefore, sodium contamination
was not present in the later experiments.

97
Figure 40: Backscattered electron image of volatilized material from experiment
U50Zr7.
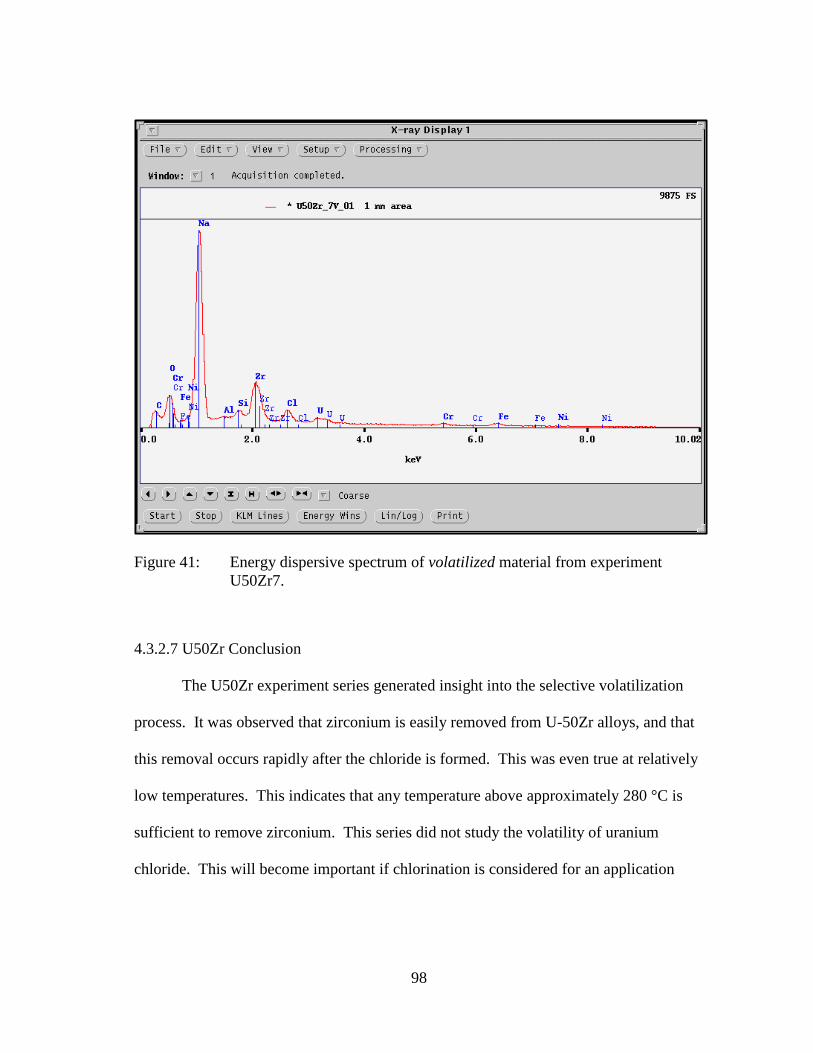
98
Figure 41: Energy dispersive spectrum of volatilized material from experiment
U50Zr7.
4.3.2.7 U50Zr Conclusion
The U50Zr experiment series generated insight into the selective volatilization
process. It was observed that zirconium is easily removed from U-50Zr alloys, and that
this removal occurs rapidly after the chloride is formed. This was even true at relatively
low temperatures. This indicates that any temperature above approximately 280 °C is
sufficient to remove zirconium. This series did not study the volatility of uranium
chloride. This will become important if chlorination is considered for an application

99
where a pure zirconium product or complete uranium recovery is required. (Uranium
transport is addressed as part of the U50ZrFinal series.)
Further, a rough understanding of the times required for separation can be
achieved using the data obtained during this series. Figure 42 shows the relative
zirconium concentration for non-volatilized portions of experiments 1, 3, 4, and 5 in the
U50Zr Series plotted as a function of time. This information was used to design the next
experimental series.
Figure 42: Summary of zirconium volatilization from U-50Zr alloys showing the
relative percent of zirconium remaining in non-volatilized products.

100
4.4 Series Zr
After the U50Zr series (Section 4.3), it was determined that further Zr
volatilization data was needed to determine parameters needed for the final separation
measurements described in Section 4.5. The first experiments of the Zr series (Zr-1 to
Zr-8) were conducted using irregularly shaped pieces of crystal-bar zirconium to study
the time and temperature dependence of the volatilization of pure Zr. It was discovered
that the reaction rate was highly dependent on surface area, indicating that the irregular
shapes were poor starting materials. Therefore, a more careful surface area study was
performed in experiment Zr-9 to Zr-20. Finally, an experiment was conducted to
determine the onset temperature of volatilization for various zirconium alloys and
shapes.
4.4.1 Rate Study (Zr1 to Zr8)
A rate study was performed at temperatures ranging from 300 °C to 400 °C in
increments of 20 °C as a probe of the zirconium volatilization process. The results
shown in Table 9 were largely inconclusive, other than to say that chloride formation
increased as a function of time for all temperatures studied, as seen in Figure 43. This
result is trivial. It was determined that the inconclusive results were obtained because of
the large unquantifiable irregular sample surface areas noted above. This hypothesis was
confirmed by sample Zr7-4, which had a much larger, yet unquantified surface area
when compared to the other samples. It was noted that the amount of material
volatilized in this sample was higher than that of the rest of the samples in this sequence
of experiments.

101
Figure 43: Results from probing experiments showing inconclusive rate study
plotted as a function of time.

102
Table 9: Summary of data from rate study.
Name mI (g) mF (g) T °C P Time (min)
Zr1-1 0.3325 0.1850 361 6 psi 5
Zr1-2 0.3930 0.1647 360 10
Zr1-3 0.4378 0.0311 358 20
Zr1-4 0.3647 0 360 40
Zr2-1 0.3610 0.2182 339 6 psi 5
Zr2-2 0.2826 0.0831 338 10
Zr2-3 0.3175 0 339 20
Zr2-4 0.3342 0 339 40
Zr3-1 0.2548 0.1491 341 6 psi 5
Zr3-2 0.2803 0.0890 341 10
Zr3-3 0.3750 0.1094 340 15
Zr3-4 0.3984 0.0404 340 20
Zr4-1 0.2760 0.1724 320 6 psi 5
Zr4-2 0.3751 0.1483 318 10
Zr4-3 0.4739 0.1522 318 15
Zr4-4 0.4904 0.0582 319 20
Zr5-1 0.3124 0.1928 301 6 psi 5
Zr5-2 0.3255 0.1084 299 10
Zr5-3 0.3658 0.0342 299 15
Zr5-4 0.3916 0.0068 299 20
Zr6-1 0.4399 0.3161 380 6 psi 5
Zr6-2 0.6127 0.4017 379 10
Zr6-3 0.7807 0.4315 379 15
Zr6-4 0.7959 0.3349 380 20
Zr7-1 0.221 0.1080 401 6 psi 5
Zr7-2 0.2995 0.0878 401 10
Zr7-3 0.4022 0.1190 400 15
Zr7-4 0.8467 0.2920 400 20
Zr8-1 10.226 9.1435 300 6 psi 10
Zr8-2 9.9431 8.8959 300 10
Zr8-3 10.060 9.0491 300 10
Zr8-4 10.537 9.4340 300 10

103
The inconclusive results of Figure 43 can be shown more clearly in Figure 44,
which shows the slope, or rate of chloride formation as a function of temperature. It
should be noted that sample Zr7-4 was removed from data presented in Figure 44, due to
its uncharacteristically large surface area.
In spite of these inconclusive results, several insights were gathered from this
sequence of experiments. First, the chloride formation rate is highly dependent on
surface area. Second, the reaction proceeds to completion before 40 minutes have
elapsed for the sample sizes of interest. This was noted in Zr-1 and Zr-2 where the
entire “40-minute” sample was consumed prior to being allowed to react for the entire
40 minutes. The time-steps studied for these first two experiments were 5, 10, 20 and 40
minutes. In response, the remaining five experiments in this sequence were reacted with
time-steps of 5, 10, 15, and 20 minutes.
Experiment Zr8 was conducted to quantify the error inherent in the system. For
this experiment larger pieces of crystal-bar zirconium were allowed to react with
chlorine gas. These four samples were sectioned from a single piece of crystal-bar
zirconium so that their lengths, and therefore their surface areas, were as similar as
possible. All four samples were exposed to chlorine for 10 minutes at 300 °C. The
results can be seen in Figure 45. It can be seen that the error in mass change is 3.8%,
with a variation in surface area measurement of 2.5%. This indicates that as long as the
surface area is precisely known; accurate, repeatable results may be obtained for
studying the effect of surface area on chloride formation. It should be noted that the
samples used in Zr8 were large sections of crystal-bar zirconium. This is important

104
because there is an inherent variability in measuring the diameter of these samples
simply due to the roughness of the samples. This further supports the hypothesis that
accurately measured samples can be used to produce data which accurately measures the
chloride formation in crystal-bar zirconium. This is because, even with such a large
variation in sample surface areas, the systematic error was only 3.8%. It then follows
that if samples were to be created with precisely controlled surface areas, then the error
in mass change will certainly be less than 3.8%.
Figure 44: Chloride formation rate from probing experiments.

105
Figure 45: Mass change data from Zr8 showing reproducibility of chloride formation
for samples with a similar surface area.
4.4.2 Surface Area Study (Zr9 to Zr20)
The set of experiments was designed to quantify the effect of surface area on
chloride formation in crystal-bar zirconium, the results of which are shown in Table 10.
The samples were created by machining the source rod of crystal-bar zirconium into a
cylindrical shape of uniform diameter. Each sample was then sectioned from this
cylinder resulting in samples with nearly identical diameters and precisely measured
thicknesses. New samples were used for each of the three temperatures studied, but
samples were reused within each temperature. The reuse of samples enabled a more

106
thorough data set to be obtained because their surface areas decrease by chloride
formation after each experiment.
Table 10: Summary of data from surface area study.
Name Surface Area
(mm2)
Mass
Change (g)
Time
(min)
Rate
(mg/min)
T
(°C)
Zr9-1 407 0.1754 2 87.7 320
Zr9-2 351 0.1330 2 66.5 320
Zr9-3 294 0.1312 2 65.6 320
Zr9-4 219 0.0958 2 47.9 320
Zr10-1 396 0.1640 2 82.0 320
Zr10-2 343 0.0590 2 29.5 320
Zr10-3 286 0.0897 2 44.9 320
Zr10-4 207 0.0820 2 41.0 320
Zr11-1 378 0.1152 2 57.6 320
Zr11-2 333 0.0825 2 41.3 320
Zr11-3 268 0.0780 2 39.0 320
Zr11-4 197 0.0349 2 17.5 320
Zr12-1 357 0.6519 10 65.2 320
Zr12-2 317 0.5148 10 51.5 320
Zr12-3 252 0.3830 10 38.3 320
Zr12-4 170 0.3090 10 30.9 320
Zr13-1 312 0.5163 10 51.6 320
Zr13-2 281 0.4229 10 42.3 320
Zr13-3 217 0.3335 10 33.4 320
Zr13-4 NA NA 10 0.1 320
Zr15-1 385 0.6476 10 64.8 400
Zr15-2 330 0.4653 10 46.5 400
Zr15-3 271 0.3956 10 39.6 400
Zr15-4 206 0.3425 10 34.3 400
Zr16-1 353 0.5907 10 59.1 400
Zr16-2 300 0.4085 10 40.9 400
Zr16-3 242 0.3445 10 34.5 400
Zr16-4 163 0.2851 10 28.5 400
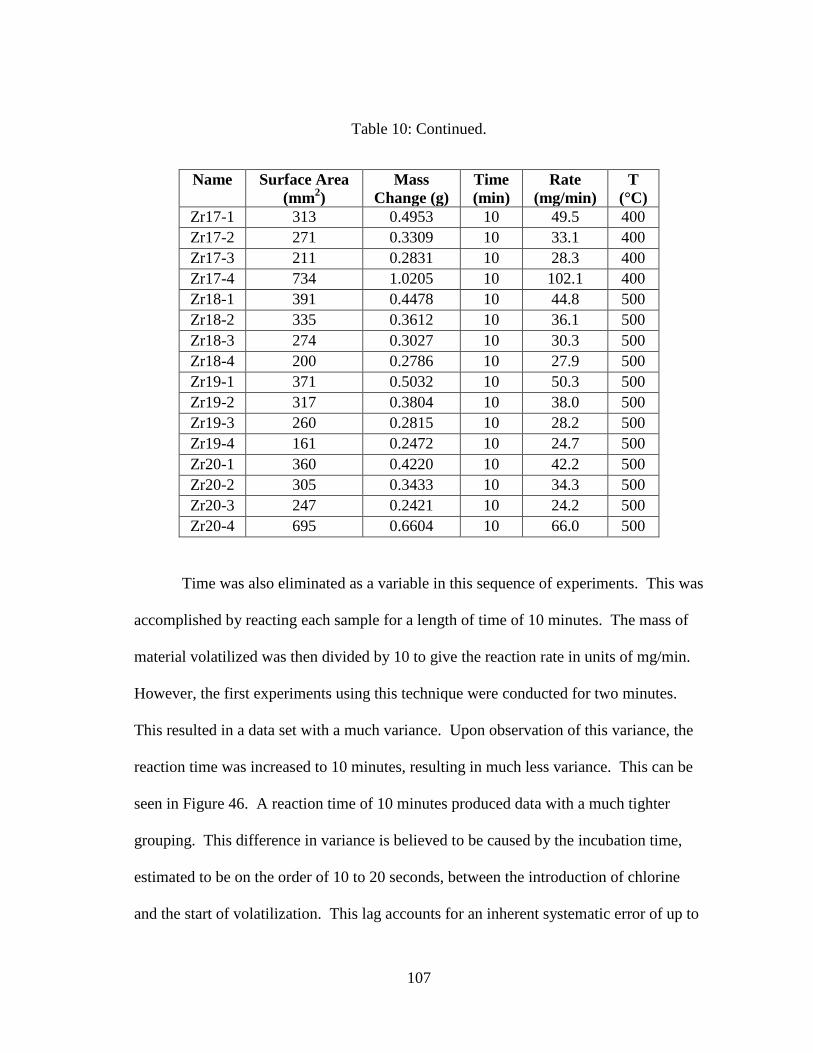
107
Table 10: Continued.
Name Surface Area
(mm2)
Mass
Change (g)
Time
(min)
Rate
(mg/min)
T
(°C)
Zr17-1 313 0.4953 10 49.5 400
Zr17-2 271 0.3309 10 33.1 400
Zr17-3 211 0.2831 10 28.3 400
Zr17-4 734 1.0205 10 102.1 400
Zr18-1 391 0.4478 10 44.8 500
Zr18-2 335 0.3612 10 36.1 500
Zr18-3 274 0.3027 10 30.3 500
Zr18-4 200 0.2786 10 27.9 500
Zr19-1 371 0.5032 10 50.3 500
Zr19-2 317 0.3804 10 38.0 500
Zr19-3 260 0.2815 10 28.2 500
Zr19-4 161 0.2472 10 24.7 500
Zr20-1 360 0.4220 10 42.2 500
Zr20-2 305 0.3433 10 34.3 500
Zr20-3 247 0.2421 10 24.2 500
Zr20-4 695 0.6604 10 66.0 500
Time was also eliminated as a variable in this sequence of experiments. This was
accomplished by reacting each sample for a length of time of 10 minutes. The mass of
material volatilized was then divided by 10 to give the reaction rate in units of mg/min.
However, the first experiments using this technique were conducted for two minutes.
This resulted in a data set with a much variance. Upon observation of this variance, the
reaction time was increased to 10 minutes, resulting in much less variance. This can be
seen in Figure 46. A reaction time of 10 minutes produced data with a much tighter
grouping. This difference in variance is believed to be caused by the incubation time,
estimated to be on the order of 10 to 20 seconds, between the introduction of chlorine
and the start of volatilization. This lag accounts for an inherent systematic error of up to

108
~17% for experiments with a 2-minute reaction time compared to an error of up to ~3%
for experiments with a 10-minute reaction time.
Figure 46: Plot showing relative variance between a 2 minute and 10 minute reaction
time.
The reaction rate appeared to accelerate with increasing sample surface area. An
increasing reaction rate with surface area is expected, but an accelerating reaction rate
deserves some explanation. It is believed that this acceleration is caused by sample
heating as the exothermic reaction proceeds. A hotter sample will naturally result in a
higher reaction rate, which will result in a hotter sample, etc. This positive feedback was

109
seen in the nearly instantaneous reactions observed when powder samples were exposed
to hot chlorine gas.
The temperature data obtained suggests that the reaction rate of zirconium with
chlorine is not dependent on temperature between 320 and 400 °C. However, there
seems to be a decrease in reaction rate as the temperature rises to 500 °C. This result is
somewhat counterintuitive to what would be expected, and deserves further research.
Figure 47: Summary of surface area study showing accelerating reaction rate as a
function of surface area, and a decreased reaction rate as a function of
temperature.

110
4.4.3 Study of Composition and Physical Shape (Zr14)
The final Zr experiment (Zr14) was used to determine the initiation temperature
for four different sample compositions and/or physical forms. One of the samples was
composed of crystal bar zirconium and was identical in shape to the samples used for the
surface area study. A second sample was composed of a Zircaloy-4 tube. A third
sample was composed of zirconium crystal bar turnings. The fourth sample was
comprised of zirconium powder. The samples were loaded into separate reaction vessels
and chlorine was introduced at room temperature following the purge process described
in Section 3.2.4. The temperature was increased at approximately 5 °C/min, and the
time and temperature of volatilization was observed and recorded for each of the four
samples and can be seen in Table 11.
Table 11: Volatilization onset temperature.
Sample T (°C) Time (min)
Powder 195 30
Turnings 232 40
Zy Tube 302 67
Crystal Bar 310 70
The powder began to volatilize at a system temperature much lower than the
volatilization temperature of zirconium tetrachloride (331 °C). This result is consistent
with the data seen in Figure 47 which show an accelerating reaction rate with increased
surface area. It can then be implied that it is possible to chlorinate a powder at much
lower system temperatures than is needed for bulk material. The high-surface-area

111
zirconium turnings also showed a much lower volatilization temperature than the 331 °C
volatilization temperature of zirconium tetrachloride.
The onset of volatilization for both Zircaloy-4 and crystal-bar zirconium were
found to be virtually identical. This was not unexpected, because Zircaloy-4 contains
98.5% zirconium. A significantly different volatilization onset temperature would have
indicated that the process being proposed in this research might not be suitable for
zirconium alloys widely used in the nuclear industry. The fact that the temperatures
were nearly identical implies that this process can be carried out on the Zircaloys with
little, if any, changes to processing equipment or production methods.
It should be noted that the onset temperatures found for Zircaloy and crystal-bar
samples are likely higher than what would be observed in an industrial system. The
reason for this is that the Zircaloy-4 tube and crystal-bar zirconium samples were heated
for over an hour before volatilization was observed. This incubation period likely
allowed these samples to pick up excess oxygen and nitrogen, which may hinder
chloride formation. This effect cannot be quantified based on the data obtained, but one
can safely assume that the volatilization onset temperatures observed are upper bounds
of what can be expected if careful practices are observed.
4.4.4 Zr Conclusion
The Zr-Series demonstrated that the chloride volatilization of zirconium is
dependent on surface area. The data suggests that the volatilization rate accelerates with
increasing surface area. This property is expected; in fact, it is the motivation behind
considering a hydride pulverization process prior to its chlorination. However, the
112
strong dependence on surface area could possibly indicate that the material does not
need to be reduced to a fine powder during the hydride pretreatment step, but simply
ground to smaller pieces. This is an important result because a hydride pretreatment step
may become the rate-limiting step for the process.
The second important result in this series is in the discovery that Zr volatilization
occurred at relatively low system temperatures for samples which had extremely large
surface areas. This was evident in dramatic fashion with the zirconium powder samples,
but was also notable with the zirconium-turnings. Both of these samples became so
exothermic in their reactions with the chlorine that they had to be removed from the
system due to safety concerns.
4.5 Series U50ZrFinal
The experiments described here represent the final series of data generated to
systematically demonstrate the temperature dependence of the separation of zirconium
and uranium from a U-50Zr alloy using elemental chlorine. A U-50Zr alloy was
prepared according to the procedure described in Section 3.2.5. This cast alloy was
sectioned into cylindrical samples with ~1 mm thickness and 14 mm diameter. Each
sample was exposed to chlorine according to the procedure in Section 3.2.5 at various
temperatures for 45 minutes and the mass change data are presented in Table 12.
As with the U50Zr series (Section 4.3), the volatilized material was physically
separated from the non-volatilized material, and these separated products were collected
and processed for analysis according to the procedures perfected in the previous
sections. The products were analyzed using EPMA to determine the relative

113
compositions of uranium and zirconium contained within the samples. This resulted in
data showing the dependence of temperature on the separation of these species.
Table 12: Summary of data from U50ZrFinal series.
Non-volatilized (NV). Volatilized (V).
Name %U %Zr T (°C)
U50ZrFinal-1NV 73.9 26.1 300
U50ZrFinal-1V 15.0 85.0 300
U50ZrFinal-2NV 98.5 1.5 400
U50ZrFinal-2V 15.4 84.6 400
U50ZrFinal-3NV 99.5 0.5 500
U50ZrFinal-3V 30.4 69.6 500
U50ZrFinal-4NV 98.8 1.2 360
U50ZrFinal-4V 15.8 84.2 360
U50ZrFinal-5NV 93.2 6.8 340
U50ZrFinal-5V 18.2 81.8 340
U50ZrFinal-6NV NA NA 280
U50ZrFinal-6V 26.3 73.7 280
U50ZrFinal-7NV 89.9 10.1 320
U50ZrFinal-7V 17.9 82.1 320
U50ZrFinal-8NV 85.3 14.7 380
U50ZrFinal-8V 20.0 80.0 380
U50ZrFinal-9NV 97.7 2.3 450
U50ZrFinal-9V 26.0 74.0 450
U50ZrFinal-10NV 95.9 4.1 340
U50ZrFinal-10V 14.9 85.1 340
4.5.1 Variable Selection and Justifications
The U50Zr-Final series builds upon all of the data obtained in previous series.
The data gathered in previous experiments was used both to justify assumptions used in
this series, as well as in the selection of variables and system parameters. The
independent variable in this series was temperature, with all other system parameters set
114
at values based on the previous tests in Sections 4.1 through 4.4 selected to generate
reproducible results.
Regarding sample fabrication, it was seen in the U50Zr series (Section 4.3) that
as-cast alloys had slightly variable compositions along their axial length and experience
has shown that the addition of a remelt step will decrease this compositional variation.
Even with a possible variation in composition among samples, the microstructure was
seen to be invariant even when the zirconium weight percent varied from 48-62%. It is
assumed that the volatilization reaction will be relatively independent of alloy
composition as long as the zirconium weight percent is roughly 50% along the length of
the as-cast alloy. Therefore, the U-50Zr alloy was cast, recast, and sliced, and the
samples were chosen at random among these slices.
The previous experiments also provided useful information regarding product
recovery and preparation for analysis following each successful experiment. The
techniques developed produce representative samples relatively free of impurities and
their compositions were readily obtained using EPMA. The result is a data series which
is believed to be of high quality.
In order to isolate temperature as the only process variable, all other possible
potential process variables were fixed. The possible variables include system pressure,
reaction time, and sample shape. It can be seen in Figure 13 that volatilization of ZrCl4
is only weakly dependent on system pressure. Therefore, the system pressure was
maintained at 6 psig out of convenience since the previous experience at that pressure
indicated functional operation of the chlorination system. The primary requirement was
115
that the system be operated at a positive pressure in order to avoid contamination from
the atmosphere. (Such a low positive pressure was selected to minimize the amount of
leakage out of the system, thus better simulating a totally static system.)
The reaction time was fixed at 45 minutes based on the data shown in Figure 42.
Those data show that the zirconium tetrachloride formation reaction is mostly complete
between 30 and 60 minutes for all temperatures of interest. In order to eliminate time as
a variable, 45 minutes was chosen because the reaction would likely have reached a
steady state at all temperatures studied within this timeframe.
The samples were prepared as thin disks of near-identical dimensions in order to
eliminate surface area as a variable. As shown in Figure 45, the variation in zirconium
chloride formation is negligible in samples of similar dimensions. The thin-disk shape
itself is used to justify the assumption that each sample’s surface area will change little
throughout the course of each 45 minute experiment as material is actively removed
through volatilization.
The temperatures for this series were also selected based on the data obtained in
the previous data series. The lowest temperature selected for this series was 280 °C,
which is slightly higher than the 271 °C to 278 °C threshold temperature noted in
Section 4.3.2.6 for experiments U50Zr6-U50Zr67. Previous experiments showed that
the most interesting temperatures for zirconium volatilization are those around the
tetrachloride volatilization temperature of 331 °C. Temperatures of 280, 300, 320, 340,
360, and 380 °C were studied in this final series resulting in a data set which contains
three temperatures above, and three temperatures below the volatilization temperature of

116
zirconium tetrachloride, spanning 50 °C in either direction. In addition, the temperatures
400, 450, and 500 °C were included to gain further insight into the volatilization of
uranium tetrachloride at higher temperatures. This test matrix results in a data set which
studies in detail the separation of zirconium from U-50Zr alloys at the temperatures most
relevant to an industrial process, as well as a rough study of the level of uranium
contamination which might be expected in the volatilized zirconium in the case of
elevated temperatures, accidental or otherwise.
4.5.2 U50Zr Final Results
Figure 48 and Figure 49 show representative sample surfaces of the non-
volatilized and volatilized samples, respectively. Throughout this series, the product
collection and conversion method developed for this research produced uniform
analytical samples that provided repeatable and reliable data. It should be noted that the
differences in contrast are simply due to different contrast settings during image
acquisition, and do not reflect compositional differences. That being said, it can be seen
that the predominately uranium samples shown in Figure 48 contain dark zirconium
spots, while the predominately zirconium samples shown in Figure 49 contain bright
uranium spots. This segregation is caused by the process which converts the chlorides to
their respective oxides. It was observed that the uranium and zirconium would begin to
segregate while in solution. In an effort to compensate for this, the samples were ground
using a mortar and pestle prior to final preparation. However, there would always be
“inclusions” in spite of these efforts. These spots are not believed to result in any
significant error due to their size when compared to the size of the 20 µm beam width

117
and 400 µm scanned beam length. Each of these line-scans was repeated three to six
times for each.
Figure 48: Backscattered electron image of non-volatilized samples. Experiment
U50ZrFinal-8 on left, experiment U50ZrFinal-10 on right.

118
Figure 49: Typical backscattered electron image of volatilized samples. Experiment
U50ZrFinal-7 on left, experiment U50ZrFinal-10 on right.
It can be seen in Figure 50 that the samples still contained some sodium. This
figure shows large-area EDS spectra of the non-volatilized and volatilized samples
showing large qualitative differences in the U/Zr ratio. The figure also shows an EDS
spectrum of one of the bright uranium “inclusions” seen in Figure 49. While these areas
contain a different composition when compared to the bulk material, the line-scan
technique is believed to eliminate the effect that this difference would cause when
analyzing the samples for this series.

119
Figure 50: Energy dispersive spectra of non-volatilized samples, volatilized samples,
and the bright portion within the volatilized samples. Plots are from
experiment U50ZrFinal-4.

120
As mentioned previously, all samples prior to experiment U50ZrFinal-5
contained no significant levels of contamination outside of a slight sodium
contamination. Experiments performed after experiment U50ZrFinal-4 marked a
departure from this trend. Experiments U50ZrFinal-5 and U50ZrFinal-6 especially
showed stainless steel contamination in the volatilized samples. The only source for this
contamination is from the stainless steel fitting which the glass reaction vessel was
connected to. This is further supported by Figure 51 which shows the difference in
stainless steel contamination for the non-volatilized and volatilized portions of
experiment U50ZrFinal-5. As can be seen, the non-volatilized portion contains no
contamination, while the volatilized portion shows significant Fe, Cr, and Ni
contamination. This is consistent with the geometry of the system. The volatilized
samples are collected from both the glass reaction vessel as well as the stainless steel
fitting which would inevitably have material deposited on it. In hindsight it would have
been better to have a system geometry which did not allow material to deposit within the
stainless steel fitting.
The stainless steel contamination is not believed to have had any effect on the U-
Zr ratio neither from an analytical standpoint nor is it believed to have affected the
volatilization of the material being studied. Checks were made to determine if the
stainless steel components would produce any interference in EPMA analysis, and no
interference effect was found. The stainless steel is not believed to affect the
volatilization because it is assumed that the steel contamination came from steel leaving
the surface of the fitting in the form of rust. This rust was never a volatilized component

121
nor was it even chlorinated and would therefore have no impact on the chlorination
process being studied. Experiments U50ZrFinal-5 and U50ZrFinal-6 contained the
highest levels of steel contamination. Once this was discovered, efforts were made to
clean the surface of the inside of the fitting with the effect of virtually eliminating any
traces of steel contamination from all future experiments.
The reason that this is mentioned is not so much because of its effect on
experimental results as much as because it is relevant to future system design. One of
the assumptions in developing this process was that a large portion of the equipment
could likely be constructed of low-cost stainless steel. This is in contrast to the exotic
materials which must be used for fluorination processes, for example. The fact that the
stainless steel fittings were actively corroded throughout the project indicates that the
previous assumption may not be valid after all. However, it should also be mentioned
that these fittings were continuously cycled between being exposed to chlorine, metal-
chlorides, water, ethanol, and acetone. It cannot be concluded that the chlorine or metal-
chlorides alone were responsible for the corrosion. That being said, it can also not be
concluded that the chlorine or metal-chlorides were NOT responsible. This is an area
where future research is needed.

122
Figure 51: EDS spectrum showing contamination of volatilized samples from
stainless steel fittings. Plots are from experiment U50ZrFinal-5.
It should be noted that the conditions of experiment 5 were repeated in
experiment U50ZrFinal-10. The reason for this was because the initial samples size for
experiment U50ZrFinal-5 was small enough that the entire sample was reduced to
chloride over the 45 minute time period. This is in contrast to all other experiments

123
which always had some bulk material which was not consumed after the experiment was
concluded. This was done intentionally so that there would always exist an excess
amount of the alloy starting material. Even so, the differences in results between
experiments U50ZrFinal-5 and U50ZrFinal-10, as seen in Table 12, are minimal and
virtually insignificant.
Another item worth discussing is that there is no data for the non-volatilized
portion of experiment U50ZrFinal-6. The sample was barely attacked by the chlorine.
This resulted in extremely small sample sizes. Enough material was collected for the
volatilized portion, but there simply was not enough non-volatile chloride present after
the experiment to be analyzed. It may be valid to assume that the non-volatilized portion
of experiment U50ZrFinal-6 is 50% Zr and 50% U, but this was not confirmed.
However, it fits with logic because this is the composition of the starting material, and it
also fits the trend of the data seen in Figure 52.
The final thing of note is that experiment U50ZrFinal-8 appears to be anomalous.
There is no obvious reason for its departure from the observed trend of the data,
especially for the non-volatilized sample. This experiment will therefore be ignored in
all future discussions.
The data from Table 12 are presented graphically in Figure 52. It can be seen
that, under these conditions, the uranium can be purified to nearly 99% at temperatures
exceeding 360 °C and to nearly 90% at temperatures as low as 320 °C. It is therefore
unlikely that any industrial-scale process will be required to operate at temperatures
greater than 360 °C. This is especially true considering that these experiments were

124
conducted on bulk specimens, where the proposed process suggests the use of metal
powder as the feed material. The reason that this is important is because the only reason
to increase the temperature above 360 °C is to speed up the process. If the starting
material is a metal powder, the process will likely occur instantaneously, as seen in
previous experiments, and an increase in temperature will have little to no effect on the
throughput of a facility. . It can also be seen that the removal of zirconium drops of
dramatically at temperatures lower than 320 °C. This suggests that the ideal temperature
for achieving purified uranium from a U-50Zr alloy is between the temperatures of 320
°C and 360 °C.
The data shows that the uranium content of the volatilized product stream
remains relatively constant at temperatures at and below 400 °C, and begins to increase
at temperatures above 400 °C. This is consistent with the increased vapor pressure of
uranium chloride at higher temperatures. It appears that the uranium-zirconium ratio for
the volatilized material is independent of temperature at the most likely temperatures of
operation, namely 320 to 360 °C. This seems to indicate that the recovery of a pure
zirconium product might not be possible under these conditions. However, it is possible
that the observed volatilization of uranium is more a product of the small size of the
system than it is to variables such as temperature. More research is needed before this
process can be used to produce a purified zirconium product.

125
Figure 52: U50ZrFinal data plotted as a function of temperature.

126
5. SUMMARY OF EXPERIMENTAL RESULTS
5.1 Motivation
The research presented in this dissertation was performed in order to gather
preliminary data for use in designing an industrial prototype system. This system would
take advantage of hydrogen’s ability to embrittle and pulverize both zirconium and
uranium. Previous research has shown that this pulverization occurs rapidly and at
temperatures which are on the same order as those needed for a chloride volatilization
process as shown in this dissertation. This means that it may be possible to add a
hydride pulverization pretreatment step to a chloride volatilization process with only
minimal changes to any existing equipment and process techniques. It is believed that
this pulverization step will result in a near instantaneous formation of volatile chloride,
which may then be selectively distilled based on the goals of the facility utilizing the
process. The production rate of the facility therefore becomes limited by the hydride
formation rate instead of the chloride formation rate.
It is believed that a hydride pulverization process will result in simpler plant
design because it allows for more precise control of system temperatures and reduces the
risk of local hot-spots forming. The formation of hot-spots was observed throughout the
course of this project, most notably during the initial testing of experimental systems. It
was seen that if chlorine were allowed to flow continuously over solid zirconium
samples, that they would become hot enough to glow orange and melt through the
borosilicate-glass reaction vessel. While the temperature of these samples was not

127
measured directly, the combination of an orange glow with the fact that the borosilicate
glass melted provides a conservative estimated temperature of at least 800 °C. It should
be noted that this temperature was achieved very rapidly; on the order of a few seconds.
This would greatly reduce the amount of material that an industrial facility could process
if it had to be designed to account for these hot-spots. The presence of hot-spots would
also all but eliminate the use of metallic alloys in the heated zone. As far as is known,
there are no existing alloys capable of surviving an 800 °C elemental chlorine
environment long-term.
Pulverizing the material prior to chlorination would result in a system who’s
temperature can be controlled in a more reliable and safe manner. It is proposed that the
chloride formation process would take place with material that has been fluidized. As
was seen in this project, the chlorination reaction occurs very readily for powdered
material, and at much lower temperatures than are needed for chloride volatilization.
Again, this suggests the use of a fluidized bed reactor with cooled walls for the initial
chloride formation process. The material would actively be deposited on the walls of the
reactor until the distillation process is to begin. This means that the equipment itself will
not be exposed to elemental chlorine at temperatures nearly as high as would otherwise
be needed if bulk material were processed with chlorine. This allows much greater
flexibility in equipment design and much longer lifecycles for all equipment used.
While the distillation temperatures might push the limits of fluorocarbons, they should
certainly be considered as being one of the primary construction materials. In fact, the
results obtained in this research suggest a distillation temperature as low as 320 °C,

128
which is pushing the limits of, but not outside of the realm of possibility for some of the
more exotic fluorocarbons.
The separation process itself will likely be a simple distillation process. Unlike
the experiments conducted for this dissertation, an industrial process will likely consist
of separate chlorination and distillation processes. This recommendation is a result of
consistent observations which indicate that the heat generated, and thus temperature
increase, by the chlorination reaction is not insignificant. This local temperature
increase would limit the control that a facility would have on the distillation products. It
seems much more likely that a process would achieve better separation results if the
chlorides are formed and then distilled in separate processing steps. The data obtained in
this research shows the results of a combined chlorination/distillation process. It was
seen that, while the non-volatilized portion of the material was virtually free of
zirconium, the volatilized portion contained significant uranium contamination. The
volatilized portions were enriched in zirconium and the uranium could likely be further
removed through the use of multiple distillation steps. However, the temperatures
studied were far below those at which one would expect to see uranium volatilization.
The fact that uranium volatilization was observed is believed to be a result of local
heating from the chloride formation process itself coupled with the simple geometry of
the system. The data gathered in this project will now be used to provide
recommendations for researchers and engineers who may wish to utilize this process in
the future.

129
5.2 Pulverization Process
The pulverization process itself is highly dependent on the nature of the alloy
being processed. It is for this reason that certain assumptions need to be made. This
project studied the volatilization of U-50Zr, however it is worth restating that the process
is certainly not limited to this exact alloy composition. Regardless, U-50Zr will be the
basis for the recommendations presented here.
5.2.1 Rate of Pulverization
Previous research has shown that the hydride formation rate is higher for pure
uranium compared to the rate of hydride formation in zirconium. While the hydride
formation rate is not known for U-50Zr alloys, a conservative estimate can be made by
using the rate of hydride formation in zirconium as the benchmark. It is important to
keep in mind that complete hydride formation is not necessary. Rather, sufficient
hydrogen embrittlement is all that is required to enable pulverization. Previous research
on hydride pulverization was conducted on Zircaloy-4 tubes which had a thickness of
0.83 mm. The results of this research showed that this material can be pulverized in less
than an hour. Because the inside and outside of these tubes were exposed to hydrogen, it
can be conservatively assumed that the pulverization will take place at a rate of 0.4128
mm/hour at each exposed surface. It is worth repeating that this reaction rate was
observed for the Zircaloy-4 alloy system. The hydride pulverization rate for U-50Zr
alloys will almost certainly be higher, perhaps dramatically higher.
Assuming a fuel-pin has a 10 mm diameter, one can safely expect total
pulverization to occur in no more than 12 hours. This time estimate assumes that the
130
fuel pins will remain fully intact until the hydride formation reaction is allowed to
consume the pin in its entirety. Not only is it unrealistic to assume that the material will
remain intact, it was observed in previous research that Zircaloy-4 would become fully
pulverized even at 50% hydride formation. This result reduces the maximum hydride
formation time to 6 hours. Even this estimate assumes the material remains intact until
50% hydride is formed, which is likely to be unrealistically conservative. Again, these
estimates are using the hydride formation rate as was observed in Zircaloy-4, where the
reaction rate, and thus pulverization rate, in U-50Zr is likely to be much higher. This
belief is due to the nature of the respective hydrides of uranium and zirconium; uranium
forms a naturally-spalling hydride, while zirconium does not.
The hydride pulverization rate can be further accelerated through mechanical
agitation of the material. This can be achieved through various well-known methods,
and it is the belief of the author that, in doing so, the gross pulverization rate can be
increased by an order of magnitude or more. The reason for this belief is that the surface
area will increase exponentially as the reaction proceeds, thus exponentially increasing
the reaction rate. While not supported by direct data, it is the educated opinion of the
author that pulverization of a 10 mm diameter fuel-pin can be achieved in less than an
hour. It is also important to note that this pulverization rate is independent of the amount
of material within any given reaction vessel, as long as an over-pressure of hydrogen is
maintained. Rather, the pulverization reaction is dependent on the surface area of the
material being reacted. It follows that the amount of material processed per batch is not

131
limited by the chemistry of the system; however, criticality concerns may limit the batch
size, depending on the type of material being processed.
5.2.2 Criticality Limits
As stated previously, the isotopics of the material to be processed is totally
dependent on the needs of the user, and assumptions cannot be made of the exact
composition of the material to be processed at this time. However, analysis can be
performed on the “worst-case” situation from a criticality standpoint. Although an
identical process can be used to remove gallium from plutonium-gallium alloys, the
focus of this discussion will be on U-235 as the main fissile isotope of interest. This is
not meant to imply that other fissile isotopes, such as Pu-239, may not be present in
material being processed using this method. In fact, it will certainly be present if
irradiated U-Zr fuel is to be processed, such as that originating from a breeder reactor
fuel cycle or the Traveling Wave Reactors (TWR). However, the isotopics of these
materials is entirely dependent on the irradiation history and time after irradiation,
making selection of a single specific material composition impossible.
5.2.2.1 Irradiated Fuel
A safety analysis of irradiated fuels is the most difficult situation to consider
from a criticality standpoint. The source of this material may be irradiated LEU/DU or
HEU fuel, each presenting its own unique challenges. The isotope of concern for
irradiated LEU/DU fuel is Pu-239. In this case, the system should be designed such that
the material is not able to achieve criticality due to the Pu-239 content. These concerns
are virtually independent of the chemical processes being employed, because the critical

132
mass of Pu-239 is lowest in its metallic state. It would be relatively straightforward to
design the system such that it incorporates material which contains neutron-absorbing
species. The neutron-absorbing material may be built into the equipment itself, or it may
be introduced into the hydride process as neutron-absorbing chemically-inert milling
balls, for example. This, combined with careful design of system geometry, can be used
to prevent criticality.
In the case of irradiated HEU, the situation is somewhat different, but not
prohibitively so. The critical mass of U-235 is appreciably reduced through the
formation of its hydride. The critical mass reaches a minimum at a hydride composition
of UH2, where the full hydride conversion of uranium is reached at UH3. This suggests
that all equipment and process design should be done with UH2 in mind, rather than
metallic uranium. Regardless, these concerns may be alleviated in a manner identical to
those used for material containing significant amounts of Pu-239. In the case of
irradiated fuel, the concerns due to potential criticality are reduced because of the likely
presence of significant quantities of poisoning fission products. Again, the exact
quantities and composition of this irradiated material is dependent so much on the
history of the material, that further discussion would be mere speculation.
5.2.2.2 Unirradiated HEU Fuel
If U-235 is the primary constituent and the only fissile isotope present, then the
situation gets more complicated. This is because the critical mass of uranium hydride is
appreciably less than that for uranium metal. This should be accounted for when
determining batch sizes for the hydride process. It can be shown that the minimum U-

133
235 critical mass is obtained for a hydride composition of UH2. As stated previously,
this result implores those performing equipment design to assume a presence of 100%
UH2 for all criticality calculations.
This case is perhaps the most critical from a criticality perspective. While Pu-
239 is certainly more sensitive to accidental criticality, realistically, any material
containing this isotope will be heavily contaminated by U-238 as well as an abundance
of neutron-absorbing fission-products. This is in contrast to virgin HEU material, which
has the potential to go critical at much smaller batch sizes. It is for this reason that it
may be prudent to consider hydride batch sizes of less than 18 kgU for unirradiated
HEU. This will be sufficient to prevent criticality even without the addition of neutron-
absorbing material. Although not directly studied in this project, it may be possible to
add hafnium directly to the reaction vessel in order to prevent criticality, thereby
increasing the batch size considerably. This hafnium is likely to be volatilized along
with zirconium during the volatilization process, but this has not been confirmed. This
means that the separated zirconium will require further processing if it is to be used
again for nuclear applications. Again, this decision is dependent on the needs of the
facility.
5.2.2.3 Unirradiated LEU/DU Alloy
Criticality is much less of a concern for unirradiated LEU alloys, and is not a
concern at all for DU. In fact, in the absence of a moderating material, uranium enriched
to less than 5.4% U-235 will never go critical under any normal circumstance. The
critical mass of 20% enriched uranium metal is 766 kg, which is likely near or

134
surpassing the amount of material which may be efficiently processed in a single batch.
The hydride process batch size for LEU/DU will therefore likely be limited by the
material-handling limits of the facility rather than those imposed by criticality limits.
5.3 Separation Process
The experimental aspect of the research presented in this dissertation focused on
the separation of uranium and zirconium through chloride volatilization. These
experiments were intended to demonstrate that this technique was capable of this
separation, and what conditions might be ideal to facilitate such a separation. Not only
was this shown to be possible, but it was seen that one may achieve near total removal of
zirconium from uranium-zirconium alloys using this method. While the non-volatilized
portion left behind following processing did contain between 1 and 2% zirconium even
in the best-case, this is still a dramatic reduction in zirconium content compared to the
starting material which contained 50% zirconium. It is not unreasonable to assume that
the zirconium content which was left behind is at least partially due to the formation of
chemically-inert surface-oxide on the alloy prior to reaction with chlorine. This suggests
that if material were to be processed which contains a lower surface area to volume ratio,
that the zirconium removal may be even greater. The samples being studied in the
U50ZrFinal experiments had thicknesses and diameters of 1 mm and 15 mm,
respectively. This corresponds to a surface area to volume ratio of 2.26 mm-1
. It is
unlikely that material being processed using this technique will have such a high initial
surface area to volume ratio. Assuming the material takes the form of a pin, as is
common for nuclear fuels, this ratio will decrease tremendously. If a pin of 10 mm
135
diameter and 100 mm length is processed, its surface to volume ratio will be 0.024 mm-1
,
a reduction of surface area to volume ratio of greater than two orders of magnitude. It is
proposed that this may translate to a corresponding reduction in zirconium content by
two orders of magnitude. For all practical intents and purposes, this would result in a
total elimination of zirconium from the alloy. To be clear, the intent of the hydride
pulverization process is to increase the surface area to volume ratio; however, preventing
the formation of surface oxide on this pulverized material is a straightforward matter.
Experimental evidence shows significant uranium contamination in the
volatilized portion which suggests that improvements should be made to the process. It
is likely that the recovery of uranium will be the primary concern for any facility
utilizing this process, especially if the uranium species involved is the valuable U-235
isotope. It follows that zirconium contaminated with up to 20% uranium may be an
unacceptable final product.
First, it should not be lost to the reader that the experiments conducted in this
research took place in standard test tubes whose dimensions are far from being
representative of an industrial-scale facility. The experiments were set up such that the
volatilization reaction would take place in a carefully controlled heated zone, and the
condensing of products would take place in an area outside of this heated zone, the
temperature of which was neither controlled nor recorded. Further, the physical
separation between the sample being reacted and the deposition zone was on the order of
10 cm, hardly characteristic of the equipment likely to be used in an industrial facility.
The reason why this matters is that the volatilization of uranium, and thus contamination

136
of the zirconium product, will be driven by several factors which were not controlled in
these experiments, but could easily be controlled in a larger system which is designed to
take advantage of a pulverized starting material.
The first difference in the experimental system presented in this dissertation and
an industrial system is that the experimental system was oriented horizontally. An
industrial process will likely take advantage of the buoyancy difference between the
chlorides of uranium and zirconium, whereas a horizontally oriented system is unable to
do so. It would be relatively easy to accomplish this task through the use of a larger
system with a condensation zone which is physically located above the initial reaction or
distillation zone. It may be possible to achieve greater separation and the creation of a
more pure zirconium product through the introduction of temperature-controlled
physical bottlenecks which would selectively allow zirconium chloride through, while
inhibiting the passage of uranium chloride. The temperature of this structure can be
maintained at a temperature slightly above the volatilization temperature of zirconium
tetrachloride thus encouraging condensation of uranium tetrachloride but allowing the
zirconium chloride to pass unimpeded. Distillation processes such as this are well
established and understood, and need not be discussed further.
The second major difference between the experimental system and an industrial
system is in the physical makeup of the starting material. The material used in the
experiments was a bulk alloy, whereas that used in the proposed industrial process will
be a metal powder. The importance of this distinction is that a bulk material is likely to
reach temperatures which exceed the desired system temperature for extended periods of

137
time, where a powder system can be designed such that the material is instantly turned to
chloride and subsequently deposited on the temperature-controlled vessel walls. This is
in addition to the clear advantages of eliminating local hot-spots as discussed earlier.
The small size of the experimental system, coupled with the use of bulk alloy, likely
resulted in material becoming volatilized due to temperatures which were higher than
that of the vessel walls, and the small system size gave preference to the now volatilized
uranium chloride to deposit in the cool zone instead of the heated zone. Again, this can
be eliminated through careful control of temperatures throughout a larger
reaction/distillation system, especially if these high local temperatures are not permitted
to exist in the first place.
5.4 Conclusion
The experiments performed during the course of this research showed that a
combined hydride/chloride-volatilization process can be used to separate zirconium from
uranium-zirconium alloys. The results obtained can be directly applied to designing an
industrial prototype system with expected batch sizes on the order of several kilograms
instead of the gram batch sizes which were studied for this project.
It was observed that a powdered material would be chlorinated nearly
instantaneously, while a bulk sample required a non-trivial reaction time before it was
fully consumed. This result supports the hypothesis that pulverizing the material prior to
chlorination may decrease the total processing time, thus increasing the throughput of an
industrial facility. Previous research has shown that both uranium and zirconium are
easily pulverized using a hydride/dehydride process.
138
It was also seen that selective volatilization of the chlorides can be used to
produce a uranium product which is nearly devoid of zirconium. This near-total
separation was seen to take place at temperatures above 320 °C. The zirconium product
was seen to be heavily contaminated with uranium, however. It is believed that this
result can be easily improved upon through careful equipment design.

139
REFERENCES
1) B. Lustman and F. Kerze Jr., The Metallurgy of Zirconium, McGraw-Hill Book
Company, Inc, New York: 1955.
2) J. Saling and A. Fentiman, Radioactive Waste Management, Taylor & Francis, New
York: 2001.
3) T. L. Yau, “Zirconium for Nitric Acid Solutions,” Industrial Applications of
Titanium and Zirconium, Philadelphia: 1986, Volume 4, pp. 57-68.
4) W. B. Lanhan and T. C. Runion, “PUREX Process for Plutonium and Uranium
Recovery”, ORNL-479, Oak Ridge National Laboratory: 1949.
5) J. L. Snelgrove, G. L. Hofman, C. L. Trybus, and T. C. Wiencek, “Development of
Very-High-Density Low-Enriched Uranium Fuels,” Nuclear Engineering and
Design: 1997, Volume 178, pp. 119-126.
6) T. Ellis, R. Petroski, P. Hejzlar, G. Zimmerman, D. McAlees, et al., “Traveling-
Wave Reactors: A Truly Sustainable and Full-Scale Resource for Global Energy
Needs,” Proceedings of ICAPP: 2010, Paper 10189.
7) G. D. Moon and P. Rudling, (Eds).: “Zirconium in the Nuclear Industry: 13th Int.
Symposium,” ASTM International, West Conshohocken, PA: 2002.
8) J. M. Markowitz: ‘‘Internal Zirconium Hydride Formation in Zircaloy Fuel Element
Cladding under Irradiation,’’ WAPD-TM-351, Westinghouse Electric Corporation,
Bettis Atomic Power Laboratory, Pittsburgh, PA: 1963.
9) K. Une, K. Nogita, S. Ishimoto, and K. Ogata, “Crystallography of Zirconium
Hydrides in Recrystallized Zircaloy-2 Fuel Cladding by Electron Backscatter
Diffraction,” Journal of Nuclear Science and Technology: 2004, vol. 41, pp. 731–
740.
10) S. Yamanaka, K. Yoshioka, M. Uno, M. Katsura, H. Anada, et al., “Thermal and
Mechanical Properties of Zirconium Hydride,” Journal of Alloys and Compounds:
1999, vols. 293–295, pp. 23–29.
11) H. M. Finniston and J. P. Howe, “Metallurgy and Fuels,” Progress in Nuclear
Energy, Pergamon Press, New York: 1956.
12) W. L. Mudge Jr., “Effect of Hydrogen on the Embrittlement of Zirconium and
Zirconium Tin Alloys,” Zirconium and Zirconium Alloys, American Society of
Metals, Cleveland, OH: 1953, pp. 146-167.
140
13) A. J. Parkison and S. M. McDeavitt, “Hydride Formation Process for the Powder
Metallurgical Recycle of Zircaloy from Used Nuclear Fuel,” Metallurgical and
Materials Transactions A: 2011, vol 42, pp. 192-201.
14) W. M. Mueller, Metal Hydrides, Academic Press Inc., London: 1969.
15) A. J. Parkison, “Hydride Production in Zircaloy-4 as a Function of Time and
Temperature,” Texas A&M University: 2008.
16) S. M. McDeavitt, A. J. Parkison, A. R. Totemeier, and J. J. Wegener, "Fabrication of
Cermet Nuclear Fuels Designed for the Transmutation of Transuranic Isotopes,"
Material Science Forum: 2007, vols. 561–565, pp. 1733–1736.
17) S. M. McDeavitt, D. T. Kraemer, A. Parkison, A. R. Totemeier, and J. J. Wegener,
"Zirconium Matrix Cermet Storage Form and Transmutation Fuel for Transuranics,"
Proceedings of American Nuclear Society Winter Meeting, Washington D.C.: 2005,
vol 93, pp. 743.
18) W. Sames, "Uranium Metal Powder Production, Particle Distribution Analysis, and
Reaction Rate Studies of a Hydride-Dehydride Process," Senior Honors Thesis,
Texas A&M University: 2011.
19) P. Chiotti and B. A. Rogers, “The Production of Uranium and Thorium in Powder
Form,” United States Atomic Energy Commission: 1950, AECD-2974.
20) H.H. Hausner and J. F. Schumar, Nuclear Fuel Elements, Reinhold Publishing
Corporation, New York: 1959.
21) M. A. Hunter, “Metallic Titanium,” Journal of the American Chemical Society:
1910, vol. 32 (3), pp. 330–336.
22) W. J. Kroll, “Method for Manufacturing Titanium and Alloys Thereof,” Germany
Patent No. 217,773, Luxemburg: 1938.
23) C. Bodsworth, The Extraction and Refining of Metals, CRC Press, Ann Arbor, MI:
1994.
24) W. J. Kroll, “The Production of Ductile Titanium” Transactions of the
Electrochemical Society: 1940, vol. 78, pp. 35–47.
25) P. Korbel and M. Novak, Encyclopedia of Minerals, Ribo International, Lisse, the
Netherlands: 1999.
26) A. E. van Arkel and J. H. de Boer, "Darstellung von reinem Titanium-, Zirkonium-,
Hafnium- und Thoriummetall," Zeitschrift für anorganische und allgemeine Chemie:
1925, vol. 148 (1), pp. 345–350.

141
27) J. Bigeleisen, M. G. Mayer, P. C. Stevenson, and J. Turkevich, “Vibrational
Spectrum and Thermodynamic Properties of Uranium Hexafluoride Gas,” Journal of
Chemical Physics: 1948, vol. 16, pp. 442.
28) E. P. Ney and F. C. Armistead, “The Self-Diffusion Coefficient of Uranium
Hexafluoride,” Physical Review: 1947, vol. 71, pp. 14–19.
29) G. D. Oliver, “The Vapor Pressure and Critical Constants of Uranium
Hexafluoride,” Journal of the American Chemical Society: 1953, vol. 75 (12), pp
2827–2829.
30) C. D. Harrington and A. E. Ruehle, Uranium Production Technology, D. van
Nostrand Company, Inc., New York: 1959.
31) L. J. Anastasia, E. L. Carls, A. A. Chilenskas, J. E. A. Grane, A. A. Jonke, et al.,
“Fluoride Reprocessing of Breeder Fuels,” U.S. Patent No. 3,753,920, United States:
1971.
32) M. A. Thompson, R. S. Marshall, and R. L. Standifer, “Pilot Plant Experience on
Volatile Fluoride Reprocessing of Plutonium,” Nuclear Metallurgy: 1969, vol 15, pp.
163-176.
33) J. J. Schmets, “Reprocessing of Spent Nuclear Fuels by Fluoride Volatility
Processes,” Atomic Energy Review: 1970, vol 8, pg. 3-126.
34) Y. Kani, A. Sasahira, K. Hoshino, and F. Kawamura, “New Reprocessing System for
Spent Nuclear Reactor Fuel Using Fluoride Volatility Method”, Journal of Fluorine
Chemistry: 2009, vol 130, pp. 74-82.
35) J. Uhlir and M. Marecek, “Fluoride Volatility Method for Reprocessing of LWR and
FR Fuels,” Journal of Fluorine Chemistry: 2009, vol 130, pp. 89-93.
36) L. J. Anastasia, P. G. Alfredson, and M. J. Steindler, “Reaction Model for the
Fluorination of Uranium and Plutonium Compounds in Fluidized-Bed Reactors,”
Industrial & Engineering Chemistry Process Design and Development: 1971,vol 10
(2), pp 150–157.
37) L. P. Hatch, J. J. Reilly, and W. H. Regan, “Fluidized Solids Process for Recovery of
Uranium from Zirconium-Type Fuel Elements,” U.S. Patent No. 3,149,909, United
States: 1964.
38) W. B. Blumenthal, The Chemical Behavior of Zirconium, D. van Nostrand
Company, Inc., New York: 1958.
39) R. F. Rolsten, Iodide Metals and Metal Iodides, John Wiley & Sons Inc., New York:
1961.

142
40) G. L. Miller, Metallurgy of the Rarer Metals: Zirconium, Academic Press Inc., New
York: 1957.
41) R. Sheldon and D. Peterson, “The U-Zr (Uranium-Zirconium) system,” Journal of
Phase Equilibria: 1989, vol 10, pp. 165-171.


![;R^ZR WZcZ_X hYZad fa a`]] WVgVc - Daily Pioneer](https://static.fdokumen.com/doc/165x107/6313be3f6ebca169bd0a9577/rzr-wzczx-hyzad-fa-a-wvgvc-daily-pioneer.jpg)