
uranium deposit development, exploration, resources
332
IAEA-TECDOC-961 Changes and events in uranium deposit development, exploration, resources, production and the world supply-demand relationship Proceedings of a Technical Committee meeting jointly organized by the International Atomic Energy Agency and the OECD Nuclear Energy Agency and held in Kiev, 22-26 May 1995 INTERNATIONAL ATOMIC ENERGY AGENCY
-
Upload
khangminh22 -
Category
Documents
-
view
2 -
download
0
Transcript of uranium deposit development, exploration, resources

IAEA-TECDOC-961
Changes and events inuranium deposit development,
exploration, resources,production and the world
supply-demand relationshipProceedings of a Technical Committee meeting
jointly organized by theInternational Atomic Energy Agency
and theOECD Nuclear Energy Agency
and held in Kiev, 22-26 May 1995
INTERNATIONAL ATOMIC ENERGY AGENCY

The IAEA does not normally maintain stocks of reports in this series.However, microfiche copies of these reports can be obtained from
IN IS ClearinghouseInternational Atomic Energy AgencyWagramerstrasse 5P.O. Box 100A-1400 Vienna, Austria
Orders should be accompanied by prepayment of Austrian Schillings 100,in the form of a cheque or in the form of IAEA microfiche service couponswhich may be ordered separately from the INIS Clearinghouse.

The originating Section of this publication in the IAEA was:Nuclear Fuel Cycle and Materials Section
International Atomic Energy AgencyWagramerstrasse 5
P.O. Box 100A-1400 Vienna, Austria
CHANGES AND EVENTS IN URANIUM DEPOSIT DEVELOPMENT,EXPLORATION, RESOURCES, PRODUCTION AND THE
WORLD SUPPLY-DEMAND RELATIONSHIPIAEA, VIENNA, 1997IAEA-TECDOC-961
ISSN 1011-4289©IAEA, 1997
Printed by the IAEA in AustriaSeptember 1997

FOREWORD
This report consists of the proceedings of the Technical Committee Meeting on RecentChanges and Events in Uranium Deposit Development, Exploration, Resources, Productionand the World Supply/Demand Relationship, held in co-operation with the OECD NuclearEnergy Agency (OECD/NEA) in Kiev, Ukraine, from 22 to 26 May 1995. It is the latest ina series of meetings organized for the exchange of information on recent developments inuranium related activities. Some of the information from this meeting was also used inpreparation of the 1995 edition of "Uranium — Resources, Production and Demand" a jointreport by the OECD/NEA and the IAEA.
At the beginning of 1995 there were 432 nuclear power plants in operation with acombined electricity generating capacity of 340 GW(e). This represents nearly a 100%increase over the last decade. In 1995 over 2228 TW-h of electricity were generated,equivalent to about 17% of the world's total electricity. To achieve this, about 61 000 t Uwere required as nuclear fuel.
For about a decade and a half uranium production and related activities have beendecreasing because of declining uranium prices. For many participants in the nuclear industrythere has been little interest in uranium supply because of the oversupplied market condition.The declining production led to the development of a supply and demand balance whereproduction is currently meeting a little over 50% of reactor requirements and the excessinventory is being rapidly drawn down. This very unstable relationship has resulted in greatuncertainty about the future supply of uranium.
One of the objectives of this Technical Committee meeting was to bring togetherspecialists in the field of uranium supply and demand to collect information on newdevelopments. This helps provide a better understanding of the current situation, as well asproviding information to plan for the future.
The IAEA is grateful to the Government of Ukraine, and in particular the StateGeological Enterprise "Kirovgeology", for hosting and assisting with organization of themeeting and the field trip. The IAEA is also grateful to "VOSTGOK" (East Mining andConcentrating Complex) for hosting the site visits to the uranium mining and milling facilitiesat Kirovograd and Zholty Vody. The untiring efforts of A.C. Bakarjiev, Director ofKirovgeology, and the staff of Kirovgeology who contributed to this successful meeting andfield trip are very much appreciated.
Special thanks are extended to participants of the Technical Committee meeting whocontributed papers and took part in the discussions. Thanks are also extended to: F. Barthel(BundesanstaltfurGeowissenschaftenand Rohstoffe, Germany), G. Erdi-Krausz (MecsekuranLtd, Hungary), M.A.G. Hassan (Nuclear Materials Authority, Egypt), M. Matolin (CharlesUniversity, Czech Republic) and A. Palfi (Ministry of Mines and Energy, Namibia), theSession Chairmen.
The IAEA staff member responsible for the organization and implementation of themeeting was D.H. Underhill of the Division of Nuclear Power and the Fuel Cycle.

EDITORIAL NOTE
In preparing this publication for press, staff of the IAEA have made up the pages from the originalmanuscripts as submitted by the authors. The views expressed do not necessarily reflect those of thegovernments of the nominating Member States or of the nominating organizations.
Throughout the text names of Member States are retained as they were when the text wascompiled.
The use of particular designations of countries or territories does not imply any judgement by thepublisher, the IAEA, as to the legal status of such countries or territories, of their authorities andinstitutions or of the delimitation of their boundaries.
The mention of names of specific companies or products (whether or not indicated as registered)does not imply any intention to infringe proprietary rights, nor should it be construed as an endorsementor recommendation on the part of the IAEA.
The authors are responsible for having obtained the necessary permission for the IAEA toreproduce, translate or use material from sources already protected by copyrights.

CONTENTS
Summary . . . . . . . . . . . . . . . . . . . . . . . . . . . . . . . . . . . . . . . . . . . . . . . . . . . . . 7
Production, inventories and HEU in the world uranium market: Production's vital role . . . . 9D.H. Underhill
The industrial types of uranium deposits of Ukraine and their resources . . . . . . . . . . . . . . 35A.Ch. Bakarjiev, O.F. Makhivchuk, N.I. Popov
Improvement of uranium production efficiency to meet China'snuclear power requirements . . . . . . . . . . . . . . . . . . . . . . . . . . . . . . . . . . . . . . 43R. Zhang
The uranium resources and production of Namibia . . . . . . . . . . . . . . . . . . . . . . . . . . . 49A.G. Palfi
A review of the Spanish uranium resources and recent developments in theprovince of Salamanca . . . . . . . . . . . . . . . . . . . . . . . . . . . . . . . . . . . . . . . . . 61J.A. Gonzdlez Granda, J. Ruiz Sdnchez-Porro, J. Arndiz de Guezala
Status of the McClean project, Saskatchewan, Canada . . . . . . . . . . . . . . . . . . . . . . . . . 85M. Giroux
Advances in the exploration model for Athabasca unconformity uranium deposits . . . . . . . . 101K. Wheatley, J. Murphy, M. Leppin, C. Cutts, J.A. Climie
Providing radiation safety for the environment and people at uranium ore mining andprimary processing operations and treatment of radioactive wastes in theNavoi Mining and Metallurgy Combinat, Uzbekistan . . . . . . . . . . . . . . . . . . . . . . 107N.I. Kuchersky
Uranium and environment in Kazakstan . . . . . . . . . . . . . . . . . . . . . . . . . . . . . . . . . . 115G. V. Fyodorov, E. Bayadilov, V. Zhelnov, M. Akhmetov, A. Abakumov
Uranium mining and rehabilitation: International aspects and examples from Germany . . . . . 123F.H. Barthel, D. Mager
The impact of Canada's environmental review process on new uranium mine developments . . 137R.T. Whillans
Uranium exploration target selection for proterozoic iron oxide/breccia complextype deposits in India . . . . . . . . . . . . . . . . . . . . . . . . . . . . . . . . . . . . . . . . . . 163K.K. Dwivedy, K.K. Sinha
Development of the Cerro Solo deposit and uranium favourability of the San JorgeGulf Basin, Province of Chubut . . . . . . . . . . . . . . . . . . . . . . . . . . . . . . . . . . . 177P.R. Navarra, A.F. Benitez
New results of the exploration for uranium ores in Romania . . . . . . . . . . . . . . . . . . . . . 187C. Bejenaru, D. Cioloboc
The Straz Block ISL project — Case history . . . . . . . . . . . . . . . . . . . . . . . . . . . . . . . 193V. Benes, J. Slezdk
Short geological description of the Inkai uranium deposit in south Kazakstan . . . . . . . . . . . 201A.A. Abakumov, V.P. Zhelnov
The exploration of uranium deposits of Ukraine by the ISL method . . . . . . . . . . . . . . . . . 203A.Ch. Bakarjiev, N.N. Makarenko
Radiometric map of the Czech Republic and uranium mineralization . . . . . . . . . . . . . . . . 207M. Matolin
Thorium deposits in the Commonwealth of Independent States and theirprospective characteristics . . . . . . . . . . . . . . . . . . . . . . . . . . . . . . . . . . . . . . . 213V. M. Kotova, J.I. Skorovarov
Uranium recovery from phosphonitric solutions . . . . . . . . . . . . . . . . . . . . . . . . . . . . . 221F.T. Bunuf, I. Miu
Geological-genetic classification of uranium deposits . . . . . . . . . . . . . . . . . . . . . . . . . . 229V.M. Terentiev, S.S. Naumov
The Streltsovskoye uranium district . . . . . . . . . . . . . . . . . . . . . . . . . . . . . . . . . . . . . 237A.P. Ischukova

The vertical distribution of uranium ore mineralization in the vein andmetasomatic deposits . . . . . . . . . . . . . . . . . . . . . . . . . . . . . . . . . . . . . . . . . . 251A.V. Zavanin, LA. Milovanov, V.I. Pigulsky, A.V. Tarkhanov
The mineral composition and the ore types of the uranium-vanadium depositSrednaya Padma (Onega Region, Russian Federation) . . . . . . . . . . . . . . . . . . . . . 259A.V. Boitsov
Genetic types of uranium deposits of Ukraine . . . . . . . . . . . . . . . . . . . . . . . . . . . . . . 271V.A. Anysimov
Classification system of the mineral reserves and resources of Ukraine . . . . . . . . . . . . . . . 277V.I. Lovyunikov
Evolution of uranium formation in Precambrian of Ukraine . . . . . . . . . . . . . . . . . . . . . . 285V.B. Koval, Yu.A. Fomin
Two main types of uranium deposit within Phanerozoic formations of Ukraine . . . . . . . . . . 287V.A. Shumlyanskiy
Uranium deposits: Main types and concepts for detection . . . . . . . . . . . . . . . . . . . . . . . 297G.A. Mashkovtsev, Ya.M. Kislyakov, A.K. Miguta,I.S. Modnikov, V.N. Shchetochkin
Uranium mining and production of concentrates in India . . . . . . . . . . . . . . . . . . . . . . . . 307J.L. Bhasin
The current situation of uranium mining in Hungary . . . . . . . . . . . . . . . . . . . . . . . . . . 333G. Erdi-Krausz
List of Participants . . . . . . . . . . . . . . . . . . . . . . . . . . . . . . . . . . . . . . . . . . . . . . . 339

SUMMARY
The Technical Committee Meeting on Recent Changes and Events in Uranium DepositDevelopment, Exploration, Resources, Production and the World Supply/Demand Relationshipwas held in co-operation with the OECD Nuclear Energy Agency in Kiev, Ukraine, from 22to 26 May 1995. It was attended by 68 participants from 20 countries and two internationalorganizations. A total of 36 technical papers covering uranium resources and supply relatedactivities in 14 countries were presented.
This was the first ever Technical Committee meeting dealing with uranium resources,production, supply and demand held in the Commonwealth of Independent States (CIS). Thelocation provided an exceptional opportunity for exchange of ideas and discussion betweenspecialists from the CIS and their colleagues from other parts of the world.
This meeting was particularly instructive in addressing several of the current issuesrelated to the uncertainty of future uranium supply and demand. Two concerns of greatimportance are: the very large imbalance between world uranium production and requirementsand the resulting inventory drawdown; and the integration of the nuclear industries of easternEurope and the Commonwealth of Independent States into the emerging worldwide uraniummarket. An additional important issue is the increasing concern for radiation safety andenvironmental concerns related to uranium production activities.
Of particular note are the early indications of uranium market price increases andincreasing interest in production activity reported at this meeting. Most significant among theseis the description of the status of the McClean Lake uranium production project by Giroux.This new mine/mill project is the first project developed in Canada since the late 1970s whenthe Key Lake project was initiated. Other developing projects are reported in Argentina(Navarra & Benitez), India (Bhasin) and Spain (Gonzalez Granda, Sanchez-Porro and Arnaizde Guezala). Information on the future Inkai ISL Project in Kazakstan is given in the paperby Abakumov and Zhelnov.
Although there are early signs of increases in the level of some uranium relatedactivities, the low priced uranium market has continued to force the closing of mines and millsand the resulting production cuts. This is noted in the Czech Republic (Benes & Slezak),Hungary (Erdi-Krausz), Kazakstan (Fyodorov, Bayadilov, Zhelnov, Akhmetov, Abakumov)and Uzbekistan (Kuchersky).
Uranium exploration activities have continued to experience cutbacks in most countriesof the world. Activities are primarily restricted to countries with uranium deposits with knownpotential for low cost production such as high grade unconformity and sandstone-type deposits.New insights into geological models for unconformity type (Wheatley, Murphy, Leppin, Cuttsand Climie), iron oxide breccia complex type (Dwivedy and Sinha), vein and metasomatictype (Zavarzin, Milovanov, Pigulsky and Tarkhanov), uranium-vanadium Padma-type(Boitsov) and volcanic type (Ischukova) uranium deposits are provided in this report. Thepaper by Ischukova, "The Streltsovskoye Uranium District" is the first detailed description inEnglish of the geology of the Russian Federation's only operating uranium production centre.
Many considerations related to uranium producing activities including radiation safety,socio-economic impacts and protection of the natural environment have an increasing influenceon the planning, development, operation and closure of uranium mining and processingfacilities. In his paper "The impact of Canada's Environmental Review Process on New

Uranium Mine Developments" Whillans reports: .."In Canada, the impact of the EA(Environmental Assessment) process on new uranium mining developments has been profound.It has changed the way projects are designed and will change the way they are brought onstream. The process has been tune consuming and often difficult, but it has revealed that thesenew uranium mining proposals are environmentally sound and can remain so over theirlife-span."
Additional views on the subject are discussed in papers from the Czech Republic (Benesand Slezak), Germany (Barthel and Mager), Kazakstan (Fyodorov, Bayadilov, Zhelnov,Akhmetov, Abakumov) and Uzbekistan (Kuchersky). The influence of socio-economic andenvironmental considerations are stated by Whillans.
The paper entitled "CIS Thorium Deposits in the Commonwealth of Independent Statesand Their Prospective Characteristics" by Kotova and Skorovarov, is a useful companionpaper to "Thorium Deposits and Their Availability" by F.H. Barthel and F.J. Dahlkamp,whichappeared in IAEA-TECDOC-650, "New Developments in Uranium Exploration, Resources,Production and Demand" (1992), and provides information on thorium resources for formernon-WOCA countries.
The paper "Radiometric Map of the Czech Republic and Uranium Mineralization"(Matolin) provides a clear example of radiometric data collected to explore for uranium wasused to prepare a map of the natural radioactivity of the Czech Republic.
Several papers describing various aspects of uranium in Ukraine provide a broad insightinto the uranium geology and resources of the country: Anysimov; Bakarjiev, Makivchuk,Popov; Lovyunikov, Shumlyanskiy; and others. One paper provides the first report of the useof in situ leach uranium mining in Ukraine (Bakarjiev and Makarenko).
This report provides an update of information from the TCM on Recent Developmentsin Uranium Resources and Supply, held in Vienna, 24-28 May 1993, the proceedings ofwhich were published as IAEA-TECDOC-823 (1995). One of the principal results of thesereports is to provide information on the world's uranium resources and production facilitiesthat will be necessary to fill the increasing uranium fuel requirements for the rest of thecentury and beyond.

XA9745121PRODUCTION, INVENTORIES AND HEU IN THE WORLDURANIUM MARKET: PRODUCTION'S VITAL ROLE
D.H. UNDERBILLInternational Atomic Energy Agency,Vienna
Abstract
This paper analyses recent uranium supply and demand relationships and projects supply through 2010. Itdiscusses how the extremely depressed record low market prices have led to the ongoing annual inventory drawdownof over 25 000 t U resulting from the current 45% world production shortfall. It describes how the policy of theEuropean Union and anti-dumping related activities in the USA are restricting imports of uranium from CIS producersto a majority of the world's nuclear utilities. These factors are reducing low priced uranium supply and forcing buyersto again obtain more of their requirements from producers. It discuses how the sale of Low Enriched Uranium (LEU)produced from of 5501 High Enriched Uranium (HEU) from Russia and Ukraine could potentially supply about 15 %of world requirements through 2010. However, legislation currently being developed by the US Congress may rationthe sale of this material, extending the LEU supply well into the next century. While the low cost supply isdecreasing, nuclear generation capacity and its uranium requirements are projected to grow at about 1.5% through2010. Demand for new uranium purchases is however, increasing at the much higher rate of 25-30% over the next10-15 years, because of the increasingly large amount of unfilled demand of reactor operators. This increasingdemand in the face of decreasing supply is resulting in a market recovery in which the spot price for non-CISproduced uranium has risen over 25 % since October 1994. Prices will continue to increase as the market equilibriumshifts from a balance with alternative excess low priced supply to an equilibrium between production and demand.This change is taking place as the inventory is further depleted, CIS import restrictions are becoming more fullyenforced and the rate at which LEU from HEU will enter the market is expected to become more clearly defined.It is anticipated that production must increase from current levels of about 32 000 t U/year, supplying 55% ofrequirements, to about 60 000 t U/year or greater to meet 80 to 90 % of worldwide reactor requirements through 2010(and beyond). The necessary production increase will occur only after market prices have risen to cover fullproduction costs plus a profit. Higher prices are absolutely essential to assure production's vital role in supplying thefuture fuel supply of the world's nuclear reactors.
WORLD URANIUM MARKET OVERVIEW
During 1994 the average annual spot uranium price again fell to an all-time low, as theworldwide uranium industry continued to produce at far below world reactor requirements. Bothuranium producers and buyers continued to have great difficulty in planning for the future becauseof uncertainty introduced by political decisions that will, in part, define the fundamental nature of thefuture uranium market. The political decisions relate to the demilitarization of high enriched uranium(HEU) from warheads for use in civilian fuel and the changing restrictions on the sale of uraniumproduced in the Commonwealth of Independent States (CIS).
Over the last 6 years there have been severe reductions in nearly all phases of the worlduranium industry, caused by a massive oversupply that led to the lowest market prices ever recorded.The crisis has been complicated by the merger of the uranium markets of the previously mutuallyexclusive areas, formerly known as WOCA (the world outside centrally planned economies area) andnon-WOCA1. This led to the sale on the world market of uranium produced by the CIS, followed bylegal and political initiatives in the European Union and the United States of America designed tostabilize the market and protect WOCA producers.
While the WOCA and non-WOCA designations are no longer applicable, these terms are neverthelessstill useful for describing the present transition to a fully integrated world market.

The rapid drawdown from the WOCA uranium inventory has brought the inventory to a levelwhere market analysts conclude there is little excess material available for sale. The approachingexhaustion of the excess WOCA inventory and the restrictions on the purchase of CIS produceduranium are respectively, eliminating and controlling, these alternative supply sources. This ishappening when the demand for uranium not under contract is projected to increase at a high rate.
Many market participants perceive that the oversupplied condition that has existed for over15 years will continue because the introduction of low enriched uranium (LEU) derived from HEUwarheads will provide an additional low priced supply. Results of analysis indicate, however, that thefundamental supply and demand balance is changing to a balance between production and demand.The near exhaustion of excess WOCA inventory and restrictions on CIS produced uraniumsubstantially reduces the low priced supply. It is expected in the near term that insufficient LEUproduced from HEU will be offered for sale to offset this reduction in supply. This will result in arelative shortage causing market prices to continue their increase. This reduction of supply alternativesoccurs at a time when demand for uranium is sharply rising. Analysis shows unfilled requirementsare increasing at a compounded rate of 25 to 30% per year.
In the longer term the majority of the supply will have to come from new production. TheLEU from the 5501 of warhead HEU purchased by the United States of America from Russia (500 t)and Ukraine (50 t) and other surplus supplies from the USA will probably meet between 5 and 17%of WOCA requirements through 2010. Maintaining production at 1994 levels would meet only about47% of world requirements through 2010. Therefore production will have to increase substantiallyto meet the requirements not met by other supply sources. New production will only be available,however, if market prices rise sufficiently to pay production costs and provide for a return oninvestment. It appears that the current market price may continue to rise to price levels that stimulatethe increased production that is essential for meeting future reactor requirements.
Uranium market prices
Sales on the world uranium market consist of two types: immediate or near term delivery,referred to as spot sales, and longer term multi-annual sales made under contract. The mostcommonly quoted market indicator for the spot price is the NUEXCO exchange value (or NEV)2.Similar indicators are also published by NUKEM (price range) and others. In this publication,reference is made to the NUEXCO exchange value. As was reported in previous years, the annualaverage spot price peaked in mid-1978 at US $112.85/kg U ($43.40/lb U3Og)3. By 1990 the averageprice had fallen to $25.40/kg U ($9.75/lb U3Og) and continued its decline in 1991 and 1992, with ayearly average of $20.67/kg U ($7.95/lb U3Og) in 1992. This price range represented a historical low(Fig. 1).
Restrictions on imports into the USA resulting from settlement agreements between the USGovernment and governments within the CIS, as well as actions by the European Union, led to thedevelopment of a two price system for spot sales made after October 1992. For countries with noimport restrictions, the 1993 price averaged $18.57/kg U ($7.13/lb U3Og), while for those countrieswith restrictions the price averaged $26.00/kg U ($10.00/lb U3Og). The unrestricted price started 1994at $18.20/kg U ($7.00/lb U3O8), remained relatively constant, but increased modestly to $18.72/kg U($7.20/lb U3O8 ) in December. The annual average for 1994 was an all time low of $18.24/kg U($7.05/lb U3Og). For those countries with restrictions on imports the price averaged $24.35/kg U($9.31/lb U3Og). Following the increase started in November 1994, the restricted spot price continuedto climb in 1995, reaching $31.20/kg U ($12.00Ab U3Og) during early May. (Fig. 2). This 30%
2 Published by NUEXCO until December 1994, and TradeTech after this date.
All prices are reported in current US dollars.
10

800
700
*- 600
500
o= 400
c
§300
200
100
0
12011010090 z>80 3
70 §60
I I I I I I I
50 |CO40 -g
3020100
1972 73 74 75 76 77 78 79 80 81 82 83 84 85 86 87 88 89 90 91 92 93NUEXCO EV Expl.Exp* EV+RMP
' Exploration Expenditures from 1993 Red Book
94
FIG. 1. WOCA uranium exploration expenditures vs average NUEXCO exchange values.

14
12
0);g'xO 10
Spot uranium price(restricted)
»V»-r.-.-»-**-
Spot uranium price(unrestricted)
35
30
25 i
20
15
June Aug Oct Dec Feb April June Aug Oct Dec Feb April June Aug Oct Dec Feb April'July Sept Nov Jan March May July Sept Nov Jan March May July Sept Nov Jan March May*
1992 Exchange Value Rmp + EV 1995
From NUEXCO
* from TRAOETECRmp = Restricted Market Penalty
FIG. 2. Recent spot market prices.

120
100 -
80
5560
40
20
40
30
20
10
1ODn
1972 74 76 78 80 82
Av. NUEXCO "EV" Av. US - domestic U(spot price)
84 86 88 90 91 92 93 94
Av. US - imported Av. Canada Av. EURATOM
FIG. 3. Development of selected uranium prices.
increase over 6 months brought the spot price to its highest value since November 1988. Theunrestricted price also recorded an 8% increase since October 1994.
Limited data on long term contract prices are available. Fig. 3 shows a comparison of theaverage delivered prices for Australia, Canada, the USA and Euratom. With the exception of Euratomwhich reports both spot and multi-annual prices, these prices are based on variable amounts of bothspot and long term sales. All average delivered uranium prices were lower in 1993, the most recentyear for which data is available. This continued a general decline in all uranium prices that startedin the early 1980s.
MAJOR MARKET EVENTS
Three major events have taken place in the last few years that significantly impact the futureuranium supply through the end of the century and beyond. These events are: 1) anti-dumping relatedactivities in the United States, 2) restrictions on the sales of CIS produced uranium in the EuropeanCommunity and 3) plans for Russia, Ukraine and USA to demilitarize HEU weapons material. Thefirst step in weapons conversion involved the signing of a purchase agreement by the United Statesfor 5001 HEU warhead material from the Russian Federation. Ukraine has also agreed to give up 50 tHEU warhead material. The US is currently evaluating both their natural and enriched uraniuminventory and have announced preliminary plans to sell surplus material as reactor fuel.
Anti-dumping settlement agreements and amendments
One of the greatest influences on uranium trade resulted from the Anti-dumping Petition inthe USA. In October 1992, DOC announced that final suspension agreements were signed with theRepublics of Russia, Kazakhstan, Ukraine, Kyrgyzstan, Uzbekistan and Tajikistan. The suspensionagreements established quotas on the importation of all uranium products from all of the CISRepublics except Kyrgyzstan and Tajikistan.
The suspension agreements prohibit any CIS uranium imports to the USA until the marketprice reaches $13 per pound U3Og ($33.80/kg U). The market price is determined by the DOC andsome CIS uranium is still allowed to be imported (irrespective of the DOC market price) undergrandfathered contracts (subject to DOC approval) entered into with US utilities before March 5,1992. At this price ($13 per pound U3Og), the total amount of nuclear material allowed to be importedinto the USA is 2.9 million pounds U3Og (H15 t U) equivalent. Larger amounts are allowed to beimported as the price increases. A total of 15.8 million pounds U3Og (6077 t U) equivalent would bepermitted above $20 per pound U3O8 ($52/kg U) equivalent. Above $21 per pound ($54.6/kg U), nolimits exist except for a ceiling on Russian material of 5.5 million pounds U3Og (21151 U) equivalent.As a result of termination of the settlement agreements by Tajikistan and Ukraine, these two countriescan import uranium (excluding HEU from Ukraine) to the US provided they pay anti-dumping duties[1].
The DOC marked price has remained below $13 per pound U3Og since the settlementagreements were signed with the CIS countries and therefore no uranium subject to the settlementagreements has been purchased by US utilities. As of 1 April 1995 the DOC-determined price was$12.06fib U3Og ($31.36/kg U). Continued upward movement in the market could soon bring theDOC-determined price above $13.00/lb U3O8 thereby allowing the sale in the USA of uraniumproduced by Kazakhstan and Uzbekistan.
14

Agreement with Russian Federation renegotiated
As part of the consideration for the 500 t HEU purchase, Russia and the USA renegotiatedthe settlement agreements between the two countries relating to the US anti-dumping proceedings. Theamended agreements, signed on 12 March 1994, will give Russian uranium more access to the USmarket. Under this amendment, which defers the settlement agreement until 2003, slightly over2500 t U equivalent of Russian origin can be imported to the US in 1994 and 1995, if that materialis matched with "newly produced" US natural uranium. This amendment also authorizes additionalmatching deliveries of natural uranium up to, but not exceeding, specified levels set for each of theyears 1996 through 2003. This level starts from about 7401U in 1996 increasing to around 1650 t Uby 2003 [2].
By 1 April 1995 approved matched uranium sales under the amended settlement agreementwith Russia had reached 1850 t U or 74% of the first year quota. This involved fourteen uraniumsales and 1 enrichment contract [3].
Agreement with Kazakhstan renegotiated
On 27 March 1995 the Republic of Kazakhstan and DOC signed an amendment to theKazakhstan Suspension Agreement. The Amendment lasts for 2 years and allows the import to theUS of 385 t U (1 million pounds U3Og) after the DOC-determined price reaches $12/lb U3O8($31.20/kg U). In exchange, Kazakhstan agreed to stop the use of its uranium in "by-pass" uraniumenrichment sales. The DOC-determined price for 1 April 1995 was $12.06/lb U3O8 ($31.36/kg U).Under the amendment Kazakhstan was permitted to import 195 kg U (500 000 Ibs U3O8) until October1995, the date the next DOC price determination is made [3].
The DOC and Uzbekistan are also negotiating an amendment to their suspension agreement.At the time of the preparation of this paper the amendment had not yet been signed.
European Community policy regarding CIS uranium imports
Because of concerns for the potential market destabilizing effects of large imports of CISorigin uranium that were being offered on the European Community market at prices judged to bearno relation to cost of production in Western terms, corrective measures were established by theEuropean Commission and Euratom Supply Agency. The measures are essentially based on theAgency's exclusive right to conclude contracts as provided for in Article 52 of the Euratom Treaty.In response to a question put to the European Parliament during the November 1992 session theCommission provided the following response:
"By virtue of Article 2 (d) and (c) of the Euratom Treaty, the Community must ensure thatall users in the Community receive a regular and equitable supply of ores and nuclear fuels andensure the establishment of the basic installations necessary for the development of nuclear energy.For this purpose, the Euratom Supply Agency was established which, under the provisions of ChapterVI of the Euratom Treaty - and more particularly its Article 52, 2 (b) - has inter alia an exclusiveright to conclude contracts for the supply of nuclear materials. Massive imports at extremely lowprices, coming from the CIS republics risk endangering the diversification of the Community's supplysources and hence its long-term security of supply and the viability of its production industries. Thatis why the Supply Agency, in exercising its right to conclude contracts is ensuring the Community doesnot become over-dependent on any single source of supply beyond reasonable limits and that theacquisition of nuclear materials from CIS republics takes place at prices related to those on themarket; that is to say prices which reflect cost of production and are compatible with prices ofproducers in market economy countries." [4].
15

According to the Euratom Supply Agency: "In practice, the approach of the Euratom SupplyAgency was pragmatic and flexible and took into account the different aspects of the specificsituations of the utilities concerned and any divergences of opinions expressed. Reaction to theAgency's approach have been generally positive. Transacting parties have increasingly informed theSupply Agency of their intentions in advance of the finalization of contractual terms. This in turn hasmeant that in only a very few cases was it necessary to introduce modifications to any contracts ornot to proceed with their conclusion. "[4]
Prior to 1994 Euratom acted to limit the amount of EC purchases of CIS uranium to about30001 U per year. In 1994 the CIS uranium imports to the EC increased to a little over 40001U [3].Euratom also indicated that they continue to monitor the policy and maintain the option of eventuallychanging the policy.
New supply — US purchase of warhead high enriched uranium from the Russian Federation andUkraine
Significant amounts of uranium from demilitarized nuclear weapons are expected to enter thecivilian market after 2000 as the result of purchase agreements between the Russian Federation,Ukraine and USA. Worldwide efforts to reduce nuclear weapons led to the June 1994 agreementbetween the Russian Federation and the USA for the transfer to the United States EnrichmentCorporation (USEC) of LEU blended from HEU from dismantled Russian nuclear weapons inexchange for cash payments by the USEC. Under the 20 year agreement the USA will pay about$11.9 thousand million (in 1993 dollars) in exchange for 5001 HEU having an assay of 90% or moreof ^U. This will be blended down, prior to shipment to the USA, to 15.3 million kg U containing4.4% ^U, equivalent to 153 0001 U (natural). The USEC will purchase 10 t HEU per year for thefirst 5 years and 30 t HEU per year over the next 15 years.
In a parallel tripartite agreement of the same date between Russian Federation, Ukraine andUSA, an additional 501 HEU hi Ukrainian nuclear weapons is to be part of the purchase agreement.Under agreement of 6 June 1994 the Russian Federation proposed to ship 301 HEU as UF6 or UO2to the US; this HEU was derived from dismantled Ukraine weapons. The material would be blendeddown to LEU in the US under the direction of Matek, a joint venture planned to help implement theUS-Russian HEU sales. Matek consists of 2 US firms with a 20% interest and 6 Russian firms witha 80% interest. The 5501 HEU under these agreements is equivalent to about 168 4001U (natural).[2].
\The first shipment of LEU blended from HEU under the Russian/US agreement, scheduled
for June 1994, was delayed due to difficulties hi resolving the transparency issue (i.e. assurance thatthe LEU is warhead derived material). The first shipment of about 301 LEU, equivalent to about 1 tHEU, is expected in the spring of 1995. There has been speculation that this LEU could enter themarket at the annual rate of up to 17 5001 U, starting as early as 2003. The settlement agreementsbetween the Russian Federation and the USA preclude large quantities of this material from being soldprior to 2003 as it may only be sold hi "market-neutral" transactions during this period.
URANIUM PRODUCTION, SUPPLY AND DEMAND
Production
The 1994 world uranium production is estimated to be 31 3001U (Fig. 4). This is about 5%less than the estimated 1993 production of 32 2001U and 48% less than the 1988 level [1]. Estimated1994 production in the former WOCA was 22 0001 U. In general, 1994 uranium production hi mostcountries remained the same or decreased from the previous year. Canada was a major exceptionwhere production increased by about 380 t U or 5%, while there were smaller increases in Namibia,
16

Canada
NigerUzbekistan
Russian FederationAustralia
Kazakhstan
Namibia
South Africa
United StatesFrance
Ukraine
Czech RepublicGabonChina
HungarySpainIndia
Argentina
34%
92%
8%
73%
67%
67%
54%
51%
41%
3 2%
32%
2.1%
21%
19%
1.3%
08%
06%
04%
Romania §03%
Mongolia §03%
Germany |02%
Bulgaria |02°/«Brazil |02%
Belgium |01%
Portugal |01%
Pakistan |01%
FIG. 4 Estimated 1994 world uranium production and rank (total 31 400 t U)

Spain and the US. The largest decrease was in France, where production fell by 40% to about1000 t U. In 1994, production took place in 26 countries. Recovery of uranium was stopped inGermany bringing to an end production in what was the world's third largest producing industry.However, nearly 90% of the 1994 world uranium production occurred in 11 countries that eachproduced 1000 t U or more. They are: Australia, Canada, France, Kazakhstan, Namibia, Niger, theRussian Federation, South Africa, Ukraine, the USA and Uzbekistan. Most of the remainder wasproduced in China, the Czech Republic, Gabon and Hungary. Canada continued its position as theworld's largest producer, increasing its share to over 30% of the total.
Supply and demand
In 1994 the estimated world production of 31 300 t U met only 54% of the world reactorrequirements of 58 4001 U (Fig. 5). World uranium production has been below world requirementssince about 1990 (Fig. 6). Non-WOCA production, estimated at 9500 t U was about equal tonon-WOCA requirements in 1994. It had exceeded non-WOCA demand since 1988, the first year thatproduction estimates are available for the country group (Fig. 7). In 1994, estimated WOCAproduction of 21 9001 U met only 44% of WOCA requirements of about 49 2001 U (Fig. 8). Therewas a resulting worldwide shortfall of about 27 1001 U and a WOCA shortfall of about 27 300 t U.Today the uranium market no longer conforms to the traditional supply and demand model ofproducers selling only to utilities. Secondary market transactions have also been important in recentyears. Such transactions include sales, loans and exchanges of natural and enriched uranium byutilities and brokers, including all transactions except the direct purchase by a utility of uranium froma domestic or foreign producer.
WOCA supply and inventory
In the former WOCA, uranium production has been below reactor requirements since 1987.The gap between production and requirements grew from about 4000 t U hi 1988 to about 27 700 t Uin 1993 and remained nearly the same at 27 200 in 1994 (Table I). The cumulative productionshortfall over this period was about 124 000 t U. For the same period uranium imports to the USAand the European Community from the former USSR and its successor States increased from 105 thi 1988 to about 5600 t U hi 1991 and then decreased and stabilized hi the 4000 to 5000 t U rangein 1992 and hi 1993 [4, 5, 6]. hi 1994 these imports are estimated to be 9450 t U. This included4000 t U and 2000 t U, respectively for the EU and US. An additional 3450 t U of CIS produceduranium was enriched hi Europe and then imported to the US (i.e. the "by-pass" option discussedbelow) [7]. The imports for the period totalled nearly 24 000 t U. This left an accumulated shortfallof nearly 95 0001 U (or about 250 million pounds U30g). A small part of this shortfall was met byimports from China and through imports of CIS and other non-WOCA produced uranium to countriesother than those of the European Union and the USA.
Starting hi 1994 a portion of the US supply was also met through the so-called "by-passoption". Under this acquisition strategy US nuclear utilities elected to buy CIS produced uranium thatwas then enriched in Europe before its import to the US. Nukem reported that hi 1994 US utilitiesbought nearly 3450 t of CIS uranium that was enriched hi Europe [7]. Under the SettlementAgreements between the US and CIS countries this was viewed as a substantial transformation of theCIS produced uranium, thereby making it exempt from import restrictions. When this practice rapidlyincreased hi 1994, the parties to the US anti-dumping litigation concluded this was a circumventionof the agreements and asked the US Department of Commerce to disallow the practice in the future.
Based on this analysis, it is estimated that a cumulative WOCA supply shortfall of about85 000 t U occurred during the period 1988-1994. This shortfall was met by drawdown of WOCAinventories. Drawdown is estimated to be continuing in 1995 at a rate of 15 000 to20 000 t U/annum.
18

Australia 2,100 3.6%
Production Shortfall 27,100 46.4%
Canada 9,560 16.4%
France 1,000 1.7%Kazakhstan 2,100 3.6%
Namibia 1,700 2.9%
Niger 2,900 5.0%
Russian Federation 2,300 3.9%
South Africa 1,600 2.7%Ukraine 1,000 1.7%
USA 1,300 2.2%
Uzbekistan 2,500 4.3%
Others 3,213 5.5%
World Demand: 58,4001U / World Production: 31,3001UOthers Argentina, Belgium, Brazil, Bulgaria, China, Czech Republic, Gabon,Germany, Hungary, India, Mongolia, Pakistan, Portugal, Romania and Spain
FIG. 5. Estimated 1994 world uranium production vs. reactor related demand

(00CC
70,000
60,000
50,000
40,000
30,000
20,000
10,000
ExcessProduction
ProductionShortfall
(85 400 t U (e))
1988 1989 1990 1991 1992 1993 1994 (e)
(e) estimate
World Demand World Production
FIG. 6. World uranium production and demand.

30,000
25,000 -
20,000
C 15,000I
10,000
5,000
Excess Production
1988I
1989 1990 1991
Production Demand
1992 1993 1994
FIG. 7. Non-WOCA production and demand.

N)60000
50000 -
40000 -
30000 -
20000 -
10000 -
ProductionShortfall(124,OOOtU(e))
140
120
1305
100*
i80
60
O
(X
40
1973 1974 1975 1976 1977 78 79 80 81 82 83 84 85 86 87Production Demand Spot Price
UJLLUL]89 90 91 92 93 94 (e)
20
0
e - estimated
FIG. S. WOCA uranium production and demand vs. NUEXCO spot price.

250,000
200,000
150,000
.o
100,000
50,000
World Production
EstimatedWOCA Inventory
•WOCA ProductionWOCA Imports
World Requirements
WOCA Requirements
• 5501 HEU Equivalent* I I I I Ml I
1986 1987 1988 1989 1990 1991 1992 1993 1994 1995 1996 1997 1998 1999 2000 2001 2002 2003 2004 2005 2006 2007 2008 2009 2010
Not accounting for: CIS civilian stockpiles; U.S. and CIS HEU other than 5501 HEU from Russian Federation and Ukraine
tou> FIG. 9. Historical development of uranium supply and demand.

The inventories being used to fill the production gap consist of material in the civilian sector(utilities, governments, producers, traders and others). The civilian stocks include strategic stocks,pipeline inventory and excess stocks available on the market. Based on analysis of published reports,the total former WOCA non-military inventory was estimated to be between 130 000 to 150 000 t Uas of 1 January 1995 [8, 9, 10, 11]. Of this amount WOCA utilities are estimated to hold about115 000 t. This is about 2.3 times annual WOCA utility requirements. Although an estimated 15%of the utility inventory is excess and could readily be offered for sale, a major portion comprisesstrategic stock mandated by law or company policy and will not be offered for sale. Fig. 9summarizes these supply and demand relationships.
HEU inventory
There is little information regarding uranium inventory held by the Russian Federation. Theircivilian stocks could easily surpass the 130 000 to 150 0001 U held in WOCA civilian stockpiles. Itwas reported by V.N. Mikhailov, Russian Minister for Nuclear Industry, that the RussianFederation's HEU inventory is 1200 t, plus or minus 15% (i.e. 1020 to 1380 t) [12]. The totalmilitary stocks held by the nuclear weapon States, consisting of fissile material in a variety of forms,may be several times greater than the civilian portion.
In June 1994, the DOE released information on its highly enriched uranium program in itsInterim Uranium Inventory Report [13]. Between 1945 and 1992, when HEU production ceased,cumulative HEU production in the United States was 994 t. About 259 t is currently in DOEinventories, excluding HEU stored at the Pantex site, Texas. Of this amount 50 to 1201 was identifiedas potential excess. Proposals have been made in conjunction with the US fiscal 1996 budget to sellsome portion of the material. Under the Energy Policy Act of 1992, USEC is to be the exclusivemarketing agent for US enriched uranium.
Potential schedule for sale of 550 t HEU from Russia and Ukraine
Once it was announced that the 5501 HEU warhead material from the Russian Federation andUkraine would be blended to LEU and sold for use as reactor fuel it became clear that the sales couldhave a major impact on the uranium market. The greatest uncertainty impacting the market has beenthe schedule of deliveries for this material; both the timing and amounts.
It is now probable the schedule for delivery of the 550 t HEU, as well as both US surplusHEU and other uranium, will be set by the US Congress. Legislation related to privatization of theUSEC was introduced by Senator Pete Domenici (Republican, New Mexico) in Senate Bill 755. Thisbill includes a schedule to ration the flow of uranium and separative work units (SWU) drawn fromthe former US, as well as Russian and Ukraine weapons, until well into the next century. The billwas sponsored by Senator Domenici, Chairman of the Senate Subcommittee on Energy Research &Development of the Energy and Natural Resources Committee and was co-sponsored by otherSenators with an interest in the bill [14]. It is anticipated this legislation will not be passed until thesecond half 1995.
In addition to setting a schedule for sale of HEU derived LEU, the proposed legislationattempts to help the Russian Federation by providing access to cash from the sale of the componentsof LEU drawn from military HEU. It is also intended to help the US uranium mining companies bydelaying and restricting the flow of the material into the market, where its sale could depress themarket.
Under the proposal, natural uranium from the DOE stockpile could be sold starting 1 January1998. The maximum amount that could be sold in one year would be 4 million pounds UF6,equivalent to 1040 t U natural. Annual sales could not however, exceed 10% of the UF6 equivalent
24

content of the total amount of natural uranium transferred from the DOE to USEC. The sale of LEUtransferred from DOE to USEC could also not exceed 800 000 SWU in any calendar year. This isequivalent to about 1100 t U natural.
In summary, the proposed legislation would provide for sale of a maximum of about1100 t U/year natural equivalent following passage of the bill. This could continue until 1 January1998 when an additional 1040 t U, or 2140 t U/year could be sold to 1 January 2002. From 2002through 2011 about 4740 t U natural equivalent/year could be sold, increasing to about 7340 t Unatural equivalent/year after 1 January 2012. This schedule would supply about 6% of the WOCArequirements of 877 0001U through 2010. It includes management of the 5501 Russian and UkraineHEU, as well as the surplus USDOE HEU, LEU and natural uranium stockpiles.
The first uranium sold under this framework could result from a 15 December 1994agreement between DOE and USEC where about thirteen tonnes HEU would be transferred to USECand blended to LEU. This would yield about 3075 t U natural equivalent being sold over 3 to 5 yearsstarting in 1995 [15].
The other uncertainties regarding future WOCA supply are related to: the full impact of thesettlement agreements and their amendments; and the disposition of the potential for additional HEUentering the market from both the USA and the Russian Federation; the remaining Russian stockpileof natural or low enriched uranium (LEU). The disposition of the worldwide weapons plutoniumstockpile is expected to have only a minor impact on the supply and demand balance for nuclear fuel.
Early indications of a recovering uranium market
In 1994 the world uranium production industry continued in a very depressed state. As in1993, the market is highly dependent on political decisions that are subject to change. Any analysisof the uranium market must take this uncertainty into account. There were, however, some indicationsin 1994 and early 1995 that the sixteen year trend of falling uranium prices and decreasing productionrelated activity may be ending and the market may be in an early stage of recovery.
They include: excess WOCA inventory is rapidly being drawn down and is nearingexhaustion; the decrease in 1994 uranium production relative to the previous year was the smallestsince 1989; and Cameco, the world's largest producer, increased its production. In Canada theamount of uranium specified in new export contracts signed by Canadian producers and approved bythe Canadian government increased from 4330 t U in 1993 to 15 200 t U in 1994. The completionof fourteen matched uranium sales under the amended US-Russia suspension agreement is expectedto stimulate production in these 2 countries. The rapid rise in spot price starting in November 1994suggests the sixteen year market decline may be at an end. The bankruptcy of a major uraniumtrading organization early in 1995 may be contributing to market instability placing additional upwardpressure on market prices. While these events may be early indications of a market recovery,uncertainty may continue until a sustained recovery is underway and political intervention is furtherreduced.
FUTURE TRENDS IN SUPPLY AND DEMAND
World reactor requirements and unfilled demand
All projections of future uranium related activities depend on the uranium market. There willbe little or no increase in any activities, including exploration, project development and/or production,unless uranium market prices increase. Making projections regarding market trends is fraught withdifficulties, primarily because of the uncertainty regarding the availability of future supplies. Futuredemand is well known through to the year 2000 and can be reasonably estimated through to 2010.
25

70
60
50 .*•'
W
§4-1
ooo30
20
101995 1996 1997 1998 1999 2000 2001 2002 2003 2004 2005 2006 2007 2008 2009 2010
NUKEM Estimate NAC Estimate
FIG. 10. Worldwide buyer unfilled needs.

The projected annual reactor requirements for both WOCA and non-WOCA up to 2010 aresummarized in Table II [1].
On the basis of existing trade agreements and considerations of technology, it is expected thatmuch of the non-WOCA demand will be met by non-WOCA supply over the next 10-15 years. Theprimary uncertainties related to meeting WOCA demand include the access of CIS produced uraniumto the WOCA market and the amount and schedule for sales of HEU derived material. However, theexisting US anti-dumping settlement agreements and the policy of the European Union regarding CISuranium imports have helped reduce uncertainty in these market parameters. This situation couldchange if there are further substantial amendments to the US-CIS settlement agreements or Euratompolicy.
Based on the analysis of WOCA inventory drawdown and the current restrictions on CISuranium imports it is possible to make projections regarding a likely market price recovery. Whereasthe available excess WOCA inventory is rapidly being depleted, the need for new uranium productioncontracts is expected to rise sharply over the next 15 years [10,16]. Projections of worldwide uraniumrequirements not covered by contracts indicate that demand for new production contracts will increasefrom about 16 000 t U in 1995 to about 50 000 t U in 2002. This is a compounded annual growthrate of nearly 30%. After 2002 the requirements will continue to increase, reaching around55 000 t U in 2005 (Fig. 10). This rapid growth rate, equalling new annual uranium sales of about5000 t U, or nearly equivalent to the annual production of Canada's Key Lake project, should putsubstantial upward pressure on uranium prices. This imbalance between demand for new productionand available production capacity should be increased by the low level of project development inrecent years.
Supply projection
Two projections of the known and anticipated uranium supply sources are made to considerhow the future supply may develop. The projections include a high case supply with LEU from HEUentering the market at an annual rate of 17 000 t U natural equivalent and a low case supply withLEU entering at an annual rate not exceeding 4740 t U natural equivalent. All other supplycontributions remain the same. The projections take into consideration existing and committed, as wellas planned and prospective WOCA production centres, supply from western reprocessing, and LEUfrom 550 t HEU warhead material plus surplus HEU, LEU and U natural from the USA. It isassumed that the requirements of former non-WOCA will be met from non-WOCA supplies, and thatat least 5000 t per year of CIS produced uranium will continue to be sold in the WOCA market. Theprojections assume that the available WOCA excess inventory will be exhausted within one to twoyears.
The projections do not take into account potential increased CIS sales allowed with risingmarket prices under terms of the CIS/US settlement agreements. Nor are matched sales that are takingplace under the amended settlement agreement with Russia included. There is a practical limit to CISsales based on production capability and a cap on Russian import until at least 2003.
The projections use a WOCA production capability based on an 85% capacity utilization ofthe 1993 Red Book data [1]. This consists of about 29 000 t U/year of Existing and Committedcapacity and a potential of up to about 10 0001 U/year of Planned and Prospective annual capabilityby 2000. This is shown in Fig. 11.
Production from reprocessing is based on the projection of WOCA mixed oxide (MOX) fuelfabrication capacities from the 1994 IAEA Year Book [17]. This supply source is projected to be 850,3000, 4000 and 4000 t U (natural equivalent), respectively in 1995, 2000, 2005 and 2010. It totalsabout 46 0001U equivalent and is estimated to meet about 5 % of WOCA requirements through 2010.
27

K)OO80.000
60,000
I40,000
20,000
World Reactor Requirements(1,068 ,000 tu) \ _ . - • - • - * ' "
. - . - • - • * '
Former WOCA Requirements(877,0001 U)
.•••• Planned andProspective Production*
-- (1994 Production)
Existing and Committed Production*
i _L1994 1995 1996 1997 1998 1999 2000 2001 2002 2003 2004 2005 2006 2007 2008 2009 2010
' at 85% capacity utilization
FIG. 11. WOCA short term annual uranium production capability.

80
60 --
31.3
20 --
0
World Reactor Requirements-
Planned and Prospective Production *
1994 Production)
Existing and Committed Production *
Former non-WOCA Requirements
tovO
1994 1995 1996 1997 1998 1999 2000 2001 2002 2003 2004 2005 2006 2007 2008 2009 2010Year
* at 85% capacity utilization
FIG. 12. Projected supplies through 2010.
80
60 --
<Dc§ 40•4-tOOo
31.3
20
World Reactor Requirements tar
WSfifl
WOCA Inventory I.."--1 * " "• •••""* Planned ancPlanned and Prospective WOCA Production * ' LEU
CIS Sales to WOCA
(1994 Production)Existing and Committed WOCA Production
Former non-WOCA Requirements from Former non-WOCA Production
1994 1995 1996 1997 1998 1999 2000 2001 2002 2003 2004 2005 2006 2007 2008 2009 2010
* at 85% capacity utilizationYear
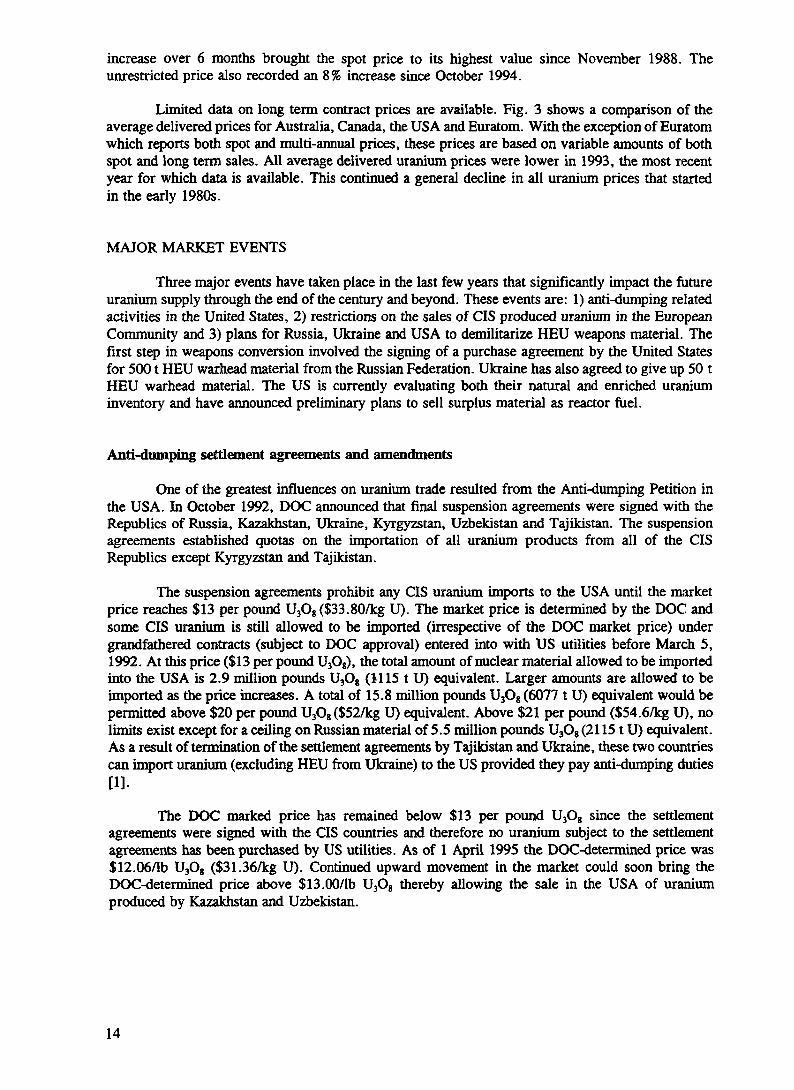
FIG. 13. Projected uranium supplies through 2010 (high LEU case).

80
60 -;..*'
W0>cO 40 --oOo
31.3
20 --
0
World Reactor Requirements
WOCAInventory.
:..--'"Planned and Prospective WOCA Production *
LEUCIS Sales to WOCA
1994 Production)
Existing and Committed WOCA Production
Former non-WOCA Requirements from Former non-WOCA Production
1994 1995 1996 1997 1998 1999 2000 2001 2002 2003 2004 2005 2006 2007 2008 2009 2010Year
* at 85% capacity utilization
FIG. 14. Projected uranium supplies through 2010 (low LEU case).

Fig. 12 is a projection of all indicated supply sources excluding HEU and other US governmentsurplus uranium.
The high supply LEU projection (Fig. 13) is based on the 550 t HEU under the salesagreement(s) between the Russian Federation, Ukraine and the USA. This represents nearly168 0001 U natural equivalent. It is projected to enter the market starting in 2003 at the rate of about17 0001 U per year and continue through 2012. In this scenario the LEU equals over 15% of theWOCA requirements from 1995 to 2010. Additional surplus US HEU, LEU and U natural wouldprobably not enter the market until 2012.
Based on the assumptions above, a supply shortfall will continue throughout the projectionperiod except for years 2002 to 2005. With the exception of this short period when worldrequirements are exceeded, all of the supply sources are insufficient to meet world requirementsbetween 1995 and 2010.
The low supply LEU case (Fig. 14) is based on the proposal in Senator Dommici's Bill 755introduced to the US Congress and discussed above. In this case the identified supply sources alwaysfall below world requirements. The shortfall varies from a minimum of about 3000 t U in 2000,increasing to a maximum of nearly 25 000 t U by 2010. For world requirements to be met, worldproduction will have to increase by about 80% within a few years and then continue to increase overthe next 15 years. This would require a rapid buildup of planned and prospective production facilities,as well as additional new projects that are not presently defined.
The short term instability is increased by the low level of world production which is currentlymeeting only about 55% of world demand.
CONCLUSIONS
The uranium supply is evolving under a restricted worldwide market. The vastly oversuppliedcondition that existed for about 16 years drove spot prices to all time lows in 1994.
The excess low-priced supply that drove down the prices was comprised of excess WOCAcivilian inventories and production from CIS countries. The low market prices, together with thecurtailment of government purchases under the centrally planned economies of the formerCOMECOM, forced production cutbacks and the closure of production facilities worldwide. As aresult, production met only about 55% of world reactor requirements in 1994.
The low production levels caused the drawdown of inventories worldwide. This impact wasgreatest in WOCA where stockpiles have been drawn down annually at the rate of about 15 000 to20 000 t U since 1991. It appears the excess WOCA inventory is now essentially exhausted. Politicaland legal restrictions on the sales of CIS produced uranium to the USA and the European Union alsolimit this supply. The changes hi two low cost supply sources have greatly reduced their marketinfluence.
A steady market price increase starting in November 1994 has, over 6 months, resulted inthe restricted spot price rising by 30% to $12/pound U3O8 ($31.20//kg U). The price of unrestricteduranium has also increased 8% to about $7.60/pound U3O8 ($19.76/kg U) over this period.
The purchase by the US of 550 t HEU warhead material from the Russian Federation andUkraine is expected to provide a new uranium supply equivalent of about 168 400 t U natural, thatmay enter the market after 2002. Additional supply is expected from the release of excess USgovernment stockpiles of natural uranium, LEU and HEU. Some analysts have projected that thisgovernment controlled material could enter the market at rates as high as about 17 000 t U naturalequivalent per year. There are now indications that the US Congress will pass legislation rationing
32

the flow to the market of both the CIS and US uranium (and SWU) until well into the next century.Draft legislation before Congress would limit the cumulative amount of this uranium supply to notmore than 6% of WOCA reactor requirements through 2010.
Based on analysis in this report, it is concluded that substantial additional uranium productionis required to meet reactor requirements under both the low and high sale scenarios for militaryderived material. It is projected that world uranium production will have to increase within a very fewyears by at least 60 to 80% over 1994 levels to meet world reactor requirements.
The recent spot market price increase may indicate that the worldwide supply and demandrelation is already undergoing the necessary change that will result in increased uranium production.For this to happen prices will have to continue their increase to a level where producers can pay alltheir costs of production and make a profit on their investment. This must occur before productioncan play its vital role in meeting 80 to 90% or more of the world reactor requirements through 2010and beyond.
TABLE I. CIS URANIUM IMPORTS TO THE US AND EC AND WOCA INVENTORY DRAWDOWN
Year
1988198919901991199219931994f
WOCADemand
40 564"42 694'40 342'45 596e
47 921"49 688*49 165"
WOCAProduction"
3650033 5802856225 77923 651
22000«21 900*
Shortfall
40649 114
11 78019817242702768827265
CIS Imports'1
105534
3 4275625524342169450s
InventoryDrawdown*
395985808353
14 192190272347217815
Total 315 970 191 972 123 998 28 600 95 398
a. Source: Ref. [1].b. Data for 1988-1993 are from the US Department of Energy (Energy Information Administration) [6]
and the Euratom Supply Agency [4, 5].c. Drawdown does not account for CIS Imports to WOCA countries other than the USA and European
Community, nor for Chinese imports to WOCA.d. Source: Ref. [5].e. Source: Ref. [6].f. Estimated data including production and CIS imports to the European Community of 3000 t U.g. IAEA estimate, includes 2000 US, 4000 Euratom and 3450 from CIS uranium enriched in Europe and
imported to the USA
TABLE IL PROJECTED ANNUAL REACTOR URANIUM REQUIREMENTS TO 2010 [1]
1995 2000 2005
World Total 60 800 63 500 68 400
FormerNon-WOC A 10300 10600 12600
FormerWOCA 50 500 52 900 55 800
Aggregate2010 1995-2010
75 700 1 068 000(100)
14 400 191 000(17.9)
61 300 877 000(82.1)
33

REFERENCES
[I] OECD NUCLEAR ENERGY AGENCY, INTERNATIONAL ATOMIC ENERGY AGENCY,Uranium 1993 - Resources, Production and Demand, OECD, Paris (1994).
[2] ENERGY INFORMATION AGENCY, World Nuclear Outlook 1994, DOE/EIA-0436(94),USDOE, Washington, DC (1994).
[3] NUCLEARFUEL, 10 April 1995, McGraw-Hill, Inc., New York, N.Y. (1995).[4] EURATOM SUPPLY AGENCY, Annual Report 1992, CEC, Luxembourg (1993).[5] EURATOM SUPPLY AGENCY, Annual Report 1993, CEC, Luxembourg (1994).[6] ENERGY INFORMATION AGENCY, Uranium Purchases Report 1993, DOE/EIA-0570(93),
USDOE, Washington, DC (1994).[7] NUKEM, 1994 Uranium Spot Market, Market Report, NUKEM, Hanau (1995).[8] NUKEM, Buyer's Banquet?, Market Report, NUKEM, Hanau (August) 1994.[9] STEYN, J.J., World Uranium Stockpiles: Potential Impact, NEI International Fuel Seminar,
Beaver Creek, Colorado, September (1994).[10] LEAMON, G.E., The What, When, and Why of Inventory as a Supply Source, USCEA
International Uranium Seminar, October, Tucson, Arizona (1993).[II] URANIUM INSTITUTE, "The Global Uranium Market, Supply and Demand 1992-2010",
The Uranium Institute, London (1994).[12] NUCLEARFUEL, 28 March 1994, McGraw-Hill, Inc., New York, N.Y. (1994).[13] NUCLEARFUEL, 4 July 1994, McGraw-Hill, Inc., New York, N.Y. (1994).[14] NUCLEARFUEL, 8 May 1995, McGraw-Hill, Inc., New York, N.Y. (1995).[15] NUCLEARFUEL, 27 March 1995, McGraw-Hill, Inc., New York, N.Y (1995).[16] NUKEM, World Contracted Supply and Demand, Market Report, NUKEM, Hanau (January)
(1995).[17] INTERNATIONAL ATOMIC ENERGY AGENCY, IAEA Yearbook 1994, IAEA, Vienna
(1994).[18] OECD NUCLEARENERGY AGENCY, INTERNATIONAL ATOMIC ENERGY AGENCY,
Uranium Resources, Production and Demand, OECD, Paris (1990).[ 19] OECDNUCLEAR ENERGY AGENCY, INTERNATIONAL ATOMIC ENERGY AGENCY,
Uranium 1991- Resources, Production and Demand, OECD, Paris (1992).
34

XA9745122THE INDUSTRIAL TYPES OF URANIUM DEPOSITSOF UKRAINE AND THEIR RESOURCES
A. CH. BAKARJIEV, O.F. MAKHIVCHUK, N.I. POPOVState Geological Enterprise "Kirovgeology",Kiev, Ukraine
Abstract
Industrial uranium deposits of Ukraine are represented by two types. Their origin is related to the processesof alkali metasomatism in areas of proto-activization that took place at the late orogenic stage of the formation of theUkrainian shield. Deposits are located in large cataclatic zones that are formed at the intersection of deep fractures.
1. INTRODUCTION
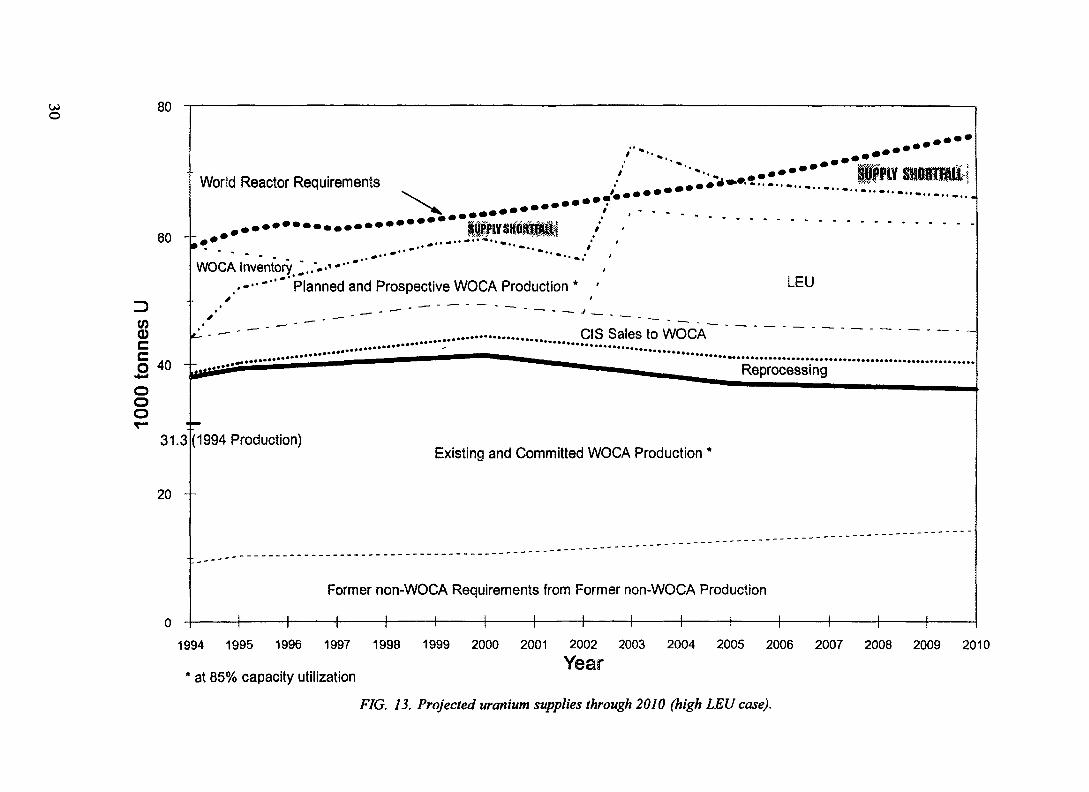
The industrial uranium deposits of Ukraine are represented by endogenic deposits in albititesand by exogenic epigenetic deposits in sediments of platform cover of the Ukrainian shield. At presentthe main suppliers of uranium ores are deposits in albitites of the Kirovograd ore region. Twodeposits of this genetic type of the Krivoi Rog ore region (Zheltorechenskoye and Pervomayskoye)have mined out Albitite-type deposits and are not considered in the present report.
The Kirovograd ore region is located in the Kirovograd district of Ukraine. Uranium depositsof this region are represented by the Michurinskoye, Severinskoye and Vatutinskoye deposits. TheMichurinskoye and Vatutinskoye deposits are exploited by VostGOK combine. The Severinskoyedeposit is prepared for operation but is not yet in production. The uranium mining complex of theregion includes two uranium mines (Ingulskoye and Smolinskoye). They are located in the towns ofKirovograd and Smolino, 80 km from each other. The recovered uranium ores are processed at thehydrometallurgical plant located in Zhelty Vody. Mining ores is done underground. The final productis uranium oxide-protoxide.
The formation of deposits of the Kirovograd region is connected with processes of sodiummetasomatism, juxtaposed on granite-metamorphic substratum in fault zones during Early Proterozoicactivization. This took place at the end of the orogenic stage of the Ukrainian shield formation.Uranium ore formation (1.7-1.8 Ga) follows the stage of regional granitization (about 2 Ga).
The Kirovograd region is also in the limits of the same geoblock of the Ukrainian shield. Thestructure of this region is defined by a large Korsun-Novomirgorodsky geoanticlinorium. The axislift of the structure consits of two granitoid complexes various age and nature. The southern part ofthe axial zone is formed by the Novoukrainsky massif of anatectic potassium granites (the age is about2 Ga). The northern part is formed by the Korsun-Novomirgorodsky pluton of rapakivi-granites andanorthosites (1.7-1.8 Ga). The limbs of anticlinorium consist of Early Proterozoic gneisses andmigmatites and small-sized granite bodies. The Korsun-Novomirgorodsky anticlinorum is limited bythe Kirovogradsky regional fault in the east and by the Zvenigorodsko-Annovsky regional fault in thewest (Fig. 1). Seismic investigations indicacte that the Kirovograd region corresponds to a block ofearth's crust with the greatest depth (20 km) of occurrence of anatectic granitoids in the Ukrainianshield.
The basement rocks within deposits are predominantly biotite gneisses, migmatites andgranite-gneisses. These rocks have been transformed under conditions of amphibolite facies, andfolded in system of steep and relatively simple folds with submeridional direction. They are non-conformly granitized and intruded by subconcordant bodies of granites and pegmatoids.
35

On the whole, the positions of the Michurinskoye and Severinskoye deposits are controlledby the Kirovogradsky fault and the Vatutinskoye deposit — by the Zvenigorodsko-Annovsky fault(Fig. 1). Within regional faults the structural position of the deposits is defined by their localizationto sites of complications of local faults by system of cross cutting disturbances. Thus the Severisnkoyeand Michurinskoye deposits are located at sites of complication of the main submeridional faults bycross cutting north-west disturbances. The Vatutinskoye deposit is located where the main north-westfault is intersected by cross cutting structures.
Faults have complex internal structures and include structural elements of two of different agegroups. The structural elements of the first group developed during formation in the making of thecrystalline basement. They are presented by consistently formed small-sized granite bodies, zones offolding, boudinage and pegmatoid veins, as well as zones of blastomylonites. The folded zones andseams of blastomylonites developed in conditions of almandine-amphibolite facies of metamorphismduring plastic deformation.
The structural elements of the second, later group were formed under conditions of relativelynear surface, brittle deformation. They are represented by mylonites and zones of cataclasisaccompanying wide zones of greenschist (chlorite-epidote) metamorphism, as well as later cataclasiteswhere the bodies of uranium-bearing albitites are located.
Sodium metasomatism forms the large bodies of albitites. They extend from a few hundredmetres to 2 km deep and have a thickness from tens to one hundred metres. The depth of occurrenceof albitites is comparable with their lateral extent (Figs 2, 4). Albitites are developed from granites,migmatites and gneisses. The textural-structural peculiarities of the replaced rocks are preserved. Suchminerals as chlorite-epidote, riebeckiteaegirine, aegirine, phlogopite and carbonate-hematite-chloriteare represented.
There is a time interval indicated between the tune of albitite formation and of uranium oreformation that is indicated by the cataclasis of albitites before ore formation. Uranium mineralizationoccurs in cataclas the albitites and formes fine impregnation and microveins. This mineralizationtogether with late albitite, rhodusite, phlogopite, chlorite, carbonate and hematite, fills the systemsof small-sized intergrain faults and forms the cement of cataclic albitites.
The position of orebodies is controlled by main and cross cutting faults, and the changes inattitude of faults in horizontal and vertical directions. In addition to the structural control in alldeposits, the lithological control is expressed by the primary localization of albitites and orebodieswithin granitoids. It is controlled by favourable physico-chemical properties of granitoids. Orebodiesoccur within the internal zones of albitite bodies, taking subconcordant position with them. Theyoccur as blankets, lens and columnar stockwork. The thickness ranges from a few metres to tenmetres, and the horizontal extent from the tens to one hundred metres (Figs 3,4). The vertical extentfrequently exceeds the horizontal, and reaches 1.5 km (Severinskoye deposit).
Uranium minerals present in the ores include uranitite, nasturan, brannerite, coffinite,hydroxides, uranium silicates and uranium black. According to conditions of formation, uraniumminerals are divided into primary: (uraninite, nasturan, brannerite, coffinite); and secondary:(hydroxides, uranophane, boltwoodite, beta-uranotile and uranium blacks). Zoning of uraniumminerals within the deposits is absent. Primary and secondary minerals are developed at the samedepth levels. Secondary minerals occur at depths of 1000 m and more.
Known resources (RAR & EAR-I) uranium resources of the Kirovograd ore region are102 000 t U including 52 000 t U with a production cost of $80/kg U. Prognostic (EAR-II) uraniumresources are estimated at 136 000 t U.
Some of the exogenic type uranium deposits in the sedimentary cover of the Ukrainian shield,are suitable for exploitation by in situ leach mining technology (ISL). These deposits are located
36
20 0 20 60
I t [ platform complex (K-P)
metamorphic complexes (AR-PR)r~5n protogeosynclinical complex (Pk)I —— i granite-gneiss complex of Early Archean stabilizationV/\ gneiss complex of Upper Archean stabilization£^-^j granulite complex (AR)proto-orogenic granitoids (PR)
\-\-\ rapakivi granites\ •&• I granites
I •"** I subalkalic granites
endogenic uranium deposits:
L® J in sodium metasomatites-albitites (1-Severinskoye, 2-Michurinskoye, 3-Vatutinskoye,4-Zheltorechenskoye, 5-Pervomayskoye)
[ • J in potassium metatomatites (6-Kalinovskoye, 7-Lozovatskoye, 8-Yuzhnoye)
[ — ] exogenic uranium deposits (9-Sadovoye, 1-Bratskoye, 11-Novogutyevskoye, 12-Devladovskoye)
FIG. 1. Krivoi Rog and Kirovograd uranium-ore regions. Geological map without cover ofNeogeneand Quarternary sediments.
37

P£an -100,/Xj. , S: .; ,
ikll^i5^16: x
\
SM *I1 4
n of the h o r L i o n - i o o m
A-B section
+ 200
//:// •'''•jTFTfi!/'* I f f l l<i:M:-*i<i!/tji/s,<*!t!M'/4f'mft? 'Wx
yx .W /l"''m
_-ioo '/7X/
/-^^
and cross section atono, A-B fright)
L±U gneisses, granites, migmatites
[^^J albitites
[ *] uranium ores
r"'^] faults, blastomylonites seams, zones of brecciation
F/G. 2. Vatutinskoye deposit.
38

H:
X
.tiiltl"* \ \\ "\ ^ \ • \ * "I •i:^xx\im^wf 'X
X
\ V
gneisses
albitites
uranium ores
the Main Michurinsky fault
faults
FIG. 3. Michurinskoye deposit.
39

X X
-«-| gneisses, granites, migmatites
[?!>] albitites|»u» [ zones of cataclasites and milonitesr^Bsl uranium ores
FIG. 4. Cross section along profile. Scale 1:10 000.
40
120
•-1 coaly sands
coaly clays
brown coals
secondary kaolins
primary kaolins
orebodies
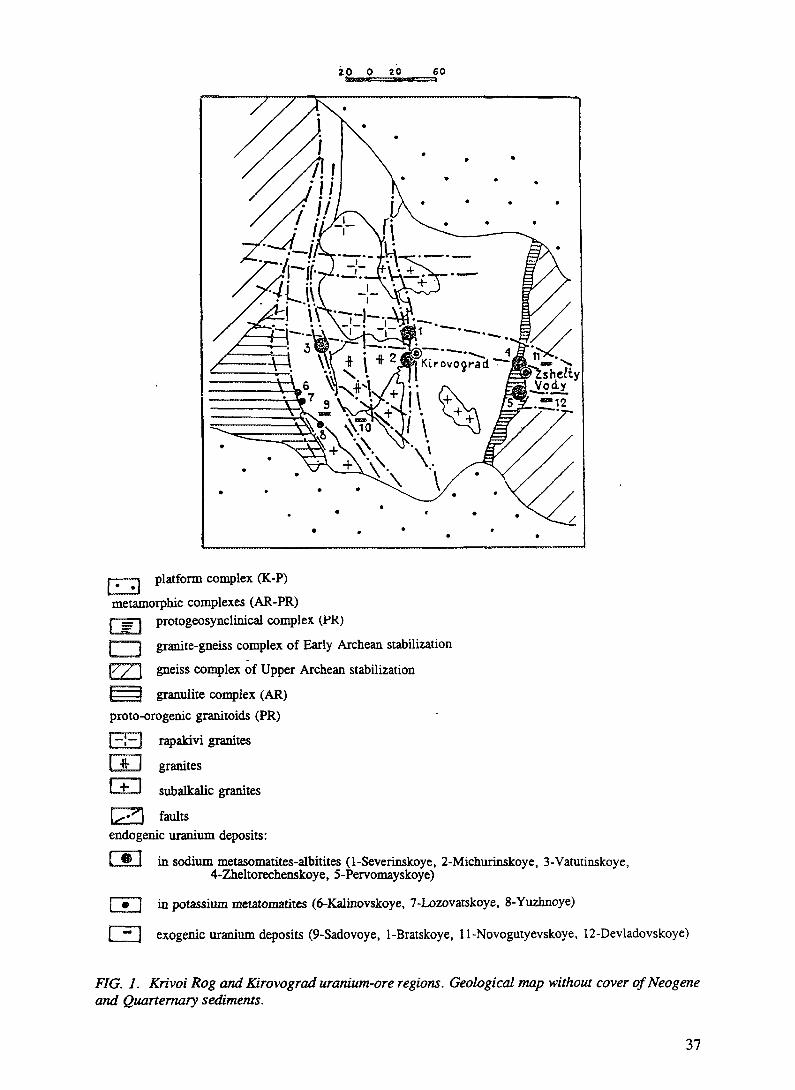
F/G. 5. Bratskoye deposit. Cross section
41

within the Dnieper brown coal basin (Devladovskoye, Bratskoye, Surskoye, Safonovskoye etc.). Someof the (Devladovskoye, Bratskoye, Safonovskoye) have been exploited. The first two are completelymined out and the resource have been deducted "cancelled" from the national uranium resourceinventory.
The deposits are located in erosional-tectonic paleovalleys, filled by Paleogene-Neogene coalbearing sediments. They controlled by zones of ground or ground-bed oxidation. The uranium oresare located in alluvial sediments in the lower part of coal bearing formations, where coal sands,seldom coaly clays and brown coals are present. The depth of the mineralization ranges from tens ofmetres to 70-80 metres.
The deposits have different shapes and extend along paleochannels and/or along paleovalleys.The width of orebodies ranges from 50-80 meters to several hundred metres. The length is 2-4 km,the thickness is 3-10 m. In section, the uranium deposits consist of numerous horizontal orebodieswith complicated contacts (Fig. 5). The uranium contents in ores are low — the first hundredth ofpercent. The uranium is concentrated hi coaly and clayed material. Uranium blacks, uranium-bearingleucoxene and iron hydroxides are present in small quantity. The Uranium reserves of these depositsare not large and range from 1000 to 3000 t U.
The prospected and previously appreciated (RAR & EAR-I) resources of these deposits are10 000 t U with a production cost of less than $80/kg U. Prognostic (EAR-II) resources are estimatedto the 20000tU.
2. SUMMARY
The whole prospected and previously appreciated (RAR & EAR-I) uranium resources ofindustrial deposits of Ukraine are 112 000 t U including 62 000 t U with a production cost of$80/kg U. Prognostic (EAR-II) resources are estimated to be 156 000 t U.
42

XA9745123IMPROVEMENT OF URANIUM PRODUCTION EFFICIENCYTO MEET CHINA'S NUCLEAR POWER REQUIREMENTS
R. ZHANGBureau of Mining and Metallurgy,China National Nuclear Corporation,Beijing, China
Abstract
Recently China put the Qinshan Nuclear Power Plant, with an installed capacity of 300 MW, in the provinceof Zhejiang and the Daya Bay Nuclear Power Plant, with a total installed capacity of 2 x 900 MW, in commercialoperation. China plans a rapid growth in nuclear power from 1995 to 2010. China's uranium production will thereforealso enter a new period with nuclear power increasing. In order to meet the demand of nuclear power for uranium,special attention has been paid to both technical progress improvement using management with the aim of reducingthe cost of uranium production. The application of the trackless mining technique has enhanced the uranium miningproductivity significantly. China has produced a radiometric sorter, model 5421-2 for pre-concentrating uranium run-of-mine ore. This effectively increases the uranium content in mill feed and decreases the operating cost ofhydrometallurgical treatment. The in situ leach technique after blasting is applied underground in the Lantian Mine,in addition to the surface heap leaching, and has obtained a perfect result. The concentrated acid-curing, and ferricsulphate trickle leaching process, will soon be used in commercial operation for treating uranium ore grading -5 to—7 mm in size. The annual production capability of the Yining Mine will be extended to 100 tonnes U usingimproving in situ leaching technology. For the purpose of improving the uranium production efficiency much workhas been done optimizing the distribution of production centres. China plans to expand its uranium production to meetthe uranium requirements of the developing nuclear power plants.
1. INTRODUCTION
Recently the nuclear power of the mainland of China put the first self-designed and self-constructed Qinshan Nuclear Power Plant in Zhejiang province with 300 MW(e) and the largest jointventure project, Daya Bay Nuclear Power Plant, in province Guangdong, with 2 x 900 MW(e), incommercial operation. China plans a fast growth of nuclear power in the period from 1995 to 2010.New power reactors totalling 10 GW(e) will be under construction in 2000. The key nuclear powerplants will be concentrated in the coastal areas, where the economy develops faster, and there is alack of primary energy resources. The construction of the second Qinshan NPP project with 2 x 600MW(e) has been started. The second Daya Bay NPP with 4 x 1 GW(e) located hi Ling'ao near DayaBay will be constructed hi two phases. The active preparation work for construction of the first phaseproject with 2x1 GW(e) sets is under way. For the third NPP of Guangdong province, the site hasbeen basically planned in Yangjiang. The site selection for NPP with 4 x 1 GW(e) in Liaoningprovince has been approved. It will be located hi Wafandian. Its feasibility study is carried out byboth China and Russia. The Sanmen NPP with 4 x 1 GW(e) will be constructed hi two phasesSanmen county, Zhejiang province, hi addition, the earlier stage work on construction of nuclearpower plants will be developed for Shandong, Jiangsu, Fujian, Hunan, Jiangxi and Jilin provinces.
Specialists believe that the rapid period of development China's nuclear power will be roundthe year 2010. The installed nuclear generating capacity will reach 20 to 30 GW(e) by 2010.
China follows the policy of "self-sufficiency of uranium" for nuclear power plants. China'suranium production will therefore also enter a new historical period with rapid development of nuclearpower. In order to meet the demands of uranium for nuclear power, China's uranium industry mustprovide at least 3500 tonnes uranium each year before 2010. This is a promising future for China'suranium industry. In recent years, special attention has been paid to technical progresses, and themanagement has been improved, with the ami of reducing the uranium production cost and increasingthe competitive ability of China's uranium production industry.
43
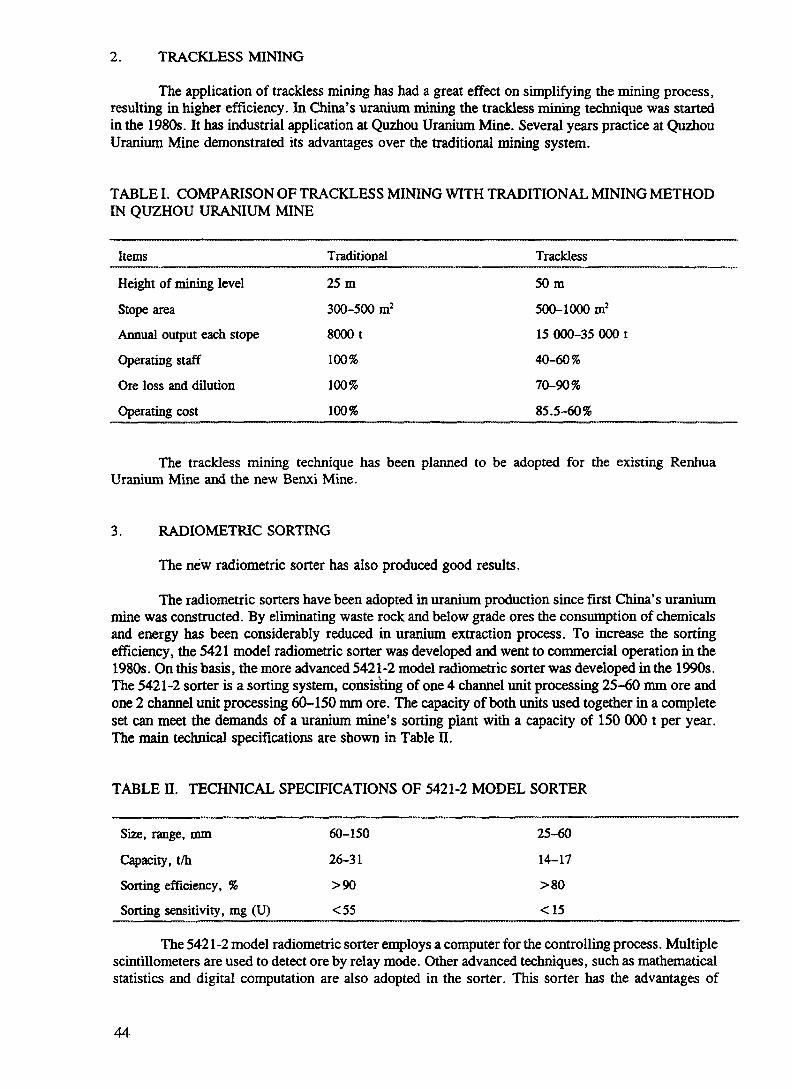
2. TRACKLESS MINING
The application of trackless mining has had a great effect on simplifying the mining process,resulting in higher efficiency. In China's uranium mining the trackless mining technique was startedin the 1980s. It has industrial application at Quzhou Uranium Mine. Several years practice at QuzhouUranium Mine demonstrated its advantages over the traditional mining system.
TABLE I. COMPARISON OF TRACKLESS MINING WITH TRADITIONAL MINING METHODIN QUZHOU URANIUM MINE
Items
Height of mining level
Stope areaAnnual output each stope
Operating staff
Ore loss and dilution
Operating cost
Traditional
25m
300-500 m2
8000 t
100%
100%
100%
Trackless
50m
500-1000 m2
15 000-35 000 t
40-60%
70-90%
85.5-60%
The trackless mining technique has been planned to be adopted for the existing RenhuaUranium Mine and the new Benxi Mine.
3. RADIOMETRIC SORTING
The new radiometric sorter has also produced good results.
The radiometric sorters have been adopted in uranium production since first China's uraniummine was constructed. By eliminating waste rock and below grade ores the consumption of chemicalsand energy has been considerably reduced in uranium extraction process. To increase the sortingefficiency, the 5421 model radiometric sorter was developed and went to commercial operation in the1980s. On this basis, the more advanced 5421-2 model radiometric sorter was developed in the 1990s.The 5421-2 sorter is a sorting system, consisting of one 4 channel unit processing 25-60 mm ore andone 2 channel unit processing 60-150 mm ore. The capacity of both units used together in a completeset can meet the demands of a uranium mine's sorting plant with a capacity of 150 000 t per year.The main technical specifications are shown in Table EL
TABLE H. TECHNICAL SPECIFICATIONS OF 5421-2 MODEL SORTER
Size, range, mm 60-150 25-60
Capacity, t/h 26-31 14-17
Sorting efficiency, % >90 >80
Sorting sensitivity, mg (U)_____<55_________________<15____________
The 5421 -2 model radiometric sorter employs a computer for the controlling process. Multiplescintillometers are used to detect ore by relay mode. Other advanced techniques, such as mathematicalstatistics and digital computation are also adopted in the sorter. This sorter has the advantages of
44

higher sorting sensitivity and efficiency, higher capacity and better automation. The sensitivity rangeof uranium grade can reach ± 10 ppm at a certain cut-off grade.
The use of two 5421-2 model sorters in the sorting plant of Fuzhou Uranium Mine simplifiesthe process flowsheet. The 11 old sorters were replaced, and operating personnel was decreased. Theoperating cost was reduced by 10%.
4. IN-PLACE LEACHING AFTER BLASTING
In-place leaching after blasting was first applied at the Lantian Uranium Mine. Heap leachingis a comparatively low cost processing method and has wide industrial application at China's uraniummines. In-place leaching after blasting has been successfully put into operation at Lantian since 1990.In place leaching after blasting is a mining system consisting of the underground blasting of hard andcompact orebody, reducing the ore to the desired size and permeability. The leaching agent, is thenadded selectively recovering useful metal from the ore. Compared with the traditional mining andmetallurgical technology, this method has advantages of higher efficiency, lower cost of production,safe operation and environmental benefits. It is applicable to orebodies with easily leached propertyof the desired metals.
In-place leaching after blasting was carried out at orebody No.30. It occurred in atectonoclastic zone of fractured granite, with a density of 2.48 t/m3, and the average thickness of6.59 m. The top of the body was close to the surface, and the hydrogeological condition was simple.The geological reserve was 7160 t of ore with a uranium content of 0.171 %.
The sublevel caving and shrinkage system was adopted. At the bottom of the body liquorcollecting tunnel was developed. In the entire mining area, four blasting sublevels with the height of10-16 m for downward blasting were arranged. The barrage-type distribution was adopted as the mainmode, and the trickling distribution and injection through wells as a subsidiary one. Usually the liquoris well distributed and the leaching was relatively complete. An average uranium content of 0.014%was obtained in residue, with the uranium recovery 88.98% and the utilization coefficient of mineralresources of 83.43%. This method will be applied to other orebodies.
5. CONCENTRATED ACID CURING AND FERRIC SULPHATE TRICKLE LEACHING
The method of uranium recovery using concentrated acid curing and ferric sulphate trickleleaching uranium process is adopted in production. Grinding is an indispensable operation in thetraditional hydrometallurgical processing of uranium ore. Its proportion of cost in ore processing isgreat. The energy consumption of grinding usually accounts for 30% to 50% of the total. In the late1980s, we started investigation on concentrated acid curing and ferric sulphate trickle leaching process(NGJ process, N, G and J — the first letters of concentrated, ferric and leaching in the Chinesealphabetic system of writing respectively. The process includes ore crushing (up to 5-7 mm),concentrated acid curing, ferric sulphate leaching, tertiary amine solvent extraction, productprecipitation and residue disposal with the process effluent in a closed circuit. Four of China's typicaluranium ores were studied using the NGJ process and compared with the traditional agitation leaching(AL) process (see Table HI). Either for soft sedimentary type uranium ore or for hard and tightvolcanic type ones, leaching results indicate that the NGJ process has advantages over AL process.
45

TABLE IE. COMPARISON OF LEACHING RESULTS BETWEEN NGJ AND AL PROCESSES
Ore NGJ process AL process
Ore
Sedimentary
Volcanic(rhyolite)Granite
Quarzite
Ugrade
0.126
0.0815
0.56
0.10
0.43
Operation condition
Sizemm
-5.0
-5.0
-5.0
-5.0
-3.0
H2SO«
9-10
1.5-2
5.6
5
5
Recovery
90.5
88.1
98.0
91.0
97.0
Operation condition
Sizemm
-0.5
-0.25
-0.5
-1.0
-0.32
H2S04
13-14
5-6
6-9
7
5.6
Recovery
90.0
90.5
98.2
93
96.5
In 1993, an industrial experiment was carried out for the sedimentary type uranium ore. Itwas steadily operated for 92 days with 726 tonnes ore treated and 500 kg sodium diuranate produced.The extraction rate reached the level of the AL process, when the ore size was less than 7 mm, andthe trickle leaching cycle was 10 to 45 days. The NGJ process is simple and its operation is stable.Compared with the AL process (see Table IV), the process effluent discharge is eliminated and mostof the residue can be used for backfill in mine.
TABLE IV. SOME ECONOMIC COMPARISON BETWEEN NGJ AND AL PROCESSES
Items AL process NGJ process
Power
WaterOperating costs
1/31/20-1/10
0.4-0.55
It can be concluded that the NGJ process is an intensified heap leaching operation. Thepractice shows that the NGJ process is a very effective extraction method for some of China'suranium ores. The method if of important significance in China's uranium ore processing.
6. IN SITU LEACH MINES
The Yining Uranium Mine is reaching one hundred tonnes annual production capability usingin situ leach technology. A small scale production of in situ leaching is being successfully carried outat Deposit No. 512, Yining Uranium Mine, Xinjiang Uygur Autonomous Region, and usefulexperience has been obtained. Now the larger project is being developed.
7. REORGANIZATION AND MANAGEMENT OF URANIUM PRODUCTION
Beside the technical progresses obtained in uranium mining and metallurgy, a series ofadjustments and reformation measures have been adopted over the last decade to conform to therequirements of a market economy. The first adjustment was cutting back uranium production andthe closure of uranium mines and mills that had comparatively high production costs. The remainingoperating uranium production enterprises must, according to the product price, define proper cut-off
46

grade of uranium ore and decrease ore dilution. They must reduce also the workforce, and reducematerial and energy consumption.
Another important adjustment is to pursue diversified economy while maintaining uraniumindustry as the main objective. All the enterprises and institutions of the uranium industry have beenenergetically developing non-uranium products and techniques. Significant results have already beenachieved. To date, the equivalent of about 200 millon US Dollars has been invested and the non-uranium development has started producing the following main products: titanium pigment,magnesium metal, rare earths, ordinary phosphorus, etc. A total of 25 000 employees from uraniumproduction have been transferred to diversified projects. It is evident that under the China's specificeconomy system non-uranium production improves uranium production efficiency.
We believe that in the coming 15 years China will have a stable and rapid development in theuranium industry to meet the requirements of nuclear power for uranium.
&SEXT PAGE(S)left BLANK .

XA9745124
THE URANIUM RESOURCES AND PRODUCTION OF NAMIBIA
A.G. PALFIMining Directorate,Ministry of Mines and Energy,Windhoek, Namibia
Abstract
The promulgation of the Minerals (Prospecting and Mining) Act, 1991, on 1 April 1994 and the simultaneousrepeal of restrictive South African legislation on reporting uranium exploration and production results, allowed theNamibian Government for the first time to present information for publication of the report "Uranium 1995 —Resources, Production and Demand", by the OECD Nuclear Energy Agency and the IAEA. Namibia, one of theyoungest independent nations in Africa, has a large number of uranium occurrences and deposits in several geologicalenvironments. The total estimated uranium resource amounts to about 299 thousand tonnes recoverable uranium ata cost of less than US$ 130/kg U, within the known conventional resources category. The most prominent geologicaltype of these is the unique, granite-related uranium occurrences located in the central part of the Namib Desert. Anumber of large tonnage but low-grade deposits suitable for open-cast mining, were identified between 1960 and 1980,the peak period for uranium exploration. At one of these deposits, Rossing, mining operations started in 1976 andwill continue into the first quarter of the next century. The presence of other, so far undiscovered deposits aresuspected under thin Tertiary cover within this uranium province. Calcrete-hosted uranium occurrences and depositsare of secondary importance, due to a lower recoverable tonnage of uranium and complications with metallurgicalprocesses. At times of better uranium markets however, at least one of these deposits will receive serious attention.Permo-Triassic age Karoo sandstone-hosted uranium deposits were subject to only limited exploration due to thedown-turn of uranium prices in the latter part of 1980s, despite the very encouraging exploration results. As onlylimited Karoo sandstone-covered areas were tested there is still great potential for further discoveries. The plannedoutput of Rossing Uranium Mine at 40 000 tonnes of ore per day which results in an annual production of 4536tonnes of uranium oxide, was achieved in 1979. Due however, to the subsequent slump in uranium prices and demandthe annual production was reduced by about 50% to the present 1911 tonnes of contained uranium (in 1994). Fullproduction capacity, depending on world markets, can be achieved within a short period of time. In case of improveduranium market conditions, Namibia is in a strong position to increase uranium production and open up newproduction centres to strengthen the country's position as an important uranium producer in the world.
1. INTRODUCTION
The promulgation of the Minerals (Prospecting and Mining) Act, 1992, on 1 April 1994 andthe simultaneous repeal of restrictive South African legislation on reporting uranium exploration andproduction results, allowed the Namibian Government for the first time to present information for thepublication of the Red Book, a report compiled by the OECD Nuclear Energy Agency and the IAEA.
As the purpose of this paper is provide an overall review of the uranium deposits/occurrences,no great details are given of the geological description of the more than 50 known occurrences norof the results of reserve calculations or feasibility studies, most of which are in any case, out-datedby at least twenty years. For the location of the most important uranium deposits of Namibia thereader is referred to Fig. 1. In case of further interest the reader is referred to articles in variousgeological publications, the open file reports of the Geological Survey of Namibia and the soon to bepublished Uranium Chapter of the Mineral Resources of Namibia
2. URANIUM EXPLORATION
The first significant discovery of radioactive mineralization within Namibia was made in 1928in the Rossing region by autoradiograph tests on a supposed sample of pitchblende.
As a result of an upswing in uranium market demand and prices, extensive uraniumexploration started in Namibia in the late 1960s. Several airborne radiometric surveys were conducted
49

ANGOLA ZAMBIA
BOTSWANA
Uranium Deposits • Namibia
Rossing Mine
Uranium in alaskrte
Uranium in calcrete
Uranium in sandstone
r/r~| Other type olI ——— I Uranium occurrences
200km12' 14 16
FIG. 1. Uranium deposits of Namibia.
by the Geological Survey during this period and numerous uranium anomalies were identified. Ofthese, the Rossing deposit where Rio Tinto Zinc obtained exploration rights in 1966, developed intoa large scale open-cast mine which started production in 1976.
Development of Rossing combined with a sharp upward trend in uranium prices, stimulatedextensive exploration activity, mainly in the Namib Desert. Two major types of deposits were locatedi.e. mineralization associated with intrusive granitic rocks ("alaskite") and mineralization associatedwith recent calcrete formations. Of the granitic type deposits, beside Rossing Mine, the Trekkopjedeposit has significant reserves. Langer Heinrich, a calcrete hosted uranium deposit is the mostpromising occurrence within the second category. The combined effect of political uncertainty andthe decline in uranium prices caused the rapid curtailment of exploration and development work bythe early 1980s. This was indeed unfortunate as the refinement of exploration techniques on thisunusual area were poised to locate a number of new deposits.
Since the 1980s, the continued weakness of the uranium market discouraged furtherexploration activities, except in the immediate vicinity of Rossing Uranium Mine. While uraniumexploration in a limited extent continued near Rossing until 1992, exploration for uranium ceased inNamibia since that date. In 1992 uranium exploration expenditure amounted to just over 1 millionNamibian Dollars (at par with South African Rand).
50

However, should a sustained upturn in demand for uranium occur, which may be the case bythe end of the 1990s, it remains possible that mining of one of the mentioned deposits will provecommercially viable, with Langer Heinrich generally regarded as having the best potential.
3. URANIUM RESOURCES
Costs were calculated by using data provided by US Bureau of Mines 1993, updated to 1stJanuary 1995. Descriptions, including reserve calculations are available for most uranium depositsof the country excluding some, often larger deposits where mining companies are still the holder ofthe mineral rights or information is not available.
While the cost of acid leaching uranium recovery is relatively well known, costs are notavailable for the alkaline leaching technique, which recovery method is essential for the calcretehosted uranium deposits. In the latter case recovery costs were increased by an additional 50% to takeinto account the envisaged higher costs.
In view of limited information available for the Estimated Additional Resources Category IIand the Speculative Resources Category no estimation for these resource categories were attempted.
3.1. Known Conventional Resources(Reasonably Assured Resources and Estimated Additional Resources Category 1)
The total resource in this category amounts to about 299 thousand tonnes of uranium at a costof less than US$ 130/kg U, see Table I.
TABLE I. NAMIBIA — KNOWN CONVENTIONAL URANIUM RESOURCES (IN TONNES OFURANIUM)
IAEA Resource Class
Reasonably Assured
Estimated Additional
< US$40/kg U78552
70546
Cumulative Cost Ranges
< US$80/kg U160587
90815
< US$130/kg U
191 822
107 513
Category I
TOTAL________________149098__________251402 299 335
The bulk of this resource is associated with intrusive granites — locally termed " alaskite "(alkaline leucogranite) in the vicinity of Rossing Uranium Mine, in the proximity of Walvis Bay, themain harbour town of Namibia. See Figs 2, 3 and 4. The total resource excludes few deposits wherereserve estimations and therefore cost estimations have not as yet been assessed by the MiningDirectorate.
The granite-associated uranium province is restricted to the axial structural zone of thePrecambrian Damara Orogenic Belt and is approximately 100 kilometres long and 50 kilometres wide.
A large number of calcrete hosted deposits have been identified and intensively explored,however their total combined uranium content is less than 10% of the total resource of this category.The calcrete hosted uranium deposits are broadly associated with the uraniferous alaskite and werederived by decomposition of the alaskite and the subsequent migration of secondary uraniummineralization to a favourable depositional environment.
51

22*Usokos
Rdssing Uranium Mine
Longer Hemrich UraniumD r)~"~L' D Deposit
- 23°
Namib Uranium District - NamibiaApproximate Location of Uraniumdeposits
Explanation<A> aloskite hosted mineralizationD calcrete hosted mineralization^-- dry rivers_.-' roads
SOkm
14
FIG. 2. Location of uranium deposits in the Namib uranium district.
52

LEGEND
I | Sand, alluvium, calcrete
Biotlte schist, quartzlte
==) Marble, quartz - blotlte schist
•%3 Mlxntc, pebbly quortzlte, 1 Marble, cordterite gneiss, quartzlte, conglomerate
Formation
Kutscb
Korbtb
- Chuos
• Rosslnq
Group
-SwaKop
| ] Blotlte, ompMbote and pyroxene gnefos, omphlbofft* L Khan I
f"'"'j FeWspatnlc quaftzlte, blotlte gneiss, conglomerate J- Etusls JNosfc
OAMARASEQUENCE
J Blotlte schist, gneiss, amphlbolite ABBABIS COMPLEX
Hgg Alosklte
' I t! ] Red gnelsslc gronlte
'•'•') Porphyrltlc and non- porphyrltlcgranite
- lltnoloajcol contact- Mam road- Railway One
IO km
FIG. 3. Geological map ofRossing uranium mine and vicinity.
53

Uranium deposits, occurrences and anomaliesin the vicinity of Rossing Uranium Mine - Namibia
<fgg£sgt Uranium dtpoiil
• • UramuRi
Promlcwnt otrfeerm ra4om«tric anomcty
Subordinate etrtoorn* rodonwlrk anomaly
FIG. 4. Uranium deposits, occurrences and anomalies in the vicinity of Rossing uranium mine.
3.2. Undiscovered Conventional Resources(Estimated Additional Resources Category II and Speculative Resources)
Although speculative figures are not provided within the Undiscovered ConventionalResources Category, substantial resources are expected in the following geological types.
5.2.7. Intrusive deposits (IAEA type 6)
The granite-associated uranium province covers approximately 5000 km2 of an area which islargely covered by calcrete and or wind-blown semi-consolidated sand. As past investigationconcentrated on follow-up of airborne radiometric anomalies, substantial additional reserves, maybeof the size of Rossing, are suspected under the superficial cover.
3.2.2. Calcrete-hosted deposits (IAEA type 10)
Within the calcrete covered terrain, of the 38 major regional airborne radiometric anomalies,eleven anomalies were successfully investigated by intensive drilling, providing proven resourcesincluded under the proven resource category. In most cases the generally low grade mineralization
54

is associated with calcrete-filled paleo-river channels. Whilst the existence of additional resourceswithin Tertiary sediments is not discounted, the presence of a large undiscovered resource is unlikely.See also Fig. 2.
3.2.3. Sandstone-hosted deposits (IAEA type 2)
The Permo-Triassic age Karoo sediments were intensively investigated in neighbouringcountries in the early 1970s and to a limited extent in Namibia as well. As these sediments areextensively dissected by river systems in the north-western part of Namibia, airborne radiometricanomalies are more pronounced. Ground follow-up and extensive drilling delineated nearly 6 milliontonnes of low grade uranium mineralization, which was excluded from the proven resource categorydue to high cost of recovery. The mineralization is associated with coarse clastic sediments,carbonaceous sulphidic shale and limestone. Additional economically recoverable resources may bepresent within similar age sediment in other, so far unexplored parts of Namibia.
4. URANIUM PRODUCTION — R6SSING URANIUM MINE
4.1. Historical Review — Rossing Uranium Mine
In 1928, Captain G. Peter Louw prospected and found uranium mineralization in the vicinityof Rossing Mountains within the Namib Desert. Over many years he tried to promote the prospect,but only in the late 1950's, a major mining company, Anglo American Corporation of South Africa,prospected the area by drilling and some underground exploration. Due to erratic uranium values andpoor economic prospects for uranium, Anglo American abandoned the search.
In August 1966, Rio Tinto Zinc acquired the exploration rights and conducted an intensiveexploration programme till March 1973. Surveying, mapping, drilling, bulk sampling andmetallurgical testing in a 100 tonnes/day pilot plant indicated the feasibility of establishing a mine.
Rossing Uranium Limited was formed in 1970 to develop the deposit. RTZ was the leadingshareholder with 51.3 % (at the time of the formation of the company) of the equity.
In 1972, Rossing awarded a management contract for the design, engineering, procurementand construction of the project to a joint venture of Arthur G. McKee, Western Knapp EngineeringDivision and Davy Powergas. Mine development commenced in 1974 and the commissioning of theplant and the initial production commenced in July 1976 with the objective of reaching full designcapacity of 5000 short tonnes (4536 metric tonnes) per year of uranium oxide during 1977. Due tothe highly abrasive nature of the ore, which was not identified during pilot plant testing stage, aftersome major plant design changes, the target capacity was only reached hi 1979.
4.2. Status of Production Capability — Rossing Uranium Mine
At full production the plant's full throughput rate at Rossing Uranium Mine is 40 000 tonnesof ore per day which would provide 4536 tonnes of uranium oxide annually. However, due toweakness in the current market the Rossing operation has been restructured, downsized and is nowoperating at 50% of capacity. Full production capacity could be achieved within a short period oftime, should market conditions warrant.
55

o\
01 DE?
irTo Gowfo (loll ond.Swokopmund
moki rood
Not mineralized (Including possible Lateral extension]f-Volley- fill sediments Probable mineralized areaJ Mineralized area (>lm thick.50,1 kij/TI
Crystalline Basement
- Mapped contactInterred contact
---Rood- - - - Major drainage system
• Exploration Pit
0 250 SOO 79O WOO 1250 m
FIG. 5. Simplified geological map ofLanger Heinrich uranium deposit.

TABLE n. HISTORICAL URANIUM PRODUCTION — ROSSING URANIUM MINE (TONNESURANIUM CONTAINED IN CONCENTRATE)
ConventionalOpen Pit Mining
Pre 1992
51 360
1992
1673
1993
1668
1994
1911
Total to1994
56612
Expected1995
1962
4.3. Ownership structure and employment in the uranium industry — Rossing UraniumMine
The present ownership structure of Rossing uranium mine is:
RTZ Corporation 56.3%Namibian Government 3.5%Rio Algom Limited 10.0%
IDC South AfricaOthers
10.0%20.2%
There have been no significant changes in the employment in the uranium industry within thelast two years. Employment at Rossing Uranium Limited, the sole producer, is currently 1250.
East
TERTIARY
South
ALONG THE GAWIB RIVER
Anomalous Anomalousoutcrop outcrop West
schist
QUATERNARY •——— Surficiol sheet colcrete
jjkj J Valley calcrete
SSSS*8] Zone of cornotite mineralization (>O.OOI% U308)
LongerHeinrich
ACROSS THE GAWIB RIVERNorth
Vertical scale greatlyexaggerated
schist and q«'
FIG. 6. Simplified sections across the Longer Heinrich uranium deposit.
51

4.4. Future production centres
Beside the Rossing operation no new production centre is planned for the next five years,even if the uranium market dramatically improves. However, after the five year period, under afavourable market conditions, the planning of at least one additional production centre is envisaged,maybe at Langer Heinrich, where large proven resources are available. See Fig. 5 for the SimplifiedGeological Map and Fig. 6 for Simplified Sections across the Langer Heinrich Deposit.
4.5. Uranium production, long term capability
Under favourable market conditions Rossing Uranium Limited, the sole uranium producer inNamibia, could return to full production capacity of close to 4000 t U per annum. The existingreserves would be expected to enable production from this source to continue until at least 2017.
Favourable market conditions would also allow the exploitation of at least one additional mineat a rate of about 1000 t U per year.
4.6. Factors influencing long term uranium production capability of Namibia
A number of proven uranium deposits have been discovered in Namibia and there is greatpotential for the discovery of additional deposits under the Tertiary sand and calcrete cover.
The most important criteria to extend production or opening new production centres is theprice and demand for uranium in the world markets. Under favourable conditions some of the alreadyproven deposits could be brought into a production stage. An additional and also important factor isthe availability of water for the possible new production centres.
5. ENVIRONMENTAL CONSIDERATIONS
Namibia's constitution requires that the state actively promote and maintain the welfare ofthe people by adopting policies aimed at ensuring that ecosystems, essential ecological processes andthe biological diversity of Namibia are maintained. However, environmental legislation that stemsfrom this provision still remains a draft (soon to be finalized) as the country addresses more pertinentissues of education and development of its people.
Under the provisions of the Minerals (Prospecting and Mining) Act 1992, an applicant fora mineral licence, including the mining licence, has to complete an environmental assessment studyand to prevent any damage to the environment from exploration and mining activities. In case ofmining, the rights holder is obliged to rehabilitate land disturbed by mining.
Whilst the Namibian environmental legislation and standards remain to be established, themanagement of Rossing Uranium has adopted standards and performance criteria used by otherdeveloped countries. Presently a comprehensive review of environmental standards and performancecriteria is being carried out by the Rossing Uranium Mine to develop site specific, risk basedenvironmental objectives and thresholds.
As Namibia's only producing uranium mine and a substantial percentage of the country'suranium resources are located within the Namib Desert, the principal environmental consideration isthe management of available water resources.
58

Potable water for the Rossing Uranium Mine as well as for the coastal towns of Walvis Bayand Swakopmund is supplied from aquifers at the Kuiseb and Omaruru river deltas. To save thoselimited water resources and to save the cost of pumping over long distances, the management ofRossing undertaken an integrated water management programme, which has resulted not only in thereduction of water consumption of the mine but also substantially reduced environmental impacts. Anew tailings deposition method was developed by the operator to minimize the amount of water whichis lost on the tailings impoundment due to the high evaporation rates experienced in this area.Addition of carbonate rich tailings also neutralizes the acid mine drainage, a large percentage ofwhich is returned to the mine.
Radiological concerns are catered for, and the recommendations included in the InternationalCommission on Radiological Protection's Publication 60 of 1990 have been implemented at RossingMine. The challenge of radiological exposure is thus not with achieving compliance with dose limits,but in the application of the principle of ALARA (As Low as Reasonably Achievable) to reduceradiological exposure. There have been concerns about the potential for the incidence of excesscancers, which are thought to be related to occupational radiation exposure. These can, however, onlybe addressed in comparison with national cancer statistics, which do not exist in Namibia at thepresent time.
6. NATIONAL POLICIES RELATING TO URANIUM
Namibia achieved independence on 21 March 1990 and the Minerals (Prospecting and Mining)Act, 1992 was promulgated on 1 April 1994. With the introduction of the Act, a number of SouthAfrican laws were repealed or amended, including all laws relating to the uranium industry, such asthe Atomic Energy Act, 1967, the Nuclear Installations (Licensing and Security) Act, 1963 and alltheir amendments.
The provisions of Part XE3 of the Act relate to source materials as specified by Schedule 1of the Act. Source material is defined as:
a) uranium, expressed as uranium oxide, of more than 0.006 per cent;
b) thorium, expressed as thorium oxide, of more than 0.5 per cent, and of which the mass ismore than half a kilogram.
Section 102 of the Act relates to the possession, disposal, enrichment, re-processing andexport of source material, while section 103 specifies penalties for the contravention or a failure tocomply with the provisions of section 102.
While the repeal of the South African uranium-related legislations was justified, due to itscomplexity and reference to enrichment and the use of enriched material in nuclear reactors, whichare not relevant to Namibia, the provisions of the Act are not detailed enough to control the safetyor the environmental aspects of the uranium industry. The introduction of a new Act or amendmentsto existing legislation are presently being considered.
59
BIBLIOGRAPHY
PALFI A.G., Response to Red Book Questionnaire 1995, unpublished Report, Ministry of Mines andEnergy, Namibia (1995).
ROESNER H., SCHREUDER C.P., Uranium, unpublished Chapter 7.1 in The Mineral Resourcesof Namibia, 1992, Geological Survey, Ministry of Mines and Energy, Namibia (1992).
ROSSING URANIUM LIMITED, Response to Red Book Questionnaire 1995, unpublished report toMinistry of Mines and Energy, Namibia (1995).
60

XA9745125A REVIEW OF SPANISH URANIUM RESOURCESAND RECENT DEVELOPMENTS IN THEPROVINCE OF SALAMANCA
J.A. GONZALEZ GRANDA, J. RUIZ SANCHEZ-PORRO,J. ARNAIZ DE GUEZALAFE Mining Centre,Salamanca, Spain
Abstract
Uranium exploration activities in Spain carried out during the 1950-1992 period, led to the discovery ofa number of deposits in different geological environments. Presently there is only activity at the FE area inSalamanca province, where the only remaining mining centre is located. A new dynamic leaching processing plantwith a capacity of up to 950 t U3Og t/year began operation in 1993, at FE mine. The development and planningof the mining in the open pits of ENUSA (province of Salamanca, Spain) under the present low market prices,has led to the implementation of a working scheme, based on the following concepts: Detailed knowledge of thedistribution and quality of the mineralization by sufficiently close spaced drilling, with 3D positioning and gradeestimation by deviation and gamma ray probing. Use of either geostatistical or arithmetical grade interpolationtechniques, properly validated with production, adapted to the density of the information available. Economicoptimization of the open pit, by means of the 3D Lerchs-Grossmann technique, as a guide for the final pit design.Calculation of the optimal pit shapes and recoverable resources under different price conditions. Thesetechniques implemented by means of computerized data acquisition and processing systems, are used to face withversatility, the present economic conditions. A full review of the uranium deposits in the province of Salamancais being carried out with these means.
1. URANIUM DEPOSITS AND EXPLORATION IN SPAIN
1.1. Historical exploration in Spain
Uranium exploration in Spain was carried out, from 1950 to 1981 by the Junta de EnergiaNuclear (J.E.N.), a public organism that depends on the Industry Ministry.
The Empresa Nacional del Uranio S.A.( ENUSA) created in 1972, is a company owned bythe J.E.N. and the National Industry Institute (I.N.I.) (Fig. 1). ENUSA has carried out uraniumexploration in Spain and overseas, directly, since 1974 until 1992, when all exploration activities werestopped and all the investigation effort was concentrated on the development and feasibility studiesof the FE area deposits.
From 1989 to 1994 a Joint Venture, ENUSA/CISA (COGEMA), has done some explorationin the province of Caceres (precambrian/cambrian schists and hercynian granites), without outstandingresults.
1.2. Uranium deposits
During this time, most of the favourable geological units of Spain have been covered with airborneand ground exploration methods (Fig. 2).
61

INCORPORATED IN 1972
ACTIVITIES-PROCUREMENT OF ENRICHED URANIUM
•PRODUCTION & EXPLORATION OF URANIUM CONCENTRATES
-DESIGN & FABRICATION OF FUEL BUNDLES
PRODUCTS-ENRICHED UF6 FOR SPANISH REACTORS
-DESIGN & FABRICATION OF FUEL BUNDLES FOR SPANISHAND EUROPEAN REACTORS
SHARE CAPITAL: 10.000 MILLION PTAS
——————SHAREHOLDERSTENEO: 60% CIEMAT: 40%
TOTAL WORK FORCE : 703 EMPLOYEES
CORPORATION'S INTEREST IN EURODIF (11,11 %)CORPORATION'S INTEREST IN CQMINAK (10 %)
FIG. 1. ENUSA.
62

GROUND
FIG. 2. Areas covered with airborne and ground exploration methods.
63

0 DON BENITO(Badajoz)
AREA
CIUDAD ROORIGO
(Salamanca Province)
CACERES PROVINCE
DON BENITO(Badajoz Province)
MAZARETE(Guadalafara Province)
TYPE
VEIN(IBERIAN TYPE)
VEIN(IBERIAN TYPE)
VEIN(IBERIAN TYPE)
SANDSTONE
TOTAL
IN SITU RESOURCES(IU308)
36,391
1.082
3.225
5.666
46.364
PRESENT SITUATION
MINING / DEVELOPMENT
UNDEVELOPEDNOT FEASIBLE PRESENTLY
UNDEVELOPEDNOT FEASIBLE PRESENTLY
UNDEVELOPEDNOT FEASIBLE PRESENTLY
FIG. 3. Uranium in situ resources in Spain.
64

Borcelono
G E O L O G Y
I 1 Ter t ia ry basinsJBi 3 MesozoicI......J Paleozoic rocks at green schists
and lower metamorphic grade
jtt^ Calc -a lkohc rocks a)gabbro and
dionte, u l t ramat ic (Bet ic range)
lAVy*} Two mica g r a n i t e s
1 BETIC RANGE S Sir2 OSSA- MORENA ZONE3 SOUTHPORTUOUESE ZONE4 CENTRALIBERIAN ZONE5 MAFIC AND ULTRAMAFIC MASSIFS6 C A T A L A N I D E S
200 290 Km
FIG 4 Geological setting of uranium deposits in Spain

Geological setting and in situ resources are given in Figs 3 and 4. Among the great number ofoccurrences studied, a number of deposits were evaluated, some of them (vein type in granites ofCaceres and Jaen) mined out by J.E.N.. Of remaining deposits the most important are in Salamancawhere they are being mined, whereas the rest is not mineable under the present economic conditions.
The main deposits outside the province of Salamanca can be summarized as follows:
PROVINCE NAME OF DEPOSIT GEOLOGICALSETTING
TYPE IN SITURESOURCES
(t
GUADALAJARA MAZARETEFluvial sandstonebraided channelsTriassic(Buntsandstein)
SANDSTONE 5 660
BADAJOZ
CACERES
SilurianDON BENITO AREA carbonaceous
schists, incontact withgranites
ACEHUCHE- PrecambnanCECLAVIN Cambrian
schists, incontact withgranites
VEIN (Iberian)TYPE
VEIN (Iberian)TYPE
3225
1 082
Most of the in situ resources (78%) and all the presently mineable resources of Spain, arelocated in the province of Salamanca.
RAR resources amount to 9148 t U, and EAR-I to 10 688 at the < $80/kg U cost range.Average grades range from 0.6 to 2 kg/t, depending on the cut-off grades (from 0.2 to 1.0 kg/t).
The main deposits in Salamanca are of the vein-Iberian type, with mineralization placed infractured precambnan- Cambrian and occasionally Silurian schists (map in Fig. 5). The deposits areof a low temperature hydrothermal origin. The main metallogenetic characteristics are summarizedin Fig. 6.
\The mineralization controls at regional and ore body scale are:
1) Regional fracture zones NE-SW;2) Ore deposited in associated (Riedel type) fractures, following complex patterns;3) Ore in a band parallel to the pre-tertiary erosion surface, 5-20 m below and deposited in the
reduction zone and lower part of the oxidization zone.4) Occasional lithological control, when carbonaceous schists and contrasts of competence
(hardness) are present.
A block diagram is given in Fig. 7, and a map of mineralized fractures at FE in Fig. 8.
1.3. Historical uranium production
The evolution of the production in Spam, is summarized in Fig. 9.
Production sites at different state of activity are shown in Fig. 10.
66

DEVELOPMENT / MINING
URANIUM OCCURRENCE
FIG. 5. Geological map with the main uranium deposits in FE area (Salamanca).
67

1 •- High geochemicai U Content in the carbonaceous schists.
2.- Nature of the alteration processes: Chloritization and hematitization(intensive but not penetratives).
3.- Low temperature, hydrothermal, paragenesis.
4.- Banded, geopetal and varved structures; Subsurficial environmentsand intermittent character of the mineralization.
5.- Radiometric age of the pitchblende (37 - 57 m.a., lower tertiary).
6.- Temperalure (70 - 230°C) and salinity (0 - 25% NaCI) deductedfrom fluid inclusion studies.
7.- Primary ore placed in fractures and breccias.
8.- Surficial character of the tectonic processes.
FIG. 6. Metallogenetic characterization of FE type uranium deposits.
68

Tertiary arkoses
Precambrian • Cambrian Schists
Mineralized Zone (in fractures)
Oxidized Zone
Uranium mineralization
Radioactive anomaly In surface
FIG. 7. Uranium ore controls at FE area (diagram).
69

FIG. 8. Mineralized fractures at Fe mine.
70

t U3O8350
300 -
250
200 -
150
100
50 -
301
254263
270260
237225
207
183
165
127 132 128 132140
86
0 -
254
230219 216
r—^r—-r—i——r—n——i——r—r75 76 77 78 79 80 81 82 83 84 85 86 87 88 89 90 91 92 93 94
DELEFANTE SLA HABA • QUERCUS
FIG. 9. Historical evolution of uranium production in Spain

FR A N C 1 A
QUERCUS:DOELEFANTE : C
LEGEND
• MILL UNDER OPERATION
ll NOT OPERATING MILL SITE
© UNDERGROUND MINE
O OPEN-PIT M3NE
A HEAP LEACHING
Hh TAILINGS STORAGE
B : DECOMMISSIONED
C : ON DECOMMISSIONSTILL IN OPERATION OR PROJECT
0 : UNDER OPERATION; DECOMMISSIONING
FIG 10 Uranium facilities in Spam

2. PRESENT ACTIVITIES
2.1. Exploration/development
2.1.1. General
Presently, all investigation related activities are concentrated in FE area, province ofSalamanca, where development drilling at 10 x 10 m spacing, is being carried out at a rate of100 000 m of percussion boreholes per year. In Fig. 11 all exploration and development drilling inrecent years is shown compared with in situ resources.
Great effort is being made to complete the investigation of the D and M-SAGERAS depositsclose to FE (Fig. 5), from which all medium to short term production will be obtained, together withFE.
2.7.2. Implementation of new integrated data acquisition and processing techniques to investigationby close spaced drilling, open pit design and mine planning
In the present situation of low market prices for the concentrates, it becomes very importantto reduce production costs. The first step is to have the best possible knowledge of the deposits, soto be able to plan accurately the mining operations. This affects the following aspects:
grade and tonnages forecast,
localization of ore,
localization of barren areas in or nearby the deposit, to place waste dumps, in order to reducetransport distances,
design of haulage roads,
determine types of ore that need different processing parameters.
The acquisition/processing system at FE is shown in Fig. 12.
To achieve this, ENUSA has upgraded the following phases of the process:
2.1.2.1. Grade estimation by simultaneous gamma ray and deviation logging
In the FE type deposits, due to the foliated and fractured nature of the schists, boreholedeviation can be of importance at the 10 x 10m grid scale (Fig. 13). To correct this, boreholes arelogged systematically with simultaneous gamma scintillometric and magnetometric deviation probes.Position and radiometry is recorded every 10 cm.
Great care is taken regarding the regular calibration of probes, correction of background (mostdue to Rn), and water absorption (see Fig. 14). Grade is estimated through the application ofcorrelation curves, specific for each deposit. The whole process is computerized.
2.1.2.2. Ore body grade modelling by geostatistics and other methods
All borehole data is stored in a workstation with the processing programs. Due to the irregulardistribution of the ore, geostatistics are only used in the wide spaced data, whereas average within
73

surface of influence, has proved to be more accurate, with data from the 10 x 10 m grid. This factcan be seen taking the example of an area in FE, comparing data from kriging and average withproduction (Fig. 15).
2.1.2.3. Economic optimization of open pit design
Economic optimization and analysis is done systematically on all deposits, as a guide for thefinal pit design. Three dimensional Lerchs-Grossman optimization techniques, implemented throughthe WHITTLE-4D software, are used.
Bearing in mind the present economic situation, ENUSA tries to mine its deposits aseconomically as possible and to maintain open the possibility of future exploitation of lower gradeore, not mineable today.
When deciding the optimum pit for the price considered (Fig. 16), the pit with the maximumnet present value (N.P.V.), is initially chosen. As the N.P.V. curve is normally quite flat in itsmaximum, and if the pit permits a convenient scheduling of the mining operation, a bigger pit canbe chosen if trying to increase the recoverable resources, or a smaller one if the scheduling isdifficult, without much change in its economic value.
In short the priorities for ENUSA are:
Design a pit that will produce the maximum economic value.
Design a pit that, once mined out, permits, if economic conditions improve, mine theremaining, lower grade ore (nested optimum pits).
Schedule the mining operation looking for short distances to dumps but without dumpingwaste over lower grade ore zones, mineable at reasonably higher prices.
2.1.2.4. Estimation of recoverable resources at different economic conditions
Using the same techniques, a range of optimum pits for different prices can be obtained (Fig.17). This curve is valid as far as the level and distribution of costs does not change significantly, thatis, the mining and treatment methods do not change.
2.2. Production
In 1994 production was started at D mine, simultaneously with FE. Treatment of the ore isdone at the Quercus Plant (Fig. 18), that was commissioned hi 1993. The plant uses a mixeddynamic-heap leaching process. One characteristic of the FE ore is that uranium gets concentrated inthe fine grained material. The ore is sorted at the following sizes:
> 10 mm Waste (67% tonnes; 15% U3Og)1 mm < x < 10 mm Heap leaching (22% tonnes; 20% U3Og)
< 1 mm Dynamic leaching (11% tonnes; 65% U3Og)
The treatment is acid leaching, with solvent extraction and precipitation with ammonia. Thecapacity of the plant is 950 t/year, being the present production level of 300 t/year.
74

METRES! U308(Thousands)
1982 1983 1984 198S 1986 1987 1988 1989 1990 1991 1992 1993 1994 1995YEAR
EXPLOR. SALAMANCA 0 DEVELOP. SALAMANCA ElEXPLOR. REST SPAIN DiN SITU RESOURCES
FIG. 11. Exploration and development drilling.

o\DEVELOPMENT
BOREHOLES
1 1
GEOSTATISTICSOTHER TECHNIQUES
EXPLORATIONBOREHOLES
-^3D BOREHOLE
DATABASE(X,Y,Z, GRADE, THICKNESS)
3D GRADE(BLOCK) MODEL
GEOLOGICALDATA
TOPOGRAPHICDATA
3D TOPOGRAPHICDATABASE
OPEN PITOPTIMIZATION
3D TOPOGRAPHICMODEL
CAD TECHNIQUES
3D OREBOOYMODEL
FINAL OPEN PIT(+ROAD AND DUMP)
DESIGN
- LONG TERM PLANNING; LIFE OF DEPOSIT
- MEDIUM TERM PLANNING; ANNUAL
- SHORT TERM PLANNING; MONTHLY(PRODUCTION, BLASTING)
FIG. 12. Diagram of borehole data acquisition/processing at FE.

X = 410 Y = 1710 Z = 560
450640
630-
62(M
610
600
590-j
580-
570-i
560
FAULT BRECCIA(Apparent dip of fault)
500
640
-630
-620
-610
-600
-590
-580
-570
560
3-E
F8AOIOMETRIC GRADE: = 3%o
-0-4 FIG. 13. Borehole profile fromD Mine.

oo
PERCUSSION DRILLINGCOST * 8 $/m (90%)
CORRECTIONS- WATER- BACKGROUND- PROBE CALIBRATION
• 3D POSITIONING• RADIOACTIVITY (cps x m)• WIDTH
CORRELATION CURVEKAOKMCTIVITY I OR»Df
DIAMOND DRILLINGCOST '80 $/m (10%)
CUTTINGS FROMPERCUSSION DRILLING
REAL TIME COMPUTER PROCESSING OF BOREHOLE DATA
GEOSTATISTICSOPTIMISATION, PIT DESIGNMINE PLANNING
FIG. 14. Grade estimation by gamma ray logging

EXPLORATION GRIDS / INVESTIGATION(50 x 50 m)
(20 x 20 m)METHOD:
KRIGING
DEVELOPMENT / GRIDS PRODUCTION (10 x 10 m) METHOD:AVERAGE IN SUFACE OF INFLUENCE
COMPARISON PRODUCTION BENCH 618-624 (FE)
PRODUCTION
AVERAGE
KRIGING
ORE (t)
77.247
83.267
60.639
GRADE (Kg/t)
0,480
0,453
0,391
U308
37.046
37.696
23.688
FIG. 15. Comparison of kriging with average at FE.

00oN.P.V. (billion PTA)
4
3 -
0 —
ORE (miliion t)U3O8 (Thousands t)
5
:
(*)
— z
— 1
2517747 4496638 5652285
TONNES OF ROCK
9449878 23599989
lORE CDU3O8 -"-BEST N.P.V.
(*) Selected Pit
FIG. 16. Optimum pit for current price.

Millions
03000 4000 5000 6000 7000
SELLING PRICE
U3O8 (Thousands)
8000 9000 10000
ooFIG. 17. Recoverable resources versus price curve.

ORE + WASTEEXTRACTION
RADIOMETRIC ARCSELECTION
I ORE
WASTE DUMP
CRUSHING < 100 mm.
FIRST WET GRINDING
SECOND WET GRINDING
JL
ACID LEACHING
COUNTERDECANTATIC
CURRENT IN WASHING |
TAILINGS 1NEUTRALIZATION |
TAILINGS DAM
CLARIFICATION
EXTRACTION
STRIPING
PRECIPITATION + RLTRATION
DRYING + PACKAGING
HEAP LEACHING
URANIUM CONCENTRATE
FIG. 18. Flow diagram of the Quercus Plant.
82

2.3. Decommissioning
The Andujar Plant was decommissioned by ENRESA (Spanish Radioactive Waste DisposalNational Company), ending in 1993. Decommissioning of the LOBO-G plant in La Haba MiningCentre by ENUSA is scheduled to be completed in 1995. Within the Saelices Mining Centre (FEmine), the old ELEFANTE plant is being, presently, decommissioned.
BIBLIOGRAPHY
ALMARZA LOPEZ, J.J., FRUTOS DOMINGO, E., MANSO CASADO, R., MARIN BLANCO,F., RUIZ SANCHEZ-PORRO, J., RIOS ARAGUES, L.M., El yacimiento de uranio de Don Benito,Investigacidn geologica y minera e ideas geneticas, VII Congreso Internacional de Mineria yMetalurgia, Barcelona (1984) t-I, 327-354 (in Spanish).
ARNAIZ DE GUEZALA, J., RUIZ ESTEBAN, B., RUIZ SANCHEZ-PORRO, J., Update ofUranium Resources in Spain, U deposits in the Salamanca province, Technical Committee Meetingon uranium resources and geology in Europe, Marianske Lazne (Czechoslovakia) (1989).
ARRIBAS, A., Sobre el origen de los yacimientos filonianos de uranio en rocas metasedimentarias:El caso de mina FE, Salamanca (Espana), Vein type uranium deposits, Vienna (1986) 193-214 (inSpanish).
ARRIBAS, A., BOTH, R.A., SAINT-ANDRE, B., The origin of Breccia-Hosted Uranium Depositsin Carbonaceous Metasediments of the Iberian Peninsula: U-Pb Geochronology and Stable IsotopeStudies of the FE Deposit, Economic Geology, vol. 89, Salamanca Province, Spain (1994) 584-601.
ARRIBAS, A., MARTIN-IZARD, A., MONTES, J., Distribution geoquimica del uranio en losmetasedimentos del C.E.G. del oeste de la provincia de Salamanca, VII Congreso Internacional deMineria y Metalurgia, Barcelona, (1984) t-I, 353-356 (in Spanish).
ARTIEDA, J.I., CHICA, M., CRIADO, M., DELGADO, J., RUIZ, J., SALGUERO, A.,Evaluation geoestadistica de los yacimientos de uranio FE, D y ALAMEDA (Salamanca), HICongreso Geologico de Espana, Salamanca (1992) 476-482.
COMA, F., Litologia, tectonica y mineralization del yacimiento FE, Saelices el Chico (Salamanca),Studia Geol6gica, XX; (1993) 7-18 (in Spanish).
COMA MOLIST, F., ARNAIZ DE GUEZALA, J., MONTES BLASCO, J., Pozo de calibration deequipos de testification radiometrica en exploration y evaluation de yacimientos de Uranio (R), Pozode calibrado para sondas gamma (C), VH Congreso Internacional de Mineria y Metalurgia, Barcelona,(1984) t-I, 261-270 (in Spanish).
DE FRANCISCO BARRERO, M., GARCIA GARCIA, J., RUIZ ESTEBAN, E., SENTCHORDIIZQUIERDO, E., ASTUDILLO PASTOR, J., El yacimiento de uranio de Mazarete (Guadalajara),Vn Congreso International de Mineria y Metalurgia, Barcelona (1984) t-I, 407-434 (in Spanish).
MORALES, M., LOPEZ ROMERO, A., "Relevant aspects to Enusa's programme to close theuranium mining and milling facility of La Haba/Badajoz (Spain)", IAEA-TECDOC-824, IAEA,Vienna, (1995) 73-82.
PEREZ DEL VILLAR, L., RODA QUEROL, J., Investigation de Uranio en los materiales delComplejo Esquisto Grauvaquico (C.E.G.) en el area Garrovillas-Ceclavin (Caceres), Actividades yResultados, VII Congreso Internacional de Mineria y Metalurgia, Barcelona (1984) t-I, 285-410 (inSpanish).
83
SERRANO FILLET, J.R., ARTIEDA GONZALEZ-GRANDA, J., Aprovisionamiento deconcentrados de uranio para las centrales nucleares en Espana, Proyecto Quercus, VIE CongresoInternacional de Mineria y Metalurgia, Oviedo (1988) t-II, 356-376 (in Spanish).
84

XA9745126STATUS OF THE McCLEAN PROJECT,SASKATCHEWAN, CANADA
M. GIROUXCorporate Strategy and International Development,COGEMA,Velizy Villacoublay, France
Abstract
The paper describes the status of development of the McClean Lake uranium production project. The projectincludes development of a new mine/mill complex located 10 kilometres west of the Rabbit Lake mine site, in theAthabaska region of northern Saskatchewan, Canada. This first Canadian uranium project since Key Lake wasdeveloped in the late 1970s, is planned to help provide the increasing need for uranium production during the restof the 1990s and beyond. The report describes the geological model for the 6 unconformity-type uranium orebodiesnamed: JEB; Sue A, B and C; and McClean Lake A and B. These deposits will be extracted using both open pit andunderground mines. The report describes the history of exploration and development, as well as the progression ofthe environmental clearance process under die joint review panel of the Canadian and Saskatchewan governments.The Canadian$250 million project, operated by Cogema Resources, is jointly owned by Denison Mines Limited,Minatco Limited and OURD (Canada) Company Limited. It is scheduled to start producing uranium concentrate in1997.
1. INTRODUCTION
On March 16 1995, Cogema Resources, the operator, launched the McClean project, a newuranium mine and mill in Canada. McClean is located in the northeastern region of the Saskatchewanprovince, about 10 kilometres west of the Rabbit Lake mining site (see Fig. 1).
This decision followed the approval given in late 1993 by both levels of government after thecareful review undertaken by a joint federal/provincial panel.
The McClean Lake project is a joint venture between 3 partners:
Denison Mines Limited: 22.5%,
Minatco Ltd (a wholly owned subsidiary of Cogema): 70%,
OURD (Canada) Co Ltd: 7.5%.
About Can$ 250 million will be invested in the project with a production start scheduled for1997.
2. THE OREBODIES
2.1. Geological setting
The McClean project includes various orebodies of the unconformity type occurring at depthsvarying between few tens of meters to about two hundred meters:
JEB, the first to be mined (open-pit),
the Sue orebodies (A, B ,C...),
The McClean A and B orebodies.
85

oo
C A N A D A
SASKATCHEWAN
0 1000kmi
ATHABASCABASIN
WOLL ASTONLAKE
EDGE OFSHIELD
0 400 km
FIG. 1. Location of the McClean project.

103°55'
54" 15'
+ WESTERN CRATON -
2 ••-.ATHABASCA-y.'-BAS/N. x^.
1 McCLEAN2 CLUFF LAKE3 KEY LAKE4 MIDWEST
5 McARTHUR6 RABBIT LAKE7 COLLINS BAY8 EAGLE POINT
9 DAWN LAKE10 CIGAR LAKE1 1 URANIUM
CITY
FIG. 2. Subdivisions of the Canadian shield and U deposits.
87

X X X X X X x P x x X / X X X X X X X' X x x x x x f x x x x x x x x
x « X . / X X X X X X X X X X X X X /x i x x x x x x x x x x x x x x x x x
x X X X X X X X X X X X X X X X X X
x .' . -• / x x x x x x - *• .'xx.' fCrvi "
x / x x x x^ X X / X X X
X X X X X
COLLINS BAYA ZONE
McCLEAN S
x x x xX X X X
.V" / XX XX>X X X X X X XX X X X X X XX X X X X X X X
X X X X / X X X X XX X X X X X X X X X X X ,
X X X X X X XX X X X X X X ' X X X X X X X X X X X X
X X X X
0 5 km_J
FAULT
URANIUMDEPOSIT
APHEBIANINTERMEDIATE - FELSIC GNEISS.CALC-SILICATES - META-QUARTZITES.
GRAPHITIC GNEISS.
ARCHEANGRANITO-GNEISS. FELSIC GNEISS.
F/G. 3. Uranium deposits around the Collins Bay Dome.

• x x x\' x x x x x - x x , , x x / x x x x x x . x x x x x
XXX IS X X X X X X XX XXXXXX /TV X X X , x^x /jOi-i
r-rr7/ J xV >~x x x x\<X X X / X X X X X X X X X X xX X X j X X ' X X X X X X X X , !X X X X \ X X X X X X X X X X X X
x x x ^ V x ' x x x x x x x x x x
r7~>x x x / x x x x x x x x x- X X X X X ^ X X ' X X X X X X X X ,fe'x x x x x x x x x x x x x
X X X X X X X X X X X X X ' X Xx x x x x x x x x x x x x x x x
///////S////S////S
FELSIC GNEISSx x x x x x x x x x x x x x x x x x x
! x x X x-77V-> '////// >^ GRAPHITICGNEISSINTERMEDIATEGNEISS
//////SS////SSS'SSS
ORE OUTLINE
FAULT
FIG. 4. 5«* A deposit. Geology at the unconformity.
89

50 J
OVERBURDEN
ATHABASCASANDSTONESINTERMEDIATEGNEISS
GRAPHITIC GNEISS
PEGMATOIOS
FELSIC GNEISS &PEGMATOIDS
MINERALIZATION
HELIKIANUNCONFORMITY
FAULTS
2 5 m
FIG. 5. Swe/4 deposit. Cross section (500 ppm cut-off).
90

450 -
425 -
CHLORITIZATION
:-:-:•:• NO ALTERATION
LIMONITIC/BLEACHEDALTERATION
SECONDARYHEMATIZATION
MINERALIZATIONHELIKIANUNCONFORMITYFAULTS
FIG. 6. Sue A deposit. Surrounding alterations.
91
0.1% U308
0.1 - 0.5% UoOg
0.5 - 15% U308
FIG. 7. Sue A deposit. Plan map of the ore outlines.
92

The deposits are located at the eastern edge of the Athabasca Basin (Fig. 2). The initialdiscovery of what has now been named the McClean orebody occurred beginning of 1979 (Fig. 3).It was followed in 1982 by the discovery of the JEB deposit and in 1985 by SUE A, the first of theseries of the SUE deposits. To date, the total known mineable reserves amount to about 20 000 t Uwith an average uranium content of 2.8%.
The McClean deposits are spatially related to the unconformity separating the HelikianAthabasca sandstone group from the underlying graphitic metasediments of the Wollaston Group andare located at the edges of presumed Archean domes, the SUE deposits being located at the westernedge of the Collins Bay Dome along a 3 km long NS trend.
The orebodies can be basement hosted or sandstone hosted. Like other orebodies in the area,the high grade core of the McClean orebodies are fault controlled and have a spatial relationship witha graphite rich pelitic gneiss. This association has allowed the development in the area of anexploration approach involving a combination of geophysical techniques. Various conductivitymethods have proved very successful, pinpointing blind mineralizations at depths greater than 500metres below the sandstone cover.
In the McClean area, uranium mineralizations can be alone or associated with nickel andcobalt.
2.2. The Sue A deposit
While each orebody presents its specific characteristics, the various orebodies have numerouscommon features. Therefore only Sue A is described with some detail. A more general descriptionof the various Sue deposits can be found in IAEA-TECDOC-650 [1].
The Sue A deposit lies between 60 and 75 metres below surface (Figs 4, 5) and strikes to thenorth. The deposit is nearly 200 m long with a width averaging close to 20 m. Its average thicknessis 9 m. The mineralization is highly fault controlled, resulting in irregular cross-sectional shape.Mineralization terminates against two sets of faults: northeast and northwest in direction.
The deposit (Fig. 6) lies on and immediately above the unconformity in an envelope ofmassive earthy-red clay. Argillic alteration extends almost to the sandstone subcrop along fault zones,leaving only scattered silicification in the cap rock. About 9 m of glacial overburden covers thesandstones.
Minor amounts of I1 mineralization extend downward into the basement as narrow roots alongfaults. Less than 25t of the Sue A deposit lies below the unconformity.
The distribution of uranium is confined to a few high grade (>5%) pods, mostly in thesouthern part of the deposit, where 70% of the total uranium is located (see Fig. 7). Grades exceeding15%U occur.
2.3. The geological model
The McClean deposits display many of the characteristics of the Athabasca deposits (see Fig.8). The mineralizations are genetically related to one or more graphitic metapelitic units ranging ingraphite from 1 to 70% and associated with the unconformity between the sandstones and theaphebian horizons in various ways:
straddling the unconformity generally in a pencil shaped form,
93

as a single tabular vein or multiple lenses in the metapelitic gneiss,
perched in the sandstones.
The sandstones and basement rocks surrounding the orebodies have been considerablytransformed in various clay minerals during a widespread hydrothermal event. Argillization,mineralization and silicification are synchronous events associated with the main reverse fault as partof a continuous tectonic-hydrothermal process.
In general, the deposits are structurally controlled by reverse faults originating in andparalleling the graphitic metasediments. These faults control the lateral extent of the mineralizationand create horsts and offsets of the unconformity surface.
3. THE AUTHORIZATION PROCESS
This lengthy process started in 1991 with the announcement by both federal and provincialgovernments that they would organize a joint review of proposed new uranium developments in theSaskatchewan province of Canada.
In August 1991 a joint federal/provincial panel was appointed. Its recommendations weresubmitted to both governments in October 1993. By the end of 1993, McClean was given green light.
The various stages
The review: A brand new mine and/or mill project must be reviewed by both control boards,the Canadian Atomic Energy Control Board (AECB), and the Saskatchewan Environment andResource Management.
The preparation of guidelines: They had been prepared by the assessment office ofSaskatchewan Environment and Resource Management.
The public hearings: After initial review lasting close to three months by a panel, chosenbecause among other criteria they had never been exposed to the uranium mining business, the publichearings took place. During these hearings, much broader issues than the only technical merits of thesubmitted project were discussed.
The Panel's Report: The recommendations were to allow McClean to proceed in 5 years(apparently with a view to implement a strategy of staged development of uranium resources hiSaskatchewan).
The Government's decision: During the 30 day period to allow for comments on the panel'sreport, Cogema Resources, now operator of the McClean project, responded to the panel'srecommendations, as did several agencies. This helped correct some misunderstandings and providedthe opportunity to clarify some technical aspects.
The green light: 23 December 1993, both governments allowed McClean project to continueits licensing process.
4. THE MINING PROJECT:
Since approval to proceed, COGEMA RESOURCES undertook the licensing phase.Construction has now started.
94

w BLEACHINGLiMONITIZATION
BLEACHINGLIMON1T1ZAT10N
UNALTERED UNALTERED UNALTEREDSILICIFIED SILICIFIED SILICIFIED
SUEA-SUE B SANDSTONES1% U308- High Ni As
ARGILLIZATION
SUE C BASEMENT7%U308- Low Ni. As
SUE CQ BASEMENT1% U308- Low Ni, As
-SILICIFIED ZONEARGILLIZATION
•CHLORITIZATiON
•APHEBIANCOLLINS BAY
ARCHEAN DOME
QUARTZIT IC UNIT
INTERMEDIATE GNEISS
GRAPHITIC GNEISS
GRANITIC GNEISS
MINERALIZAT ION
FAULT
FIG 8 Schematic section across the Sue area

SOLVENTEXTRACTION
CRUSHERPRECIPITATIONDRYING
LEACHING
FIG. 9. The McClean mill.

4.1. Construction schedule
April 1995: Construction of the temporary camp, and then the permanent camp,the water treatment plant and mill offices.
October 1995: Start of open pit mining operations at the JEB orebody.
1996: Construction of the process plant (see Fig. 9). Completion of miningof JEB orebody, by year end.
1st half of 1997: Completion of construction of the mill. Preparation of the JEBopen-pit as a tailings disposal facility. Beginning of mining of the SueC orebody.
2nd half of 1997: The mill will then be commissioned and production will start.
1998: Full scale production of 6 million pounds per year expected.
4.2. Economic impact
Investment
In the next two years, until production starts, about 250 Mcan$ will be invested in the project.
Jobs and northern employment
Construction stage: 250 people on the average will be employed. Production stage: 200permanent jobs will be created by mid-1995 with a company policy of maximizing the employmentof northern residents. Experienced people will be transferred from our existing operation in CluffLake to supervisory positions in the McClean lake project.
Business opportunities
The purchase of equipment, goods and services, both during construction and production stagewill boost the local economy. The Company will insure that on site contractors will follow its ownpractice of local employment preference.
4.3. Safety and protection of the environment
The performance of the facilities to insure a safe workplace for all personnel, and an excellentprotection of the environment will be permanently monitored.
All critical parts of the facilities have been extensively reviewed during the regulatory process.However, in spite of the additional administrative burden, Cogema Resources will continue to proposeand implement modifications to the approved facility, each time such are both reasonably achievableand beneficial to workers' safety and the protection of the environment.
For example in 1994, an application was made and approval obtained for a modification ofthe mill process resulting in a decrease of the volume of mill tailings, and a reduction of the totalchemical loading to the environment.
97

00
U i i H 1 I i I 1 i
FIG. 10. Uranium supply and demand of the western world.

The concept of paste tailings now fully operational at Cluff mining will be proposed forMcClean.
Reclamation and decommissioning were taken into account at the design stage to be optimizedwhen production stops. The McClean project is the first uranium mine for which financial assurancesfor decommissioning will be implemented at the very beginning of production.
5. CONCLUSION
The production of this new mine, the first investment launched by the industry in Canadasince Key Lake in the late seventies, will start in two years from now at a time the situation willlikely be favourable for new production (see Fig. 10), taking into account the following factors:
further closing down of mines in the years to come,
a consumption level which is presently the double of the production level,
the exhaustion of inventories in the western world,
uncertainty of western world consumers on the available supply coming from the RussianFederation and other producing countries in the CIS, including the prospects of a somewhatlimited flow coming from the blending down of highly enriched uranium from weaponsinventories.
REFERENCE
[1] EY, F., PIQUARD, J.P., BAUDEMONT D., ZIMMERMAN, J., "The Sue UraniumDeposits, Saskatchewan, Canada", New Developments in Uranium Exploration, Resources,Production and Demand, IAEA-TECDOC-650, IAEA, Vienna (1992)189.
88EXT PA3E(S)• A £JL Dl A RJIlf3©f t ULAiilV . _ _99

ADVANCES IN THE EXPLORATION MODEL FORATHABASCA UNCONFORMITY URANIUM DEPOSITS
K.WHEATLEY, J. MURPHY, M. LEPPIN,C. CUTTS, J.A. CLIMEEUranerz Exploration and Mining Ltd,Saskatoon, Saskatchewan,Canada
Abstract
This paper covers the genetic model of ore formation and exploration techniques Uranerz Exploration andMining is presently using to explore for unconformity uranium deposits in the deeper parts of the Athabasca Basin.The main objectives of this paper are: 1) to present a genetic model for unconformity uranium deposits which is beingused in our current exploration strategy, and 2) to present the sequence of exploration techniques used by Uranerzto explore for uranium in areas of the Athabasca Basin with up to 1000 m of sandstone cover. The Athabascaunconformity deposits are located in northern Saskatchewan, Canada. Within the Precambrian Athabasca Basin,exploration companies have discovered 18 uranium deposits. These contain more than 500 million kilograms ofuranium, with average grades ranging from 0.3 to 12%. Uranerz discovered the Key Lake deposits in 1975, currentlythe largest and richest open pit uranium mine in the world. Uranerz also holds interests in the Rabbit Lake, MidwestLake and Me Arthur River deposits, all in Saskatchewan, and is also actively exploring for uranium worldwide. Thefirst discovery in the eastern Athabasca Basin was in 1968 at Rabbit Lake, followed by Key Lake in 1975. Bothdeposits had surficial indicators, such as radioactive boulders, strong geochemical anomalies in the surrounding lakesand swamps, and well-defined geophysical signatures. After the Key Lake discovery, an exploration model wasdevised which incorporated the underlying graphitic horizon and its strong electro-magnetic signature. Since then,there have been numerous new discoveries made by systematically drilling along these electro-magnetic conductors.The advancements in geophysical and geochemical techniques have led to discoveries at increasing depths. In 1988,the McArthur River deposit was discovered at a depth of 500 m.
GENETIC MODEL FOR UNCONFORMITY URANIUM DEPOSITS
Archean lithologies
During the early Archean, accretion of crustal blocks formed large plates. The Archeanlithologies consisted of granites, granitic gneisses and minor mafic assemblages, which were subjectedto granulite facies metamorphism during the Kenoran Orogeny at 2560 Ma. The borders of the crustalblocks were zones of weakness and the sites of repeated faulting. Gravity data is used to differentiatebetween these crustal blocks.
It has been postulated by Heier and Adams [1] that uranium migrates upward in the crustduring granulite facies metamorphism. Therefore, it is possible that the Kenoran Orogenyconcentrated uranium in the upper Archean crust.
Paleoproterozoic lithologies
Paleoproterozoic pelitic, psammitic, quartzitic and carbonate sediments were deposited in amiogeosynclinal setting over the Archean lithologies. The basal, carbon-rich pelites were enriched inuranium derived in part from the enriched Archean crust. The Archean block boundaries had littleeffect on sedimentation during this stable depositional period.
Both the Archean lithologies and the Paleoproterozoic sediments were metamorphosed to anupper amphibolite to lower granulite grade (Annesley and Madore [2]) during the PaleoproterozoicHudsonian Orogeny dated at 1780 Ma. The carbonaceous rocks near the base of the pelitic unitsformed graphitic layers.
101

During metamorphism, the carbon in the carbonaceous sediments was converted into graphite.Dehydration of the rock produced fluids, which transported the uranium and associated metals intoareas of less confining pressure.
The Hudsonian orogeny also reactivated many of the structural zones between the Archeanblocks. These zones may be up to several hundred kilometres long and 10 to 20 kilometres wide,herein called mega-shears. These zones of weakness were subjected to folding, faulting anddownwarping, causing the metasediments to be preserved in linear troughs or keels. These wereintruded by radioelement-enriched pegmatites, and were the focus for fluid migration, increased heatflow, chemical alteration and anatexis. All these events contributed to the further concentration ofuranium within the faulted graphitic lithologies. Parslow [3] has shown that uranium can beconcentrated in anatexites by up to 50 times the original content of the parent rock.
Upward heat flow within the mega-shears was aided by the presence of the newly formedgraphite, which acted as a thermal conductor (Tilsley [4]). Graphitic units folded or faulted into nearvertical attitudes transfer heat much more efficiently than those with a horizontal attitude. Regionalthermal events, therefore, would have had a more concentrated effect within the graphiticmega-shears, allowing for longer periods of metamorphism and fluid flow in the structural zones thanin the surrounding lithologies.
The mega-shear zones are now marked by preserved NE-trending keels of Paleoproterozoicmetasediments, with the easternmost mega-shear in the Basin underlying all of the known easterndeposits. This has been described as the Wollaston/Mudjatik contact in numerous papers (Sibbald [5]).
The initial processes involved in the formation of the unconformity deposits of the AthabascaBasin and the Beaverlodge-type deposits near Uranium City, Saskatchewan, are thought to be similar.The concentration of uranium in the basement lithologies in both regions would be comparable ingrade during the Paleoproterozoic, before deposition of the Athabasca Group sandstones occurred.
Athabasca group deposition
The Archean and Paleoproterozoic lithologies went through a period of uplift and erosion afterthe Hudsonian Orogeny. Then they were covered by the Mesoproterozoic sandstones of the AthabascaGroup.
Deposition of fluviatile to shallow marine quartz sand and pebbles in the intracratonicAthabasca Basin, formed by tensional tectonics, covered the basement lithologies with up to 5 km ofsediments. The present day thickness of the sandstones is estimated to be a maximum of 2,200metres. The Athabasca Basin played an important role in the formation of the unconformity depositsby providing basinal brines to the relatively dry basement lithologies during the main deposit-forminghydrothermal event described below. These fluids concentrated the basement-hosted protore into thehighest grade uranium deposits in the world.
While low grade uranium deposits occur in numerous localities around the world, the highgrade unconformity deposits occur only in the Athabasca Basin and, to a lesser extent, in the PineCreek geosyncline of northern Australia. Without the presence of the overlying sandstones, theprotore developed in the basement lithologies would not have been concentrated beyond grades of0.5% uranium, on par with the Beaverlodge type or the European Hercynian deposits. The finalconcentration step was a hydrothermal event which promoted circulation of the basinal brines of theAthabasca Group.
102

Deposit formation
The deposit-forming event, which took place at approximately 1350 Ma, increased thetemperature at the bottom of the Athabasca Group to an estimated 200 degrees Celsius (Kotzer andKyser [6]). It also re-activated basement structures, which extended into the overlying sandstones.This event mobilized the high salinity, oxidized basinal brines through the Athabasca Groupsandstones, as they had a higher permeability than the underlying basement lithologies. The fluidswere channeled into the upper portions of the mega-shears and flowed along strike due to the highpermeability of these structures. Some of the basinal brines were forced down into the faultedgraphitic lithologies due to both gravity induced hydrostatic pressure and convection. In the graphiticshear zones, the oxidized brines mobilized the uranium and associated metals and transported themalong the strike of the mega-shear.
Some of the fluids travelled deeper within the graphitic package, and became reduced. Bothreduced and oxidized fluids continued along the mega-shear until they reached a dilation zone in thegraphitic package caused by extensional cross-faulting. Here, the fluids mixed together, causing themetal-bearing oxidized fluids to become reduced. The uranium and metals would precipitate, formingunconformity mineralization.
During, and subsequent to, unconformity mineralization, the mixed basinal brines alsocirculated upwards within the overlying sandstones. These followed the permeable fault systems whichextended from the graphitic horizon into the sandstones, creating an alteration halo. The size of thehalo above the deposit is proportional to the amount of fluid which flowed through the sandstone. Thegeochemistry of the alteration halo varies with the distance from the deposit area, ranging fromseveral per cent uranium to one half of a ppm. Metals such as nickel, arsenic, lead, cobalt andvanadium are also common within the halo.
The brines also converted the interstitial clays to illite, and, closer to the deposit, to chlorite.Both silicification and desilicification may occur within the haloes. An increase in the boron contentis also typical. However, not all alteration haloes contain uranium, or are associated withmineralization with economic grades.
EXPLORATION TECHNIQUES
The following is a description of our exploration techniques in areas of deep sandstone. Thesetechniques are based on the genetic model described above. A progressive sequence of explorationsteps is used, starting with large scale area selection involving a few thousand square kilometres, andending with drill targets involving several kilometres of conductor strike length.
Area selection
Field evidence of the exploration criteria derived from the genetic model are sought usinggeophysics and geochemistry. The boundaries of Archean blocks and associated keels ofPaleoproterozoic metasediments are located with geophysics. These define the NE trendingmega-shear zones. Surveys of lake sediments and sandstone boulders locate geochemical anomaliesat surface. Electro-magnetic surveys then delineate graphitic lithologies at depth. The following stepshave been established by Uranerz for the exploration for unconformity uranium deposits in areascovered by thick sandstones.
Large scale attributes, such as NE-trending mega-shears, are defined by gravity and magneticdata. The gravity data outline the boundaries of Archean crustal blocks which are zones of crustalweakness. Magnetic data differentiate between the Archean and Paleoproterozoic lithologies, with the
103

mag highs representing the Archean and the mag lows representing the Paleoproterozoic. Keels ofPaleoproterozoic metasediments preserved over these zones of crustal weakness are sought.
After locating such a potentially favourable geological setting, the area is sampled usingreconnaissance-scale lake sediment and boulder geochemistry. Boulder sampling is carried out in areascovered by glacial till, and is designed to locate sandstone boulders which carry the geochemicalsignature of an alteration halo. The anomalous boulders are present in the till, with the source of theboulders at the alteration halo subcrop.
Reconnaissance sampling of sandstone boulders is performed at 300 metre intervals on linesspaced 2 kilometres apart. These lines are oriented perpendicular to the prevalent glacial direction.If geochemical anomalies are encountered, a more detailed follow-up survey is done, samplingboulders at a 100 to 150 metre spacing on lines 800 metres apart.
Modelling and empirical data both indicate that geochemical responses become stronger closerto a deposit. The deeper deposits have weak but still detectable surficial signatures in the overlyingboulders. In areas where the sandstone is 1 kilometre thick, only a subtle expression is seen in theboulders with uranium values less than 1 ppm.
Because of the subtlety of the geochemical signatures, improved techniques were used tolower detection limits for uranium, boron and lead. An axial ICP unit and fluorometry is used for theanalyses, and larger sample sizes improve the uranium and lead detection limits to 0.02 ppm. Theboron detection limit is 2 ppm, and illite and chlorite may be determined to a limit of 0.001%.
Areas with favourable geochemistry are then tested by electro-magnetic surveys, whichdetermine the location of graphitic horizons in the basement. Two modes of operation have been used,moving-loop and fixed-loop time domain EM, which can accurately define conductive lithologiesthrough 1 kilometre of sandstone.
The moving loop survey uses a transmitter loop size of 1 kilometre diameter, with thereceiver 2 kilometres away. This entire set-up is moved on 300 metre intervals through the bush foreach reading. The fixed-loop EM survey has a stationary transmitter loop of 1.6 kilometres indiameter and a moving receiver which takes readings from 50 metres to 3 kilometres away.
A combination of favourable gravity, magnetics, boulder geochemistry and EM responsesallows for the placement of a drillhole.
In the next stage of an exploration programme, core drilling is employed to examine thetargets defined by the previous surveys. The core from a drillhole is examined for lithologies andstructure, and then geochemically analysed. This information is used to determine if another drillholeis warranted. Targets would continue to be drilled until the anomalies have either been satisfactorilyexplained or a deposit has been located. It is important to note that not all alteration haloes are relatedto a uranium deposit, and most alteration haloes are in fact barren.
SUMMARY
In summary, Uranerz has advanced the genetic and exploration models for unconformityuranium deposits within the Athabasca Basin, and has applied them in areas of up to 1 kilometre ofsandstone cover.
104

Genetic model
The sequence of geological events which contributed to the concentration of uranium are asfollows:
1) Archean crustal accretion, resulted in zones of weakness between the crustal blocks. Theblock boundaries have locally developed into NE-trending mega-shears.
2) Granulite facies metamorphism during the Kenoran Orogeny concentrated uranium in theArchean crust.
3) Erosion of the Archean and subsequent deposition of psammites and uranium-enriched peliticsediments during the Paleoproterozoic
4) Metamorphism and deformation during the Paleoproterozoic formed linear basins of peliticto psammitic metasediments over the Archean zones of crustal weakness, i.e., the mega-shears. This also involved further concentration of uranium by anatexis and fluid migration.
5) Erosion of the Archean and Paleoproterozoic lithologies, and subsequent deposition of theMesoproterozoic Athabasca Group.
6) A hydrothermal event at approximately 1350 Ma caused basinal brines to concentrate theuranium present in the mega-shears at the unconformity contact with the overlying AthabascaGroup sandstones.
Recent glaciation caused surface expressions of the hydrothermal event in the sandstones tobe spread down-ice from where it subcrops.
Exploration model
Our exploration techniques for the search of deep uranium deposits commence with ageological compilation of the basement lithologies beneath the Athabasca Basin. Gravity andmagnetometer surveys define NE-trending mega-shear zones with preserved keels of Paleoproterozoicmetasediments. This provides target areas of up to 100 km long and 20 km wide.
Sampling of the glacially-derived sandstone boulders determines areas of geochemicalanomalies in the till. These responses are the surface expressions of hydrothermal alteration haloesin the upper sandstones, and effectively reduce the strike length of the target to about 5 kilometres.EM surveys are then used to locate graphitic horizons in the basement Paleoproterozoicmetasediments, further reducing the width of the target to several hundred metres. The initial drillingtarget area is then approximately 5 kilometres by 400 metres. Geochemical and structural analysesof each drillhole further refines the target area, until the source is discovered.
ACKNOWLEDGEMENTS
The authors acknowledge Uranerz Exploration and Mining for their permission and supportin the writing of this paper. Numerous critical reviews were provided by R. Orr and R. Loewer, andthe figures in the slide presentation were drafted by C. Haider.
105

REFERENCES
[1] HEIER, K.S., ADAMS, J.A.S., Concentration of radioactive elements in deep crustalMaterial, Geochim. et Cosmochim. Acta, 29, (1965), 53-61.
[2] ANNESLEY, L.R., MADORE, C., The Wollaston Group and its underlying Archeanbasement in Saskatchewan: 1989 fieldwork and preliminary Observations in Summary ofInvestigations 1989, Saskatchewan Geological Survey; Saskatchewan Energy and Mines,Miscellaneous Report (1989) 89-4.
[3] PARSLOW, G.R., Basement as source material for HHP granites: data from the Saskat-chewan Shield, Canada, in, High heat production (HHP) Granites, hydrothermal circulationand ore genesis; papers presented at a conference by The Institution of Mining and Metallurgyat St. Austell, Cornwall, England (1985).
[4] TISLEY, J.E., Continental weathering and development of palaeosurface-related uraniumdeposits: some genetic considerations; in Uranium in the Pine Creek Geosyncline, editors J.Ferguson, A.B. Goleby, Proceedings Series, International Atomic Energy Agency, Vienna(1980) 721-732.
[5] SIBBALD, T.I.I., Geology and genesis of the Athabasca Basin uranium deposits; in Summaryof Investigations 1985, Saskatchewan Geological Survey; Saskatchewan Energy and Mines,Miscellaneous Report (1985) 85-4.
[6] KOTZER, T., KYSER, T.K., Fluid history of the Athabasca Basin and its relation touranium deposits; in Summary of Investigations 1990, Saskatchewan Geological Survey,Saskatchewan Energy and Mines, Miscellaneous Report (1990), 90-4.
106

XA9745128PROVIDING RADIATION SAFETY FOR THEENVIRONMENT AND PEOPLE AT URANIUM OREMINING AND PRIMARY PROCESSING OPERATIONSAND TREATMENT OF RADIOACTIVE WASTES IN THENAVOI MINING AND METALLURGY COMBINAT, UZBEKISTAN
N.I. KUCHERSKYNavoi Mining and Metallurgy Complex of Kyzylkum State,Concern of Rare Metals and Gold,Navoi, Uzbekistan
Abstract
The rise of the uranium industry in the Republic of Uzbekistan is closely connected with the discovery ofa number of significant uranium deposits of sheet sandstone type in the Kyzylkum desert area, between the Amu-Darya and Syr-Darya rivers. Based on these deposits, in 1958 the construction of Navoi Mining and MetallurgicalCombinat (NMMC) commenced. In 1965 the Hydrometallurgical Plant No. 1 (HMP-1), located in the industrial zonenear the Navoi town, started producing the uranium protoxide-oxide (yellow cake). The structure of the NMMCuranium production operations includes HMP-1 and three mining facilities. Conventional open-pit and undergrounduranium mining were shut down here in 1994 and at present all the uranium is extracted by in situ leaching (ISL).Radiation safety of the environment and population inhibiting the areas involved in the activities of uranium materialsmining and primary processing facilities is covered by a system of Republican legislative acts, standards, norms andregulations. The legislative basis covering the radiation safety activity is represented by the following acts of theRepublic of Uzbekistan: "Public Health Service Act", "Environmental Protection Act", "Labor Act", "State SanitaryInspection Act". The radiation and hygiene sanitary monitoring aimed at collecting information on the radiationconditions at the working places and in the environment, on the current and expected irradiation doses taken by thepersonnel and various population groups inhabiting the area involved in the activities of the existing, liquidated ortemporarily closed NMMC facilities constitutes an integral part of the radiation safety providing system. The resultsof the radiation monitoring show that no radioactive contamination of any environmental objects has been detectedoutside the sanitary zones and production sites. The radionuclides content in the atmosphere, on the ground surface,in the underground water was found to be at the background level. Current annual average exposure doses of thelimited critical population groups were detected to be essentially lower than the current international standards andwere about 1 mSv per year. The strategic trends in uranium industry development include providing of ecologicallysafe conditions at all the NMMC operations based on implementation of the more ecologically "clean" ISL method,liquidation of mining and processing operations that have proved to be ineffective due to both economic and ecologicalreasons. The reclamation programme has been set up and is being continuously implemented which includes specialmeasures for reclaiming of environmental objects that have been affected by uranium production operations in thecourse of more than 30 years of their existence.
1. INTRODUCTION
The Republic of Uzbekistan is one of the largest producers of uranium protoxide-oxide(yellow cake). The uranium industry origin in the Republic is connected with the discovery of anumber of large deposits of uranium ore in the Kyzylkum desert, between the rivers Amu-Darya andSyr-Darya. Based on these deposits the construction of Navoi Mining and Metallurgy Complex(NMMC) was started in 1958. In 1965 the production of uranium protoxide-oxide was commencedat the Hydrometallurgical Plant (HMP-1) located in Navoi industrial zone.
NMMC production activity comprises the territory of sandy planes and low mountainelevations of central Kyzylkum with an area of about 100 000 km2, which is included into a networkof automobile roads, electric power lines, water mains, railways.
Since 1991, the moment of the formation of the independent Republic of Uzbekistan, NMMCwith all its production facilities has become property of the Republic. In 1992 on the base of NMMC,construction-mounting and design organizations of Atomic Engineering and Industry Ministry of the
107

former URSS, located in the territory of the Republic, the Kyzylkum State Concern of Rare Metalsand Gold was established.
NMMC uranium industry is a complete cycle: from prospecting works to hydrometallurgicalprocessing with production of uranium chemical concentrate in the form of protoxide-oxide (yellowcake). The structure of the NMMC uranium industry includes HMP-1 and three mining enterpriseslocated close to the towns of Uchkuduk, Zafarabad and Nurabad. Besides, NMMC comprisesMuruntau gold mining and processing industrial complex, located near the town of Zarafshan.Currently Kockpatas gold mining and processing industrial complex is being constructed in theUchkuduk region. It will be put into operation in 1995. The Mining Division No 2 for fluorite oresmining and enrichment is acting not far from the Krasnogorskiy settlement in the Tashkent region.
Five modern towns with a total population of about 200 000 people have been constructed inKyzylkum, on the base of uranium and gold mining industry: Navoi, Zarafshan, Uchkuduk,Zafarabad, Nurabad. All towns are assets of the NMMC. They are connected to one another and tothe region center Navoi town by railroads (500 kilometres), automobile roads (1000 kilometres), andan electric power grid, linked to the Republic's network.
There are several large uranium deposits (Uchkuduk, Sugrali, Ketmenchi, Sabirsay, NorthernBukinay, Southern Bukinay, Beshkak) within the NMMC activity sphere. At present, they are atvarious stages of working.
According to IAEA classification, uranium deposits taken by NMMC for operation andplanned for commercial processing, are related to blanket sandstone type. The uranium content in oresreaches a few tenths of a percent. The ores consists of pitchblende, often in a coffmite mixture.Mineralization occurs in eight water-permeable beds of the Cretaceous period and in three beds ofPaleogene.
Underground mining of uranium ore was completed in 1994. Currently uranium deposits,being assets of NMMC, are developed only by the in situ leaching (ISL) method. Several other largeuranium deposits, which are planned for production by in situ leaching, are at various stages ofpreliminary and detailed prospecting. Full-scale development testworks have been conducted at someof these deposits.
2. RADIATION - ECOLOGICAL ASPECTS OF URANIUM MINING
2.1. Baseline radiation and mining waste
The top layer of the earth surface in a region of NMMC uranium mining enterprises ispresented by desert and semi-desert brownish-gray not very productive soils, which are of mot muchvalue for irrigated cultivation. They have been used before the beginning of mining mainly forpasturing cattle.
The regions have no constant flowing surface waters. Intermittent rivers flow only in springand autumn.
The background indices of natural radioactivity of the soils are:
gamma-radiation exposure dose rate is 10-17-10"6 R/h,natural uranium content is 2-Smg/kg,Radium-226 content is 2-4-10'9 Ci/kg,total specific alpha activity is 330-350 Bq/kg.
108

Background indices of natural radionuclide content in flora: natural uranium is0.001-0.005 mg/kg, Radium-226 is 0.05-0. MO'9 Ci/kg, Polonium-210 is 0.05-1.0-10'9 Ci/kg.
The dumps of substandard or subeconomic ores were formed during previous years in theprocess of open pit and underground mining. Up to now the dump total volume is about 2,420thousand cubic meters. Subeconomic dumps consist of caked massifs of a broken rock mass oftruncated prisms and cones of sandy-argillaceous rocks. Practically all dumps are covered by a naturalargillaceous crust, partially broken by cracks. Dust and radon enter to the atmosphere from thesurface of these subeconomic dumps.
The total specific alpha activity of subeconomic ores in dumps is 10-20-103 Bq/kg. The radonflux density from the surface is in range from 0.03 to 1.5 Bq/square meter-sec. The Gamma-radiationexposure dose rate at the surface is up to 300-350-10"6 R/h.
The radon equivalent equilibrium concentration in atmospheric air, measured below the dumpsurface is 30-40 Bq/cubic metre. At a distance of 20-30 metres from the dump concentrationdecreases to the natural background of 10-15 Bq/cubic metre.
The average concentration of long-lived alpha-active nuclides in atmospheric air under dumps'surface is within the limits of 0.05 to 0.1-10'15 Ci/1 a year, i.e. This equals the natural background.As a result of measurements it is established that an aureole (or plume) of territory contamination ingamma-radiation exposure dose rate and total specific alpha-activity due to dusting from dumpssurface is observed at a distance of 20-30 m. At a distance of 30-50 m from the dumps theradionuclide concentration in a surface earth layer is decreasing practically down to backgroundvalues.
2.2. In situ leach mining
Full-scale commercial in situ leaching (ISL) uranium production was first put into operationin 1961 at the Uchkuduk deposit. At present, ISL mining method is in operation at Uchkuduk,Nothern Bukinay, Southern Bukinay, Beshkak, Sabirsay and Ketmenchi deposits.
The structure of the ISL mine includes three parts: a mining complex, a system of surfaceequipment and pipelines as well as a processing complex.
The mining complex consists of a system of holes drilled from the surface down through theproductive bed. Well casings are installed. The area around the casing is cemented in order to isolateone aquifer from another. The wells in the ore interval are equipped with filters (i.e. screens).Solution lifting devices (submersible electric pumps, air lifts) are set in the recovery wells to recoverproducing solutions. The hole openings are connected with feeder or distributing pipelines by meansof hoses.
The processing complex includes a system of sorption (i.e. ion exchange resin) andregeneration columns, as well as filtration and leaching solutions preparation equipment, acompression station and reagent stores.
A system of surface pipelines connects the mining and processing complexes in one unit. Itconsists of main distributing and feeder pipelines. They are usually put on the surface, or more rarelyseldom under ground or in banting. It also includes local field pump stations with collectors ofproductive solutions and local distribution tanks and oxidation units.
The deposits are the assets of NMMC. They are developed using sulphuric-acid leachingsystems, except for Uchkuduk deposit, where from 1983, a weakly-acid technological scheme wasused. In this system of air is the oxidizer which has been used.
109

The negative impact of in situ leaching on the earth surface, soil and atmosphere issignificantly less than of underground and open pit mining. The single contamination source of ISLmining is leaks and spilling of leaching solutions due to technological violations of producing andinjection wells, repairing and restoring works at wells and surface pipelines.
Other location of spills, the soil layer and moisture are contaminated with sulphates, nitratesand natural radionuclides of uranium-radium series. Investigations of suraface and subsurfacedistribution of radioactive contamination at the ISL areas' surface indicates that they are local, bothin area and depth.
Even at the location of intensive spils, as a rule, the contamination levels at a depth of30-40 cm are reduced to background values due to the high sorption-and-capacitive and neutralizingproperties of the upper layers.
Based on to the data obtained prior to reclaiming ISL areas, radionuclide contamination (afactor of area contamination) averages 26%. The contaminated ground, taken when cleaning thesurface, is characterized by average values of gamma-radiation exposure dose rate of 60-80-10"6 R/hin total specific alpha activity of 5-10-103 Bq/kg.
The total area contaminated by radionuclides at mined out deposit by ISL subject toreclamation is about 13 000 thousand square meters. The volume of contaminated ground from thecleaned surface is about 3500 thousand cubic meters.
During ISL mining, the ore bearing aquifer is subject to the greatest environmetal impact. Theextent of this impact is primarily determined by the technological ISL scheme. The type of reagentand the oxidizing agent.
During leaching with sulphuric-acid, the concentration of mineralization in mining zoneincreases by 5-15 times in comparison with background indices. The hydrogen index (pH) is reducedfrom 7 to 1.5-2.2. The increase in mineralization is primarily connected with accumulation of thesulphate-ion in circulating technological solutions. An aureole (or plume) of technological solutionsspreading from the ore occurrence along the direction of a natural flow at the boundary of hydrogenindex, exceeding 6, does not exceed 150-200 metres. Transport of the radionuclide conteined doesnot exceed 50-60 metres. According to other indices the spreading is less.
With the weakly-acid scheme a hydrogen index of stratal waters, general mineralization,composition and content of main macrocomponents during leaching and after its completing practicallydo not differ from background values in stratal waters, even inside ore occurrence contour.
The data from observation wells, developed in the productive aquifer, show that in all ISLoperations of NMMC, at any technological scheme used, the natural geochemical character of stratalwater is unchanged more than 200-300 m zone from ore deposits. The control and monitoring of thestate of aquifers contiguous to the productive aquifers also show that there is practically no evidentchange in their natural state. It should be noted that underground water of productive aquifer of theNMMC ISL operations are all classified as category unsuitable for economic purposes. In thisconnection, the method based on natural demineralization of residual solutions in the process ofmigration with underground water flow has been adopted as the main method of decontaminated areasliquidation.
3. RADIATION-ECOLOGICALCHARACTERISTICOFTHEHYDROMETALLURGICALPROCESS
Uranium chemical concentrate,(i.e. yellow cake ) is transported from ISL mines toHydrometallurgical Plant No 1 (HMP-1), for further extraction and concentration, using organic
110

extractants. The pregnant organic matter containing uranium is subject to re-extraction using a mixtureof carbonate and ammonium bicarbonate.
Ammonium-uranyl-tricarbonate crystal slurry (pulp) is filtered. The filtered crystals areroasted in the revolving horizontal tube furnace and the final product is obtained in a form of uraniumprotoxide-oxide (yellow cake).
From yellow cake production waste gases to emission into atmosphere are subject topreliminary purification from ammonium and uranium dust in two series connected dust extractors,two film cooling absorbers and two scrubbers with a fitting of Rashig rings. The high purificationeffect ensures a low level of radionuclide emission into atmosphere, average annual quantity of whichis 1.36 Ci in total alpha-activity. Radiation monitoring results show that average annual contaminationof an atmospheric air at HMP-1 area and within the limits of sanitary defense zone by natural uraniumand total alpha-activity of uranium-series' radionuclides does not exceed the admissible concentrationsfor a limited part of population1.
At the distance of 500 m from HMP-1 perimeter, an authentic radioactivity increase inatmosphere, soils and grounds relative to the natural background is not detected. The HMP-1 tailingsdump is located 4 km to the west of the plant. It occupies an area of 5.9 square kilometres. It is atailings dump of a plain (flat) type, alluvial. Dams are 15 meters high. The dams are made of wood-rubble grounds and filled with a loamy aggregate. The sanitary defense zone with a radius of 700 m,guardzone of 110-140 m and observation zone of 2.5 km, including nearby settlements, are setaround the tailings dump.
From the beginning of operation (1964) about 60 million tonnes of the solid-phase pulp havebeen accumulated in the tailing dump during uranium ore processing. Natural uranium residualcontent in solid wastes is 50-60 mg/kg, a total specific alpha-activity is 8-104 Bg/kg.
As for the granulometric composition, the tailings dump sedimentations are presented mainlyby erosion-resistant fractions, the beach zone of maps is presented by incoherent material buttransition and central zones are presented by coherent material. The state of beaches at the maps ofthe tailing dump at present is stable. Up to now the tailings dump does not significantly impact onthe radioecological state.
An effective system of a drain screen, consisting of a row of 24 pump-out (recovery) wells,located along northern, western and partially eastern sides of the tailings dump at the distance of 50 mfrom the dam, is in operation with water diversion from aquifer and water return to the plant forfurther use in the process. This system has been made to protect underground water from filtrationlosses through the tailing dump basement by removing water.
According to the results of testing in the network of hydro-observing wells made around thetailings dump, it is estimated that radionuclide content in underground water in the sanitary-defensezone and beyond it did not exceed admissible concentrations for a "limited part of population" duringthe whole work period.
The density of radon flow from the tailing dump surface varies within considerable limitsfrom 0.1 to 20 Bg/m2-sec, and depends on the composition and state of tailing sedimentation surface.The tailing dump annually releases into atmosphere from its bare surface up to 2000 Ci of radon.
The average annual concentration of long-lived uranium series aerosols, formed due to dustcoming to an atmospheric air from dry surface sites of beach zones of maps, does not exceed theadmissible concentrations for a limited part of population living directly on the tailings dump territory.
The term "limited part of population" means population living in the areas of probable impact ofuranium production. The permissible rates by special standard (HPD -76/87").
Il l

At the distance of 30-50 m from fencing dams it reduces practically down to background values. Atthe same time during 30 years of operation a 300 m aureole of radionuclide contamination of soilsand grounds due to weathering (wind erosion) from dried beaches of the maps has been formed inthe sanitary-defense zone of the tailing dump. Radionuclide concentration in this zone exceeds thenatural background level by 5-10 times. Radionuclide concentration in the sanitary-defense zone atthe distance exceeding 300 m from the tailings dump as well as in the observation zone includingnearby settlements is at a natural background level.
From 1994 storage of radioactive wastes of uranium ore processing in the tailings dump hasbeen stopped and it is planned to make their burial in 2000-2005, including radioactivedecontamination and reclaiming of contaminated sites of sanitary-defense zone and pulp feed-lineroute.
Currently the research works are conducting in order to obtain the initial data for thedevelopment of main technical projects for the selection and substantiation of the tailings dump burialconstruction.
4. INFRASTRUCTURE OF RADIATION SAFEGUARD
Radiation safety of environment and population in the Republic of Uzbekistan is ensured bya system of legislative standards and legal acts, decrees of the President, resolutions of the Cabinetof Ministers at the President of Republic of Uzbekistan, Statements of Bodies of State Regulation andSupervision, the system of standards and rules of radiation safety.
The main legislative acts regulating the activity concerning radiation safety of the environmentand population are the following laws of the Republic of Uzbekistan: "Care of public health", "Natureprotection", "Labour", "State sanitary supervision". The former Soviet Union legislative acts, decreesand other standard technical documents, which are not in conflict with the Republic laws, are actingin radiation safety insurance.
The State Sanitary Epidemic Service, the State Committee of Supervision over SafeConducting of Operations in Industry and Mining Supervision and the State Committee of NatureProtection exercise the state supervision over assurance of the environment and population radiationsafety.
To realize their powers, the State Supervision Bodies, in compliance with their competence,control the observance of rules and standards of the radiation safety. Radiation safety of titleenvironment and population living within the regions of uranium ore mining and processing, isensured by NMMC organizations.
Basic requirements in the radiation safety assurance are regulated by "The Basic SanitaryRules of Operation with Radioactive Materials and Other Ionizing Radiation Sources (O C H -72/87)".The system of dose limits of irradiation and principles of their application is established by "TheStandards of Radiation Safety (HPB-76/87)".
The main standardization document regulating the complex of sanitary protective measures,which should be fulfilled in the process of liquidation and conservation of uranium mining enterprisesfor the purpose of the equipment and premises decontamination, territories reclaiming, burial ofradioactive waste, is the paper issued in the former Soviet Union and called "Sanitary Rules ofLiquidation, Putting into Long Term Storage and Changing the Type of Activity of Radioactive OreMining and Processing Facilities (Cn JTKIT-91)".
112

The rules have been developed taking into account the following acting documents: OCH-72/87, "Sanitary Rules of uranium mines operation (C IT-86-118) ", "Sanitary Rules of RadioactiveWaste Handling (CTIOPO-85)" and other official sanitation and safeguard standard documents.
5. RADIATION CONTROL
An integral part of the system of radiation safety assurance is a radiation and hygienic sanitarycontrol, which is necessary for obtaining the information on the environment and working places'radiation situation as well as on the current and predicted doses of irradiation of the personnel andvarious groups of population living within the regions of probable action of the existing, conservedor put into long term storage NMMC enterprises.
The production radiation monitoring is performed by the NMMC departments controlling thelabor conditions and environment protection (C K YT and CO C). The departmental monitoring isperformed by the Central Laboratory of Labour Conditions and Environment Protection by theIndustrial and Sanitary Laboratories of Sanitary and Epidemic Services of the Concern. The Statemonitoring is performed by the local and central organizations of State Sanitary Supervision, StateCommittee of Nature Protection, State Urban Technical Supervision. Besides, the specialized researchorganizations are engaged in investigation of radiologic conditions at the operating facilities as wellas in prior-to-reclaiming, post-reclaiming, periodic and routine investigations.
The following factors are subject to monitoring:
gamma radiation exposure dose rate;
the content of radon and its daughter products in premises, radon exhalation from tailingdumps and dumping grounds;
general dust content and the content of aerosols of long-lived alpha-active radionuclides in air;
radiochemical water composition;
total specific alpha-activity of soils, bottom fills, isotope compositions;
chemical factors (substances).
A volume and periodicity of radiation monitoring depend on the radiation situation and aredetermined by corresponding standardization documents. The results of radiation monitoring ofradioactive environment contamination connected with the activity of uranium mining and processingNMMC enterprises show that the average annual effective equivalent dose of irradiation of criticalpopulation group living in these regions does not exceed 1 mSv/ year relative to a sum of allradiation-hazard factors and corresponds to the basic limit for population, adopted by the InternationalCommittee of Radiation Protection.
6. CONCLUSION
Navoi Mining & Metallurgy Complex engages the leading specialized and designorganizations of the Republic and Commonwealth of Independent States, famous international researchcenters and companies with experience in various technologies of reclaiming of contaminatedenvironment objects, connected with the activity of uranium mining and processing enterprises, in thedevelopment of scientific fundamentals and techniques of conservation works, entrails of the earthreclaiming, proving the efficiency of nature protection measures, study as well as prediction ofradiation situation and fulfillment of design documentation.
113

The strategic trends of further development of NMMC uranium production are the following:to provide an ecologically safe situation for all NMMC objects by means of ecologically more "pure"in situ leaching method; to liquidate mining and processing enterprises, which will be less effectivein further operation relative to economic and ecologic conditions; to isolate and bury an accumulatedradioactive waste from the main environmental elements; to reclaim the grounds disturbed by theactivity of uranium enterprises.
To realize these trends, NMMC has been developing and performing step-by-step theprogramme of actions for reclaiming of the environmental objects, which were being subject to theimpact of uranium productions for more than thirty years of their existence.
114

XA9745129URANIUM AND ENVIRONMENT IN KAZAKSTAN
G. FYODOROV, E. BAYADILOV, V. ZHELNOV,M. AKHMETOV, A. ABAKUMOVAtomic Energy Agency of Kazakstan,Almaty, Kazakstan
Abstract
Kazakstan's data on uranium as a state report has been included for the first time in the Red Book. Thereforethe report contains two large themes presented in Suggested Topics for Papers: Country report, based on the 1995NBA/IAEA Red Book Questionnaire and environmental impact regulations. Kazakstan is considered as one of theworld leaders on uranium supply. In Kazakstan there are many well known types of deposits but the main one is thesandstone-rollfront type. That type is represented by the group of deposits of the Syr-Darya uranium ore province.Deposits of that type include the main part of uranium ore of the Republic of Kazakstan and supply almost all of itsuranium mining. At the large three enterprises the uranium is extracted by underground leaching. The mining methodof uranium extraction is stopped. Because of the poor development of nuclear energy, Kazakstan's need for uraniumis not very high. Presence of a large amount of cheap and technological uranium ores allow the Republic to exporturanium. There are plans to increase uranium mining and perhaps to establish new mining facilities including joint-ventures. More than 50 uranium deposits are known in Kazakstan. During prospecting and exploitation of thesedeposits a large amount of rad wastes hi the form of ore dumps and tailings were generated. They have a sensibleinfluence on the environment. Moreover, near the sandstone-rollfront type uranium deposits the large amount ofunderground water has been contaminated by radionuclides. Special investigation of the this phenomenon is necessary.In Kazakstan there are the rad waste disposal conception and contaminated earth recultivation regulations. At present"The Rad Wastes Management Low" is submitted for approval.
1. HISTORY OF URANIUM INDUSTRY IN KazakSTAN
Uranium prospections in Kazakstan were started in 1948 and have been proceeding up to now.The history of prospections and exploration work of uranium carried out can be divided in twostages, combine first with the development of prospection methods and second, with features of thegeological structure of Kazakstan surface, because of the fact that the significant part of Kazakstanterritory is submitted by friable Mesozoic-Cenozoic sediments overlapping Paleozoic complexes ofrocks and performing depression structure (Fig. 1).
During the first stage (1948-1957) prospections were conducted basically with application ofair- and pedestrian gamma surveys in the areas not closed by friable sediments.
During the second stage the prevailing method has become deep geological mapping withapplication of geophysical methods and drilling works in areas as well opened as basically coveredby young friable sediments
Already during the first stage in 1951, the "Kurday" deposit was discovered for exploitationhi the south of Kazakstan. and two more deposits were discovered soon at the same place. KirgizskyProduction Centre was then established, which at the present time is owned by the Republic ofKyrgyzstan.
The uranium deposits revealed in the south of Kazakstan form the Pribalkhash uraniumprovince, where the general reasonably assured resources exploited amount to 22 000 t.
In 1953, in northern Kazakstan the deposits Kubasasdyrskoe and Balkashinskoe were openedwhich marked the beginning of discovering the Kokshetau uranium province and basis for creationof Tselinny Production Centre founded in 1957. Generally reasonably assured resources of theprovince are about 100 0001 and concentrated basically on large deposits: "Vostok", "Grachovskoe","Kosachinoe", the ores of which are located in Paleozoic and more ancient rocks.
115

0\

1. Borders of Premesozoic (a) and Mesozoic-Cenozoic (b) sediments2. U ore provinces with endogenic deposits in Premesozoic sediments
(I- Kokshetauskaya, II- Pribalkhashskaya)3-5. U ore provinces with exogenic deposits in Mesozoic-Cenozoic
sedimentary formations:3- with soil oxidation of coal beds (III- Iliyskaya)4- with strata! oxidation in penetration sediments (IV- Chu-Sarysuyskaya,
V- Syrdaryinskaya)5- with phosphatic fossi! fish bone detritus (VI- Prikaspiyskaya)
6-10. U deposits:6- endogenic of different ore formations7- infiltrations with strata! oxidation8- infiltration with soil oxidation9- infiltration with stratal-soil oxidation in sediments of paelovalley10- with phosphatic fossil fish bone detritus.
11 Production Centres
Numbers of deposits on scheme:1- Grachyovskoe 17- Chaglinskoe2- Shokhpak3- Zaozyornoe4- Kamyshevoe5- Shatskoe6- Semizbay7- Tastykol8- Akkan-Burluk9- Glubinnoe10- Koksorskoe11- Vostochno-
18- Shatskoe-I19- Kosachinoe20- Vostok21- Zvyozdnoe22- Manybayskoe23- Yuzhno-
Manybayskoe24- Shorly25- Talas26- Granitnoe
Tastykolskoe 27- Ulken-Akzhal12- Victorovskoe 28- Koldjat13- Agashskoe 29- Nizhne-Iliyskayay14- Fevralskoe 30- Suluchokinskoe15- Burlukskoe 31- Djusandalinskoe
33- Kyzyltas34-35-36-37-38-39-
40- Inkay41-42-43-
44- Irkol45-46-47-48-
16- Slavyanskoe 32- Kopalysayskoe 49-
KandjuganUvanasMynkudukSholak-EspeKyzylkolZhaipak
ZarechnoeMoyinkumSeverny Karamurun
Yuzhny KaramurunMelovoeTomakTaybogarTasmurun
FIG. 1. Uranium gradation metallogenic scheme of Kazakhstan.

oo SO<L Kaiatau
Syr- Darya depression
•780
-500
•MO
Cliu-Sarysu-depressioii
via « ivs iss m
1-5 penetrated mesozoic-cenozoic sediments; 6-10 impenetrated premesozoicsediments; 11-fractures; 12-borders of stratiun oxidation and concerning uranium ore
FIG. 2. Geological section of Mesozoic-Cenozoic sediments of Syr-Darya and Chu-Sarysu depressions.

In 1954, the large "Melovoe" deposit was discovered in west Kazakstan, on the Magyshlakpeninsula. Its uranium mineralization is concentrated in phosphatic fossil fish bone detritus. Thisunique type ore (so-called organogeneous phosphatic) is industrial despite low contents of uraniumin ore since uranium containing bones can be easily enriched during the washing process. In 1959,the Pricaspian Production Centre was created on the basis of the "Melovoe" deposit, which togetherwith three more deposits forms the Pricaspian uranium province. The general reasonably assuredresources of the Pricaspian province amount to about 65 000 t.
Prospection works of the second stage, concentrated basically on the study of depressedstructures, resulted in the discovery of a series of large and unique deposits in young friable sedimentsand in the radical reorganization of the structure of resources for the uranium industry of Kazakstan.These works in the south of Kazakstan revealed three uranium provinces, of which two: Chu-Sarysuand Syr-Darya, are the largest in the world for creation of uranium extraction enterprises by methodsof underground leaching. A third province — Hi is characterized by ore of soil oxidation (so-calleduranium-coal). However, in spite of high enough contents (up to tenths of percent) and significantreasonably assured resources (about 93 000 t), the industry has not been developed yet due toeconomic reasons.
In 1970-1971, extraction was successfully carried out, using underground leaching method,in the "Uvanas" deposits, Chu-Sarysu province. This marked the beginning of priority developmentof the deposits in the Chu-Sarysu and Syr-Darya provinces. At present, within the limits of theseprovinces, more than 10 large and unique deposits are discovered, the ore of which is connected withregional zones stratum oxidation, developing in north-western direction" from Tyan-Shan deep into theartesian basins of Syr-Darya and Chu-Sarysu depressions. The zones of stratum oxidation aredeveloped in several good penetrated sand water-bearing horizons, forming system penetration deepinto artesian basins of oxygen water tongues (Fig. 2). Front ending of stratum oxidation zones ofthese tongues forms a regional geochemical barrier on which uranium ore of sand type of rollfrontis formed. In this province there are 6-9 productive horizons located which contain ores with uniquetechnological terms that allow to extract uranium very profitably by method of in situ leaching. Thegeneral reasonably assured resources of both provinces amount to 320 000 t which has allowed tocreate on their bases the uranium extraction enterprises by in situ leaching method.
2. THE CURRENT SITUATION
The discovery of highly profitable and technological deposits in the provinces of Chu-Sarysuand Syr-Darya has resulted in decreasing of mining uranium extraction in Kazakstan and increase (to80%) extraction share by method of in situ leaching.
At present, in addition to three operating in situ leach enterprises, two more are created, andthe creation of 2-3 enterprises are planned, so that in the near future all uranium will be extractedin Kazakstan by in situ leaching method. At all inconsistent evaluations of influence of the in situleaching method on the environment doubtless one, that this method is the most economic andtechnological one and produces the least amount of radioactive wastes. The problem of restorationof water horizons after in situ leaching quite soluble, including with help of oxygen method ofoxidation of working solutions without application of sulfuric acid.
Thus, at present Kazakstan has a well prepared basis for development of uranium extractionby in situ leaching method, which amounts to 320 000 t at total sum of prepared sticks 600 000 t.
It is not planned to carry out further prospection work for discovering new deposits orprovinces. The current work is directed to revealing the stocks within the limits of known ore fieldsand to transfer additional and estimated stocks in the category of reasonably assured resources.
119

Revealed and prepared stocks suitable for extraction by in situ leaching method createfavourable conditions for uranium extraction carried out by in situ leaching method. In this connectionthere is the task of conversion of two existing production centres.
3. THE SUPPLY AND DEMAND
At the present low level of development of atomic engineering in Kazakstan (presented by onpower generating installation BN-350 on the Mangyshlak peninsula), there is practically no uraniumdemand in the Republic. All uranium concentrate goes to the world market. Unfortunately, theconditions of expert are at present adverse. Upon improvement of these conditions, Kazkahstajtl canincrease, in short time, uranium extraction up to 5-7 thousand tonnes per year.
4. IMPACT OF THE URANIUM INDUSTRY ON THE ENVIRONMENT
With respect to the problem of the impact of the uranium industry on the environment inKazakstan there are 3 aspects to take into account:
availability of deposits of uranium ore,
long functioning of uranium mines and processing operations,
cessation of works of extraction and processing enterprises of uranium ore.
The impact of deposits of uranium ores on the environment is bets displayed at formation ofore on ending of stratum oxidation zones (sandstone rollfront type) where practically on all frontendings on the band of width of 10-15 km marks natural pollution of water horizons by radionuclides.The extent of the front reaches 100-150 km and the polluted area of water horizons is2000-5000 km2. The water from such areas cannot be used. On the other hand availability of sanddeposits permits to refuse mining of uranium extraction which forms huge quantities of radioactivewastes.
The production of uranium by mining method in Kazakstan carried out for over 40 years hasresulted in an accumulation on the surface of more than 200 Mln.t of radioactive processing wasteswhich represent low radioactive wastes containing alpha beaming nuclides. These wastes are a threatto the environment in the form of soil and water horizon contaminations by radionuclides as well asin the air in connection with dusting of dry beach of tails of processing.
The specific care for Kazkahstan is presented radioactive wastes formed by enterprises whichceased their operation because these wastes have lost the "owner" and their disposal requires largebudgetary appropriations.
5. FURTHER RESEARCH
As mentioned already, the discovery of new uranium deposits and provinces is not plannedas the Republic has a large reserve of revealed stocks and stocks which can be revealed within thelimits of known ore fields. Thus a large part of resources related to the category of highly profitableand technological ores suitable for extraction by in situ leaching method.
It is necessary to note that this way the sulfuric acid process odes not produce much RadWaste(as with the mining method) proceeds the pollution by radionuclides of water horizon from whichuranium is extracted, that requires the special costs of restoration of the horizon. Probably the
120

decrease of the cost is served application of regime of oxygen oxidation without application of sulfuricacid.
The other important direction of research is the reduction of the impact of mining andprocessing production wastes on the environment.
NEXT PAGS(S)!©ft BLANK
121

XA9745130URANIUM MINING AND REHABILITATION: INTERNATIONALASPECTS AND EXAMPLES FROM GERMANY
F.H. BARTHELBundesanstalt fur Geowissenschaften und Rohstoffe,HannoverD. MAGERFederal Ministry of Economics,BonnGermany
Abstract
In the period from 1945 to 1994 about 1.87 million t U have been produced worldwide. The maximumof production reached about 70 000 t U in 1981, now the production has fallen to about 32 000 t U. Due to thedecrease of the annual output, employment in uranium production has decreased, however the productivity hasbeen increased in most countries. As any mining, uranium mining has an impact on the environment. Especiallythe radioactivity of the ores and waste material may create radiological hazards to the population when protectionmeasures are not observed carefully. The impact of uranium production to the environmental is illustrated byvarious examples. The costs which are necessary to decommission and rehabilitate uranium production facilitiescan reach high levels depending on the specifics of the recultivation activities. International examples are given.The production of uranium in Eastern Germany is described briefly, and the reclamation activities of the formerWismut mining and milling facilities is illustrated by selected examples.
1. INTRODUCTION
Uranium has been produced during the past 50 years for both military and civil uses. Partof this production, which was higher than the demand, was stockpiled for strategic reasons. Afterthe fall of the iron curtain, most of the stockpile has been made available for commercial use.Thus, less uranium is now required from production and producers are being forced to reducetheir output or close their mines. Production has fallen below demand since the mid-1980s.
The closure of uranium mines and mills requires proper decommissioning andrehabilitation according to international radiation protection guidelines and standards and tonational regulations.
Aspects of past and present uranium production are described in this paper, followed byexamples of decommissioning and rehabilitation projects. It is not intended to deal with specificmethods or regulations in individual countries; however, the example from Germany mayillustrate the extent of decommissioning and rehabilitation work necessary in densely populatedareas of Central Europe.
2. PAST AND PRESENT URANIUM PRODUCTION
World uranium production during the period from 1945 to 1994 is estimated to have beenabout 1 868 200 t U or about 4.7 billion pounds U3O8. At an arbitrarily chosen sales value ofUS$20/lb U3O8 this would amount to approximately $100 billion. It should be kept hi mindhowever, that the uranium price in WOCA (World Outside Centrally Planned Economy Areas)countries was higher over extensive periods, meaning this value may represent the lower limit.
A breakdown of the estimated production of the different producer countries from 1945 to1994 is given in Table I. Production figures for WOCA countries (total 1 083 000 t U) are fairlywell known through the regular questionnaires on uranium resources and production (Red Book).
123

TABLE I. RANKING OF URANIUM PRODUCING COUNTRIES (OVER 10 000 t U CUMULATIVE PRODUCTION 1945-1994)(Figures rounded to the nearest 100 t U)
WorldCountry t(j % (hare
1
2
3
4
5
6
7
a
a
10
1 1
12
13
14
15
te
17
18
19
20
21
USA 342,200 18.3
Canada 274,300 14.7
GDR** 216,300 11.6Rep. S.Africa 148,600 8.0Czech Rep. 104,100 5.6Russ.Fed. 103,000* 5.5*
Kazakhstan 86,000* 4.6*PR China 79,000* 4.2*
France 71,300 3.8Uzbekistan 70,500* 3.8*Niger 62,600 3.4
Australia 57,900 3.1Namibia 56,700 3.0Ukraine 46,800* 2.5*Gabon 24,400 1.3
Zaire 23,300 1.3Bulgaria 23,100* 1.2*
Tajikistan 20,000* 1.1*Hungary 17,500 1.0Romania 17,100 1.0
others 23,500 1.3(16 countries)
total 1,868,200
WOCACountry (U * jtl«'e
1
2
3
4
5
6
7
8
0
10
USA 342,200 31.6Canada 274,300 25.5
Rep. S.Africa 148,600 13.7France 71,300 6.6Niger 62,600 5.6
Australia 57,900 5.4Namibia 56,700 5.2Gabon 24,400 2.3
Zaire 23,300 2.2others 21,700 2.0(14 countries)
58% of world total
total 1,083,000
Non-WOCACountry tu % ehnre
1
2
3
4
5
6
7
8
9
10
11
12
GDR** 216,300 27.5Czech Rep. 104,100 13.3Russ.Fed. 103,000* 13.1*Kazakhstan 86,000* 11.0*PR China 79,000* 10.1*
Uzbekistan 70,500* 9.0*Ukraine 46,800* 6.0*Bulgaria 23,100* 2.9*Tajikistan 20,000* 2.6*Hungary 17,500 2.2Romania 17,100 2.2
others 1,800* 0,2*(2 countries)
42% of world total
total 785,200*
* estimated production; ** production 1945 - 19901994 production is estimatedBGR,March 1995

TABLE II. RANKING OF URANIUM PRODUCING COUNTRIES IN 1993
12345678g
1011121314151617181920212223242526
Country
CanadaNigerRuss.Fed.UzbekistanAustraliaKazakhstanFranceRep.S.AfricaNamibiaUSAPR ChinaCzech Rep.GabonUkraineHungarySpainIndiaArgentinaRomaniaGermanyMongoliaBulgariaBelgiumPortugalBrazilPakistantotal
tu9,1782,9142,600*2,600*2,2562,1101,7341,7031,6681,1781,000*
950556500*380183180*121120*116100*60*343230*30*
32,333
% share
28.49.08.0*8.0*7.06.55.45.35.23.63.1*2.91.71.6*2.2
<1.0<1.0*<1.0<1.0*<1.0<1.0*<1.0*<1.0<1.0<1.0*<1.0*
cumulative
28.437.445.453.460.466.972.377.682.886.489.592.494.195.796.9
estimated
BGR.March 1995
TABLE III. MAJOR URANIUM PRODUCING COMPANIES 1993
12
3
4
5
6
7
8
9
10
Company
CAMECO.Canada
COGEMA. France
(production in France,
Canada. USA Niger.Gabon)
Uranerz. Germany
(production m Canada, USA)
Priargunsky (Russ.Fed.)
Navoi, Uzbekistan
KATE P. Kazakhstan
Rossing, Namibia
NUFCOR, Rep. S. -Africa
ERA, Australia
WMC.Australia
World total
Production 1993tu
5100
4200
2670
2600*
2600*
2110
1670
1660
1130
1120
24860
32330
% - shareof production
15.8
13.0
8.3
8.0
8.0
6.5
5.2
5.1
3.5
3.5
76.9
100.0
* estimated
BGR.March 1995
125

Official production data for the non-WOCA area have been provided by only four countries.Production could only be estimated for the remaining 13 countries, mainly CIS and PR China asmajor producers. Total non-WOCA production was estimated to be about 785 200 t U.
Production for 1993 of about 32,300 t U (see Table H) was less than half of the estimatedpeak production in 1981. At an average price of $20/lb U3O8 the 1993 production represents asales value of approximately $1.7 billion.
As shown in Table II, ten major producing countries account for nearly 90% of theproduction. The leading producer country is Canada, with a share of 28%. The four producers ofthe CIS have a share of 25 %.
For some countries, e.g. Niger, sales revenue from exported uranium is a major source ofincome. In 1989 the value of exported uranium from African countries, excluding the Republic ofSouth Africa, amounted to $530 million or about 7% of the value of all exported minerals.
Most producing countries are major uranium consumers. Other main producers, e.g.Australia, Kazakhstan, Namibia, Niger and Uzbekistan, have no domestic demand, and theirentire production is exported.
The share of uranium production by company is shown in Table III. Ten companiesaccounted for more than three fourths of the 1993 production. The share of the top four producerswas almost 50%. Estimated production from companies of the CIS amounted to 23%.
3. EMPLOYMENT IN THE URANIUM PRODUCTION INDUSTRY
The number of persons employed varies from country to country, depending on thenumber and size of the individual uranium operations. A world-wide survey of employment inuranium mines and processing plants for the past is not yet available. In some countries, however,it was very high. Figures from 15 selected countries show that employment decreasedcontinuously over the past 15 years. In 1985, for example, about 85 000 persons were employedin these countries, in 1990 only 55 000 and in 1993 about 20 000 persons.
The downward trend can best be illustrated by comparing employment and production intwo of the major producing countries, USA and Canada, as shown in the following compilation.
1980 1985 1990 1993
USA
Production (t U) 16800 4300 3420 1180
Employment 20 000 2 450 1 350 700
t U per man-year 0.84 1.76 2.53 1.69
CANADA
Production (t U) 7 150 10 880 8 730 9 180
Employment 6 100 5 300 2 500 1 300
t U per man-year 1.17 2.05 3.49 7.06
For comparison, employment by the Wismut company amounted to about 40 000 personsduring the 1980s, now (1994), 4 600 persons are employed in the decommissioning activities.
126

Efficiency in uranium production in the USA and in Canada has increased remarkably,from around 1 t U per man-year in 1980 to 1.7 and 7 t U per man-year, respectively, in 1993.For other countries the trend to higher efficiency can be observed too, but not to the same degree.
4. THE IMPACT OF URANIUM MINING ON THE ENVIRONMENT
Like mining and processing of other minerals, uranium mining has an impact on theenvironment.
Mining requires land areas of various sizes (e.g. for open pits), which are then no longeravailable for agriculture or housing. The barren waste rocks and tailings have to be stored in thevicinity of the production centres, requiring additional ground. Dams have to be built to retaintailings; measures must be taken to ensure stability and impermeability.
The radioactivity of uranium means that special safety measures must be taken duringmining and processing to prevent radiological hazards to the population and environment.
These measures have not been observed carefully in mining projects immediately afterWorld War II. In the 1950s and 1960s, uranium production served mainly military purposes. Thisresulted in a growing state-supported uranium mining industry in the West and East. Majorproducers during that time were the USA, Canada, USSR, GDR, the Czech Republic, and theRepublic of South Africa.
After termination of mining due to exhaustion or termination of government salescontracts, mine sites and production centres were closed. In most cases, legal provisions forproper decommissioning and rehabilitation were lacking, and the sites were abandoned withoutany safety or recultivation measures being taken.
The growing environmental awareness during the 1970s resulted in governmentalregulations being issued for new projects and for recultivation of abandoned sites. One of themajor objectives of the regulations for new mines is to ensure proper consideration of the impacton the population and overall environment in view of the economic and socio-economic interests.The potential release of radioactive and chemically toxic substances during production is avoidedby requiring special operating conditions. Today, mining companies in many countries are legallyrequired to include the cost of decommissioning and rehabilitation in their cost calculations. Theoperator has to demonstrate that sufficient funds for later decommissioning and rehabilitation areavailable. New mines receive permission only when an environmental impact study (EIS) has beencarried out.
For abandoned mines the situation is different. Very often the previous owner is no longeravailable. To protect the population and the environment in those cases, many countries are nowundertaking cleanup projects financed by the government.
Examples of this are the Uranium Mill Tailings Remedial Action (UMTRA) of the USAor the ongoing program for German uranium mines and mills decommissioning. The examplesshown in Table 4 illustrate the burden on the taxpayer when rehabilitation has to be carried outlong after mining was terminated.
The different types of rehabilitation projects, according to a proposal by URANERZ(1994), may be classified as follows:
1) Abandoned production sites:
no rehabilitation by the owner,
127

TABLE IV. COST OF DECOMMISSIONING AND REHABILITATION.FOUR EXAMPLES OF COMPLETED AND ONGOING PROJECTS
1) UMTRATitlelThis project encompasses 24 facilities which were in production in the 1960s and 1970s.Uranium production: ca. 56,000 1 UArea involved: 1450 haRehabilitation period: 1979 - 1998, by US governmentExpenditures today: $1 .3 billion,
estimated total: $2.1 billionSpecific costs: $9.3/lb \J^OQ today, estimated total $14.7/lb
2) Beaverlodge, CanadaProduction period: 1950 - 1982Uranium production: 17,500 1 U (underground mine)Rehabilitation period: 1983 - 1995, by the mining companyExpenditures: C$ 16 millionSpecific costs: C$ 0.36/lb Us08 or US$ 0.3/lb
3) Quirke mine, Elliot Lake, CanadaProduction period: 1 956 - 1 961 , 1 968 - 1 990Uranium production: 44,000 1 U (underground mine)Rehabilitation period: 1991 - 1994, by the mining companyExpenditures: C$ 46 millionSpecific costs: C$ 0.4/lb UsOg or US$ 0.33/lb
4) UMTRA Title IISubject of this program is sites that are being decommissioned and rehabilitated by privatecompanies through financial reserves set aside during the production period (surety bonds).Production period since before 1980Uranium production 250,000 t URehabilitation period since 1980Expenditures: 5290 million so far, will become higher!Specific costs: SO 44/lb
5) Average from 120 mining and 80 milling operations and 12 ISL projects in 14countries (not including Germany)Accumulated production: 1.1 million tUExpenditures: $3.7 billionSpecific costs: $1.25/lbU3Os
128

rehabilitation at the expense of the government.Examples: Port Radium, Canada;
several mines in western USA (UMTRA Title I);several mines in the CIS.
2) Rehabilitation at government expense immediately after closure.Examples: Wismut, Germany;
several mines in the Czech Republic.
3) Rehabilitation by the owner after closure,financed by the owner through earnings (regular case).Examples: Elliot Lake, Canada;
mines in France;recently closed mines in the USA (UMTRA Title II)
4) Rehabilitation by the owner during the production period,financed through earnings.Examples: In situ leaching, e.g. in the USA
Which decommissioning and rehabilitation methods are used depends largely on the typeof the deposit and the mining and processing methods.
The following parameters are associated with the specifics of the deposits:
morphology of the orebodydepth of miningrock stabilityhydrogeological conditionsore grademineralogy and chemistry of the ore.
Additionally, the following mining and milling techniques have to be taken intoconsideration:
open pit mining,underground mining,conventional extraction (acid or alkaline leaching),heap leaching,in situ leaching from the surface by injection of acidic or alkaline chemicals,leaching underground.
These aspects are only some of the general features to be taken into account. For newmines, which require licensing, consideration of the above parameters and mining and millingmethods is part of the planning of costs during the feasibility study.
For example, open pit mining is considered as cost-advantageous due to the use of large-capacity equipment. On the other hand, large-scale operations generally produce huge amounts ofbarren waste rock and large amounts of low-grade ore. Safe storage of over-burden and wasterock requires solid ground and well-engineered dumps. The mineralogy of the waste rock has tobe analysed to determine its potential for generating acids, which would pollute the surface andground water. The stability of the open pit walls has to be investigated and carefully monitored.The hydrogeology of the mine area is also a factor to be assessed and monitored.
Safety measures for underground mines include monitoring of wall-rock stability,determination of the lithology and chemical composition of the wall rock and the hydrogeology.
129

The potential for the generation of acidic mine water is an important concern which has to beinvestigated prior to decommissioning.
Suitable ground conditions are required for the deposition of tailings containingradioelements and in many cases chemically toxic substances (e.g. heavy metals, As). Variousoptions for the safe disposal of tailings are available:
1) In the past, an earth-dam across a morphological depression (e.g. a valley) was consideredto be sufficient. However, leakage of water is a current problem which requires carefulmonitoring. Dam stability has to be assured, so that breaks or severe leakage of materialis prevented.
2) Another option is the construction of a lined and covered pond. This requires carefulmonitoring.
3) When available, open pits may be used as disposal sites for tailings. This option was takenup again recently in Canada and in France. The open pit remaining from the mined outRabbit Lake deposit e.g. is used for disposal of the tailings from the currently operatingCollins Bay and Eagle Point deposits. The mined out Deilmann orebody will be used fordisposal of waste from mines that will soon become operational.
Subaerial disposal of tailings has proved to be advantageous in terms of cost, since itsimultaneously provides backfill for the open pit. Later covering and recultivation is regarded aslow cost.
5. COST OF DECOMMISSIONING AND REHABILITATION
The cost of decommissioning and rehabilitation depends to a large extent on the type ofproject. Four examples of completed and ongoing projects are given in Table IV.
6. URANIUM MINING IN EASTERN GERMANY
Uranium mining started in 1946 in the Erzgebirge Mountains, Saxony. These depositshave been mined since the 12th Century, first for silver, and later for cobalt, nickel and otherbase metals. The uranium mining district is in late Paleozoic (Hercynian) rocks north of theBohemian Massif. Uranium was mined from well-known mines of Schlema-Aue,Johanngeorgenstadt in Germany and Jachymov in the Czech Republic.
The deposits are of the vein-type. They occur mainly at the exocontacts of 300 to 330My/old granites and are hosted by metamorphosed rocks (schists, amphibolites, metadiabase) ofOrdovician to Devonian age.
The mineralization belongs to the classical five element association (Bi-Co-Ni-Ag-U) andwas formed in two periods at around 275 My and 155 My. The uranium content of the mineddeposits varied considerably; the average grade was 0.4% U. The mines extended to a maximumdepth of 1750 m.
Mining in the German part of the Erzgebirge yielded about 88 000 t U from more than 12mining sites. Mining was terminated at the end of 1990 due to economic considerations anddepletion of the deposits.
Production in the second mining district began in Thuringia in 1950. At the beginning,uranium was mined in open pits from deposits hosted in Upper Permian sandstone and in black
130

shales of Ordovician and Silurian age. The Lichtenberg mine, the largest open pit mine, wasworked from 1957 to 1978. At the same time, deposits were mined underground to a depth of1100m. The host rocks of the uranium mineralization are Ordovician shale (Lederschiefer),Silurian graptolitic shale and Devonian diabase.
The mineralization occurs in lenses and stockworks and is fissure controlled. The ore-forming process was complex, starting with an initial enrichment of uranium in the black shale(protore). When the black shale was exposed at the surface during the Permian, uranium wasleached by weathering and redeposited on geochemical barriers in the non-weathered parts of thehost rock. This process was controlled by the fracture system. The ages of the major oreformations are 240 Ma and 90 Ma. The average content was 0.08 to 0.09% U. The Ronneburgdistrict in Thuringia yielded about 97 000 t U from more than 6 areas. Mining was terminated in1990 for economic reasons.
The third and smallest mining district is located near Dresden, Saxony. Uranium hosted incoal of Permian age in the Freital area was mined from 1947 to 1955 and 1968 to 1989. About3 000 t U were produced.
Uranium mineralization in the Konigstein area is hosted in Cretaceous sandstone(Cenomanian), similar to the Straz-Hamr deposits in the Czech Republic. Initially, the deposit wasmined by conventional underground methods (1967 to 1983). Block leaching of low-grade,underground parts of the deposit using sulfuric acid was begun in 1971, continuing until 1990.About 15 000 t U were produced conventionally and 3500 t U by leaching.
A total of 216 352 t U was produced in the former GDR from 1946 to 1990: 87% byunderground mines, 9% by open pit mining and 2% by leaching methods.
Two major processing operations utilized acid and alkaline extraction methods. TheCrossen mill had an annual capacity of 2.5 million t of ore and the capacity of the Seelingstadtmill was 4.6 million t.
The uranium mining districts of Saxony and Thuringia are among the most productivedistricts in the world. Their output may be compared to that of the Elliot Lake mines in Canada(140 000 t U) or of the Grants District, USA (125 000 t U).
7. RECLAMATION ACTIVITIES OF FORMER WISMUT MINING AND MILLINGFACILITIES
A vast amount of land and facilities was contaminated by Wismut uranium productionactivities from 1946 to 1990. The environments of the mining areas have been adversely affected.Only minor rehabilitation was carried out during the mining period by the former joint Soviet-German company Wismut.
With the German unification the Federal Government of Germany took over responsibilityfor Wismut in 1990 and was faced with various problems. The first decision was to terminate allcommercial mining activities for economic reasons. Second, a program was initiated to evaluatethe extent to which cleanup activities will be necessary. On behalf of the Federal Ministry forEnvironment, Nature Conservation and Nuclear Safety, the Federal Office for RadiationProtection (BfS) was commissioned to conduct a radiological evaluation of abandoned uraniummining and milling facilities. On the basis of recommendations by the German Commission onRadiological Protection, the evaluation was conducted with special emphasis to 1 mSv/year doserate as the threshold value for individual exposition of the population, additional to the pre-miningexposition. The study areas were defined and field inspections with measurements of radioactivitywere carried out. About 5000 abandoned mining related sites originating from medieval silver
131

TABLE V. WISMUT SITES AT THE BEGINNING OF RECLAMATION ACTIVITIES
Aue Kbnigstein Ronneburg Seelingstadt
Surface (ha)
Shafts
Waste piles- number- footing (ha)- volume Mm'
Tailings ponds- number- surface (ha)
- volume Mm3
Mine workings
- surface km2
- ace. length km
Open pits- number- surface (ha)
- volume Mm3
569.4
8
20342.3
47.2
13.5
0.3
30.7
240
00
0
143.4
10
3
37.94.5
34.60.2
7.1
112
00
0
1 670.3
38
16
552.0178.8
39.0
0.25
73.4
1043
1160
84 (open)
1 314.8
0
9
533.172.0
7
706.7
159.7
0
0
00
0
Total
3 698.3
56
481 517.7
311.5
14723.8
160.45
111.2
1395
1
160
84
Source: Wismut 1994
132

mining and later base metal and uranium mining were identified in an area of 1500 km2. Theevaluation reduced this area to about 250 km2, which will require further investigation andcleanup measures. The comprehensive evaluation will be finished in 1996/1997.
Other than the orphan mining sites all mining and milling facilities being active until 1990were transferred to the new Wismut rehabilitation company. Administered and financed by theFederal Ministry of Economics (BMWi) this government-owned but privately organized andprivately managed company is responsible for the decommissioning and remediation of itsfacilities and sites.
An overview of the mining and milling sites is given in Table V.
After evaluating the complexity and magnitude of the necessary restoration measures, itwas decided to take a site-specific, risk-based approach. Because this agricultural and industrialarea is densely populated, all remediation activities had to be carefully planned. The ongoingrestoration activities are illustrated by the following examples:
Open pit mining has produced about 600 million m3 of ore and waste rock, of which about160 million m3 was taken from a single open pit (Lichtenberg) nearly 200 m deep with anarea of about 1.6 km2. After mining activities ceased the open pit was used for disposal ofwaste rock from the Ronneburg mines. About 80 million m3 have been backfilled before1990. About 100 million m3 of waste material remains piled around Ronneburg. Most ofthis material will be backfilled in the open pit.
Underground mining has yielded about 300 million m3 of material, half of which was ore.In the Aue district of the Erzgebirge, there are about 40 piles with a total volume of over45 million m3 covering an area of about 3 km2. A major program of stabilization,reshaping, covering and revegetation of these piles is being carried out.
In addition to numerous shafts, drifts totalling about 1400 km have been driven.
Mill tailings: Two major conventional mills have been operated (Crossen and Seelingstadt)besides a number of smaller ones, being active at the mining sites for a short period oftime.
At the Crossen mill, alkaline leaching methods were used for ore from the Erzgebirge.The tailings were disposed of in a nearby pond, about 2 km2 in size, which now containsabout 45 million m3 of tailings and 6 million m3 of water.
The Seelingstadt mill used both alkaline and acid leaching methods and processed mainlyores from the Ronneburg district in Thuringia. The tailings were disposed of in twonearby ponds with a total volume of 107 million m3, covering an area of 3,4 km2.
8. STATUS OF WORK
Detailed engineering studies in 1990 and 1992 yielded conceptual models for remediationmeasures. The most important measures may be classified as follows (only a selection):
Underground remediation:• cleaning and flooding of the mines,• backfilling of mine workings,• hydrological control,• groundwater protection and monitoring.
133

Surface restoration:• demolition of buildings,• site rehabilitation for other uses,• repair of surface damage caused by mine subsidence,• cleaning of contaminated soil,• groundwater protection and monitoring.
Mill tailings remediation:• in situ stabilization and covering of tailings,• cover design,• improvement of dam stability,• groundwater protection and monitoring.
At present, many of these activities are ongoing, e.g.:
Underground mine remediation is far advanced. More than 5 000 underground barriershave been constructed to prevent exchange of groundwater with water in the floodedmines. Mine workings have been partly refilled or stabilized to protect the surface frommine subsidence, to minimize radon exhalation and infiltration of groundwater.
Surface remediation includes backfilling of the Lichtenberg open pit from adjacent wasterock piles, reshaping of the remaining piles, and revegetation. Some buildings have beendemolished, contaminated soil has been removed and the ground prepared for reuse.
Covering of mill tailings after dewatering is one of the most challenging problems. Withcontinuing dewatering, the ponds will be gradually covered using geotextiles and soil. Thefinal cover will be designed to prevent radon emanation and water infiltration.
Numerous boreholes and wells for the observation of groundwater control were drilledaround the tailing ponds and are continuously monitored.
DM 700 to 800 million are spent annually for these activities. It is estimated that aboutDM 13 billion will be required over a period of 10 to 15 years.
BIBLIOGRAPHY
BARTHEL, F.H., Uranium Production in the Former German Democratic Republic from 1945 to1990, Geol. Jb, A 142, Hannover (1993) 335-346 (in German).
FEDERAL MINISTRY OF ECONOMICS, Wismut — State of Decommissioning andRemediation, BMWi-Documentation No. 335, (1993) 34 pp.
FEDERAL MINISTRY OF ECONOMICS, Progress of Decommissioning and Remediation.BMWi-Documentation No. 370 (1995) 35 pp.
GATZWEDLER, R., MAGER, D., Remnants of Uranium Mining. Rehabilitation of Wismut, inGerman. Geowissenschaften 11, No. 5-6, (1993) 164-172.
LANGE, G., "Technical Rehabilitation Options for Former Mining and Milling Facilities ofWismut GmbH", Planning and Management of Uranium Mine and Mill Closures, IAEA-TECDOC-824, IAEA, Vienna (1995) 51.
NELSON, CHERNOFF, A.R., MAGER, D. GOLDAMMER, W., Contrasts between theEnvironmental Restoration Challenges posed by Uranium Mining and Milling in the United States
134
and the Former German Democratic Republic, in: POST, R.G. (ed.): Technology and Programsfor Radioactive Waste Management and Environmental Restoration. Proc. Symp. WasteManagem. Tucson, Arizona, 1993. Vol. 1, Washington DC (1993) 269-276.
ROTHEMEYER, H., BRENNECKE, P., KRAUS, W., MAGER, D., An Overview of the WasteDisposal Situation in Europe and of Uranium Mine and Mill Remediation Activities in Germany.Meeting of the National Academy of Sciences/National Research Council's Committee onEnvironmental Management Technologies 6 Dec. 1994, Washington DC (1994).
RUNGE, W. BOTTCHER, J., Closure and Rehabilitation of the East-German Uranium Mining.In German. Atomwirtschaft, (1994) 194-199.
URANERZ, Comparison of Remediation Costs (1994) (in German), unpublished, BMWi ResearchProject 37/93 [Summary published in: BMWi-Srudienreihe, Nr. 90 (1995) (in English, French,Spanish and Russian)].
NEXT PAGE{S)left BLANK
~~" 135

XA9745131THE IMPACT OF CANADA'S ENVIRONMENTAL REVIEWPROCESS ON NEW URANIUM MINE DEVELOPMENTS
R.T. WHILLANSUranium and Nuclear Energy Branch,Energy Sector, Natural Resources Canada,Ottawa, Ontario, Canada
Abstract
Canada introduced an environmental assessment process in the mid 1970s. It was designed to ensure thatthe environmental consequences of all project proposals with federal government involvement were assessed forpotential adverse effects early in the planning stage. In 1984, a Guidelines Order was approved to clarify the rules,responsibilities and procedures of the Environmental Assessment and Review Process (EARP) that had evolvedinformally under earlier Cabinet directives. The EARP process remained largely uncontested until 1989/90, when twodecisions by the Federal Court of Appeal effectively converted the Guidelines Order into a legal requirement forrigorous application. The Supreme Court of Canada upheld the constitutionality of the EARP Guidelines Order in1992, rendering compliance with the Order by all federal government decision-makers a mandatory requirement.Canada became the world's leading producer and exporter of uranium during the late 1980s. Since then, the Canadianpublic has become sensitized to numerous issues concerning environmental degradation, from the Chernobyl accidentto ozone depletion. In 1991, during this period of increasing awareness, the Atomic Energy Control Board, the federalnuclear regulator, referred six new Saskatchewan uranium mining projects for environmental review, pursuant to theEARP Guidelines Order. Both federal and provincial governments and the uranium industry expressed concern aboutthe potential impacts of an apparently burdensome public environmental review process on the development of newuranium mining projects. However, the successful advancement of three such proposals through the process hasallayed much of the uncertainty and has confirmed that Canada's uranium-producing operations can meet highenvironmental, health, and safety standards. The public review process provided an extremely valuable focus onaspects of these developments that needed to be addressed by proponents and regulators. It has helped to demonstratethat new uranium mining projects are being developed in a responsible manner, after full consideration has been givento the potential impacts and public concerns associated with these facilities. The lessons learned in Canada could wellprove to be useful in other jurisdictions where considerations are being given to the development of new uraniumproduction projects.
1. INTRODUCTION
The establishment of the Canadian government's process for assessing the environmentalimpact of major new projects was precipitated in part by a growing appreciation among Canadiansthat a balance must be achieved between the activities that promote economic growth and thepreservation of the natural environment. Governments have become increasingly aware that economicgrowth must be managed in a manner that is sustainable in the longer term. When public confidencein an environmental assessment (EA) process is achieved, and economic growth is seen to be managedresponsibly, the continuation of development is supportable by everyone. When a viable process isaccepted in one jurisdiction, the approach may quickly become the norm in others.
This paper will provide a brief examination of the evolution of Canada's EA process,focussing primarily on its application to the uranium mining industry. The new environmentalassessment legislation will be compared with the previous federal EA regulations under which all thecurrent uranium mining projects are, or will be, reviewed. The paper will provide some recentexamples of the nature and scope of the reviews undertaken related to uranium mining projects, andof their outcomes. A brief analysis of this recent experience, together with some observations abouthow the effectiveness of the process might be improved, may be useful for those considering adoptingthe Canadian model as part of the approval process in the development of their uranium resources.
137

2. PERCEPTIONS AND PUBLIC AWARENESS
Canada has been a major producer of uranium since the inception of the industry in the 1940s.However, Canada's emergence as the world's leading producer and exporter of uranium in the mid1980s coincided with a surge in anti-nuclear activity which sought to block further nuclear powergrowth. The prospect of uranium mining expansions in Saskatchewan, together with a Canadian publicnewly sensitized to environmental matters, afforded anti-nuclear advocates the perfect opportunity todiscredit the uranium mining industry. In parallel, Canadians had become increasingly aware in the1980s of the importance of maintaining a strong economy and a healthy environment. World eventsfocused public concern on the need for policies and practices that promoted sustainable development.
Critics pointed to falling uranium prices, reactor cancellations, and lower uranium demand.The Three Mile Island and Chernobyl accidents together with the uranium mine-water spills inSaskatchewan became "proof that nuclear power and uranium mining were environmentallydangerous. Detractors argued that new uranium production capability was not needed. A public letter-writing campaign was launched to persuade governments to reject new uranium mining proposals onenvironmental grounds. When it became clear that industry intended to proceed with new miningproposals, the anti-uranium lobby called for a review of uranium mining in northern Saskatchewan.When this failed, critics turned to the EA process as a possible means of blocking new developments.They argued that only by imposing a new stringent review process could the environment andCanadians be protected. It was alleged that Canada did not have any critical environmental reviewmechanism in place for uranium exploration and mining activities. Clearly, this is not the case!
3. REGULATORY FRAMEWORK FOR ENVIRONMENTAL REVIEW
3.1. Background
Canada is a federation often provinces. The respective jurisdiction of the federal government and theprovinces is defined in the Canadian Constitution Act, 1987. Under the Constitution, the federalParliament has the power "to make laws for the peace, order and good government of Canada,"except for those areas which fall under exclusive provincial jurisdiction as specified in the Act. Manyof these areas of federal jurisdiction are enumerated in the Act, such as defence, postal services,navigation, shipping, railways, international and interprovincial undertakings, money banking, andcriminal law. Areas of provincial jurisdiction include such matters as natural resources, electricitygeneration, local works and undertakings, hospitals, education, property and civil rights, and thecreation of courts and the administration of justice. There are also areas where the federal Parliamentand provincial legislature share power.
3.2. The Federal Role in the Nuclear Industry
The federal government has overall jurisdiction over Canada's uranium industry by virtue ofthe Atomic Energy Control Act of 1946. All Canadian uranium operations are classified as nuclearfacilities, and are controlled by the federal Atomic Energy Control Board (AECB) under theprovisions of the Act and the regulations derived from it. Although uranium mining activities havealways been subject to the requirements of the Act and its regulations, a strict licensing system hasbeen in place since 1976. The AECB issues licences for the operation of uranium mines only afterensuring that they will not have a significant effect on the health and safety of the mine workers andthe public, and after reviewing measures designed to ensure adequate protection of the environment.
Furthermore, the AECB has always imposed on its uranium mining licensees the responsibilityof reducing a miner's radiation exposure to levels as low as is reasonably achievable. Considerableadvances in radiation protection regarding the risk of cancer have been made since the beginning ofuranium mining in Canada. The AECB also regulates waste management practices to ensure that the
138

radiological impact of Canada's uranium tailings does not pose any undue public health andenvironmental risks.
3.3. Provincial Environmental Protection
In Canada, all levels of government share responsibility for environmental protection. Withthe growing awareness that EA was becoming an essential tool for ensuring effective integrationbetween economic and environmental imperatives, Ontario, already an important uranium producer,became the first province, in 1975, to establish its own Environmental Assessment Act. The followingyear, shortly before the province became Canada's leading uranium producer, the Government ofSaskatchewan established an Environmental Impact Assessment Branch in its Environment Ministry,and in 1977 became involved in scrutinizing and regulating its uranium mining industry in responseto rising public concerns over proposals to develop new uranium mines in the Athabasca Basin. Theprovincial government appointed the Cluff Lake Board of Inquiry in 1977 and the Key Lake Boardof Inquiry in 1979 to examine the Cluff Lake and Key Lake uranium mining projects, respectively,through a public hearing process. At these reviews, the public voiced concerns about environmentalprotection, the health and safety of workers, economic development, and the benefits to localcommunities. Both Boards of Inquiry found that the measures proposed by the uranium industry wereadequate to protect environmental quality, safeguard occupational health and safety, and meet therequirements of Canadian and Saskatchewan law, regulations and policies in a satisfactory manner.
As a result of these and other non-uranium inquiries, the Government of Saskatchewanestablished a new Environmental Assessment Act in 1980, and created special units within itsdepartments of the Environment and Labour to license and inspect uranium mines. Saskatchewan'sEA review and regulatory processes have been structured to accommodate federal/provincial reviewsfor new uranium mining developments, as detailed later in the paper.
3.4. The Federal Environmental Assessment and Review Process
The federal EA process has parallelled the introduction of provincial procedures. Originallyestablished by Cabinet Directive in 1973, and reaffirmed with some improvements in 1977, thefederal Environmental Assessment and Review Process (EARP) was created to ensure that theenvironmental consequences of all project proposals with federal involvement were assessed forpotential adverse effects early in the planning process. Specifically, EARP has been applied as an aidto predict the likely environmental effects of all proposals requiring federal involvement and decision-making. To oversee this process, the Federal Environmental Assessment Review Office (FEARO) wasestablished, and operated within the federal Department of Environment.
In 1984, the Governor in Council approved a Guidelines Order to clarify the rules,responsibilities and procedures of EARP that had evolved informally under the earlier CabinetDirectives. The EARP Guidelines Order (EARPGO) set out a detailed assessment process for allproposals which would "include any initiative, undertaking or activity for which the Government ofCanada has a decision-making responsibility." In this regard, "a decision-making responsibility" wasinterpreted as including proposals undertaken by any federal department, those likely to have anenvironmental effect on an area of federal responsibility, those for which the federal governmentmakes a financial commitment, or those developed on lands or territories, including the offshore,administered by the federal government. While private-sector developments were not covered unlessthe development required federal involvement, for example the issuing of a licence, provincialregulations may apply to all projects within provincial boundaries. As will be discussed below, thecurrent review of six uranium mining projects in Canada falls under the EARP Guidelines Order of1984.
139

The EARPGO was written with a fair degree of flexibility and numerous areas were open tointerpretation. Over tune, it became clear that the EA process needed strengthening, clarification andreform; a revision of the process began in 1987. Nonetheless, the Order remained largely uncontesteduntil 1989/90, when two decisions by the Federal Court of Appeal underscored the need for reform.In response to a challenge by environmentalists that approval of the construction of the Rafferty-Alameda and Oldman River dams in western Canada had been granted without an EA, the court ruledthat what was thought to have been a non-enforceable guideline was, in fact, a legally enforceable lawof general application that imposed additional duties to the existing responsibilities of federal decision-makers. This effectively converted the EARPGO into a legal requirement for rigorous application.Although these court decisions reflected a shift in public values, they also had a more significantimpact in hastening reform. As the Order had not been drafted with strict legal interpretation in mind,the difficulty and uncertainty evident in its administration necessitated revisions in order to render theprocess effective, efficient, fair, timely and open. [See the section on The Canadian EnvironmentalAssessment Act (CEAA) for a complete discussion of the new legislation.]
4. INDEPENDENT PUBLIC ENVIRONMENTAL ASSESSMENT AND REVIEW PANELS
Before addressing the issues surrounding EARP as they relate to uranium mine developments,it should be noted that all new uranium mining projects are automatically referred by the AECB forpublic review, and that the review of a uranium mining proposal requires the formation of an EARPpanel. As will be discussed later, much of the concern expressed by government and industry relatesto the activities of these independent public review panels.
In April 1991, six uranium mining projects were referred by the AECB for public review.A five-member Joint Federal/Provincial Panel on Proposed Uranium Mining Developments inNorthern Saskatchewan was appointed in August 1991 to assess the Cluff Lake Dominique-JanineExtension (DJX), the Midwest Joint Venture (MJV), and the McClean Lake projects. A four-memberfederal Rabbit Lake Uranium Mine Environmental Assessment Panel was appointed in November 1991to conduct public hearings on the Eagle Point/Collins Bay A & D Expansion, also proposed innorthern Saskatchewan. (See Case Histories for specifics on the recommendations of these two panelsand the responses to the recommendations by government.)
It should be noted that of the six uranium mining proposals referred in 1991 for panel reviewpursuant to the EARPGO, only three completed the review process before CEAA was proclaimed inJanuary 1995. However, the remaining three uranium mining projects will be assessed under theEARPGO, since the review panels were appointed prior to CEAA being proclaimed.
5. ISSUES RELATED TO EARP, INCLUDING OVERLAP/DUPLICATION AND SCOPING
As noted above, the Canadian and Saskatchewan governments both developed independentenvironmental assessment and review processes for those projects in which they would be involved.As well, each level of government also assumed specific regulatory responsibilities for various aspectsof the development of uranium mining projects.
In accordance with the federal EARP Guidelines Order, the AECB established an automaticreferral list for proposals such as new uranium mining facilities. The expansion or extension ofexisting facilities also became referable under various sections of the Guidelines Order, following anAECB screening process. When six uranium mining projects were proposed for development inSaskatchewan (see Case Histories below and Table I), each requiring an EA by a public review panelpursuant to EARP, it became clear that the existence of parallel processes at the federal and provinciallevels would create unnecessary duplication.
140

In recognition of the similar legal requirements for a public input process, Saskatchewan andfederal officials cooperated closely in establishing a joint federal/provincial process to review five ofthe six new uranium mining proposals. Saskatchewan agreed to include all but one of the proposalsin a joint review process. As Cameco Corporation's Eagle Point/CoUins Bay project had receivedprovincial approval in 1988, there was agreement that it be excluded from review by the Joint Panel;it was reviewed only by a federal panel. This teamwork proved very beneficial and is highlighted bytwo examples of excellent federal/provincial cooperation.
First, establishing the Joint Panel's Terms of Reference (ToR) was crucial in limiting theoverall scope of the review, so as to exclude issues such as nuclear non-proliferation and othernational or international issues not directly related to the impacts of these uranium projects. Annex 1,the product of considerable inter-governmental negotiation, reproduces the ToR for the Joint Panel.
Second, the finalization of guidelines for preparing Environmental Impact Statements (EISs)for the Cigar Lake and McArthur River projects was a major effort. The Joint Panel held scopingsessions to solicit views and opinions from the public and prepared guidelines with the help of aconsultant. Circulated for comments in draft form in June 1992, these guidelines raised significantconcern at both levels of government and in the uranium industry because they seemed to broadenthe scope of the Joint Panel's review beyond that originally mandated. The guidelines also obligedproponents to submit marketing and operating information that could compromise their commercialpositions, and sought data on social and health matters which were not readily, or in some caseslegally, obtainable by the proponents.
The draft guidelines did not assign specific responsibility for the collection of data among thevarious expert groups, which might later be called upon to provide specialist testimony. They alsosuggested that governments provide guidance and information at the data-gathering stage and thencritique the results presented at public hearings, without realizing that this might place governmentsin conflict of interest. Finally, they included questions about certain regulatory processes that werejudged to be beyond the Panel's ToR. In summary, as drafted, the guidelines sought a great deal ofinformation, significant amounts of which were not readily available and some of which was notdirectly relevant. All of these observations were submitted and the draft EIS guidelines weresubsequently modified by the Panel. Annex 2 reproduces the table of contents of these draft guidelinesas an indicator of their comprehensiveness.
6. GENERAL APPLICATION AND RESPONSIBILITIES UNDER EARP
Before reviewing the progress of the first uranium projects through the panel process, it isuseful to outline the role of the various players involved in an EARP review and how the processproceeds.
6.1. Application of EARP
As defined under EARP, any department, board or agency of the Government of Canada,including the AECB, may be considered an "initiating department," that is, a federal department oragency that has "decision-making authority" for a project. The EARPGO requires all initiatingdepartments to consider the environmental impacts of proposals as early as possible.
Section 12 of the EARPGO obliges initiating departments to assess all projects, includingthose proposals with potentially significant adverse environmental effects. When it is determined thatimpacts may be significant or unknown, proposals are referred to the Minister of the Environmentfor independent panel review. However, Section 13 of the EARPGO states that "Notwithstanding thedetermination concerning a proposal made pursuant to Section 12, if public concern about the
141

proposal is such that a public review is desirable, the initiating department shall refer the proposalto the Minister for review by a Panel."
Upon receipt of a panel report with recommendations, it is the responsibility of the initiatingdepartment to decide, in cooperation with other departments, the extent to which the recommendationsshould become a requirement of the Government of Canada. It is worth stressing thatrecommendations developed by a panel are advisory to government and to the regulatory agencies.
As noted above, the AECB's automatic referral list included new uranium mining facilities.In 1991, the AECB referred the six Saskatchewan uranium mining proposals for independent panelreview, through the then Minister of Energy, Mines and Resources (now Natural Resources).The referral of these proposals to EARP was done as early as possible and was based on theproponents' letters of intent, not on actual licence applications.
6.2. The Role of the Federal Environmental Assessment Review Office (FEARO)
Until the promulgation of CEAA, FEARO was responsible to the Minister of the Environmentfor the administration of the EARPGO, and for advising departments on their EA responsibilities.Once a proposal was referred for public review by an independent panel, it was the responsibility ofFEARO, in consultation with the department or agency making the referral, to draft terms ofreference for approval by the Minister of the Environment, to identify potential panel members, andto ensure procedures were in place to conduct the panel review. When the panel completed its work,FEARO transmitted the panel's report to the Minister of the Environment and the Minister responsiblefor the department or agency that made the referral. In preparing the government response, FEAROtypically took the lead in ensuring that the government respected the integrity of the process by givingthe panel recommendations due consideration.
6.3. The Role of a Public Environmental Assessment Panel
Environmental assessment panels are made up of unbiased individuals who are appointed bythe Minister of the Environment to examine the environmental effects of the proposal and the directlyrelated social impacts of those effects. With the approval of the Minister of the Environment and theMinister responsible for the initiating department, panels may also consider the general socio-economic effects of, and the technology and need for, new proposals. A panel is empowered to issueguidelines to the proponent for the preparation of an EIS, and to conduct public hearings on theproject. It is the responsibility of a panel to prepare a report containing its conclusions andrecommendations for decisions by the appropriate authorities. These recommendations result from aconsideration by the panel of all the information submitted to it, including the public concerns thepanel has heard.
6.4. The Role of Federal Ministers
Generally under the EARPGO, it is the role of the Minister responsible for a department,board or agency to refer to the Minister of the Environment for a public review by an independentpanel any project with potentially significant adverse environmental effects (or projects where publicconcern is such that a public review is desirable). The Minister of the Environment, as Ministerresponsible for FEARO, is then responsible for appointing the panel and issuing the terms ofreference for the review. Responsibility for making the panel report public rests with both theMinister of the Environment and the Minister of the responsible department. The decisions arisingfrom panel reports are to be made by all Ministers with jurisdiction, including the Minister of theEnvironment. In making their decisions, the responsible authorities, including Ministers with
142

jurisdiction, must consider the panel report, but are free to consider other sources of information andto make different value judgements.
Proposals regulated by the AECB are a special case in that many of the recommendations ofpanels fall within its jurisdiction. Although the Minister of Natural Resources has the power to issuespecial directives to the Board, this power is normally reserved for extraordinary circumstances. Thedistinction between recommendations directed to the AECB and those directed to the government isbased on whether the recommendations are related to potential licensing conditions.
6.5. The Role of the Atomic Energy Control Board (AECB)
The AECB, an independent federal regulatory body established to control and supervise thedevelopment, application, and use of atomic energy, reports to Parliament through the Minister ofNatural Resources. As noted, one of the roles of the AECB is to regulate the mining of uranium toensure that the activity does not pose undue risk to health, safety, security and the environment.
Licence applications to the AECB for a project that has undergone a public review by a panelmust also undergo a further internal review by AECB staff with contributions from other governmentagencies such as the federal departments of Environment, Human Resources Development, andFisheries and Oceans, and their provincial counterparts. These agencies make up what is called theJoint Review Group, and this consultative process is known as the Joint Regulatory Process. Allrelevant comments from the Joint Review Group, and those from the public review panel, are thenreflected in a recommendation from AECB staff concerning appropriate licensing action to the five-member Atomic Energy Control Board. If the Board is satisfied that the proposal is acceptable withrespect to health, safety, security and protection of the environment, a licence is issued.
7. CASE HISTORIES — PROJECTS PROGRESSING THROUGH EARP
In April 1991, six uranium mining projects in Saskatchewan were referred by the AECB forpublic review. The map below (Fig. 1.) shows the location of the major uranium-producing operationsin Canada, while Table I provides a summary of the six new mining proposals. Among the firstprojects to be referred for EARP review amid the controversy surrounding the above-mentionedFederal Court of Appeal decision, these six proposals entered the process at a very sensitive time. Thefive projects examined by the Joint Panel were referred under Section 12 of the EARPGO, while thesixth project, examined by the Federal Panel, was referred under Section 13 of the EARPGO (seepage 5). By late 1991, specific ToR had been released for both Panels and the respective reviews hadbegun.
The Joint Panel commenced public hearings for the first three of five uranium mining projectson March 22, 1993, and completed this phase of the review on May 20, 1993. The Federal Panel alsocommenced public hearings early in 1993. The marathon of hearings for the Joint Panel alone covered20 days, beginning in Regina and ending in Saskatoon, with six northern communities in between.Sessions averaged 10 hours a day, but often lasted 12 hours. Some 300 petitioners presented opinionsand positions in public meetings averaging 80 attendees. To assist intervenors in preparing briefs topresent at both panel hearings, some $500 000 was made available by the federal and provincialgovernments. Both levels of government presented formal briefs at the Joint Panel hearings in supportof the three projects at the opening session in Regina, and provided more supporting documentationat the closing sessions hi Saskatoon. The environmental assessment of the four uranium projectsreviewed to date is estimated to have cost close to $3 million. The public hearings phase ended withless apprehension about the process than at the outset, but the outcome of these reviews was not tobe known until the panels released their reports in late 1993.
143

a PRODUCING OPERATIONS
RABBIT LAKE (Including EAOLEPOINT and COU.INS BAY)
KEY LAKECLUFF LAKESTANLEIOH [ELLIOT LAKE] (1)
O PROJECTS UNDER DEVELOPMENT
McARTHUR RIVERMIDWEST/McCLEAN
CIOAR LAKEKIOOAVIK (2)
OUNNAR•nd
LORADUHAHIUH CITY
( EAOLE POINT
I COLUN8 BAY
ATHABASCABASIN
PAST PRODUCING OPERATIONS
SOURCE: URANIUM AND NUCLEARENERGY BRANCH, NRCtn
BEAVERLODQE etalOUNNAR & LORADO etalAONEW LAKE (1)MADAWASKA et •! (3)
(BANCROFT]
QUIRKE/PANEL/DENISON etalJELLIOT LAKE] (1)
PORT RADIUM (4)RAYROCK [MARIAN RIVER] (5)
FIG. 1. Uranium mining in Canada.

While the scope of this paper does not permit exhaustive detail on all aspects of a panelreview, the essential recommendations of the review panels and the responses to thoserecommendations by government are provided below. Readers are also invited to peruse Annexes 1and 2 for additional insight into the mandate and scope of the uranium project panel reviews.
It is also worth noting that while both panels initiated their respective reviews in early 1993,the EISs for the Cigar Lake and McArthur River projects had not been finalized and thus the reviewof these two projects was postponed to a later date. As well, in 1992, the Joint Panel had been askedby government to review an Underground Exploration Program (UEP) for the McArthur River project,which was proposed in order to obtain data needed to prepare an EIS for the overall project. ThePanel reported in early 1993, recommending that the UEP be allowed to proceed subject to certainconditions. Both governments agreed and work got under way as soon as possible.
TABLE I. NEW SASKATCHEWAN URANIUM MINING PROJECTS (AS OF 1995)
PROJECT/OPERATOR
Dominique-JanineExtension/
Cogema Resources Inc.
PROJECTTYPE
MineExtension
STATUS OFPROJECT
Panel andGovernmentApproval of
OWNERS(SHARE %)
Cogema Resources Inc. (100)
Midwest Project/Minatco Limited
McClean Lake Project/Minatco Limited
Cigar Lake Project/Cigar Lake Mining
Corporation
McArthur RiverProject/
Cameco Corporation
Eagle Point-Collins BayA & D /
Cameco Corporation
New JointProductionCentre [seeMcClean]
New JointProduction
Centre
NewProduction
Centre
New Mine[Milling atKey Lake]
MineExpansion
Project;Mining Proceeding
Approval Withheldbut Project beingRe-submitted byNew Operator
Panel andGovernmentApproval of
Project;ConstructionProceeding
EIS in Preparation(expected in 1995);
Panel ReviewExpectedin 1996
EIS in Preparation(expected in 1995);
Panel ReviewExpectedin 1996
Panel andGovernmentApproval of
Project;Mining Proceeding
Cogema Resources Inc. (56),Denison Mines Limited (19.5),
Uranerz Exploration and Mining Limited(20),
OURD (Canada) Co., Ltd (4.5)
Cogema Resources Inc. (70),Denison Mines Limited (22.5),OURD (Canada) Co., Ltd (7.5)
Cameco Corporation (48.75),Cogema Resources Inc. (36.375),
Idemitsu Uranium Exploration CanadaLtd (12.875),
Korea Electric Power Corporation (2)
Cameco Corporation (53.991),Uranerz Exploration and Mining Limited
(29.775),Cogema Resources Inc. (16.234)
Cameco Corporation (66.67)Uranerz Exploration and Mining Limited
(33.33)
145

8. PANEL RECOMMENDATIONS
In late 1993, the Joint Panel recommended that the DJX proceed, subject to conditions, thatthe MJV not proceed as designed, and that the McClean Lake project be subject to a five-year delay.The Federal-only Panel recommended that full-production underground mining of the Eagle Pointorebody be approved, subject to certain conditions, but that approval be withheld for open-pit miningof the Collins Bay A and D orebodies until additional technical information on waste-rockmanagement and decommissioning is provided by the proponents.
In early 1994, Cogema announced that it had decided to modify its plans for developing theDJX project at Cluff Lake, and submitted revisions to the government regulatory authorities. Therevised three-phase mining plan would not require the damming and partial draining of the north endof Cluff Lake, but would require Cogema to access deeper portions of the DJX orebody byunderground means after an initial phase of open-pit mining.
9. GOVERNMENTS' REACTION AND RESPONSE
The federal and provincial governments responded to the recommendations of the Joint Panelon December 23, 1993. Both governments agreed that DJX should proceed as submitted, subject tothe AECB licensing process, that the MJV presented potential risks and should not proceed aspresented, and that the McClean Lake project should proceed subject to the AECB's normal licensingprocess. Governments concluded that the AECB's licensing process would allow all of the technicalissues raised by the Joint Panel to be considered within the context of a licence application, andprovide sufficient time for the proponents to address them before the McClean Lake project comesinto operation.
Cogema's proposed modifications were viewed by the AECB as presenting environmentalimpacts that were less than those predicted for the initial project and, as such, could therefore beadequately controlled. Nonetheless, the AECB invited public comment on the proposed modificationsto the mining method at DJX to ensure that there was no significant public concern regardingCogema's application. After receiving only minor comments, the AECB concluded that the projectcould proceed as re-submitted.
In March 1994, the federal government agreed with the Panel that underground mining atEagle Point should proceed, subject to the AECB's licensing process, but opined that open-pit miningat Collins Bay A&D may also be able to proceed, subject to the AECB licensing process. The AECBprocess would address the conditions recommended by the Panel during the evaluation of the licenceapplications, and would require the provision of adequate information on waste-rock management anddecommissioning, as recommended by the Panel.
On July 29, 1994, the AECB referred the proposal for a redesigned Midwest Joint Venture(MJV) to the Minister of the Environment for public review. The project is expected to be reviewedby the existing Joint Panel at the same time as the Cigar Lake project. ToR were prepared in closeconsultation with Saskatchewan's Department of Environment and Resource Management andFEARO. On November 9, 1994, the revised MJV uranium mining proposal was referred by thefederal and provincial environment ministers for review by the Joint Panel. The EISs for the MTV andCigar Lake are expected to be submitted in the summer of 1995 in the hope that the public reviewprocess could begin as soon as possible.
146

10. CANADA'S NEW LEGISLATION — THE CANADIAN ENVIRONMENTALASSESSMENT ACT (CEAA)
In June 1990, the Government of Canada introduced Bill C-78, the Canadian EnvironmentalAssessment Act (CEAA), as a comprehensive reform of EARP. At the time, the government believedthat the proposed legislation would have a greater impact on sensitizing decision-making and decision-makers to the needs of the environment than any other legislation then existing elsewhere in theworld. The government intended that the EARPGO would remain in force until the new legislationwas promulgated, but Bill C-78 died when Parliament was prorogued in early May 1991.
The legislation, reintroduced as Bill C-13 in the new Parliament later in May 1991, hadnumerous amendments made that required further comments from representatives of environmentalgroups and industry. Meanwhile, subsequent appeals to the aforementioned court decisions (see page3) resulted in the Supreme Court of Canada upholding the constitutionality of the EARPGO inJanuary 1992, rendering compliance with the Order by all federal decision-makers a mandatoryrequirement. Draft regulations required by Bill C-13 were reviewed across Canada and the Billreceived approval in the House in March and in the Senate in June; it received Royal Assent on June23, 1992. The necessary operating regulations and procedures took considerable time to be finalized,and it was not until January 19, 1995, that CEAA was proclaimed by Order in Council. Projects willhenceforth be reviewed under CEAA, although as noted above the Saskatchewan uranium projectswill proceed under the EARPGO. The Canadian Environmental Assessment Agency, formerly knownas FEARO, will oversee the new environmental review process.
The new CEAA legislation replaces the old EARP Guidelines Order, and sets out, for the firsttime in legislation, the responsibilities and procedures for the EA of "projects" involving the federalgovernment. It reduces legal uncertainties and the need for court interpretations, sets out a streamlinedprocess, and establishes sustainable development as a fundamental objective of the federal process.CEAA provides an environmental process for new projects, and a participant funding program thatsupports public participation (see Fig. 2).
The reforms will help ensure that environmental considerations are integrated into federaldecision-making processes, and will help develop greater harmonization of EA systems acrossCanada. By introducing a degree of certainty in the process, the reforms will also reduce costs andtime demands for all participants.
CEAA applies to projects for which the Government of Canada holds the decision-makingauthority — whether as a proponent, land administrator, source of funding, or regulator (for listedstatutes). The new CEAA process is similar to EARP in many respects, but several important changeshave been introduced. These include the following: the definitions of a "project" and an"environmental effect," the introduction of "comprehensive study" and "mediation" as new EA tracksthat a project may follow, the requirement to keep an ongoing record of all documents related to theassessment in a public registry, the requirement to consider the need for a follow-up program, andthe mandatory public input into specified EA tracks.
CEAA has four stated objectives, namely: i) to ensure that the environmental effects ofprojects receive careful consideration before responsible authorities take action, ii) to encourage thoseauthorities to take actions that promote sustainable development, iii) to ensure that projects carriedout in Canada or on federal lands do not cause significant adverse environmental effects outside thejurisdictions in which the projects are carried out, and iv) to ensure that there is an opportunity forpublic participation in the EA process.
In addition, four guiding principles are to be followed in applying CEAA.
Early Application The process should be applied as early in the planning stage of theproject as practicable, and before irrevocable decisions are made.
147

START
DOESCEAA APPLY?
[SEEFIGURE 2]
ONCOMPREHENSIVE
STUDY
LIST?
COMPREHENSIVESTUDY
SCREENING(CLASS SCREENING)
PANEL REVIEWAND/OR
MEDIATION[SEE FIGURE 3]
IMPLEMENTATION DO NOT PROCEED
END
FIG. 2. CEAA Process overview flowchart.
148

START
IS THEUNDERTAKING
IN RELATION TO APHYSICAL
WORK?
IS THEPHYSICAL
ACTIVITY ON THEINCLUSION
LIST?IS IT ONTHE EXCLUSION
LIST?NOT A PROJECT
NO EA REQUIRED
FT IS A PROJECT.
ISTHERE
A FEDERALAUTHORITY S.5
TRIGGER?IS
IT EXCLUDED
FOR EMERGENCYPURPOSES?
IT LIKELYTO INVOLVEANSBOUNDARY
EFFECTS1'
CEAAAPPLIES.
CONTINUE.CEAA DOES NOT
APPLY NO EAREQUIRED
CEAA DOES NOTAPPLY. NO EA
REQUIRED
FIG. 3. Startup phase. Does CEAA apply?
149

MEDIATIONTERMS OF REFERENCE
ESTABLISHED.
REFERRAL
DECISION
MEDIATION OF
SPECIFIC ISSUES?
PANEL REVIEWTERMS OF REFERENCE
ESTABLISHED.
MEDIATOR APPOINTED
PROJECT PROCEEDS.GO TO THE
IMPLEMENTATIONPHASE.
PROJECT TO BEMODIFIED AND
REASSESSED ORABANDONED,
FIG. 4. CEAA public review flowchart.
150

Accountability
Efficient and Cost Effective
Open and Participatory
The self-assessment of projects for environmental effects by federaldepartments and bodies is a cornerstone of the process. [A Cabinetdecision by Order in Council is required in response to therecommendations of a panel report.]
Each project should undergo only one EA, and the level of effortrequired to undertake an assessment for the project should match thescale of the likely environmental effects of the project.
Public participation is an important element of an open and balancedEA process. [A participant funding program exists to promoteeffective public participation in the process.]
10.1. Specific Highlights of CEAA - A Comparison with the EARPGO
Most importantly, CEAA defines a "project" as being either: i) an undertaking in relation toa physical work, such as any proposed construction, operation, modification, decommissioning, orabandonment, or ii) any proposed physical activity not relating to a physical work that is listed in theCEAA Inclusion List regulation, as shown below (see Fig. 3).
Once an EA is required or "triggered," because a federal authority is a proponent, providesfunding, owns the land or is a regulator, CEAA provides several assessment options, compared toEARP. Four types of EA now available to meet different project circumstances include: screening,comprehensive study, mediation and panel review. The assessment track depends on the level ofenvironmental risk represented by the project (see Fig. 4).
Screening Systematically documents environmental effects and determines the need tomitigate these, or modify a project plan, or recommend further assessmentthrough mediation or panel review. To improve process efficiency, small-scale or routine projects may be assessed through a class screening (seeExclusion List below).
Comprehensive Study Applied to large-scale and environmentally sensitive projects usuallyundergoing more intensive assessment (see Comprehensive Study List below).
Mediation
Panel Review
A new voluntary approach in Canadian environmental assessment in whichan impartial mediator, appointed by the Minister of the Environment*, helpsinterested parties resolve issues surrounding a project. Used when the partiesare willing, limited in number, and where a consensus is possible.
If a project requires further evaluation, after screening, comprehensive studyor mediation, it is referred to the Minister of the Environment1 for review byan independent, public panel.
The Federal Minister of the Environment plays a pivotal role in implementing the federalenvironmental review process under CEAA, and has the ability to: i) call for a public review by apanel, mediator or both, under certain circumstances and in consultation with a federal authority, atany stage of a screening or after comprehensive study, ii) appoint panel members or a mediator, andestablish terms of reference in consultation with the responsible federal authority, iii) allow anotherfederal process to be substituted for a panel review under CEAA to promote efficiency, avoidduplication and save time, iv) ensure that projects posing risks of significant adverse environmentaleffects on federal lands, or across provincial or international boundaries receive an EA, and v) preventoverlaps or confusion with other jurisdictions by developing coordinated EA procedures for conductingjoint panel reviews with those jurisdictions.
151

Notwithstanding the above, it is noteworthy that while the intention of CEAA is to ensure thatall projects undergo an EA, it is expected that less than 5% of all projects with federal involvementwill be assessed in depth by panel review; the vast majority will require a screening only. [UnderEARP, only some 48 projects have undergone panel reviews since the federal environmentalassessment process was established in 1974.]
Several Regulations under CEAA are required to put its procedures into effect and clarify itsrequirements and scope. Four are critical to the proper functioning of CEAA, namely: theComprehensive Study List, the Law List, the Exclusion List and the Inclusion List.
ComprehensiveStudy List
Law List
Exclusion List
Describes those types of projects that must be assessed through a moredetailed study, i.e., those having the potential of causing significant adverseenvironmental effects no matter where they are located and which oftengenerate considerable public concern; includes projects in national parks,major pipelines or mining projects, nuclear power facilities and uraniummines.
This regulation was strengthened to reflect public comments. By lowering theinclusion thresholds, more projects will be subject to comprehensive study.
Defines the scope of CEAA by identifying those federal statutory andregulatory approvals that will be counted as triggers for an EA. [UnderCEAA, an EA is required or triggered for a project when a federaldepartment or agency is asked to provide a licence, permit, certificate orother regulatory authorization listed on the Law List; not every such decisionwill result hi environmental effects.]
New provisions have been added following a review of public comments,bringing to 190 the number of federal triggers for EAs.
Describes those undertakings in relation to a physical work that do notrequire an EA. Such projects are routine and relatively small-scale, and canbe expected to result in only insignificant environmental effects; includes suchundertakings as routine maintenance, minor renovations, etc.
The Exclusion List will help streamline the federal EA process by allowingdepartments and agencies to focus their assessment efforts on those projectswith environmental effects.
Relates only to those projects that are a physical activity not relating to aphysical work, that is, activities that must be subjected to an EA if a federaldepartment or agency proposes, funds, or otherwise authorizes the project byissuing a permit or licence; includes such activities as cutting and removingtimber from a National Park.
Other important regulations are being developed for CEAA through an extensive process ofconsultations. One will describe procedures for conducting EAs of international development projectsoutside Canada involving the federal government, while respecting the sovereignty of states andinternational law. Another will articulate the principle of "one project/one assessment" to ensure thatEAs relating to the same project, but involving more than one responsible authority, are coordinatedto avoid duplication.
The foregoing provides a brief overview of CEAA. An exhaustive critique of CEAA asapplied is not possible because no major projects have been reviewed under the new Act. Thus, anyexamination of Canada's EA process must be restricted to projects that have been reviewed under the
Inclusion List
152

EARPGO. Although the new Act and the old Guidelines Order are quite similar operationally, it isimpossible to predict if CEAA will be comparable to EARP in practice, for differences between thetwo processes may take some time to become clear.
11. COMMENTS ON THE ENVIRONMENTAL ASSESSMENT PROCESS(UNDER EARP/CEAA)
In January 1995, the federal environmental assessment and review process changed with thepassage of the new CEAA. The initial stages of the process have been clarified through theintroduction of regulations covering the Comprehensive Study List, the Inclusion List, the Law Listand the Exclusion List, and the powers of the public review panels have been strengthened.
There are a number of areas where governments, regulators and proponents will be paying particularattention in order to improve the review process in practice under CEAA. In part, these stem fromobservations made during the recent EAs and panel reviews of the four Saskatchewan uranium miningproposals already reviewed under EARP.
Timing
Panels
Agencies
Policy
A major concern expressed by industry and government in completing an EA for anew uranium mining project has been the inordinate length of time taken to proceedthrough to completion. At most stages of the process, considerable delays wereintroduced that when taken together (more than one year) had an inordinate impacton the cost of the development, both in terms of total expenses and potential lostmarket opportunities.
Suggestions have been made that a defined schedule could be adopted at the start ofthe process, which would clarify for all those concerned the need to complete theassessment in a pre-determined time frame. This would help the proponent, thegovernment, and the panel to identify the minimum requirements needed to fulfil theassessment obligations without extending the process beyond what was deemednecessary.
The independence of a review panel can become problematic if public perceptionsinfluence panel members to the extent that the scope of a review is broadened beyondthe established terms of reference. The importance of nominating qualified expertsto panels and encouraging panels to observe their mandates cannot be over-emphasized.
The CEA Agency could formally establish a pool of qualified "experienced" expertswho could be called upon when selecting the best panel members.
The current EA process was not designed with independent regulatory authorities inmind. While a federal agency or board, such as the Atomic Energy Control Board(AECB), often triggers an EA, it must be seen as being free of conflict, and operatingat arm's length.
In the recent assessment of uranium projects, governments qualified their responseto allow the AECB to comment on those aspects of the panel recommendationsdirectly related to the licensing process, while the broader policy issues (e.g., socio-economic) were dealt with by specific departments.
Scoping an EA has proven to be problematic, particularly in separating environmentalissues from socio-economic and policy issues. The public often perceives thatunderlying policy issues should be an integral component of the project assessment,for there are often no other opportunities for public expression of concern in these
153

areas. Such concerns during the recent assessment of uranium projects led to anexpansion of the "environmental" review to allow opinions to be voiced regardingCanada's policies on non-proliferation of nuclear weapons and uranium exports.
Although a panel chairman may permit presentations on such issues, in the recentpanel reviews the chairmen did make an effort to limit the discussion and debate inthe interest of examining the central environmental issues.
Priorities There is a risk that panel members or the public may lose sight of the EA priorities;they may expect that minor issues should be accommodated and reviewed in greatdetail.
It is critical to rank the essential issues and focus resources on the areas of majorenvironmental concern, thereby permitting panels to concentrate on the higher riskareas, and save time and money in the process.
Scope Examining the cumulative effects of several projects was established as an importantcriterion for the EA of new uranium mining projects. Proponents argue that theyshould bear only the costs associated with their own project.
There are opportunities for government and industry cooperation in the pooling ofresources to overcome such constraints without compromising future developments.
The proclamation of CEAA has afforded an opportunity for the Government of Canada tore-examine the EA process, and in particular the review procedures of the independent panels, andto make improvements where appropriate. While this responsibility falls mainly to the CanadianEnvironmental Assessment Agency and the Regulatory Advisory Committee (RAC) that representskey stakeholders, Natural Resources Canada has embarked on its own review, with a particular focuson suggesting improvements that would benefit natural resource projects.
In addition, the Ministers of the Environment and Industry have undertaken a JointMonitoring Program (IMP) to review the implementation of CEAA during the first year. The JMPwill monitor the impact of implementing CEAA on the competitiveness of Canadian industry and onsustainable development. The JMP will collect the views of all stakeholders on the implementationof CEAA, apply the Business Impact Test to the federal EA process, and identify public policybenefits of CEAA, especially with regard to its contribution to sustainable development.
12. CONCLUSION - CANADA'S ENVIRONMENTAL ASSESSMENT PROCESSAS A MODEL
The EA process in Canada has evolved into a fairly complex set of procedures involving alllevels of government, the public and the proponents. As the process matures, it will be continuouslyimproved, with the benefit of input from all players. The difficulties experienced to date will beresolved, but new problems will undoubtedly surface that require novel solutions. Canada's EAprocess is truly a dynamic one.
Today, EA has become an integral part of the design process of new projects. It is now partof sound engineering practice. Indeed, obtaining financing for new projects depends on minimizingenvironmental liabilities. The trend is established and will continue.
When the development of several new uranium mining projects in Saskatchewan wasproposed, both the federal and provincial governments and the uranium industry expressed concernabout the potential impacts of what appeared to be a rather burdensome public environmental reviewprocess. However, the successful advancement of three such proposals through the process has allayed
154

much of this uncertainty and has confirmed that all of Canada's uranium-producing operations canmeet high environmental, health, and safety standards.
In Canada, the impact of the EA process on new uranium mining developments has beenprofound. It has changed the way projects are designed and will change the way they are brought onstream. The process has been time consuming and often difficult, but it has revealed that these newuranium mining proposals are environmentally sound and can remain so over their lifespan.
The Government of Canada is convinced that the EA process has helped to demonstrate thatnew uranium mining projects are being developed in a responsible manner, after full considerationhas been given to the potential impacts and public concerns associated with these facilities. Thelessons learned in Canada could well prove to be useful in other jurisdictions where considerationsare being given to the development of new uranium production projects. However, it is understoodthat all processes can be improved, and both levels of government in Canada will be working closelywith the uranium mining industry to make improvements in the EA process wherever possible toreduce the time and cost of reviews, while meeting the fundamental objectives.
The new global appreciation of EA may also have an impact in the marketplace. A recentmotion put forward in the Swedish parliament would require uranium buyers to pay for theenvironmental damage caused by uranium mining in other countries. This action confirms the growingawareness that environmental considerations could have an unexpected impact on world marketopportunities. Canada's exemplary EA process could give Canadian uranium producers an edge inthe future.
The real impact of Canada's EA process might be that the "Canada model" is applied beyondnational borders. As the world's leading supplier of uranium, Canada has attracted much attention inareas such as uranium exploration and mine development technology. If that focus is extended toCanada's positive experience with EA, the wealth of knowledge gained in Canada could well proveuseful in other jurisdictions considering the development of new uranium production projects.
155

BIBLIOGRAPHY
Environmental Assessment and Review Process Guidelines Order, SOR/84-467, June 23, 1984, anextract from the Canada Gazette, Part II, July 11, 1984.
The Canadian Environmental Assessment and Review Process, a paper presented by Guy Riverin,Director of Operations, Central Region, Federal Environmental Assessment Review Office, to theSeminar on Environmental Assessment hosted by the Technical University of Nova Scotia, May 14,1992.
Bill C-13 - The Canadian Environmental Assessment Act, Chapter 37, Statutes of Canada 1992, anAct to establish a federal environmental assessment process, Assented to 23rd June, 1992.
Application of Canadian Environmental Regulations to the Development of Canadian Uranium Mines,a paper presented by Kenneth L. Smith, Uranium and Nuclear Energy Consultants - Canada, to theUnited States Council of Energy Awareness International Uranium Seminar, Lake Tahoe, Nevada,September 22, 1992.
Keynote Address, by the Honourable Berny Wiens, Minister of Environment and ResourceManagement, Government of Saskatchewan, to the 19th Annual Symposium of the Uranium Institute,London, England, September 8, 1994.
The Canadian Review Process for Uranium Mines, a paper presented by Michel Poissonnet, Presidentof Cogema Resources Inc., to the Nuclear Energy Institute's International Uranium Seminar, BeaverCreek, Colorado, September 27, 1994.
Highlights of the Canadian Environmental Assessment Act Regulations, Putting the Act into Practice:The Canadian Environmental Assessment Act Regulations, and An Overview of the FederalEnvironmental Assessment Process, a series of media information bulletins/fact sheets released by theCanadian Environmental Assessment Agency, October 6, 1994.
Department of the Environment - Law List Regulations, Inclusion List Regulations, ComprehensiveStudy List Regulations, Exclusion List Regulations, an extract from the Canada Gazette, Part II,October 19, 1994.
Environmental Assessment of Nuclear Projects in Canada - Process, Participation, Lessons Learned,a paper presented by Geraldine Underdown, to the KASAM Seminar on EIA - A Process forParticipation in Decision-Making, Lulea University, Sweden, October 24-26, 1994.
156

ANNEX 1
FINAL TERMS OF REFERENCE FORTHE ENVIRONMENTAL ASSESSMENT REVIEW BY
THE JOINT FEDERAL/PROVINCIAL PANEL ON PROPOSED URANIUM MININGDEVELOPMENTS IN NORTHERN SASKATCHEWAN
MANDATE
1. The Panel shall review the environmental, health, safety and socio-economic impacts(hereinafter referred to as "impacts") of the proposed uranium mine developments (listed inSchedule A) in Northern Saskatchewan and assess their acceptability.
In assessing the acceptability of the proposed developments, the Panel will include in itsreview and consider:
a) the historical experience with past and existing uranium mining operations inSaskatchewan;
b) the cumulative impacts of existing operations and the proposed developments;
c) the short and long term impacts of the proposed projects, spanning their constructionphase, operating period, decommissioning phase and post-decommissioning phase;
d) the impact of employment and socio-economic opportunities afforded northernresidents by the proponents and the measures necessary for implementation of thoseopportunities;
e) the adequacy of measures proposed by the project proponents to protectenvironmental quality and to safeguard worker health and safety, and whether themeasures can be expected to meet the requirements of Canadian and Saskatchewanlaw, regulations and policies applicable to uranium mine developments;
f) the adequacy of monitoring, enforcement and compliance systems to ensure thatmeasures necessary for mitigating adverse impacts can be implemented;
g) the benefits afforded by the proposals.
2. The Panel shall determine from its review whether a project is acceptable or unacceptable.
In concluding that a project is acceptable, the Panel may recommend that specified minimumterms and conditions, including any mitigative measures or any other measures relating to theimpacts under the Panel's review, be implemented where it considers these necessary for theprotection of health, safety and the environment or for dealing responsibly with socio-economic concerns. The Panel may also suggest measures that it considers would enhance theacceptability of the proposals.
If the Panel concludes a project is unacceptable, it shall provide its reasons for thisconclusion.
3. In fulfilling its mandate, the Panel shall provide full opportunities for public consultation andreview.
157

REVIEW PROCEDURES
Detailed written procedures for conducting the review shall be established by the Panel andmade available to the public.
TECHNICAL EXPERTS
The Panel may secure the services of independent technical experts to assist and advise oncomplex technical and/or socio-economic issues related to its mandate. Such experts will also beavailable to respond to inquiries from review participants.
STAGES OF THE REVIEW
Schedule A lists the five proposals to be reviewed by the Panel. The five proposals have beenreferred due to potentially significant or unknown adverse environmental effects and public concern.
While all of the proposals are in the planning stage, some are further advanced than others.Environmental Impact Statements (EIS) have been prepared for the first three proposals listed inSchedule A, one of which (Dominique-Janine Extension) is associated with the existing operatinguranium mining facility and two of which are for new uranium mining facilities. EIS documents haveyet to be prepared for the last two proposals listed in Schedule A. The Panel will take the differingstages of these projects into consideration in scheduling its review.
The Panel will seek public comment on the three available EISs and determine their adequacybefore proceeding to public hearings. When the Panel is satisfied with the information provided,including that with respect to the cumulative impacts, it may report on one or more of these projectsto the Ministers as described in the following stages of the review. The Panel shall submit its finalreport(s) on these proposals within 18 months of its appointment.
In reviewing the remaining two proposals, the Panel will conduct scoping sessions inappropriate communities to solicit public comment and, based on these comments and its ownconsideration, prepare and issue Guidelines to the respective proponents for the preparation of EISs.The cumulative impacts of these two proposals will be considered when the EIS documents have beensubmitted. The stages of the review following submission of these documents to the Panel are outlinedbelow. The Panel shall submit its final report(s) on these two proposals within 18 months of receiptof the proponent's EISs.
1. Review of Information
a) Review of the available information on the environmental, health, safety and socio-economic impacts of the uranium mining industry in Saskatchewan to date. Theinformation and any related reports prepared will be made available to the public.
b) Review of the past performance of the uranium mining industry in providingemployment and socio-economic opportunities to northern residents. The informationand any related reports prepared will be made available to the public.
c) Review by the Panel of Environmental Impact Statements (EIS) submitted by theproponents. The EISs will also be made available to the public for review and writtencomment.
158

d) The Panel may draw on proponents, technical agencies from within federal orprovincial governments, independent experts and the public for available information.
2. Should the Panel, after reviewing the above information and considering public comments,deem an EIS deficient it may request additional information from the project proponent.
3. Once the Panel is satisfied with the information provided, it will announce public hearingsfor the project in question. If appropriate, the hearings may be structured to address morethan one project.
For the purposes of promoting public awareness and facilitating public comment, the Panelwill hold meetings and/or hearings in the appropriate northern communities, Regina,Saskatoon and in such other Saskatchewan communities as the Panel may think necessary.
4. When the Panel is in a position, following the completion of public hearings, to provide areport on its findings, conclusions and recommendations relevant to a specific project, it willsubmit the report to the federal Ministers of the Environment and of Energy, Mines andResources and to the Saskatchewan Minister of Environment and Public Safety.
The Panel should, to the extent possible, ensure that the timely review of a specific projectis not jeopardized by delays in the review of another project included in its mandate.
LINKAGE TO OTHER POLICY PROCESSES
The Panel is not expected to interpret its mandate so as to duplicate the work of other publicinquiries and policy processes or to focus on national or international issues which are not directlyrelated to the impacts of the proposals.
However, concerns may be raised by the public which extend beyond the impacts of directconcern to the Panel, and in such cases the Panel will ensure that the public is provided a reasonableopportunity to express these concerns.
Schedule A
EIS SUBMITTED
1. Dominique-Janine Extension (Cogema Resources Inc. - operator)
2. South McMahon Lake Project [Midwest Joint Venture] (Minatco Limited - operator)
3. McClean Lake Project (Minatco Limited - operator)
EIS TO BE PREPARED
4. McArthur River Project (Cameco Corporation - operator)
5. Cigar Lake Project (Cigar Lake Mining Corporation - operator)
159

ANNEX 2
EXCERPT FROM THE DRAFT EIS GUIDELINESAND GOVERNMENT INFORMATION REQUIREMENTS
FOR THE CIGAR LAKE AND McARTHUR RIVER PROJECTS
TABLE OF CONTENTS
PARTI: GENERAL REQUIREMENTS . . . . . . . . . . . . . . . . . . . . . . . . . . . . . . . . . 1
1.0 INTRODUCTION . . . . . . . . . . . . . . . . . . . . . . . . . . . . . . . . . . . . . . . . . . . . . 1
2.0 THE PANEL'S MANDATE . . . . . . . . . . . . . . . . . . . . . . . . . . . . . . . . . . . . . . 22.1 THE PANEL'S OBJECTIVE . . . . . . . . . . . . . . . . . . . . . . . . . . . . . . . . . 22.2 PANEL CONCLUSIONS AND RECOMMENDATIONS . . . . . . . . . . . . . . . 32.3 LINKAGE WITH OTHER POLICY PROCESSES . . . . . . . . . . . . . . . . . . . 32.4 INFORMATION RESOURCES . . . . . . . . . . . . . . . . . . . . . . . . . . . . . . . 42.5 INFORMATION REQUIREMENTS . . . . . . . . . . . . . . . . . . . . . . . . . . . . 4
3.0 PRINCIPLES, STANDARDS AND REQUIREMENTS . . . . . . . . . . . . . . . . . . . . . 53.1 INCLUSION OF PUBLIC CONCERNS . . . . . . . . . . . . . . . . . . . . . . . . . . 63.2 SEPARATION OF FACT AND OPINION . . . . . . . . . . . . . . . . . . . . . . . . 63.3 INCLUSION OF ADEQUATE INFORMATION . . . . . . . . . . . . . . . . . . . . 73.4 USE OF LOCAL KNOWLEDGE . . . . . . . . . . . . . . . . . . . . . . . . . . . . . . 73.5 IDENTIFICATION OF INFORMATION GAPS . . . . . . . . . . . . . . . . . . . . . 83.6 READABILITY OF EIS . . . . . . . . . . . . . . . . . . . . . . . . . . . . . . . . . . . . 83.7 PROVISION OF TRANSLATED SUMMARIES . . . . . . . . . . . . . . . . . . . . 93.8 IDENTIFICATION OF SPATIAL BOUNDARIES . . . . . . . . . . . . . . . . . . . 93.9 IDENTIFICATION OF TEMPORAL BOUNDARIES . . . . . . . . . . . . . . . . 10
4.0 POLICY AND ECONOMICS . . . . . . . . . . . . . . . . . . . . . . . . . . . . . . . . . . . . 114.1 GOVERNMENT POLICY . . . . . . . . . . . . . . . . . . . . . . . . . . . . . . . . . 114.2 END USES OF URANIUM . . . . . . . . . . . . . . . . . . . . . . . . . . . . . . . . 114.3 URANIUM SUPPLY AND DEMAND . . . . . . . . . . . . . . . . . . . . . . . . . 124.4 BENEFITS AND COSTS . . . . . . . . . . . . . . . . . . . . . . . . . . . . . . . . . . 134.5 REVENUE SHARING . . . . . . . . . . . . . . . . . . . . . . . . . . . . . . . . . . . . 15
PART II: REGIONAL BASELINE . . . . . . . . . . . . . . . . . . . . . . . . . . . . . . . . . . . . 16
1.0 REGIONAL NATURAL PROCESSES AND ECOSYSTEMS . . . . . . . . . . . . . . . . 171.1 VALUED ECOSYSTEM COMPONENTS . . . . . . . . . . . . . . . . . . . . . . . 171.2 REGIONAL GEOLOGY . . . . . . . . . . . . . . . . . . . . . . . . . . . . . . . . . . 171.3 REGIONAL CLIMATE AND METEOROLOGY . . . . . . . . . . . . . . . . . . . 181.4 REGIONAL HYDROLOGY . . . . . . . . . . . . . . . . . . . . . . . . . . . . . . . . 181.5 REGIONAL AQUATIC ECOSYSTEMS . . . . . . . . . . . . . . . . . . . . . . . . 191.6 REGIONAL TERRESTRIAL ECOSYSTEMS . . . . . . . . . . . . . . . . . . . . . 191.7 SYSTEMS ANALYSIS . . . . . . . . . . . . . . . . . . . . . . . . . . . . . . . . . . . 201.8 SENSITIVITY AND VULNERABILITY . . . . . . . . . . . . . . . . . . . . . . . . 201.9 ENVIRONMENTAL STATUS . . . . . . . . . . . . . . . . . . . . . . . . . . . . . . 211.10 RESEARCH AND MONITORING . . . . . . . . . . . . . . . . . . . . . . . . . . . . 21
160

2.0 REGIONAL SOCIO-ECONOMIC AND HEALTH PROFILE . . . . . . . . . . . . . . . . 232.1 VALUED SOCIAL SYSTEM FUNCTIONS . . . . . . . . . . . . . . . . . . . . . . 232.2 DEMOGRAPHIC ANALYSIS . . . . . . . . . . . . . . . . . . . . . . . . . . . . . . . 232.3 HISTORICAL ANALYSIS . . . . . . . . . . . . . . . . . . . . . . . . . . . . . . . . . 232.4 TRADITIONAL RESOURCE AND LAND USE . . . . . . . . . . . . . . . . . . . 232.5 SOCIO-ECONOMIC ANALYSIS . . . . . . . . . . . . . . . . . . . . . . . . . . . . . 242.6 HEALTH STATUS . . . . . . . . . . . . . . . . . . . . . . . . . . . . . . . . . . . . . . 252.7 SERVICES AND FACILITIES . . . . . . . . . . . . . . . . . . . . . . . . . . . . . . 262.8 EDUCATION AND TRAINING . . . . . . . . . . . . . . . . . . . . . . . . . . . . . 262.9 EMPLOYMENT . . . . . . . . . . . . . . . . . . . . . . . . . . . . . . . . . . . . . . . 272.10 LOCAL BUSINESS AND ECONOMIC ACTIVITIES . . . . . . . . . . . . . . . . 272.11 LOCAL INSTITUTIONS . . . . . . . . . . . . . . . . . . . . . . . . . . . . . . . . . . 272.12 LOCAL ISSUES . . . . . . . . . . . . . . . . . . . . . . . . . . . . . . . . . . . . . . . 282.13 REGIONAL DEVELOPMENT CONTEXT . . . . . . . . . . . . . . . . . . . . . . . 282.14 HERITAGE RESOURCES . . . . . . . . . . . . . . . . . . . . . . . . . . . . . . . . . 282.15 RESEARCH AND MONITORING . . . . . . . . . . . . . . . . . . . . . . . . . . . . 28
3.0 INSTITUTIONAL FRAMEWORK . . . . . . . . . . . . . . . . . . . . . . . . . . . . . . . . . 293.1 APPROVALS, REGULATIONS AND STANDARDS . . . . . . . . . . . . . . . . 293.2 INSTITUTIONAL MANAGEMENT CAPABILITY . . . . . . . . . . . . . . . . . 303.3 FIRST NATIONS INVOLVEMENT . . . . . . . . . . . . . . . . . . . . . . . . . . . 303.4 CONSULTATION . . . . . . . . . . . . . . . . . . . . . . . . . . . . . . . . . . . . . . 31
PART HI: PROJECT-SPECIFIC GUIDELINES . . . . . . . . . . . . . . . . . . . . . . . . . . . . 32
1.0 PROJECT DESCRIPTION . . . . . . . . . . . . . . . . . . . . . . . . . . . . . . . . . . . . . . 321.1 PROJECT OVERVIEW . . . . . . . . . . . . . . . . . . . . . . . . . . . . . . . . . . . 321.2 THE PROPONENT . . . . . . . . . . . . . . . . . . . . . . . . . . . . . . . . . . . . . . 32
1.2.1 Ownership and Financial Capability . . . . . . . . . . . . . . . . . . . . . . . 321.2.2 Experience . . . . . . . . . . . . . . . . . . . . . . . . . . . . . . . . . . . . . . . 33
1.3 PROJECT MANAGEMENT . . . . . . . . . . . . . . . . . . . . . . . . . . . . . . . . 331.3.1 Consultation and Public Information . . . . . . . . . . . . . . . . . . . . . . . 331.3.2 Community Role . . . . . . . . . . . . . . . . . . . . . . . . . . . . . . . . . . . 341.3.3 Compensation Commitments . . . . . . . . . . . . . . . . . . . . . . . . . . . . 34
1.4 PROJECT DESCRIPTION REQUIREMENTS . . . . . . . . . . . . . . . . . . . . . 351.4.1 Activity Management Plans . . . . . . . . . . . . . . . . . . . . . . . . . . . . . 351.4.2 Activity Descriptions . . . . . . . . . . . . . . . . . . . . . . . . . . . . . . . . . 351.4.3 Alternatives . . . . . . . . . . . . . . . . . . . . . . . . . . . . . . . . . . . . . . 36
1.5 SITE CONDITIONS . . . . . . . . . . . . . . . . . . . . . . . . . . . . . . . . . . . . . 371.6 PROJECT COMPONENTS AND ACTIVITIES . . . . . . . . . . . . . . . . . . . . 38
1.6.1 Pre-Development, Site Preparation and Construction . . . . . . . . . . . . . 381.6.2 Mining Operations . . . . . . . . . . . . . . . . . . . . . . . . . . . . . . . . . . 381.6.3 Milling Operations . . . . . . . . . . . . . . . . . . . . . . . . . . . . . . . . . . 391.6.4 Liquid Waste Treatment . . . . . . . . . . . . . . . . . . . . . . . . . . . . . . . 401.6.5 Waste Management . . . . . . . . . . . . . . . . . . . . . . . . . . . . . . . . . . 411.6.6 Tailings Disposal . . . . . . . . . . . . . . . . . . . . . . . . . . . . . . . . . . . 421.6.7 Support Operations . . . . . . . . . . . . . . . . . . . . . . . . . . . . . . . . . . 431.6.8 Transportation Systems . . . . . . . . . . . . . . . . . . . . . . . . . . . . . . . 43
1.7 DECOMMISSIONING AND ABANDONMENT . . . . . . . . . . . . . . . . . . . 451.8 RISK ANALYSIS AND EMERGENCY RESPONSE . . . . . . . . . . . . . . . . . 47
1.8.1 Identification of Risks . . . . . . . . . . . . . . . . . . . . . . . . . . . . . . . . 471.8.2 Prevention . . . . . . . . . . . . . . . . . . . . . . . . . . . . . . . . . . . . . . . 481.8.3 Contingency Plans . . . . . . . . . . . . . . . . . . . . . . . . . . . . . . . . . . 48
1.9 MONITORING . . . . . . . . . . . . . . . . . . . . . . . . . . . . . . . . . . . . . . . . 501.9.1 Continuous Monitoring . . . . . . . . . . . . . . . . . . . . . . . . . . . . . . . 50
161

1.9.2 Periodic Project Auditing . . . . . . . . . . . . . . . . . . . . . . . . . . . . . . 51
2.0 ECOSYSTEM IMPACTS . . . . . . . . . . . . . . . . . . . . . . . . . . . . . . . . . . . . . . . 522.1 PROJECT ENVIRONMENT BASELINE . . . . . . . . . . . . . . . . . . . . . . . . 522.2 IMPACT PREDICTIONS . . . . . . . . . . . . . . . . . . . . . . . . . . . . . . . . . . 54
2.2.1 Impact Models . . . . . . . . . . . . . . . . . . . . . . . . . . . . . . . . . . . . . 542.2.2 Impact Prediction Statements . . . . . . . . . . . . . . . . . . . . . . . . . . . . 56
2.3 IMPACT SIGNIFICANCE ASSESSMENT . . . . . . . . . . . . . . . . . . . . . . . 572.4 MONITORING . . . . . . . . . . . . . . . . . . . . . . . . . . . . . . . . . . . . . . . . 58
3.0 DIRECT HUMAN HEALTH AND SAFETY IMPACTS . . . . . . . . . . . . . . . . . . . 593.1 RADIATION DOSE-RESPONSE . . . . . . . . . . . . . . . . . . . . . . . . . . . . . 593.2 WORKER HEALTH AND SAFETY . . . . . . . . . . . . . . . . . . . . . . . . . . . 60
3.2.1 Radiation Risks to Workers . . . . . . . . . . . . . . . . . . . . . . . . . . . . 603.2.2 Other Risks to Workers . . . . . . . . . . . . . . . . . . . . . . . . . . . . . . . 623.2.3 Worker Health and Safety Programs . . . . . . . . . . . . . . . . . . . . . . . 623.2.4 Monitoring . . . . . . . . . . . . . . . . . . . . . . . . . . . . . . . . . . . . . . . 633.2.5 Workers Compensation and Insurance . . . . . . . . . . . . . . . . . . . . . . 63
3.3 PUBLIC HEALTH . . . . . . . . . . . . . . . . . . . . . . . . . . . . . . . . . . . . . . 633.3.1 Radiation Risks to the Public . . . . . . . . . . . . . . . . . . . . . . . . . . . . 633.3.2 Non-Radiation Risks to the Public . . . . . . . . . . . . . . . . . . . . . . . . 643.3.3 Monitoring and Compensation . . . . . . . . . . . . . . . . . . . . . . . . . . . 65
4.0 COMMUNITY VITALITY . . . . . . . . . . . . . . . . . . . . . . . . . . . . . . . . . . . . . . 664.1 INTRODUCTION . . . . . . . . . . . . . . . . . . . . . . . . . . . . . . . . . . . . . . . 664.2 IMPACT PREDICTIONS AND SCENARIOS . . . . . . . . . . . . . . . . . . . . . 66
4.2.1 Historical Analysis . . . . . . . . . . . . . . . . . . . . . . . . . . . . . . . . . . 674.2.2 Comparative Case Studies . . . . . . . . . . . . . . . . . . . . . . . . . . . . . 694.2.3 Impact Scenarios . . . . . . . . . . . . . . . . . . . . . . . . . . . . . . . . . . . 69
4.3 MONITORING AND MITIGATION . . . . . . . . . . . . . . . . . . . . . . . . . . . 71
5.0 ECONOMIC DEVELOPMENT AND EMPLOYMENT . . . . . . . . . . . . . . . . . . . . 725.1 EMPLOYMENT . . . . . . . . . . . . . . . . . . . . . . . . . . . . . . . . . . . . . . . 72
5.1.1 Northern Hiring . . . . . . . . . . . . . . . . . . . . . . . . . . . . . . . . . . . . 725.1.2 Training . . . . . . . . . . . . . . . . . . . . . . . . . . . . . . . . . . . . . . . . . 735.1.3 Culture and Work Place . . . . . . . . . . . . . . . . . . . . . . . . . . . . . . . 745.1.4 Worker Camps . . . . . . . . . . . . . . . . . . . . . . . . . . . . . . . . . . . . 75
5.2 BUSINESS OPPORTUNITIES . . . . . . . . . . . . . . . . . . . . . . . . . . . . . . . 755.3 MONITORING AND MITIGATION . . . . . . . . . . . . . . . . . . . . . . . . . . . 76
162

XA9745132URANIUM EXPLORATION TARGET SELECTIONFOR PROTEROZOIC IRON OXIDE/BRECCIACOMPLEX TYPE DEPOSITS IN INDIA
K.K. DWIVEDY, K.K. SINHAAtomic Minerals Division,Department of Atomic Energy,Hyderabad, India
Abstract
Multiracial iron oxide/breccia complex (IOBC) type deposits exemplified by Olympic Dam in Australia, fallunder low grade, large tonnage deposits. A multidisciplinary integrated exploration programme consisting of airbornesurveys, ground geological surveys, geophysical and geochemical investigations and exploratory drilling, supportedadequately by the state of the art analytical facilities, data processing using various software and digital imageprocessing has shown moderate success in the identification of target areas for this type of deposits in the Proterozoicterrains of India. Intracratonic, anorogenic, continental rift to continental margin environment have been identifiedin a very wide spectrum of rock associations. The genesis and evolution of such associations during the MiddleProterozoic period have been reviewed and applied for target selection in the (i) Son-Narmada rift valley zone; (ii)areas covered by Dongargarh Supergroup of rocks in Madhya Pradesh; (iii) areas exposing ferruginous breccia in thewestern part of the Singhbhum Shear Zone (SSZ) around Lotapahar; (iv) Siang Group of rocks in Arunachal Pradesh;(v) Crystalline rocks of Garo Hills around Anek; and (vi) Chhotanagpur Gneissic complex in the Bahia-Ulatutoli tractof Ranchi Plateau. Of these six areas, the Son-Narmada rift area appears to be the most promising area for IOBC typedeposits. The significant features of this important zone are: 1. Presence of a basement ridge bounded by two NW-SEto N-S trending faults with marked gravity and magnetic highs. 2. Deposition of a thick pile of Proterozoicmetasedimentary rocks with a Palaeozoic cover. 3. Proterozoic rocks having been subjected to extensional rifttectonics with bimodal volcanics, often with alkaline affinity. 4. Presence of ferruginous breccia with as high as 14%total iron and significant U, REE and Cu along the marginal parts of the valley. Considering occurrences of theuranium anomalies near Meraraich, Kundabhati, Naktu and Kudar and positive favourability criteria observed in awide variety of rocks spatially related to the rifts and shears, certain sectors in Son-Narmada rift zone have beenidentified as promising for intense subsurface exploration.
1. INTRODUCTION
Iron Oxide/Breccia Complex type deposits are recognized by their multimetal (Cu, Au, Ag,REE, U, etc.) character typified after the low grade, large tonnage deposit (U as by-product) ofOlympic Dam in Australia (Roberts and Hudson [1], Dahlkamp, [2, 3, 4]). The concept that led tothe discovery of this class of deposits along with its geological characters has become the guidelinesto look for such a type of deposit in other parts of the globe. Initially, it was thought that the depositwas formed as a result of a thick pile of sedimentary breccia deposited in a graben, under a very highenergy environment and the first mineralizing event was set during sedimentation itself along withstrata-bound haematite, sulphide, uranium, rare earths, gold and silver, which was possibly relatedto geothermal activity resulting from volcanism. However, sulphide zoning and alteration related tomineralization plus high potassium, rare earths, barium and flourine contents were suggestive ofalkaline-igneous activity in the region and a magmatic and hydrothermal affiliation, are now fairlyindicated and recognized.
Beside the Olympic Dam deposit in South Australia, the Iron Oxide/Breccia Complex depositsare only known from few countries in the world, viz. Great Bear Magmatic Zone and Wernecke Mts.Canada; Kiruna, N. Sweden; Bayan Obo, China and S.E. Missouri, USA. The commoncharacteristics of these deposits are :
i) Host rocks belong to the upper part of the Lower Proterozoic and Middle Proterozoic age(1800 to 1100 Ma). They are rich in iron-oxide, (Fe content being 20-60%) and associatedwith Cu up to 2%, U30g up to 0.06%, REE traces to 6.1%, Au 0.5-2 gm/tonne and Ag upto 6 gm/tonne Cobalt, nickel, tellurium, arsenic, barium and fluorine are also invariablyassociated.
163

ii) The host rocks are dominated by rift tectonics and are located in cratonic or continentalmargin environment.
iii) Mineralizations are generally related to igneous activity. However, these are invariablystructurally related to major lineaments and show an indirect or spatial association withigneous rocks.
iv) Wall-rock alterations are seen both vertically and laterally (sodic, potassic, sericitic) from thedeeper level to the shallower level. Iron metasomatism in general is predominant.
v) Morphology of the deposits are both transgressive and stratabound and orebodies occur asdiscordant veins or range from breccia to massive concordant bodies. Morphology andalteration are controlled by permeability along faults, shears and intrusive contacts orpermeable horizon or welded tuff.
vi) It is believed that these deposits are formed in a shallow crustal environment (hundreds ofmetres to 6 km) and are the expressions of deep-seated volatile rich igneous hydrothermalsystem tapped by deep crustal rift tectonic structures.
In the light of the above characteristic features, an attempt has been made for selection oftarget areas for uranium exploration hosting Iron Oxide/Breccia Complex type mineralization in India.The multidisciplinary data like Airborne Gamma Ray Spectrometric (AGRS), ground geophysical, andgeochemical, generated by AMD and the other institutions have indicated favourable target areas forthis type of deposits in the Proterozoic terrains of India.
2. REGIONAL TECTONIC FRAMEWORK OF INDIAN SHIELD
The Indian sub-continent is essentially made up of three main cratons of Archaean age, viz.Singhbhum-Orissa, South Dharwar and Bundelkhand massifs with nucleus of Older MetamorphicTrondjhemite Gneiss (OMTG) ranging in age from 3800-3400 Ma (Sarkar and Sana [5]). These areskirted a by greenstone belt often of komatiitic affinity and further surrounded by Proterozoic mobilebelts which have been the site of a long period of tonalization extending up to around 2800 Ma whenthe cratonic areas began stabilizing and the process continued till around 1600 Ma on the cratonicareas, both within and at the margins (Mukhopadhyay [6]). The areas were unconformably overlainby sedimentary quartz-pebble-conglomerates (QPC) and arenite sequences (grits and quartzites)deposited in an overall anoxygenic conditions during the Late Archaean to Early Lower Proterozoicperiod as reported from Singhbhum-Orissa and Karnataka areas. Instances from Raj as than andadjoining areas of Uttar Pradesh around Bundelkhand craton are limited. Uranium, in the labile form,for the first time, was released and mobilized into a sedimentary system, along with copper and otherprecious metals (Au. Ag. etc ) and became part of the geological system in getting mobilized andremobilized by the thermal and metamorphic events created by the basic and acid volcanics introducedinto the sedimento-volcanic sequence. The granites were intruded at different times e.g. Singhbhumgranite-A Phase I & II (3300 Ma) and Singhbhum granite-B phase III (3000 Ma) (Saha et al. [7]), and1960-950 Ma Chhotanagapur granite (Mukhopadhyay [6]) related to Satpura Orogeny and at differentlevels in the lithospheric crust. Similar situations prevailed in other parts of the shield as well as SouthDharwar Cratonic areas. These Early Lower Proterozoic sedimento-volcanic sequences were depositedunder a typical plate-tectonic subduction regime dominated by basement fractures and rift-orientedtectonics with material transfer from deeper as well as shallower part of mantle domains. Finally, thewhole pile of sediments together with iron-rich Banded Iron Formations (BIFs), both within theCraton and in the surrounding mobile belt, carbonaceous shales, phyllites and limestones depositedin euxenic environments and deep sea conditions (the latter belonging to Middle/Upper ProterozoicPeriod) have been subjected dominantly by the continental extensional tectonics and have been sitesfor acid and basic extrusive and intrusives, often of an alkaline nature, causing large scale direct orremote-controlled magmatic affiliations mobilizing U, Cu, REE, Au, Ag, etc. Such magrnatic
164

affiliations have been so dominating over the enveloping Proterozoic mobile belt around the threecratons that the central part of the Indian shield is wholly a reworked and refused mass of crystallinerocks and gneisses, as of now, with less metamorphosed Mid-Upper Proterozoic Cuddapah andVindhyan sediments.
3. POTENTIAL AREAS FOR IRON OXIDE/BRECCIA COMPLEX (IOBC) TYPEURANIUM DEPOSITS IN INDIA
The Indian Shield as a whole on its periphery is bounded by rift related grabens and marginalsag basins formed by continental crustal extension. Thirty-six extensional cratonic features like basins,ridges and faults have been recognized by Biswas [8] which have been grouped under (i) intracratonic,(ii) pericratonic, (iii) transitional, and (iv) aulacogens (Fig. 1). Radhakrishna and Naqvi [9]mentioned that the development of the Indian grabens followed the inherent tectonic grains of thecraton (Fig. 2).
In the initial stages of evaluating potential or known terrains for the Iron Oxide/BrecciaComplex type deposits, six favourable areas were identified (Fig.3).
1. Son-Narmada valley areas, Uttar Pradesh and Madhya Pradesh.2. Dongargarh Supergroup, Khairagarh basin, Madhya Pradesh.3. Siang group of rocks, West Siang district, Arunachal Pradesh4. Singhbhum district, Bihar5. Chhotanagpur Gneissic Complex, Ranchi Plateau, Bihar6. Anek and Darugiri, Garo Hills, Meghalaya
After preliminary evaluation, three areas namely the Son Valley areas in Uttar Pradesh andMadhya Pradesh, Khairagarh basin in Madhya Pradesh and West Siang district in Arunchal Pradeshwere taken up for detailed follow-up. From the preliminary data it was not possible to pinpoint thetarget area as most of the information in the proposed areas is lacking or based on other supportingevidences. Thus, this paper aims at highlighting the most potential area.
The salient features of the three main target areas selected for future follow-up work arepresented below.
3.1. Son-Narmada rift valley zone
The possibilities of finding Iron Oxide/Breccia Complex deposits in the Son-Narmada rift zonein parts of Madhya Pradesh and Uttar Pradesh have been examined in the light of geological andgeophysical characterization and evolution of the basin.
3.1.1. Disposition of basin and Tectonic setup
The Son-Narmada tectonic zone cuts through the central part of the Indian Shield as a majormid-continental rift (Figs 1,2). The rift-dominated basin with its complex structure and geologicalhistory is essentially intracratonic at its early stage of development during the Late Archaean andEarly Proterozoic times. Later, the basin was dominated by the Mid-Proterozoic continental-extensional rift or aborted rift tectonics finally developing into tectonic grabens during theCarboniferous period (Radhakrishna and Naqvi [9]).
165

1. PURNCA BASIN
2. MUNOER-SAHARSA RIDGE3. GANOAK BASIN4. FAIZABAD HIOOE9. SHAROA BASIN
C. CHANDAUSI RIOOE
7. SAHASPUR BASIN6. DELHI-KALKA RIOOE9. PUNJAB BASIN
10. DELHI-LAHORE RIDGE11. N. RAJASTHAN BASIN
12. JAISALMER-MARI ARCH
L E G E N D13. S. RAJASTHAN BASIN
14. NAGAR PARKAR ARCH
15. KACHCHHBASIN18. SAURASHTRA ARCH
17. SURAT DEPRESSION18. BOMBAY ARCH19. RATNAGIRI OFFSHORE BASIN20. VENGURLA ARCH21. KONKAN BASIN22. TELLICHERY ARCH23. KERALA BASIN24. MANNAR BASIN
25. K AVER I BASIN26. KRISHNA-GODAVARI BASIN27. MAHANAOI BASIN2B. BENGAL BASIN29. DAMOOAR BASIN*30. SON BASIN31. SATPURA BASIN32. NARMAOA BASIN33. CAMBAY BASIN
34. PRANHITA-GOOAVARI GRABEN35. MAHANAOI GRABEN
36. PALGHAT GRABEN
NARMAOA-SONOAMODAR RIFT
FIG. 1. Indian craton with radial basins and arches/ridges, intra-cratonic and pericratonic basins,major faults and tectonic lineaments.
166

, MPMB
DEC CAN tRAP.COVER.
L E G E N DEARLY PROTEROZOICMOBILE BELT
MPMB: MIDDLE PROTEROZOICMOBILE BELT
MPSB : MIDDLE PROTEROZOICSEDIMENTARY BASINS
IG . INTERIOR 6RABEN
(A f t e r Radhakrishno a Noqvi.1986)
FIG. 2. Simplified geological map of peninsular India showing major tectonic zones (modified afterRadhakrishna and Naqyi, 1986).
167

IF" 76° at" 92«
36' f
?
)>
>V_./ '——^'N
/
J'"r•v,
Cv'>|
K
36'
DELHI28
•-•^•i.j
20
12
r--»< i
r.'- -*V1 iiaea
:>.r
2B«
AHMEOABAD BHQPALa a
( i a
.
(JfLCUTTA -^ S\ /". »
- *
I————| AREAS FOR REGIONALI————I APPRAISAL
888 TARGET AREAS
1. SON-NARMADA I M.P. & U.P. I2. OONGARGARH-LOMARA I M.P.)3. WEST S1ANG I ARUNACHAL )4. SINGHBHUM ( BIIIAR )5. ANEK i MEGHALAYA )6. CHOTANAGAPUR I BIHAR )
20'
12"
76« 84° 92"
FIG. 3. Areas under evaluation for IOBC type of uranium mineralization.
168

3.1.2. Regional lithostructural setting of the study area
Geologically, the area comprises basement granitic and gneissic complexes, which are overlainby synsedimental-volcanic formations of Lower Proterozoic age (Mahakaushal Group of rocks) ofgreenstone assemblage made up mainly of phyllite, tuff and meta-volcanics (metabasalts, pillow lava,basic schists, etc.). Some of the associated ultramafic lavas have been considered to be of komatiiticorigin. These are followed by the Bijawar Group of rocks which represent a regime of eugeosynclinalsedimentation. The rocks have been subjected to regional metamorphism resulting in slate, phyllite,schist, marble, metasubgreywacke, metaproto-quartzite, and banded iron formation (BIF). Further,these are sharply divided by a prominent ENE-WSW fault of deep origin. In the Son Valley areasthe base of Bijawars towards north is marked by banded haematite jasper/chert and overlain byVindhyan sediments consisting of quartzite, sandstone, shale, porcellanite and limestone withintrusions of basic volcanic suites comprising agglomerate, kimberlite (900-1350 Ma, Smith, [10])and basalt. The Son river flowing E-W, in the central part almost follows the faulted contact betweenthe Vindhyans and Lower Proterozoic volcano-sedimentary Mahakaushals/Bijawars — the latter areknown to be intruded by granite and dykes of syenite and trachyte which are typical of rift regimes(Balasundaram and Balasubramaniyan [11]).
3.1.3. Broad Tectonic setting of rift zone and geological evolution
The tectonic setting and geological evolution of this belt has been reviewed by Biswas [8].The observations made by various workers like Radhakrishna and Naqvi [9] and Biswas ([12, 13, 8])can be summarized as:
1) Doming up of the lithosphere due presumably to hotspot activity and injection of high-densitymass in the crust during the Early Proterozoic time and formation of the triple-arm geometry.
2) Regional dilation and injection of magma associated with volcanism and deposition of thevolcanogenic Mahakaushal sediments in the Early Proterozoic.
3) Propagation of the rift system laterally under extensional tectonics, producing detachmentsystems and accommodation zones.
4) Intrusive activity and emplacement of alkaline magmatic rocks like kimberlites (at Panna andJungel), carbonatite and lamproite (Sidhi) and other basi-cultrabasic dykes in the break-awayzones (detachment systems) in the Middle Proterozoic.
5) Cessation of rifting and folding under compressive stresses in the Upper Proterozoic.
The above summary supports Early Proterozoic rifting of the Indian crust.
3.1.4. Geophysical signature of Proterozoic rifting
The magnetic and gravity anomalies over the Vindhyan basin in Son Valley have been usedby Das [14] to trace the subsurface extent and derive the geometry of the Lower Proterozoic volcano-sedimentary rocks cropping out of the northwestern and southern margins of the basin. The Pre-Vindhyan topography and structural features with a rift-valley geometry have been described by him.
3.1.4.1. Pre-Vindhyan topography
The Bouguer gravity and magnetic anomaly (VF) (Fig. 4) reflects some prominent gravity-magnetic highs occurring with the Mahakaushal suite of rocks. The ultrabasic intrusives near Jungel
169

-Jo
0 20 W 60 KILOMETRES
-
Mari^VBhabu,
^d- b^46==S
-»H5~***GRAVITY-«GH——pj—INTERPRETED FAULTS
^o^flOaihjnganjfafsf^(AFTER DAS. 1993)
F/G. 4. Bouguer gravity anomaly map of the Son Valley and adjoining region.

(Srivastava et al. [15]) and Panna (Sarma and Nandi [16]) are characterized by sharp peaked magnetichighs. The dolerite dykes also are characterized by high magnetic anomalies.
The Vindhyan as a whole leaves a negative gravity anomaly and the Gondwana Group arerepresented by a marginal gravity high H-6 (Fig. 4) with feeble magnetic anomaly.
The extent of the magnetic rocks below the Vindhyan sediments has been interpreted usingthe locations of the magnetic anomaly pairs, the residual gravity highs and the preceding analysis ofthe possible sources of anomalies. These may possibly represent the Proterozoic iron-rich volcanicrift material such as the basalt flows and ultrabasic bodies (kimberlite) as seen near Jungel and in theSidhi area. The magnetic anomalies of Domains 1 and 4 are considered to represent the subsurfaceextension of the Bijawar-Mahakaushal rocks under the Vindhyans in the Gangetic alluvium andforming the basement ridge.
The pre-Vindhyan topography in the west shows a basement ridge as the Satna-Semeria-Burdiridge and in the eastern part a central ridge has been traced from Mirzapur to Varanasi related to theVindhyan rocks. Parallel to this central ridge, there are two 'highs' to the north and south ofVaranasi, forming a north-south striking dome-shaped plateau surrounded by depressions of the orderof 2-3 km (Fig. 4) suggesting that they are basement 'high'.
3.1.4.2. Structural features with rift valley geometry
The 'stripped' gravity anomaly map, after the removal of the gravity effects of the supra-crustals like the Vindhyan and Mahakoshal groups from the observed Bouguer anomaly map (Fig.4), reflects a central high around Rewa and extending northeast and southward. This represents ahigh-density intracrustal or subcrustal mass. The three regional lows suggest shallow protoriftdepression of the Pre-Bijawar-Mahakoshal in the Archaean basement. Regional dilation later musthave caused injection of the magma, associated with doming and volcanism. Koide and Bhattacharya[17] and Mohr [18] have advocated a similar mechanism for formation of rift valleys.
During the Middle Proterozoic this rift system was reactivated, creating the Vindhyan basinbetween the uplifted shoulders (gravity highs) in the north and south. The Satna-Bargarh-Burdi buriedridge structure represents such an accommodation zone in the Vindhyan, while the Kaimur andChopan escarpment represent the initial detachment systems (break-away zones). In the Son Valleyarea, the Kaimur escarpment in the western sub-basin and the Chopan escarpment in the eastern sub-basin indicate a 'locked' system. Similar rift asymmetry has been noticed in Lake Baikal, the Rhinegraben, Central African rifts and the Gregory rift (Bosworth et.al. [19]).
3.1.5. Uranium mineralization and associated features in the Sidhi-Meraraich-Kundabhati-Dudhi-Naktu-Kudar tract of rift zone
South of the Son-Narmada rift valley the Chhotanagpur granite-gneiss Complex and Bijawarmetasedimentaries have been surveyed in parts of Sonbhadra district, Uttar Pradesh and Sidhi district,Madhya Pradesh and a number of significant uranium anomalies have been located in migmatitic andgranitic complex. Aerospace data integration using Airborne Gamma Ray Spectrometric (AGRS) andLandsat data has brought to light prominent radiometric fronts marked as breaks and structural trendE-W to ENE-WSW interpreted as faults and shears. Some of the uranium anomalies were foundassociated with these features. Ground verification indicated extensive radioactive breccia zones, oftenferruginous and varying in length from tens of kilometres to a few kilometres at the southern fringenear the contact of the Bijawars with the crystallines and Gondwana sediments with basement granitegneisses. From the data similar indications are seen towards the north, near the contact with theVindhyans. These breccias are heterolithic and vary in composition from granitic to syenitic,displaying, by and large, a volcano-plutonic association and alkaline affinity. Chemically, the samples
171
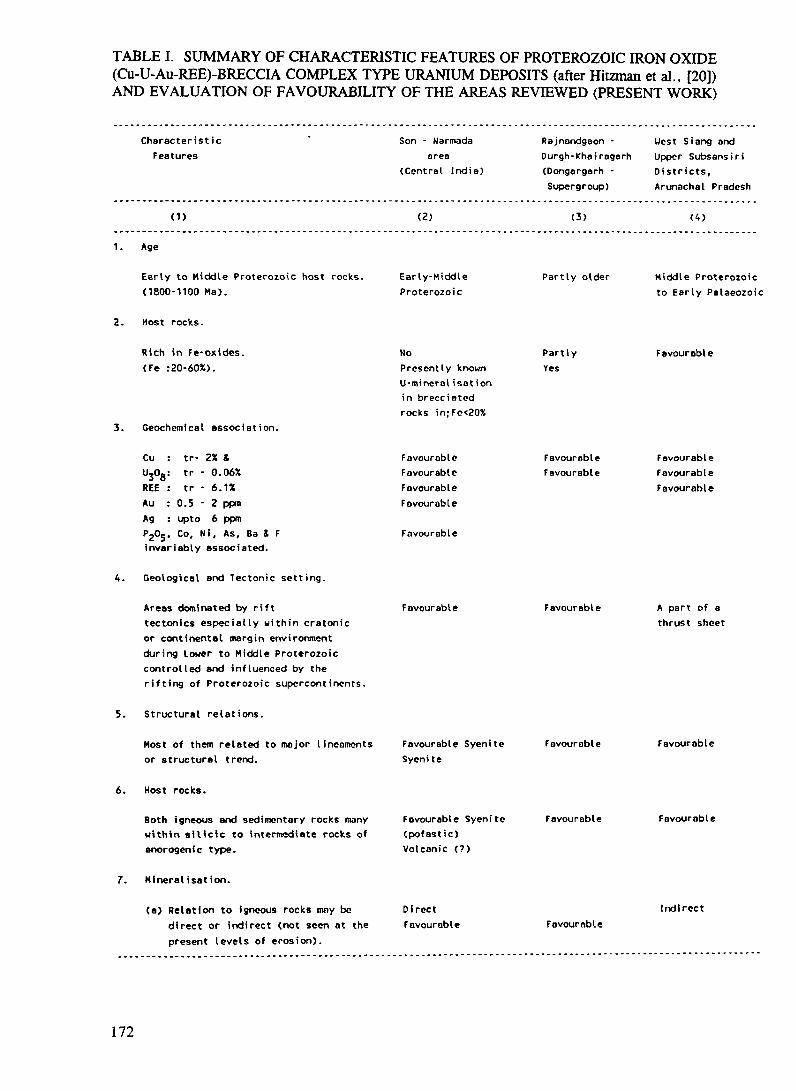
TABLE I. SUMMARY OF CHARACTERISTIC FEATURES OF PROTEROZOIC IRON OXIDE(Cu-U-Au-REE)-BRECCIA COMPLEX TYPE URANIUM DEPOSITS (after Hitzman et al., [20])AND EVALUATION OF FAVOURABILITY OF THE AREAS REVIEWED (PRESENT WORK)
CharacteristicFeatures
Son - Narmadaarea
(Central India)
Rajnandgaon -Durgh-Khairogarh(Dongorgarh -Supergroup)
West Siang andUpper SubsansiriDistricts,Arunachal Pradcsh
(1) (2) (3) (4)
1. Age
Early to Middle Proterozoic host rocks. Early-Middle(1800-1100 Ma). Proterozoic
Partly older Middle Proterozoicto Early Palaeozoic
2. Host rocks.
Rich in F«-oxides.(Fe :2C-60X>.
3. Geochemical association.
NoPresently knownU-minerolisotionin brecciotedrocks in;Fe<20%
PartlyYes
Favourable
Cu :U308:REE :Au :Ag :P205.
tr- 2X &tr - 0.06Xtr - 6.1X
0.5 - 2 ppmupto 6 ppmCo, Hi, As, Ba 8 F
FavouroblcFavourableFavourableFovouroble
Favourable
FavourableFavourable
FavourableFavourableFavourable
invariably associated.
Geological and Tectonic setting.
Areas dominated by rifttectonics especially within eratonicor continental margin environmentduring Lower to Middle Proterozoiccontrolled and influenced by therifting of Proterozoic supercontinents.
Favourable Favourable A part of athrust sheet
5. Structural relations.
Most of them related to major lineamentsor structural trend.
Favourable SyeniteSyenite
Favourable Favourable
Host rocks.
Both igneous and sedimentary rocks manywithin silicic to intermediate rocks ofanorogenic type.
Favourable Syenite(pofastic)Volcanic (?)
Favourable Favourable
7. Mineralisation.
(a) Relation to Igneous rocks mny be Directdirect or indirect (not scon at the Favourablepresent levels of erosion).
IndirectFavourable
172

(1) (2) (3)
8. Mineralogy.
(a) Ores dominated by iron oxides(haematite (shallow) or magnetiteor magnetite (deeper)).
(b) REE in apatite, monazite, xenotine,and bastenasite.
(c) Au as native metal.(d) Cu as sulphides.(e) Co , Ba, P and F.
minerals are common and often abundant.
9. Alteration.
Host rocks intensely altered. Alterationmineralogy depends on host lithology onddepth of formation with zonal featuresand chorecters.
No clearinformationon ores.
No clearinformation
Minor
No clear informa-tion; Fe ores ofmarine origin
(a) Sodic (deeper)(b) Potassic (shallow).(c) Sericitic and(d) Si Iicification at very shallow levels
Locally the host rocks are intenselyFe-metasomatised.
10. Morphology of deposits.
(a) Stratobound (concordnnt).
(b) Transgressive.(discordant veins ; breccias).
(c) Morphology and alteration orecontrolled by permeability along faults
11. Depth of formation.
Shallow crustol environment* <«6ktn depth).
Seen at Sonavnni
Favourable
Favourable
Not documented
No data
Sericitisation andsiticification inpresently knownmineralised bodies
concondant
12. Geophysical signature.
13 Genesis.Hydrothermal type linked to deep-seated,volatile rich igneous rocks by deep crustnl rifts.
Positive gravityfeaturesDistinct mngneticanomalies indica-ting subsurfncebodies.
Favourable
No data ongravitysonic isolatedmagnetic highsdiscerned.
Favourable
No data
Favourable
173

analyse SiO2 6075%, K2O 8.75-14% Na2O 4.00-8.14%, CaO 0.07-1.9%, A12O3 13-20%,1.11-13.35%, FeO 0.25-4.16% and contain Cu 5- > 500 ppb, Ni 15- > 300 ppm, Au up to 52 ppband Ag <5 ppb. Petromineralogically the breccia consists of angular fragments and cluster ofquartzite, migmatite and basic rocks, with a lot of cherty materials and quartz-veins. They are oftenferruginous and sometimes carry highly haematitized pyroblastics with remnants of migmatites asxenotith. Biotite and amphiboles in the latter are completely altered and haematitic palagoniticfragments or divitrified shards are observed. Phenocrysts of sanidine and zoned plagioclase are alsoseen. The general nature of the pyroclats (ignimbrite ?) and their alterations indicate repeated volcanicactions through a wide range of geologic time. Bijawars/Mahakaushals, so far, are not seen havingbeen intruded by the syenitic rocks, yet their being affected remotely by the thermal events generatedby the intrusive syenitic rocks cannot be ruled out. However, the basic and acid volcanics associatedwith these Lower Proterozoic rocks are amply evidenced both in the form of flows as also in the formof dykes. In the light of recent models of ore genesis at Olympic Dam deposit — a major exampleof the IOBC type of uranium and associated mineralization — where granitic breccias, oftenhaematitized, have largely been produced by volcano-plutonic hydrothermal systems.
3.2. Dongargarh supergroup (DSG) of rocks, Khairagarh Basin
The areas covered by the DSG of rocks (Fig. 3) fulfill several of the favourability factors forhosting iron oxide/breccia complex type uranium deposits (Table I). The foremost among theseinclude the intra-plate, intra-cratonic rift tectonic association and the bimodal rhyolite-basalt/granite-gabbro volcano-plutonic assemblage.
Many of the favourability factors for IOBC type deposits are satisfied in the areas coveredby the Dongargarh Supergroup of rocks (Table I).
The area between Malanjkhand and Lohara in Khairagarh basin suggests the possibility offinding IOBC type uranium mineralization in this tract.
3.3. Maro-Kau-Dupu, Arunachal Pradesh
The Banded Iron Formations (BIFs) are represented by magnetite quartzite, haematitequartzite and biotite magnetite quartzite and are reported from several localities in Upper Subansiriand West Siang Districts of Arunachal Pradesh (Fig. 3). The important occurrences include Maro,Bari-Rijo, Tai, Badak, Bate nalla, Lete nallah, Noko nallah, Gamkak, Tapior, Jaiyor and Kau nallah.The BIFs contain up to 50% volume of ironoxide minerals (magnetite/haematite) and up to 60%modal quartz with variable amounts of muscovite, biotite and garnet. Other minerals present aresphene, epidote, tourmaline, perthite, K-felspar, chlorite, apatite and monazite. The most commonalteration features seen are 1) oxidations of iron oxides, magnetite altering to martite, limonite,goethite haematite, and haematite to limonite, goethite, ii) chloritization, iii) silicification and iv)serialization. This suggests that these rocks have undergone alteration by pneumatolitic/hydrothermalprocess. Other minerals present include pyrite, chalcopyrite, chalcocite and covellite. These mineralsoccur in poorly disseminated form or as irregularly distributed clusters. Primary uranium mineralsidentified include uraninite, and brannerite. An epicontinental platform/shelf environment formed inshallow water and shallow tectonic conditions has been inferred for the volcano-sedimentary sequence.Minor veins of quartzo-felspathic material reported in these metasediments adjacent to mineralizediron oxide rock and the alteration effects suggest an epigenetic, hydrothermal uranium mineralization.
The inferred within-plate, oceanic tectonic association and the marine nature of the origin ofiron oxides, and the structural disposition of the host rocks (nappe with shallow depth persistence),however, casts some doubts on these BIF related uranium association to be grouped with the IOBCtypes. Nevertheless, they represent an interesting association and more data to support their IOBCcharacter are being collected.
174

4. CONCLUSION
In light of the above discussions on uranium exploration target selection for Proterozoic IronOxide/Breccia Complex (IOBC) type deposits in India, the areas in Son-Narmada rift valley zonewhich extends over 200 km, have been taken up for detailed evaluation. A multigeoscientificprogramme by a full time dedicated team of geologists, geophysicists, geochemists andgeochronologists with a full laboratory support has been envisaged. A good number of uranium showshave been discovered some of which may lead to the discovery of a sizeable uranium deposit of IOBCtype in this tract.
REFERENCES
[I] ROBERTS, D.E., HUDSON, G.R.T., The Olympic dam copper-uranium-gold deposit, RoxbyDown, South Australia, Proterozoic unconformity and stratabound uranium deposit,TECDOC-315, IAEA, Vienna (1984) 69-94.
[2] DAHLKAMP, F.J., Genesis of uranium deposits. An appraisal of the present state ofknowledge, in Amstutz et al. edited, ore genesis, the state of the art, Springer Verlag, Berlin,Heidelberg, New York (1982) 644-654.
[3] DAHLKAMP, F.J., Classification scheme of uranium deposits, Metallogenesis of uraniumdeposits, Panel Proceedings Series, IAEA, Vienna (1989) 1-31.
[4] DAHLKAMP, F.J., Uranium ore deposits Springer Verlag, Berlin Heidelberg (1993).[5] SARKAR, S.N., SAHA, A.K., Structure and Tectonics of the Singhbhum — Orissa lorn ore
craton, Eastern India. Recent Researches in Geology, Hindustan Publication, Delhi, V.10(1983)1-12.
[6] MUKHOPADHYAY, D., Precambrian of the Eastern Indian shield perspective of theproblems. Precambrian of the Eastern Indian shield, Geol. Soc. of India, Bangalore (1988)1-12.
[7] SAHA, A.K., RAY, S.L., SARKAR, S.N., Early History of the Earths: Evidence from theEastern Indian shield, Precambrian of the Eastern Indian shield, Geol. Soc. of India,Bangalore (1988) 13-38.
[8] BISWAS, S.K., Tectonic Framework and evolution of Graben Basin of India, Rifted Basinsand Aulacogens, Gyanodaya Prakashan Nainital (1993) 18-32.
[9] RADHAKRISHNA, B.P., NAQVI, S.M., Precambrian continental crust of India and itsevolution, Jour Geol.Soc Ind., V. 94 (1986) 145-166.
[10] SMITH, B.H.S., Limberlits and Kimberlites in India, Neues Jahrbuch Mines, Abh. 161,Stuttgart (1989) 193-225.
[II] BALASUNDARAM, M.S., BALASUBRAMANIYAN, M.N., Geochronology of IndianPrecambrian, Bull. Geol. Soc. Malaysia, V. 6. (1973) 215-226.
[12] BISWAS, S.K., Rift basins in the western margin of India and their hydrocarbon prospects,Bull. Am. Assoc. Pet. Geol., 66 (10) (1982) 1497-1513.
[13] BISWAS, S.K., Correlation of non-marine Cretaceous rocks of Western India, Proc. Seminaron Cretaceous Event, Stratigraphy & Correlation of India Nonmarine Strata, IGCP seminaron project, Punjab Univ., Chandigarh (1990) 245-216.
[14] DAS, L.K., Geophysical signature of Proterozoic Rifting — A case History in Son valley,Rifted basins and Aulacogens. Granodaya Prakashan (1993) 163-181.
[15] SRIVASTAVA, V.N., MITRA, S.K., DAS, L.K., MOHAN, V., TIWARI, R.A., SNGH,R.P., Characteristic geophysical response over kinberlite plugs and other ultrabasic bodiesin Jungel valley of Mirzapur district, Uttar Pradesh, Spl. Publ. Geol. Surv. India, V.2 (1983)291-306.
[16] SARMA, K., NANDI, S.C., Report on the XXII International Geol. Cong. Ind. Part II, Sec.2 (1984).
[17] KOIDE, H., BHATTACHARYA, S., Mechanistic interpretation of rift valley formation,Science, 89 (1975) 791-793.
175

[18] MOHR P., Musings on continental rifts, Paul Mason (Ed) Continental And Oceanic Rifts,Am. Geoph. Union, Washington (1982) 293-309.
[19] BOSWORTH, W., LAMBIASE, J., KEISLER, R., A new look at Gregory's Rift: thestructural style of continental rifting, EOS, July 22 (1986).
[20] HITZMAN, W. Murray., ORESKES, NAOMI, EINAUDI, T. MARCO, Geologicalcharacteristics and tectonic setting of Proterozoic iron oxide (U-Cu-Au-REE) deposits,Precambrian research, 58 (1992) 241287.
176

XA9745133DEVELOPMENT OF THE CERRO SOLO DEPOSIT ANDURANIUM FAVOURABBLITY OF THE SAN JORGEGULF BASIN, PROVINCE OF CHUBUT
P.R. NAVARRA, A.F. BENITEZComision Nacional de Energia Atomica Argentina,Mendoza, Argentina
Abstract
The objectives of the CNEA are in the process of transformation in accordance with political and economicalchanges occurring in the country. Hence, in the future the uranium exploration activities of CNEA would tend toimprove the knowledge of geology and uranium favourability; to perform prospection tasks, and research anddevelopment in exploration technologies, to contribute to be in a position to meet the requirements of the country inthe long term. On the other hand, a strong growth of nuclear capacity is expected in the first two decades of the nextcentury. Based on its promising grade, the Cerro Solo uranium ore deposit was selected in 1990 by the CNEA tocarry out an assessment project. The intensive exploration level was accomplished, as follows: definition of generalcharacteristics of the main orebodies; detailed geologic studies; estimation of resources with adequate data; andpreliminary selection of mining-milling methods to estimate the potential profitability of the project. The depositbelongs to the sandstone type. The mineralized layers are distributed into the fluvial sandstones and conglomeratesof the cretaceous Chubut Group, lying 50 to 130 m deep. Resources of the deposit, with an average grade of 0.3%U,in tonnes of recoverable uranium at costs of up to $80/kg U, are: Reasonable Assured Resources (RAR): 800 t U,Estimated Additional Resources, Category I (EAR-I): 21001 U. Follow-up drilling programmes are being performedat present in some of the target sites defined in the paleochannel that hosts the Cerro Solo deposit, in order toestablish the hypothetical resources of the area. The sites were determined as a result of the exploration that CNEAconducted in the Pichifian uranium district. Recently, a regional research project was formulated, the goal of whichis to contribute to selecting targets for detailed exploration in the San Jorge Gulf Basin, where the Chubut Group isdistributed. Besides, the objective of the project is to improve the results of the studies that CNEA is executing indifferent regions of the basin, which is considered highly favourable for uranium, by making an integral analysis ofthe information and planning.
1. INTRODUCTION
The goals of the Comision Nacional de Energia At6mica of Argentina (CNEA — NationalAtomic Energy Commission) and the scopes of the uranium exploration activities that it perform, arein the process of transformation in accordance with political and economical changes that are takingplace in the country. An important milestone was the recent decision of the government to change thestructure of the CNEA, in order to privatize the activities belonging to the production stage of thenuclear system, and to assign research and development activities in the nuclear field to the CNEA.
As the fuel cycle activities are involved in this new context, it is predictable that in the future,the start or continuity of uranium mining operations will depend upon more stringent economicalconditions. This will be established by the commercial arrangements with the companies owning thenuclear power and fuel cycle plants. Competition with foreign sources of uranium will be of majorimportance in the development of such operations.
At present, the total nuclear installed capacity of 940 MW divided in two plants, is notexpected to increase until the end of the decade, because of delays in the construction of the AtuchaII plant. Besides, the competition of more profitable sources of energy in the short term, wouldpostpone commitment of additional nuclear power plants. This indicates that the increase of uraniumrequirements curve will diminish in the short term [1].
However, a strong growth of nuclear capacity is expected in the first two decades of the nextcentury. Hence, in the future the uranium exploration activities of CNEA would tend to improve theknowledge of geology and uranium favourability; to perform prospection tasks, and research and
177

development in exploration technologies, to contribute to be in a position to meet the requirementsof the country in the long term.
2. SITUATION OF THE CERRO SOLO PROJECT
In 1990 the CNEA started performing an assessment project in the Cerro Solo uranium oredeposit, based on their promising grade that may allow production in competitive conditions in thecountry. Two stages of the project have been completed: the first, exploration to delineate the mainorebodies, and the second, geologic setting research and economic studies at the order-of-magnitudelevel. Then, the intensive exploration level was accomplished, as follows: definition of generalcharacteristics of the main orebodies; detailed geologic studies based on drillhole samples andgeophysical logging; estimation of resources with adequate data; and preliminary selection of mining-milling methods to evaluate the potential profitability of the project. At present, the third and finalstage is being carried out, the goal of which is the detailed delineation of selected orebodies, and tocarry out prefeasibility studies.
Conventional mining methods are being considered to make estimations about profitability ofthe project. On the other hand, the unfavourable permeability conditions existing in the main sectorsof the deposit do not allow applying the in situ leaching technology, that is anyway taken into accountin the studies about other targets in the region. Then, characteristics that seem to be favourable toapplying this technology will be analysed in some areas; for instance, the Arroyo Perdido, SierraCuadrada and El Mirasol prospects, that show geologic indications of good permeability in the hostlayers, to trying to execute a pilot test. Besides, the attention has been focused on the borehole miningtechnology that may be an alternative in this case, taking into account that it was tested in depositsof this type.
With regard to the environmental aspects of a possible production stage, a systematicprogramme of studies in this field was initiated, with the participation of the group in charge of thewaste management issues in the CNEA, and local institutions [2].
In the next two years it is expected to drill additional 20,000 m in the area. By that time itis expected to reach the general objectives of the project, which means to complete the developmentprior to the production stage of the deposit. This includes the following items:
completion of the makeup of a comprehensible geological model of the deposit, to beextrapolated to the regional exploration,
definition and application of resource estimation methods to establish a reliable categorizationof the uranium resources,
analysis of the potential profitability of the project with accuracy that can allow to makedecisions about the production stage,
survey the environmental baseline of the area, at a general level,
research of the feasibility to use special technology, with emphasis on in situ leaching,
expeditious exploration of the geological influence area of the Cerro Solo deposit, to estimateits hypothetical resources in a reliable way.
178

3. COMMENTS ABOUT GEOLOGICAL SETTING OF MINERALIZATION
Some reports have been issued that describe the geological characteristics of the depositslocated in the Cerro Solo area [3, 4]. In the present report only some aspects of this matter relatedto the mineralization model will be mentioned.
The fluvial stratigraphic unit belonging to the cretaceous Chubut Group that hosts themineralization reach up to 150 m thick in the Cerro Solo area. Conglomerates and sandstonescorresponding to defined facies of the sedimentary environment [5] are predominant in the lithologyof the high energy, braided type paleochannel.
It has been established that mineralization is related predominantly to the following featuresof the paleochannel section:
sediments characteristic of reduced environment, gray or green color,
quick alternation between different lithologic classes (as described by Marveggio [6]).Mineralized layers, up to 10 m thick, are made up of alternating thin sandstone andconglomeratic beds, that contrast with more lithologically homogeneous overlapping andunderlying layers.
In Fig. 1 a typical drillhole log shows the close association between mineralization, organicmaterial and sulfides; and the apparent increasing content of cement towards the mineralized layer.In the last column, the variations of maximum diameter of grain size indicates the lithologiccharacteristic of the orebodies mentioned above.
The grade, that averages 0.3 % U in the orebodies identified in the main sectors of the deposit,is frequently higher than 2% U values in the sandstone layers interbedded.
Diagenes seems to have played an important role in preserving the mineralization, as it isindicated by the typical presence of abundant carbonatic cement in the mineralized layers, apart fromorganic material and sulfides that give them a distinctive hard feature comparing with more friableparts of the sections in the area.
Apparently, there are paleo-geomorphological aspects that play an important role in themineralization process, which is indicated by the location of the higher grade layers in certainpositions with regard to the border or the talweg of the paleochannel, depending on the stratigraphiclevel.
Typically, mineralization occurs in immature sandstone-size sediments, that may occasionallybe the matrix of conglomerates, which are made up in the clastic fraction mainly by lithic fragments(ryolites, ignimbrites, and acid tuffs, and less frequent andesites, silica and granites-granodiorites),quartz and feldspars. There are abundant clays (predominantly montmorillonite) and calcite in thematrix. Uranium minerals are associated with disseminated "clastic" organic material, and sulfides[4]. In order of abundance they occur as coffinite, uraninite and undetermined uranium mineralslinked with organic material [7].
The predominant tectonic system affecting the region follows the NW direction, and dividesthe deposit in three main blocks [8]. It is possible that the tectonic system have been important in thepreservation or leaching, depending of the position of mineralization.
179

FIG. 1. Cerro Solo drillhole log.
180

5. THE RESOURCES SITUATION
Resources of the deposit were established by using conventional estimation methods, whichwere applied with data obtained in about 300 drillholes, in the 90 hectares area corresponding to themain sectors. With regard to the 320 hectares that include all of the Cerro Solo area, the studies havebeen based on 60 000 metres of drillholes, of which 36 000 m correspond to the Cerro Solo Projectand the rest to previous programmes.
However, geostatistics was applied in the sector named C, what made an interestingcontribution to the knowledge about characteristics and distribution of the mineralization. This wasthe first application of a software recently incorporated as a resource estimation tool by CNEA, withsuccessful results, with IAEA technical assistance [9].
The situation of uranium resources in the Cerro Solo area is shown in the following table. Thereference date is January, 1995. Most of the resources belong to the main sectors of the Cerro Solodeposit. The resources are expressed in tonnes of uranium as recoverable quantities, this means, themining and ore processing estimating losses were deducted.
REASONABLE ASSURED RESOURCES ESTIMATED ADDITIONAL RESOURCESRAR Category I - EAR-I
Cost Ranges Cost Ranges
< $80/kg U
800
< $130/kg U
1 250
< $80/kg U
2 100
< $130/kg U3250
6. POSSIBILITIES OF INCREASING RESOURCES IN THE EASTERN SLOPE OF THEPICHINAN RIDGE
In the Pichinan Ridge region, located 420 km West of Trelew, the host fluvial sediments wereexplored in an area which is limited by the Chubut River to the west and the Arroyo Perdido to theeast, about 40 km east to west and 8-10 km north to south. In the western slope, where thepaleochannel turns to south, small deposits were found. However, the eastern slope, where the depositdescribed in this report is located, shows a distinctive pattern of lithology, diagenetic andmineralization processes, that resulted in more favourable conditions [10, 11]. It was proposed thatthe eastern part of the paleochannel it is a different fluvial cycle, younger than the western part [5].
Data obtained in exploration drillholes indicate the presence of mineralization, and promisinggeologic characteristics, in different sectors within an area of about 180 km2. All this taking intoaccount the Cerro Solo model. The favourable area is about 60% of the total, i.e. 110 km2.
Fig. 2 shows a schematic map of the deposition limits of the fluvial sediments, the locationof the Cerro Solo and these favourable sectors, which it is expected will increase the resources, bycarrying out drilling exploration programmes, based on the metallogenic and paleo-geomorphologicalpattern defined in the Cerro Solo deposit.
7. IDEAS ABOUT URANIUM FAVOURABILITY AND EXPLORATION OF THE SANJORGE GULF BASIN
The Central Region of the San Jorge Gulf Basin was the objective of exploration tasks from1959, which followed the anomalies discovered in the Chubut Group stratigraphic unit. Thisintracratonic basin covers a surface of 170 000 sq. km (about 68 000 sq. miles). It is located between
181

5&05Km
Cretaceous paleochannel, area of deposition.Volcanics environment underlyng. j OutcroppingReconnaissance sectorDevelopment sector
FIG. 2. Schematic map of the Cerro Solo deposit location and deposition limits of the fluvialsediments.
the North-Patagonic and the Deseado Massifs, separated due to the deformation produced by thecontinental drift. The basin has continuously subsided through normal faults, since the early Cretacic.The deposition of the continental Chubut Group occurred in this period [12]. At the same time animportant volcanic activity took place in the region of the present Andean Orogenic Belt, which islocated some hundred kilometres to the west of the central area of the basin. The pyroclastic rocksoriginated in this event were mentioned as uranium source in the region [13].
In wide areas of the basin, the cretaceous sedimentation began with high energy fluvialconglomerates and sandstones (Los Adobes Formation), filling the lows of a paleorelief scoured overthe underlying paleozoic and mesozoic formations. The fluvial system was later covered by thetuffaceous sediments transported from the west that represent perhaps 90% of the volume of thecretaceous column (Cerro Barcino Formation). At the top it presents a second fluvial systeminterbedded with tuffs and silstones (Puesto Manuel Arce Formation). The first two membersmentioned above reach an average depth of some hundred metres in some places. The third amaximum of some tens of metres. See summary of cretacic stratigraphic units in Fig. 3.
In the decade of 1960 a number of anomalies and ore deposits were discovered in the basin.This was a result of local aerial survey programmes (total gamma), carried out in the Chubut Group,basically to cover the fluvial members in the base and at the top. Two of them, small depositsbelonging to the Los Adobes Formation, were mined in the decade of 1970.
182

AGE LJTHOLOGYURANIUMMINERA-LIZATION
ORE DEPOSITS
33LA3OSECOPUERTO V1SER
CHACAYCURA
SIERRA CUADRADA
LAGUNACOLORADABARDAS COLORADASLAQUEBRADA
LOS ADOBESCERRO CONDORCERRO SOLO
\/ v Ny v Ny vV \/ V V N/ N/
v v v v v v vN / V V V V \ / V
V V V V V V V VV V V V V V V V
FIG. 3. Summary of cretacic stratigraphic units.
At that time, the exploration effort was concentrated in the Sierra de Pichifian District. Upto the present, about 110 000 m of exploration drillholes have been carried out in the region, allowingto find some deposits and favourable areas, as mentioned above. At the end of the 1980s, regionalgeological mapping tasks were performed in the continuity to the south of the fluvial system [14].Completing this program and a detailed analysis of the data is foreseen, trying to establish the locationof new areas that may have adequate conditions to extrapolate the Cerro Solo metallogenic model.
A 100 000 sq. km aerial radiometric survey performed in the basin, at the end of the decadeof 1970, allowed the detection of 2372 uranium anomalies [15]. An important number of thisanomalies was located in the medium and higher parts of the cretaceous stratigraphic unit.
183

PROVINCEOFCHUBUT
PROVINCE OFSANTA CRUZ
0 100,Km CHUGROU
Area ofdeposition.
421
(Partially from Fuente, A. and Matoberti, A.)
MAIM AREAS OF ANOMAL IPSPFPQgrr
CO.BAYOCUENCANORTECo. SOU)Co. CONDORLAGUNACOLORADALAPOTRANCAELMIRASOLNORTEELMIRASOLSUR 4fi-CHACAYCURAEA. LA MADRESELVASA.DELGUANACOLAQOSECOSA.CUADRADA NORTHSA.CUADRADASURCO.TACHO
16- CDON.GATO-KRUGERASSOC. WITH'GAUCHE"SANDSTONE TYPEVOUCANICTYPE
UPPER FLUVIALTUFFACEUSLOWER FLUVIALBASIN UMFT
FIG. 4. Map showing the known and the inferred development of the two fluvial and tuffaceoussystems of the Chubut Group.
Mineralogical studies carried out in tuffs and tuffltes of the Cerro Barcino Formation, indicatethat they liberated important quantities of uranium in the basin [5]. Part of it was transported throughthe fluvial members (made up of volcanic material) interbedded in the Chubut Group, and precipitatedwhere conditions were adequate. However, tuff horizons hosting uranium mineralization were alsofound. In this case, mineralization would be related to hydrothermal episodes occurred in the Tertiary[5]. The wide distribution of the volcanic formation, and evidences of uranium mineralization andmobilization, encourage to face research programmes on the different mineralization models whichare frequently related to this type of geologic environment.
184

Uranium occurrences are known in the upper fluvial member (Puesto Manuel Arce Formation)since the 1950s. In most of them exploration is in the reconnaissance phase. The Sierra Cuadradadeposit was explored with a shallow drillhole programme in 1978 [16]. Favourable geological featureswere observed in different areas where this formation outcrops, for instance, in the El Mirasol Nortey El Mirasol Sur occurrences, and some possible metallogenic models that seem to be applicable,were proposed.
Besides, in the east border of the basin, anomalies that correspond to carbonatic mineralizationin soils ("caliche"), evaporitic type, have been put in evidence. They are spread in great "spots" thatadd up to about 100 sq. kilometers. Yet, some anomalies are lying in tertiary fluvial sedimentation(Rio Chico Formation).
Fig. 4 represents a map that indicates the known and inferred development of the two fluvialand the tuffaceous systems of the Chubut Group. It also shows the position of the main deposits andgroup of anomalies. It is noted that the studies were concentrated on the central region of the Provinceof Chubut.
Evaluations of uranium favourability of the different geological environments in Argentina,have considered the San Jorge Gulf Basin in the higher level of priority. Such considerations arebased on the elements described above that have been reported in detail [17].
The authors consider that, at present, it is advisable to perform a detailed research programmeabout the favourability of the basin, in order to contribute to its exploration. It is clear that it isimportant to obtain data about the tuffaceous intermediate member and the upper fluvial member totry obtain knowledge on the same level, about the features of the three members of the ChubutGroup. This will be done taking into account the geological characteristics and the presence ofdeposits and anomalies in different areas. At the same time, it is convenient to improve knowledgeabout the mineralization models in the corresponding geological environments.
Finally, it is recommended that, considering the information about the presence of favourablelithology, attention be paid to the parts of the basin that were geologically recognized in anexpeditious way, or even not recognized and devoid of radiometric surveys.
The methodology proposed is as follows:
1) Recognition programme, Scale 1:500 000, in the regions with almost complete lack of theinformation that it is needed to be included in the following step.
2) Geological survey programme, Scale 1:100 000, using satellite image technology. Regionsof the basin to perform this stage will be selected based on their geologic characteristics.
3) Systematic survey of stratigraphical sections and geological features of interest, inrepresentative localities, to make the necessary characterizations and correlations.
4) Definition of the models of mineralization present in the different stratigraphical units, makingthe convenient research on the deposits selected as typical.
5) Global analysis of data, to define target sites for exploration and priorities.
ACKNOWLEDGEMENT
The authors want to thank Lie. D. Guzman for his help in preparing the text of this paper.
185

REFERENCES
[I] NAVARRA, P., "The Cerro Solo Project", New Developments in Uranium Exploration,Resources, Production and Demand, IAEA-TECDOC-650, IAEA, Vienna (1992) 147.
[2] HALUSKA, O., Plan de evaluacion ambiental, Proyecto Co. Solo. CNEA, Internal Report(1994) (in Spanish).
[3] OLSEN, H., BERIZZO, J., El potencial uranifero del Cretacico Continental en la PatagoniaExtrandina de la Republica Argentina, Uranium Evaluation and Mining Techniques,Proceedings Series, IAEA, Vienna (1980).
[4] BENITEZ, A., FUENTE, A., MALOBERTI, A., LANDI, V., BIANCHI, R.,MARVEGGIO, N., GAYONE, M., Evaluacion de la Mina Nuclear Cerro Solo, Prov. delChubut. Parte 1: Caracteristicas geologicas del yacimiento y de la cuenca, XII CongresoGeol6gico Argentino, Actas T.V (1993) 272-278 (in Spanish).
[5] MALOBERTI, A., Presencia de uranio en rocas volcaniclasticas cretacicas de la regidncentral de la Prov. del Chubut, Republica Argentina. Simposio sobre Recursos, Eventos yRitmos del Cretacico de America Latina, Asociacion Geol6gica Argentina (1989) (in Spanish).
[6] MARVEGGIO, N., O'CONNOR, E., Estudio estadistico del Miembro Arroyo del Pajarito,para el Sector C del Yacimiento Cerro Solo, Pcia. del Chubut. CNEA, Internal Report (1995)(in Spanish).
[7] MALOBERTI, A., Determinaciones mineralogicas en muestras provenientes de testigos deperforaciones del Yacimiento Cerro Solo. CNEA, Internal Report (1995) (in Spanish).
[8] BIANCHI, R., Analisis estructural, Yacimiento Co. Solo. CNEA, Internal Report (1995) (inSpanish).
[9] SARDIN, P., Approach to the resource estimation of the Cerro Solo uranium ore depositusing geoestatistical methods, Tech. Comm. Meeting, Computer Application in UraniumExploration and Production, IAEA (1994).
[10] BERIZZO, J., Los Adobes-Sierra de Pichinan — Bosquejo geologico, area de influencia,CNEA, Internal Report (1975) (in Spanish).
[II] BENITEZ, A., Resultados del control geologico. Yacimiento Co. Solo. Obra 01/85. CNEA,Internal Report (1987) (in Spanish).
[12] CHEBLI, G., NAKAYAMA, C., SCIUTTO, J., SERRAIOTTO, A., Estratigrafia del GrupoChubut en la regi6n central de la provincia homonima, Actas VI Congreso Geol6gicoArgentino, I (1976) 375-392 (in Spanish).
[13] RAMOS. V., El vulcanismo del Cretacico Inferior de la Cordillera Patagonica, Actas VIICongreso Geologico Argentino, I (1979) 423-435 (in Spanish).
[14] FUENTE, A., LANDI, V., TRIANA, P., Relevamiento geologico de las sedimentitascretacicas en el area comprendida entre Co. Condor y Est. La Bernarda, CNEA, InternalReport (1988) (in Spanish).
[15] SOLIS, R., MALLET, R., Informe final de la Obra 70 Ex. Prospeccion radimetrica aereade un irea de 100 000 km2, en las Provincias del Chubut y Santa Cruz, CNEA, InternalReport (1980) (in Spanish).
[16] VALDIVIEZO, A., FUENTE, A. Resultado de los trabajos realizados en el Distrito uraniferoSierra Cuadrada, CNEA, Internal Report (1979) (in Spanish).
[17] FUENTE, A., GAYONE, R., BIANCHI, R., MARVEGGIO, N., PAEZ, M., ChubutGroup, Cretaceous sedimentites, Unit XLVI, CNEA, Internal Report (1993) (in Spanish).
BIBLIOGRAPHY
GORUSTOVICH, S., BRODTKORB, M., BENITEZ, A., MALOBERTI, A., Los yacimientos dela paragenesis U-V-Cu del Cretacico de la Republica Argentina, UNESCO-IGCP (1992) (in Spanish).
NAVARRA, P., SARDIN, P., URQUIZA, L., BERNAL, G. Y GUZMAN LOBOS, D., Evaluacionde la Mina Nuclear Cerro Solo, Prov. del Chubut, Parte 2: Sobre los parametros economicos deldeposito, XII Congreso Geologico Argentino, Actas T.V (1993) 279-238 (in Spanish).
186

XA9745134NEW RESULTS OF THE EXPLORATIONFOR URANIUM ORES IN ROMANIA
C. BEJENARU, D. CIOLOBOCRare Metals Autonomous Regie,Bucharest, Romania
Abstract
The objective of the decentralization programmes of exploration activities for radioactive ores in Romaniais the creation of specific sub-units which act with predilection in the extension of the three uranium metallogenesisprovinces. As a positive result of this reorganization, new mineralizations of interest are identified presently in theHighis-Drocea Massif of the southern-western part of the Apuseni Mountains and in the eastern Banat at Mehadia,Svintija and Ilisova. The uranium mineralizations in the Highis-Drocea Massif occur in several forms of presentationof which the intragranitic (Milova type) and those localized within the metamorphites of the Paiuseni Series, have apractical importance. The intragranitic mineralization of the Milova type consisting of pechblende associated withsecondary minerals of the autunit-torbernit type, is controlled by the disjunctive tectonics (fractures, cataclasis andmylonitization zones). In addition to the uranium mineralizations in the same conditions there occur sporadically metalsulphides of Cu, Pb, Zn and Co. The mineralization of the P&useni type is represented by lentiliform bodies,concordants with schistosity within the grey or reddish grey quartzites, in which the mineral elements — pechblendeand chalcopyrite — occur as impregnation (disseminations). In the eastern part of the Banat, the hydrothermal uraniummineralizations are closely associated with quartziferous rhyolite of areas. At Mehadis, the mineralization representedby pechblende and parapechblende, associated with Cu and Zn sulphides, is controlled by a fractures system whicheffects the metamorphic formations of the Corbu Series. In the southern zone of the eastern Banat, at Svintita andIlisova, the uranium mineralization also hydrothermal, represented by pechblende and coffinit in association with themetal sulphides, is hosted in the joints systems within the quartziferous rhyolites and pyroclastical rocks. As aconsequence of the above mentioned, we can remark in the eastern Banat a new sub-province of uraniummetallogenesis clearly different from sedimentary deposits in the western Banat.
The programme to decentralize the exploration for radioactive ores in Romania, has a mainpurpose to sitting up some subunits, which should operate more efficiently for extending actual miningareas connected to known metallogenic provinces (Fig. 1). The positive results of this action arealready significant in the western part of the country, starting with the Highis-Drocea massif in northand in the Eastern Banat at Mehadia, Svinita and Ilisova. By the genetic nature and the geologicalconditions under which the explored uranium mineralizations are found in these areas, they canalready make up a new metallogenetic subprovince with specific features.
The uranium mineralizations in the Highis-Drocea massif appear in different presentations,but only the intragranitical (Milova type) and the perigranitical (Paiuseni type) veins forms placed ingranite and in the metamorphites of the Paiuseni series have practical importance (Fig. 2). The Milovatype mineralization is controlled by the disjunctive intragranite tectonics N-S oriented within theHighis-Drocea massif. This mineralization is represented by the primary uranium mineral pechblendeand by the secondary minerals of the autunite and torbernite type. The orebodies located along thefractures have a large development at level of areas with strong cataclazation and breccification of thegranitic rocks, where then can reach hundreds of metres in length, a thickness between 0.6-1.5 m,and contents varying between 0.03-1.50% U. Within these deposits, the uranium mineralizationaccompanied by polymetallic sulphides of Cu, Pb, Zn, Mo and Co, is hosted in a clayey gangue,impregnated by iron hydroxides. The associated polymetallic sulphide mineralization is devoid ofeconomic importance. Recently, in this area mineralized bodies are known and also, a great numberof radiometric anomalies, provide a good perspective to the area.
The Highis granite, which hosts these mineralizations has a massive texture, a hipidiomorphicgranular structure, rarely pegmatoid and a yellowish white or pinkish colour. The granites have anormal mineralogical composition, in which predominate (in the following order): potassic feldspar,plagioclase, quartz and biotite. The accessory minerals represented by zirconium, apatite and allanite
187

Western CarpathiansOonot mettatafnaEastern Corpoih/am
;' / URANIUM METALLOGENETIC PROVINCES
("WESTERN CARPATHIANS n BANAT MOUNTAINSDEPOSITS ORE DEPOSITS
TOCiudonovita11 Natra12 Dobrei Sud13 Dobrei NordMINERALIZATIONS
14 Ilisova15Mehadia
1 Baita Bihor2 Avram lancu3 RdnusaA Rachitele5 Budureaso
6 Paiuseni
MINERALIZATIONS7 Anesem8 Milova9 Conop
IIIESTERN CARPATHIANSORE DEPOSITS
16 Tulghes17 Crucea18 BotusanaMINERALIZATIONS
19 Bicazul Ardelean
20 Piriul Lesu21 Holdita22 Hojda
O Large deposits > 20.000 t metal
o Medium deposits 5000-20OOOt metal
o Small deposits < 20001 metal
o Ore deposits depletedi Ore deposits in explotation
6 Ore deposits in explorationo Mineralization in exploration
FIG. 1. Uranium in Romania.
188

1 Km 5Km
/rrrv'///-{'///«""^ !"<"'/,$s <"".-•&
^W'V*.,/''••^>->^
v'^''.X/.'^Xx.^PAlUStMl AREAr, c^uL//
'' S Z—^.Z-*-""
LEGEND
la^ " KnlTRlAS'C [J . ^| Conglomerotw and sandstones
PERMIAN |^'^/4 Argillaceous schists
PROTEROZOIC { ^^ Metomorphit rocks
|*V**j RhyollteJl Jllllllll J- lX
I *, * \ Gabbro- diorile
&ranitt
areat
FIG. 2. Hlghis-Drocea geologial map.
189

0 50O 1OOO 1500 m
MEHADIA
L E G E N Dj.=i Jurassic
Permian 3|.Sandstones and argillaceous beds
[;•:. . j Permian 2
RToF] Permian 4 Conglomerate
-Z—rJj Metamorphites. Corbu series.
|x » *J Ouartziferous rhyolite
The hercynic granite of Sfardinu
Major Fault.
Uranium mineralization
190
FIG. 3. Geological map of the Mehadia area.
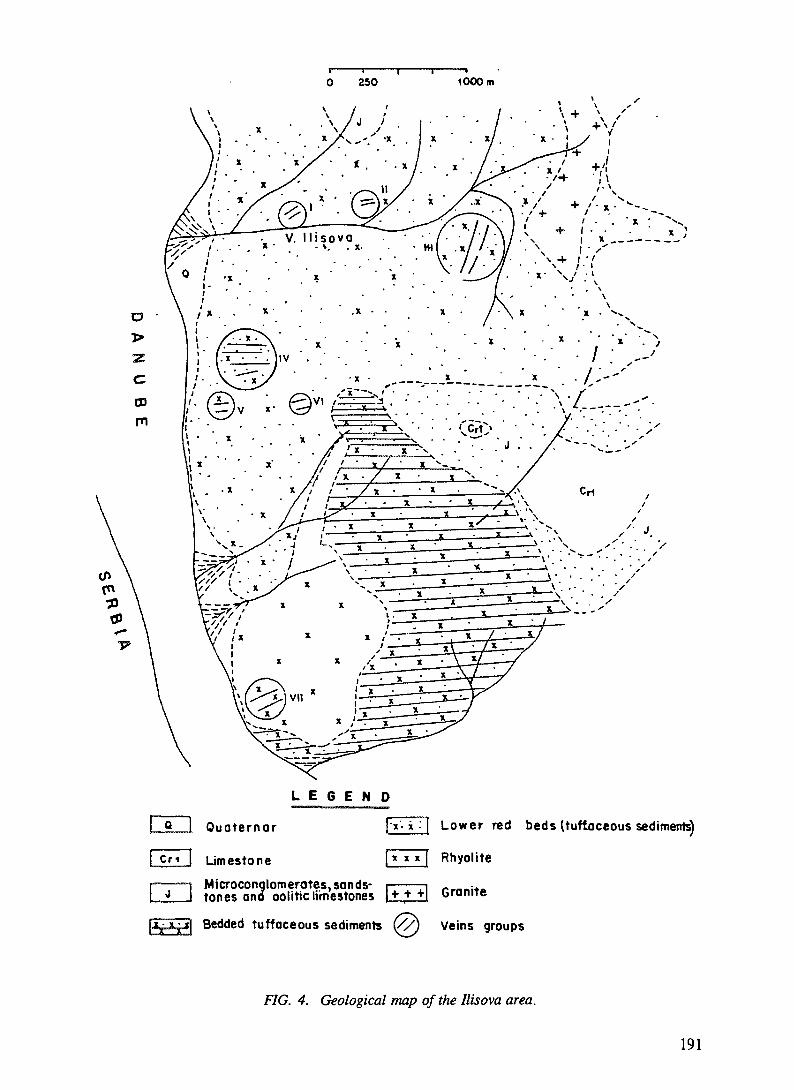
250 1000m
L E G E N D
Quoternar
Limestone
Microconqlomerates, sands-tones ana oolitic limestones
Ijxj x •' | Lower red beds (tuftaceous sediments)
[ x x x j Rhyolite
+ +] Granite
Bedded tuffaceous sediments (//) Veins groups
FIG. 4. Geological map of the Ilisova area.
191

are in a reduced proportion. Within the contact zone of the granitic body with metamorphicformations a large halo of hornfels develops.
The mineralization of the Paiuseni type, represented by pechblende and chalcopyriteimpregnations is usually located at the leval of the gray quartzite, which are adjacent to the fractureswithin the inferior complex of the Paiuseni metamorphic series. The mentioned metamorphic complex,petrographically is composed by chlorito-sericite schists, quartzo-felspathic schists quartzites, basicand acidic metatuffs. These weakly metamorphosed formations are influenced by an older disjunctivetectonics and a newer one N-S oriented, which allowed the access of the mineralization solutions. Atthe level of the grey quartzite, the uranium mineralization is accompanied by the products of someintense albitization, carbonatation, sericitization and chloritization processes. In both zones, theuranium mineralization as well as associated metal sulphides is considered hydrothermal. Taking inplace of these mineralizations appear to be in the Laramian phase of the Alpine orogenesis.
At Mehadia, the uraniferous mineralization represented by pechblende and parapechblende,accompanied by metal sulphides of Cu and Zn, is also controlled by N-S oriented, fracture systemswith dips between 55-60° towards east. On these fractures (Fig. 3) located at the metamorphic contactof the Corbu series with the granites and the Permian sedimentary formations one can recognize theeffects of some hydrothermal solutions which generated intense processes of chloritization,sericitization and silicification.
The uraniferous mineralization transported by these solutions was deposited in the supportfissures of the main faults or in the cataclazation and breccification areas which were more developedwithin these faults. In all researched cases the primary uranium mineralization is represented bypechblende in the form of spherolites which offer incorporate corroded pyrite grains, or veinlets nearthe metallic sulphures. The secondary uranium minerals formed by pechblende alteration is theautunite, which forms crusts or flaky aggregates of yellowish colour. The Corbu metamorphite series,in which are located the uranium mineralization, belong to the green schists facies and arepetrographically made up of chlorito-sericitic schists, compact phyllite and quartzite with graphite.The Permian sedimentary formations overlying discordantly those metamorphites, and they develop,vertically as two overlapping beds; lower conglomeratic and upper argillaceus sandstone beds.
In the southern area at Ilisova (Fig. 4) a hydrothermal uranium mineralization is located inthe E-W oriented fracture systems, which are situated in the lower Permian red beds and inquartziferous rhyolite. The fault systems which host the uranium mineralization aggregates, formingseveral vein fields (Fig. 4). Within these veins the primary uranium mineral is pechblende, placedin the vein rilling as ribbons 3-5 cm thick, veinlets and pockets, in which the mineral has a reniformor colomorph aspect. In all cases the uranium mineralization is associated with finegrained pyrite,disseminated or placed in pockets. Sporadically also appear metal sulphides of Cu, Pb, Bi or Zn.Among the secondary uranium minerals one can recognize the autunite and the zippeite. The veinfilling which also represents the gangue of this mineralization is made up of clayey minerals,carbonates and quartz. In the fracture systems, the mineralized areas appear as an elongated lens,which can be over a 100 m and have a thickness of 0.8-1.0 m. The lower red beds, which hostprevalent these mineralizations, lithological is composed by microconglomerate, red sandstone withcalcareus concretions and several interlayers of red or grey rhyolite flows.
In the upper stratigraphical position the stratified pyroclastite level is made up of a thick pileof volcanic tuffs and breccias. The pyroclastite rocks bed also include levels (flows) from thequartziferous red, grey or violet rhyelites.
In conclusion, it was mentioned that, in the western part of Romania besides of knownuranium deposits of the sandstone type in exploitation, a new metallogenetical area has beendiscovered in which the hydrothermal uranium presents vein forms. The mineralized veins areintragranitic, in genetical relationships with the Highis granite in Highis-Drocea massif, andperigranitic in the metasediments and pyroclastic rocks in other zones.
192
XA9745135THE STRAZ BLOCK ISL PROJECT — CASE HISTORY
V. BENES, J. SLEZAKDIAMO s.p.,Straz pod RalskemCzech Republic
Abstract
The ISL project on the Straz deposit, located about 90 km north of Prague, the capital of the CzechRepublic, is the only commercial in situ leaching plant, that has been operated in the Czech Republic. The facilitybegan its first industrial production at the end of 1969, some 5 years after the discovery of the sandstone-hosteduranium deposits in the northern part of the Bohemian Cretaceous basin. The orebodies lie 180 to 280 m below thesurface, depending on its configuration. The orebodies are situated in the lower part of Cenomanian sediments — inbrackish sediments, and especially in marine sandstones. At present, the leaching fields have the area of about 650ha (6.5 km2). Some of these fields were closed, wells decommissioned and surface is being reclaimed. Because ofthe technological properties of uranium ores and host rocks, the leaching is very slow. Therefore some leaching fieldshave been in production for more than 25 years and they still produce industrial amounts of uranium. The plants wereconstructed for the capacity of 30 to 40 mVminute (400 to 650 litres per second). The highest annual production wasmore than 800 tonnes. The total amount of produced uranium was 15 000 tonnes between 1968 and 1994.
1 INTRODUCTION
The Straz in situ uranium mine is located in the northbohemian part of the BohemianCretaceous Basin. These uranium ore deposits were discovered in the early 1960s. The explorationhas focussed on the most promising part, the Straz block.
There are eight deposits situated in the Straz block — the Krizany, Brevniste, Hamr, Osecna-Kotel, Holicky, Straz, Mimon and Hvezdov deposits. The Hamr and Straz deposits are the biggestin the area with about 50% of all resources.
The exploitation development began in the second half of the 1960s. The newly discovereddeposits were considered the most prospective uranium source in former Czechoslovakia, and theyshould have replaced the production from classical deep-mined deposits, such as Pribram, Rozna,Zadni Chodov etc.
Because of a false strategy in uranium production development (classical deep mine next toISL fields) and other external influences, the uranium production is becoming more expensive anddeclining in this newest production area in the Czech Republic.
2. GEOLOGY
The Straz block is a geological unit, bordered by faults. The north-eastern border is createdby the Lusatian fault, which separates it from crystalline rocks of the Jested mountains complex oflower Paleosoic and upper Proterozoic age. The south-eastern border is formed by a belt of Tertiaryvolcanic dykes called "Devil's Walls". The Cretaceous sedimentation is changing its facialdevelopment in this direction. The Straz fault creates the north-western border of the Straz blockand separates it from the sunken Tlustec block lying in the north-west. The last, south-western borderis created by complicated south-eastern continuation of the Ceska Lipa fault zone. Geologicalconditions of Cretaceous sedimentation do not change into this direction.
193

The deposits in the area of the Straz block belong to the sandstone-tabular type uraniumdeposits. They are hosted in the basal part of the Upper Cretaceous sedimentary complex. It isoverlying crystalline rocks of Proterozoic and Lower Paleozoic age with some depressions in theirpaleorelief filled by Carboniferous and Permian sediments.
This Cretaceous sedimentation began with fluvial, fluvio-lacustrine and other fresh watersediments of lower Cenomanian. This sedimentation continued in "wash-out" horizon, which liesbetween the freshwater and marine sediments. Marine sediments of the upper Cenomanian consistsof two main parts — the lower one is called friable sandstones and the upper one fucoid sandstones.Ore is associated with freshwater, mostly argillaceous sediments and especially with the lower partof cenomanian marine sandy sediments. The whole thickness of the orebodies sometimes exceedsmore than 10 metres, however, the average is about 6-8 m. The depth of deposits is given by theirposition in the Straz block — from about 130 metres ha the north-eastern part to about 250 metresin the south-western part. The whole area is influenced by saxon tectonics and Tertiary volcanism.
2.1. The Straz deposit
2.1.1. Lithostratigraphy
Proterozoic
The complex of Proterozoic rocks is developed in the nortwestern part of the deposit. It isformed by grey sericitic phyllites and granitoids.
Paleozoic
Paleozoic rocks on the deposit are formed by sediments of Ordovician, Silurian, Devonianand Permo-Carboniferous. Ordovician rocks are formed by quartzy phyllites (with content of quartzhigher than 50%) and sericitic quartzites. Silurian rocks are formed by so called "variegated series"— graphitic phyllites, sericitic-chloritic phyllites, chloritic phyllites, carbonatic phyllites and quartzyphyllites. Devonian rocks are formed by sericitic phyllites with layers of slightly metamorphosedlimestones. Permo-Carboniferous rocks are formed by red sandy-clayey siltstones, melaphyres andquartzy porphyries.
Mesozoic
Mesozoic sediments on the deposit are represented by upper Cretaceous.
Upper Cretaceous
Upper Cretaceous sediments belong to the Lusatian facial area and are formed by sedimentsof Cenomanian and Turonian. Their thickness varies between 150 m in the north-east and 270 m inthe south. The whole complex of proterozoic, paleozoic and mesozoic sediments is penetrated byultrabasic rock dykes of Tertiary age.
2.1.2. Tectonics
Platform sediments in the area are penetrated by many fissures and faults. They create fourmain systems: NE-SW, NW-SE, submeridional (N-S) and subequatorial (W-E).
194

2.1.3. The shape of orebodies
Orebodies were formed in the shape of lentils and flat flags. The shape is influenced bylithological homogeneity of rock environment:
volume and character of reduction agent dispersion,thickness of horizon,intensity of layer oxidation and the form of redox barrier.
3. HYDROGEOLOGY
Hydrogeological relations are very complicated in the Straz block. Two aquifers aredeveloped in the upper cretaceous sedimentary complex. The lower cenomanian aquifer has anartesian water level and the upper Turonian aquifer has a free surface water level. Separation of theseboth aquifers can be defined as semiconfining bed — the aquiclude.
3.1. Cenomanian confined aquifer
This aquifer is formed by semipervious freshwater sandy siltstones and silty sandstones oflower Cenomanian and marine sandstones (friable sandstones) and silty sandstones with fucoidaltexture (fucoid sandstones) of upper Cenomanian.
3.2. Middle Turonian aquifer
This aquifer is separated by lower Turonian aquiclude, which is formed by marlstones, muddylimestones and marly siltstones. It is formed by middle and upper Turonian marine sandy-marlysilstones, marly sandstones and sandstones.
4. THE HISTORY OF URANIUM PRODUCTION
The Straz block deposits were discovered by structural borehole HT-I in 1963. The Strazdeposit proper was discovered by geological — exploration borehole profile XXX063 in 1967. Thehistory of uranium production began immediately after its discovery.
In 1967, the first leaching test field (VP-1) started its operation. It was situated on the Hamrdeposit. The alcaline lixiviant (sodium carbonate) was applied during the test and it did not givesufficient results At present, we can mention, that it could not have been successful because of:
very primitive conditions given to this test,low experience with this leaching technology andorientation on sulfuric acid leaching technology used in the Soviet Union.
Leaching test field VP-2 was drilled near the new shaft of the Hamr mine and before it startedit had practically no groundwater level for its operation because of the drainage of the sunken shaft.Afterwards the decision to remove the future leaching test fields farther from the deep mine area wasmade.
Leaching test field VP-3 was the first one situated in the middle of the Straz deposit. It wasdrilled in the form of two hexagonal cells with 16 m long side and one well in the centre. It was thefirst leaching test, which gave the first real uranium production from ISL technology. The first tankof concentrate was sent for its processing to the MAPE Mydlovary uranium mill on December 13,
195
1967. It was the real beginning of semi-commercial uranium production using of ISL. Afterwards thisleaching test field was extended to 9 ha under a new name VP-4.
Leaching test field VP-5 was situated on the Hamr deposit again. It should have ensured thepossibility of leaching in the freshwater low permeable sediment in the lowest part of the Cenomaniansediments. The test with strong sulfuric acid (over 200 g/1) was also executed.
The last leaching test field was also performed on the Hamr deposit and it was named VP-6.It has the area over 30 ha. Because this field was situated in the close neighbourhood of the Hamrdeep mine there ware many problems in its production and it also influenced the deep mining areaby acidic solutions. Many corrective actions were done but they were not sufficient enough.
In 1971, after the government's decision about future uranium production in the nortbohemianarea, the fast development of ISL fields and production started in the industrial scale. The area ofleaching fields increased very fast, especially after the flooding of the Hamr mine in 1972. The areaincreased as follows:
1970 -1975 -1980 —1985 -1990 -1993 -
9 ha208 ha305 ha440 ha600 ha650 ha
Cumulative production was as follows:
1970 - 5011975 - 240011980 - 630011985 - 990011990 - 1330011995 — 152001
Unfortunately this development was done without any consideration to the environment, whichwill influence the future restoration procedure.
7. SPECIAL TECHNOLOGICAL REGIME APPLIED DURING 1992-1994
After the government's decision in 1992, the special technological regime for ISL plants wasapplied. Solution circulation was decreased to the minimum to protect ISL area surroundings. It alsoallowed for time for the evaluation of the present situation in consideration to the future productionor remediation beginning. During this period the acidity of solutions was kept on the necessary levelto avoid the back precipitation of dissolved solids in the layer (orebody). During that time extensiveresearch work was carried out and its results were summarized in the detailed report called "AnalysisofISL-m".
8. RESTORATION PROJECT
Over the years the acid solutions and leaching products has spread into a large volume ofunderground water and it is necessary to clean this contaminated water in the case of the end ofuranium production.
196

The main task of the Straz deposit restoration is to solve the ISL technology environmentalimpacts on the cretaceous aquifers.
Wide laboratory research, geological and geophysical exploration were carried out in theframe of this solving. New mathematical models have been developed for the evaluation of hydraulicand hydrochemical situation of the deposit and for the restoration process economical evaluation, too.This work led to the determination of starting conditions for the restoration project:
a) The contamination of the cenomanian aquifer
Volume of contaminated water: 186 mil. m3, area 24 km2
Main contaminants: SO42: 3 792 000 t, (out of which 948 000 t free H2SO4)
NH4+: 91 400 t
Al: 413 000 tU: lOOOt
Total amount of TDS: 4 800 000 t
b) The contamination of the turonian aquifer
Volume of contaminated water: ca. 80 mil.m3, area 7.5 km2.Main contaminants: SO42: 22 0001
NH4+: 1300t
Total amount of TDS: ca. 25 000 t
c) risk of the dispersion of contamination to the larger area and to the higher volume ofunderground water,
d) risk of the next contamination of the turonian aquifer, that is the source of drinking water.
The targets of the deposit restoration are as follows:
to decrease the contents of dissolved solids in cenomanian water gradually to theenvironmental limit. The research results show that the safe concentration of TDS should beabout 3 g.r1;
to decrease the contents of dissolved solids in turonian water gradually to the quality givenby the Czech water standards. It means practically to the pre-operational baseline.
8.1. The cenomanian aquifer restoration
is planned in two steps. The first one is to achieve the hydraulic underbalance in very shorttime and to obtain full control on underground contaminated solution. During this step it is necessary:
to control the ISL process not to achieve the precipitation of solids in orebody,to prepare the well pattern for new system of pumping and injection,to remove uranium from solutions all the time,to start the evaporation station operation (first stage of desalination plant),to inject the concentrate from evaporators back to the central part of deposit.
The second step is to start with the removal of solids from the underground. This period willinclude:
the construction of the second stage of desalination plant (for the treatment of the Stage Iproducts),
197

the controlled pumping of solution in order to use the full capacity of treatment plant for 7-10 years,
checking and control of changes in underground solution composition — the construction ofmembrane technology units and their operation.
8.2. The restoration of turonian aquifer
will be performed by combining three methods:
a) Injection of contaminated water to the hydraulic barrier;
b) Pumping of the most contaminated water to the membrane technology plant. The projectedstart of operation is in 1996 and capacity 2 m3/min.
c) Discharge of low contaminated water to the river. This method will be used only during thefinal phase of restoration.
8.3. Desalination Plant Stage 1
In February 1994, DIAMO awarded RCCI contract to clean up the acidic solutions and toproduce a pure salt product using a system of evaporators, crystallizers and recrystallizers. Thesystem will treat 6.5 mVmin of acid solution, recovering 5.5 nrVmin of clean water for discharge tonearby river and 1.0 m3/min of concentrated solutions. The start of operation is assumed in April1996. This technology will produce two main products after crystallization and recrystallization ofsalts from the concentrate:
1. The crystals of ammonia alum, NH4A1(SO4)2.12 H2O. The assumed production will be about250 0001 per year for the first 8-10 years of operation, it will be until 2008. The productionwill decline (3-5% per year) after that year.
2. The crystallization filtrate of alum (the so-called mother liquor). The assumed production willbe about 250 000 m3 per year. The composition of this solution will change very slightly inthe first 10 years of operation. A moderate fall down of individual components concentrationis expected during following years. Most of components from the original solution andpractically all of radionuclides will be concentrated in this mother liquor.
8.4. Desalination Plant Stage II
The products of the Stage I are practically wastes if it is not further treated and it is necessaryto solve their treatment into commercial products or into products, which can be safely deposited inthe environment.
The large research programme for solving the problem connected with the underground waterdesalination is realized in DIAMO at present. The first results show the possible ways for the Stage Iproducts treatment
There are three technologies (or their combination) for decomposition of ammonia alum:
1. The calcination of ammonium aluminum sulfate to A1203 in one or two steps, to produceA12(SO4)3 at first and A12O3 afterwards.
198

2. Hydrolytic decomposition of ammonium aluminum sulfate to ammonium alunitNH4A13(OH)6(SO4)2 and the calcination of ammonium alunit to A12O3.
3. The decomposition of ammonium aluminum sulfate by means of ammonia under atmosphericconditions with production of A1(OH)3 and calcination to AI2O3 afterwards.
The possible commercial products of these technologies are:
A12O3, about 30 000 t per year, orA12(SO4)3, about 100 000 t per year, andH2SO4 (produced from pyrolytic gases), 100-150 000 t per year.
The treatment of concentrate has to have the main goal to minimize the amount of solid wastesfor their deposition. The possible solving is in 3 or 4 stages thickening with crystallization andseparation of solids. The solid wastes will be solidified or vitrified before deposition. The liquid restwill be dried and solids will be calcinated afterwards. Gases from thermal processes can be used forsulfuric acid production.
The projected start for Desalination Plant Stage II operation will be in 2000.
BIBLIOGRAPHY
BENES V., "In Situ Leaching of Uranium in Northern Bohemia", Uranium In Situ Leaching,IAEA-TECDOC-720, IAEA, Vienna (1992) 55.
FIEDLER J., SLEZAK J., "Experience with the Coexistence of Classical Deep Mining and In-situLeaching of Uranium in Northern Bohemia", Uranium In Situ Leaching, IAEA-TECDOC-720, IAEA,Vienna (1992)115.
&3iXT PASIEIS)left
199

XA9745136SHORT GEOLOGICAL DESCRIPTION OF THEINKAI URANIUM DEPOSIT IN SOUTH KAZAKSTAN
A.A. ABAKUMOV, V.P. ZHELNOVNational Joint Stock Company of
Atomic Energy and Industry "KATEP",Almaty, Kazakstan
Abstract
The Inkai deposit is located in the territory of the Suzakski region of South Kazakhstan, at 160 km from therailroad station Kzyl-Orda, at the south-western part of Chu-Saryssu uranium ore province. The Chu-Saryssuiskayadepression presents an artesian basin which was formed by water-bearing complexes of upper chalk and of Paleocene-Eocene. During the neotectonic stage of the later Oligocene-Quaternary period, the artesian basin was developedmainly in infiltration regime, this fact led to comprehensive developing of stratum oxidation zones, the boundariesof which are forming regional fronts systems in ore-enclosing complexes horizons. Industrial uranium mineralizationis linked with boundaries of stratum oxidation zones in water-bearing horizons (from lower Turonian to middleEocene ones). The most significant industrial objectives are: in Paleocene sediments — deposits: Uvanas, Kanzhugan,Moinkum; in chalk sediments — Mynkuduk, Zhalpak and the deposit discovered in recent years — Inkai.
1. GEOLOGICAL FEATURES OF THE DEPOSITInkai is the largest deposit among the discovered uranium objectives of the province of Chu-
Saryssuiskaya. Ore-enclosing rocks at the deposit are represented by small-average grade sands andgravel-shingle sediments of Mynkudukski (K2t:) and Inkudukski (Kjtj-st) horizons.
The main feature of pinching out of stratum oxidation zone in ore-enclosing horizons is itsdeveloping layer by layer which is controlled by faced-geochemical conditions that, in their turn,determine the stage structure of the mineralization.
On the map, ore deposits have the form of long bands stretching for tenth kilometers. In thecross-section ore deposits have the form of rolls with different combinations of upper, lower wingsand of "bag" part.
2. STRATIGRAPHY
In the vertical section of the deposit region one can choose the following:
1) Folded basement formed by dislocated Proterozoic and early Paleozoic formations;
2) Intermediate structural stage formed by lithified sedimentary rocks of middle and upperPaleozoic;
3) Platform blanket represented by Mesozoic-Cenozoic rocks involved industrial uraniummineralization.
3. URANIUM MINERALIZATION
The mam ore-controlling factor at the deposit is connection of mineralization with theboundaries of stratum oxidation regional zones.
201

3.1. Lithological faded and geochemical description of ore-bearing horizons
Ore-bearing horizons are Mynkudukski (K2t,) and Inkuduksku (K2t2-st) ones. Mynkudukskihorizons represent the alluvial cycle of the first turn where one can choose several elementary cycleswith thicknesses from 1-2 metres to several metres, each of these cycles is beginning with rather hard-grade rocks and finishing with fine-grade ones. Accumulation of Inkudukski horizon rocks occurredunder the condition of tectonic movement that led to the renewing of surface relief. The rocks aremainly large and hard fragmental weakly sorbed sediments, often move in the section.
3.2. Morphological types of ore deposits
Ore deposits move to the stratum oxidation zone boundary pinching out spatially andmorphologically. Each of the deposits is located within one ore-bearing horizon. Deposits coasist ofmain roll with strongly marked bag parts and wings and there are also comprehensive developed linksof bag-wing elements of the orebody, the thickness of which is approaching 20-25 metres.
3.3. Substantial composition of ores
Inkai deposit uranium mineralization is developed in all lithological differences of later chalkrocks. Macroscopically mineralized sediments do not differ from barren ones. Uranium mineralizationis represented by nasturan (82%) and coffinite (18%).
3.4. Description of ore-controlling epigenetic zonality
The stratum oxidation zone is divided into the subzone of completed oxidation and thesubzone of inside-stratified oxidation.
The recovery zone is contiguous with stratum oxidated rocks and represents a chemicalbarrier, uranium and other accompanying elements are being accumulated on which. The zone ofunaltered rocks does not differ visually from unoxidated ore rocks and is characterized by usualmineral composition and by natural grey and grey-green colours.
4. GENESIS OF THE DEPOSIT
The Inkai uranium deposit is referred to the group of deposits of exogeneous genesis. Its oresare spatially and genetically linked with the boundary of oxidated and recovered friable water-permeable rocks.
Large scales of ore formations are stipulated by significant thickness, high permeability of oreenclosing horizons, firmness of composition. Accumulation of uranium at the recovering barrier hasoccurred in many stages during a long time.
202
XA9745137THE EXPLORATION OF URANIUM DEPOSITSOF UKRAINE BY THE ISL METHOD
A.Ch. BAKARJIEV, N.N. MAKARENKOSGE Kirovgeology,Kiev, Ukraine
Abstract
The geological and hydrogeological conditions of uranium deposits within the Tertiary coal-clay-sandsediments in the paleodepressions of the Ukrainian shield have been investigated for mining by ISL method. All ofthe natural indexes for determining the efficiency of using ISL technology are appraised. All deposits of this type canbe divided into three groups.
The region of the Ukrainian shield is one of the largest uranium provinces of the world. Themain prospected uranium resources are represented by deposits in albitites within early Proterozoiccrystal basement. In addition, significant uranium resources are concentrated in middle- and small-sized deposits of low-grade uranium ores in Tertiary rocks of sediment cover (Devladovsky type), aswell as in zones of fissured crushed granite-gneisses (Michailovsky type). These two types can beexploited by ISL method because of low quality of ores and very difficult hydro-geological andtechnical conditions for conventional mining.
The deposits of Devladovsky type are located in depressions in the crystalline basement (i.e.paleochannels and paleovalleys) at a depth of to 80-100 metre (m). The relief of basement surfaceis eroded and characterized by old (Tertiary) river valleys. These valleys comprise about 80% of theterritory of the Ukrainian shield. The paleodepressions are of erosional-tectonic origin. Their arealdistribution is controlled by tectonics and petrographical structure of the crystalline rocks. As a rule,modern river systems commonly inherit paleodepressions. All of the known uranium deposits arelocated on slopes of modern plateaus near watersheds of the second and third orders.
The uranium deposits are located in productive water-bearing horizons formed by alternatingof sedimentary coal bearing rocks which have very different lithological and grain-size characteristics.The productive horizons, with a thickness of 1-2 m to 20-30 m is bouded above and below byimpermeable rock units. The lower impermeable unit is a Mesozoic weathering crust of the crystallingrocks. The overlying waterproof consists of Paleogene clays and rocks of mixed lithologic (sand-coal-clay) structure). The thickness of counting units within the limits of deposits changes from 1 m to10-12 m. The position of ore bodies and their morphology are controlled by development of zonesof ground-bedd oxidation of the sedimentary rocks (Fig. 4).
The ore bodies extend in plan along the paleochannel or alongside the paleodepression. Thewidth of the zones range from 50-14 m. thickness. The producting ore bearing zone, as a rule, rangesfrom one sixth to one third of the mineralized zone. The average uranium content in the oreintersections average is 0.015-0.03%.
Four main lithological-mineralogical types of uranium ores are identified in these deposits:
1. Sand is the main type.It is represented by quartz, sometimes quartz-glauconite and quartz-feldspar-glauconiteminerals. The sands include coaly and clay particles.
2. Clays.This mineral is predominantly of kaolonite structure. It contains a significant quantity of coalymaterial.
203

3. Ores of mixed coaly-clay-sand structure.
4. Brown coals.They occur as thin beds interbedded between rocks and ores of other types. The Coal consistsof coalified organic material with impurities of sand and clayey material.
All uranium deposits of the Devladovsky type contain little carbonate material but a largequantity of coaly material. They can be leached using sulfuric acid solutions (1-1.5%).
The geological structure and hydro-geological conditions of the Devladovsky type depositsare very uniform. They defined by the following characteristics:
two-layer structure of rocks section;
absorption of uranium ores on Tertiary coaly sediments with different grain-size structure;their distribution is controlled by paleovalleys and paleochannels eroded in crystallinebasement;
supply of the productive horizon by atmospheric oxygen-bearing precipitations forminguranium bodies;
position of low-grade uranium ores in endocontact of zone of ground-bed oxidation (i.e. rollfront) in permeable sedimentary rocks within the limits of productive horizon bordered byimpermeable rock units;
single layer distribution of ores in section in the form of ribbon showed zones of significantsizes with a depth of up to 100 m from the present surface;
uniform lithological types and structures of ores, composition of cement and contents ofadmixtures in ores (coaly material, sulphides, carbonates).
At present 12 uranium deposits and prospective occurencies have been identified. Two ofthem have been completely and successfully mined out using by ISL method (Devladovskoye andBratskoye). The uranium resources of these deposits have been concelled from the national inventory.Within the third deposit (Safonovskoye), only one ore body was cancelled.
The investigation of the deposits is conducted using standard methods and techniques. It isdone in the following manner:
drilling on a network of 200-100 m x 100-50 m;core testing, for geotechnological evaluation researches;gamma and electric logging of wells;evaluation of required solution quantity in hydro-geological and geotechnological wells;experimental filtration activities in hydro-geological wells.
With reference to uranium recovery by ISL method based on a majority of natural factorsuranium deposits of Ukraine are rather similar. However, a series of factors is present and depositsare distinguished as follows:
1. geological structure;2. amout of uranium resources determined by the areal sizes of ore bodies;3. grain-size of ores and country rocks including the quantity of clay and coaly material;4. relationship between permeability of uranium bearing rocks and country rocks;5. vertical filtration heterogeneity of the productive horizon;6. regime of underground waters;
204

7. chemistry and quality of underground waters;8. geo-engineering conditions.
Uranium deposits of Devladovsky type are controlled by two characteristics of one geologicalstructure: paleovalley. One is the slope of the paleovalley and the other one is paleochannels. Theore bodies are classified as middle- and small-sized. Most of the deposits are conturn uraniumresources of between 1000 5000 t U.
The main distinctive features of uranium deposits of the Devladovsky type are the very highvariability of grain-size and the quantity of coaly material in ores and country rocks. Thecharacteristic feature of all uranium deposits of the Devladovsky type is the high permeability of oresin comparison with permeability of country rocks. According to this attribute all deposits can bedivided into two groups. For one group this parameter is less than 2.0; for the other group it is morethan 2.0. The first group of deposits is more suitable for uranium extraction by the ISL method.
Based on comparison of all identified uranium deposits of the Devladovsky type accordingto the natural characteristics with reference to exploitation by ISL separate them into two groups:
1. Group A contains deposits with better characteristics for ISL mining:
Devladovsky deposit,Chervonoyarskoye deposit,Safonovskoye deposit.
2. Group B contains deposits with middle-grade characteristics for ISL mining:
Bratskoye deposit,Novoguryevskoye deposit,Surskoye deposit.
During exploration and investigation of uranium deposits a series of new methodicalapproaches were developed:
1. The classification of uranium bearing sediments of the central part of Donets basin isdeveloped according to grain-size and quantity of coaly material.
2. The distinctive attributes for ISL method exploitation are defined, and the deposits are dividedinto 2 groups.
3. The classification of sands of the productive horizon of Safonovskoye deposit is developed.
4. On the basis of results of using the ISL method in the limits of three deposits the significanceof vertical filtration heterogeneity of productive ore-bearing horizon (Figs 9 and 10) isappreciated.
5. We have made the lithological-technological typification of uranium ores for the first time.Four types and four subtypes are allocated (Figs 11 and 12).
6. For prognostic determination of the ISL method efficiency in the limits of uranium depositsof the Devladovsky type we have also developed the principles of determination of ore qualityand the principles of geotechnological dividing of deposits into districts (ore bodies, blocks),based on analysis of such attributes as:
a) uranium content of the horizon;b) share of the first grade ore in section of the productive horizon;
205

c) linear ore-bearing factor (ratio of ore thickness to total thickness of productive water-bearinghorizon);
d) adducted uranium contents;e) geochemical condition;f) permeability of productive horizon;g) availability of subbalance ores in productive horizon;h) nature of vertical filtration heterogeneity of productive horizon.
206

XA9745138RADIOMETRIC MAP OF THE CZECH REPUBLICAND URANIUM MINERALIZATION
M. MATOLINFaculty of Science,Charles University,Prague, Czech Republic
Abstract
Intensive U exploration and radiometric mapping in the Czech Republic in past decades yielded numerousradiometric data. The whole area of the Czech Republic has been covered by airborne radiometric measurement whatformed the database for the compilation of the map of the terrestrial radiation. 122 regional ground gamma rayspectrometry profiles were measured and used for the back calibration of the digitized map and its conversion intothe gamma dose rate units. The regional radioactivity of rocks of the territory is in the range 6-245 nGy.h"1 and islinked with the U mineralization of the Bohemian Massif.
1. GEOLOGY OF THE CZECH REPUBLICThe territory of the Czech Republic, of the area of 78 863 km2 is formed by two regional
geological units. The Bohemian Massif, a part of the European Variscan system, built up by thebasement of Proterozoic crystalline and Prevariscan Paleozoic rocks and the platform cover, formsthe majority of the territory. The Western Carpathians, with rocks of Alpine development, occurs inits eastern part. Magmatic, sedimentary and metamorphic rocks of Proterozoic to Quaternary age withcomplicated structural-tectonic setting correspond to the paleographic development of the territory.
2. RADIOMETRIC MEASUREMENT OF THE CZECH REPUBLIC
Uranium exploration and radiometric mapping in the Czech Republic in past decades produceddata describing the radioactivity of rocks of the whole territory and formed the base for thecompilation of the radiometric map of the country.
Regional airborne gamma total count measurement of the whole former Czechoslovakia wasperformed by Geofyzika Brno with the analogue airborne radiometric instrument ASGM-25 fitted upwith GM tubes, with flight mines separation 2 km, at the flight height of 100 m, hi the period1957-1959. The equipment was calibrated by means of a Ra-226 point source and the results of thesurface rock radioactivity were expressed in units of the surface rate (/*R/h). The maps of profiles [1]and contour lines [2,3] on the scale 1:200 000 and 1:500 000 were compiled.
Detailed airborne gamma total count measurements were carried out by means of airborneanalogue instruments ASGM-25 and ARS-2 with scintillation counter of 1006 cm3 NaI(Tl volume hiindividual regions of interest, with flight lines separation 250 m, at the flight height of 80 m, in theperiod 1960-1971. The instruments were calibrated by Ra-226 point source and the constructed mapsof contours on scales of 1:25 000 and 1: 50 000 were expressed in exposure rate. The detailed totalcount measurement covered most of the territory of the Czech Republic.
Detailed airborne gamma ray spectrometry with the digital, spectrum stabilized airbornespectrometers DiGRS 3001 of 14 800 cm3 Nal(Tl) volume, and alter GR-800D of 33 600 cm3 Nal(Tl)volume, were used for the survey in regions of interest with flight lines separation 250 m, and at aflight height of 80 m from 1976 onward, and 50% of the area of the Czech Republic was covered.The instruments were calibrated by flights over natural calibration strips. Results are the maps ofcontours of gamma dose rate and K, U, Th ground concentration in rocks on scales of 1:25 000 and1:50000.
207

A car-borne total count survey with the analogue Ra-69 ratemeter fitted up with GM tubes,and with the digital scintillation DiGRS-2000 car-borne gamma ray spectrometer, was conducted inthe U potential areas in the sixties. A ground gamma survey with portable total count instruments andportable gamma ray spectrometers were applied on a wide scale. Laboratory radiometric analyses ofmore than 7000 rock samples from the region of the Czech Republic completed information on theregional radioactivity of rocks.
Calibration facilities for the portable and airborne gamma ray spectrometers, built in theCzech Republic in 1975 [4], checked by the intercomparison measurement in 1992 [5], and the useof IAEA geological reference materials for laboratory gamma ray spectrometry, manufactured by theIAEA in 1987, were important technical means for the consistency of radiometric data.
3. COMPILATION OF THE RADIOMETRIC MAP OF THE CZECH REPUBLIC AND ITSBACK CALIBRATION
A uniform database for the compilation of the radiometric map of the Czech Republic wasthe map of contours of the exposure rate of regional airborne measurement of Czechoslovakia1957-1959, carried out by means of one instrument and a uniform method within a relatively shortperiod of time, which was completed using the detailed successive airborne and ground total countand gamma ray spectrometry measurement of the country.
With respect to the initially used (1957-1959) airborne instrument ASGM-25, detectionefficiency of its GM tubes and the way of equipment calibration by means of Ra-226 point source,the resultant reported values of the exposure rate G*R/h) should be considered for relative data. Themain reason is the difference in energy gamma ray spectra of Ra-266 calibration source and of rockradiation in the geometry of the field measurement, and the respective instrument count rate response[6,7]. Back calibration was applied to level the radiometric map of the Czech Republic [8].
Portable gamma ray spectrometer GS-256 of the Faculty of Science, Charles University,calibrated at the calibration facilities in Bratkovice near Pribram (Czech Republic) and inLangenlebara (Austria), and checked by comparison measurement with the GR-256 spectrometer ofthe Geological Survey of Canada, calibrated in Canada, in Berlin in 1992, was used for the backcalibration. A possibility to convert the ground gamma ray spectrometric data into gamma air doserate was further verified by means of pressurized ionization chamber Reuter-Stockes, similarly as wasperformed in Switzerland [9]. In 1994, 79 regional profiles of a length of 1-5 km, evenly distributedover the area of the Czech Republic, situated in low, medium and highly radioactive regional rockunits, were measured by portable GS-256 gamma ray spectrometer and concentrations of K, U andTh in rocks were determined (Fig. 1). In addition to that, similar data from 43 regional gamma rayspectrometry profiles, quoted in Uranium Survey reports, were used too. The data on K, U, Thconcentrations were recalculated into gamma air dose rate at the height of 1 m above the earth'ssurface [10]. Regression analysis between the air dose rate data, determined by ground gamma rayspectrometry, and the data of the airborne map derived the multiplication correction constant 0.85 forthe airborne map data (Fig. 2).
The exposure rate airborne map of contours, on the scale 1:200 000, has been converted tovector form by digitizing in the Czech Geological Survey, Prague, in 1994, and expressed by 871 652data in regular grid 300 x 300 m over the territory. Digitized data were recalculated to gammaabsorbed dose rate (nGy.h"1), using the relation 1 /*R/h = 8.69 nGy.h1, and the multiplicationcorrection constant 0.85 was applied. A new terrestrial gamma dose rate map of contours of theCzech Republic, on the scale 1:500 000, was compiled by computer processing with the step ofcontours 10 nGy.h"1 in 1995. A simplified radiometric map is shown in Fig. 3 [11].
208
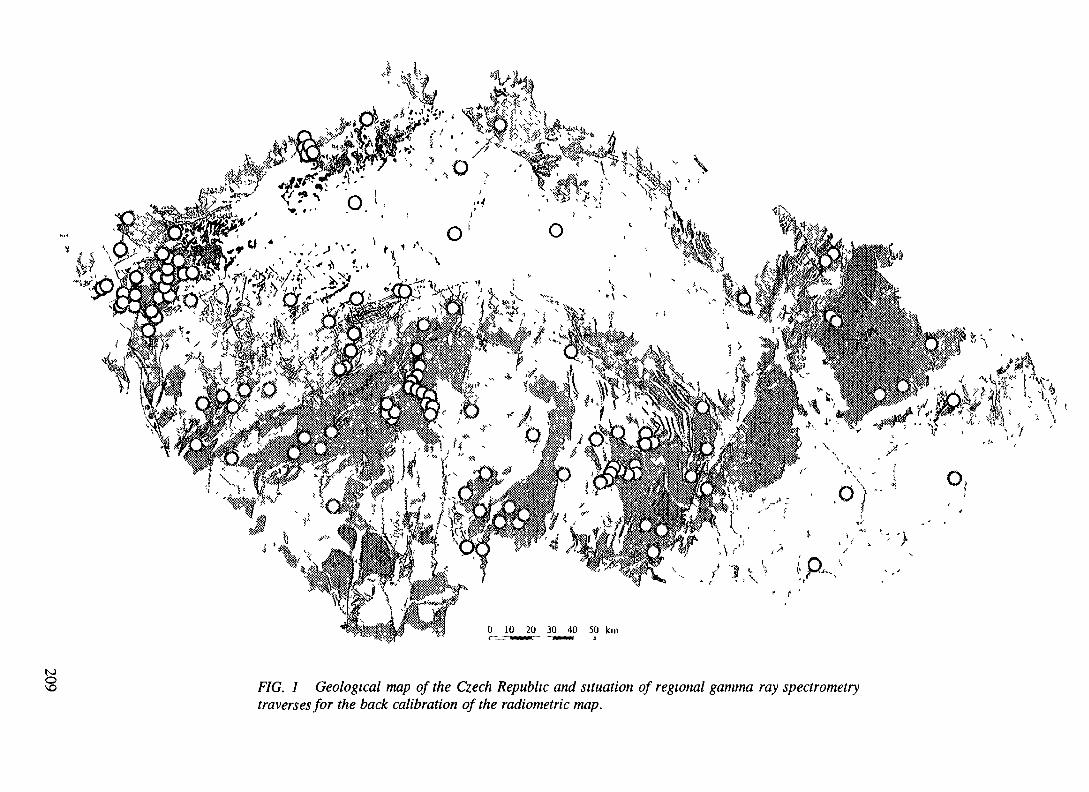
A ;^-
. .•«1|:
0 10 20 30 40 50 km
F/G. 7 Geological map of the Czech Republic and situation of regional gamma ray spectrometrytraverses for the back calibration of the radiometric map.

too
Da(GS = 0.864 Da(TC) - 3.113
80 90 100 110 120 130 140 150 160 170 180 190 ZOO 210 220DafTC) (nGy/h)
FIG. 2. Regression between gamma dose rate determined by ground gamma ray spectrometry (GS)and airborne total count (TC) measurement.

F/G. 3. Mop o/ terrestrial gamma dose rate of the Czech Republic.

4. REGIONAL RADIOACTIVITY
Regional radioactivity of rocks of the area of the Czech Republic is in the range of6-245 nGy.h'', with the mean 65.6 ± 19.0 nGy.h"1. In comparison to the estimation of the globalmean 55 nGy.h"1 [12] and other collected data on the terrestrial radioactivity of various countries [13]it illustrated the above average potential of natural radioactivity elements in rocks, namely in theBohemian Massif.
5. URANIUM MINERALIZATION AND REGIONAL RADIOACTIVITY OF ROCKS
The Variscan tectogenesis had fundamental significance for the U accumulation in theBohemian Massif. The endogenous U mineralization corresponds to late-Variscan (265 ± 15 Ma) andKimmerian (185 ±15, 150 ±20 MA) periods, the exogenous mineralization is considered to be ofUpper-Cretaceous-Miocene age. The study of spatial distribution of numerous U accumulations in theBohemian Massif shows the general link with deep seated faults of the earth's crust and significantrelation to acid Variscan plutonic bodies. Approximately 17 000 radiometric anomalies and objectsof U mineralization were located by the Czechoslovak Uranium Industry in the past. They occurmostly in regions of increased regional radioactivity of magmatic and crystalline rocks. The majorityof U mineral bodies was discovered in the exocontact areas of Variscan magmatites or the link withthe nearby granitoids can be presumed.
REFERENCES[I] CENTRAL GEOLOGICAL OFFICE, INSTITUTE OF APPLIED GEOPHYSICS,
Aeroradiometric map of the CSSR 1:200 000 (map of profiles), UUG, Prague (1965) (inCzech).
[2] MATOLIN, M., Interpretation of the aeroradiometric map of the CSSR 1:200 000 (I. Stage— Bohemian Massif), Rep. UGF Brno, F. of Sc., Prague (1967) (in Czech).
[3] MATOLIN, M., Interpretation of the aeroradiometric map of the CSSR 1:200 000 (II. Stage— Western Carpathians), Rep. UGF Brno, F. of Sc., Prague (1973) (in Czech).
[4] ROJKO, R., ZEMAN, J., STANFJC, M., Construction of calibration facility for field gammaray spectrometers, Rep. GP CSUP, Liberec (1975) (in Czech).
[5] MATOLIN, M., KASPAR, J., PROKOP, P., Investigation of radon risk of the geologicalbasement of the CR. Rep., F. of Sc., Prague (1992) (in Czech).
[6] MATOLIN, M.. New procedures in geophysical radiometric investigation of the naturalenvironment, DrSc. thesis, F. of Sc., Prague (1989) (in Czech).
[7] MATOLIN. M . DEDACEK, K., The cause of differences in the maps of total gamma rayactivity of rocks, AUC-Geologica, 4 Charles University, Prague (1984) 371-383.
[8] INTERNATIONAL ATOMIC ENERGY AGENCY, The use of gamma ray data to definethe natural radiation environment, IAEA-TECDOC-566, Vienna (1990).
[9] RYBACH. L., SCHWARZ, G., Ground gamma radiation maps: processing of airborne,laboratory and in situ spectrometry data, First Brake, Vol. 13, 3 (1995) 97-104.
[10] INTERNATIONAL ATOMIC ENERGY AGENCY, Construction and use of calibrationfacilities for radiometric field equipment, Technical Reports Series No. 309, IAEA, Vienna(1989).
[II] MANOVA, M., MATOLIN, M., Radiometric map of the Czech Republic 1:500 000, CzechGeol. Surv., Prague (1995).
[12] UNSCEAR, Exposures from natural sources of radiation, Proc. of the 37th session ofUNSCEAR, Vienna, 6-7 June 1988, Annex A, UN A/AC 82/R 466.
[13] ANDJELOV, M., TOMSIC, T., PECNK, M., "Ground gamma ray spectrometry inSlovenia", paper presented at the IAEA Technical Committee Meeting on Use of UraniumExploration Data and Techniques in Environmental Studies, Vienna 1993.
212
XA9745139
THORIUM DEPOSITS IN THE COMMONWEALTH OF INDEPENDENTSTATES AND THEIR PROSPECTIVE CHARACTERISTICS
V.M. KOTOVA, J.I. SKOROVAROVAll-Russian Research Institute of Chemical Technology,Moscow, Russian Federation
Abstract
Since 1956, the Ail-Russian Research Institute of Chemical Technology has been engaged in the researchof assessing thorium deposits and ore occurrences, as well as developing its production technology from various oretypes. From the known CIS thorium and thorium-bearing deposits and occurrences (2500) only 241 sites have theirresources estimated. They include 132 monazite placers of the Quaternary age, 6 complex Quaternary deposits ofplacer type (4 polarite, 1 uranium-thorianite and 1 thorium-platinum placers), 66 endogenous deposits and occurrencesand 38 complex ones (including zircon-ilmenite Tertiary and older buried placers). This paper gives a summary ofthe author's attempt to classify thorium deposits according to their genetic types. The proposed classification schemeis based on formational principles and integrates geological-tectonic, magmatic and other criterions. The depositswhich are located in igneous, metamorphic and sedimentary rocks are further observed according to their geologicalsetting and types of mother rocks. Thorium deposits are known in the numerous metallogenetic provinces of the CIS.
1. INTRODUCTION
Large scale thorium-oriented geological explorations and surveys were conducted in the SovietUnion in 1946-1951. The accent was made on monazite Quaternary placers, since during those yearsas well as nowadays the main source of thorium is monazite. During that period, 132 monazite placerdeposits were found and explored. In most cases they were small sediments of continental type.Genetically they vary from alluvial, proluvial, cone evacuation, beach, bar, delta and other placers.
The main regions of continental placers development are the regional fields of monazite-bearing granites — the major source of heavy accessory minerals. They are the Aldan and Ukrainiancrystalline shields, the Transbaikalian, some regions of the Urals. Presently the placers have nopractical significance due to the very low contents of monazite hi the sands (O.n kg.m3) and theirsmall size.
Since 1951 no special exploration for thorium has been undertaken. As a rule, thorium wasregarded as a useful component in complex deposits. However, the State Committee on Resourcesdid not show any interest in its reserves. There are practically no developed commercial deposits ofthis metal. Up to the recent moment it has been recovered as a by-product from the ores of a fewcomplex ore deposits. Presently, they are the loparite deposit of Lovoserskoe (the Kola Peninsula)and the uranium-phosphorus deposit of Zaosernoe (Kazakhstan).
In comparison with uranium and many rare metals, the knowledge of thorium available in theCIS territories is rather small. However, there has been some information accumulated from varioussources such as:
large-scale geological, geophysical, technological research on uranium ores with evaluationof thorium contents,
information on contents, geochemistry, mineralogy of thorium in the complex ores of depositsbearing thorium in rare metals and rare earths;some topical studies on geochemistry of radioactive elements, geological formations,radio-geochemical mapping, etc.
213

Since 1956, the All-Russian Research Institute of Chemical Technology has been engaged incomprehensive activities directed to evaluation of the potential mineral base for thorium, determininggenetic and commercial deposit types, developing processing technologies for thorium-bearing oresand recovering thorium from them.
Potential thorium regions have been determined. A one-to-ten-million scaled map has beencompiled for thorium-bearing areas of the CIS. According to the metallogenic analysis of the map,there are three types of metallogenic structures:
(1) three belts of endogenic and exogenetic thorium mineralization (the Kola-Urals-NorthKazakhstan, the Ukraine-South Thian Shan, the Baikal-Okhotsk coast);
(2) eight provinces (the Ukrainian, Kola, Kokchetavsk, the Yenisei-Sajany, the Sajano Tuva-Mongolian, the North Thian Shan, the North Baikal, Aldan);
(3) nine zones of endogenic and 8 basins of exogenetic accumulation of thorium.
Of the 2500 thorium and thorium-containing deposits and ore manifestations determined byus in the CIS territories, the reserves and resources have been calculated for 241 entities. They are132 monazite Quaternary placers, 6 complex Quaternary deposits of placer type (4 loparite placers,one uranium-thorianite, one thorite-platinum), 66 endogenic deposits and manifestations and 38complex Tertiary monazite-zircon-ilmenite and more ancient buried placers.
On the whole, the reserves evaluation was presented by authors' work.
The prognosticated reserves of thorium in the CIS are assessed to be 1 700 000 tonnes byJanuary 1, 1995. The predominant portion (86.7%) is presented in endogenic complex, generallypolymetal deposits of sometimes large and even unique size. As a rule, the thorium content in the oresrarely exceeds 0.01-0.1%. The 0.1-2% and richer ores comprise about 4.4% in the present CISreserves balance.
Uranium deposits bearing off-grade and poor thorium ores comprise 3.1% in the reservesbalance. In the complex buried placers, the thorium resources comprise 5.8%.
We suggested a formation-genetic classification for the CIS thorium deposits and oremanifestation. The general formation analysis of the deposits takes into account their genesispeculiarities. The consecutive selection of formations corresponds to the genetic sequence of thethorium accumulation processes.
The term "ore formation" means a group of deposits and ore manifestations with similargenesis possessing stable association of commercially valuable elements and major ore and ore-forming minerals. Ore formations are singled out according to their relation to geological formations.As a rule, the thorium ore formations are complex considering the set of elements.
Altogether, there have been eight ore formations singled out (see Table I). Regarding theirrelation to geological formations, they are subdivided into four groups. The first group comprises thealkaline and ultra-basic alkaline sodium derivatives of abyssal (subcrustal) centers. They are agpaiticnepheline-syenites, ultra-basic alkaline rocks with carbonatites and other ore metasomatites.
The second group are high-temperature metasomatic sodium and potassium formations relatedto alkaline syenites, alkaline and sub-alkaline granitoids and metamorphogenic rocks. The source ofsubstance for this group is mainly crustal. They are characterized by a quartz-feldspar compositioncontaining microcline and micas of the biotite group in potassium metasomatites and albite andalkaline amphiboles and micas — in sodium metasomatites.
214

TABLE I. CLASSIFICATION OF THORIUM ORE FORMATIONS
c3a331
E
N
D
0
G
E
N
I
C
Group
2
I.
Magma-
alkaline
formations
of abissal
origin
Ore formations
3
1 . Thorium-rare earthin agpaitic nepheline-syenite and m soma-tites
2. Thorium-rare earth-rare metal in carbona-tites and other metasomatites
Mineral ore types
4
1. Loparite
2.Lovozerit-eudialyte
3. Pyrocil ore-thorite
4.Rinkolite-3ov-Ghorrite
1. GatchettoJJte
2. Thorite-bastaaesite
3. Titano-magneti-te-perovskite
4. Gatchettolite-baddeleyte-magnetite
Useful elements
major /secondary
5/6
Ta,TR/Nb,Th,TiSr
Zr,TR/Th,Sr
Ta,Th/Nb
TR/Th
Nb,Ta/th,P,U
TR,Th/P.Ta, Mb
Ti.TR/Th
Fe.Zr/Ta^.Th
Mean Thcontent
in ore, %
7
0.02
0.01
0.1
0.01-0.05
0.02-0.05
0.02-0.5
0.01
0.08-0.1( to 0.2)
Geologic-techtinicposition
8
InTMAzoneson shield
InTMAzoneson shieldand itsfringes
Geologicage
9
UpperPaleozoic
UpperProtero-zoic-Me-sozoic
Geologicforma-tions
10
Nepheli-ne-syenite
agpaitic
.
Ultra-basic al-kalinerockswith
carbona-tites
Comroer-cia]
viability
11
Limited
Feasiblewith
recoveryas by-
product
Example
12
WorkedLovoserskdeposit
Kiey,Blosimen
skoe,Tomtor
and otha
K)

1E
N
D
O
G
E
N
I
C
E
N
D
O
G
E
N
I
C
2
II.
Metasoma-
tic
alkaline
incrustal
formations
III.Acid
hydrother-m litesboundwith
incrustalalkaline
rocks
33. Thorium-rare earth-uranium in pegma-toids
4. Thorium-rare metalin sodium quartz-feld-spar metasomatites
5. Thorium-phosphor-us-uranium in eusi-tes
6. Thorium-rare earthin acid hydrother-malites
41. Thorite-xenoti-
me-monadte
1. Thorium-zircon-pyrochlore
2. Zircon-thorite-columbite
3. Thorite-malaco-ne-priorite-fergu-sonlte
4. Thorite-phenak-ite-bertrandite
(genth helvine)
Thorite-fluarine-apatite-pitdbblende
t . Xenotime-thorite
2. Monazjte-colum-bite-xenotime-thorpit
3. Brannerite-tho-rite-urajiinite
4. Monaate-thori-te-xenotime-bas-tnaesite
5. Thorite
5/6TR,Th/ZrfU
TajNn>,ZrrTh/TR
Ta(Nb,ZrfTh/TR
TR.Th/Zr^Jb.TaU
Be/Th,TR,Zr,Zn
U,P(Th/-
TR,Th/U
TR,Th/Nb,Ta
U/Th
TR,nh(Pb/Zn
Th/-
70.02-0.2
(tol)
0.02-0.1(to 0.7)0.02-0.1(to 0.4)
0.02-0.05(to o.5)
0.02-0.3(to 1.0)
0.02-0.1(tO 0.2)
0.2-0.8(to 3.0)0.2-0.5(to 1.0)
0.04-0.02
0.03-0.05(to 0.5)
0.1-04
8In TMAzones andpro-toactiva-ticm ofshields
TMAzones ofearlycon-solida-tion(medianmassives,etc)
TMAzones ofmedianmassifs
Blocks ofTMA ro-nes of ea-rly consolidation
9MiddleUpperProtero-zoic,Paleozoic
UpperProtero-zoic, Me-sozoic
MiddlePaleozoic
MiddlePaleozoic-Mesozo-ic
10Migmati-te-granitemetamor-phogenic
andplutono-
geoic
Alkalineand sub-alkalinegranito-
ids, alka-line syen-ites, alka-line met-am orphiccomplex
Alkalinecomplex
Alkalineand sub-alkalinegranito-
ids, alka-line syen-ites, alka-line vol-
canogeniccomplex
11Not
profitab-le
The mostfeasibleforma-tion
Viabilityis notclear
Ratherpromis-
ing
12Deposits ofKalinovskoeLosovatskoeand others
Deposits ofUlug-Tan-sek, Katu-ginsk, etc.
Workeddeposit ofZaosernoe
Chesten,Prjamoy,
Akrt,Kutesai,Aktjus,
Oktj abr-skoe, etc.

0
8 *
.A
o,-S
53*
| .9!U
oi-sg-i,
CO
•^ o<§d
f&£ErfH\3
1
I- *|1*
6 I
I 1111CD
'
fg§
35
3•r
T> !_Jg e fcrC
O
§
§)
o w
z
w
217

The third group of ore formations are acid high- and medium-temperature hydrotherrnolitesrelated, as a rule, to geological formations of higher alkalinity. Their forms are manifested as veins,stockworks, metasomatites.
The most important feature of the third group is the thorium-rare earth mineralizationcharacter with the formation of thorium minerals.
The fourth group is represented by terrigeno-clastic (dislocated or residual) both ancient andmodern formations. They include weathered crusts of kaolin, bauxite, ferroxide-clayey composition,placers of both continental and coastal marine genesis, ancient lithified sedimentary strata. Themechanism of these formation genesis is one and the same and is related to the enrichment of bothresidual and transported material by minerals which are resistant to physical and chemical weathering.
The groups of ore formations are combined in accordance with their relation to geologicalentities of various material origin as follows:
(1) the first group — from subcrustal center;
(2) the second and third groups — from the crustal material differentiated in the direction ofrising alkalinity;
(3) the fourth group — originated from exogenetic sedimentary differentiation of material.
The most characteristic representatives of deposits are to be considered below.
2. DEPOSIT OF LOVOSERSK
The deposit is related to the Lovosersk massif of Hercynian agpaitic nepheline-syenite. It haddeveloped under platformic conditions of the Baltic shield, and is situated in a thick tectonic zonedeposited in the stratum of Archean rocks.
The massif is laccolithic in form. The plan area is 660 km2. Its formation took four phasesof intrusive activity. The first phase: rocks of the poikilitic nepheline-syenite complex, the second:those of the loparite-bearing differentiated complex (77% of the studied massif volume), the third:rocks of the eudialytic lujaurites, the fourth: alkaline dykes of various composition.
The deposit ores are ones from the second phase rocks. They form a stratum of rhythmicallyalternating beds of urtites-lujaurites-foyaites. The beds slightly dip to the massif center. Thedifferentiation degree of the complex is very high; monomineral nepheline rocks unites were singledout. The agpaitic coefficient of the rocks of the complex comprises 1.25.
The ore mineral is loparite. Its content throughout the ore horizons varies from 0.48 to0.72%. The most loparite-bearing minerals are unites, juvites, malignites. The maximalmineralization generally occurs at the lower boundary of the layers.
The thickness of the differentiated complex averages 1500 m. There have been 200 layers ofrock singled out, and 30 of them contain large quantities of loparite. Eleven horizons bear commercialquantities of loparite.
The orebodies form relatively thin sills well persistent along the dip and strike. Thecommercial concentrations of loparite are related to rich nephelines and melanocratic rock facies. Themajor rock-forming minerals are feldspars, nepheline, sodalite, aegirine, arfvedsonite. The secondaryare alkaline amphibole, villiaumite, apatite, ilmenite, eudialyte, murmanite, sphene, lamprophyllite,rinkolite, etc.
218
The ores contain 4.6-5.4% of loparite, 0.39-1.04% of thorium dioxide in loparite,0.020-0.027% of thorium in the ores. The deposit produces loparite as a complex mineral. Atechnology for concomitant recovery of thorium is available.
3. DEPOSIT OF KIEV
The deposit is located in the region of the Yenisei massif belonging to the Kiey massif ofultra-basic alkaline rocks and carbonatites. The massif area of 18 km2 is irregular in shape and in itspresent erosion cross section reveals a set of alkaline series rocks: ijolite-melteigites, nepheline andalkaline syenites, veined alkaline rocks. This complex of rock has well developed carbonatites.
The orebody (native ores) presents a zone of the most carbonatized rocks 2.5 km long and300-400 m wide. It is a carbonate ore stockwork formed with feldspars (microcline), carbonates-siderite, rarely with calcite and dolomite. The ores are rare earths and enriched with thorium.Thorium are bonded by metaloparite, thorite and thorianite. The main rare earth mineral isbastnaesite. The average thorium content in the native ores is 0.043%.
The native rocks are overlain with the weathering crust of Upper Triassic and Jurassic ages.The thickness of the weathering crust is from 10-15 to 60-70 m. The weathering crust of orecarbonatitic stockwork presents certain commercial interest. Its composition is as follows: 27-30%of goethite-hydrogoethite, 34-36% of iron hydroxides mixed with clay minerals, 28-30% offerri-halloysite, 6.0% of fluorite. There are present quartz, magnetite, microcline, apatite, zircon,perovskite, thorianite, thorite, loparite, pyrochlore, rutile, sphene, monazite, parisite, weinschenkite(churchite), etc.
The major rare earth minerals are parisite, rhabdophanite. Thorium both occurs in the rareearth minerals and forms its own minerals — thorite, thorianite.
The weathering crust contains 0.22-0.4% of thorium.
4. ULUG-TANSEK DEPOSIT
The deposit is situated in the south-eastern region of Tuva within the limits of the Sangilenskmedian mass. It is related to the intrusion of sub-alkaline syenites of absolute age of 260-265 millionyears. The massif is stock-like formed and takes up an area of 0.9 km2. The intrusive rocks areoverlain with the developed granitelike metasomatites (qualmites) of albite-quartz-microclinecomposition with riebekite. lithium micas and rare metal minerals.
The entire massif is a single orebody. The rare metal mineralization is presented bypyrochlore, columbite, malacon. ferri-thorite. Thorium occurs in pyrochlore, columbite, malacon andferri-thorite, but more than 10% of the element is related to ferri-thorite, the content of which in theores is 0.12-0.19%.
The ores are stockwork-disseminated. The highest contents of the useful components are heldin zinnwaldite facies. A rich thorium mineralization is located in the central part of the massif. Theaverage content of thorium in the massif rocks is 0.084%, in the zinnwaldite facies 0.13%.
The deposit is unique in its thorium mineralization extent.
5. NORTH BAIKALIAN ORE FIELD (DEPOSITS OF PRJAMOY, CHESTEN, AKIT)
The ore field is known to have over 50 less studied deposits and ore manifestations of
219

thorium. The ore region is confined to the joint of the Siberia platform with its southern folded fringe.It is situated in a strong long-lived zone of tectono-magmatic activation. Sub-alkaline and alkalinegranites, granosyenites, alkaline and nepheline syenites of Lower Paleozoic and Lower Mesozoic agesare developed there.
The orebodies are vein-shaped and of complicated structure containing a complex of ore andvein minerals. The ores contain quartz, microcline, fluorite, barite, carbonates. The major oreminerals are thorite, xenotime. Sometimes they form large bimineral veined bodies (Prjamoy deposit)containing a few per cents of rare earths and thorium.
The Baikal-Amur Railway passes through the southern part of the ore region, which makesit quite promising.
In conclusion, regarding thorium, the most perspective for the nearest future of the CIScountries are loparite-bearing agpaitic nepheline syenites, zirconium-thorium-phosphorus-uraniuniformation in eusites and carbonate metasomatites.
Later on, for a more distant future, it would be possible to involve into production thedeposits of thorium-rare metals-rare earths formation in the weathering crusts of carbonatites,thorium-rare metals in quartz-feldspar (sodium) metasomatites, rare earths-thorium hydrothermolites.
The future of complex monazite placers containing thorium, situated in the CIS countries, hasnot been considered yet.
220

XA9745140
URANIUM RECOVERY FROM PHOSPHONTTRIC SOLUTIONS
F.T. BUNUS, I. MIUChimenerg,Craiova, Romania
Abstract
A new technology for uranium and rare earth recovery applied in a semi-industrial plant processing 5 m3/hphosphoric acid has been extended to phosphonitric solution, resulting in the process of nitric acid attack of phosphaterock for complex fertilizer production. In this process uranium and rare earths are obtained at larger quantities dueto the complete dissolution of elements involved. The method is based on a one cycle extraction-stripping processusing as extractants: di(2-ethylhexyl) phosphate (DEPA) in mixture either with tri-n-butylphosphate (TBP) or tri-n-octylphosphine oxide (TOPO) in view of obtaining a synergic effect for U (VI). A mixer-settler extractor in four stepswas used. Two stripping steps are involved for the elements mentioned. Before uranium stripping a scrubbing withurea was introduced to eliminate nitric acid extracted. Uranium was obtained as green cake (hydrated uraniumtetrafluoride) which can be easily transformed in hexafluoride or converted to a diuranate. At the same time theradium is also eliminated leading to a non-radioactive fertilizer product.
1. INTRODUCTION
Uranium recovery from phosphoric acid was carried out in the USA, using a two-cycleextraction-stripping method developed by ORNL [1,2], and applied at industrial scale in the USA,Belgium and Taiwan.
A one-cycle extraction-stripping process was successfully developed in Romania [3] andapplied in a large pilot plant processing 5 m3/h phosphoric acid. Three industrial units were built onthis technology.
In the Rumanian process the uranium product is different from the one based on the ORNLmethod, and the result is a uranium tetrafluoride compound which can be easily transformed touranium hexafluoride of high purity. Uranium is produced at $25/kg U.
In the Rumanian process rare earth elements (REE) are also extracted resulting in an yttriumconcentrate [4].
Until now no uranium recovery process from a phosphonitric (PN) solution has been carriedout except for the one described in this paper.
Worldwide there are 80-100 plants processing phosphates of sedimentary origin with anaverage uranium content of 0.014% U, i.e. approx. 120 t/year recoverable uranium. The rare earthelement content is approx. ten times higher, i.e. 1200 t/year (sedimentary phosphates). At KemiraOy (Finland) REEs were extracted from PN solution [5] but uranium is neglected.
In this process both uranium and REES are extracted, the last one being more important thanin the case of phosphoric acid obtained by sulfuric acid attack [4]. Due to the present unfavourableuranium market, REEs recovery might be an incentive.
In the experimental work carried out in our laboratory it was established that in all casesuranium and REEs are completely dissolved in nitric acid attack of phosphate rock [6]. At the sametime uranium decay products like ^Ra are also dissolved.
221

At present, the fertilizers resulted from phosphates are radioactive. They contain up to100 mg/kg uranium and also 20-40 pCi/g ^Ra, It must be noted that natural materials (concrete,bricks etc.) have 0.7-2 pCi/g^Ra [7] or Kola fertilizer 2-4 p
2. DESCRIPTION OF THE PROCESS
Uranium and rare earth extraction. Radium elimination. PN solutions are taken from thefertilizer plant obtained by nitric acid attack of phosphate rock. No organic matter is present in thePN solution (different from sulfuric acid attack) because only calcinated phosphates are used. Thisis an important simplification, and important savings are obtained.
The PN solution used for the solvent extraction process is the one resulting from the fertilizerproduction process after calcium nitrate separation obtained by cooling. Uranium and REEs are notaffected by calcium nitrate crystallization, being left in soluble form in the PN solution. ^Ra is alsofound dissolved in the PN solution.
Uranium is always present in hexavalent state due to HNO2 (oxidant catalyst) existent in thePN solution which is a mixture of phosphoric and nitric acids.
After calcium nitrate separation the PN solution still has 4% solids. Therefore the PN solutionmust be clarified otherwise the solids hinder the extraction process. At this stage ^Ra can beeliminated introducing Ba++ and SO4
2 (as Na2SO4). Radium is coprecipitated 80% on BaSO4 andcarried in the next stage with the flocculant at the same time with solids.
ISRAEL ROCKLQmg/kg POLIAS 30
4 5 5 7TIME HRS
FIG. 1. Clarification process.
222

3 ••
D
1.0
0.8 •
\0.6
0.5
o.i. ••
0.3 ••
0.2
0.1 02 O.I. 0.8 ———«-
DEPA mol/I
agueous phase 4 mol // Wj PO^ and 2,4 mot/1 W/VOj
FIG. 2. Uranium extraction with DEPA.
223

70
9
2 I 6
5
2
0.1
0.7M TOPO
O.L 0.8
DEPA mo/// » 0.1 mot // TOPOagueous phase 4/no/// Wj POt. »2.4/no/ //
FIG. 3. Uranium extraction with DEPA+0.1 mol/TOPO
224

The clarification process is carried out using a polyacryl amidic flocculant efficient between5-15°C which is usually the temperature of the PN solution after calcium nitrate separation. Bestresults were obtained with Polias 300 flocculant as shown in Fig. 1.
The PN clarified solution has an average uranium content dependent on phosphate rock used:
Morocco 110-140Jordan 80-120Israel 100-120Florida 100-140 U/L.
The average content of REE is 1-2 g/1 except Kola which has a higher content.
The typical analysis of the PN solution (mixture of phosphoric acid and nitric acid) is: 7%N, 8-9% P, Ca/P = 0.5, specific gravity 1.5 kg/dm3, and HNO3 approx. 10%. Due to this strongacid mixture only organophosphorus acid esters are efficient.
In the laboratory experiments several compounds as: ocrylpyrophosphoric acid (OPPA),nonylphenyl phosphoric acid (NPPA) and di(2-ethylhexyl) phosphoric acid (DEPA) were studied.
It was established by IR spectra, pH-metric analysis and has chromatography that OPPA andNPPA are very unstable versus hydrolysis. Therefore the only efficient and stable extractant is DEPA.It was also used in synergic mixture with TBP (tri-n-butyl phosphate) or TOPO (tri-n-octylphosphineoxide) in kerosine as diluent. The best efficiency is obtained in the presence of DEPA+TOPOselected as extractants for uranium and REE recovery. The results in this case of uranium are shownin Figs 2 and 3.
The best extractant for uranium is 0.6 mol/L DEPA + 0.1 mol/L TOPO, but for REEextraction a higher concentration of DEPA was chosen. In this case 1.2 ml/L DEPA + 0.2 mol/LTBP [8] gives acceptable results for uranium but better yields for REE extraction.
There is no synergistic effect in the case of REEs as it is with uranium as U(VI). Thereforeuranium and REEs are simultaneously extracted from PN solution.
2.1. Extractant scrubbing
At the same time with U(VI) and REEs some nitric acid is also extracted from aqueous PNsolution. The presence in the next stage of HNO3 in the organic phase interferes seriously withuranium stripping. Therefore the extractant undergoes a scrubbing process when HNO3 is eliminated.The most suitable scrubbing reagent is an urea aqueous solution which retains HNO3 as urea nitrate(used as fertilizer). The scrubbing process takes place in a mixer and the dispersion is discharged ina separator where organic-aqueous phases separate.
2.2. REE stripping
The extractant leaving the scrubbing stage is sent to the REE stripping unit. The strippingreagent is hydrofluoric acid 15% or a mixture of ammonium fluoride and sulfuric acid. The REEsare transferred to the aqueous phase, uranium is left in the organic phase. The REEs in presence ofF" precipitate.
The stripping process takes place in a mixer and the dispersion is sent continuously in aseparator where the three phases separate; the organic phase via overflow goes to uranium strippingunit, the aqueous stripping reagent is recirculated, eventually corrected. The precipitate settles andis unloaded periodically on a filter.
225

PHOSPHATE ROCK
NITRIC
ACIDNITRIC ACIU ATTACK
FILTRATION REZWUE
COOLING
phosphonitric
FLOCCULANT
solution
CLARIFICATION
phosphonitric solution
FIL TRA TtON
phosphonilric
DEPA t TBP
KEROSEN
solution
EXTRACTIO N
extractant
correctionSCRUBBING
SCRUBBINGSOLUTION
———1——;——dj spersion
SEPARATION
extractant
correction
1FeSOj
extractant
URANIU STRIPPING
STRIPPING SOLUTION,FORURAWUM SEPARATION
txtractantDEPA . TBP
correction
< t
STRIPPINGSOLUTION FOR RE
RE STRIPPING
dispersion
SEPARATION
•Ca(N03)2 LH 0
-^SEDIMENT
POSTTREATMENT
phospho-nitricsolution
FILTER CAKE
FILTERGREENCAKE
FIG. 4. Uranium and rare earth recovery from phosphonitric solution.
226

2.3. Uranium stripping process
The extractant leaving the REEs stripping unit is loaded with U(VI) and by gravity flow isdischarged to the uranium stripping unit consisting of a similar mixer and separator. The strippingreagent is either 15% hydrofluoric acid or ammonium fluoride and sulfuric acid, in both alternativesin the presence of 3-5 g/L Fe(II). The presence of F acidic media and Fe(H) is a stronger reductorfor U(VI) comparable with the mixture phosphoric acid and Fe(II) as used in the ORNL process. Theredox potential is lower.
Uranium in hexavalent state is reduced by Fe(II) to U(FV) in the presence of strong F'complexing medium for Fe(III).
Tetravalent uranium in the presence of HF instantly precipitates as UF4 x H2O or if NH4F(strong acid medium) is used, as (NH4)7U6F3| as determined by thermogravimetric analysis.
The stripping reaction is sensitive to HNO^HNOj) presence therefore it must be removedfrom the organic phase. The scrubbing operation is important.
The dispersion from the mixer is transferred to the settler: the organic phase via overflow isrecirculated to extraction battery without any further treatment bearing in mind that only acidic mediais used. The stripping reagent is recirculated after separation, eventually corrected. The greenprecipitate separates on the bottom and is periodically unloaded on the filter where it is washed andobtained as green cake.
As in the ORNL process the oxygen form air affects the Fe(II), therefore a previous nitrogensparging of the organic phase is required.
2.4. PN solution post-treatment
The PN solution from the extraction process settles in a separator where most of the extractantis recovered but still 50-200 mg/kg extractant is present in the aqueous phase. This must beeliminated on activated carbon. A chromatographic method capable to determine 2-4 mg/kg organicphase in PN solution was carried out. The flowsheet of the process if shown in Fig. 4.
The two products obtained are: green cake and rare earth concentrates. The uranium contentof the green cake is 55-59% U and is impurified by Fe, Ca, Al, REEs. However, at 400°C, innitrogen atmosphere, this product is transformed to UF4, which treated with F2, the only volatileproduct was UF6. The green cake could also be transformed to a diuranate.
The REE concentrate has 30-40% REE, where both eerie and yttric elements are representedhowever predominating cerium and yttrium.
The fertilizer obtained after this treatment is of very low radioactivity with a uranium contentof 10 mg/kg and 3-5 pCi/g ^Ra. Beside uranium and rare earth recovery an incentive might be thenon-radioactive fertilizer obtained.
REFERENCES
[1] HURST, F.J., GROUSE, D.J., BROWN, K.B., Ind.Eng.Chem.Process.Des.Dev., 11 (1972)122.
[2] HURST, F.J., POSEY, F.A., Chem.Eng.Prog. (1982) 184.[3] BUNUS, F.T., MIU, I., DUMITRESCU, R., Hydrometallurgy 35 (1994) 275.
227

[4] BUNUS, F.T., DUMITRESCU, R., Hydrometallurgy 28 (1992) 331.[5] LOUNAMAA, N., MATTILA, T., JUDIN, V.P., SUND, N.E., Inst. MondialduPhosphate,
Conf. Boston (1980) 759.[6] BUNUS., F.T., DUMITRESCU, P., Hydrometallurgy 16 (1986) 167.[7] BUNU§, F.T., from Pollution Control in Fertilizer Production, Marcel Dekker Inc., New
York (1994).[8] BUNU§, F.T., DOMOCOS, V.C., DUMITRESCU, P., Inorg.Nucl.Chem. 40 (1978) 11'
228

XA9745141
GEOLOGICAL-GENETIC CLASSIFICATION OF URANIUM DEPOSITS
V.M. TERENTIEV, S.S. NAUMOVGeologorazvedka Concern,Moscow, Russian Federation
Abstract
The paper describes a system for classifying uranium deposits based on geological and genetic characteristics.The system is based on the interrelation and interdependence of uranium ore formation processes and other geologicalphenomena including sedimentation, magmatism and tectonics, as well as the evolution of geotectonic structures.Using these aspects, deposits are classified in three categories: endogenic — predominately hydrothermal andhydro thermal-metasomatic; exogenic — sedimentary diagenetic, biogenic sorption, and infiltrational; and polygeneticor composite types. The latter complex types includes: sedimentary/metamorphic and sedimentary/hydrothermal,where different ore generating processes have prevailed over a rock unit at different times. The 3 page classificationis given in both the english and russian languages.
1. INTRODUCTION
The following scientific statements are of utmost significance for solving difficult problemsof uranium metallogeny and classification of uranium deposits
(1) Interrelation and interdependence of uranium ore formation processes and other geologicalphenomena: sedimentation, magmatism, tectonics, etc., and the evolution of geotectonicstructures. A specific role of tectonic and tectonomagmatic activation processes, orogeny andriftogenesis during formation of uranium ore zonation.
(2) Structural-petrological and system approach to the analysis of geological environments,resulting in establishment of the most objective associations between metallogenic structuresand geological and tectonic bodies of the same rank and extent, i.e. geological-formationaltype of deposits.
(3) Effect of inhomogeneities of the Earth's crust and the upper mantle deep structure on theformation of uranium ore regions, geodynamics of tectonic and ore-generating processes.
(4) Interrelation between the processes of dispersion, mobilization and concentration of uraniumand its accessories in the Earth's crust.
Taking into account the above statements, classificational categories of uranium deposits formthree groups of deposits, each of them having the common petrological-energy nature ofmineralization sources, specific features of localization and differing from the other ones by geologicalconditions of the shows of deposits. Among them are:
(1) Endogenic group of deposits of predominantly hydrothermal and hydrothermal metasomaticgenesis, showing up in association with crushing and metasomatic zones in activatedstructures of Precambrian shields, median masses and volcano-plutonic belts.
(2) Exogenic group of deposits (sedimentary diagenetic, sorptive-biogenic, infiltrational deposits),developed in association with activated platform covers, erogenic and riftogenic troughs anddepressions.
(3) Polygenetic group of composite telescoped deposits (sedimentary metamorphic, sedimentaryhydrothermal, etc.), emplaced during space coincidence of various ore-generating processes
229

occurring at different time within single structures, for instance regional zones of structuralstratigraphic unconformities, centra type structures, etc.
A complex character of deposits, in certain cases, results in indefinite and contradictorytheories concerning their genesis.
Let us analyse the composition of the groups and the most important specific features of theirrepresentatives.
2. ENDOGENIC GROUP OF URANIUM DEPOSITS
Geological environments during emplacement of deposits of this group are noted for the activetectonic regime with pauses of a relative stabilization of movements. The leading types of geologicalore-controlling structures are represented by crushed lithophile crustal blocks with intense shows ofgranitoid and alkaline magmatism within shields and median masses, or continental volcanism in theform of volcano-plutonic belts or isolated volcano-tectonic structures. Fault tectonics of differentextent is typical, as well as intense metasomatic processes.
The following types of deposits are distinguished within the group (see Table I):
A. In folded areas (median masses):
Fluorine-molybdenum-uranium in systems of linear tectonic dislocations within volcano-tectonic structures (calderas, etc.) and their basement, accompanied by extensive aureoles ofhydromicaceous (argillizitic) and berisitic metasomatites in volcanites and alkaline-sodicmetasomatism in the basement. Vein, stockwork, sheet-like type of orebodies. Age:Middle-Late Paleozoic, Mesozoic (130-140 Ma), less frequently Proterozoic(1500-1700 Ma).
Uranium in beresites and eucites of crushing zones in granites, terrigenous carbonate andcarbonaceous sequences:
• phosphorus-uranium in eucites,• molybdenum-uranium in beresites (depending on geochemical features of
emplacement of ore-bearing hydrotherms). Vein and stockwork morphological type.Age: Paleozoic (350-370, etc.).
B. Within activated shields in association with regional processes of alkaline metasomatism:
Uranium in albitites, in zones of the Early-Middle Proterozoic activation of ancient shields.A possible subtype: titanium-uranium in apogabbroid albitites. Stockwork morphological type.Age: 1800 Ma.
Uranium, gold-molybdenum-uranium in potassic metasomatites (gumbeites) of regional faultzones in activated shield blocks.Subtype: thorium-uranium in alkaline rock masses. Vein stockwork type. Age: 130-165 Ma.
Uranium and thorium-uranium in alkaline metasomatites, syenite and alkali granitic masses,associated with activation epochs of ancient shields (Proterozoic: 1000 Ma, Mesozoic, etc.).The known deposits of this type (vein-impregnated) are characterized by a significant extent,but have low uranium contents in ores (Greenland-Ilimaussah, E. Brazil).
230

TABLE I. ENDOGENIC GROUP OF DEPOSITS
/. 3»AOseHN3fr epvnnaf. £ndogenic group of deposits
f 1 ruftPomepMdJi&Hine Mecmopoo/cjeHifX B donaxaKmuBVteuuu (faanepOdQuoKux u AOKeM6puucKux CK/tajyamwx
1. i. Hydrotkermal deposits in zones of tectono-magmatic activation ofPhanerozofc and Precambrian fold areas.
Tnun Mecrnopootc-.
Geologic- formationat type of deposit7ptpqflffSt'tffiC- Co^^cmB,y/o^ee
ffffd?-7ftffrtype of deposit
tfuu mvn Mecmopoycfi? ypany opyAexeHueMinerafization,accompanying
uranium1. f. f. ypaHOBbU B apsuMtisumax v nojreBoufnamo--
.1. 1. 1. Uranium inaroiflizfte and -feldspathicmetasomatttesr in volcano&enic-'t.eeionstructure. on/c
KOBblU
Vein, stock workMo,F
1. 1. 2. ypaHOBuii B sepesi/max v aacomax 30x4006-/lenufi B 3PaHt/maxt(teAepoAucmtnx ameppu-1. 1.2. Uranium in beresiies of fracture zonesin oranites. carbonaceous and terridenous--cSrSonate strata.
Ve/'n-sfoo/ctvortfMO.P
1.1. s.Ji/paHOBbiu $ t&jiueBbix MemacoMamumaxBblU
1.1.3- Uranium inootash metasomatitesfhumbeiui) Vein-stockworkin zones orrejionaf fautts
f. 1.4.ypaHO6Uu B afibGumumax/. /.</. Uranium in albitites Stockwork Fe1. 1. 5. yPdHOBblU U TnOPUU-UPaHOBUil B m&IOVHUXMemaooMamumax cuenumoBtux ooi&iO'/HO-epaHt/moBux Maccvaoa1. 1.5. Uranium and thorium-uranium in afxafintetasomatites of syenite and afxafi-
-granite massifsVein-stockwork
231

TABLE II. EXOGENIC GROUP OF DEPOSITS
B. 9K30zeHnati apynna Mecmopo&cAeHt/iL.2. Sxogenic group of deposits-
2.1. UM&iMbnipatjuOHHbte Mecmop03K%eHufi B atcmuBusvpOBdHff&x vex/rax n/tamtpopM,opoeeHHbix u putpmosenHb/x Bnafivxax.2.1. Infiltration deposits in activated .covers of platforms, orogenic andrtnogenic depressions.reo/ioZQ-tpOPMau^OHHbiu mun Mecmopow-Geofogic- formations! type of deposit
2.1. 1. UpaHOBbiu e 3DH3X ivtaemoBoso DKucje#u# e metpi/eeHKuxum&NGeHHO-KapBOHamHbix nxututax.2.1.1. Uranium, in zones of strata f oxidation interrigenous rock bodies.2.1.2.Spa»oabie B Wftax iwaemoBow uepyHmoBoaoOKucjientai e ysJiexocHbtx moxmax.Z.1.2. Vi^ntMm.inwnes of strataf and soiftoround)oxidation of coal-bearing strata. w
2.1.3. UpgHOBbiu B 30Hax rviacmoBoao oapnnmoBO8oOKucnenuft a ^K*^aHo•^M^^u:mt>K marufaxn&ffeqfOWA2.1.3. Uranium, 'monies of Strataf and soft oxidation ofsandy-clayer strata of paleovaffeys.2.1.4. BumyMHO-ypawBbru B 3onax BOCcmartoajreHuxmeppuaeKHO-KapGOHarnHbix mojiu^.2.1.4. Bitumen-uranium in zones of reduction ofterrigenous- carbonate strata.
feo/ioso-MOpiposiosiweeffuu mun MecmopooKfie
mu.Geoiogic-morphofo&icaftape of aeposft
Cmpamu(popMHi}iu,POMomStratiform, roll-type
CmpamupoPMHbiu,poMaBbiuStrati form soil- type
CmpanoitpoPMHttiuStratiform
CmpamuqtoPMHwu, B TOMvvcae PO/uoBbiuStratiform, roff-type
ConymcmByfOimeei/pam opyfieHeweMineralization ,accompanying
uranium
Mo,Se,Re,V,Sc
Se,Mo,Re,Ge,A&
Se, Mo, Sc
Se,V,Mo2.2. CuH-Aua&H&mufKKue MGcmopoaqq/eHUfi B vex/fax n/iamtpoPM u oposennbix BnafluH2.2. Syn-d/a^&netic deposits in covers of platforms and orojenic depressions.2.2. 1. ypatfOBbiii. B MOPCKUX CMb<pusonocnnni s»uxaxCffocmntiiM /yempumoM.2.2.1. Uranium in marine sufphide-bearind clayswith oone detritus. *2. 2.2. UPSHOBMU B Kmmvtiemna/tbmix neemocraBem-H6ac meppuseKfoax motiyax.2.2.2. Uranium in continental variedatedterrigenous strata.2.2.3. ypdHOHOCHbiu. e (po&popumax.2.2.3-Vran/ferot/s in phosphorites.2. 2. 4. ypaHOHOCHuu B moppJHUteax, tusHumax,rcapcnrax.2.2 A. Orffnrferoi/s in peat bo&S, fi&nites, karst.
CmpamutpoPMHiHUStratiform
CmpamvtpopMHMUStratiform
CmpamupOpMHbiuStratiform
CmpamuqyoPMHtau,eHeajosouStratiform
TR,P
Se,PP
232

TABLE HI. POLYGENIC GROUP OF DEPOSITS
3. no/iuaeHHan apunna MecmopoycaeHt/L3. PoJygen/c group of deposits
f£Q/l020-(pOPMdUtUOHHbl{i THU71 M6C77)Op03fC-JL&HUU.
Geologic- formationaf type of deposit
3. 1. ypaHOBbiuBHOHSJiOMepamax £OKeMBt>uuCKUx
3. 1. Uranium in conglomerates
3. 2. ypattoBbiu a AoiceMEPuucKux rjecvanuicax u
3. 2. Uranium in precambrian sandstones anddofomites
3. 3. UPamBbtu B s3/iepojiucmo-/speMHucmbtxcsiaHU,ax8. 3. uranium in carbonaceous-siliceous schists3. 4. ffpe/fOBbiii B ueoJii/moBbix. MemacOMamumax
ajitiCKumoBbix epanumoB3. 4. Uranium in zeotitic metasomatites of
alaskite granites
3. 5. ypaHOBbiu B Ka/ibtiueBO-MarHeauajtbHbix. uZffUKtiemux ( Kf-ffe-Chf) MemacoManuimaxsort ompyKmypHO-cmpamuspaiputtecKux He-
3.5.1. ABcmnajiuucKuu noAmun
3.6~. Uranium in cafcium- magnesium and cfayer(M-He-Chf)mezasomatic zones ofstrueturae-stratigraphic unconformaties
3.5.1. Australia- type3.5.2. Canadian- type3.6. UPdHOHOCHbiu B KepBOHarm/max cmpynmyp
nenmpaJibHOSo rnuno3. 6. Uraniferotis in carbonatites of Central
type structures3.7. ypanoBbiu a spaHumax.mejiotfHbix Memaco-.
Marnumax u nesMamumax (gnop{pupoBbiaj8. 7. Uranium in 6ran!test afkafine metasoma-
tites and pegmatites („ porphyry")
feo/ioso-MOpipa/ioeuvec-HULL
Geofogic-morDholosicaltype of deposit
CmpamuQoPMHbiii
Stratiform
3Cu/}bHO-u//no/(Bep/<0B6/u,cmpamutpopMHbiuVein-stock workstrati for/nCmpamuepoPMHbiu
StratiformCmpamu(poj)MHb/u ,OfCt/JlbHtttU
Stratiform,veins
Cmpamu<por>MHbiit
Stratiform
Vein- stockwork
SlmOKBeptfOBbry,BKpanj} eHHbiu
Stockwork
*l
CorwmcmBijfomeeypany opy^eneHueMineralization,accompanying
uranium
Aujh
Cu,Co,Au
y,Mo
TR,Nb,TaJh,Cu
7/t,77?
233

3. EXOGENIC GROUP OF URANIUM DEPOSITS
Geological environments, characteristic of the emplacement of deposits of this group areclearly classified under two subgroups — epigenetic, essentially infiltrational, associated with activatedplatform covers and systems of depressional valleys and paleovalleys; - syn-diagenetic, associated withessentially terrigenous (including clayey, phosphate, etc.) sequences of platform covers and erogenicdepressions.
The most important of them, epigenetic subgroup, is noted for an active infiltrationalhydrodynamic regime of artesian basins, determining the movement of pressure oxygen water fromrecharge areas (orogens) deep inside the basins with generation of oxidizing and reducing zonationwhich control the distribution pattern of uranium and complex deposits on geochemical barriers.Genetic similarity of deposits is also emphasized by characteristic roll shapes of orebodies.Differences are associated with types of geochemical barriers — stratal or stratal-ground oxidationzones (2.1.1, 2.1.2, 2.1.3) and reduction zones (2.1.4). The age of ores is predominantly Neogeneor Quaternary, as well as Mesozoic (for paleovalleys). Accompanying mineralization is shown inTable II.
Syn-diagenetic subgroup of uranium deposits comprises orebodies of a stratiform type, mainlyassociated with sedimentation and partial alteration in the process of diagenesis.
The most important geological economic type among them is phosphorus-rare earth-uraniumsorptive-biogenic, associated with sulfide-bearing clays of young platform covers. The emplacementof these deposits is due to mass extinction of fish in certain parts of sea basins with subsequentseparation of bone detritus which sorbed uranium in accumulative structures. The age of deposits isLate Oligocene.
Uranium type in variegated terrigenous continental sequences, representing the sedimentaryclass of deposits, sometimes forming major bodies with low grade or run-of-mine ores. The age rangeof the emplacement of these deposits is rather extensive (Proterozoic-Paleozoic) and varies fordifferent regions. The morphological type is sheet-like, lenticular, impregnated and concretionary.
Other types of deposits in the exogenic group (see Table II) are, in fact, uranium-bearing;they are associated with phosphorites (2.2.3), lignites, karsts (2.2.4) in which uranium plays the roleof a by-mineral.
Mineralization is in certain cases characterized by a large extent, along with a low uraniumcontent in ores. The age range of the emplacement of deposits is extensive.
4. POLYGENETIC GROUP OF COMPOSITE (TELESCOPED) URANIUM DEPOSITS
Geological environments for the emplacement of these deposits are diverse intra- and peri-cratonal, partly riftogenic ancient platform depressions; stabilized blocks in boundary zones ofplatforms; granite gneiss domes and aureoles in basement; zones of structural unconformities atboundaries of the crystalline basement and depressional structures; long-lived faults; a compositecombination of endogenic and exogenic ore-generating processes polychronous ore genesis.
The following geological-genetic types of deposits are distinguished within the group:
Gold-uranium in conglomerates of Precambrian depressions. Stratiform orebodies formed asa result of placer accumulation of metals in the process of reiterated redeposition of uraniumand gold. Lately, there appeared convincing evidence of a sedimentary-hydrothermal genesisof gold in Witwatersrand. Therefore, possibly, this type of uranium deposits has asedimentary-hydrothermal-metamorphic genesis.
234

Uranium in Precambrian sandstones and dolomites. Association with intracratonal depression.Proximity to "sandstone" type deposits (common stratigraphic level, association with fossils,etc.). However, subsurface uraniferous hydrotherms were supplied to sedimentary basins,resulting in emplacement of rich lenses.
Uranium (with V and Mo) in carbonaceous-siliceous shales of Riphean and Paleozoic,forming under conditions of sedimentation and subsequent hydrothermal and crust-formingprocesses. Stratiform morphological type.
Uranium in calcium-magnesian metasomatites of structural-stratigraphic unconformity zones(Australian and Canadian subtypes).A polygenetic character of this type (in the generally adopted interpretation) shows upprimarily in the evolution of ore-generating processes — ore accumulation, activation withselective mobilization of substance, in certain cases, hypergenesis leading to uraniummobilization, etc.Age of mineralization is 1300-1350 Ma, 1600-1700 Ma. Being characterized by commonemplacement (basic criteria: association with regional unconformities, carbonaceous sequencesin the basement, large extent, etc.), the Australian and Canadian subtypes differ as regardsmetal concentration in ores, age, lithification of the overlying sandstones and other features.
Uranium in zeolite metasomatites of alaskite granites. Mineralization is associated withzeolitization zones and weathering crusts of highly radioactive granite masses. Magmaticaccumulation — metasomatism — crust formation.
Uranium in granites, alkaline metasomatites and pegmatites ("porphyry"). A combination ofmagmatic, metasomatic and soil-infiltrational processes with a significant effect of faultstructures. Impregnated and sheet-like type of orebodies.Age: 2000-1850, 1050-950 Ma, etc.
Uraniferous rare metal-rare earth in carbonatites of central type structures. A polychronousevolution of certain masses is characteristic, as well as a combination of magmatichydrothermal-metasomatic and crust-forming processes, determining the ore potential ofstructures.Age: Proterozoic-Mesozoic.
The present paper highlights on the types of uranium deposits which are of economic interest.Besides, uraniferous placers are known, quartzite skarns and other types of uranium mineralizationof a vague practical significance, which also correspond to certain "cells" of classificational tables.
Presumably, the proposed classification of uranium deposits, based on a comprehensivemetallogenic analysis of ore-bearing geological structures, petrological analysis of ores, evolution ofore structures and their regular interrelations will favour a more efficient study of uraniferous areasand prediction of the types of uranium deposits which are new for them.
SSEXT PAQE(S) I!ef t BLANK I
»,M MU^ I J! 235

XA9745142THE STRELTSOVSKOYE URANIUM DISTRICT
L.P. ISCHUKOVAConcern Geologorazvedka,State Geological Enterprise Sosnovgeologija,Moscow, Russian Federation
Abstract
This paper describes the geology of the Streltsovskoye uranium district located in south-eastern Zabaikalieregion, Chita Province, Siberia, Russia. This district hosts Russia's only currently active uranium production centre.The uranium ore was discovered from 1963 to 1967 by drilling below fluorite veins which had minor associateduranium mineralization and radioactive anomalies. The uranium occurs as large scale vein stockwork deposits ofhydrothermal origin within a volcano-tectonic caldera formed by continental volcanism of Late Mesozoic age. Rocksoccurring in the caldera include basalt and trachydacite, overlain by rhyolite, and with associated interbeddedsediments. The ore bodies occur in steeply dipping faults, with the greatest concentrations located where faults alongthe margins of the caldera intersect steeply dipping, cross cutting, northeasterly and northwesterly striking faults. TheStreltsovskoye caldera extends over an area of ISO km2 and is underlain by a large batholith. The 19 identifieduranium deposits occur in structural features that cut through the caldera sequence and extend into the basement rocks.The caldera has a maximum thickness of 1400 metres. Details of several deposits are given, including descriptionsof mineralization and associated alteration.
The Streltsovskoye uranium district is located in south-eastern Zabaikalie in the economicallydeveloped region of the southern Chita Province of the Russian Federation. Due to geographicalconditions, the region is easily accessible. However it took about 15 years to discover the uraniumdeposits. During this discovery period, the opinions on the uranium potential of the territory changedseveral times. The evaluation of the uranium potential of the Streltsovskoye fluorite deposit, wherelocal radioactive anomalies and minor uranium mineralization were already known at a depth of 50 m,was undertaken in 1963.
The first hole drilled below the thinning out of the fluorite vein intersected a thick ore bodyat a depth of 220 m. It was located in trachydacites in the lower wall of the fault bounding the fluoritevein. This was the first discovery of one of the largest deposits in the Streltsovskaya caldera. By1967, the Streltsovskoye ore field was defined as a large industrially important uranium ore regionwith unique reserves and ore grade. The bases of these deposits construction of the PriargunskyMining and Chemical Processing Works was started in 1968.
The deposits of the Streltsovskoye uranium district are very typical representatives of large-scale hydrothermal uranium deposits, formed in areas of continental volcanism during the final stagesof Late Mesozoic tectono-magmatic activity. The deposits are located within the Streltsovskayavolcano-tectonic caldera which covers 150 km2 (Fig. 1).
The position of the caldera is defined by the junctione of long-lived deep faults of variousorientations at the arch of a local gneiss-granite dome. Granitoid rocks, originated from silicapotassicmetasomatism and anatexis, which developed throughout Proterozoic to Early Mesozoic time, arewidely distributed in the basement and flanks of the volcano-tectonic depression. Various Precambrianmetamorphic rocks (quartz-plagioclase-biotite gneisses, biotite-hornblende gneisses, dolomitizedlimestones, etc.) occur as xenolithes among granitoids of various ages.
The sedimentary-and-volcanogenic rocks forming the caldera have an average thickness of500-800 m, and are as much as 1400 m thick in the deepiest parts of the caldera. The geologicalsection is represented by the Upper Jurassic Priargunskaya series. The series consists of three basaltsheets alternating with three trachydacite sheets, separated by thin horizons of sedimentary andtuffaceous rocks. The upper part of the section is composed of the Lower Cretaceous Turginskaya
237

SW Fluorttovy MeridlonahiyA
Tsentralnaya ShirondukuevsKayo MEahearzone shaar z o n e B
-76O
J30
Fig. 1. The Streltsovskoye ore field. Geological map.
Sedimentary-volcanogeneous rocks (upper structural level):1-13 - the Turginskaya series (Lower Cretaceous): 1 - sandstones, 2 - aleurolites, 3 - gritstones, 4 - conglomerates,5 - basalts, 6 - liparites of neck facies, 7 - liparites of sheet facies, 8 - acid tuffs, 9 - granosyenite-porhyries (a),liparites (b) - extrusive bodies of subvolcanic facies; 10 - spherolitic liparites, 11 - felsites of neck facies, 12 - fel-sites of sheet facies, 13 - plagiodasic trachydacites; 14-21 - the Pruargunskaya series (Upper Jurassic); 14 - ba-salts of upper sheet, 15 - trachydacites of upper sheet 16 - basalts of middle sheet, 17 - trachydacites of lowersheet, 18 - "oceltar" trachydacite tuffs, 19 - basalts of lower sheet, 20 - conglomeratic breccias of basalts, 21 - ba-sal conglomerates.
Lower structural level:22-granites of the Variscian epoch of granitization, 23- granites of the Caledonian epochof granitization; 24-25 - metamorphic rocks; 24 - dotomiftzed limestones, 25 - biotite-amphibole gneisses,ampnibolites, metasedimentary rocks; 26 - tectonic faults: a - steeply dipping, b - gentle; 27 - the boarder of theStreltsovskaya volcanotectonic caldera, 28 - volcanic apparatuses: 1 - Krasnokamensky, 2 - Yugo-Zapadny,3- Zapadno-Tulukuyevsky; 29 - molibdenum-uranium ore bodies: a - run-of-mine and high-grade ores,b - lean ores (at the geological map - ore body projections on the surface); 30 - uranium deposits:1 - Shirondukuyevskoe, 2 - Streltsovskoye, 3 - Antei, 4 - Oktyabrskoe, 5 - Luchistoye, 6 - Martovskoye, 7 - Malo-Tulukuyevskoye, 8 - Tulukuyevskoye, 9 - Yubileinoye, 10 - vesennee, 11 - Novogodneye, 12 - Pyatiletneye, 13 -Krasny Kamen, 14 - Yugo-Zapadnoye. 15 - Zheriovoye, 16 - Argunskoye, 17 - Bezrecnoye, 18 - Dalnee, 19 -Vostochno-Shirondukuyevskoye.
238

series where rhyolite sheets, which are divided into felsites and liparites using texture and structurefeatures, predominate. The section is completed by liparites alternating with basalt sheets andconglomerate and sandstones horizons. Sub-volcanic feauters occur along the center shear zone atjunctions with faults of the Argunskaya shear zone. The roots of the volcanoes are necks of liparitesand syenite-porphyries extended along the faults. In the upper zone the cone-shaped pipes consist oferuptive breccias of rhyolites. The eastern part of the caldera is exceptional and is composed ofstratified gently pitching effusive sheets and sedimentary rocks. As the result of the processe ofcaldera formation, the rocks of the basement and cover were broken into blocks which underwentmovement in opposite directions.
The Argunskaya shear zone of the north-eastern and sub-latitudinal trend is the majorore-controlling zone in the Streltsovskaya caldera. It was initiated at the stage of plicated dislocations.It remained technically mobile throughout the Proterozoic-Paleozoic history and the complete periodof sedimentary-volcanogenic cover formation. It consists of numerous tectonic fractures with anortheastern (70°) and latitudinal strike accompanied with zones of close spaced jointing of the rocks.The total thickness of tectonically broken rocks is 3-5 km. Within the Argunskaya shear zone, quartz-K-feldspar-albitite metasomatites and greisens occur together with pre-ore and ore-accompanyinglow-temperature hydrothermal alterations (argillization, albitization). Alternation occurs both inbasement and in sedimentary-volcanogenic deposits of the caldera.
The meridional shear zone also consists of a series of tectonic joints that are second order tothe major meridional fault. The junction of the meridional and Argunskaya deep shear zones was themain magma- and fluid-transporting channel in the post-granitization period and during volcanism,as well as the ore-transporting channel during the final period of activization.
Meridional faults, grouped into zones of 500-900 m thickness, were important ore-controllingstructures in the caldera. The majority of the deposits are located within the Argunskaya shear zoneat its junctions with the meridional shear zones. Both faults and zones of steeply dipping jointing witha northwestern (330°) strike, accompany the faults. They formed at junctions of the meridional andnortheastern fractures and host uranium mineralization in the sedimentary-volcanogenic strata. As thistook place, zones of contiguous jointing were developed between the meridional faults. They are forthe most part second order joints. Zones of steeply dipping jointing were formed mainly in theeffusive sheets and less brittle commonly in sedimentary rocks. The presence of brittle rocks atseveral levels in the section resulted in the appearance of mineralized fissure zones on severallithological levels.
Faults with either a northeasterly (30) or northwesterly (0) strike host uranium ore in thebasement rocks. Channels for percolating hydrothermal solutions were provided by steeply dippingfaults which restrict the caldera, and cross cutting faults that extend through basement rocks and allsedimentary-volcanogenic strata.
In addition to the steeply dipping tectonic fractures there are several structural features presentwith a shallow dip. These include gently pitching fractures formed at the contact between thebasement rocks and overlapping sedimentary-volcanogenic strata, as well as at the border of thePriargunskaya and Turginskaya series. These occur mainly in the horizon of tuffs and sedimentaryrocks, at the base of the felsite sheet.
Gently drapping fractures consist of numerous cracks filled with clay alterations. These claybearing zones are the screening surfaces during of percolation the ore solutions. In some cases theyhost ore bodies. A combination of ore-treating, ore-controlling and ore-hosting structural elementsin unified space with a few numbers of drainage faults and numerous screening fractures appearedto be the major factor which caused favourable thermobaric conditions in the area of ore deposition.
The Streltsovskoye ore district includes 19 uranium deposits. The two largest are located inthe basement rocks (Argunskoye, Antei). Seventeen occur in sedimentary-volcanogenic rocks of the
239

caldera fill of thirteen occur in stratified effusive sheets and in sedimentary rocks, while four are ineffusive rocks of the vulcanic neck facies. Some of the deposits in the sheet facies volcanic rock alsobelong to the large class of deposit, including the Streltsovskoye, Tulukuyevskoye and Octyabrskoye.These three deposits together with the two deposits (Argunskoye, Antei) in the basement are the onlyones on the reserves and ore grade.
Geological structure is the major factor controlling uranium deposit development. Thechemical composition of the rocks does not have an influence on ore development richness; all rocksof very different composition — granites, acid, intermediate and basic effusives, sedimentary types,and dolomitized limestones — host ore.
The bedded structure of the sedimentary-volcanogenic series and the repetition in thegeological section of the rock types, favourable for fissure zone formation, caused multi-layerdistribution of the ore. It occurs at 6 lithological-structured levels: levels 1 in 5 in the sedimentary-volcanogenic sequence with the 6th level represented by the basement rocks. Three majormorphological body types are recognized: stockwork, veine and bedded. Every deposit is representedby these three (or rarely two) are recognized: types of ore bodies located as a rule at severallithological-structural levels.
The third and the fourth levels, where uranium mineralization is concentrated in thetrachydacite sheets as stockwork-like or rarely vein-like bodies, contain the richest ore. The Anteideposit, mineralization is located in the basement rocks in a large vein-like body which also includesthicker stockwork-like zones. In the Argunskoye deposit — a thick stockwork occurs with vein-likeapophyses. Ore bodies along bedding occur at the second lithological-structural level where they arelocated in a gently dipping fracture at the base of felsite sheet. Smaller bed-like bodies occur in thesandstones of the basal horizon of the sedimentary-volcanogenic strata.
Uranium mineralization occurs in various altered rocks. Haloes of pre-ore metasomaticalterations (hydromica-carbonate-quartz, sericite-carbonate-quartz, kaolini-carbonate-quartz) wereformed as a result of the processes of acidic leaching. Alteration, which developed in close associationwith uranium deposition, is also developed. They are manifested in the metasomatic-streaky formationof albite and hematite, as well as silicification and carbonization.
The uranium mineralization is represented by pitchblende, with rare coffinite and, as verysmall amounts of brannerite at some deposits. The ores are characterized by impregnations, vuggyimpregnations, streaky and brecciated structures. The uranium content varies over a wide range —from the cut-off1 to the a few percent. Average content in some bodies and deposits ranges from0.15-0.33 % and in the largest bodies up to 0.6-3.0%.
In addition to uranium the ores have a complex composition. They contain molybdenum, andrarely fluorite in commercial quantities. The deposits belong to the hydrothermal low-temperature typeof molybdenum-uranium formation. They were formed in several phases of a single hydrothermalevent. The process of ore formation took place in 6 phases:
1 Phase of argillization (facies of kaolinite and hydromica alteration);2 Cryptoquartz-carbonate-sulphide phase;3 Albite-brannerite (the first ore) phase;4 Quartz-molybdenite-coffinite-pitchblende (the major ore) phas);5 Quartz-molybdenum-sulphide phase;6 Calcite-fluorite-dickite (post-ore) phase.
1 Editor's note: The normal cut-off grade used for conventional reserve estimation (i.e. non-in situleach) in the Commonwealth of Independent States B 0.0390 U.
240

The ore and ore associated minerals were deposited from hydrothermal solutions in tectonicfractures, in rock pores and by metasomatic replacement. Vuggy-disseminated, streaky-disseminated,and brecciated ore structures are the most common. The age of the uranium ore is determined asEarly Cretaceous. It is mainly 130-125 million years, with youngest age of 110 million years.
All deposits of the Streltsovskoye ore field are hidden, and not exposed at present on the daysurface. Most of the ore bodies occur at a depth of more than 200 m. The majority of them are alsolocated in the interval of 400-900 m below the surface. Only a single body occurs at a depth of50-100 m.
The Streltsovskoye deposit is the largest of the deposits. It occurs in the sedimentary-volcanogenic cover, in the eastern part of the caldera. It is comprised of 6 structurally interrelatedore bodies, each of which is classified as an average or large sized deposit.
A significant part of the reserves is contained in the Streltsovskaya vein. It has a length of750 m and an average thickness of 6 m. The average uranium content is 0.33% . All rocks cut bythe fault host ore mineralization. However, the highest contents of uranium (up to 0.8%) andmolybdenum (up to 0.4%) are in the basalts (Fig. 2). The main part of the uranium reserves at thedeposits are concentrated in stockwork-like bodies in the lower trachydacite sheet. The bodies consistof contiguous steeply dipping ore-bearing fractures feathered large faults (Fig. 3). The uraniumcontent in ore bodies increases near the lower or upper limiting surfaces such as gently dippingfractures in tuffs or conglomerates (Fig. 4, 5); the stockworks split into short vein-like bodies whenthey thin out. The length and width of the ore bodies reaches a few hundreds of metres.The uraniumcontent varies between 0.15 and 0.5%.
Hydrothermal wall-rock alterations in the Streltsovskoye deposit is manifested byhydromicatization, albitization-2, carbonatization, streaky and metasomatic silicification andpyritization, and the development of ankerite and chamosite veinlets. Veins of fluorite and veinletsof dickite and calcite formed in the post-ore stage. Pitchblende, and rarely coffinite, representuranium mineralization. Mineralization forms finely disseminated, vuggy-disseminated aggregates,streaky segregations along cracks, saturates tectonic breccias and borders their fragments.Molybdenum mineralization is represented by jordisite which is transformed to ilsemanite duringoxidation. The association of uranium, with pyrite; isolated quartz veinlets and coarse-flankedmolybdenite are rarely noted. Berylium (bertrandite) is also present in noticeable quantities in someuranium and molybdenum ore bodies.
Many of the other deposits formed in the sedimentary-volcanogenic strata are characterizedby similar geological structures. The Tulukuyevskoe uranium-molybdenum deposit, is one of theseand it is of major importance.
This deposit is located in the central part of the Streltsovskaya caldera. It occurs within thenorthwestern strike shear zone of the same name where it cross the Argunskaya shear zone in aterrain of stratified Upper Jurassic volcanites. It consists of a series of contiguous, steeply dippingfractured-veined, stockwork-like and gently pitching ore bodies of complex morphology. They arelocated at the second lithological-structural level and do not outcrop (Figs 6 and 7). Molybdenumoccurs in commercial concentrations in the ore. Insignificant concentrations of lead, beryllium andrhenum occur with the uranium. The length of the deposit is 1300 m. The richest part is 400 m longand the width of the productive zone is from 150 to 250 m. The section containing ore is 180-270m high.
The fifth ore-bearing zone, controlled by tectonic fractures with a northwestern strike, is therichest and contains 60-70% of the total reserves. The ore bearing rocks are felsites, lava brecciasof felsite composition and tuffaceous-sedimentary rocks: a minor part of the lower grade ore occursin underlying basalts and trachydacites. The uranium ore grade is high. The average uranium contentexceeds 0.4%, and ranges from the cut-off to 5-7% in some intervals; the highest uranium contents
241

to
Fig. 2. The Tsentralny area of the Streltsovskoye deposit.Geological section on the 115+50 prospecting line.Legend see on Flg.1. Fig. 3. The Glubinny area of the Streltsovskoye deposit.
Geological plan of the horizon of 332 m.Legend see on Fig. 1.

Hor.
Fig.4. The Glubinny area of the Streltsovskoye deposit.Geological section on the 97-th prospecting line.Legend see on Fig. 1.
SW
. IQM.
Fig. 5. The Streltsovskoye deposit. Geologicalsection on the 113+50 prospecting line.Legend see on Fig. 1.

w 40n
Fig. 6. The Tulukuyevskoye deposit. Geologocal planof the horizon of 600 m. Legend see on Fig. 1.
sw
Fig. 7. The Tulukuyevskoye deposit. Geological sectionon the 35-th prospecting line. Legend see on Fig. 1.
244

are 30-40% over a thickness of 5 m. The thickness of ore bodies varies from a few tens to 50-60 m.The second ore-bearing zone represents the central part of the deposit. It is controlled by fracturesof the meridional and northeastern strike, restricted by faults with a northwestern strike. Uraniummineralization forms large concentrations at the junction of different striking faults. The averageuranium content is about 0.3%. A gently dipping bedded ore body also occurs in a lit-by-lit Tintlocated within a tuff-sandstone horizon under a felsite sheet. The average uranium content is 0.2%,and reaches 5-10% in intersections of steeply dipping fractures with the lit-by-lit zone.
Molybdenum is present in commercial contents at the Tulukuyevskoye deposit. It is mainlyconcentrates in the lower part of rich uranium ore bodies. The highest grade concentrations, occurin basalts and felsite tuffs. Concentrations of Molybdenum in different ore bodies vary in the rangefrom a few hundreds of a percent to 10-12%. The average molybdenum content is 0.2%. The averagerhenium content is 146 ppm based its presence in molybdenum concentrate.
Hydrothermal wall rock alteration is well developed, It is represented by silicification,hematitization, hydromicatization, carbonatization and albitization. Streaky silicification andchloritization are confined to large tectonic fractures. Uranium mineralization is represented bypitchblende forming metasomatic and streaky segregations. Coffinite occurs in very minor quantitiesin association with pitchblende. Uraninite and uranium titanite (brannerite) are always rare.Molybdenite occurs in ores as finely flaked and cryptocrystalline (jordisite) varieties that formmetasomatic and streaky separations. Pyrite and lollingite are of limited.
The unique Antei deposit is situated directly under the Streltsovskoye deposit. It occurs adepth of 350-1400 m below the surface in the basement granites (Fig. 8). At the Antei deposit, thecommercial reserves have an average uranium content of 0.2%. Of this, 78% of the ore has anaverage bofuranium content of 1.33%.
The major ore body is located in a large tectonic joint of the north-eastern (30°) trend in theLate Paleozoic metasomatic and intrusive-anatectic granites. The strike length of the body is 1000 m,and the dip extension is about 900 m. Its upper border is represented by a gently dipping fracture onthe contact of structural eluvium of granites and the overlying dacites which enclose ore bodies of theStreltsovskoye deposit. The body has a complex structure. Ore stockwork-like swells the thickness,of which reaches up to 50 m, alternate with vein-like intervals with a thickness of a few metres. Mostof the uranium reserves are concentrated in the central part of the body, the ore body is chimneyshaped in section and stockwork-like in plan (Fig. 9). The height of this body is 200 m, the lengthis 300 m, the thickness is from 10 to 50 m. The uranium content exceeds 0.7-0.9%, reaching morethan 4% in ore intersections. The average content is 0.954% in the central part. Molybdenum occursin insignificant amounts of less than 0.03%.
These granites enclosing ore are characterized by intensive pre-ore pneumatolitic-hydrothermalalterations such as microclinization and early albitization. Zones of sericitization and silicification withpolymetallic mineralization (galenite, sphalerite and molybdenite) were formed along tectonic faultsdeveloped mainly at deep levels during early stages of ore-accompanying alterations. Native silveris observed in galenite from these zones.
Low-temperature hydrothermal pre-ore processes caused formation of wide haloes ofhydromica, veinlets of quartz, siderite, and pyrite along faults. Mixed-layered hydromica-montmorillonite and chlorite occur in central part of the haloes. At the beginning of the early orestage, streaky-metasomatic albitization-2 was widely manifested and accompanied by branneritesegregation and ankerite veinlets in the lower parts of ore bodies. During the final uranium-oredepositionstage, numerous veinlets of quartz and chlorite (chamosite-type) were formed. Uraniummineralization is represented by pitchblende, less of ten coffinite and, insignificant quantities ofbranderite. The latter was developed only at the bottom of ore bodies at a depth of more than 800 mbelow the surface. Only pitchblende occur spread above this level. Molybdenum mineralization isrepresented by dispersed segregations of molybdenite, in association with cryptocrystalline quartz and
245
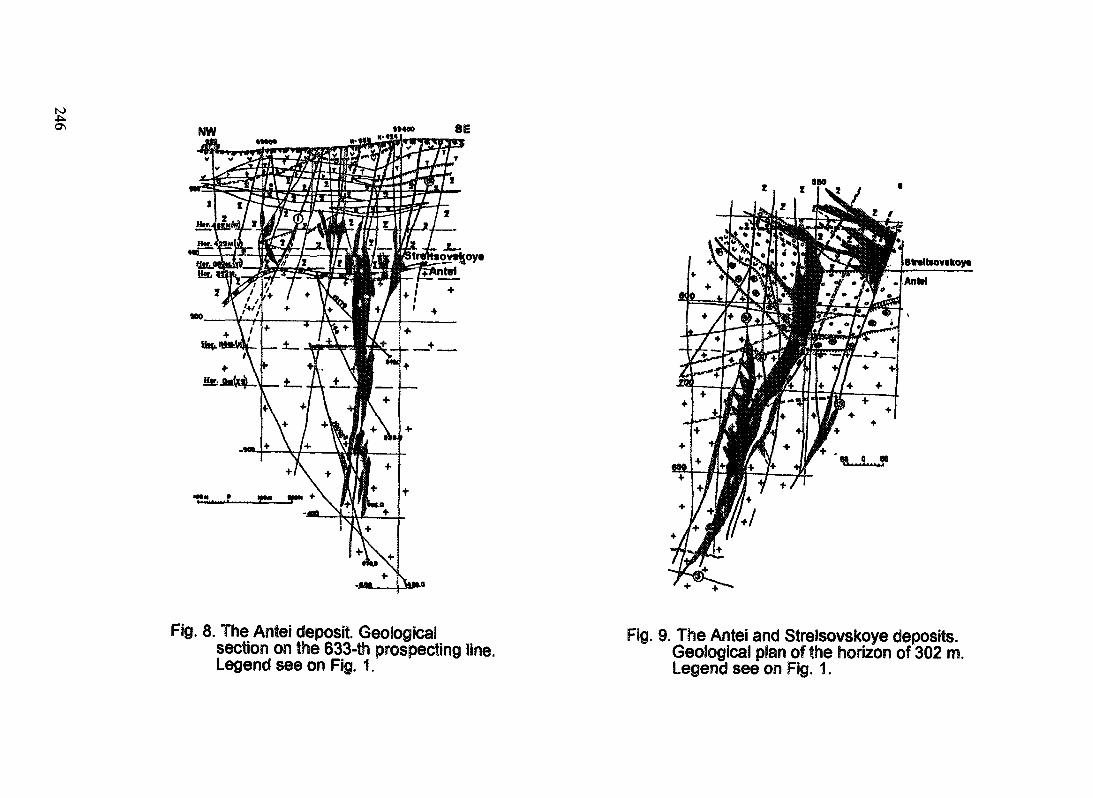
I!o>d>
0)
rot)&
&
<§!
o»
®*"" «0_J00o>u.
246

fine flaked molybdenite, together hi vuggy-disseminated segregations with pitchblende and lath-likequartz. Post-ore wall rock alterations are slightly developed in granites slightly. Veinlets of dickite,druzy quartz, calcite, pyrite and fluorite, cross cutting uranium mineral ratio, were formed hi faults.
The large-scale Argunskoye deposit is located in the basement rocks. It is situated in thewestern part of the Streltsovskaya caldera at the intersection of the Argunskaya and the meridionaldeep shear zones. The deposit was formed on the northern side of the Krasnokamensky volcanic neck.The Argunskoye deposit is the only in the Streltsovskoye district where most of uranium ore bodyis concentrated in cabonaceous rocks.
The deposit was discovered 16 years after the start of exploration and the discovery of theKrashny Kamen deposit in the territory. The upper parts of ore bodies occur at a depth of 140 mbelow the surface under a basalt sheet, making them difficult to discover.
The deposit is located on the northern limb of an anticline of metamorphic rocks. The coreand the southern limb of the anticline are composed of polvchronic metasomatic granites.Metamorphic rocks are represented by steeply dipping strata of dolomitized limestones, thinintercalations of high-alumina quartz-mica-andalusite schists, and biotite-amphibole gneisses intrudedby ortho-amphibolites. The limestones are about 200 m thick (Fig. 10).
sw
Fig. 10. The Argunskoye deposit. Geologicalsection on the 2-nd prospecting line.Legend see on Fig. 1.
247

The granites and limestones are overlain by thick sheets of basalts and trachydacites. Ore-controlling structures are joints of the meridional, northwestern, sublatitudinal and rarely northeasternstrike. The major host for uranium mineralization is a thick zone of breccias formed on the bottomof the limestone horizon of less importance are granites which occur under the limestones in the knotof intersections of differently directed steeply dipping faults. The limestone is brecciated over athickness of 50-100 m; the breccia body has an isometric shape in plan and steep dip conformablewith bedding dip. The main ore bodies of the Argunskoye deposit are concentrated in the zone ofthese breccias. Its width is 200-300 m, the vertical extent of the mineralization is more than 1000 m.The upper limit of the ore bodies is a fracture along the contact between the basement and coverrocks. This causes a screening effect for percolating hydrothermal solutions. Elongated on verticalline ore bodies, as well as vein-like bodies, which often are tongues of stockworks, occur in this ore-bearing zone. Uranium mineralization is irregular, contents vary from the cut-off to 3.5%. Thethickness of ore intersections is in the range of 16 to 70 m. The major part of ore reserves isconcentrated in ore shoots characterized by increased thickness of mineralization and high uraniumcontents. This results in about one third of the reserves being concentrated in blocks with rich ores(more than 0.3%).
Pre-ore high-temperature metasomatic rocks, such as microclinites, albitities, skarns,phlogopite metasomatites and greisens, are widespread within and near ore bodies. Low-temperaturewall rock alterations is represented by argillization and silicification. Haloes of argillization havezoned structure. Kaolinite is developed in the upper parts. It is replaced by montmorillonite andchlorite depth and, deeper than 700 m, by hydromica. Chlorite and chlorite-montmorillonitemetasomatites, related to the post-uranium fluorite process, are observed along faults that have beentested by deep drilling to a depth of 2500 m. Pitchblende and, less, coffinite occur in ores. Themolybdenum content in carbonaceous ores is about to 0. 15 % , and in alumosilicate ores up to 0.26 % .Molybdenum mineralization, represented by coarse flaked molybdenite and jordisite, in associationwith fluorite and sulfidized quartz, fills crack cavities, saturates breccia cement and wall rocks, formsveinlets. The fluorite content varies in the range from a few percent to 51%; the average content is12%.
This brief description of the unique aspects at the reserves and ore grade of the molybdenum-uranium deposits of the Streltsovskoye district it shows that an important peculiarity controlling theformation of large-scale deposit mineralization is the coincidence of a single geostructural block ore-process, responsible for the generation of ore solutions, channels control transportation to the areaof ore deposition, and favourable conditions for location of ore bodies. Specific conditions of the ore-preparing processes are defined by peculiarities of the endogenous development of the concrete blockof earth crust.
The processes of polychronic granitization (PR^-PZz) and dome formation in the post-granitization epoch includes silica-alkaline metasomatism and the formation of local metasomatic zonesof quartz-K-feldspar-albitite and greisens along faults.
The most significant pneumatolitic-hydrothermal alterations took place in the Late Mesozoicperiod of activation. It is marked with tectonic rebuilding of the region and more intensivemanifestation of silica-alkaline metasomatism and acidic leaching processes along reactivated shearzones. Here formed haloes of silica-potassic-sodic metasomatites and greisens in the basement rocks.
Evidence for the recurrent link in time between the ore deposits and the deep-seated, slowlyevolving magmatic chamber include: the indications of multi-stage ore related processes in thebasement of the Streltsovskaya caldera, occurring together with products of magmatism and low-temperature hydrothermal processes of ore formation within the deep-seated zone. The slowlyevolving magma chamber was capable of generating fluid flows which introduced huge masses of oreforming, as well as other elements, in the area of deposition. The products of magmatism andsubsequent pneumatolitic-hydrothermal and hydrothermal processes give evidence of directed
248

migration and concentration of elements forming ore mineralization within deep-seated transcrustalfaults.
The continental volcanic belt, where the Streltsovskoye ore field is located, has been tracedfor more than 1000 km across Russia, China and Mongolia.
The Dornotskoye uranium ore field of Mongolia was discovered and explored by Russianspecialists as the continuation of this belt, by using criteria which were established as a result of theStreltsovskoye deposit investigation. Positive signs of uranium potential of volcanotectonic structureson the territory of northeastern China, similar to the Streltsovskaya and Dornotskaye calderas on thegeological structure, were revealed within this belt by joint work of Russian and Chinese specialists.
A uranium-bearing in southeastern China is known in volcanotectonic caldera with commercialores and other occurrences of uranium mineralization. From our point of view, this area has not beenyet completely evaluated.
It is proposed that Meso-Cenozoic intracontinental volcanic belts in other regions of the earthwhich underwent long evolution are also potentially uranium-bearing. It is necessary to use all theavailable data on the formation conditions of deep deposits in volcanotectonic structures fordiscovering large uranium deposits within their limits.
M1XT PAQ11S)!eft BLANK I 249

XA9745143THE VERTICAL DISTRIBUTION OF URANIUM OREMINERALIZATION IN THE VEIN AND METASOMATIC DEPOSITS
A.V. ZAVARZIN, LA. MILOVANOV,V.I. PIGULSKY, A.V. TARKHANOVAil-Russian Research Institute of Chemical Technology,Moscow, Russian Federation
Abstract
The vertical distribution of the uranium resources (VDR) 43 vein and metasomatic hydrothermal depositsis observed. The common features and the reasons of this distribution are discussed. From the surface to the lowestlevels of prospecting works the VDR is defined by the concrete lithological-structural situation (the presence of"traps") and does not depend on the distance from the earth's surface. The vertical range of uranium oremineralization is determined on the basis of VDR data, taking into account the size of post-ore erosional shear, thezonality of ore-enclosed cataclasites and the notions about the uranium transportation and deposition. The maximumrange of uranium ore mineralization is equal apparently to 4-4.5 km. The evaluation of the deposit's deep levelsshould be based on the tendencies of changing of those geological conditions which were discovered by the geologicalinterpretation of VDR diagrams.
At present, the working and surveying depth in vein and metasomatic deposits reaches1.5-2 km and more. We have studied 43 deposits in the CIS countries, Czechoslovakia and formerEast Germany. Due to long experience in the subject, we have much information accumulated on thevertical distribution of reserves (VDR), which could be valuable for both theory and practice. Specialattention was paid for clearer understanding of factors affecting the shape of VDR curves and themaximal extent of mineralization.
The deposits under consideration and geotectonic sedimentation are confined to Pre-Cambrianshields (7 deposits), Caledonian (26), and Hercynian (10) faults. The VDR diagrams of more than20 deepest deposits are given hi Fig. 1. The age of the deposits corresponds to the formation periodof geotectonic entities they are confined to, except for deposits 2.1 and 7.1, the formation of whichtook place during the Mesozoic tectono-magmatic activity.
Out of the 43 deposits, 15 had been completely developed, 11 — almost one half — i.e. at60% of the sites, the larger portion of reserves was assessed by recovery and the smaller belongedto the RAR category. The resources of other sites are less proven and belong to the RAR and EARcategories. With the deepening of the working horizons and more knowledge attained, the maximalin the diagrams go down. The reserves in deep strata of long-producing deposits appear to be smallerthan those in the upper ones due to a sharp decrease of the surveying grid density and an increase ofthe minimal commercial "metro percent" — both measures resulting from profit-raising interests andgrowing cost of mining.
The VDR curves shape is variable enough. The diagram of deposits with simple geologicalstructure (one deposit in one single dislocation) and shallow ones are similar to the curves of normalstatistically obtained data distribution. Extenuated deposits of simple structures are shown asplatformic (Fig. 1./1.3, 4.1,4.6). The deposits with complex structures are presented by curves ofmost peculiar shapes, often even dentiform (Fig. I.I 1.4, 5.2, 6.1).
The VDR curves reflect the primary distribution of uranium minerals accumulated at the oregenesis stage during the hydrothermal process (the period of uranium transport). The followedhydrothermal regeneration of uranium and the effect of hypergenic processes had not influenced theshape of the VDR curve noticeably [3]. It is noteworthy to mention the regeneration at the depositsof Pribram and Zadni Chodov. In the first of the lower horizons, when pitchblende was replaced byU-antraxolite, the productivity decreased by 20%, the reserves decreased accordingly, and a slight
251

to(J\rO
42 4.9 44 4.5 46 4.7
1500
f 1
Deposits:1. Ukrainian Shield:
1.1. Vatutinskoe1.2. Novo-Konstantinovak1.3. Severinka1.4. Tsentralnoe1.5. Michurinskoe1.6. Zheltorechenskoe
2. Aldan Shield:2.1. Elkonskoe Plato + Kurung
4. Kokchetav Caledonian Massif:4.1. Kamyshovo4.2. Vostok + Zvezdnoe4.3. Kosachinoe-Tsentralnoe
4.4. Kutuzovskoe4.5. Sartubek-14.6. Zaozernoe4.7. Manybai
5. Czech Hercynian Massif:5.1. Niderschleme-Alberode5.2. Zadni Chodov5.3. Pribram5.4. Rozna
6. Chatkalo-Kuraminsk Hercynian Folded Region.6.1. Alatanjga
7. Priargunsk Hercynian Massif:7.1. Streltsovskoe + Antey
Additional diagrams:3.1. Area of ore deposits between Ace and Fay mines
(Beaverlodge, Canada)4.7. Deposits in relation to reconstructed paleosurface at the ore
formation moment4.8. Distribution of total reserves in 4.1.
FIG. 1. VDR diagrams.

The confinement of the major part ofreserves:a) to the site of rocks with a complicatedlithological structure,b) to the sloping part of the fault,c) to the "broken" contact of rocks by variousstructural stages
N)
Schematic sections: 1 loose sediments Kz-Mza) Deposit of Severinka 2 volcanites Ms acid (a), basic (b)b) Glavnajaorebody of Vostok deposit 3 volcanite of medium composition S-Dc) Deposits of Vostok + Antey 4 conglomerates (a) tuff conglomerates,
(b) S-D5 flyschcides 06 migmatites Pr8 granites
FIG. 2. The confinement of the major part of resources.
500"
9 orebodies10 borderline of albitized rocks11 tectonic dislocations intersecting (a),
conformable (b)12 alteration diagrams reserves (a), contents(b),
horizontal section area of ore deposits (c)

rise in reserves (a few percent) occurred in the second horizon and the near-surface zone (Fig. I./2.10). However, the altering conditions of uranium deposition during the ore stage had been adecisive factor throughout the whole vertical extent of the deposits.
The conditions change might have been attributed either to the geological restructuring or tothe chemical properties of uranium with their different behaviour at different depths.
Geological interpretation of the VDR curves shape shows that in most cases the appearanceof the peaks and dips is related to certain geological factors, regardless the depth (Fig. 2.). The betterthe deposit has been explored and studied, the clearer the VDR curves indicate the changes inlithologo-structural conditions.
Out of 43 deposits, the VDR is determined by structural conditions at 24 sites, by structuraland partially lithological — at 6, and by both equally — at 13. The structural elements are presentedas "traps" at the sites of flexures, joints or transversions of continuity breaks; in four cases a foldingbreak had additional effects.
The lithological factor is revealed through the physical-chemical properties of the rocks, itis shown in selective confinement of continuity breaks to lithological horizons with favourableconditions for fission formation and their absence in unfavourable rocks, in screened mineralization.The manifestation of chemical properties in a deposit scale has been proven in single cases. However,the location of a deposit within the limits of an ore field, or even a province, points out to theirconfinement of the strata with higher reduction capacity (high concentration of organics and Fe"1"2
minerals). In the Chetkalo-Kuramin region, 90% of reserves belong to the lower series, containingorganic components [3]. Within the limits of the Czech Massif, the mineralization is concentrated inmetamorphosed rocks, containing organics and other reducing agents, in the esocontact with graniteintrusives. They are absent in granites [10]. In the Kokchetav province the mineralization is presentedby sedimentary and effusive-sedimentary rocks with organics. In all the above provinces, the orecontains solid bitumen of hydrothermal origin.
In the geological interpretation practice there were cases when certain significant alterationsof the curve's shape could find no reasonable explanation. These facts might be attributed toinsufficient study or some other reasons (a weak supply of uranium, unfavourable hydrodynamicconditions etc.).
Diagram 4.9 (reserves distribution in relation to paleosurface) shows a lithologo-structuralenvironment within a whole ore province. While plotting it, one could find that the proven reservesof similar significance happened to be rather distant. The error of underestimating the reserves inlower spaces was eliminated The parallel vertical lines of "platforms" on the diagram correspond tothe length of 0.9 km. This length has been underestimated, since the upper region of six deposits wassheared by erosion, and the lower parts of four deposits have not been explored yet. The length ofthe "platform" of the actual diagram and corresponding interval for maintaining geological conditionsshould increase at least on the account of the eroded portions up to 1.1-1.3 km; with the addition ofthe lower parts, it might reach 1.5 km and more.
Several mineralogical and geochemical data and indications of the uranium content within theore indirectly indicate that the favourable conditions for ore deposition remain with the growingdipping.
It is common knowledge that uranium minerals occur in paragenesis with minerals of manychalcophilic elements (Mo, PB, Zn, Cu, Bi, etc.) and iron. At that, the uranium minerals are oftenspatially more widely developed than the minerals of associated elements. This factor might implythat uranium could be relatively more stable in solutions.
254

The composition and ratio of uranium minerals at the ore stage do not change up to the depthof 2 km from the present surface (3 km and more from the paleosurface) if the lithologo-structuralconditions remain unaltered, i.e. the dependence of their deposition on the distance from the surfaceis not evident. One or another uranium mineral present in the ore cannot be indicative of the strippeddeposit depth [3].
Such dependence, based on the chemistry of uranium, might be evident in deeper spaces,since the uranium regeneration, being in principle affected by the depth, was observed at the ZadniChodov deposit [2.10]
Such pitchblende specimen were sampled from the depth range 300-1350 m at Pribram, andthe elementary cell AO size was determined, which revealed no noticeable divergence in any of theregularities [1].
The results of the study, conducted in uranium metasomatites, have shown that thepeculiarities of changes around the ore, deposited at least 1.2-1.5 km from the contemporary surface,are determined by the influence of local factors (composition of enclosing media, properties ofsolution-conducting structures, etc.) [6].
The diagrams on ore contents, changing with the depth, were analysed which verified that thecurves maximals generally depend on geological factors — the position of structural traps withpredomination of rich veined ore, the location of rock horizons with favourable chemical properties— they result in large accumulations of uranium minerals. When the geological conditions retain theirquality in the depth, the contents value remains the same, sometimes it may even grow. The structuralenvironment can change, e.g. the number of ore-enclosing fissures may decrease, but if themorphology and size of the remained fissures are the same, then the structural conditions willgenerally stay unchanged.
Apparently, this is the explanation of accumulations of rich ores throughout all vertical rangesof deposits. Thus, the Niderschleme-Alberode deposit, despite a sharp decrease of veins at 1.8 kmdepth, has several veins at that level with a productivity exceeding 30-fold the average productivityof the deposit [1].
The theoretical and experimental data testify on the carbonate uranium-bearing system beingcapable to withstand considerable variations of the pH value in T, PCO2 and smaller in Eh.
The given facts — the deposition of uranium minerals simultaneously with minerals of manyother elements, the constant composition and ratio of uranium minerals at the ore stage throughouta wide range of depths, and, apparently, the stability of physical-chemical properties and stability ofcarbonate uranium-bearing systems in a changing physical-chemical environment — imply thaturanium-bearing hydrothermal solutions should be relatively stable.
At the developed depths, the vertical variations of physical-chemical properties appear to beunimportant for uranium under unchanged geological conditions, i.e. one can suppose that thedeposition conditions generally undergo no alteration and there is no particular chemical environmentnecessary for depositing uranium at various depths. As it follows, the main reason affecting VDR isthe alteration of lithologo-structural conditions.
The information on VDR makes it possible to determine the vertical extent of a mineralizationmore correctly which requires data on the upper and lower mineralization limits.
The results of the geological survey and considerations about the dimension of erosion searingtestify on the distance from the upper part of the uranium mineralization to the surface at the momentof ore formation having been less than a few hundred metres.
255

The lower limit of a mineralization can be determined by the depth of stripping at a numberof deposits such as Sheltorechenskoe, Niderschleme-Alberode, Pribram, the deposit of Beaverlodgeregion, where it approaches 1.6-2.3 km. At that, the mineralization is not delineated. It is probablethat the size of the sheared upper parts and the lower, yet not completely explored comprise 0.5 km.The lower limit of the mineralization measured from the paleosurface at the ore formation momentcan be assessed to be 3-3.5 km. The reconstruction of the paleosurface in the Chatkalo-Kuraminskregion has made it possible to evaluate the lower limits of ore deposition to be 4-4.5 km [4].
The lower limits of ore formation can be estimated by the depth of various deformationmanifestations (structural zonality) which led to ore-bearing zones formation. Thus, the Ukrainianmedium-temperature uraniferous albitites, formed both metasomatically and by filling various hollows,are characteristic for brittle deformations (cataclasites) formed under hypabyssal conditions 3-7 kmdeep. The medium- and low-temperature deposits of vein and vein-disseminated ores originated byway of filling open hollows on the background of well developed jointing and branching at the depthof 0.5-4.0 km [8].
On the basis of theoretic assumptions, the lower limit can be evaluated only in approximationdue to absence of any comprehensive theory on uranium source in hydrothermal deposits, as well ason the uranium transport forms.
Temperature is also a limiting factor fore uranyl-carbonate solutions, making them unstableat 200-300°C. Proceeding from geothermal gradient (3° per 100 m) and assuming it as high aspossible in the early geologic periods, taking into account some other factors, the maximal depth ofa formation can be 5-7 km [1.7].
In the cases of uranium having been transported as high-temperature (300-500 °C) haloidcomplexes, the depth of deposit formation is limited by the depth of the magmatic centre (source ofuranium) only, i.e. it will greatly exceed the technically feasible working depth [7]. According to asuggestion by A.G. Betekhtin, the depth of uranium sediments transported with haloids can be limitedby certain minimal levels of oxygen concentration. However, the existence of such a level isquestionable.
For comparison, the lower formation limit of hydrothermal deposits bearing non-ferrous andrare metals is evaluated as 5.0 km, with the surveying and working carried out down to 3.2. km [5].
The lower limit of medium- and low-temperature uranium deposits, evaluated by variousmethods, could be set at 3.5-7 km. Using the practical data on VDR of uranium, non-ferrous and raremetals in hydrothermal deposits, it would be wise to accept the 4-5 km depth lower limit for an oreformation of uranium. Apparently, the maximal vertical extent of a mineralization can reach the sameamount (4-5 km) minus the depth of the upper mineralization limit, i.e. a few hundred metres.Tentatively, for evaluation reasons one can accept the lower limit to be 4 km and the maximal extent3.5km.
The multiform VDR curves resulting from a combination of factors do not permit to elaboratea universal model diagram for depth evaluation. Though the structural alterations bound with thedepth have certain regularities, the lithological environment changes and peculiarities of uraniumregeneration bear a local character and cannot be generalized.
An unchanged lithologo-structural environment should make the quality and quantity ofreserves unaltered, and the central part of the diagrams will ideally present a straight line, parallelto the vertical. When the ore enclosing dislocation gets diminished with the depth, the ores becomedepleted and the reserves value decreases. The VDR diagram shapes are similar to the diagrams oflog normal distribution of values.
256

The mineralization depth extrapolation should be based on the alteration tendency peculiar tojust those geological conditions which were found by means of the VDR curves interpretation.
The quantity of metal reserves in one metre of dipping, taken as initial for extrapolation,should depend on the relation of the VDR diagram and the geological conditions change. If therelationship is clear, the lower section of the diagram should be taken, if not, the average reservevalue. It should be noted that the reserves of the lower sections are often unjustly underestimated.
Information on VDR sometimes makes it easy to reveal the basic relationships ofmineralization locality, thus assisting in more correct evaluation of depth. For instance, some suddenchanges in VDR may testify about altered geological conditions, still latent in the deposit. On theother hand, "gaps" in the diagrams of large deposits, ore field and provinces, which failed to beproperly interpreted in geological terms, could be indicative of still unstripped orebodies at the edges.
The absence of geological factors reflected in the curves' shape may indicate errors in thereserves calculation.
The information on the maximal extent of mineralization and VDR of uranium deposits canbe applied to evaluation of the depth of other metals in hydrothermal deposits under similar geologicalconditions.
CONCLUSIONS
(1) At surveyed depths, the VDR of uranium deposits is determined by the actual lithologo-structural environment (presence of "traps") and does not depend on the distance to the day-surface.
(2) Maximal vertical extent of uranium mineralization appears to be 4-4.5 km.
(3) Evaluation of abyssal sections of deposits should be based on the alteration trends specific tothe very geological conditions which were found by geological interpretation of VDRdiagrams. It is recommended to take up the maximal lower mineralization limit of 4 km fromthe paleosurface at the ore formation moment and the maximal extent of mineralization of3.5 km. The information on VDR and extent of uranium mineralization can be applied to theevaluation of depth of deposits bearing other metals of a similar environment.
REFERENCES[1] BATASHEV, B.G., ZAVARZIN, A.V., LEONENKO, B.I. et al, On Vertical Distribution
in Hydrothermal Uranium Mineralization, Geology of Ore Deposits, No.l. (1991) 3-11.[2] DOLEZAL, M. YEGOROV, V.S., ZAVARZIN, A.V. et al., On Metasomatic Uranium
Deposits of Czech Massif, Geology of Pre Deposits, No. 6 (1975) 42-52.[3] ZAVARZIN, A.V., On Mineralogical Zonality of Uranium Hydrothermal Deposits,
Mineralogical Mapping as Research Method for Ore Areas, Sverdlovsk, MIAS (1983).[4] KUSHNAREV, I.P., Depths of Endogenic Ore Deposits Formation, Nedra, Moscow, (1982).[5] LIR, Y.V., Principles and Methods for Evaluating Mineralization Distribution Depth in
Hydrothermal Deposits of Non-Ferrous and Rare Metals, LSU, Leningrad (1984).[6] ORNELJANINKO, B.I., Processes of Near-Ore Alterations in Enclosing Rocks,
Hydrothermal Deposits of Uranium, F.I. Wolfson Ed., Nedra, Moscow (?) 264-293.[7] RAFALSKI, R.P., State and Targets of Experimental Research on Radioactive Elements
Migration Processes, Behaviour of Radioactive Elements in Geological Processes, Nedra,Moscow (1978).
257

[8] TOLKUNOV, A.E., KRUPENNKOV, V.A., SONJUSHKIN, E.P., KHOROSHILOV,L.V., Structural Conditions of Deposit Formation, Hydrothermal Uranium Deposits, F.I.Wolfson Ed., Nedra, Moscow (1978) 220-225.
[9] RICH, R.A. HOLLAND, H.D. PETERSEN, U., Hydrothermal Uranium Deposits,Amsterdam (1977).
[10] Uranium Deposits in Czechoslovakia, Y.A. Arapov et al Ed., Nedra, Moscow (1984).
258

XA9745144THE MINERAL COMPOSITION AND THE ORE TYPES OFTHE URANIUM-VANADIUM DEPOSIT SREDNAYA PADMA(ONEGA REGION, RUSSIAN FEDERATION)
A.V. BOITSOVAll-Russian Research Institute of Chemical Technology,Moscow, Russian Federation
Abstract
The deposit Srednaya Padma is the largest and best prospected of the uranium-vanadium deposits of theOnega region. There are abnormally high concentrations of gold, palladium, platinum, copper and molybdenum inthe ores. The ore mineralization is located in the albite-mica-carbonate metasomatites upon the proterozoic aleorolitesand schists. The ores are generally composed of albite, dolomite and micas. The main vanadium mineral is vanadianflogopite, the main uranium mineral is pitchblende. The proportions of the ore and ore-forming minerals aredetermined. The noble metal mineralization (which associates with selenides of lead, silver and bismuth) and thecopper-molybdenum mineralization (represented by chalcopyrite and molybdenite) are spread extremely irregularlyin the orebodies. The ores can be classified as carbonaceous by their composition. Four mineral ore types, with regardto the mineralization composition of the ore, are determined: pitchblende-flogopite, noble metal-pitchblende-flogopite,sulphide-flogopite and hypergene. The ores are classified in three technological ore types (uranium-vanadium;uranium-vanadium with Au, Pd, Pt; vanadium with Cu, Mo) and two technological ore sorts (by the acid inventoryin processing). The correlation between the composition of the ore and the technological processing parameters aredetermined. The specifics of the various ore types distribution in the orebodies are discovered. A comparison withthe other U-V deposits of the Onega region is made.
1. INTRODUCTION
After disintegration of the USSR 60% of all nuclear power station capacities and only 26%of prospected uranium resources were left on the territory of the Russian Federation. The demand ofRussian nuclear power stations is basically met by accumulated uranium stocks. Beside the Streltovskregion, nowadays there are no more deposits in Russian ready for uranium production. This is whythere is a problem of increasing demand for uranium resources Russia.
At the beginning of the 1980s a number of complex uranium-vanadium deposits with highconcentrations of gold, platinum, paladium, copper and molybdenum were discovered by thegeologists of the state concern "Geologorazvedka" on the northern shore of the Onega lake. Theyhave considerable resources and can be evaluated as a perspective uranium-bearing region (Table I).
The ores of the deposits are known for their complex mineral composition and for an unevendistribution of both valuable components and various minerals affecting the technologicalcharacteristics. The insufficient information on the changeability of the material composition andtechnological properties of the ores was the reason for their mineralogical-technological mapping(MTM) [1]. It was conducted on the Srednaya Padma deposit — the largest and the best prospectedof the uranium-vanadium deposits of the Onega region. The main task of this mapping was theinterrelated studying of mineral composition and technological characteristics, determining of themineral and technological ore types and singularities of their spatial location for the qualitativeevaluation of the ore.
2. METHODOLOGYThe sampling method included the selecting of the drill core samples at the full thickness of
the orebodies. They were formed from the separate core samples. The weight of the separate samplein the united sample was proportional to the length of each ore interval.
259

K)
8 TABLE I. RESOURCES AND MEAN CONTENTS OF THE MAIN COMPONENTS OF THEONEGA REGION URANIUM-VANADIUM DEPOSITS (DATA FROM CONCERN"GEOLOGORAZVEDKA")
1" - "• 11 1 If1 1 VIn • i. 11 Deposit ij |ths.| | tonni , i „,.
205iiaver|C, %
. .L.,., ,. .,
I™1 u11 1|ths. (aver|tonn|C, %i -.1 ——
r — -— — —i Moii )iths. averItonnjC, %i ...
1 ——— •• — iCu
ths.tonni
iAu1
Pdi
Pt——— i ——— i
Iaver I kg. jav.C|kg. lav.CJkg. lav.cIP 7\ \j , /a
•1
)ppmU-. 1 —— 1
!ppmi Ippm.-4-
ISrednaya I I i I i ! S I I ! I 1 ! i I|Padma*f- |107.7|£.3513.10|0.07|1.0 |O.OE| £.0|0.04|1100|0.23|1300|0.£9| 70 |0.02|! I ! ! ! I I ! ! i i I i I I !iTsarevskoe**) 73.7(2.3312.2010.0713,3 |0.07|12.110.24) 210|0.04|1£10|0.£4| 60 |0.02|! ! I I ! i i I i ! ! i I I 1 !IVesenneye***) 82.2|3.09!1.32)0.05)2.9 JO.05) 2.9)0.05)1040)0.18) 460)0.31| 50 |0.02|I ! 1 i I ! i I i 1 1 I i i ! I!Kosmozero***j 69.3)4,22|2.10)0.13)2.2 |0.13|13.8|0.84| 380J0.24! 580!0.36| 50 10.02)iVerhnaya | ! I 1 I ! I I 1 i I 1 ! i 1[Padma** ) 13.1)2.32)0.2410.04)1.7 JO.52) 2.9(0.52) 12010.21) 100J0.18) - | - |iI TOTAL: |351.0|£.89|8.9610.08111.1|0.14|33.7|0.48|E850|0.20|3650|0.£8| 230iO.Q2|i __ ______I______I______1______I_____I_____I_____I_____|______I______I_____I______I______I_____I______I
* - category C-l + C-2** - category C-2*** - category C-2 + P-l

There were 40 mineralogical-technological samples form the Srednaya Padma deposit in all(usually 1-2 samples at one section): 23 samples from the 1st orebody and 17 from the 2nd orebody.The laboratory study of the samples was provided with the wide spectrum of the special methods.
3. THE GEOLOGY AND MINERALOGY OF THE DEPOSIT
The U-V deposits of the Onega region have a similar geological structure and mineralcomposition as the uranium deposits of the Franceville region (Gabon), which correspond to thesandstone type according to the IAEA classification. But by some specific features we can considerthem as an individual type [2].
The deposits are concentrated in the Onega epicratonnal trough, which is filled with thevolcanic-sedimentary rocks of Lower Proterozoic age (schungite schists, sandstones, dolomites andtuffites prevail). The deposits are located in the zones of fold-fracture dislocations, which arepresented by the systems of narrow (2-4 km ) N-W oriented anticlines for the space of 30-90 km.The cores of anticlines are formed by dolomites and the wings by schists [3].
The orebodies are located along the by layers steeply dipping faults filled by the breccias andcataclasites and hi the knots of their crossing with the dipping at low angle thrust-like faults [3]. Thehigh grade ores are connected with the wedge-shaped cataclasm zones in aleurolites and at theircontact with the schungite schists.
The Srednaya Padma deposit is 3 km long and consist of two orebodies with an echelon-likejoint. The first one has a cigar-like configuration, wedge-shaped section and subgentle dip (Fig. 1).Its length is 1060 m, thickness 40-50 m, the average content of vanadium pentoxide is about 3 % and0.13% of uranium. The orebody 2 is situated in the steeply dipping fracture zone in aleurolites andin some wedge-shaped zones contiguous to the first one. Its length is 1840 m, the vertical size is100-450 m, the average content of vanadium pentoxide is 2.4% and 0.11% of uranium. The 2ndorebody contains 63% of the total uranium and vanadium resources but differs from the 1st orebodyby the lower ore grades.
The U-V ore mineralization is situated hi the zonal constructed aureoles of metasomatites uponthe aleurolites and schists. There are the following aureole zones (from the periphery to the centre):
1) pyrite-dolomite-quartz-albite metasomatites,2) albite-hamatite-mica metasomatites,3) mica-carbonate metasomatites.
The albitites (1) usually do not contain ores. The glimmerites (2) are composed of low andmiddle grade ores. The main resources are connected with the mica-carbonate metasomatites.
3.1. Vanadium mineralization
The main vanadium mineral is vanadian flogopite (roscoelite). Fine-scaly aggregates of thebrown flogopite usually form the even dissemination and closely associate with dolomite. The sizeof the flogopite scales is about O.OOn mm, up to the first mm. The chromian micas are representedby green chromphengite, which mainly form streaky and streaky-disseminated aggregates. The contentof vanadium pentoxide changes in flogopite from 8 to 22%, in chromphengite is connected withforming of micas with intermediate composition, but nevertheless the isomorfism between Cr and Vis not fixed.
261

1< £3*90 10
l-schungite aleurolites, 2-arkose aleurolites and tuffaleurolites3-dolomites, 4-fracture zones, 5-volumetric cataclastn zones]6-copper-molybdenum mineralization in albite metasomatites,'7-uranium-vanadium ore mineralization in carbonate-micametasomatites, 8-carbonate streaks with noble metal mineralization9-hematite zones.
FIG. 1. Schematic geological cross section of U-V deposit Srednaya Padma.
262

A small amount of vanadium ore mineralization is related to vanadium hematite (it contains1-10% of V), to vanadian oxides (nolanite and karelianite), to admite and to uranium-vanadates(carnotite, calciocarnotite).
The balance of vanadium resources distribution in the minerals is the following: micas —about 90%, hematite — 7%, oxides and uranium-vanadites — 3%.
3.2. Uranium Ore Mineralization
The uranium ore mineralization has a streaky-nest-disseminated form, uneven distribution andis connected with the carbonate-mica metasomatites. The maximal uranium concentrations are in thecarbonate veins and veinlets.
The main uranium mineral is pitchblende. Usually the aggregates of the broken downspherolites of pitchblende cement carbonate and mica grains. The aggregates of coffinite are spreadrather widely. They form the separate fine dissemination in the low-grade uranium ores or presentwith pitchblende. The nets and streaks of various hypergene uranium minerals (hydrous uranates ofthe curite group, silicates of the urophane group, uranium-vanadites of the camotite group) are widespread in the oxidation zone. An insignificant part of uranium mineralization is connected with thebladed aggregates of uranium-titanates which have a heterogeneous structure. The uranium contentin titanates is only about 5-10%.
The proportions of the uranium minerals hi ores are the following: pitchblende: 65%,coffinite: 15%, hypergene uranium minerals: 20%, uranium-titanates: less than 5%. The part of thepitchblende increases in the high grade uranium ores and the part of coffinite and hypergene mineralsincreases in the low grade ores.
3.3. Noble metal mineralization
The extremely uneven distribution is typical for the noble metal mineralization. The maximalconcentrations are connected with the mica-carbonate veins. It is often represented by the exoticminerals from the group of bismuthides and selenides, such as weibullite, frudite, polarite. Theinclusions of the native gold, intermetal and sulphoselenides of palladium and bismuth were found inthe grains of clausthalite and other selenides [4]. The geochemical association with Cu, Bi, Ag andSe is typical for the noble metals [3].
3.4. Copper-molybdenum mineralization
The copper-molybdenum mineralization is usually met at the edge parts of U-V orebodies withlow-grade ores or out of them (Fig. 1). Its distribution is irregular. The ore minerals are representedby chalcopyrite, chalcosine and molybdenite, which associates with pyrite, marcasite, sphalerite andgalenite.
3.5. Chemical and mineral composition of ores
The silicate analysis of themineralogical-technological samples and their statistical calculationconfirm that the composition of the ore is changeable. The composition of the 1st and 2nd orebodydiffers slightly. The content of vanadium pentoxide in probes is changing from 0.93 to 4.8% (themean is 2.3 %) and of uranium from 0.005 to 0.21 % (the mean is 0.064%). The main ore-composingminerals are albite, mica and carbonates. They make up about 85% of all (Table II). Albite usuallyprevails over other minerals (the mean content is 37%). The concentrations of carbonates change from
263

TABLE II. THE CHEMICAL AND MINERAL COMPOSITION OF THE ORES OF THESREDNAYA PADMA DEPOSIT
2102 T102 AlgOa Fe203 FeO CaO MgOMean : 46.522 .70S 11.963 5.276 1.011 7.203 7.096
x
Minimum : 33.270 .270 6.550 2.580 .090 1.150 4.710MaximumM : 58.940 1.350 15.490 12.780 5.350 13.590 11.230
K£0 P'zOs los.ign.
Mean : 4.194 2.578 .194 11.366 2.106 2.572 2.306
Minimum : 1.580, 1.140 .020 6.330 .110 .140 .930Maximum : 7.200 w" 4.400 1.110 21.220 20.100 5.940 4.300
carbonates albite micas chic-rite quartz hematite
Mean :
Minimum :Maximum :
19.7
1.144.5
37.8
13.961.0
26.0
10.4C1"* OQ( . «i
3.5
014.9
9.1
0.831.3
3.4
1.07.9
264

6 to 44% (the mean content is 21%). The main carbonate is the ferriferous dolomite. Its contentvaries from 1 to 41 %. The calcite and ankerite are met as an impurity. The mean content of micasin ores is 26%.
The concentrations of the rare earths in ores are slightly abnormally high and their industrialsignificance is unimportant.
4. THE INFLUENCE OF THE COMPOSITION OF THE ORE ON THE PARAMETERS OFTECHNOLOGICAL PROCESSING
The technological research carried out in the institute by S.A. Pirkovsky proved that the mostcomplete vanadium recovery was reached only by sulfuric pressure leaching. It was also establishedthat the ores of Srednaya Padma are refractory by the vanadium recovery, easily uranium-recovered,and that the effectiveness of vanadium recovery is determined firstly by the parameter of the aciddischarge of the ore.
The statistical evaluation of the MTM data allowed to determine the relationship oftechnological parameters and the mineral composition. The considerable correlation coefficients forthe acid discharge were obtained with the carbonates — 0.565, and with K2O — 0.48 (as the indexof micas presence). The absolute maximum correlation coefficients for acid discharge (up to 0.743)were obtained with the special parameter of the product of carbonates into K2O (Fig. 2), whichindicates the intensiveness of the carbonate-mica metasomatism.
All known vanadium and uranium minerals were discovered in the after leaching cakes. Theirincomplete recovery is explained by the finally disseminated inclusions of minerals in the insolubleore-forming minerals.
5. MINERAL AND TECHNOLOGICAL ORE TYPES
The important task of the mineralogical-technological mapping is the determination of mineralhnnlnoirsl nrf tvnpcand technological ore types.
The mineral type represents spatially isolated ores with typical mineral composition andtechnological properties.
The technological type is represented by the ores which can be separately mined andprocessed according to a special technological principally devised for them. The technological typesare subdivided into technological ore grades. They are to be treated in uniform circuits but differ intechnological characteristics
5.1. Mineral ore types
It has been found out that the major factors determining the efficiency of the processingtechnology are:
the composition of the ore-bearing rocks,
the content and the correlation of the main ore minerals.
According to the composition of the ore-bearing rocks the ores belong to the composition ofthe carbonaceous type. They are subdivided into two varieties: with medium (10-20%) and large(more than 20%) carbonate contents (Fig. 3).
265

4* ••
ri »•Iii
:
It
•*a
iti
sii•i .
L ,riiii '•
Scatter M*ttan feta fife »2
* i
Sefiestro tealts:
. " /' 1 Mrs ' 28
" .'X Slope 526
. ' X ' . Correl. caff.. .565. x
X \ •
// • . -X ^ "ta<-
3» « S* 0 7» •
•CM inw.
Scatter Hot
_—____——__"_—_——__"",
* J thin . 28* S
X s 1 " * : -^/ lutmcrt • ffl« ^/<'" * Coml. cteff.. .483
4 X
X f
•
i » « a »- 7t «•cM »nw> J
iScatter riot '
'^** i (
10 ' HqressioB fealU'
- ; i Mrs . aj ' x' SI"!* •!!»i x lirtmt»t -68 165i „ • ;^X ; Cwrtl.coeff. .6«
* x. •'X ' '
/, .- 4 •
,» 31 « ft « 7» H
«cid im«n
Suttor riotfrwi «*t> nil rt
I ——————————————————————— .
is ' ' x'" Jfcjrtssioti tesnlU'
. ,'.IX' «hirs : 28< < x' *
'Jj< ' . S l o p e ' 2 1 5 7." !irtCTKpt -5 59S
a; X,-*' ' Correl. coeff.. .713
' Xl/
i*
t i ————————————————31 1C 3» 42 45
Ul «cld Jnvml 1
FIG. 2. The correlations between acid discharge and the mineral composition of the ores.
266

iii DISCHARGEd]-<50 '
F~~~l- 50-60- - "
-ORE BODY
HOLES
| ->60 MO 20
F/G. 3. Projection of orebody 1 on horizontal plane. Some results of samples study.
267

The main mineral type by the ore minerals correlation is the pitchblende-flogopite type, whichforms most of the deposits resources with complex U-V ores. Other vanadium-containing and uraniumminerals rarely prevail over V-flogopite and pitchblende respectively. Therefore, it is possible tosingle out only some mineralogical varieties of pitchblende-flogopite ores: with hematite, withchromphengite, with vanadium oxides, with coffinite, with uranium titanates.
Secondary U-V ores are spread along the fracture permeable zones. They are classified as ahypergeneous mineral type and favourable for leaching.
The presence of significant concentrations of by-components in ores made it possible todetermine noble metal pitchblende-flogopite and sulphide-flogopite mineral types.
The delineation of ore types is not possible now under the existing rare sampling network.
5.2. Technological ore types
Technological ore types have been determined according to the contents of the maincomponents and technological grades of ores — according to their acid discharge.
The main index determining the quality of the ores and technological scheme of processingis the contents of the value components and their spreading at the deposit. Delineation according tothese features has been carried out by the geologists of "Geologorazvedka". These data show that theores of the deposit are represented by the U-V technological type for which the technological schemehas been specially developed. The delineation of pure U or V ores into autonomous sites is presentlyimpossible.
The ores with abnormally high concentrations of copper, molybdenum and nobel metals areclassified as two separate technological types: uranium-vanadium type with gold, palladium andplatinum, and vanadium type with copper and molybdenum. The development of the technologicalscheme for these ores is possible after their delineation on the stage of the detailed prospecting andtaking of representative technological samples.
The ores of the deposit can be characterized as high in acid discharge (60%) of samples withacid discharge of more than 50%). Therefore two technological grades have been determinedaccording to their acid discharge: acid-capacious (up to 50% of acid discharge) and high acid-capacious (above 50%) (Fig. 3).
6. THE PECULIARITIES OF THE OTHER U-V DEPOSITS
The mineralogical-technological studies have ben also carried out for 14 samples from theKosmozero, Tzarevsko\ e and Vesenneye deposits, which, together with the Srednaya Padma deposit,can be considered as a single ore field (Table I).
6.1. Kosmozero Deposit
Several orebodies can be determined in the deposit. Orebody 1 is located in the breccia andcataclasm zone, in aleurolites and sandstones. Orebody 3 is in the cataclasm zone on the contact mica-carbonate and quartz-chlorite-carbonate schist with gabbro-diabase. The ore fragments are representedby albitized schists and glimmerites and the cement by quartz, carbonate and chlorite with sulphides.
268

6.2. Tzarevskoye Deposit
The deposit is situated in the anticline zone. The core of it is formed by terrigene-carbonaterocks and the wings by aleurolites. The rocks are intensively brecciated, mylonitizated and schisted.The tectonic activity was accompanied by hydrothermal-metasomatic and hypergenious processes.Two ore types are determined: carbonate in dolomites and silicate in aleurolites.
6.3. Vesenneye Deposit
Ores of the deposit are located in albite-carbonat-mica metasomatites and by the compositionare similar to ores of the Srednaya Padma deposit. The exception are the ores of the third "non-uranium" orebody in the breccia zone on the contact of dolomites and the underlying terrigene-carbonate rocks. The vanadium micas are in the glimmerites and also in the breccia fractures andcement.
The research of the composition and technological qualities of ores of the Tzarevskoye,Vesenneye and Kosmozero deposits made it possible to find out that:
the ores are mostly carbonaceous, ores in dolomites of the non-uranium 3rd body depositVesenneye belong to the high-carbonaceous type;
the ores are mainly average grade by vanadium and low grade by uranium content, the mainvanadium mineral is vanadian micas;
high recovery of vanadium and uranium (97-99 %) and high acid discharge was obtained formost samples;
the high grade ores of the Kosmozero deposit with a considerable amount of vanadium oxidesbelong to the refractory grade by the technological properties.
7. CONCLUSION
The data obtained on the distribution of various mineral and technological ore types isimportant for maximal and complex recovery of the components. They must be used on the nextstages of exploration of deposits in order to create an optimal programme for its development and fordesigning and processing facilities.
REFERENCES[1] BOITSOV, A.V., BIRKA, G.I., NKOLSKY, A.S., SHULGIN, A.S., Application of
Mineralogical-technological Mapping for the Qualitative Evaluation of Ores of the EndogenicUranium Deposits of Streltsovsk and Kokchetavsk Uranium Ore Regions (CIS), reportpresented at the Technical Committee Meeting, IAEA, Vienna (1993).
[2] TISHKIN, A.I., TARHANOV, A.V., STRELTSOV, V.A., Uranium Deposits of AncientShield, Nedra, Moscow (1990)
[3] SAVITSKY, A.V., BILIBINA, T.V., MELNKOV, E.K., PETROV, Y.V., Regularities ofEmplacement of Onega Type Complex (V, PD, Au, U) Ore Deposits and Prospects of theirDiscovery in the Eastern Part of the Baltic Shield, Geology and Genesis of PGE Deposits,Nauka, Moscow (1994).
[4] POLEHOVSKY, Y.S., VOLOSHIN, A.V., New PGE Nature Systems in the Metasomatitesof South Karelia, USSR, Academy of Sc. reports, v. 315, N3 (1990).
ISEXT PAGE(S) I!©f t BLANK I 269

XA9745145GENETIC TYPES OF URANIUM DEPOSITS OF UKRAINE
V.A. ANYSIMOVSGE Kirovgeology,Kiev, Ukraine
Abstract
There are three genetic classes of uranium deposits in Ukraine. Eight types of uranium deposits are describedwith reference to their genesis, age and geological position. The attributes of uranium concentration in Precambrianand Proterozoic periods of activization are shown.
The territory of Ukraine differs exclusive diversity of geological conditions where uraniumconcentrations were formed. The convincing proofs in kinds of isotopic age of formation of uraniumminerals accumulations during nearly all geological history of considered territory from LowerProterozoic to Upper Neogene (Table I) are present.
TABLE I. THE EPOCHS OF URANIUM ORE FORMATION WITHIN UKRAINE
Limits (Ga) Main geological processes whichled to ore formation
Examples of deposits and occurrences
2.4-2.6 sedimentation and metamorphism2.1-2.2 hydrothermal metasomatism
1.9-2.1 postultrametamorphichydrothermal processes
1.55-1.85 hydrothermal metasomatism
0.5-0.6 hydrothermal matasomatism
0.3-0.4 hydrothermal metasomatism,epigenetic exogenic filtration
0.1-0.2 sedimentation, diagenesis,hydrothermal metasomatism
0.002-0.025 Exogenic filtration of fracturewaters of basement rocksthrough upper coaly sediments
Nikolo-Kozelskoye; Yugok
Chabankovskoye, Nikolaevskoye,Novoselskoye, Sergeevskoye,GeorgievskoyeYuzhnoye, Lozovatskoye, Kalinovskoye,Znamenskoye, Yubileynoye
Maloanastasyevskoye, Perzhanskoye,Anatovskoye, Vladymirovskoye,Gvoszdavskoye, Pavlovskoye, Tankovoye,Krasnogvardeyskoye, Tokovskoye
Kovshilovskoye, Gorodokskoye,Rozanovskoye, Kasperovskoye,Bekkerovskoye, YuzhnobelozerskoyeNikolaevskoye, separate veins atZheltorechenskoye deposit, NovosvetskoyeAdamovskoye, Markovskoye, Svatovskoye,Gorskoye, Chapaevskoye,Dombrovenskoye, Vorobyevskoye,Novoodeskoye, YavornikovoyeBratskoye deposit, Verbovetskoyeoccurrence
Known uranium occurrences relate to some seventeen genetic types of three genetic classes:exogenous (sedimentary, exodiagenetic, epigenetic infiltration), endogenous (magmatic, pegmatic,hydrothermal metasomatic and lodes) and metamorphic (sedimentary metamorphosed).
271

to
^ » C23 • OT3 «
FIG. 1. Metallogenic scheme of the Ukrainian shield with respect to uranium.

Legend:
1-6 GEOLOGICAL REGIONS1 Ukrainian shield2 Don-Dnieper frough3 Volin-Podolian plate4 Black Sea maritime
depression5 Crimean mega-annclmonum6 Carpathian folded system
7-10 LIMITS OF METALLO-GENIC DIVISIONS
7 province8 region9 zone10 areaLimits of zones and areas withinsedimentary cover of the Ukrainianshield are shown by a dotted line
11-17 GENETIC TYPES OFURANIUM DEPOSITS
11 hydrothermal-metasornaacdeposits in carbonate-sodium metasomatues,
12 hydrothermal-metasomancdeposits in potassiummetasomantes andpegmatoid granites,
13 hydrothennal deposits inmineralized zones offracture basement rocks,
14 hydrothermal deposits infracture zones of carbonateand terrigenous beds ofdepressions, cover of theshield and folded regions,
15 sedimentary metamorphicdeposits in conglomeratesand sandstones of crystallinebasement,
16 sedimentary diagenencdeposits in coaly beds,
17 infiltration epigeneocdeposits in particolouredtemgeous sedimentsassociated with zones ofoxidauon-reducnon
URANIUM DEPOSITS1 Yuzhnoye2 Kalinovskoye3 Lozovatskoye4 Bratskoye5 Sadovo-Konstannnovskoye6 Vatutunskoye7 Sevennskoye8 Michunnskoye9 Safonovskoye10 Zheltorechenskoye11 Pervomanskoye12 Nikolo-Kozelskoye13 Devladovskoye14 Novoguryevskoye15 Surskoye16 Chernvonoyarskoye17 Berekskoye18 Krasnooskolskoye19 Adamovskoye20 Markovskoye21 Nikolayesvskoye
METALLOGENIC (URANIUM-ORE) DIVISIONS
PROVINCESI CarpathianII Vohn-PodolianIII Ukrainian shieldIV Don-DnieperV Cnmean-BIack Sea maritime
REGIONS12345
67
TemopolskayaVohnskayaPodolskayaBelotserkovskayaCentral Ukrainian(Kirovograd)DneprovskayaPnazovsayaPoltavskaya
4 Sushchano-Perzhanskaya5 Ovruchskaya6 Emilchinskaya7 Radomishelskaya8 Khmelmtskaya9 Umanskaya10 Braio-Zvenigorodskaya11 Cherkasko-Kirovogradskaya12 Zapadno-Inguletskaya13 Knvorozhsko-
Kremenchugskaya14 Orehovo-Pavlogradskaya15 Gulyaipolskaya16 Maloomsolskaya17 Elanchikskaya18 Konkskaya19 Lisichanskaya20 Starobelskaya21 Markovskaya22 Volnovahskaya23 Novoodesko-Molochanskaya24 Kirovskaya
AREAS1 Chop-Mukachsevsky2 Rahovsko-Chivchinsky3 Baranovsky4 Khodorkovsky5 Dimersky6 Skvirsky7 Tarashchansky8 Vatutuisko-Alexandnsky9 Sursko-Verhovtsevsky10 Chertomliksky11 Volnyansky12 Devladovsky13 Sinelmkovsky14 Pnluksky15 Miragorodsky16 Novosanzharsky17 Karlovsky18 Slavyansky19 Pavlogradsky
ZONES123
Samborsko-YaremcbenskayaSamenskayaDnestrovskaya
273

Within Ukraine all three genetic classes are represented by uranium deposits of different agesand within various structures and lithological positions. According to genesis, age and geologicalposition, the uranium deposits of Ukraine can be divided into eight types (Fig. ):
1. Sedimentary metamorphosed deposits in sandstones and conglomerates associated with theinitial stage of development of the Lower Proterozoic geosyncline in the central part of theUkrainian shield.The isotopic age of ores is 2.4-2.6 Ga.Example: Nikolo-Kozelskoye deposit.
2. Hydrothermal-metasomatic deposits in pegmatoid granites associated with granitization duringthe finishing stage of the Lower Proterozoic geosynclinal cycle in the north-western, centraland south-eastern parts of the Ukrainian shield.The age of ores is 1.9-2.0 Ga.Examples: Yuzhnoye, Lozovatskoye, Kalinovskoye deposits.
3. Hydrothermal-metasomatic deposits in albitites associated with the first Middle Proterozoicstage of tectonomagmatic activization following consolidation of Lower Proterozoicgeosyncline in the central part of the Ukrainian shield.The isotopic age of ores is 1.55-1.8 Ga.Examples: Michurinskoye, Vatutinskoye, Severinskoye deposits.
4. Hydrothermal veins and impregnated deposits in tectonic breccias, as well as in folding,fracturing and layering zones in ferromagnesian and sodium metasomatites within LowerProterozoic ferruginous quartzites and crystalline schists associated with the same period ofthe Middle Proterozoic tectonomagmatic activization.The age of the ores is 1.7-1.8 Ga.Examples: Pervomayskoye and Zheltorechenskoye deposits.
5. Hydrothermal subagree predominantly impregnated deposits in tectonic and altered sandstonesof "white" Devonian connected with the intrusion of volcanic alkaline rocks within contactarea between the folded Donets basin and the Ukrainian shieldThe isotopic age is 320 million years.Example: Nikolayevskoye deposit.
6. Sedimentary and exodiagenetic deposits in Lower Carbonic coaly sandstones, sometimes inlimestones, aleurilites, argillites within the northern slope of the Dnieper-Donets depression.They are possibly processed with additional uranium intruding at Kimmeridgian time.The isotopic age of ores is 200 million years.Example: Markovskoye deposit.
7. Hydrothermal vein-impregnated deposits with subagree and crosscutting ore bodies in crushedand hydrothermal altered saturated by bitumens of petroleum series Upper Permian andLower Triassic, seldom Carbonic, Lower Permian and Lower Jurassic sandstones directlywithin salt domes of Dnieper-Donets depression associated with Kimmeridgian tectonicactivization.The age of ores is 180-200 million years.Examples: Adamovskoye, Krasnooskolskoye, Berekskoye deposits.
8. Epigenetic infiltration deposits in coaly Middle Paleogene sands filling tectonic depressionsin the roof of Precambrian basement rocks of the Ukrainian shield associated with completionof Alpine orogenesis within the Mediterranean belt that has resulted in the formation of theCarpathian and Crimean mountains and in the rasing of the Ukrainian shield.The isotopic age of ores is 25 million years.Examples: Devladovskoye, Surskoye, Bratskoye, Safonovskoye deposits.
274

Taking into account the history of geological development of the earth's crust segment whereUkraine is located and known shows of uranium concentration, it is possible to assume that theprospects of discovery here new uranium deposits remain significant. Discovery of new deposits ofall three genetic classes is possible.
Exogenic deposits of sedimentary, exodiagenetic and epigenetic infiltration types can bediscovered in Carbonic coaly formation within the Donets basin, in Carbonic and Jurassic formationswithin the southern slope of the Dnieper-Donets depression, on the bottom of Lower Cretaceousformation within the southern slope of the Ukrainian shield, in Neogene formations in theTranscarpathian and Forecarpathiandepressions, as well as in Paleogene-Neogene bitumen formationsof the Carpathian and Crimean plain.
The genesis of new uranium deposits will be probably magmatic, pegmatitic andhydrothermal. As it is known, the first two of them have a practical significance only when uraniumis in complex with other metals. The geological conditions answering to this requirement are observedin Ukraine.
Magmatic uranium deposits can be connected with the intrusions of Lower and MiddleProterozoic and Lower Paleozoic alkaline rocks including carbonatites in the eastern and south-western parts of the Ukrainian shield and within the contact area of the folded Donets basin and thePriazov block of the shield. Here uranium can associate with tantalum, niobium, zirconium,phosphorus.
Apparently pegmatitic and hydrothermal deposits in pegmatoid granites associate withintrusive and ultrametamorphic granitoids finishing the Early Proterozoic stage of the Ukrainian shielddevelopment. Therefore, they should be widespread in the central and north-western parts of theshield. Except for uranium these deposits can also contain thorium, rare earth elements, including theyttrium group and such rare metals as lithium, rubidium, tantalum.
The main prospects of increase of uranium resources in Ukraine must be connected withhydrothermal vein and vein-impregnated ores in fault zones which associate with five (threePrecambrian and two Phanerozoic) periods of tectonic and tectono-magmatic activization. Theattributes of uranium concentrations are already establish for all these periods.
The first of them with an age of ore formation of 2.1-2.2 Ga is stipulated by tectonicpreparation to mass granitization of metamorphosed and folded rocks of Early Proterozoicgeosynclines and to implantation of granite intrusions. The indicated process was widely displayednot only inside geosynclines but also in framing archeozoic formations — reflected activization. It wasintensively developed in the western part of the Ukrainian shield.
The second period with an age of ore formation of 1.5-1.8 Ga is stipulated by large block-intrusions with complicated (from acid to basic) composition within formed Early Proterozoicgeosynclines which are widespread in the central, north-western and south-western parts of theUkrainian shield.
The third period with an age of ore formation of 0.8-1.2 Ga associates with formation anddevelopment of two avlakogenes within a consolidated platform. These avlakogenes set west, north-west and north-east limits of the present Ukrainian shield and provoked renewal of movements withintrusion of dykes and small-size intrusions through many faults in marginal parts and inside theshield.
Potential Phanerozoic uranium-ore periods of activization are connected with Hercynian andKimmeridgian stages of tectonogenesis which took place in regions surrounding the Ukrainian shield.There are few attributes of uranium mineralization. Its perspective is defined by favourable geologicalconditions in the folded Donets basin, Carpathian mountains and Volin-Podolian plate. Numerous
275

uranium occurrences of Kimmeridgian time (160-200 million years) are fixed in outcrops of oldcrystalline rocks of the Carpathian mountains, in various Upper Precambrian rocks and LowerMesozoic rocks within the Dnieper-Donets depression and folded Donets basin.
The new deposits of metamorphic class, initially exogenic and endogenic, are most probablythere where the structure of Lower Proterozoic geological formations has volcanogenic formationswith acid and medium composition and where the metamorphic degree of these formations is minimal.The north-western part of the Ukrainian shield (teterevskaya series with novograd-volinskaya bed,leptite-clessovite of osnitskaya series) is equal to these conditions. The rocks of this region are theretocharacterized by one of the highest uranium backgrounds in comparison to other regions of theUkrainian shield.
BIBLIOGRAPHY
ANDERSON, E.B., TARKHANOV, A.V., ZASLAVSKY, V.G., Age ratio between uranium oreformation and regional metamorphism within Zheltorechenskoye deposit, Soviet Geology 12 (1987)64-69.
BELEVTSEV, Ya.N., BAKARJIEV, A. Ch., KOVAL, V.B. et al., Uranium deposits of Ukraine,Geol. J. 5 (1992) 28-43.
BELEVTSEV, Ya.N., BATASHOV, B.C., KOVAL, V.B., The Zholtye Vody uranium deposit andiron ore deposits of Krivoy Rog, XXVII Session of the IGC, Excursion 108, Guidebook, NaukovaDumka, Kiev (1984).
BELEVTSEV, Ya.N., KOVAL, V.B., BAKARJIEV, A. Ch. et al., Genetic types and regularitiesof location of uranium deposits in Ukraine, Naukova Dumka, Kiev (1995).
EGOROV Yu.P., SUKHININ, A.N., Some regularities of formation and disposition of Precambrianmetasomatic uranium deposits, Geol. J. 2 (1969) 52-60.
SHUMLYANSKIY, VA. A., SERGEEV, I.P., KORNEVA, N.G., Conditions of uranium and thoriumaccumulation in basal beds of sedimentary cover of large platform depressions, Geol. J. 4 (1984)46-58.
SHUMLYANSKIY, V.A., ANYSIMOV, V.A., URALOV, V.A. et al., Kimmeridgian ore formationof Volin-Podolian plate, Proceedings of the Academy of Science of the USSR, Geological series 12(1980) 110-122.
Geology and genesis of uranium deposits in sedimentary and metamorphic formations, Moscow,Nedra (1980).
Metallogeny of Ukraine and Moldavia, Kiev, Naukova Dumka (1974).
Rules of prognostication of deposits within Ukrainian shield and its frame, Kiev, Naukova Dumka(1975).
276

XA9745146CLASSIFICATION SYSTEM OF THE MINERALRESERVES AND RESOURCES OF UKRAINE
V.I. LOVYUNIKOVState Commission of Ukraine on Mineral Resources,Kiev, Ukraine
Abstract
This paper describes the system used to classify the resources and reserves of all minerals and fuels inUkraine. The classification system is part of an official procedure determined by the Ukrainian State Commission onReserves. Following preparation of resource estimates the results are registered with the State, which maintains anofficial inventory of all mineral resources. This paper compares the Ukrainian system to, and finds it compatible withthe United Nations International Framework of resource classification. The UN system is based on economics ofproduction and mineability.
1. GENERAL CLAUSES
1.1. The classification defines the common principles of the calculation and state registrationof the reserves and the estimation of mineral resources for the State Fund of Ukraine.
1.2. The prospected and preliminary estimates reserve of resources and also the perspectiveresources of oil and gas are calculated and registered in the State balance of the Ukrainian mineralresources based on the results of geological-exploration works (GEW). This includes all of test miningand drilling carried out during the process of commercial development of mineral deposits. Thebalanced and, conditionally balanced reserves and resources of solid, liquid and gas-like mineralresources are subjected, to state registration. These estimates underwent the examination andestimation of the Ukrainian State Commission on the reserves of mineral resources (SCR), and alsothe additional reserves discovered during deposit development. New deposits (fields) are added to theState balance according to the decisions of the State Commission of Reserves (SCR).
1.3. The perspective and prognosed estimated mineral resources are quantitatively estimatedfor the limits of all prospective areas based on the results of geological, geophysical, geochemical andother evaluation methods.
1.4. The reserves are calculated and registered, the resources are estimated separately for typeof mineral resources and the direction of their commercial usage.
1.5 The reserves of the complex fields of the main and jointly bedded mineral resources andalso the present useful components must undergo estimation and registration. The necessity of theircommercial usage is established by the standards on mineral raw materials. The reserves of associatedmineral resources and components are calculated and registered according to the "Demands ofcomplex studying of the mineral resource deposits which are sent to the State examinationestimation".
1.6. Quantitative estimation of prospective and prognosed resources is complex. For this aimthe demands as to the quantity and quality of mineral resources and also the presence of usefulcomponents in them have been used. Is also necessary to take into consideration the standards of theknown analogical deposits together with the possible changes of these demands in the nearest future.
1.7. Estimation and registration of the mineral reserves and the available useful commercialcomponents are made in the case of their presence in the earth. Recoverable reserves of mineralresources are established according to the optimal system of development, which is substantiated by
277

variational technical-economical calculations. These reserves include the losses during extraction,enrichment and processing of raw materials. The reserves of the associated useful components, whichare accumulated during the processing of mineral raw materials in goods concentrates, products ofmetallurgical or another redistribution are calculated and registered so by the presence in the earth,as in the products and minerals which are extracted. For oil, gas-condensate, natural and dissolvedgas and the other included useful components both the total and recoverable reserves are estimatedand registered.
1.8 The estimation of the mineral resources quality is carried out according to the possibledirections of their using correspondingly to the standards and demands of the acting standards andtechnical conditions and taking into consideration the technology for extracting and processing of theraw materials. At this point the composition of useful and harmful components, the forms of theirlocation and the peculiarities of their distribution in the products of redistribution and waste materialsof production are established.
1.9. Estimation and registration of the mass and volume of the reserves and quantitativeevaluations of the mineral resources are made in the units of mass and volume. Exploitational reservesof underground waters are estimated and registered, and prognosed resources are evaluated in cubicmetres per day. Steam-water mixture in tonnes per day. In industrial waters the quantity ofcomponents with commercial value (in tonnes) is established. These components may be obtained inthe deposits during the calculation terms of its development without taking into consideration thelosses during waters processing. By the deposits of heat-energetic waters, except the exploitationalreserves, the heat-energetic power of the field is estimated (in gigajoule, megawatt, tonnes ofconditional fuel).
1.10. The application of this classification for different kinds of mineral resources is regulatedby the corresponding instructions of the Ukrainian State Commission on the reserves of mineralresources.
2. CLASSES OF MINERAL RESERVES AND RESOURCES BY THE DEGREE OFTHEIR STUDYING AND TRUSTWORTHINESS
2.1. Mineral resources that are evaluated based on geological data studying in the areas ofthe earth, on the earth's surface, in the water and gas sources and on the bottom of water reservoirsas good for commercial exploitation by the conditions of bedding, quantity and quality compose thecurrent mineral resources, and together with the accumulated production — the initial mineralresources of the objects of geological investigation.
2.2. Depending on their determination mineral resources are subdivided into the reserves ofmineral resources of the discovered deposits (pools) and the mineral resources of the undiscovereddeposits (pools) in the perspective areas of the earth.
2.3. Depending on the degree of geological study completed mineral resources are subdividedinto two classes: prospected (proved) and preliminary estimated (probable).
2.4. Prospected (proved) reserves of mineral resources are the reserves with quantity, quality,technological properties, mining-geological, hydrogeological and other conditions of bedding werestudied in the degree suitable for their commercial exploitation. The main parameters of theprospected reserves, which stipulate the project decisions as to the production and processing of rawmaterials and environment prospection, are established by the data of immediate measurements orinvestigations done by the uniform volumetrical network in the contours of the deposits with thelimited extrapolation, based on the data of geological, geophysical, geochemical and otherinvestigations. The main predestination of the prospected reserves is the projecting of the building ofmining enterprises and the fields development.
278

2.5. The preliminary estimated (probable) reserves of the mineral resources are the reservesof which quantity, quality, technological properties, mining-geological, hydrogeological and otherconditions of the bedding that have been studied to the degree suitable for the technical-economicalevaluation for either commercial exploitation or test-commercial development. The main parametersof the preliminary estimated reserves of mineral resources, which influence the choice of methods ofextracting and processing the war materials, are estimated mainly on the basis of the dataextrapolation of measurements or investigations, located in the field limits by rare or uneven network.Extrapolation is grounded by the analogy with the prospected pools (deposits), and also by the dataof geological, geophysical, geochemical studying bowels of the earth. The main purpose of thepreliminary estimated reserves is the projecting of further prospecting of test-commercial developmentof the field and its preparation for the commercial exploitation.
2.6. Depending on the degree of geological study and reliability of the mineral resources ofperspective underground deposits are subdivided into two classes: perspective and prognosed.
2.7. Perspective mineral resources are the resources of certain geological commercial type,quantitatively estimated based on results of geological study in the limits of productive regions withthe known fields of mineral resources of the same geological-commercial type. Perspective resourcestake into consideration the possibility of discovering of the new deposits (pools) of mineral resources,the existence of which is stipulated by the positive evaluation of the established existance of mineralresources, geophysical, geochemical and other anomalies whose nature and perspectiveness areproven. Quantitative evaluations of the deposit (pool) parameters are determined on the basis ofgeological interpretation of geophysical and geochemical data or statistical analogy. The main use ofthe perspective resource estimation is planning prospecting and exploration.
2.8. Prognosed mineral resources are the resources that take into consideration the potentialpossibility of the fields forming of certain geological-commercial types, based on positivestratigraphical, paleographical, lithological, tectonical, mineraogenic and other preconditions,established in the limits of regional geological structures with undiscovered commercial fields.Quantitative evaluation of the prognosed resources is done on the basis of assumed similar parameterswith the analogous geologic structures where discovered deposits of mineral resources of the samegeological-commercial type. The main use of the prognosed resources is planning of regional andprognosing-geological works.
2.9. The instructions for using the classification for the deposits of separate kinds of mineralresources define the categories of explored deposits of the mineral resources in the limits of classesby the degree of geological studying and trustworthiness.
3. RESERVES AND RESOURCES GROUPS BY THE DEGREE OF THEIRPREINVESTMENT STUDY
3.1. Rational and effective geological study of the subsurface earth with the aim ofdiscovering or prospecting the mineral resources deposits envisages the optimal succession ofgeological-exploration works (GEW). In order to determine the expediency of investing the next stageof geological-exploration works or the building of mining enterprise the geological-economicalevaluation (GEE) of the objects of geological studying are done. Pre-investment studies of theseobjects envisage the establishing in detail of mining-geological, technological and technical-economicalcharacteristics of the mineral resources deposits, and also the social, ecological, lawful and otherconditions of the field development and the realization of raw materials or the products of theirprocessing.
3.2. The primary geological-economical evaluation (GEE-I) is done for the basing ofexpediency of the investing the exploration-prospecting works in the earth's areas perspective fordiscovery of mineral resources. GEE-I is carried out on the grounds of qualitative evaluation of
279

perspective resources and is given in the form of technical-economical suppositions (TESp) as to theirpossible commercial importance.
3.3. The preliminary geological-economical evaluation (GEE-II) is done with the aim ofbasing the expediency of commercial exploitation of the deposit (area) of mineral resources and theinvesting of successive prospecting and preparation for their development. GEE-II is done on theground of the preliminary evaluated reserves of mineral resources and is given in the form oftechnical-economical report (TER) on the expediency of further prospecting or test-commercialdevelopment of the deposit (area).
3.4. The detailed geological-economical evaluation (GEE-III) is done with the aim ofestablishing the industrial activity effectiveness of the mining enterprise, which is created on the basisof prospected reserves of mineral resources and includes the technical-economical substantiation (TES)of the standards for their evaluation.
3.5. Thus the mineral reserves and resources by the degree of their preinvestment studyingare divided into three groups:
3.5.1. To the first group the reserves of mineral resources are related reserves, on the basisof which the detailed geological-economical evaluation (GEE-III) is done of the effectivenessof commercial activity of mining enterprise which is projected for their development. Thematerials of GEE-III, including TES of stable standards for mineral raw materials, underwentthe examination and were estimated by the Ukrainian State Commission on the reserves ofmineral resources.
3.5.2. To the second group the reserves of mineral resources are related reserves on the basisof which the preliminary geological-economical evaluation (GEE-II) of their commercialimportance is done. The TER materials on the expediency of the field further prospecting,including TES of temporary standards of mineral raw materials, underwent the examinationand were approved by the Ukrainian State Commission on the reserves of mineral resourcesor by the client (investor) of the exploration works.
3.5.3. To the third group of the resources and reserves of mineral resources are related these,on the basis of which the primary geological-economical evaluation (GEE-I) of the possiblecommercial importance of the earth's perspective area is done. The TES materials on theexpediency of further exploration works and the parameters of recommended standards formineral raw materials underwent the examination and were approved by the client (investor)of exploration works or the Ukrainian State Commission on the reserves of mineral resources.
4. RESERVES GROUPS BY THEIR COMMERCIAL IMPORTANCE
The classes of mineral resources and useful components are divided into three groups: theircommercial importance
balanced,conditionally balanced,out of balance.
4.1. Balanced reserves are reserves that at the moment of evaluation accordingly to thetechnical-economical calculations may be economically extracted and used with modern techniques andtechnology of production and processing of the raw materials, which provide the keeping of demandsof the rational using of the bowels and the protection of natural environment.
280

4.2. Conditionally balanced reserves are reserves the effectiveness and production and usingof which at the moment of evaluation cannot be precisely established, and also the reserves thatcorrespond to the demands for the balanced reserves, but cannot be used because of unsolved,unlawful, ecological and other questions.
4.3. Reserves out of balance are reserves the production and using of which at the momentof evaluation are not economically justified. However, in future they may become of commercialimportance.
4.4. Only in their balance perspective and prognosed resources are evaluated on the basis ofassumed parameters only in their balance part. Out of balance and conditionally balanced componentsof perspective and prognosed resources are not estimated.
5. GROUPS OF MINERAL RESOURCES DEPOSITS BY THE COMPLEXITYOF THEIR GEOLOGICAL STRUCTURE
5.1. By the complexity of geological structure the deposits of mineral resources or their areas,which are envisaged for the development by individual enterprises, are divided into four groups:
5.1.1. To the first group belong deposits (areas) of simple geological structures withundeformed or weakly deformed bedding of the deposit, consistent quantitative or qualitativeparameters of the mineral resources pools, even distribution of the main useful and harmfulcomponents.
5.1.2. To the second group belong deposits (areas) of complex geological structure withinconsistent quantitative or qualitative parameters of the pools of mineral resources, unevendistribution of the main useful of harmful components.
5.1.3. To the third group belong deposits (areas ) of very complex geological structure withchanging quantitative of qualitative parameters of the reserves of mineral resources, veryuneven distribution of the main useful or harmful components.
5.1.4. To the fourth group belong deposits of extremely complex geological structure withsharply changing quantitative or qualitative parameters of the deposit of mineral resources,with absolutely uneven distribution of the main useful or harmful components.
5.2. During the determination of the geological structure complexity in the field are used theindices of changing of the main deposit parameters which contain no less than 70% of the rawmaterial reserves.
5.3. The instructions for using the classification for different kinds of mineral resourcesenvisage the using of quantitative evaluations of changing of the mineral resources pools parametersand the indices of the raw materials quality for the establishing the groups of complexity of the field(area) geological structure.
6. PREPARATION OF THE MINERAL RESOURCES DEPOSITS (AREA) FORCOMMERCIAL EXPLOITATION
6.1. The state of preparation of mineral resources for commercial exploitation is determinedby the decisions of the Ukrainian State Commission on the Reserves of Mineral Resources. Thedecision is made following examinations of the materials of geological-economical estimations of thedeposits (areas) of mineral resources, taking into consideration the conclusions of the clients andperformers of geological surveys, the investors of the mining facilities construction, which are
281

projected on the basis of these reserves, and also the demands of the legislation of nature protectionand the legislation on the earth's bowels.
6.2. The state of geological study of the reserves of the deposits (areas) mineral resources,which are prepared to the commercial exploitation and are transferred to the users of the bowels mustcorrespond to the following conditions:
6.2.1. Balanced reserves of the main and jointly bedded mineral resources and the availablein the adjoining useful components of commercial importance were estimated by the Ukrainian StateCommission on the Reserves of Mineral Resources.
6.2.2. The volumes of total reserves and resources of the field (area) in its geological limitswere established as to the degree of their geological studying, reserves and resources of theneighbouring undeveloped fields of mineral resources which are taken into consideration at theprojecting of construction (reconstruction) the mining objects for the establishing of possibleperspectives of the enterprise development, the bordering depth and the development area, the choiceof the way of uncovering the pools' mineral resources, the places of laying of the mine shafts, thelocation of industrial constructions, access roads and so on.
6.2.3. The volumes of balance prospected and preliminary evaluated reserves of mineralresources were established which are used for the projecting of construction (reconstruction) of themining objects, the possibility of these reserves development is substantiated without damage for themineral resources pools which are left in the earth's bowels.
6.2.4. The quantity of the prospected reserves of the first class of geological studies providesthe activity of mining objects for the period of returning of capital investments into prospecting andcommercial exploitation of the field.
6.2.5. The dangerous ecological factors are established and estimated which influence or mayinfluence the state of natural environment and human health during prospecting and development ofthe field, processing of raw materials, storage of industrial waste; the rational complex of themeasures as to environment protection and the people's health is worked out; the backgroundparameters of the environment state are established; preliminary consent are obtained for special useof plots of land with the aim of the mineral resources extraction according to the legislation.
6.2.6. The profitableness of industrial activity of mining object is grounded by technical-economical estimations which is projected on the basis of the reserves of mineral resources establishedby the State examination, taking into consideration the expenses for additional prospecting of mineralresources, the effectiveness of capital investments into the field (area) development is provided at thelevel of income average norm.
6.3. For the projecting of construction of mining and processing objects in the field of thefirst and second groups of the geological structure complexity the prospected reserves of mineralresources of the first class of geological studying are used; in the fields of the third and fourth groupsof the geological structure complexity the prospected and preliminary estimated reserves of mineralresources of the first and second class of geological studying in the ratio which is determined by theinstructions of the classification as to the separate kinds of mineral resources.
6.4. By the agreement of the interested users of the earth's bowels under conditions ofeconomical risk the transfer of the preliminary estimated reserves of the deposits of mineral resourcesmay be realized before their examination and estimation by the Ukrainian State Commission on thereserves of mineral resources with following obligatory estimation. In such cases the reservesstudying, which are transferred to commercial exploitation, may not correspond to the demands ofpoints 6.2 and 6.3 of this classification, on condition that geological studying provides the establishing
282

TABLE I. CORRELATIONS OF UKRAINIAN CLASSIFICATION OF RESERVES AND RESOURCES OF MINERAL RESOURCES WITHINTERNATIONAL FRAMEWORK FOR CLASSIFICATION OF RESERVES AND RESOURCES
UN International ~*Framework
4
Feasibility study
Prefeasibility study
Geological study
Ukrainian system
detailed preinvestmentestimation (TES)
preliminarypreinvestmentestimation (TER)
primary preinvestmentestimation (TESp)
Detailed exploration
Class 1explored
1. (1.1.1)2. (1.1.2)3. (1.1.3)
1. (1.2.1)2. (1.2.2.3. (1.2.3)
General exploration
Class 2preliminary estimated
reserves (probable)
1. (2.2.1)2. (2.2.2)3. (2.2.3)
1-3(2.3.1-3)
Prospecting
Class 3prospective resources
Reconnaissance
Class 4forecast resources
usually do no
singled out
1 (3.3.1) 1(4.3.1)
.«v—4
I
UN Framework1. Economic2. Marginally economic3. Subeconomic1-3. Economic-subeconomic
oo
Ukrainian system1. Balanced2. Conditionally balanced3. Out of balance1-3. Indivisible balance and out
of balance
(1.1.1)-Figure indices of reserves and resources

and evaluation of harmful ecological factors connected with the deposit exploitation, according topoint 6.2.5.
6.5. In the deposits which are brought into development the additional prospecting andexploitation prospecting are carried out.
6.5.1. The additional prospecting of the developed deposits is carried out in their insufficientlystudied parts (flanks, deep or upper horizons, separated areas, etc.) and is done consequentlyaccording to the plans of productive works.
6.5.2. The exploitation prospecting which leaves behind the development of productive works,must specify the data on morphology, inner structure, conditions of the pools bedding anddevelopment and the quality of their mineral resources by data of drilling the additional wells and ofhole-making of the mining-preparatory and other workings. The exploitation prospecting, whichaccompanies the productive works, must specify the quantitative and qualitative indices of the mineralresources pools by data of drilling and investigations in development and regime wells, investigationsin the cleaning mining workings, etc.
6.5.3. In the result of carrying out the additional prospecting and exploitation prospecting ofthe deposits (areas) of the developed mineral resources the transferring of preliminary evaluatedreserves into prospected ones, and also the calculation and registration of the established reserves aremade.
6.6. In the developed deposits of mineral resources the uncovered, prepared, ready forextraction and also being present in the protecting pillows of mining-capital and mining-preparatoryworkings of the reserves of mineral resources are estimated and registered separately with theirdividing into classes and groups according to the degree of geological studying and their commercialmeaning.
6.7. The recalculation and the examination of the reserves of mineral resources are made bythe State in the following cases:
if in the result of mining or additional exploration works or the investigations as to the poolregime of mineral resources in the developed deposits the summary prospected balancereserves increases for more than 50% in comparison to the preliminary evaluated ones by theUkrainian State Commission on the reserves of mineral resources, or if the written-off andenvisaged for the writing off the prospected reserves as those that were not proved orinexpedient for production by technical-economical (mining-technical) reasons, exceed thenorms established by legislation;
if the revision of the standards demands and technical conditions as to the quality and quantityof mineral resources, the technology of their processing leads to decreasing of summarybalance prospected reserves of the deposits of mineral resources of more than 20% or theirincreasing for more than 50%.
if the exceeding of real terms of exploitation of the deposit (area) reserves of mineralresources over the adopted ones at heir State examination and evaluation is reached in theextent that leads to the reconstruction of mining objects in connection with the changing ofexploitation conditions.
284

XA9745147EVOLUTION OF URANIUM FORMATIONIN PRECAMBRIAN OF UKRAINE
V.B. KOVAL, Yu.A. FOMINMetallogeny Department,Institute of Geochemistry, Mineralogy and Ore Formation,National Academy of Science,Kiev, Ukraine
Abstract
The physical and chemical processes of uranium ore formation are used to describe the evolution ofPrecambrian age uranium deposits of the Ukraine. The processes controlling increasing migration of uranium in theenvironment are identified. These process are associated with two periods in the Precambrian: late Archean and earlyProterozoic. Geochemical and isotopic evidence based on samples from uranium deposits are discussed.
The processes of increasing of uranium migration activity and changing of its partitioncoefficient between solid phase and fluid to favour of last are dated as late Archean, it connected withgrowth of water partial pressure. During this stage at temperatures of over 400°C chloride, phosphaticand hydratic complexes were dominated for uranium transportation. According to our experimentalresearch, the most effective uranium transfer could be carried out by chloride complexes of iron aswell as calcium and magnesium. On the inclusion data such fluids have been seen exocontact zonesaround field of late Archean granitization. Superfluous chemical elements were removed from thosezones to form iron-magnesium metasomatites, iron ore deposits and plagiomigmatites in perpheralzones. At the Ukrainian Shield alike rock series most fully represented near the village of Petrovo(North Krivorozye), where uranium content in iron-magensium metasomatic rocks reaches n x 10"'to 10"2%. At the granites of Dneprovsky block many biotite lenses with uranium-containing monaziteand xenotime were found. Regionally enumerated processes are connected with formation of thermal-cupola structures, which are framed by greenstone belts. Its isotopic age is 2900-2500 m. years.
The second stage of uranium regeneration was early Proterozoic. At that time at the UkrainianShield trough structures of different scale were born and developed. Krivorozsko-Kremenchugskayabelt is the best known example. Lower (arkosic-conglomerate) and upper (organic-enriched) rockbenches of that belt are essentially uranium-bearing. Under metamorphism of those rocks uraniumore deposits with uranium content near 1% have been formed. Examples: some deposits ofZoltorechemskoye and ore deposit Thervony Shahtar. Their isotopic age is 2200-2000 m. years.
The most productive stage of uranium deposition in Ukraine is the stage of albitization. Theisotopic age of ore deposits is 1750-1800 m. years. The albitization processes are connected withearly Proterozoic microclinization processes, which have very wide development and are well-knownat all Precambrian shields (so-called "potassium explosion"). We believe that they were a result ofan applied endogenous wave which was born by increasing of upper mantle volume. All geologicalevents caused by that wave in the upper beds of the earth's crust determine the division border UpperArchean-Lower Porterozoic. Natrium metasomatism processes separate from metapepsis processesin 250-300 m. years. Basification processes connected with enlargement in lower beds of earth crustwere accompanied by removing of potassium from them. It spent for microclinite formation andnatrium released from rocks spent for albitization. There was the evolution of polychrome systemwhich had a large vertical stretch and where early chloride fluid changed by late carbonate solution.
Isotopic (S, C, O, H) study of the albitite uranium deposits of the Ukrainian Shield shows oreforming system polygenesis. At the natrium- carbonate metasomatism formation besidemetamorphogeneous solution descending isotopically light oxygen meteoric water took part in fluidcomposition. The meteoric water role was increasing during the process. Carbon, sulfur and, inaccordance with lead-isotopic research, uranium mainly took out from host rocks. At the same timethere are evidences of sulphur and carbon entrance into tectonic-metasomatic zones by ascending
285

depth emissions during diaphthoresis and especially at the period of ore formation. In temperaturediapason 200-300 °C isotopic balance at system: sightly ore albite of early association-water wasestablished. Then it was broken when the productive (ore) mineral associations were formed. Probablyit was due to the complexity of geological systems, exactly to combination of metamorphogenous-metasomatic surroundings, depth emissions, meteoric water, that ore-controlling geochemical barriersin tectonic-metasomatic zones appeared. Those barriers were fixed by isotopic data.
To solve this problem, isotopic-geochemical research was concentrated on the borders ofrepresentative sections of slightly eroded deposits where overlying ore, underlying and rooted partsof tectonic-metasomatic zones were revealed (Severinovskoye, Vatutinskoye and other ore deposits).
The sulphur, carbon and oxygen isotope distribution at minerals of uranium-containingmetasomatites have fixed the presence of lateral and vertical isotopic-geochemical zonality.
Lateral zonality causes by position of natrium-carbonate metasomatite aureoles at tectonic-metasomatic zones and by changing of isotopic parameters from host rocks and diaphthorites toalbitites and ore deposits. At all parts of zones the tendencies of isotopic parameter changing arestable. There are considerable sulfur and oxygen lightening and carbon getting heavy withsimultaneous increasing of last quantity.
Vertical zonality is discovered under isotopic comparison of uranium-containing albitites atdifferent levels. Extreme significances of isotopic characteristics as an indication of metasomaticprocess maximum intensity coincides with the most productive ore parts of zones. Over- andunderlying parts isotopically are equal but carbonates with heavy (a18) > 16%) oxygen are presentat the first and absent at the second. At the rooted parts of metasomatic zones the isotopic parameterchanging is minimal. On the whole the changing curves of all isotopic parameters and linearproductivity are identical.
The albitite ratio Fe2O3/FeO at the sections changes similarly, reaching the maximum(2.64-3.34) at the ore part levels and decreasing to 0.82-1.40 at the zone rooted parts. Thus theexistence of reduced-oxidative geochemical barriers are confirmed. The localization of uranium oredeposits are determined by oxidation possibility of Fe-containing mineral iron. The process intensitydepends on the degree of iron oxidation.
On the basis of isotopic zonality it is possible upon the extreme significances of isotopiccharacteristics to conclude about deposition depth of the most productive ore deposits (at the studyingobjects the depth is from 220-340 to 900-930 m). The comparison of isotopic parameters at thedifferent zone parts also allows to conclude about levels of its erosion.
The question about combination of endogenous and exogenous factors of uranium ore depositsformation is still discussed. We concede the exogenous factor influences at rich ore formation, butat the same time suppose that such ore could form by endogenous way.
Thus uranium ore deposit formation in Precambrian Ukraine connected with the repeateduranium regeneration at the time interval Upper Archean-Lower Proterozoic. This regeneration causedto endogenous and exogenous processes, leading to earth crust differentiation: the entrance to crustof additional chemical elements which removed from the division sphere crust-upper mantle duringrise of its border. Maximum element removing with their fixation at upper beds of earth crust wasat the mantle projection exocontacts. On isotopic data mantle projection rise were polystage processand took place for a long time. Uranium regeneration and deposition to ore concentrates happenedat some stages, the rich ore deposits formed at late stages. We suppose that the contrast rich oredeposits could form if late metasomatites laid on uranium-bearing albitites.
286

XA9745148TWO MAIN TYPES OF URANIUM DEPOSIT WITHINPHANEROZOIC FORMATIONS OF UKRAINE
V.A. SHUMLYANSKIYInstitute of Geochemistry, Mineralogy and Ore Formation,National Academy of Sciences,Kiev, Ukraine
Abstract
The two main types of uranium deposits occurring within Phanerozoic formations of Ukraine are described.They consist of uraniferous bearing bitumen in the Upper Carboniferous to Lower Triassic red beds, and infiltration(roll front type) uranium ores, occurring in the sediments filling ancient Paleogene river valleys. The first deposit typeinclude black to dark brown beds of disseminated to massive bitumen occurring respectively as ozyantraxolite andoxykerite. These beds include uranium, as well as other metals. This uranium mineralization is dated at 195 to 200million years old. The second type includes infiltration deposits in Paleogene coal bearing sediments, with the uraniummineralization occurring in the upper part of the sequence. The sediments occur within paleovalleys eroded into theunderlying crystalline basement of the Ukrainian shield and its weathered crust. The paleovalleys extend to a depthof 70 to 90 metres. The coal bearing sediments are overlain by sediments of younger age. Several uranium depositsof the second type are known, including a few identified as being of industrial grade.
1. INTRODUCTION
Phanerozoic deposits surround the Ukrainian shield. They form the platform mantle of theVolyno-Podolian plate, fill the Dnipro-Donets and the Nearblacksea depressions and participate in thestructures of Donets, Dobrugia-Crimea and Carpathian folded areas (Fig. 1). Cenozoic deposits froma thin cover over the Ukrainian shield.
Several uranium deposits and numerous ore manifestations are known within sedimentaryformations. Increased uranium concentrations within terrestrial deposits of the Middle Devonian andLower Cretaceous appear near outcrops of the Pre-Cambrian crystalline rocks. There are theuraniferous coals in the Middle Carboniferous deposits on the south slope of Voronezh crystallinerock mass. The oil and gas-bearing Dnipro-Donets depression is characterized by widespreaduraniferous bitumen deposits and smaller uraniferous manifestations. There are also commercialuranium deposits in the Eocene sedimentary rock of the shield cover. They are located in the Dniprolignite basin.
Two main t>-pes of uranium deposits within the Phanerozoic formations are recognized by theimportance of their uranium concentrations. There are uraniferous bitumen in the UpperCarboniferous to Lower Triassic red beds and infiltration uranium ores in the ancient Paleogene rivervalley.
2. URANIFEROUS BITUMEN DEPOSITS
The Adamovskoe deposit is typical representative of the uranium-bitumen deposits. It is partof the south-eastern Dnipro-Donets depression. That depression is filled by carboniferous, LowerPermian, Triassic, Jurassic, Cretaceous and Palogene sediments. They overlie the rift which is filledby thick Devonian terrigenous, saliferous and effusive formations.
The Devonian salt deposits which lies at the basis of anticlines and structural swells formnumerous diapir and salt domes (Fig. 2). The uranium-bitumen mineralization is associated with thesestructures.
287

KJoo00
r \lyiv\\Wp-i *
FIG. 1. Map of the uraniferous sedimentary structures in Ukraine and Moldova.
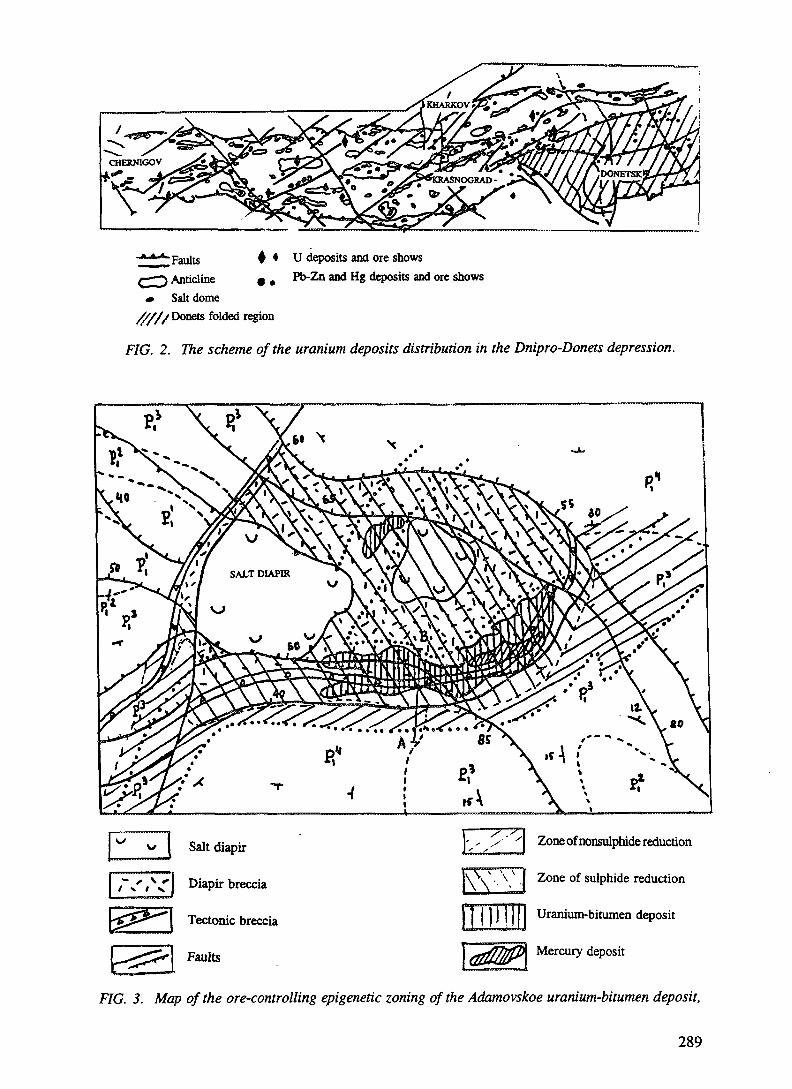
: FaultsAnticline
« Salt dome^y/Donets folded region
4 * U deposits and ore showsg t Pb-Zn and Hg deposits and ore shows
FIG. 2. The scheme of the uranium deposits distribution in the Dnipro-Donets depression.
^ v/ I Salt diapir
/" Nx,x ^ I Diapir breccia
i^m^
Tectonic breccia
Faults
X .' Zone of nonsulphide reduction
A. \ \ I Zone of sulphide reduction
Uranium-bitumen deposit
Mercury deposit
FIG. 3. Map of the ore-controlling epigenetic zoning of the Adamovskoe uranium-bitumen deposit,
289

to8
4. Iff .
-700
RED CLAY AND ROCK SALT
f.'
Y77ARed rocks
Zone of non-sulphide reduction
Zone of sulphide reduction
Uraniferous bitumen
Mercury mineralization
•./.'.••'. -."I Pyritized rocks
Diapir breccia
U . . I Saltdiapir
F/G. 4. TTze geological section A-B of Adamovskoe uranium-bitumen deposit.

The total thickness of the Phanerozoic formations near Adamovskoe deposit is estimated at6.5 km by geophysical data. They form the large Slavyanskaya anticline. The north-western part ofthe anticline is broken by two Devonian salt diapirs. One of them is overlain by Triassic red beds,and the second is located under the Paleogene deposits.
The uranium-bitumen mineralization is located within the Triassic sediments. It is controlledby the old channels which surround the Adamovsky salt dome (Fig. 3). The old channels are filledwith polimictic sandstones as shown in Fig. 4. In addition, the uranium-bitumen orebodies arecontrolled by the southern and northern faults, and also by the distribution of the epigeneticallyreduced, intensively argillized and pyritized Lower Triassic rocks. The orebodies (up to 11 units inthe total of 100-200 m) are the black and dark brown beds of disseminated or massive bitumen. Theblack bitumen has the characteristics of oxyantraxolite, and the dark brown bitumen the characteristicsof the oxykerite. Furthermore, there are many disseminated barren bitumens of the asphaltite andasphalt classes. The black bitumen is enriched by uranium (in excess of 1%) more than the brownbitumen (in tenths of one percent), the typical ore consists of a terrigenous quartz (69-80%), feldspars(1-3%), carbonates (1-10%), clay minerals (5-15%), iron sulphides (1-3%) biotite and chlorite(< 1 %). The uraniferous bitumen content varies from one to 85 %.
The orebodies of the cross-cutting type are located near disjunctive dislocation and containabout 10% of total uranium reserves.
The solid bitumen also contains vanadium, molybdenum (up to 1%) and chromium (up to0.1%). This bitumen is intimately associated with CR-bearing montmorillonite and calcite whichformed at 180-190°C. Cinnabar is also present in the form of disseminations and veinlets along withuraniferous bitumen and iron disulphides. Galena, shpalerite, barite, celestite, fluorite occur in thecalcite enriched rocks in the lower part of the Triassic in the southern fault zone. The sulphides andfluorite contain admixtures of mercury or diffuse cinnabar.
The argillitized rocks and the associated mercury and polymetallic mineralization extendwithin the Lower Permian and carboniferous deposits along the southern fault to a depth of more than1000m.
The content of lead ranges up to 1%, zinc — 10% and mercury — 0.3%. The uraniferousbitumen, V and Mo are not found beneath the Triassic deposits, despite the fact that the barren solidand liquid bitumen are widespread.
The age of uranium ores is from 200 ±10 to 195 ±5 mil. years according to U-Pb data(Lower-Middle Triassic). It is possible that the uranium ore was formed as the result of interactionbetween oxygen-bearing groundwaters and the hydrocarbon-bearing hydrothermal solutions whichdeposited the mercury-polymetallic mineralization.
3. INFILTRATION (ROLL-FRONT TYPE) DEPOSITS IN COAL BEARING SEDIMENTS
The second important type of uranium deposits are the infiltration deposits in the Paleogenecoal-bearing sediments which fill the paleovalleys. The paleovalleys are cut in the crystalline rocksof the shield and its weathered crust to a depth of 70-90 m. The coal-bearing sediments are overlainby the Eocene and Oligocene marine deposits, or directly by Miocene littoral sands. The cover bedsare usually 30-60 m thick.
The paleovalleys are formed by the rivers which ran off the Ukrainian shield to the north intothe sea basin of the Dnipro-Donets depression, or to the south into the Tethys sea basin (Fig. 5).Some paleovalleys are filled completely by river sediments but others only partially. Those which arefilled only partially are in the lower part of the Paleogene cover and are overlain by lagoonal orlacustrine marsh deposits.
291

to
sj 4- n^&(i
y^-'&f / ,».01
FIG. 5. Paleogeographical map of the western part of the Dnipro lignite basin, Middle Eocene.

UORE
RIVER PALEOVALLEY .
FIG. 6. Geological section of the Khutor skoe uranium manifestation.
to

Boundaries of the paleovalley•^%& Fully oxidized fluvial sediments}f ( \ \ \ Interlayered oxidized and unoxidized sediments
Uranium orebodies
FIG. 7. Map of the epigenetic zoning of the Safonovskoe uranium deposit.
The main uranium deposits (Sadovoe, Bratskoe, Safonovskoe, Devladovskoe,Novogurievskoe) and manifestations (Khistoforovskoe, Khutorskoe and others) are associated witha river sedimentary complex at the south and central parts of Dnipro lignite basin (Fig. 5). The sheeturanium deposits of the valley type are distributed along nearly the entire width of the channel(Devladovskoe, Bratskoe, Novogurievskoe deposits). The uranium deposits of the near-slope typeform narrow sinuous strips along paleovalley slopes (Sadovoe, Khutorskoe, Tashlykskoe and otherdeposits and manifestations) (Fig. 6). The localization of ore deposits depends on the developmentof the ore-controlling oxidizing zones which can develop downslope from the upper reaches of theriver valley or from the sides of valleys (Fig. 7). Uranium bodies are distributed in all river sedimentsand also often in the upper part of the weathered Precambrian bedrock. The thickest and richestorebodies are located in lower and middle parts of river sands. Ore-bearing coaly sands predominate;clays and brown coals are less frequently ore-bearing.
The lagoonal facies are composed of coaly-clay sediments with rare small interbeds of fine-grained sand and sandstone. Thick coal deposits are characteristic of this complex. Two commercialuranium deposits (Surskoe, Chervonojarskoe) and numerous ore manifestations are in sediments ofthe complex. Uranium ores are mainly controlled by ground oxidizing zones. They are thereforelocated in the upper part of the Eocene coaly sediments. They are the ores of the ground-bedoxidizing zones which are present on slopes and in upper reaches of river valleys.
The locustrine marsh complex occupies a large area (Fig. 5). Its deposits consist of coalysiltstones, clays and thick beds of brown coal with sand interbeds. They fill a shallow (up to 20 m)gentle depression (40-50 x 20-30 km). These deposits are the least uraniferous of all. There are onlysmall ore manifestations in the peripheral parts of locustrine marsh basins. Uranium concentrationsare controlled by the ground oxidizing zones are located in the upper part of coal-bearing series (incoaly clays, brown coal).
294

Ore-controlling oxidizing zones in water-bearing horizons of Dnipro lignite basins wereformed as a result of oxidation of iron sulphides and organic carbon by groundwaters. There are threemain lithological types of uranium ores. In the Bratskoe deposits these are: coaly sands (63%), coalyclays (13%) and brown coal (16% of reserves), the reserves of uranium ore in the upper part of theweathered Precambrian crust are not more than 8% of the total. Uranium occurs mainly in coal-richand clay-rich matter. Uranium hydroxides (—17%), uraniferous leucoxene ( — 5%) and ironhydroxides (~3%) are minor. The zone of uranium mineralization coincides with the zone ofepigenetic reduction and hydrosulphuric and sorptive precipitation of some elements. An addition toiron disulphides there are bravoit, violarite, jordisite and sphalerite. High contents of Se, Mo and Reare present in some orebodies. Some deposits also have Zn, Co, Ni and Tl. The development of theriver drainage and the zones of oxidation and the formation of uranium ores started between the earlyand late Pliocene and is continuing at the present time.
295295

XA9745149
URANIUM DEPOSITS: MAIN TYPES AND CONCEPTS FOR DETECTION
G.A. MASHKOVTSEV, Ya.M. KISLYAKOV, A.K. MIGUTA,I.S. MODNIKOV, V.N. SHCHETOCHKINAll-Russian Scientific Research Institute of Mineral Resources,Moscow, Russian Federation
Abstract
This paper presents a classification of uranium deposits as a basis for developing an optimal explorationstrategy for discovering deposits with favorable characteristics for low production cost. The classification is basedon endogenic and exogenic sub-classes both of which are subdivided to syngenetic and epigenetic groups. The tectonicsetting is also taken into consideration. Following description of the economic and geological types of deposits, thefactors governing the formation of the deposits is given.
The recent uranium mineral resources in Russia are required to be essentially improved, bothin quantitative and qualitative respects. In response to this statement, forecasting and prospectingworks in the country should be aimed at the discovery of new large districts with a highly profitableuranium mineralization, which would be either rich or relatively poor, but at the same time adaptableto streamlined production. In order to enhance the efficiency of forecasting, concepts for the detectionof uranium ore mineralization were worked out. They are based on the results of analysis, concerningthe leading world types of uranium deposits, which are consistent with modern economic andtechnological requirements.
Extremely high mobility of uranium, especially at moderate and low temperature andpressure, causes a wide range of its natural concentrations. The intense prospecting and exploration,which were carried out during last decades all over the world, gave rise to the discovery of hundredsof uranium deposits of different type, dimension, ore quality, technological propenies, and mode ofprocessing.
Many classifications of uranium deposits exist; they are based on genetic features, tectonicsetting, host rock composition, geological structure, morphology of orebodies, etc. (P. Kerr, 1955;D. Surazhskii, 1956; V. Ziegler, 1974; M. Shumilin, 1978; F. Dalkamp, 1989; N. Laverov, 1992and others). The classification, proposed by the authors (Table I), involves all up-to-date knowneconomic deposits — proven and potential — and has a genetic background. Endogenic and exogenicclasses of ore concentrations are distinguished. Contrary to some investigators, the authors believethat the separation of a specific class of polygenic uranium deposits is inexpedient, because a geneticaffinity of deposits would be more properly defined by the main type of productive process. Allsubsequent alterations, including those positively affect the ore quality, are of the second geneticimportance. Each of the classes is subdivided into two groups of syngenetic and epigenetic deposits.The farther classification is issued from the tectonic setting of ore deposits (Table I).
In the endogenic class the objects of main interest are represented by epigenetic(hydrothermal) deposits from the areas of tectonomagmatic rejuvenation of shields, median massesand foldbelts. Above else, this are rich deposits, located in Precambrian tectonic and stratigraphicunconformities (Cigar Lake, Ranger), in exocontact zones of erogenic granitoids within medianmasses (Schlema-Alberoda) and in superimposed volcanotectonic structures of Mezozoic age(Streltsovskoe).
In the exogenic class the epigenetic (infiltrational) objects also play a leading role. They arelocated in platform forelands, epiplatform erogenic belts, and arches within shields and previouslyformed foldbelts. Large and intermediate deposits, related to zones of strata! oxidation in permeablerocks of sedimentary cover, are most important.
297

TABLE I. ECONOMIC AND GEOLOGICAL TYPES OF DEPOSITS00
Genetic Genetic Tectonic setting Economic type of depositclass group
Singenehc Shield blocks affected U and Th-U types(magmato- by granitnation formed at final stages ofgemc) graninzabon
Rejuvenated I) type in long-existedPrecambnan shields faults within areas of
protorejuvenabon
Au-U type in long-existed faults withinareas of Mesozoicleconomag-mabcrejuvenabon
Protoplatform U and Ni-U types indepressions tectonic and strabgraphic
unconformities
Endogenic Epigenetic Areas of tectonomag U and P-U types in nfto-(hydro- mabc rejuvenation of gemc troughsthermal) foldbelts
U type in exocontactzones of granitoids
U type in volcanogeiucand terrigenous rocks indepressions
F-Mo-U type insuperimposedpalcovoicamcdepressions
V type in highlyradioactive granitoidplutons
Host rocks
Alaskites, migmabtespegmatoid rocks
Gneisses, ferruginousquartzitcs, homfels,migmatates, granites
Crystalline schists,migmahtes, granites
Crystalline schists andgneisses withintercalations ofcarbonaceous andcarbonate rocks,sandstones and siltstonesof sedimentary coverQuartz sandstones,carbonaceous shales,conglomerates, diabases.granitesAmphibolites,carbonaceous-siliceousschists
Chlonte-hydromica,rarely carbonaceous-siliceous schists, diabases.limestones
Acidic, intermediatebasic volcanics, tuf-faceous sandstones,metamorphosedlimestones and granitoidsof basementLeucognuutcs
Associated alterabon
Quartz - K-feldspar
Riebickite-aeginnc andchlonte albiutes.alkaline amphibolcrocks, aeginmbtes
Pynte-carbonate-K-feldspar
Chlonte, illite.sencite,occasionally magnesite
Chlonte and ankentealbilites
Albitc-carbonate-chlonte
Hydromica
Quartz-hydromica,quartz-kaolinite-monbnonllomteankente-chlonte-albite
Albite, chlonle-mica.occasionallymonbnonllonite-zeolite
Main ore minerals
Uranmite, belafite,uranolhonte, zircon.monazitc, molybdenite
Uraruiute, brannente,coffinite, pitchblende
Brannente, Au-beanngpynte
Coffinite, uraniumoxides, sulfides,arsenides, selemdes, andtellundes
CofTimte, brannente.pitchblende, F-apabte
Pitchblende, Pb, Cu Mosulfides
Coffinite, pitchblende,Fe, Zn, Cu sulfides,occasionally Ni arsenides
Pitchblende, cofflnite.brannente, jordisite,fluonle
Pitchblende, Fe sulfides.occasionally -uranortl
Orebody morphology
Bedlike and lenticular
Platelike loads, lenses,bodies of irregular shape
Platelike loads and lenses
Flattened linear loads inunconformities, near-concordant and cross-cutting bodies inbasement
Pillarlike and lenticularloads
Veined and lenticularbodies
Lenticular and bedlikeloads, rarely veinedbodies
Flattened stockworks,steeply dipping lenticularand veinlike bodiesbedlike toads
Veined and lenticularbodies
Scale of deposits, orequality and technological
propertiesLarge and intermediatedeposits of poor ore,well-dressed and easilybroken downLarge and intermediatedeposits of ordinary ore,satisfactory dressed andeasily (occasionalsabsfactory) brokendownLarge and intermediatedeposits of ordinary ore,well-dressed and easilybroken down
Large and intermediatedeposits mainly of nchore, welt-dressed andeasily broken down
Large and intermediatedeposits of ordinary ore,well-dressed andeasily broken downLarge and intermediatedeposits mainly of nchore, well-dressed andeasily broken downLarge and intermediatedeposits of nch andordinary ore, mainlywell-dressed and easilybroken downLarge and intermediatedeposits of nch andordinary ore, mainlywell-dressed and easilybroken down
Intermediate deposits ofordinary and nch ore,well-dressed and easilybroken down.occasionally suited tounderground leaching(UL)
Examples of deposits
Rossing, Charlebois,Yuzhnoe
Michunnskoe,Vahibnskoe,NovokonstantinovskoeZheltorechcnskoe
Druzhnoe, KurungElkon, Snezhnoe
Cigar Lake, Rabbit Lake,Jabiluka, Ranger
Grachevskoe,Kosachmskoe
Oberschlema,Niederschlema, Pnbram
Schmirhau, Roist,Beerwalde
Strellsovskoe,Tulukuevskoe,Argunskoe, Chauli
Lunusin, Gomoe
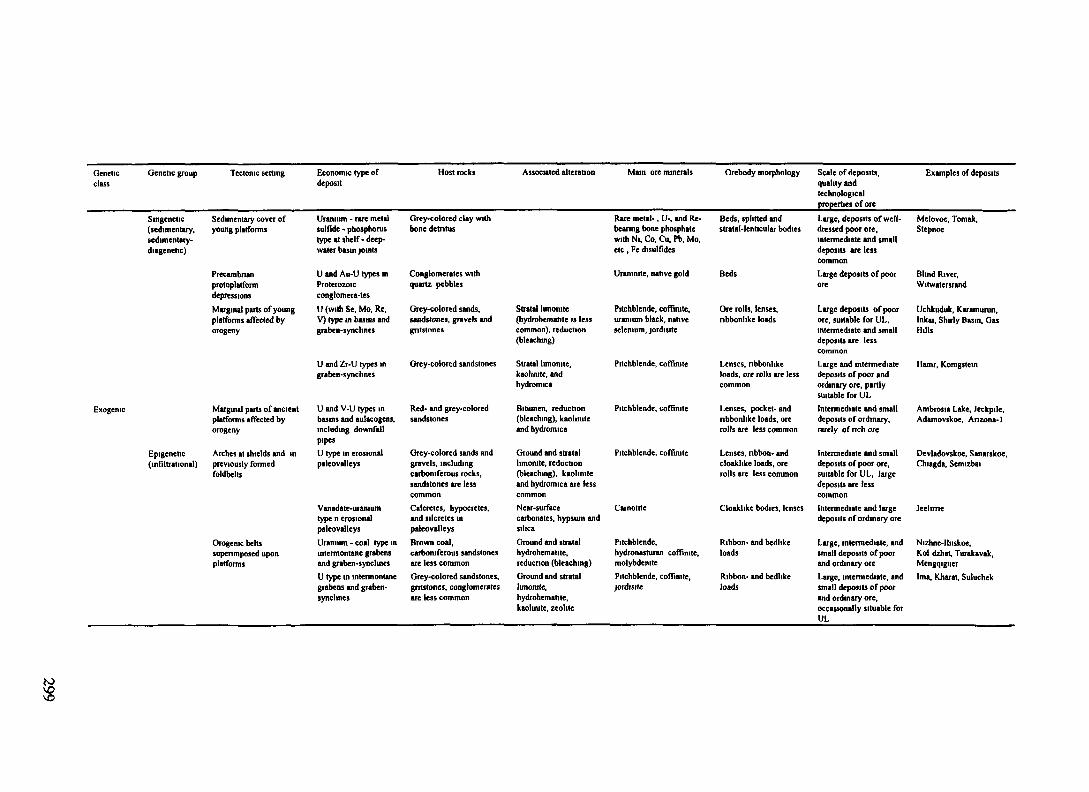
Genetic Genetic group Tectonic settingclass
Singenelic Sedimentary cover of(sedimentary, young platformssedimentary-diagenetic)
PrecambnanprotoplatformdepressionsMirginal parts of youngplatforms affected byorogeny
Exogemc Marginal parts of ancientplatforms affected byorogeny
Epigenehc Arches at shields and in(infiltrational) previously formed
foldbelts
Orogemc beltssupenmposed uponplatforms
Economic type ofdeposit
Uranium - rare metalsulfidc - phosphorustype at shelf -deep-water basin joints
U and Au-U types inProterozoicconglomera-tesU (with Se, Mo, Re.V) type in bums andgraben-synclines
U and Zr-U types ingraben-synclines
U and V-U types inbasins and aulacogens,including downfallpipesU type in erosionalpaleovalleys
Vanadate-uraniumtype n erosionalpaleovalleysUranium - coal type inintermontane grabensand graben-synclinesU type in intermontanegrabens and graben-synclines
Host rocks
Grey-colored clay withbone detritus
Conglomerates withquartz pebbles
Grey-colored sands,sandstones, gravels andgritstones
Grey-colored sandstones
Red- and grey-coloredsandstones
Grey-colored sands andgravels, includingcarboniferous rocks,sandstones are lesscommonCalcretes, hypocretes,and silcretes inpaleovalleysBrown coal,carboniferous sandstonesare less commonGrey-colored sandstones,gritstones, conglomeratesare less common
Associated alteration
Strata! limomte(hydrohematite is lesscommon), reduction(bleaching)
Stratal limomte,kaolinile, andhydromica
Bitumen, reduction(bleaching), kaolmiteand hydromica
Ground and strata!limomte, reduction(bleaching), kaolmiteand hydromica are lesscommonNear-surfacecarbonates, hypsum andsilicaGround and strata!hydrohematlle,reduction (bleaching)Ground and stratallimomte,hydrohematite,kaolmite, zeolite
Mam ore minerals
Rare metal- , U-, and Re-bcanng bone phosphatewith Ni, Co, Cu, Pb, Mo,etc , Fe disulfides
Uramnite, native gold
Pitchblende, coffuute,uranium black, nativeselenium, jordisite
Pitchblende, coffuute
Pitchblende, coflinite
Pitchblende, coffuute
Camotite
Pitchblende,hydronasturan coffmite,molybdenitePitchblende, coffinile,jordisire
Orebody morphology
Beds, spirited andstratal-lenUcular bodies
Beds
Ore rolls, lenses,nbbonlike loads
Lenses, nbbonlikeloads, ore rolls are lesscommon
Lenses, pocket- andnbbonlike loads, orerolls are less common
Lenses, nbbon- andcloaklike loads, orerolls are less common
Cloaklike bodies, lenses
Ribbon- and bedlikeloads
Ribbon- and bedlikeloads
Scale of deposits,quality andtechnologicalproperties of oreLarge, deposits of well-dressed poor ore,intermediate and smalldeposits are lesscommonLarge deposits of poorore
Large deposits of poorore, suitable for Ul..intermediate and smalldeposits are lesscommon
Large and intermediatedeposits of poor andordinary ore, partlysuitable for ULIntermediate and smalldeposits of ordinary,rarely of rich ore
Intermediate and smalldeposits of poor ore,suitable for UL, largedeposits are lesscommonIntermediate and largedeposits of ordinary ore
Large, intermediate, andsmall deposits of poorand ordinary oreLarge, intermediate, andsmall deposits of poorand ordinary ore,occasionally siruable forUL
Examples of deposits
Melovoe, Tomak,Stepnoe
Blind River,Wirwatersrand
Uchkuduk, Karamurun,Inkai, Shiny Basin, GasHills
Harm, Koragstein
Ambrosia Lake, Jeckpile,Adamovskoe, Anzona-1
Devladovskoe, Sanarskoe,Chiagda, Semizbai
Jeelime
Nizhne-llnskoe,Kol dzhat, Turakavak,MengqiguerIma, Kharat, Suluchek
to

Stage of ore alteration,enrichment or impoverishment
of primary ore
Ore stage intense ore formation
in areas of multistage
development of metasomatic
processes (tens of My)
Pre-ore (ore-preparing) stage
accumulation of uranium
and its repeated redmnbunon
with increase of mobile form
amount
Weathering and crust formation
Late tectonomagmatic and metasomatic
processes
Epithermal alkaline and earth alkaline
metasomatism and associated sharp
redistribution of uranium
Multistage differentiated potassic volcanismand intrusive activity with additional uranium
supply
Rejuvenation of previously existed faults
and appearance of new ones
K-Si metasomatism,subsequent to granitization
Heterochronous palingenetic-metasomatic granite formation,
leucogranites being
predominant
Low-grade metamorphism with initial uranium accumulation
FIG. 1. Evolutionary geological model of endogenic uranium deposits formation.
300

Post-ore stage:erosion of deposits andburial of them underreduced conditions
Ore stage:
formation of productivezones of strata! and ground
oxidation (up to 20-30 My)
Pre-ore stage
(hundreds of My)
Stagnant exfiltrationalhydrodynamics
Peneplanation
Rejuvenation of erosion Reinforcement of orogeny
Elevated U content in
ground water(nx 10-5-nx 10'6 g/1)
Infiltrational hydrodynamicsregime
Epigenesis under reducedconditions
Low-amplitudeorogenesis
Deposition of near-shore marine and continental
terrigenous sediments, mainly grey-colored,
intercalated with motley-colored and water-resisting
horizons
Formation of depressions: marginal platform basinsand graben-synclines, intermontane basins,
erosional paleovalleys
Formation of ore material sources: granites, acidicvolcanics, occurrences of uranium mineralization
FIG. 2. Evolutionary geological model ofexogenic epigenetic uranium deposits formation.
301

A comparison of geological and genetic features of economic deposits led to the conclusionthat all large uranium deposits appear as a final event in the sequence of prolonged interrelatedgeological processes that induce a directional uranium migration and accumulation, resulted in theformation of potential sources of ore. Two models of geological evolution during uranium oreformation are suggested: endogenic epigenetic (hydrothermal) and exogenic epigenetic (infiltrational)ones (Figs 1 and 2). Both models involve successive ore-preparing, ore-forming and ore-transformingprocesses. Large ore deposits appear under conditions, which provide the superposition of all mainore-forming processes within a limited geological space.
A model of endogenic uranium ore formation allocates the most important role to ore-preparing processes, which occurred well in advance to the ore mineralization proper and caused awidespread multistage granitization and K-Si metasomatism. These processes were most intense withinlong-evolved granite gneiss cupolas. The migration of a great body of uranium, thorium and othermetals into the upper crust associated with such processes, gave rise to potential sources of orematerials.
The granitized blocks were subsequently affected by intense pre-ore tectonomagmatic andtectonic processes, which induced a rejuvenation of previously existed deep-seated zones and theappearance of new ones, both being highly permeable for magmatic melts and postmagmatichydrothermal solutions. These processes favored an additional gain of uranium and redistribution ofthe metal, which had been previously contained within granitized complexes. In the course of this,the role of mobile uranium increased.
The pre-ore rejuvenation stage was followed by ore-forming processes that were related tothe interaction between ascending carbonate and sulfide-carbonate thermal solutions and the hostrocks, enriched in radioactive elements. As a result, rich uranium and complex mineralization wasformed at degassing geochemical barriers.
Late-ore and post-ore processes could transform the primary ore mineralization, inducing itssecondary impoverishment or enrichment. Occasionally these processes may be rather important.
A model of exogenic-epigenetic uranium ore production envisages the formation at the earlyore-preparing stage the following geological objects:
sources of ore materials (U-rich igneous and metamorphic rocks, uranium occurrences);various depressions (platform basins and graben-synclines, intermontane basins, erosionalpaleovalleys);grey-colored bedded sandstone-carbonate-claystone sequences.
The ore-forming stage is characterized by a low-amplitude orogenesis, arid climate buildupand provides the infiltrational hydrodynamic regime, downward penetration of oxygen- and U-bearingsolutions along with local upward epigenesis. A combination of these interconnected processes givesrise to the formation of productive zones of ground and stratal oxidation with high uraniumconcentrations at the pinches.
If orogenesis and erosion are enhanced, a partial destruction and alteration of deposits arepossible at the post-ore stage. On the contrary, the burial and conservation take place under stabletectonic conditions, favorable for the peneplanation and sluggish hydrodynamics.
Evolutionary geological models, worked out by the authors, allowed to define generalconditions of formation and localization of large uranium deposits and to establish two groups of mainprerequisites for the formation of them (Table II). These favorable prerequisites can be used for aforecasting evaluation of vast areas, including poorly studied regions, with the aim of discovery ofhigh-productive uranium mineralization of various nature.
302

TABLE H. FACTORS GOVERNING THE URANIUM ORE FORMATION
Ore objects Prerequisites of mineralization formation
Exogenic Ore 1. Continental blocks of early consolidation and prolonged emergence, affected byhydro- districts heterochronous tectonomagmatic rejuvenation.thermal 2. Regional tectonic mobile structures of increased transcrustal permeability.
3. Prevailing development of low-grade sialic rocks in crystalline basement withpredominance of mobile uranium forms.4. Large structures of central type with intense development of multistagegranitization.5. Widespread K-Si alteration, greisen, skarnoid rocks, formed subsequently togranitization that produces U, Th occurrences and disseminated radioactivemineralization.6. Multistage differentiated subalkaline volcanism and intrusive activity related totectonomagmatic rejuvenation with predominance of mantle-derived basic rocks atinitial and final stages.
Ore fields 7. Joints of long-existed deep-seated faults with superposition of igneous activityof different age.8. Linear deep-seated zones of dilatation and geophysical fields with contrastedgradients.9. Areas of differentiated radioactive element distribution with U-deficient haloesagainst a normal or elevated radiochemical background.10. Development of various alkaline and earth alkaline (Mg, Ca, Na) alterations,superimposed onto the early K-Si alteration.11. Tectonic and stratigraphic unconformities and other contrasted inhomogeneitiesof host rocks.12. Endogenic occurrences of fluorite, chalcophile and rare elements.
Exogenic Ore 1. Continental blocks with widespread sialic rocks of crystalline basement,epigenetic districts approached the aeration zone.
2. Areas of moderate emergence at margins of platforms (forelands), at shields, inepiplatform and epigeosyncline orogenic belts.3. Regional tectonic mobile structures of increased transcrustal permeability.4. Weakly lithified, mainly arkose (continental or shelf) platform and orogenicsediments.5. Active infiltrational hydrodynamics regime in artesian systems as well as groundwater basins, existed at the time of ore formation.6. Predominance of arid or moderately wet climate at the epochs of reinforcementof orogenic processes.
Ore fields 7. Marginal basins and systems of graben-synclines at platforms; mtermontanebasins within orogenic belts; erosional paleochannels.8. Horizons and units of permeable grey-colored sands, sandstones, gritstones, andconglomerates, including lignite- and coal-bearing rocks.9. Zones of strata! and ground oxidation of primary grey-colored rocks, includingzones of secondary reduction (bleaching).10. U-rich rocks, uranium ore occurrences, and geochemical haloes of mobileuranium forms in areas of ground- water recharge .11. Elevated uranium (> n * 10"5 g/1) and dissolved oxygen contents in infiltrationalstratal and ground water.12. Pre- and sin-ore reducing epigenesis in aquifers that reinforces the oredeposition in sedimentary rocks and enhances the contrast of reducing barrier.
303

The existence of early consolidated blocks and prolonged emergence with associated low-grade metamorphism of sialic rocks, containing mobile forms of U, are regarded as main prerequisitesfor the appearance of large endogenic uranium concentrations. Large uranium ore districts atrejuvenated ancient shields (Alligator Rivers in Australia, eastern Athabaska in Canada, Aldan insouthern Yakutiya, Krivoi Rog — Kirovograd in Ukraine) are consistent with these conditions as wellas districts within median masses in foldbelts (Streltsovskii in southeastern Transbaikalians, northernKazakhstan, Erzgebirge, etc.). Multistage granitization and associated subsequent K-Si metasomatism,producing disseminated radioactive mineralization and U and Th occurrences, play the most importantore-preparing role. Differentiated subalkaline volcanism and intrusive activity, including initial andfinal basic rocks of mantle origin, are also important at the stage of rejuvenation. The differentiatedradioactive element distribution with deficient U haloes against the background of normal or elevatedradiochemical field is of essential significance. Alkali earth and alkaline alteration, superimposed uponearly K-Si metasomatism in local structure, as well as structural and stratigraphic unconformities andother contrast heterogeneities of host rocks are also noteworthy.
The most substantial prerequisites for the large exogenic epigenetic uranium concentrationsinclude: (1) continental blocks of the Earth's crust with widespread sialic basement, approached theaeration zone; (2) areas of moderate uplift at marginal parts of platforms, shields, and erogenic belts;(3) depressions, mainly filled by weakly lithified sediments of Mesozoic-Cenozoic age; (4) favorablepaleohydrogeological and paleoclimatic factors. Attention should be also drawn to (1) permeable grey-colored horizons and units in sedimentary cover; (2) zones of stratal and ground oxidation; (3) U-bearing rocks and uranium occurrences in regions of alimentation for ground water; (4) elevated Ucontents (>5 10"6 g/1) and enrichment in dissolved oxygen of recent stratal and ground water.
The largest exogenic epigenetic deposits are controlled by zones of stratal oxidation withinsedimentary cover of ancient and young platforms, which were affected by a moderate mountainbuilding, associated with the Alpine orogeny in adjacent mobile belts. Host structures are representedby marginal platform depressions and graben-synclines, transformed into foredeeps.
A combination of above-mentioned prerequisites in a certain geological space allows to setoff the areas, prospective for large uranium accumulations of economic importance. Geological andmineral types of them are determined by a local geological structure, lithology and geochemistry ofhost rocks.
The leading prerequisites of uranium ore formation determine the basic concepts of geologicaland genetic forecasting that envisage the successive analysis of potentially prospective regions in therange from a small scale (1:2 500 000-1:500 000) to the evaluation of discovered deposits.
The early stage of endogenic deposit forecasting (1:1 000000-1:500000) involves thecompilation of schemes, which represent (1) basement structure; (2) deep-seated structure ofpotentially prospective blocks; (3) composition and abundance of products of tectonomagmaticrejuvenation; (4) radioactive element contents in rocks of different age. Additional field studies inspecific areas are scheduled.
At the following stage (1:200 000-1:50 000) the scheme of altered rock and ore localizationshould be prepared in addition to above-mentioned data. A complex analysis of prerequisites for oreformation allows to set off areas, prospective for exploration.
The forecasting for exogenic epigenetic deposits has to be performed by the same way. Theforecasting investigations under consideration do not replace the compilation of forecasting andmetallogenic maps, but allow to provide an express evaluation of large geological blocks, based onmain factors of uranium ore formation, expensive geological exploration being applied only to alimited extent.
304
The evaluation of revealed ore objects includes the determination of mineralization type, itstechnological and geotechnological properties and the forecast for environmental consequences ofexploration and mining. The detailed works at an object are completed by a preliminary geologicaland economic estimation of advantages for further development.
BS1XT PAOE(S)left BLA&4K 305

XA9745150
URANIUM MINING AND PRODUCTION OF CONCENTRATES IN INDIA
J.L. BHASINJaduguda Mines,Uranium Corporation of India Ltd.,Singhbhum District, Bihar, India
Abstract
In order to meet the uranium requirements for the atomic power programme of the country, uranium depositswere explored, mined and concentrates were produced indigenously. The geology of the areas, mode of entries andthe various extraction methods deployed in different mines with their constraints are described. The variousequipments used in mining and processing activities are elaborated. The flow sheets for processing the uranium oreand that of the effluent treatment plant are given in detail. The future plans of the company for undertaking the newprojects to meet the demand of uranium requirement for the increasing nuclear power programme are given.
1. INTRODUCTION
With the formulation of the Atomic Power Programme in the context of power requirementsof the country with regard to the availability of various types of energy resources, the importance ofuranium assumed a considerable significance. During the first phase of the nuclear power programme,natural uranium was selected as the fuel. Thus, there was an imperative need to locate the uraniumdeposits in the country so that the requirement of the strategic mineral could be met indigenously.
The Atomic Minerals Division under the Department of Atomic Energy undertakes theexploration programme of various radioactive minerals by various geophysical and geochemicalmethods. In the promising areas, they also undertake exploratory mining. Once a deposit of sufficienttonnage and grade is proved, the deposit is handed over to Uranium Corporation of India Ltd. (UCIL)for commercial mining and production of uranium concentrates.
Presently the Corporation is having three deposits under commercial exploitation, i.e.Jaduguda, Bhatin and Narwapahar. All these deposits are in the Singhbhum Trust Belt in Bihar Statein Eastern India.
The occurrence of uranium-bearing minerals in Singhbhum Thrust Belt has been known since1937. In 1950 a team of geologists was appointed with the specific task of closely examining the 160km long Singhbhum Copper Belt to locate the presence of uranium mineralization and otherradioactive minerals. The team located several anomalous radioactive areas in Singhbhum Thrust Beltof which Jaduguda, Bhatin. Narwapahar, Turamdih and Bagjata were a few. During the leastfourdecades, some of these mineral occurrences have become major uranium producing mines.
UCIL was established on 16 October 1967 as a Public Sector Enterprise with its registeredoffice in Jaduguda with the specific objective of mining and processing of uranium ore.
UCIL has a number of operating units, among them there are three mines at Jaduguda, Bhatinand Narwapahar, three uranium recovery plants to recover uranium from copper tailings, a by-productrecovery plant to recover copper and molybdenum sulphide concentrates and a magnetite plant torecover magnetite present in the uranium ore.
307

2. JADUGUDA MINE
2.1. Geology
The original geology of Singhbhum Thrust Belt (STB) has been the subject matte of intensestudy for many geologists for the past 50 years. The pioneering work in this region was done by Dr.Dunn and Dr. Dey. They divided the entire area into two broad divisions, north and south of thethrust belt. On the northern side of the thrust belt, there are rocks of Chaibasa and Iton Ore serieswhile on the southern side the rocks of Iron Ore and Dhanjori stages and Singhbhum granites havebeen described. The thrust zone is developed between Chaibasa and Iron Ore stage rocks.
In the Jaduguda Mine, there are two orebodies, one the Footwall Lode (FWL) and the otheris called Hangingwall Lode (HWL), both are separated from each other by a distance of about 60-100m. The FWL extends over a length of about 800 m in SE and NW direction. The HWL has only200-300 m of length and is confined to the eastern part of the deposit only. The average width of helodes is about 3-4 m, though at certain places in the mine the lodes are as thick as 20-25 m. TheFWL is better mineralized and contains copper, nickel and molybdenum sulphide minerals in additionto uranium. Both of these lodes have an average dip of about 40-45°. The orebody in Jaduguda hasbeen prospected up to a depth of about 800 m below ground level, and it is expected that it wouldcontinue further in depth.
2.2. Mode of entry
The main entry to the mine is through a circular concrete lined shaft of 5 m diameter. Theshaft has been sunk to a depth of 640 m in two stages: one from surface to 315 m and the secondfrom 315 to 640 m. The shaft is equipped with two tower mounted multi-rope friction winders. TheCage winder is a 280 KW D.C. winder, and the skip winder is a 360 KW AC winder. The cage andskip winders are balanced by counter-weights and tail ropes. A double deck cage is used for loweringand hoisting of men and material and for hoisting waste rock. The skip with a payload of 5 tonnesis used for hoisting ore from 605 m level. The shaft is also equipped with pipe columns forcompressed air, water mains, drilling and drinking water and power and control cables.
2.3. Mine layout
The main levels are at vertical interval of 65 m, the last level being at 555 m.
During exploratory mining, 5 adits are driven to meet the lodes. The ground level (0 m.l.)and -30 m.l. were developed and connected by raises and winzes. Subsequently, levels at 50 m,100 m and 165 m depth were developed from the principal winzes sunk from 0 m.l. and laterconnected to shaft and ore-pass. Development of lower levels at 230 m, 295 m, 370 m, 434 m ,495 m and 555 m depth was done from the shaft. Crushing and loading stations are located at580 m.l. and 605 m.l. respectively.
2.4. Mine development
The mine development work involves development of winzes, raises, cross-cuts and drifts inore and waste rock.
308

2.4.1. Drives
Drives in the main levels are generally 2.4m x 2.5min size with a 610 mm gauge trackfitted in them. Drilling is done by Jack hammer drills with Burn cut pattern. The blasted rock iscleared by pneumatic loaders (EIMCO 12 B/21) loading into side tipping rubs. These tubs are hauledby diesel locomotive for either dumping in grizzley (ore), or hoisting to surface by the cage. Theventilation in the drives and cross-cuts is provided by auxiliary fans with metal and flexible ducts.
2.4.2. Raising
Raising is a key job in the development programme of any mine. Raises are developed frombottom to top level for ventilation, ladder-ways, ore transfer etc. To bring the mine to its targetedproduction and efficiency, speedy raising methods are necessary. Constant efforts are made toimprove the raising methods with regard to safety, speed and economy. There are three ways ofraising. They are:
(i) Open raising
This is the simplest and most commonly used method where persons on a platform of timberplanks, supported on standard rail clamps drill the face. Before each round is blasted theplatform is dismantled. Access to the face is made by rope ladders etc. This method is wellsuited for short raises of 6-15 m and inclinations of 40°-60°.
(ii) Compartment raising
In this system a timber partition separates the raises in two compartments, major cross sectionis used by broken rock and the rest for placing of pipes and ladder for access to the face. Attimes the broken rock reserves as platform for performing drilling etc. The ladder-waycompartment is covered with wooden planks at the time of blasting.
(iii) Alimak raising
Raising by Alimak Raise Climber is essentially a self powered rugged manoeuvrable platformfor a limited height and angle, moving on a rail guide anchored to the roof of the raise tocarry men and material. The guides are anchored to the walls by retractable expansion bolts.
Jaduguda was the first mine in India to use Alimak Raise Climbers in 1967. The ore-passraises and ventilation raises in the I- stage and subsequently raises in II-stage shaft deepeningwork were all done by Alimak Raise Climber.
2.5. Sloping
The method of sloping deployed in a mine depends on the nature, shape and size of theorebody and strength of the wall rocks.
In Jaduguda the "Cut & Fill" sloping method is applied, using deslimed mill tailings asbackfill. The broken ore is mechanically handled using Load Haul Dump (LHD) machines. Thebroken ore is transferred to the foot-wall ore-transfer passes. At the bottom of the ore-pass, the oreis loaded into 3.5 tonne capacity Granby Cars. These mine cars are hauled by diesel locomotives forautomatic dumping into ihe main ore-pass system. The main tramming drive in each level isdeveloped on the foot-wall side of ihe ore drive. By this way no ore is left in pillars. In the "Cut &Fill" method, the percentage of recovery of ore is approximately 80% and is ideally suited for theJaduguda Mine.
309

Earlier the horizontal holes were drilled with the help of jack-legs standing on the muck pileand the broken ore was handled by LHD. This was changed to drilling uppers. Lately the drillingoperation has been mechanized by drilling horizontal holes by hydraulic drifters and the broken oreis handled by 1 cu.yd. LHD. The filling in this case is done close to the back leaving a gap of about1 metre. This has unproved the productivity tremendously. Until the 3rd stage is ready, a decline isalso being constructed to the two levels below 555 m.l.
2.6. Backfilling
The deslimed mill tailings are transported hydraulically to underground through 3" diameter(75 mm) diamond drill boreholes drilled from surface to underground. There are three boreholeslocated in the west, central and eastern parts of the deposit, and are connected to 100 m.l., 165 m.l.and 230 m.l. drives. The tailings are tapped from the bottom of these boreholes, and are conveyedto different stopes through 90 m High Density Polyethelene (HOPE) pipes. Boreholes are also drilledfrom level to level to transport the tailings for deeper working levels.
2.7. Ill-stage of shaft sinking
An auxiliary shaft is under construction for mining ore lying below 555 m.l. to a depth of900 m. The location of this shaft is about 580 m north of the main shaft. The winders will be installedat 495 m.l., and between 555 m.l. and 495 m.l. the excavation is 7.5 , diameter, similar to the towerarrangement above ground level in the first stage. The ore bin and ore transfer pockets are excavatedin the rock. The new levels at 620, 685, 750, 815 and 880 m.l. will be opened up. The crushingstation and skip loading station would be opened at 835 and 865 metres depth respectively.
Drilling in the shaft is done in two halves, the benches differ in elevation by about a meter,thus giving two free faces for blasting, to restrict the throw and avoid damage to sollars, ladders andpipes. Spiral pattern of drilling is followed. For mucking a cactus grab of 0.6 m3 capacity inconjunction with two 1.5 m3 capacity buckets is used.
For ventilation two fans of 15 HP each in series are installed near the shaft top with metalductings of 50 cm in diameter and flexible terelene ductings are used below the metal ductings andare extended to about 20 m from the shaft bottom. The shaft lining will be done by slipform method.After lining, the shaft will be equipped with buntons, rails, rope guides, pipe columns, power andcontrol cables, etc. The cage and its counter weight will then be installed.
2.8. Ventilation
P.V. 160 Aerofoil fans with a capacity of 3000 m3/min each at 75 mm water gauge arelocated at Adits No. 2 and No. 5, at the western and eastern ends of the mine.
Ventilation doors have been installed underground to prevent short circuits, and to allowfresh air to ventilate the working places from the deepest level. Air is split at alternate working levelsto provide fresh air to the working stopes.
3. BHATIN MINE
Bhatin Mine is an extension of Jaduguda, located at a distance of about 4 km from it. INbetween Jaduguda and Bhatin, there is a big upthrow fault whereby the Jaduguda lode has beenupthrown. A separate mine is in operation at Bhatin. The orebody width varies from about 2 m to10 m, having a gradient of about 30-40°. The deposit has an almost similar geology as at Jaduguda
310

with the same country rock as chlorite biotite schist. Because of the low reserves the deposit isdeveloped by adits and incline shafts and the main mining method is cut and fill. The ore istransported by dumpers to Jaduguda Mill for beneficiation.
4. NARWAPAHAR
The uranium deposit at Narwapahar is one of the many economic deposits in the SighbhumThrust Belt (STB). The orebodies are monomineratic — the uranium occurring as uraninite and thehost rock is chlorite quartz schist containing some magnetide. The underlying schist is of similarcomposition but with increased magnetic content. The ore-bearing chlorite quartz-schist is overlainby a quartz chlorite schist. At their maximum extent the orebodies have a strike length of about2100 m and extend to a vertical depth of 600 m. There are 6 uranium-bearing beds/lodes which are:
(1) Main Band I (4) HW Lode West of Fault(2) Main Band II (5) Khundungri I(3) Band No. 3 (6) Khundungri II
The average dip of the orebody is 30°-35° towards the north-east and occurs sa tabularlenticular horizons. The thickness of orebodies varies from 2.5 m to 20 m.
4.1. Mode of entry
The deposit is planned to be developed by one vertical shaft to a depth of 350 m and a 7°access decline suitable for trackless mining,
The shaft is presently being sunk and it has reached a depth of 200 m. It will have two groundmounted multi-rope friction winders — one for the cage and the other for the skip. These winders arealso under installation. Once the sinking and equipping are completed, the temporary headframe willbe replaced by a permanent structure and other facilities like orebin, wastebin, belt conveyor etc. willbe constructed.
The 7° access decline is excavated by deploying twin boom hydraulic drill jumbos, LHDs of1.78 m3 and 2.8 m3 capacities, LPDTs — 13 and 23 tonne capacities and the relevant serviceequipments like passenger carriers, supply trucks, service-cum-lube trucks, motor equipments whichenter the mine directly from surface through the access decline. Where the orebody is narrow, it isproposed to deploy the "room and pillar" method with steps using decline as the main entry andramps for entry to the stopes. The main haulage drives are in the foot-wall with the cross-cuts at pre-determined levels. Where the orebody is wider, the cut and fill method will be used with post pillars.
Presently when the mine is under construction, the ore is brought to surface through thedecline and transported to Jaduguda Mill by road. As soon as the shaft is commissioned, the ore willbe hoisted to surface by skip and then transported to Jaduguda by road.
Since most of the equipments are used for the first time in the country, great care is taken forthe training for the engineers, supervisors, operators and maintenance staff, and for the adequateservice backup and spare parts management. Arrangements are also made for training of the engineersaborad, posting of foreign commissioning engineers along with foreign engineers.
4.2. Use of high pressure and high capacity main and auxiliary fans
Because of the large scale use of big diesel equipments, ventilation requirements for the mineare high. The ventilation system has been designed with the help of computers. In the long run, for
311

total mine ventilation, three fans with a capacity of 75 m3/sec at 1.7 KPa (about 7" WG) each with250 KW electric motors will be used for main ventilation. Provision has been kept for the installationof one additional fan in case ventilation problems are faced in the future. The total circulating quantityof air of about 200 mVsec is equivalent to about 0.18 m3/sec per tonne of ore mined for rated capacityproduction plus an allowance of 10% additional waste. This large quantity of air required to controlheat, dust and diesel emissions is also sufficient to control the radon content in mine air. Two fansModel VF-2000 supplied by M/s Voltas have already been installed in parallel at the westernventilation shaft.
5. RADIATION HAZARDS
In a uranium mine the workers are exposed to the hazards of radiation in addition to the otherhazards of underground mining operations. Two main sources of health hazards are inhalation ofradon gas and airborne dust. To minimize the effects of radon, the mine must have a good ventilationsystem, so that all radon gas generated is flushed out of the mine and the working places are wellventilated. With this in view, powerful ventilation fans are installed and are kept running. Auxiliaryfans are installed wherever thy are necessary.
For suppressing dust, all operations in the mine where there are chances of raising dust aremade wet operations with sprinkling of water. All drilling operations in the mine are wet and in allplaces where ore is handled, water is sprinkled to keep the dust down.
Monitoring of radiation, radon and dust is done by the Health Physics Group of the BhabhaGroup of Bhabha Atomic Research Laboratory at Jaduguda. Members of this laboratory take samplesfrom the mine and mill sites at periodic intervals and keep a watch on all aspects of radiation. Theresults of the investigation conducted at Environmental Survey Laboratory at Jaduguda show that theexposure to radiation is below the permissible limits of 5 rem per year.
6. JADUGUDA MILL
Uranium ore produced from Jaduguda, Bhatin and Narwapahar mines and uranium mineralconcentrates transported from uranium recovery plants are processed in the mill located at Jaduguda.The mill has an installed capacity of 1370 tonnes of ore per day. It is now being expanded to process200 tonnes per day.
6.1. Crushing
The uranium ore from Jaduguda is transported by conveyor belt to the crushing section whilethe ore from Bhatin and Narwapahar mines is fed via ground hopper for crushing and grinding. Intwo stage crushing — 200 mm ore is screened on — 125 mm opening scalper. Oversize is crushedin primary jaw crusher. This is screened on a triple deck screen with openings of 113 mm, 65 mmand 25 mm, -25 mm size is collected as fine ore and -113 mm +65 mm as pebbles, and the rest isrecycled back for secondary crushing.
6.2. Grinding
This is followed by two stage wet grinding with a primary rod mill and secondary pebble millto get ground material of the size of 60% passing through 200 mesh. This slurry is thickened andfiltered to remove water for proper solution balance and the cake is repulped with secondary filtratefrom downstream to 60% solid slurry. This was mechanical preparation of slurry.
312

6.3. Leaching
This slurry is pumped for leaching in leaching pachucas, which are essentially air agitatedtanks. In leaching tetravalent form of uranium is oxidized to hexavalent from which is soluble inacidic medium. For this sulfuric acid and pyrolusite i.e. MnO2 is added to maintain 1.6-1.7 pH and -480 mv emf, temp, around 36-38°C. The reaction tune is 12 hrs. There are 13 Nos of pachucas, 9in line. The slurry overflows from one pachuca to another and by the time it comes out from the lastpachuca, the slurry has been retained for 12 hrs and around 95% of uranium is leached out.
6.4. Filtration
The leached slurry is filtered in two stages employing string discharge vacuum drum filters.The primary filtrate so received contains 100-500 ppm slimes. This is clarified on precoat filter toget a clear liquor of less than 8-10 ppm suspension.
At this stage the liquor contains 0.5-0.6 gm/lit of U3O8, ferrous and ferric sulphate, dissolvedmanganese, free acid and other impurities. This is concentrated and purified by the ion exchangesystem, strong base an ion exchange resin is used in a two column system. The complexes of uranylsulphate, ferric sulphate and sulphate ions get absorbed which are eluted by one normal salt solution.The strong eluate contains around 5-6 gm/1 U3O8.
This eluate is treated with lime to increase pH to 3.8, ferric sulphate and gypsum getprecipitated. This is thickened and filtered. As along with iron some of the uranium complexes alsoget precipitated hence this is sent ahead of leaching to recover this uranium.
6.5. Precipitation
The overflow is treated with magnesia to get magnesium di-uranate or yellow cake, which isthickened, washed, filtered, dried and packed in drums. The U3O8 content in yellow cake is around74% U3O8.
During the process of recovery of uranium, two types of wastes are generated — barren cakefrom filter section and barren liquor from ion exchange system. Barren liquor is neutralized to pH10.5 to precipitate dissolved manganese etc. The barren cake slurry is sent to the magnetite plantwhere magnetite is recovered, then this is mixed with neutralized barren liquor. This is classified byhydrocyclone. Coarser sand is sent to mines for backfilling and finer size is sent to a tailings pondwhere solid and precipitates settle and clear liquor is decanted off.
6.6. Effluent treatment
The decanted liquor of the tailings pond occasionally used to have higher manganese andradium values than the prescribed limits. The final combined effluent, however, used to be within thelimit due to dilution by other streams. Recently the mill has been expanded to increase its capacityneeding higher water requirements, which could have been met only by water reclamation. Thiswould have resulted in less water available for dilution and values of radium etc. would haveincreased in the final effluent.
Therefore a combined scheme of water reclamation and retreatment of tailings pond effluentwas implemented. This has been commissioned in March 1990. This has resulted not only in areduction of fresh water requirement, but has also resulted in the purity of the final effluent.
313

6.7. Scheme
The main consideration in formulating the scheme was that mine water, magnetite pit waterand tailings pond water cannot be used ahead of ion exchange due to its chloride content. The schemehas been shown in a diagram and shows the different streams:
(i) The compressor water and excess vacuum seal water is collected and recycled back to theindustrial water reservoir at the water treatment plant for reuse.
(ii) The mine water and magnetite pit water contains fines and hence is pumped to the thickener,the overflow is collected in a water reservoir in the mill. This water is used for secondarycake repulping and for the magnetite plant, all downstreams to ion exchange. The underflowis pumped to tailings pond.
(iii) The tailings pond overflow is brought to the water treatment plant area by gravity drain andis pumped to raw effluent thickener. The clarified effluent is stored in a tank and supplied tothe mill as per requirement. Extra effluent is treated for radium and Mn removal before thesame is discharged to the environment.
6.8. Treatment scheme
The re-treatment plant capacity is 100 m3/h. The clarified effluent at controlled rate is pumpedto the barium reaction tank. Barium chloride solution is dosed @ 25 mg/1 of effluent to precipitateradium as barium radium sulphate, the reaction time being half an hour. This is then neutralized bylime to pH 10 to precipitate Mn, the reaction time in this case is 1 hour.
The resultant precipitate is thickened in treated effluent thickener, the settled precipitate ispumped to the tailings plant, where it is mixed with fresh tailings before pumping to the tailings pond.This is required as the barium radium sulphate precipitate is quite concentrated and is difficult to settleif pumped alone.
The overflow of this thickener, i.e. treated effluent is brought to normal pH by dosing sulfuricacid before the same is discharged to the atmosphere.
6.9. Recovery of uranium from copper tailings
The copper ores of Singhbhum Thrust Belt contain small amounts of uranium minerals whichare recovered as by-products. UCIL has set up 3 uranium recovery plants at Rakha, Surda andMosaboni, near the Copper Concentrators. Tailings after the extraction of copper are sent to UCILplants for recovery of uranium. The uranium content of copper tailings is of the order o 0.01 % U3O8.The copper tailings are recovered. These uranium mineral concentrates from all three plants aretransported to Jaduguda Mill by road for further processing. All these plants contribute about 150tonnes of uranium mineral concentrates per day.
6.10. By-product recovery
Uranium ores of Jaduguda, Bhatin and Narwapahar contain small quantities of sulphideminerals of copper, nickel and molybdenum. These are recovered as by-products. Sulphide mineralsof Cu, Ni and Mo are recovered by floatation. The combined concentrate of copper and nickel,containing about 20% CuS, are sold to Hindustan Copper Ltd., Ghatsila for smelting and recoveryof copper metal. The sulphide concentrate of molybdenum is converted into ferromoly which is usedin Ordinance Factories.
314

•". <• :l f' i -:" :• r-: •--•» ~'I. i «••'
/VAT-'
•v ...._ /- , --
I** .»*,*—
-x-..s *\ --.-'>:A- " -.V- / -f\j
F/G. 7. Location map of Jaduguda in India.
315

'/' / - ' , ' • >s _/ < ' / • : - 5 > . z ^ * • —£7*'' // . V T / / / V -VZJ-?"*5^ e.^/// ' ' '^^£3>y?> ' - 'Qx.'/^^-._j ' 'v ' / '/v^^^^/':' V'^xx X' x -_ .. \' ' • ' ' / • ' ' ' ' . / \ ' ' / ' •> ' > •'
' •/ ' ' ,
TURWDIH EAST
NARWARAHARBHAT.-M
^/ // H-
3 TERTUflY ROCXS
Sv:-\\ \\ V - - -M - - - -X -\ \.-s^— _
'v ALMA/aHANjORi LAVA
DHAN-OSI
IRON-CUE STAiE ROCKS
CHAI3ASA STAGE ROCXS
THRUST BELT -
86- 96" JO'
F/G. 2. Geological map of Singhbhum Thrust Belt.
316

JOi IfVEL
^,1 GARNET. n'JSCCVlTE SCHIST.
^T. MUSC. KY SUASTZ. SCHIST
~y/7\ PELIT1C SCHIST
SAND.>_Li 8RECCIATED SLUAfiTZITE,
GnANULAR ROCK.
llfj E?!DIOR(TE.
FIG. 3. Transverse section across Jaduguda Hill. Scale: 1:4000.
317

w.*// • .«<•
BUMTON
FIG. 4. Shaft plan.
318

-SSgML
^
,Y^ ' ^"^ —— :*r^, •"
' ' "
*A-*f•V-
:!'*["i
/i
-^ •
• ?^
-J -1_
i
I
t
'-
/"•
swpACja__,_j ;~r •
• '
v. ... .„ ., . ., // / /r"5i& st*
C.-.; £>•",<; } " ^L<(P ' '
>~ ' 1 ,r^nr~CRusK£// , '= 9.50 «Cl i ."K- / /> "" ""^ U , ^ ORE PASS
!» 16.00 "XI \fc ' /
'.. ^ I*-00 */ /. ?^OPw POOiET
** *? ' * A.1 *>S * i • <£
\ / 1 \. l;' $ " ' i
\ .„*"*'""" ••— L>> -h7 sv" " '" -"' •• f "' "' f / '. —WEIGH OP* ~7 i 'I '— j.CASIMg | / ^
S= 'M.S V A
f / -^: y// 5 JC
- r; - •*•* «.— w>^™f> 5yiu C--;AFT SOTTOM
F/G. 5. Crushing and hoisting station.
319

90 mLEVEL
tV*
* §
2U-SI!TT>* 4- r
ope RAISE
MLJJJ,'A' BOLTS
4,'4JX~
^ .>".;'.-- SANS PILL ; .'-':'V: ' " ' /'.SAND FiUL' .- -~ - ' ; -','-',.' SAHD F I L L - * ^|::r^.:;V^-v^-;V,^:v-V;;l:J'-'V::-:^-;^::^-r..>-;V:v--.---i-;-;-: >^J-;:':-:J:"^:.-'"v^v-:.;-^|;;-:7:"••/.?<::-- :vi^Kl'-''-'-:Vv--'v':---'^-^^
ORE TRANSFERR A I S E
^\ I M i l l• V - - -
FW-DRIV*—^B~ CAR-
S'. CT10M A -'A
F/G. 6. Cur and fill slope at Jaduguda.
320
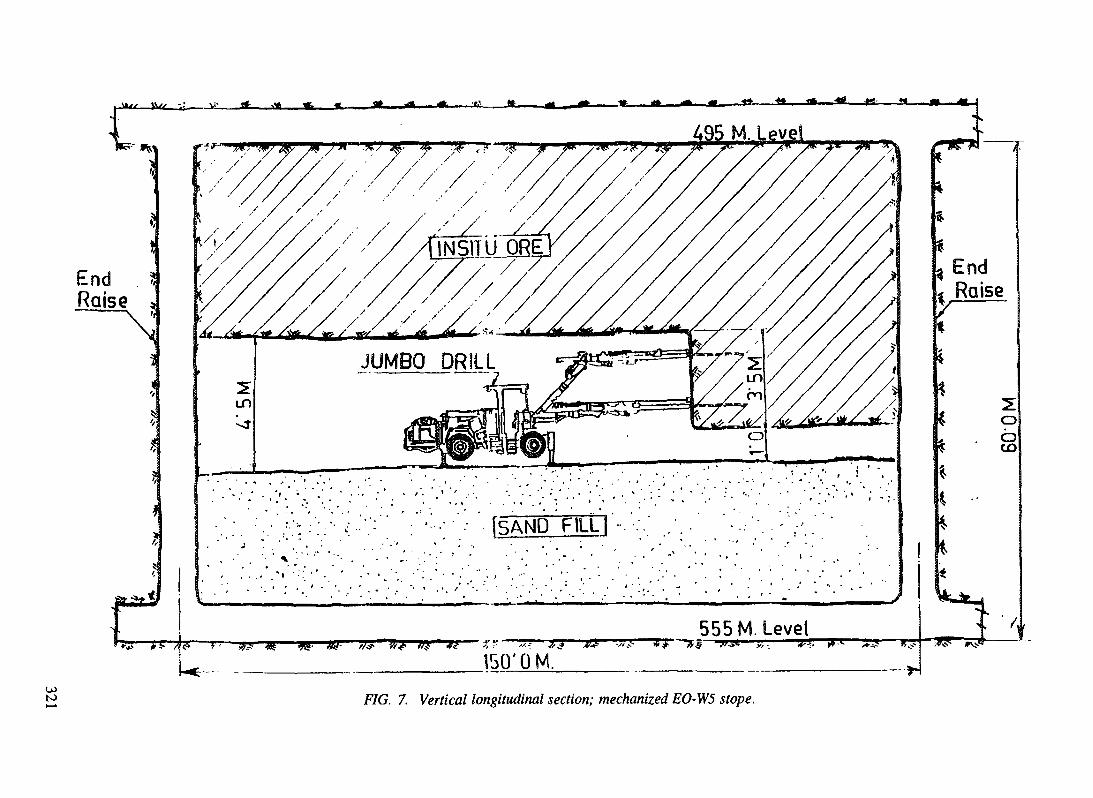
rj* " %'
EndRaise
-*——A.
495 M. Level
JUMBO DRILL
U)to
'•-.".•• ISAND FILL! ... .;..' / • • - • ' ; . ; ' ' • ' . . ' . " '
555 M. Level-jrse—sr——rsr
150'OM.
/•"f? fl (
Y*
t^
EndRaise
CDCD
F/G. 7. Vertical longitudinal section; mechanized EO-W5 slope.

toto
Wv
95 ML. F.W. DRIFT
X>xTUeC/RAISE
555 ML./F.W. DRIFT *-ORE DRIVE
FIG. 8. Transverse section showing the general arrangement ofHCF stoping.

WINDERS
ORE BIN
555NLCRUSH ma STM. 56OMU
CRWSHIN6 STN. —*=>LOADING STN. —*
980 *«•••_
FIG. 9. Ill-stage shaft sinking.
555 M.L.
. Development below 555 m.l.
323
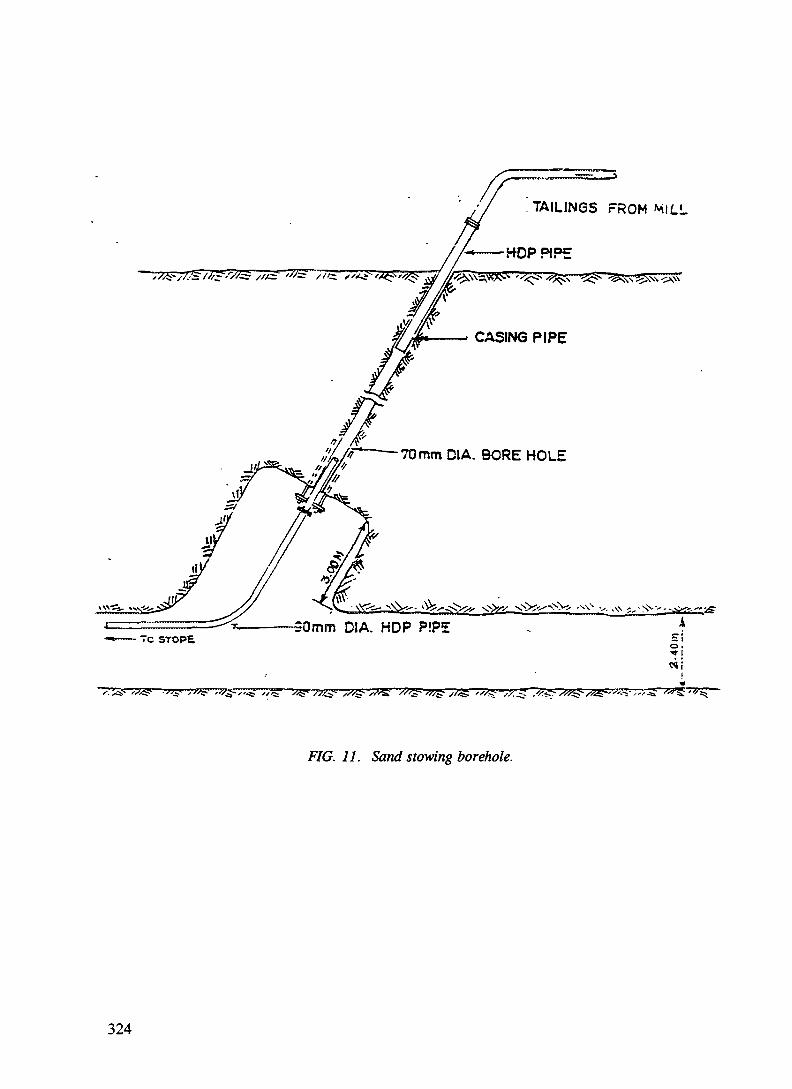
70mm DIA. BORE HOLE
0mm DIA. HDP P!P5
FIG. 11. Sand stowing borehole.
324

END
RAIS
ES (E
AST;
->-
• —
*. —
t-
f— TD 'x t
ti —— — - ——
*********
t
?^
ADIT- 5
—— 5» PAN DRIFT• fIISHAFT
i
^^^ '
f
tC. £
STOPS LEVEL
i H1
Tu
t TD^_
jt
STOf
/,
'£ LEVEL
lH :a A
t ~~" -> -«— *p «
i " ™ fn —
rT.. £
f"~ fi J!
HI ^ = —— •W
5 TOt ^™_
^ ^
«»™ —— -. ,A___ XV
STWPB LEVEL
!! 1* "*~«—
n1 1i
~|1 fUl
Ka,
1
3
o
1
ir
P<\L.
. | «*L»| l-i
«_— 1 ADIT-2
1W4- W'.NZS |
V.I
70MI. ' T" """.• _ <l f l _ 1OREPASS T" it"Z30ML | A
* t•Z95ML. &
\N. CROSS CUT
373 ML <S
\N. CROSS CUT 1
C^ B ^
=i <
,"~*" 1
^ «
« 1
^! _^t\45SKl. £•
vs.
Ik ^
[I - STOPPING |f? - REGULATOR ID - DOORTO - TOP DRIVE.
^
^ i:
~"~±
p £.
~-*" *
sv e.
tu —— »(A
Of __
^"°
t
t&
ft
f
>
J
. 1
........... ,. L (|
Bird STAGE
/
t
I
t
t
totu
enV)
jj
F/G. 72. Schematic diagram of proposed ventilation network ofjaduguda mine.
325

IOOMB5M
55M
FIG. 13. Borehole section, Narwapahar deposit.

9UOW 800W 400W 30«iW 200W 1QOW O.OH 10dE 2QOE
FIG. 14, Narwapahar mining project; surface plan.
100 H
J99N.
CE
u>tsJ

tooo
LEGEND.1) 1st LEVELitmiFI2) DliCLIKE 4 RAWI'S3) 2H(JLfHVIELI)Hirr E7SH/)) JirdLlEVELDHirT Effll
FIG. 15. Narwapahar mining project; underground plan showing present development through decline.

, SLUR BY TO Lb »CHINCIROM GTPS>JM SLURRY
HYDHOCYCLONESUNOfRFLOW
tBACK FILL
SAND
pps /UANKOCCLANT
^S—\>VASH WATER
rv———HSEC. FILTERuVi_iX
i nuu—piiiii— Mij
-2i-m» l-ll3"«<-o5mm I—J
, 5TEOHG - L J A T E
C R A S H I N G ^ V10'N:-D£WATERING ^EACHING-FILTRATION CLARIFICATION- ION EXCHAf.CE. P?CD.,C~-- iCOVERY TAILINGS-DISPOSAL
F/G 16 Uranium ore processing flowsheet.
OJK)VO

BgclZ TREATMENT LIME
FLOCAL
,SECONDAFrLARIFIER
--iPH ACID-^CORRECTION
TANK
T R E A T E DEFFLUENT
J_AKIFIEDIfATERORANT
LIME TREATMENT
PRIMARYCLARIFIER
SLUDGE FOR^POND><VIA TAILINGS PLANT
TO INDUSTRIALW A T E R RESERVOIR
ASLUDGE TOTAILINGS PLANT
FOR PLANT USE
S.T. P.P L A N T
CLARIFIED WATER
MINEWATER MINE W A T E R D R A I N
FIG. 17. Flowsheet of effluent treatment plant
330

FLOW Mn
BEFORE AFTER
INDUSTRIAL EFFLT- 6360 600
BEFORE A F T E R BEFORE A F T E T
7!0/ 8 0 3 - 0 0 - 2
S.T.I'. EFFLUENT 3000 3000 50 ' 50
TOTAL EFFLUENT 9360 3600 500 5 5 2 - 0 < 0 - l
FIG. 18. Anticipated results in lean period, i.e. mid-October to mid-June
6.11. Magnetite recovery
The uranium ores of Singhbhum contain about 3% magnetite minerals. These are separatedafter the recovery of sulphide minerals and uranium by electromagnetic separation. It is ground to90% -300 mesh. The magnetite produced is 95% magnetics and find its use in coal washeries.
7. FUTURE PLANS
To meet the ever increasing requirement of uranium for the nuclear power programme, thereis a constant search for viable uranium deposits in the country. One such deposit has been located atDomiasiat in Meghalaya state hi the north-eastern part of the country. This was the result of extensivedrilling and exploratory mining. The estimated ore reserve is expected to be 9.22 million tonnes withan average grade of 0.1 % U3O8. The ore occurs at shallow depth of 45 m from the surface. The ratioof ore to ore burden is 1: 6.7 which makes the deposit amenable to exploitation by open cast miningmethod. The only difficulty is the remoteness of the area whereby the heavy open cast miningmachinery will have to be transported. The mill will have to be installed at site to process the minedore. The raw materials required for processing will have to be supplied constantly and all this willadd to the cost of the finished product.
NEXT!®f t BLANK 331

XA9745151
TOE CURRENT SITUATION OF URANIUM MINING IN HUNGARY
G. ERDI-KRAUSZMecsekuran Ltd.,Kovagoszolos, Hungary
Abstract
The paper describes the history of uranium production in Hungary. It focuses on the Mecsek Ore MiningCompany, now known as Mecsekuran Limited, and its relationship with the Hungarian Government. From the startof uranium production in 1963 until May 1989 all production was exported to the Soviet Union under an bilateralcontract. In exchange the Soviet Union agreed to provide fabricated fuel for the future Hungarian nuclear power plant.In May 1989 the Government of Hungary announced closure of its uranium mining operations because of the highcost of production. The paper describes the history of events since 1989, as well as the current plans to terminate alluranium production by 31 December 1997. The Mecsek Mountains lie in the southern part of Hungary, west fromthe Danube, about 30 km from the former Yugoslavian border, and north from the city of P6cs. Its eastern side isbuilt up from medieval limestone and dolomites, while the western part is from sandstone and clay from the geologicalPaleozoic. In the eastern part high quality cokeable coal has been mined for more than 200 years, east from the cityof P£cs; and in the western part uranium ore was discovered and the mining began only a few decades ago.
HISTORY OF THE HUNGARIAN URANIUM EXPLORATION AN MINING
The work began with Soviet participation in 1952, by examining the materials of differentHungarian Coal mines. Exploration started in 1953 in the Western Mecsek, with the depositdiscovered in 1954. With surface trenching and shallow borings the presence and orientation ofuraniferous lenses were documented. Based on this knowledge, the mine-purpose exploration speededup and the development of the first mine began. In 1956, the previously Soviet-Hungarian JointVenture for Uranium exploration went into Hungarian ownership and the Uranium mining started inthe same year.
In the next years the production increased very fast, and had a steady level for many years.Three mines were producing continuously and as the Mine No I. and later the No n. were expectedto be depleted, mines No IV. and V. were commissioned.
The construction of the Processing Plant was finished in 1963, and since then the Companyhas not exported raw ore, but uranium concentrate. The export was directed solely to the SovietUnion, under an interstate contract. This contract ensured that the future Hungarian power plant orplants would be supplied by the Soviet Union with fuel elements.
Production continued without any problem until May 1989, but it needed a very high statesubsidy, as the production costs soared, and this was not followed by the price fixed in the interstatecontract. In the meantime the world market price of the uranium had a sharp decline. In the lastyears, the subsidy reached the 30-40 million US$/year. In May 1989, the Hungarian Government ofthat time, with economical explanation but with political consideration announced the closure ofHungarian uranium mining.
The governmental decision left only the possibility to the Company for surviving to find anew market or a new partner while the decommissioning work began. This concession was verifiedby the fact that the deposit had a huge amount of proven reserves at that time, the newest mine builtfrom central sources was commissioned, and the enlarging of the Paks Nuclear Power Plant was inthe Hungarian energy policy. Social policy played also a role in the consideration, as unemploymentrose, and large crisis areas developed in Hungary, mainly because of the drastic reduction in the(heavy) industry.
333

With this concession, the Mecsek Ore Mines started to search for partners. In the meantimeradical measures were taken to reduce the production costs, and redundancy was also reduced byusing the government workforce policy measures which was given especially for the uranium mining.The area of the company activities were also reduced, which meant to get rid of the auxiliaryactivities, to reduce the number of departments, transform the production structure, revaluate thegeological reserves and to some extent also transform the technology.
The main issues of the programme were as follows:
To wind up all unprofitable works and units. Drastic decrease in central administration.
Cleaning the profile, i.e. to separate auxiliary activities from the main one.
To organize economical associations from activities enables to self-supporting.
To acquire governmental level help for discharged staff not employed in new associations andcompanies.
To seek foreign partners.
In 1990-1991 the Mecsek Ore Mining Company closed two of its plants, the GeologicalSurveying and the Research Automatization. It further dissolved 8 departments and sub-departments.17 (seventeen) economical associations were formed from the auxiliary activities, of which a few arementioned below:
boring and hydrogeological surveytrade and supply of materialsproduction and trade of explosivesfoundarytransportationfabrication of steel structuresmanufacturing of nuclear and electronic instrumentsmanaging of guest houses and holiday resortstimber yard, etc.
By organizing the main activity, it became evident that it could bear not more than about 2000men, and the self-supporting other companies about another 5-600. As for the redundant 5000, wehad to take care of them in a way that no new "crisis belt" could develop in a country trying tochange into market economy and struggling with serious economical difficulties of the startup.
The Uranium Company is located not far from the third biggest city of Hungary which alsohas another big industrial facility characterizing the city: a coal mine, which is also in seriousrecession.
In 1990-1991, nearly 5000 men left the Company, provided with subsistence, withoutproblems and they did not increase the unemployment rate in the area.
Fuel supply of the nuclear power plant providing approximately 50 % of the national electricalenergy production is not solely an economical but also a political issue. Above that, the Governmenttook into account the previously performed and outlined measures and the foreign partner's wish forjoining. Based on these facts, the Government decided to produce the fuel for Paks NPP fromHungarian uranium, if its price is not too far from the international praxis.
Five years ago the company produced 1 kg U for more than 100 US$, and this cost wasreduced by more than 40%.
334

In 1991, the Company formed 5 units instead of the previous 9. These are:
mine (with 3 shafts)milloperational auxiliary plant (energy supply, ore transport)head office (management, control and enterprising, business)human and recultivation department.
On 1 of April 1992, the State Property Agency assented devaluating of the Affiliate's estates,based on market value judgement, and by this to form a new Limited, the MECSEKURAN.
The MECSEKURAN Ltd disposes of all underground and surface facilities needed for miningand processing (within the existing mining areas), with a workforce of 1850, and of three smaller butimportant affiliates: Trade and material supply, manufacture of explosives and fabrication of steelstructures.
The ore reserves of the mining property are owned by the state, but concession rights are keptby the Limited Company, even if it should be privatized and a foreigner acquire the majority share.The ore reserves were revaluated and categorized. The basis of revaluation — in the present marketenvironment — is profitability, and for the re-categorization of the recommendations of the IAEA.
The MECSEKURAN Ltd was the first company to perform its structural change, and did itfrom its own sources. As a supplier of the national nuclear power plant, it enjoys some protectionagainst market effects, but real assurance of its survival is the setting its performances and costs tothe real market.
During the last years the MECSEKURAN was the only supplier of the Hungarian NPP. Theproduction was in 1992 430 tonnes, in 1993 380 tonnes and in 1 994 it will be 413 tonnes. BetweenOctober 1992 and August 1993 the company could utilize only one shaft from the two deep units dueto serious accident that occurred in shaft No 4 in October 1992.
The high costs of the renovation the state of the uncertainty and the absence of the developingworks created altogether a very serious situation at the beginning of the recent year, both from thepoint of view of production and financially.
In this situation the former (springtime of 1994) Hungarian Government had worked out aprogramme for the consolidation of uranium mining. This programme consists of decreasingproduction parallel to a gradual closing down of certain mine areas. It further comprises theexpenditures of required developing works. The programme includes the human costs and the costsof necessary environmental rehabilitation.
As a consequence of the absence of developing works, the ore reserves were diminisheddrastically. Firstly in category RAT.
On 01.01.1993 the declared uranium resources were as follows:
RAR Reasonably Assured Resources1132 tonnes U
EAR I. Additional Resources16 661 tonnes U
on 01.01.1995:
RAR 672 tonnes U
335

EAR I. 15 644 tonnes U
As it appears form these figures, the RAR resources are sufficient for a production of 3 yearson the reduced level. At the same time the deposit has considerable resources for about 20 years.
The problem of the absence of developing works comes from the financial situation. In 1991the Hungarian Government declared the price of domestic uranium in US$60/kg. Since that timeinflation has increased by about 120% but the devaluation of the HUF was about 80% only.
Under these conditions the company is forced to consume the existing RAR resources and thefuture.
The change of the Government in last May is delaying the decision. The new HungarianGovernment declared the closing of Hungarian uranium mining on 23.12.1994. The closing meansthat the end of production will be on 31.12.1997. After this time the company will continue theclosing of mines and begin the environmental rehabilitation works.
THE CURRENT SITUATION
Some data about the Hungarian uranium centre:
Name of the production centre: MECSEKURAN LLCOperational status: existingStartup date: 1956Deposit type: sandstoneType of the mining operation: UGSize (tonnes ore/day): 2500Average mining recovery: 50 to 60%Type of the mill: IX/AL (+ heap leaching)Size (tonnes ore/day): 1500Average processing ore recovery: 90%Nominal production capacity (t U/year): 650Employment: 1300, at the end of 1995: 1200Historical U production (t):
to 1992: 16 7181993: 3801994: 4131995 and later: 210-200/year until 1998
During the last years the MECSEKURAN was the only supplier of the Hungarian NPP. In1995 the MECSEKURAN reduced its production the further demand of NPP is coming from Russia.
THE OPTION OF THE DEPOSIT OF RADIOACTIVE WASTE
In the near vicinity of the Mecsek Uranium deposit, to the west, and in the deep footwall ofthe "productive" complex, in the Lower Permian aleurolit (a claystone) could be of major importancein the future.
Hungary is not a very extensive country, and most of its area is overlain by Tertiary-Quaternary sediments, therefore the deposition of the different kinds of toxic and radioactive wastescauses anxiety. Presently the high activity radioactive waste — the spent fuel elements — are deliveredto the Soviet Union, within the framework of an interstate contract, but the deposition of the middle,low and high activity wastes is a continuing problem.
336

The above mentioned geological formation is extremely large extensive, about 140 km2, andhas a thickness of 600-800 m. Its homogeneity, water-tightness makes it quite suitable for finaldeposition of any kind of dangerous waste, radioactive waste included.
The experts of Mecsek, knowing well the importance of the geological sealing of wastedeposits, began the detailed surveying of the area.
As the area in question is not far from the western flank of our deposit, the idea emerged thatwith the help of an exhaust of the mine which could be taken out of the mine activities and is 1000 mdeep, will we can access the formation, and the shaft could be used for the deposition in 1100 mdepth. The formation in the area is free from faults, is tight, and even the quality of its materialexcludes the possibility of water migration, therefore the dangerous wastes could be separated fromthe environment with total safety.
The research is in progress, and as a matter of course the economical calculations too, bothnational and foreign companies and authorities, scientific institutions are involved, the interest is veryintensive.
According to the present concept, the planned depository even in the first phase could receiveabout 30 000 m3 waste per year.
The whole surveying and research work on the waste deposit is performed according tointernational standards. Within the framework of a National Project and using technical assistance ofthe Canadian AECL, the Mecsek Ore Mining Co. and the MECSEKURAN LTD. excavated about300 m drift and drilled about 800 m boreholes for the prospection of the claystone.
The programme is expected to continue in the next years.
5IEXT PAOE(S)left BLANK 337

LIST OF PARTICIPANTS
Abakumov, A.A.
Anisimov, A.V.
Anysimov, V.A.
Arnaiz de Guezala, J.
Babak, M.I.
Bakarjiev, A.C.
Ballery, J.-L.
Barthel, F.
Bejenaru, C.
Beliavsky, L.N.
Benes, V.
Bhasin, J.L.
Boitsov, A.V.
Bunus, F.T.
KATEP,National Joint Stock Company of Atomic Energy
and Industry,ul Bogenbai Batyr Street 168,480012 Almaty, Kazakstan
Faculty of Cybernetics, Kiev State University,252017 Kiev 17, Ukraine
"Goskomgeologia",State Geological Enterprise, "Kirovgeology",Expedition # 57, P.O. Box 1,Kamenka, Cherkaskoi District, Ukraine
ENUSA, Apartado 28,E-37500 Ciudad Rodrigo, Salamanca, Spain
East Mining and Concentrating Complex,State Committee on Nuclear Power Use,Gorky str. 2, Dniepropetrovsky Region,,322530 Zholtye Vody, Ukraine
State Geological Enterprise "Kirovgeology",8 Kikvidze Street, 252103 Kiev, Ukraine
Commissariat a l'6nergie atomique,Centre d'etudes nucleaires de Saclay, DDC/DIR/MNC,B&iment 476, F-91191 Gif-sur-Yvette Cedex, France
Bundesanstalt fur Geowissenschaften und Rohstoffe,Stilleweg 2, D-30655 Hannover, Germany
Rare Metals Autonomous Regie,68 Dionisie Lupu Street, Bucharest 1, Romania
State Geological Enterprise "Kirovgeology",8 Kikvidze Street, 252103 Kiev, Ukraine
Diamo s.p., CS-471 27 Str£2 pod Ralskem, Czech Republic
Uranium Corporation of India Ltd,Jaduguda, Bihar, India
All-Russian Research Institute of Chemical Technology,Kashirskoe road, 33, 115409 Moscow, Russian Federation
Chimenerg, c/o Baba Novae 19 G 12,Bucharest 38, Romania
339

Cadez, F.
Chernov, A.P.
Chruschev, D.P.
Cioloboc, D.
Dembinski, W.
Desderedjian, M.
Dwivedy, K.K.
Erdi-Krausz, G.
Fyodorov, G.V.
Fomin, Yu.A.
Galetsky, L.S.
Gavrilenko, N.M.
Geidl, J.
Giroux, M.
Hassan, M.A.G.
Mine zirovski vrh,Todrai 1, 64224 Gorenja vas, Slovenia
The Ukrainian State Committee onNuclear Power Utilization,
9, Bastionnnaya str., 252014 Kiev, Ukraine
Institute of Geological Science,National Academy of Science of Ukraine,55-B Tchkalov Street, 252650 Kiev, Ukraine
Rare Metals Autonomous Regie,68 Dionisie Lupu Street, Bucharest 1, Romania
Department of Radiochemistry,Institute of Nuclear Chemistry and Technology,Dorodna 16, PL-03-195 Warsaw, Poland
Electricite de France, 23 bis Avenue de Messine,F-75384 Paris Cedex 08, France
Atomic Minerals Division, Department of Atomic Energy,1-10-153-156, Begumpet, Hyderabad 500 016, India
Mecsekuran Ltd, H-7673 Kovagoszolos 0165, Hungary
Radiology Division, Atomic Energy Agency of Kazakhstan,13 Sq. Republic, 480013 Almaty, Kazakstan
Institute of Geochemistry, Mineralogy and Ore Formation,National Academy of Science of Ukraine,34 Palladin Prospect, Kiev, 252142, Ukraine
State Geological Enterprise "Geoprognoz",8 Pilip Orlyck Street, 252024 Kiev, Ukraine
State Committee of Ukraine for Geology andUtilization of Mineral Resources,
34 Volodymyrska Street, 25200 Kiev, Ukraine
El-50, US Department of Energy,Washington D.C. 20585, United States of America
Corporate Strategy and International Development,COGEMA,2, rue Paul-Dautier,F-78140 Velizy-Villacoublay, France
Nuclear Materials Authority,P.O. Box 530, El Maadi, Cairo, Egypt
340

Ishido, A.
Ischukova, L.P.
John, R.D.
Kotova, V.M.
Koval, V.B.
Kuchersky, N.
Likar, B.
Lovyunikov, V.I.
Makarenko,N.N.
Malivanchuck, B.V.
Makhivchuck, O.F.
Mashkovtsev, G.A.
Matolin, M.
Miu, I.
Naumov, S.S.
Tono Geoscience Center, Resources Appraisal Section,Power Reactor and Nuclear Fuel Development Corp.,959-31 Sonodo, Jorinji, Izumi-cho,Toki, Gifu, 509-51, Japan
Concern Geologorazvedka,State Geological Enterprise Sosnovgeologia,4, Marshala Rybalko Street,123436 Moscow, Russian Federation
Uranium Saskatchewan Association, Inc.,600 Spadina Crescent East,Saskatoon, Saskatchewan, Canada S7K 3G9
Ail-Russian Research Institute of Chemical Technology,Kashirskoe road, 33, 115230 Moscow, Russian Federation
Institute of Geochemistry, Mineralogy and Ore Formation,National Academy of Science of Ukraine,34 Palladin Prospect, 252142 Kiev, Ukraine
Navoi Mining & Metallurgy Combinat,27, Navoi Street, 2706800 Navoi, Uzbekistan
R2V Mine zirovski vrh,Todraz 1, 64224 Gorenja vas, Slovenia
State Commission of Ukraine on Mineral Resources,34, Volodymyrska Str., GSP-34, 252601 Kiev, Ukraine
State Geological Enterprise "Kirovgeology",8 Kikvidze Street, 252103 Kiev, Ukraine
Expedition # 37, Kirovograd, Ukraine
State Geological Enterprise "Kirovgeology",8 Kikvidze Street, 252103 Kiev, Ukraine
All Russian Institute of Mineral Materials (VIMS),Staromonetny st. 31, 10917 Moscow, Russian Federation
Faculty of Science, Charles University,Albertov 6, CS-128 43 Prague 2, Czech Republic
Chimenerg,Drumul E 70 km 6, Craiova, Romania
Geologorazvedka Concern,4, Marshala Rybalko Str.,123436 Moscow, Russian Federation
341

Navarra, P.R.
Ogryzlo, P.S.
Oi, N.
Pakhomov, V.I.
Palfi, A.G.
Perkov, P.G.
Saleskij, V.T.
Sayyah, T.A.
Shumlyanskiy, V.A.
Siroshtan, D.R.
Starodumov, V.M.
Stcherbak, N.P.
Stevens, G.H.
Departamento Evaluacion,Comision Nacional de Energia Atomica,Azopardo 313, 5501 - Godoy Cruz, Mendoza, Argentina
Uranium & Support Services, CAMECO Corporation,2121-11th Street West,Saskatoon, Saskatchewan S7M 1J3, Canada
Division of Nuclear Fuel Cycle and Waste Management,International Atomic Energy Agency,Wagramerstrasse 5, P.O. Box 100, A-1400 Vienna, Austria
Moscow Geological Exploration Institute,23 Mikluko-Maklaya UL,117873 Moscow, Russian Federation
Mining Directorate, Ministry of Mines and Energy,Private Bag 13297, Windhoek, Namibia
Hydrometallurgical Plant,State Committee on Nuclear Power Use,Gorky str. 2, Dniepropetrovsky reg.,322530 Zholrye Vody, Ukraine
" Goskomgeologia",State Geological Enterprise "Kirovgeology",Expedition # 57, P.O. Box 1,Kamenka, Cherkaskoi District, Ukraine
Nuclear Materials Authority,P.O. Box 530, El Maadi, Cairo, Egypt
Institute of Geochemistry, Mineralogy and Ore Formation,National Academy of Science of Ukraine,34 Palladin Prospect, 252142 Kiev, Ukraine
State Geological Enterprise "Kirovgeology",8 Kikvidze street, 252103 Kiev, Ukraine
State Committee of Ukraine for Nuclear Power Utilization,9 Bastionaya Street, Kiev 252014, Ukraine
Institute of Geochemistry, Mineralogy and Ore Formation,National Academy of Science of Ukraine,34 Palladin Prospect, 252142 Kiev, Ukraine
OECD Nuclear Energy Agency,Le Seine Saint-Germain, 12, Boulevard des lies,F-92130 Issy-les-Moulineaux, France
342

Sukhovarov- Jornoviy,
Suran, J.
Tarkhanov, A.V.
Taylor, M.
Underbill, D.H.
Vasil'ev, A.I.
Wheatley, K.
Whillans, R.T.
Yakovlev, E.A.
Zaritzky, O.I.
Zavarzin, A.V.
Zhang, R.
B.V. State Geological Enterprise "Kirovgeology",8 Kikvidze Street, 252103 Kiev, Ukraine
Diamo s.p.,CS-471 27 Straz pod Ralskem, Czech Republic
Atomredmetzoloto, Bolshaya Ordynka 24/26,109107 Moscow, Russian Federation
The Uranium Institute,Bowater House, 68 Knigthsbridge,London SW1X 7LT, United Kingdom
Division of Nuclear Fuel Cycle and Waste Management,International Atomic Energy Agency,Wagramerstrasse 5, P.O. Box 100,A-1400 Vienna, Austria
Eastern Ore-Dressing Factory,Kno Boctzok, Scientific Association,Gor'kogo St. 2, 322530 Zhieltye Vody,Dnepropetrovsk Region, Ukraine
Uranerz Exploration and Mining Limited,410 22nd Street East, Suite 1300,Saskatoon, Saskatchewan S7K 5TA, Canada
Natural Resources Canada, 580 Booth Street,Ottawa, Ontario, K1A OE4 Canada
State Committee of Ukraine for Geology andUtilization of Mineral Resources,
32 Volodymyrska Street, 252003 Kiev, Ukraine
State Committee of Ukraine for Geology andUtilization of Mineral Resources,
32 Volodymyrska Street, 252003 Kiev, Ukraine
Ail-Russian Research Institute of Chemical Technology,Kashirskoe road, 33, 115409 Moscow, Russian Federation
Bureau of Mining & Metallurgy,China National Nuclear Corporation,P.O. Box 2101-9, 100822 Beijing, China
343


![[ترجمه] Carlin Trend Exploration History Discovery of the Carlin Deposit](https://static.fdokumen.com/doc/165x107/63168d77c5ccb9e1fb03bb00/-carlin-trend-exploration-history-discovery-of-the-carlin-deposit.jpg)


