Self-Organization of Zr(IV) Porphyrinoids on Graphene Oxide Surfaces by Axial Metal Coordination
Upload
khangminh22Category
view
0download
0
minerals
Article
Rutile Mineral Chemistry and Zr-in-Rutile Thermometry inProvenance Study of Albian (Uppermost Lower Cretaceous)Terrigenous Quartz Sands and Sandstones in SouthernExtra-Carpathian Poland
Jakub Kotowski * , Krzysztof Nejbert and Danuta Olszewska-Nejbert
�����������������
Citation: Kotowski, J.; Nejbert, K.;
Olszewska-Nejbert, D. Rutile Mineral
Chemistry and Zr-in-Rutile
Thermometry in Provenance Study of
Albian (Uppermost Lower
Cretaceous) Terrigenous Quartz
Sands and Sandstones in Southern
Extra-Carpathian Poland. Minerals
2021, 11, 553.
https://doi.org/10.3390/
min11060553
Academic Editor: José
Francisco Molina
Received: 30 March 2021
Accepted: 19 May 2021
Published: 23 May 2021
Publisher’s Note: MDPI stays neutral
with regard to jurisdictional claims in
published maps and institutional affil-
iations.
Copyright: © 2021 by the authors.
Licensee MDPI, Basel, Switzerland.
This article is an open access article
distributed under the terms and
conditions of the Creative Commons
Attribution (CC BY) license (https://
creativecommons.org/licenses/by/
4.0/).
Faculty of Geology, University of Warsaw, Zwirki i Wigury 93, 02-089 Warszawa, Poland;[email protected] (K.N.); [email protected] (D.O.-N.)* Correspondence: [email protected]
Abstract: The geochemistry of detrital rutile grains, which are extremely resistant to weathering,was used in a provenance study of the transgressive Albian quartz sands in the southern partof extra-Carpathian Poland. Rutile grains were sampled from eight outcrops and four boreholeslocated on the Miechów, Szydłowiec, and Puławy Segments. The crystallization temperatures of therutile grains, calculated using a Zr-in-rutile geothermometer, allowed for the division of the studyarea into three parts: western, central, and eastern. The western group of samples, located in theMiechów Segment, is characterized by a polymodal distribution of rutile crystallization temperatures(700–800 ◦C; 550–600 ◦C, and c. 900 ◦C) with a significant predominance of high-temperature forms,and with a clear prevalence of metapelitic over metamafic rutile. The eastern group of samples,corresponding to the Lublin Area, is monomodal and their crystallization temperatures peak at550–600 ◦C. The contents of metapelitic to metamafic rutile in the study area are comparable. Thecentral group of rutile samples with bimodal distribution (550–600 ◦C and 850–950 ◦C) most likelyrepresents a mixing zone, with a visible influence from the western and, to a lesser extent, the easterngroup. The most probable source area for the western and the central groups seems to be granuliteand high-temperature eclogite facies rocks from the Bohemian Massif. The most probable source areafor the eastern group of rutiles seems to be amphibolites and low temperature eclogite facies rocks,probably derived from the southern part of the Baltic Shield.
Keywords: heavy mineral analysis; trace elements; Lower Cretaceous; provenance; mature sediment;longshore current; Bohemian Massif; Baltic Shield
1. Introduction
The uppermost Early Cretaceous (Middle and Late Albian, c. 110.8–100.5 Ma) andLate Cretaceous epicontinental basin in Poland, called the Polish Basin, was part of thevast Central European Basin System (CEBS, Figure 1) [1]. The CEBS developed afterthe Variscan orogeny (c. 300 Ma) and extended from the North Sea to Poland [2]. Theprocesses that took place in the CEBS from the Permian to the Palaeogene were successivemarine transgressions and regressions with the dominant characteristics of shallow shelfsea sedimentation. In the late Jurassic, a significant uplift of Precambrian and Variscanstructures was reported, e.g., [2,3] including SW Poland. After the Neo-Cimmerian tectonicphase, during the Earliest Cretaceous, the sea-level was low [4] and large land areasof extra-Alpine Europe had been elevated [5]. Sedimentation in the Polish Basin wasrestricted to the narrow Mid-Polish Trough, including terrestrial and shallow shelf facies.Additionally, the epicontinental Polish basin was isolated from the Tethys Sea during mostof the Early Cretaceous [6–8]. In the Middle and Late Albian (latest Early Cretaceous) inthe Polish Basin, as in everywhere in Europe, a significant eustatic marine transgression
Minerals 2021, 11, 553. https://doi.org/10.3390/min11060553 https://www.mdpi.com/journal/minerals
Minerals 2021, 11, 553 2 of 27
began [9–11]. The sea transgressed from the west and merged with the Russian sea inthe east [9]. The detrital material came, most probably, from nearby uplifted areas. Thesource areas (Figure 1) could have been (i) the Bohemian Massif S and SW of the study area;(ii) the Ukrainian Shield [5,9,12]; (iii) a hypothetical Holy Cross Mountain—Dobruja Land(HCMDL) [13], also called the Krukienic Island [14]; or (iv) the crystalline basement of thesouthern part of the Baltic Shield. Quartz as a main component of the Albian sands haslittle diagnostic significance in determining its provenance. Therefore, the analysis of heavyminerals seems to be a promising approach in provenance studies of these mineralogicallymature sediments [15–19].
Minerals 2021, 11, 553 2 of 28
in the Polish Basin, as in everywhere in Europe, a significant eustatic marine transgression began [9–11]. The sea transgressed from the west and merged with the Russian sea in the east [9]. The detrital material came, most probably, from nearby uplifted areas. The source areas (Figure 1) could have been (i) the Bohemian Massif S and SW of the study area; (ii) the Ukrainian Shield [5,9,12]; (iii) a hypothetical Holy Cross Mountain—Dobruja Land (HCMDL) [13], also called the Krukienic Island [14]; or (iv) the crystalline basement of the southern part of the Baltic Shield. Quartz as a main component of the Albian sands has little diagnostic significance in determining its provenance. Therefore, the analysis of heavy minerals seems to be a promising approach in provenance studies of these miner-alogically mature sediments [15–19].
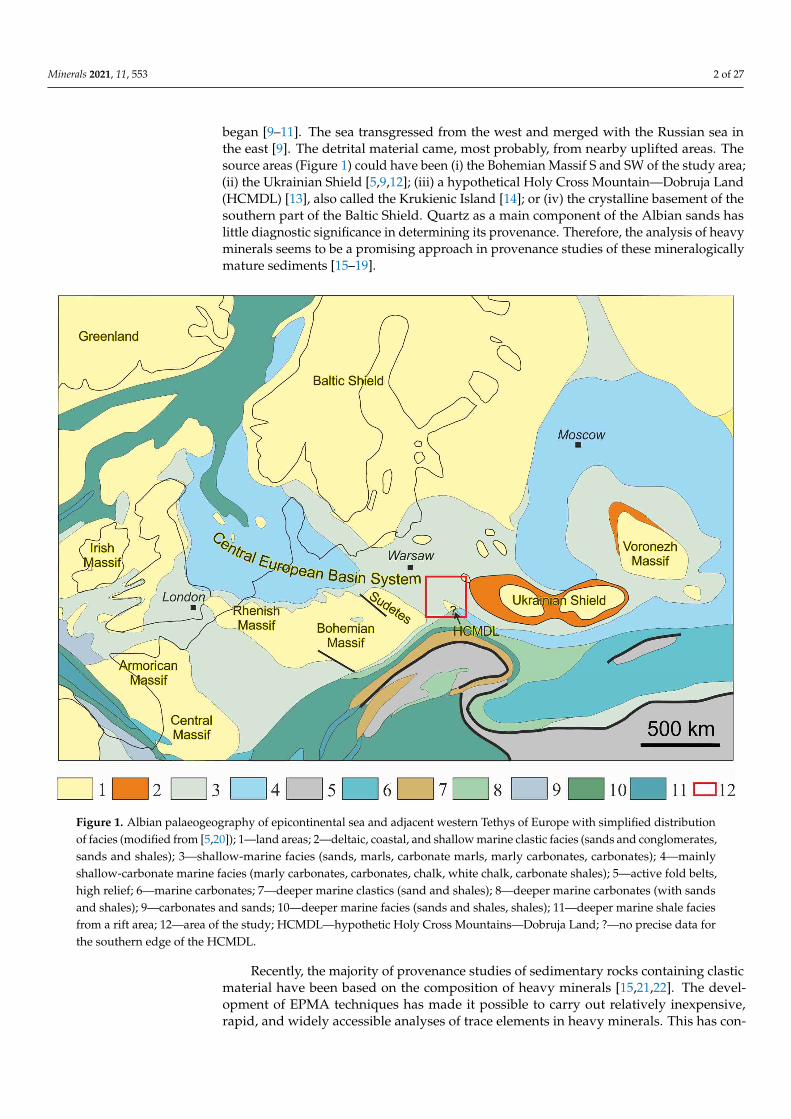
Figure 1. Albian palaeogeography of epicontinental sea and adjacent western Tethys of Europe with simplified distribu-tion of facies (modified from [5,20]); 1—land areas; 2—deltaic, coastal, and shallow marine clastic facies (sands and con-glomerates, sands and shales); 3—shallow-marine facies (sands, marls, carbonate marls, marly carbonates, carbonates); 4—mainly shallow-carbonate marine facies (marly carbonates, carbonates, chalk, white chalk, carbonate shales); 5—active fold belts, high relief; 6—marine carbonates; 7—deeper marine clastics (sand and shales); 8—deeper marine carbonates (with sands and shales); 9—carbonates and sands; 10—deeper marine facies (sands and shales, shales); 11—deeper marine shale facies from a rift area; 12—area of the study; HCMDL—hypothetic Holy Cross Mountains—Dobruja Land; ?—no precise data for the southern edge of the HCMDL.
Recently, the majority of provenance studies of sedimentary rocks containing clastic material have been based on the composition of heavy minerals [15,21,22]. The develop-ment of EPMA techniques has made it possible to carry out relatively inexpensive, rapid, and widely accessible analyses of trace elements in heavy minerals. This has contributed
Figure 1. Albian palaeogeography of epicontinental sea and adjacent western Tethys of Europe with simplified distributionof facies (modified from [5,20]); 1—land areas; 2—deltaic, coastal, and shallow marine clastic facies (sands and conglomerates,sands and shales); 3—shallow-marine facies (sands, marls, carbonate marls, marly carbonates, carbonates); 4—mainlyshallow-carbonate marine facies (marly carbonates, carbonates, chalk, white chalk, carbonate shales); 5—active fold belts,high relief; 6—marine carbonates; 7—deeper marine clastics (sand and shales); 8—deeper marine carbonates (with sandsand shales); 9—carbonates and sands; 10—deeper marine facies (sands and shales, shales); 11—deeper marine shale faciesfrom a rift area; 12—area of the study; HCMDL—hypothetic Holy Cross Mountains—Dobruja Land; ?—no precise data forthe southern edge of the HCMDL.
Recently, the majority of provenance studies of sedimentary rocks containing clasticmaterial have been based on the composition of heavy minerals [15,21,22]. The devel-opment of EPMA techniques has made it possible to carry out relatively inexpensive,rapid, and widely accessible analyses of trace elements in heavy minerals. This has con-

Minerals 2021, 11, 553 3 of 27
tributed to the use of heavy minerals in provenance analyses of siliciclastic deposits and thedetermination of the host rocks and source areas in many places around the world [23–25].
Rutile, apart from zircon and tourmaline, is classified as a heavy mineral extremelyresistant to weathering [24] and is very common in clastic sediments, including quartzarenite. Despite this, rutile is rarely used in provenance analyses of clastic material. Itis, however, an especially useful mineral in pure quartz arenites, which are characterizedby high ZTR (zircon-tourmaline-rutile) index, low quantity, and low diversity of heavyminerals [18,26,27]. However, it is interesting because rutile composition can be used as a toolin provenance studies [28–30]. The advancement of analytical techniques led to the recognitionof a relationship between the crystallization temperature and Zr content in rutile [31,32]. Thisin turn allowed the calibration of the Zr-in-rutile (ZIR) geothermometer, which can also bequite widely used in determining the provenance of detrital rutile [28,29,31,33,34].
The aims of this paper are as follows: (1) to comment on the physical propertiesof rutile as an important factor influencing the mode of preservation of rutile in detritalsettings; (2) to report on the chemical composition of rutile from twelve outcrops and/orboreholes scattered in extra-Carpathian Albian (uppermost Lower Cretaceous) sands ofsouthern Poland; (3) to test an application of the Zr-in-rutile thermometry in provenancestudies of quartz arenite; and, finally, (4) to point out some of the possible provenances ofrutile in the Albian quartz arenites to determine the host rocks and location of source area(s).
2. Regional Geological Setting
The study area covers the southern part of extra-Carpathian Poland where Albiandeposits are available partly as outcrops and partly in boreholes (Figure 2). The Albiandeposits crop out at the marginal parts of the Miechów Segment of the Szczecin-Łódz-Miechów Synclinorium (Figure 2, Table 1). In the south-western part of the MiechówSegment, they form a narrow, nearly 100 km long longitudinal belt of outcrops, includingthe Korzkiew, Glanów-Stroniczki, Przychody, Lelów, and Mokrzesz localities studied here.In the north-eastern part of the Miechów Segment, close to the Holy Cross Mountains(HCM), the Albian deposits also form a narrow, longitudinal belt, but with rather occasionaloutcrops [35]. The best known outcrops in this part of the Miechów Segment occur atWrzosówka Hill (292.6 m a.s.l.) near Bolmin (studied here) and in an overburden activequarry in Małogoszcz (approx. 5 km west of Bolmin). The Radomsko Folds with theChełmo Mount (in Polish: Góra Chełmo, 323 m a.s.l.) terminate the Miechów Segment fromthe north and separate it from the Mogilno-Łódz Segment (Figure 2). One more outcropstudied here, called Kopiec, is situated on the northern edge of the Annopol Anticline inthe Szydłowiec Segment of the southern part of the Mid-Poland Anticlinorium (Figure 2,Table 1). The other four samples studied here come from boreholes in eastern Poland. Thethickness of the Albian sands in the Potok IG-1 borehole in the Szydłowiec Segment in thesouthern part of the Mid-Polish Anticlinorium is approximately 20 m [36] and was sampledfrom a depth of 248.0–249.7 m. The other three sampled boreholes, Tomaszów LubelskiIG-1, Piaski IG-2, and Łuków IG-1, are situated in the vast tectonic unit called the PuławySegment in the southern part of the Koscierzyna-Puławy Synclinorium (Figure 2, Table 1).The Tomaszów Lubelski IG-1 borehole is very close to the Mid-Polish Anticlinorium. Thethickness of Albian sands in this borehole is c. 12 m [37] and the core material was sampledat the depth of 1006.7–1013.0 m. The thickness of Albian sands in the Piaski IG-2 boreholeis only c. 2.5 m [38] and the core was sampled at the depth 725.4–727.4 m. The ŁukówIG-1 borehole is located close to the Mazury-Podlasie Homocline (Figure 2, Table 1). Thethickness of Albian sandstone in the northernmost borehole, Łuków IG-1, is c. 25 m [39]and was sampled at a depth of 510.1–524.6 m.

Minerals 2021, 11, 553 4 of 27Minerals 2021, 11, 553 4 of 28
Figure 2. Geological map of the south-eastern part of Poland. (a) Location of study area in Poland and Europe; (b) geolog-ical map after [40] with standard stratigraphic colours used: green—Cretaceous; blue—Jurassic; violet–pink—Triassic; other colours—pre-Mesozoic. Red dots indicate sample localities; the western zone: KRZ—Korzkiew, GLA—Glanów-Stroniczki, PRZ—Przychdy, LEL—Lelów; the central zone: MO—Mokrzesz, GCH—Chełmo Mount, BOL—Bolmin, PO—Potok IG-1; the eastern zone): TL—Tomaszów Lubeski IG-1, PK—Piaski IG-2, KOP—Kopiec, LK—Łuków IG-1. Yellow dotted line shows front of the Carpathian nappes. The division of the study area into individual zones was made on the basis of the results of rutile mineralogical studies, which allowed to distinguish three distinct groups (western, eastern, and central) of rutile grains crystallizing at different temperatures (more detailed description in the text).
Table 1. GPS coordinates of the examined localities.
Sample Type of Locality Locality Latitude Longitude KRZ outcrop
western zone/group
Korzkiew 50°09′42.5″ N 19°52′46.7″ E GLA outcrop Glanów-Stroniczki 50°18′59.9″ N 19°47′32.7″ E PRZ outcrop Przychody 50°30′22.0″ N 19°43′42.6″ E LEL outcrop Lelów 50°41′48.4″ N 19°36′18.9″ E MO outcrop
central zone/group
Mokrzesz 50°48′09.5″ N 19°23′34.4″ E GCH outcrop Chełmo Mount 51°03′27.2″ N 19°44′38.3″ E BOL outcrop Bolmin 50°48′36.5″ N 20°20′37.1″ E PO borehole Potok IG-1 50°45′43.17″ N 22°19′13.17″ E
KOP outcrop
eastern zone/group
Kopiec (Annopol) 50°54′27.0″ N 21°50′28.1″ E TL borehole Tomaszów Lubelski IG-1 50°24′59.98″ N 23°34′38.64″ E PK borehole Piaski IG-2 51°09′25.35″ N 22°55′03.64″ E LK borehole Łuków IG-1 51°56′32.99″ N 22°34′33.79″ E
Figure 2. Geological map of the south-eastern part of Poland. (a) Location of study area in Poland and Europe; (b) geologicalmap after [40] with standard stratigraphic colours used: green—Cretaceous; blue—Jurassic; violet–pink—Triassic; othercolours—pre-Mesozoic. Red dots indicate sample localities; the western zone: KRZ—Korzkiew, GLA—Glanów-Stroniczki,PRZ—Przychdy, LEL—Lelów; the central zone: MO—Mokrzesz, GCH—Chełmo Mount, BOL—Bolmin, PO—Potok IG-1;the eastern zone): TL—Tomaszów Lubeski IG-1, PK—Piaski IG-2, KOP—Kopiec, LK—Łuków IG-1. Yellow dotted lineshows front of the Carpathian nappes. The division of the study area into individual zones was made on the basis of theresults of rutile mineralogical studies, which allowed to distinguish three distinct groups (western, eastern, and central) ofrutile grains crystallizing at different temperatures (more detailed description in the text).
The Albian deposits directly cover Upper Jurassic limestones or calcareous clays ateleven locations [9,41]. Only in one borehole, Potok IG-1, are the calcareous sands overlyingthe pre-Albian Lower Cretaceous sand, sandstones, and calcareous sandstones [36]. Inall cases, excluding the Chełmo Mount, the Albian sands and sandstones are coveredby lithified carbonate (mainly inoceramid limestone) Cenomanian deposits [35,42]. AtChełmo Mount, the Albian sandstone is covered by Cenomanian glauconitic sands [43]. Thethickness of the Albian deposits ranges from 0 to c. 50 m [42] in the south-western marginof the Miechów Segment, and approximately 26–76 m in the north-eastern margin [44].The thickness of Albian sands and sandstones at Chełmo Mount [43], recorded as 180 m,seems to be overestimated. Previous investigations [6] show a maximum thickness of 100m for the Albian at this locality. The thickness of Albian deposits in the Kopiec outcropis 6.5 m and, in boreholes, as stated above, it ranges from c. 2.5 m (Piaski IG-2) to c. 25 m(Łuków IG-1). The differences in thickness of the Albian deposits were probably controlled

Minerals 2021, 11, 553 5 of 27
by active synsedimentary block faulting and a diversified pre-Albian surface morphology,which played a substantial role in controlling the local deposition of clastic material [35,42].
Table 1. GPS coordinates of the examined localities.
Sample Type of Locality Locality Latitude Longitude
KRZ outcrop
western zone/group
Korzkiew 50◦09′42.5′′ N 19◦52′46.7′′ EGLA outcrop Glanów-Stroniczki 50◦18′59.9′′ N 19◦47′32.7′′ EPRZ outcrop Przychody 50◦30′22.0′′ N 19◦43′42.6′′ ELEL outcrop Lelów 50◦41′48.4′′ N 19◦36′18.9′′ E
MO outcrop
central zone/group
Mokrzesz 50◦48′09.5′′ N 19◦23′34.4′′ EGCH outcrop Chełmo Mount 51◦03′27.2′′ N 19◦44′38.3′′ EBOL outcrop Bolmin 50◦48′36.5′′ N 20◦20′37.1′′ EPO borehole Potok IG-1 50◦45′43.17′′ N 22◦19′13.17′′ E
KOP outcrop
eastern zone/group
Kopiec (Annopol) 50◦54′27.0′′ N 21◦50′28.1′′ ETL borehole Tomaszów Lubelski IG-1 50◦24′59.98′′ N 23◦34′38.64′′ EPK borehole Piaski IG-2 51◦09′25.35′′ N 22◦55′03.64′′ ELK borehole Łuków IG-1 51◦56′32.99′′ N 22◦34′33.79′′ E
3. Materials and Methods
Twelve localities within the Albian deposits were sampled in the extra-Carpathianarea of southern Poland (Table 1, Figure 2). Sand and sandstone samples were taken fromseven natural outcrops: Korzkiew (KRZ), Glanów-Stroniczki (GLA), Przychody (PRZ),Lelów (LEL), Mokrzesz (MO), Bolmin (BOL), and Chełmo Mount (GCH) of the MiechówSegment. A sand sample from Kopiec (KOP) near Annopol and one sand sample fromthe Potok IG-1 borehole (PO) from the Szydłowiec Segment were also taken. Two sandysamples from the Tomaszów Lubelski IG-1 (TL) and the Piaski IG-2 (PK) borehole andone quartz sandstone sample from the Łuków IG-1 (LK) borehole, all from the PuławySegment, were also taken.
In order to separate the heavy minerals, a 1 kg sample from each outcrop (KRZ, GLA,PRZ, LEL, MO, GCH, BOL, KOP) and 0.5 kg sample from each core material (TL, PO, PK,LK—the weight of the core sample was limited owing to the limited amount of materialavailable for sampling) were used. The sandstone samples from the Chełmo Mount wereinitially crushed in a Testchem LKS-60 jaw crusher. All twelve samples (loose sands andcrushed material) were then rinsed with double-distilled water to dispose of the clayfractions and then sieved to obtain 63–125 µm and 125–250 µm size fractions. From thesefractions, three magnetic fractions (0.3 A, 0.8 A, 1.2 A, and a diamagnetic one at 1.2 A)were obtained from a single sample after separation on the Franz LB-1 Magnetic BarrierLaboratory Separator. The Frantz isodynamic separator was set to standard operatingconditions, with the side slope fixed at 15◦ and the chute forward slope set to 20◦ [45]. Themost magnetic minerals, such as Fe-Ti oxides and some garnets, tend to concentrate inthe 0.3 A fraction, while rutile falls into the diamagnetic fraction, and only some grainswere found in the 1.2 A magnetic fraction. This procedure not only helps in gaining highquality heavy mineral concentrates, but also shortens the time of density separation usinga heavy liquid. In this case, all obtained fractions were then separated using LST Fastfloatheteropolytungstate with a density of 2.9 g/cm3. After heavy liquid separation, the rutilegrains were handpicked, mostly from the non-magnetic fraction and to a lesser extent fromthe 1.2 A fraction. Earlier investigations had shown that there is no correlation between thesize of a detrital rutile grain and a magnetic fraction with its chemistry [46,47]; thus, therutile grains were picked regardless of size or occurrence in magnetic fractions.
The grain surface morphology and initial mineral identification were performed us-ing a ZEISS SIGMA VP electron microscope equipped with two energy-dispersive X-rayspectrometers Bruker XFlash 6|10 (SEM-EDS) in the National Multidisciplinary Labora-tory of Functional Nanomaterials NanoFun, Faculty of Geology, University of Warsaw.

Minerals 2021, 11, 553 6 of 27
The selection of grains for further analysis was made using a stereoscopic microscope,taking into account the optical properties of rutile [48]. Subsequently, the rutile grainswere mounted in epoxy resin and polished. Rutile compositions were determined bywavelength-dispersive spectrometry (EPMA) using a CAMECA SX Five field emissionelectron microprobe at the Joint-Institute Analytical Complex for Minerals and SyntheticSubstances, University of Warsaw. The analyses were done under a 15 kV acceleratingvoltage, 75 nA beam current, and 5 µm beam spot size. The counting times 20 s at peak and10 s for background for major elements were applied, while the intensity of Cr, Zr, and Nbanalytical lines selected was measured for 40 s at the peak maximum, and the backgroundintensity was recorded during half the time of the measurement at the peak position. The‘PAP’ Φ(ρZ) corrections after [49] were calculated. The standards supplied by Cameca andStructure Probe, Inc. were used during calibration of the microprobe. The standards, typeof diffracting crystals, analytical lines used, and mean detection limits, expressed in ppm,were as follows: Mg (MgO, LTAP, Kα, 23), Al (Al2O3, TAP, Kα, 40), Si (SiO2, TAP, Kα, 12),Ti (TiO2, LLIF, Kα, 104), V (V, LLIF, Kα, 40), Cr (Cr2O3, LLIF, Kα, 37), Mn (rhodonite, LLIF,Kα, 20), Fe (hematite-SPI25, LLIF, Kα, 40), Zr (Zr, LPET, Lα, 20), and Nb (Nb, Lα, 20).
The EBSD (electron backscatter diffraction) technique [50,51] was used for identifi-cation of TiO2 polymorphs. Mounts with rutile crystals embedded in epoxy resin werepolished using a 1.0 µm grain size diamond suspension and, furthermore, a 0.5 µm and0.25 µm diamond suspension using a vibrating polisher (vibromet). Rutile grains, embed-ded in epoxy resin, were analyzed in Zeiss Auriga 60 FE-SEM (field emission scanningelectron microscope) with a e− Flash Bruker EBSD detector. The rutile grains were notcovered with a conductive carbon layer; however, for more effective electron removal, a se-lected area of the examined mount with rutile grains was framed with a highly conductivecopper tape. The analyses were done in a high vacuum using a 10 kV acceleration voltage.The sample surface was tilted 70◦ relative to the beam and the detector tilt angle was closeto 1.6◦. The distance between the detector and the examined rutile surface was 17 mm. Inmost cases, rectangular areas within central parts of the analyzed grains were selected forEBSD analysis. Only an identification of TiO2 polymorphs was needed, therefore, a largerstep size (pixel size of approximately 1.5–3.5 µm) than in standard EBSD crystallographicorientation studies was used. A phase map mode was used to identify common TiO2polymorphs (rutile, brookite, or anatase) using the ESPRIT ver. 2.1 software, Bruker NanoGmbH, Berlin, Germany.
For TiO2 polymorph identification, the following crystallographic parameters, includ-ing space groups and fundamental unit cell parameters, were used: anatase (I41/amd;a = 3.7845 Å, c = 9.5143 Å), brookite (Pbca; a = 5.4558 Å, b = 9.1819 Å, c = 5.1429 Å), andrutile (P42/mnm; a = 4.5937 Å, c = 2.9587 Å).
4. Rutile Mineral Chemistry, Occurrence, and Zr-in-Rutile (ZIR) Geothermometry
Rutile is the most widespread and most thermodynamically stable natural polymorphof TiO2. The other, less common, natural polymorphs of TiO2 are akaogiite, anatase,brookite, and riesite [52,53]. Rutile most often crystallizes under conditions of medium-and high-grade metamorphism, and much less frequently in low-pressure hydrothermalquartz veins and in igneous rocks (for additional references, see Meinhold et al. andreferences therein [54]) with crystallization temperatures ranging from approximately430 ◦C to over 1100 ◦C [31]. In general, rutile crystallizes commonly in metamorphic rocksformed under high-pressure conditions, i.e., above 1.1 GPa [54,55]. In rocks with a lowCa content, it is also stable at pressures lower than 0.7 GPa [56]. Low-pressure rutiles arealso stable in low- and medium-grade metapelites, where the concentrations of Ca andFe are very low and, conversely, the contents of Mg and Al are very high [54,55,57,58].Low-pressure rutile may occur as characteristic needle-like crystals in quartz veins [59,60].Taking into account the documented stability of rutile and the potential differentiation ofthe chemical compositions of the protolith rocks, detrital rutile occurring in sedimentaryrocks most often crystallized in the temperature and pressure range corresponding to

Minerals 2021, 11, 553 7 of 27
eclogite, granulite, and blueschist metamorphism [30,31,54,55,61,62], and less frequentlyand/or very rarely crystallized under the conditions of epidote-amphibolite and greenschistmetamorphism [54,57].
Rutile preserves information on the lithology of the source area, because of its veryhigh resistance to weathering and diagenesis, whereas other minerals such as garnet,amphibole, and apatite may be completely dissolved occasionally. The use of rutile inprovenance analysis is limited by the low concentrations of trace elements, which requirethe use of laser ablation inductively coupled plasma mass spectrometry (LA ICP-MS) orelectron probe microanalysis (EPMA) in the trace analysis mode [31,33,47,54]. The use ofEPMA in trace mode is facilitated by the high thermal stability of rutile, thanks to whichit is possible to increase the detection limit of the determined trace elements by using thehigher current of the electron beam and the extending count time at peak and backgroundpositions. Approximate concentrations of elements from the HFSE group (high fieldstrength elements), represented by Nb, Ta, Zr, Hf, and W, as well as some transition metalsgroup, such as Cr, V, and Fe, can reach concentrations up to 3000 ppm [30,33,54,63,64].Zr concentrations in rutile from metamorphic rocks vary in the wide range from severalppm up to 11,000 ppm [29,34,65]. Anomalously high concentrations of transition metalsare described only from rutile occurring in some ore deposits, e.g., [66], in which thecontents of V2O3, Cr2O3, FeO, Nb2O5, and WO3 can reach 3.95 wt.%, 3.28 wt.%, 3.27 wt.%,0.23 wt.%, and 17.73 wt.%, respectively. The common high concentrations of HFSE andother transitional elements (particularly V and Cr) in rutile allow us to estimate rutilecrystallization temperatures and discriminate between different source lithologies withinsource areas (for review, see [54]); both of these methods are commonly used in sedimentprovenance studies.
Zr-in-rutile geothermometry (ZIR) is a relatively new method and is used mainly fordetermining crystallization temperatures of rutile in various metamorphic and igneousrocks [67]. The key requirement for using the ZIR method is the determination of theZr concentration in the rutile structure. Improving EPMA techniques in a trace modeallows us to determine the concentration of Zr with a detection limit below 40 ppm. TheZIR method can be applied only when the SiO2–ZrO2–TiO2 system is in equilibrium withquartz, zircon, and rutile [31,32,65]. So far, in the literature, there are several calibrations ofZr in rutile geothermometers (Table 2). The first ZIR geothermometer (no 1 in Table 2) wasproposed by [31] based on the Zr content of natural rutile crystals. This method assumesthat, if rutile crystallizes in the presence of zircon and quartz, then Zr is buffered in therutile structure. Rutile is able to preserve the original Zr concentration, indicating thepeak of metamorphism even under retrogressive conditions [33], thus allowing for thedetermination of the relict temperatures of rutile formation from previous crystallizationstages [68].
An alternative formula (no 2 in Table 2) was presented by [32], who calibrated theirrutile geothermometer on experimental studies, supplementing it with only a few analysesof natural rutiles. The results from both geothermometers coincide only at about 540 ◦C.The discrepancy between the two geothermometers is clearly visible at lower and highertemperatures. This difference may come from the systematic analysis of rutiles onlyincluded inside garnets by [31], while rutiles found in the rock matrix were disregarded.The above mentioned geothermometers (no 1 and 2 in Table 2) are based only on theZr concentration in the rutile structure. Geothermometers (no 3–7 in Table 2) presentedby [65,69] additionally take into account the pressure values in the system during rutilecrystallization. However, when analyzing rutile grains from sedimentary rocks, we haveno certainty about pressure conditions occurring during their crystallization. In earlierstudies, authors [47] suggested using a default 10 kbar and the α-quartz stability fieldgeothermometer of [65] when information about pressure is not available. A comparison ofcalculated temperatures from the geothermometers of [32] (no 2 in Table 2) and [65] (no 3 inTable 2), with suggested default values, shows differences not greater than 5%. The resultsof both ZIR geothermometers are nearly the same; therefore, we chose not to make further
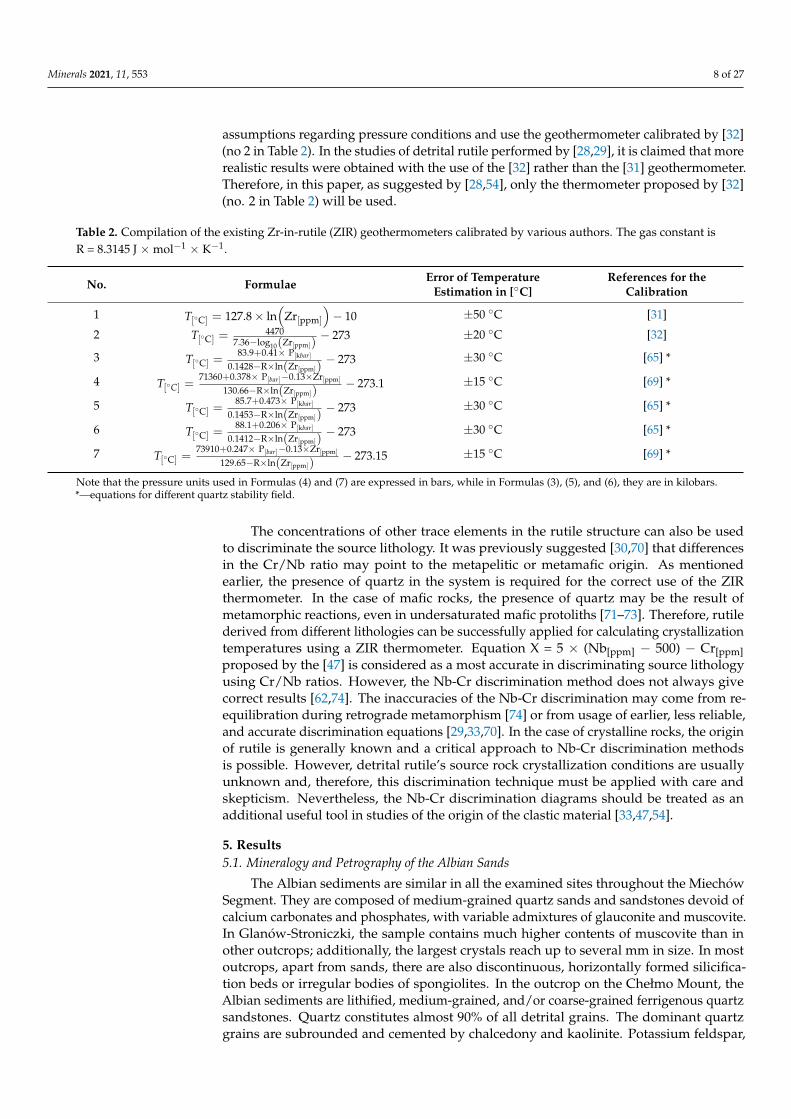
Minerals 2021, 11, 553 8 of 27
assumptions regarding pressure conditions and use the geothermometer calibrated by [32](no 2 in Table 2). In the studies of detrital rutile performed by [28,29], it is claimed that morerealistic results were obtained with the use of the [32] rather than the [31] geothermometer.Therefore, in this paper, as suggested by [28,54], only the thermometer proposed by [32](no. 2 in Table 2) will be used.
Table 2. Compilation of the existing Zr-in-rutile (ZIR) geothermometers calibrated by various authors. The gas constant isR = 8.3145 J ×mol−1 × K−1.
No. Formulae Error of TemperatureEstimation in [◦C]
References for theCalibration
1 T[◦C] = 127.8× ln(
Zr[ppm]
)− 10 ±50 ◦C [31]
2 T[◦C] =4470
7.36−log10(Zr[ppm])− 273 ±20 ◦C [32]
3 T[◦C] =83.9+0.41× P[kbar]
0.1428−R×ln(Zr[ppm])− 273 ±30 ◦C [65] *
4 T[◦C] =71360+0.378× P[bar]−0.13×Zr[ppm]
130.66−R×ln(Zr[ppm])− 273.1 ±15 ◦C [69] *
5 T[◦C] =85.7+0.473× P[kbar]
0.1453−R×ln(Zr[ppm])− 273 ±30 ◦C [65] *
6 T[◦C] =88.1+0.206× P[kbar]
0.1412−R×ln(Zr[ppm])− 273 ±30 ◦C [65] *
7 T[◦C] =73910+0.247× P[bar]−0.13×Zr[ppm]
129.65−R×ln(Zr[ppm])− 273.15 ±15 ◦C [69] *
Note that the pressure units used in Formulas (4) and (7) are expressed in bars, while in Formulas (3), (5), and (6), they are in kilobars.*—equations for different quartz stability field.
The concentrations of other trace elements in the rutile structure can also be usedto discriminate the source lithology. It was previously suggested [30,70] that differencesin the Cr/Nb ratio may point to the metapelitic or metamafic origin. As mentionedearlier, the presence of quartz in the system is required for the correct use of the ZIRthermometer. In the case of mafic rocks, the presence of quartz may be the result ofmetamorphic reactions, even in undersaturated mafic protoliths [71–73]. Therefore, rutilederived from different lithologies can be successfully applied for calculating crystallizationtemperatures using a ZIR thermometer. Equation X = 5 × (Nb[ppm] − 500) − Cr[ppm]proposed by the [47] is considered as a most accurate in discriminating source lithologyusing Cr/Nb ratios. However, the Nb-Cr discrimination method does not always givecorrect results [62,74]. The inaccuracies of the Nb-Cr discrimination may come from re-equilibration during retrograde metamorphism [74] or from usage of earlier, less reliable,and accurate discrimination equations [29,33,70]. In the case of crystalline rocks, the originof rutile is generally known and a critical approach to Nb-Cr discrimination methodsis possible. However, detrital rutile’s source rock crystallization conditions are usuallyunknown and, therefore, this discrimination technique must be applied with care andskepticism. Nevertheless, the Nb-Cr discrimination diagrams should be treated as anadditional useful tool in studies of the origin of the clastic material [33,47,54].
5. Results5.1. Mineralogy and Petrography of the Albian Sands
The Albian sediments are similar in all the examined sites throughout the MiechówSegment. They are composed of medium-grained quartz sands and sandstones devoid ofcalcium carbonates and phosphates, with variable admixtures of glauconite and muscovite.In Glanów-Stroniczki, the sample contains much higher contents of muscovite than inother outcrops; additionally, the largest crystals reach up to several mm in size. In mostoutcrops, apart from sands, there are also discontinuous, horizontally formed silicifica-tion beds or irregular bodies of spongiolites. In the outcrop on the Chełmo Mount, theAlbian sediments are lithified, medium-grained, and/or coarse-grained ferrigenous quartzsandstones. Quartz constitutes almost 90% of all detrital grains. The dominant quartzgrains are subrounded and cemented by chalcedony and kaolinite. Potassium feldspar,
Minerals 2021, 11, 553 9 of 27
glauconite, and heavy minerals are relatively rare. In sandstones from the Chełmo Mount,only a few, small, muscovite flakes were identified. The Albian sands at the Kopiec outcropare largely similar to those found on the western side of the present-day HCM. These areclastic sediments dominated by medium- and coarse-grained quartz sands. In the sands ofKopiec, however, there are significant amounts of small pieces of fine-grained phosphoriterocks and carbonate cements (mostly calcite) that are not found in the Miechów Segment.The Albian sediments from the Łuków IG-1 and Piaski IG-2 boreholes are similar to eachother. They constitute poorly cemented, fine-grained sandstones or loose quartz sandswith a significant amount of glauconite and fine muscovite flakes. As in the sample fromKopiec, small grains/clasts of phosphorite are also present. The Albian sandstones fromthe Tomaszów Lubelski IG-1 borehole are poorly lithified, composed of medium-grainedquartz with macroscopically visible glauconite. However, the concentrations of muscoviteare much lower than in samples from the north (Łuków IG-1 and Piaski IG-2). The sampletaken from the Potok IG-1 borehole is similar to that from Tomaszów Lubelski IG-1 andKopiec; it is characterized by a significantly higher content of calcium carbonate and only afew broken muscovite grains were identified.
Although petrographic and mineralogical descriptions of the main mineral compo-nents of the Albian sediments from southern Poland are somewhat variable, the heavymineral assemblage is exceptionally homogeneous and does not exceed 1% of the totalgrains of entire samples. In all of the examined samples, there is a dominance of mineralsthat are highly resistant to physical and chemical weathering. Thus, tourmaline, rutile, zir-con, staurolite, and to lesser extent monazite-(Ce) dominate in heavy mineral assemblages.Garnet, spinel, kyanite, and sillimanite can also be found, but in much lower amounts.Significant and variable concentrations of Fe-Ti oxides, usually very strongly affected byleucoxenization, are also present in all of the analyzed samples.
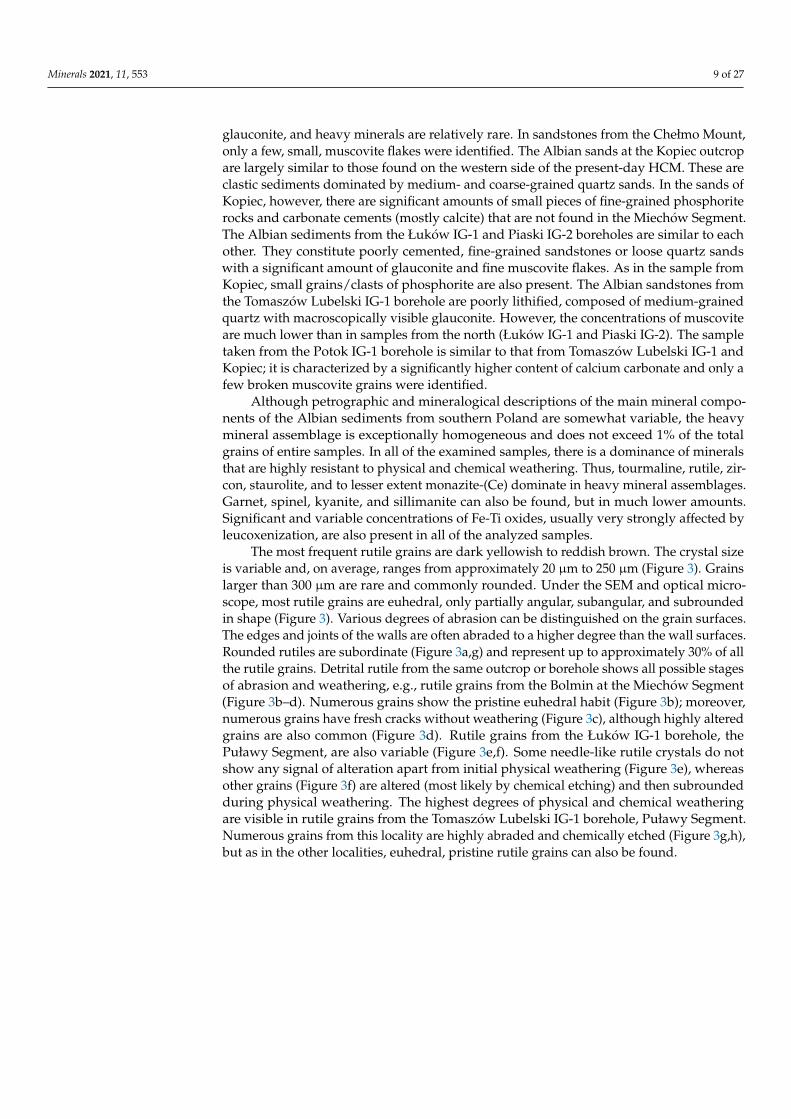
The most frequent rutile grains are dark yellowish to reddish brown. The crystal sizeis variable and, on average, ranges from approximately 20 µm to 250 µm (Figure 3). Grainslarger than 300 µm are rare and commonly rounded. Under the SEM and optical micro-scope, most rutile grains are euhedral, only partially angular, subangular, and subroundedin shape (Figure 3). Various degrees of abrasion can be distinguished on the grain surfaces.The edges and joints of the walls are often abraded to a higher degree than the wall surfaces.Rounded rutiles are subordinate (Figure 3a,g) and represent up to approximately 30% of allthe rutile grains. Detrital rutile from the same outcrop or borehole shows all possible stagesof abrasion and weathering, e.g., rutile grains from the Bolmin at the Miechów Segment(Figure 3b–d). Numerous grains show the pristine euhedral habit (Figure 3b); moreover,numerous grains have fresh cracks without weathering (Figure 3c), although highly alteredgrains are also common (Figure 3d). Rutile grains from the Łuków IG-1 borehole, thePuławy Segment, are also variable (Figure 3e,f). Some needle-like rutile crystals do notshow any signal of alteration apart from initial physical weathering (Figure 3e), whereasother grains (Figure 3f) are altered (most likely by chemical etching) and then subroundedduring physical weathering. The highest degrees of physical and chemical weatheringare visible in rutile grains from the Tomaszów Lubelski IG-1 borehole, Puławy Segment.Numerous grains from this locality are highly abraded and chemically etched (Figure 3g,h),but as in the other localities, euhedral, pristine rutile grains can also be found.
Minerals 2021, 11, 553 10 of 27Minerals 2021, 11, 553 10 of 28
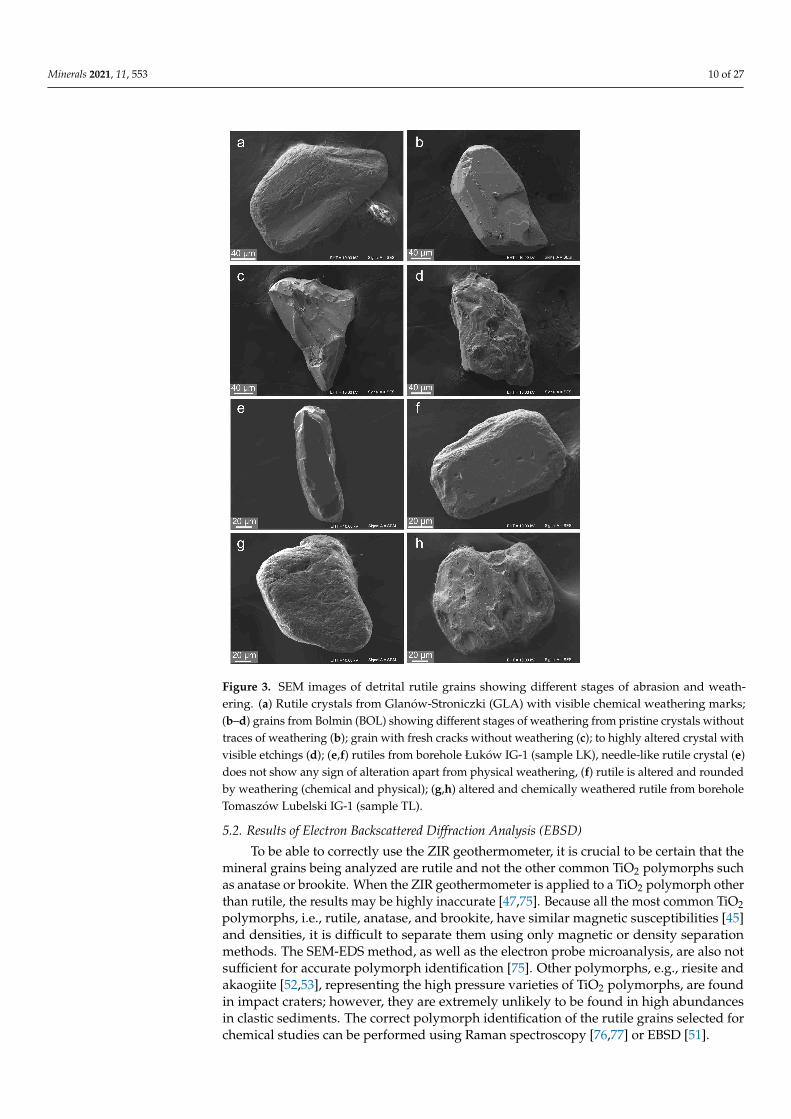
Figure 3. SEM images of detrital rutile grains showing different stages of abrasion and weathering. (a) Rutile crystals from Glanów-Stroniczki (GLA) with visible chemical weathering marks; (b–d) grains from Bolmin (BOL) showing different stages of weathering from pristine crystals without traces of weathering (b); grain with fresh cracks without weathering (c); to highly altered crystal with visible etchings (d); (e,f) rutiles from borehole Łuków IG-1 (sample LK), needle-like rutile crystal (e) does not show any sign of alteration apart from physical weathering, (f) rutile is altered and rounded by weathering (chemical and physical); (g,h) altered and chemically weathered rutile from borehole Tomaszów Lubelski IG-1 (sample TL).
5.2. Results of Electron Backscattered Diffraction Analysis (EBSD) To be able to correctly use the ZIR geothermometer, it is crucial to be certain that the
mineral grains being analyzed are rutile and not the other common TiO2 polymorphs such as anatase or brookite. When the ZIR geothermometer is applied to a TiO2 polymorph other than rutile, the results may be highly inaccurate [47,75]. Because all the most com-mon TiO2 polymorphs, i.e., rutile, anatase, and brookite, have similar magnetic suscepti-bilities [45] and densities, it is difficult to separate them using only magnetic or density separation methods. The SEM-EDS method, as well as the electron probe microanalysis, are also not sufficient for accurate polymorph identification [75]. Other polymorphs, e.g., riesite and akaogiite [52,53], representing the high pressure varieties of TiO2 polymorphs, are found in impact craters; however, they are extremely unlikely to be found in high abundances in clastic sediments. The correct polymorph identification of the rutile grains selected for chemical studies can be performed using Raman spectroscopy [76,77] or EBSD [51].
Figure 3. SEM images of detrital rutile grains showing different stages of abrasion and weath-ering. (a) Rutile crystals from Glanów-Stroniczki (GLA) with visible chemical weathering marks;(b–d) grains from Bolmin (BOL) showing different stages of weathering from pristine crystals withouttraces of weathering (b); grain with fresh cracks without weathering (c); to highly altered crystal withvisible etchings (d); (e,f) rutiles from borehole Łuków IG-1 (sample LK), needle-like rutile crystal (e)does not show any sign of alteration apart from physical weathering, (f) rutile is altered and roundedby weathering (chemical and physical); (g,h) altered and chemically weathered rutile from boreholeTomaszów Lubelski IG-1 (sample TL).
5.2. Results of Electron Backscattered Diffraction Analysis (EBSD)
To be able to correctly use the ZIR geothermometer, it is crucial to be certain that themineral grains being analyzed are rutile and not the other common TiO2 polymorphs suchas anatase or brookite. When the ZIR geothermometer is applied to a TiO2 polymorph otherthan rutile, the results may be highly inaccurate [47,75]. Because all the most common TiO2polymorphs, i.e., rutile, anatase, and brookite, have similar magnetic susceptibilities [45]and densities, it is difficult to separate them using only magnetic or density separationmethods. The SEM-EDS method, as well as the electron probe microanalysis, are also notsufficient for accurate polymorph identification [75]. Other polymorphs, e.g., riesite andakaogiite [52,53], representing the high pressure varieties of TiO2 polymorphs, are foundin impact craters; however, they are extremely unlikely to be found in high abundancesin clastic sediments. The correct polymorph identification of the rutile grains selected forchemical studies can be performed using Raman spectroscopy [76,77] or EBSD [51].
Minerals 2021, 11, 553 11 of 27
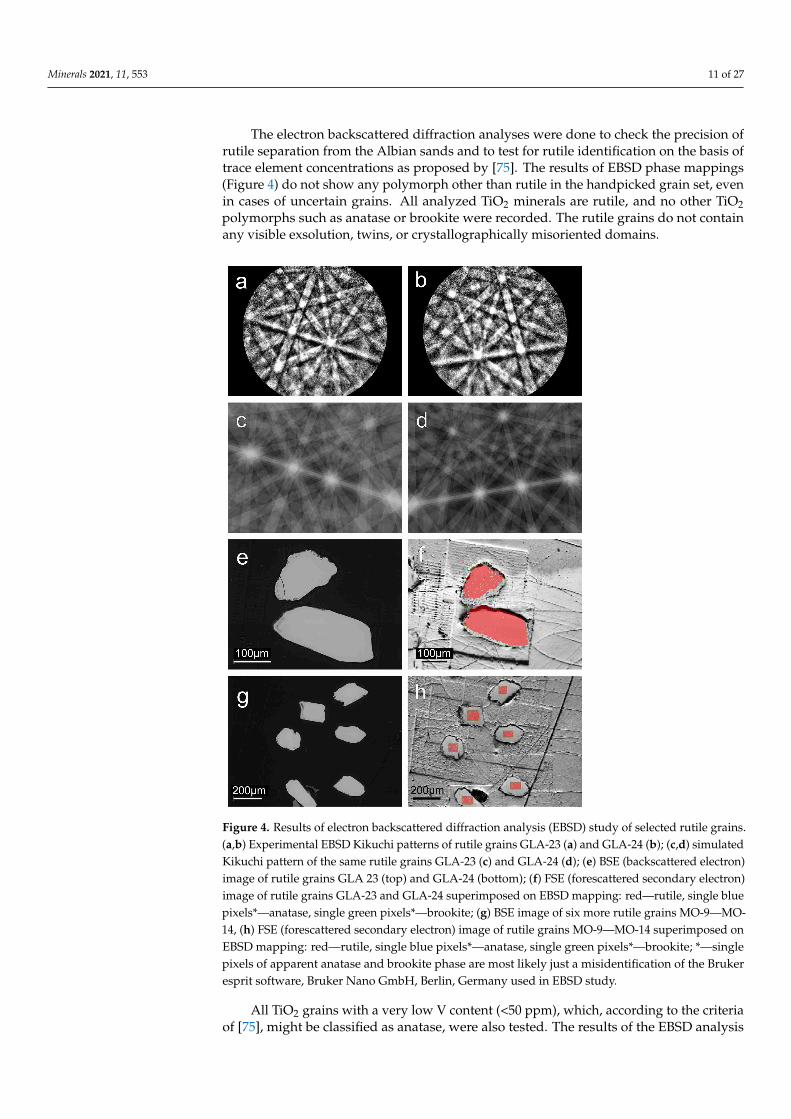
The electron backscattered diffraction analyses were done to check the precision ofrutile separation from the Albian sands and to test for rutile identification on the basis oftrace element concentrations as proposed by [75]. The results of EBSD phase mappings(Figure 4) do not show any polymorph other than rutile in the handpicked grain set, evenin cases of uncertain grains. All analyzed TiO2 minerals are rutile, and no other TiO2polymorphs such as anatase or brookite were recorded. The rutile grains do not containany visible exsolution, twins, or crystallographically misoriented domains.
Minerals 2021, 11, 553 11 of 28
The electron backscattered diffraction analyses were done to check the precision of rutile separation from the Albian sands and to test for rutile identification on the basis of trace element concentrations as proposed by [75]. The results of EBSD phase mappings (Figure 4) do not show any polymorph other than rutile in the handpicked grain set, even in cases of uncertain grains. All analyzed TiO2 minerals are rutile, and no other TiO2 pol-ymorphs such as anatase or brookite were recorded. The rutile grains do not contain any visible exsolution, twins, or crystallographically misoriented domains.
Figure 4. Results of electron backscattered diffraction analysis (EBSD) study of selected rutile grains. (a,b) Experimental EBSD Kikuchi patterns of rutile grains GLA-23 (a) and GLA-24 (b); (c,d) simulated Kikuchi pattern of the same rutile grains GLA-23 (c) and GLA-24 (d); (e) BSE (backscat-tered electron) image of rutile grains GLA 23 (top) and GLA-24 (bottom); (f) FSE (forescattered secondary electron) image of rutile grains GLA-23 and GLA-24 superimposed on EBSD mapping: red—rutile, single blue pixels*—anatase, single green pixels*—brookite; (g) BSE image of six more rutile grains MO-9—MO-14, (h) FSE (forescattered secondary electron) image of rutile grains MO-9—MO-14 superimposed on EBSD mapping: red—rutile, single blue pixels*—anatase, single green pixels*—brookite; *—single pixels of apparent anatase and brookite phase are most likely just a misidentification of the Bruker esprit software, Bruker Nano GmbH, Berlin, Germany used in EBSD study.
All TiO2 grains with a very low V content (<50 ppm), which, according to the criteria of [75], might be classified as anatase, were also tested. The results of the EBSD analysis
Figure 4. Results of electron backscattered diffraction analysis (EBSD) study of selected rutile grains.(a,b) Experimental EBSD Kikuchi patterns of rutile grains GLA-23 (a) and GLA-24 (b); (c,d) simulatedKikuchi pattern of the same rutile grains GLA-23 (c) and GLA-24 (d); (e) BSE (backscattered electron)image of rutile grains GLA 23 (top) and GLA-24 (bottom); (f) FSE (forescattered secondary electron)image of rutile grains GLA-23 and GLA-24 superimposed on EBSD mapping: red—rutile, single bluepixels*—anatase, single green pixels*—brookite; (g) BSE image of six more rutile grains MO-9—MO-14, (h) FSE (forescattered secondary electron) image of rutile grains MO-9—MO-14 superimposed onEBSD mapping: red—rutile, single blue pixels*—anatase, single green pixels*—brookite; *—singlepixels of apparent anatase and brookite phase are most likely just a misidentification of the Brukeresprit software, Bruker Nano GmbH, Berlin, Germany used in EBSD study.
All TiO2 grains with a very low V content (<50 ppm), which, according to the criteriaof [75], might be classified as anatase, were also tested. The results of the EBSD analysis
Minerals 2021, 11, 553 12 of 27
showed that all the separated TiO2 minerals with a low V content were rutile (see Figure 4,Table 3).
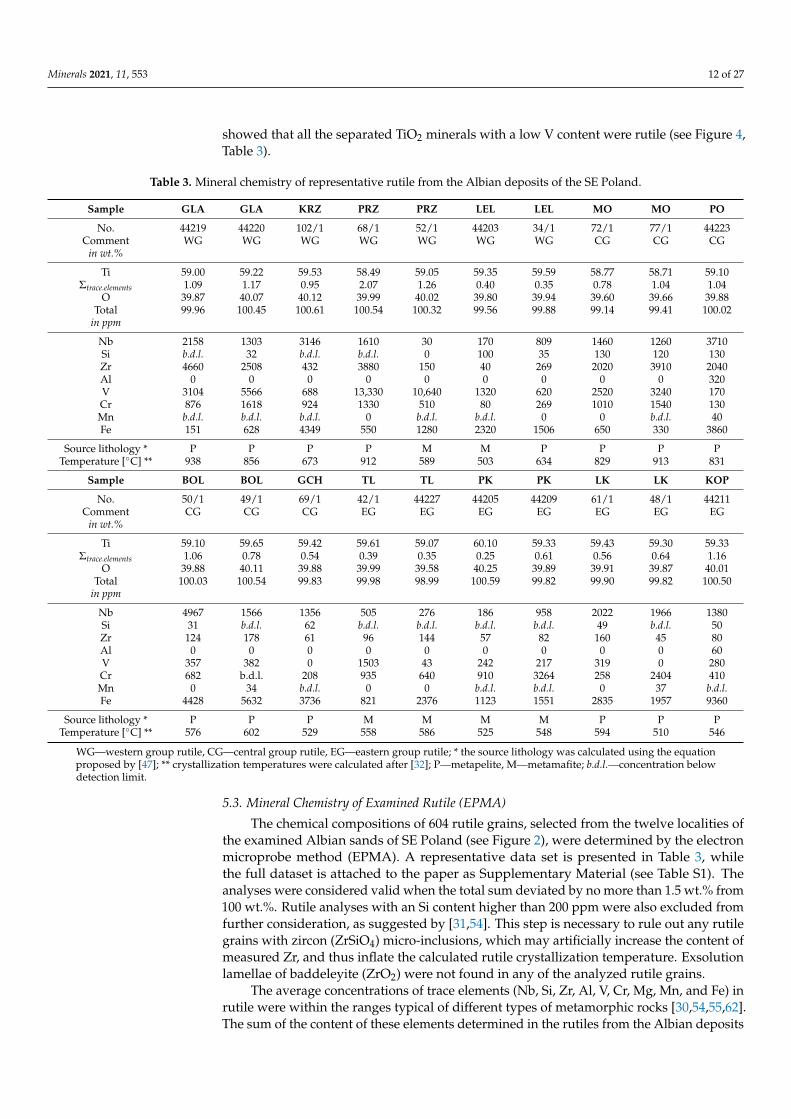
Table 3. Mineral chemistry of representative rutile from the Albian deposits of the SE Poland.
Sample GLA GLA KRZ PRZ PRZ LEL LEL MO MO PO
No. 44219 44220 102/1 68/1 52/1 44203 34/1 72/1 77/1 44223Comment WG WG WG WG WG WG WG CG CG CG
in wt.%
Ti 59.00 59.22 59.53 58.49 59.05 59.35 59.59 58.77 58.71 59.10Σtrace.elements 1.09 1.17 0.95 2.07 1.26 0.40 0.35 0.78 1.04 1.04
O 39.87 40.07 40.12 39.99 40.02 39.80 39.94 39.60 39.66 39.88Total 99.96 100.45 100.61 100.54 100.32 99.56 99.88 99.14 99.41 100.02
in ppm
Nb 2158 1303 3146 1610 30 170 809 1460 1260 3710Si b.d.l. 32 b.d.l. b.d.l. 0 100 35 130 120 130Zr 4660 2508 432 3880 150 40 269 2020 3910 2040Al 0 0 0 0 0 0 0 0 0 320V 3104 5566 688 13,330 10,640 1320 620 2520 3240 170Cr 876 1618 924 1330 510 80 269 1010 1540 130Mn b.d.l. b.d.l. b.d.l. 0 b.d.l. b.d.l. 0 0 b.d.l. 40Fe 151 628 4349 550 1280 2320 1506 650 330 3860
Source lithology * P P P P M M P P P PTemperature [◦C] ** 938 856 673 912 589 503 634 829 913 831
Sample BOL BOL GCH TL TL PK PK LK LK KOP
No. 50/1 49/1 69/1 42/1 44227 44205 44209 61/1 48/1 44211Comment CG CG CG EG EG EG EG EG EG EG
in wt.%
Ti 59.10 59.65 59.42 59.61 59.07 60.10 59.33 59.43 59.30 59.33Σtrace.elements 1.06 0.78 0.54 0.39 0.35 0.25 0.61 0.56 0.64 1.16
O 39.88 40.11 39.88 39.99 39.58 40.25 39.89 39.91 39.87 40.01Total 100.03 100.54 99.83 99.98 98.99 100.59 99.82 99.90 99.82 100.50
in ppm
Nb 4967 1566 1356 505 276 186 958 2022 1966 1380Si 31 b.d.l. 62 b.d.l. b.d.l. b.d.l. b.d.l. 49 b.d.l. 50Zr 124 178 61 96 144 57 82 160 45 80Al 0 0 0 0 0 0 0 0 0 60V 357 382 0 1503 43 242 217 319 0 280Cr 682 b.d.l. 208 935 640 910 3264 258 2404 410Mn 0 34 b.d.l. 0 0 b.d.l. b.d.l. 0 37 b.d.l.Fe 4428 5632 3736 821 2376 1123 1551 2835 1957 9360
Source lithology * P P P M M M M P P PTemperature [◦C] ** 576 602 529 558 586 525 548 594 510 546
WG—western group rutile, CG—central group rutile, EG—eastern group rutile; * the source lithology was calculated using the equationproposed by [47]; ** crystallization temperatures were calculated after [32]; P—metapelite, M—metamafite; b.d.l.—concentration belowdetection limit.
5.3. Mineral Chemistry of Examined Rutile (EPMA)
The chemical compositions of 604 rutile grains, selected from the twelve localities ofthe examined Albian sands of SE Poland (see Figure 2), were determined by the electronmicroprobe method (EPMA). A representative data set is presented in Table 3, whilethe full dataset is attached to the paper as Supplementary Material (see Table S1). Theanalyses were considered valid when the total sum deviated by no more than 1.5 wt.% from100 wt.%. Rutile analyses with an Si content higher than 200 ppm were also excluded fromfurther consideration, as suggested by [31,54]. This step is necessary to rule out any rutilegrains with zircon (ZrSiO4) micro-inclusions, which may artificially increase the content ofmeasured Zr, and thus inflate the calculated rutile crystallization temperature. Exsolutionlamellae of baddeleyite (ZrO2) were not found in any of the analyzed rutile grains.
The average concentrations of trace elements (Nb, Si, Zr, Al, V, Cr, Mg, Mn, and Fe) inrutile were within the ranges typical of different types of metamorphic rocks [30,54,55,62].The sum of the content of these elements determined in the rutiles from the Albian deposits

Minerals 2021, 11, 553 13 of 27
of SE Poland varied from 0.16 wt.% to 9.77 wt.% (see Table S1). More than 60% of therutile analyses show the sum of the trace element content below 1 wt.%, while only 1.5%of the analyses have a total content of trace elements exceeding 3 wt.%. The measured Zrconcentrations of analyzed rutile grains extend from 0 to 7490 ppm (see Table S1) with nodistinctive internal chemical zonation. The range of Zr contents in nearly all samples variesfrom 4000 to over 7000 ppm. Only in the sample from the Łuków IG-1 borehole, the rangeis limited to 1020 ppm. However, the median Zr content within an analyzed sample rarelyexceeds 1000 ppm. Rutile grains with very low Zr or with Zr below detection limits werealso identified in all the studied samples (Table S1).
The concentrations of Fe (on average 1500–2000 ppm) and Cr (average 620–680 ppm)in rutile are uniform and do not vary significantly, both within and between samples. Themean Nb concentrations in most samples are above 1500 ppm. Only in Tomaszów LubelskiIG-1, Piaski IG-2, and Łuków IG-1, the mean Nb concentrations range from 740 to 830 ppm.Vanadium contents in rutile grains also show visible differences with regard to samplinglocation (see Table S1). In localities from the Miechów Segment, i.e., the geographicallywestern zone (Przychody, Glanów-Stroniczki, Lelów, Korzkiew, see Figure 2) and centralzone (Bolmin, Mokrzesz, Chełmo Mount, see Figure 2), the mean V concentrations aremostly above 1000 ppm. The highest concentrations of V, reaching over 13,330 ppm, arereported from Przychody (on average, in this sample, 8010 ppm) and Glanów-Stroniczki(average 5105 ppm). Rutile grains east of the HCM, i.e., from the Szydłowiec and thePuławy Segments, which is the central zone (Potok IG-1) and the eastern zone (TomaszówLubelski IG-1, Łuków IG-1, Piaski IG-2, Kopiec, see Figure 2), contain much less V in theirstructure. Their mean V concentrations do not exceed 1000 ppm, e.g., in Kopiec, TomaszówLubelski-IG1, and Piaski IG-2, they range from 650 to 750 ppm. The lowest concentrationsof V are in rutiles from Łuków IG-1, with a median value of less than 400 ppm (Table 3).
5.4. Estimation of Rutile Crystallization Temperature Using ZIR Geothermometer
Despite a significant range of zircon concentrations in each sample, distinctive peaksof estimated crystallization temperatures are indicated based on the rutile geothermometercalibrated by [32]. Estimates of the rutile grains are presented in Table 3 and SupplementaryTable S1. Taking into account the temperature distributions in each of the tested samples(see Figure 5), three groups of samples (western, central, and eastern) were distinguishedin Figure 6, which additionally allows us to divide the area of SE Poland into three regions(western zone, eastern zone, and central zone, see Figure 2), characterized by a similarspectrum of rutile crystallization temperatures.
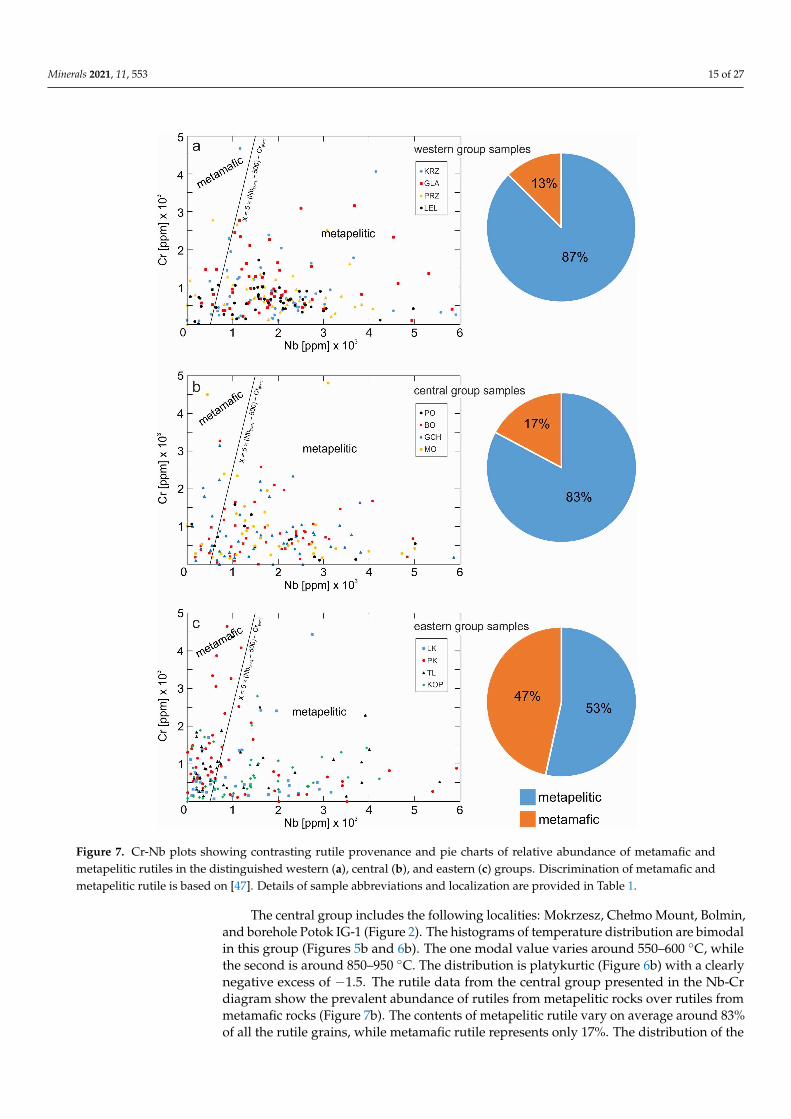
The western group of samples includes four outcrops: Korzkiew, Glanów-Stroniczki,Przychody, and Lelów (Figure 2). The histograms of temperature distribution are poly-modal (Figures 5a and 6a). The majority of results oscillate around 700–800 ◦C; however,there are also visible peaks in the range of 550–600 ◦C as well as close to 900 ◦C. Thedistribution is platykurtic (Figure 6a) with a negative excess −0.6. Rutile compositionsfrom the western group presented in the Nb-Cr diagram [47] show a significant dominantabundance of rutiles from matapelitic rocks over rutiles from metamafic rocks (Figure 7a).The content of metapelitic rutile grains varies between 80 and 90% of the population ineach of the analyzed locations in the western zone, averaging 87% of metapelitic rutile,while the metamafic rutiles represent only 13%.
The eastern group also includes four sample localities, three boreholes: Łuków IG-1,Piaski IG-2, and Tomaszów Lubelski IG-1, as well as the Kopiec (Annopol) outcrop. Alllisted localities are positioned east of the Holy Cross Mountains (Figure 2). The temperaturehistograms are monomodal in this group of samples (Figures 5c and 6c). The distributionis leptokurtic (Figure 6c), with a positive excess of 6.7. The distribution of the results is alsomuch more concentrated than that of the normal distribution. The rutile compositionaldata from the eastern part of the study area presented on the Nb-Cr discrimination diagramshow a nearly even distribution of rutiles from metamafic and metapelitic rocks (Figure 7c).The content of metapelitic and metamafic rutile is similar, at 53% and 47% respectively. The

Minerals 2021, 11, 553 14 of 27
highest ratio of metamafic rutiles, reaching 57%, can be found only in the sample from thePiaski IG-2 borehole near Lublin.
Minerals 2021, 11, 553 14 of 28
Figure 5. Histograms of rutile crystallization temperatures for all samples in the three groups: western (a), central (b), and eastern (c). Details of sample abbreviation and localization in Table 1. Temperatures were calculated using the [32] formula. Blue colour—metapelitic rutile; orange col-our—metamafic rutile.
Figure 6. Summary histograms of rutile crystallization temperatures for the western (a), central (b), and eastern (c) groups with an indication of metamorphic facies. Temperatures were calculated using the Watson et al. [32] geothermometer.
The western group of samples includes four outcrops: Korzkiew, Glanów-Stroniczki, Przychody, and Lelów (Figure 2). The histograms of temperature distribution are poly-modal (Figures 5a and 6a). The majority of results oscillate around 700–800 °C; however, there are also visible peaks in the range of 550–600 °C as well as close to 900 °C. The dis-tribution is platykurtic (Figure 6a) with a negative excess –0.6. Rutile compositions from the western group presented in the Nb-Cr diagram [47] show a significant dominant abundance of rutiles from matapelitic rocks over rutiles from metamafic rocks (Figure 7a).
Figure 5. Histograms of rutile crystallization temperatures for all samples in the three groups:western (a), central (b), and eastern (c). Details of sample abbreviation and localization in Table 1.Temperatures were calculated using the [32] formula. Blue colour—metapelitic rutile; orange colour—metamafic rutile.
Minerals 2021, 11, 553 14 of 28
Figure 5. Histograms of rutile crystallization temperatures for all samples in the three groups: western (a), central (b), and eastern (c). Details of sample abbreviation and localization in Table 1. Temperatures were calculated using the [32] formula. Blue colour—metapelitic rutile; orange col-our—metamafic rutile.
Figure 6. Summary histograms of rutile crystallization temperatures for the western (a), central (b), and eastern (c) groups with an indication of metamorphic facies. Temperatures were calculated using the Watson et al. [32] geothermometer.
The western group of samples includes four outcrops: Korzkiew, Glanów-Stroniczki, Przychody, and Lelów (Figure 2). The histograms of temperature distribution are poly-modal (Figures 5a and 6a). The majority of results oscillate around 700–800 °C; however, there are also visible peaks in the range of 550–600 °C as well as close to 900 °C. The dis-tribution is platykurtic (Figure 6a) with a negative excess –0.6. Rutile compositions from the western group presented in the Nb-Cr diagram [47] show a significant dominant abundance of rutiles from matapelitic rocks over rutiles from metamafic rocks (Figure 7a).
Figure 6. Summary histograms of rutile crystallization temperatures for the western (a), central (b), and eastern (c) groupswith an indication of metamorphic facies. Temperatures were calculated using the Watson et al. [32] geothermometer.
Minerals 2021, 11, 553 15 of 27
Minerals 2021, 11, 553 15 of 28
The content of metapelitic rutile grains varies between 80 and 90% of the population in each of the analyzed locations in the western zone, averaging 87% of metapelitic rutile, while the metamafic rutiles represent only 13%.
Figure 7. Cr-Nb plots showing contrasting rutile provenance and pie charts of relative abundance of metamafic and met-apelitic rutiles in the distinguished western (a), central (b), and eastern (c) groups. Discrimination of metamafic and met-apelitic rutile is based on [47]. Details of sample abbreviations and localization are provided in Table 1.
The eastern group also includes four sample localities, three boreholes: Łuków IG-1, Piaski IG-2, and Tomaszów Lubelski IG-1, as well as the Kopiec (Annopol) outcrop. All listed localities are positioned east of the Holy Cross Mountains (Figure 2). The tempera-ture histograms are monomodal in this group of samples (Figures 5c and 6c). The distri-
Figure 7. Cr-Nb plots showing contrasting rutile provenance and pie charts of relative abundance of metamafic andmetapelitic rutiles in the distinguished western (a), central (b), and eastern (c) groups. Discrimination of metamafic andmetapelitic rutile is based on [47]. Details of sample abbreviations and localization are provided in Table 1.
The central group includes the following localities: Mokrzesz, Chełmo Mount, Bolmin,and borehole Potok IG-1 (Figure 2). The histograms of temperature distribution are bimodalin this group (Figures 5b and 6b). The one modal value varies around 550–600 ◦C, whilethe second is around 850–950 ◦C. The distribution is platykurtic (Figure 6b) with a clearlynegative excess of −1.5. The rutile data from the central group presented in the Nb-Crdiagram show the prevalent abundance of rutiles from metapelitic rocks over rutiles frommetamafic rocks (Figure 7b). The contents of metapelitic rutile vary on average around 83%of all the rutile grains, while metamafic rutile represents only 17%. The distribution of the
Minerals 2021, 11, 553 16 of 27
calculated crystallization temperatures, in both metamafic and metapelitic rutiles, does notdiffer significantly in all three groups (Figures 5 and 6).
6. Discussion6.1. Geochemistry and Temperatures
The simple chemical composition of rutile (TiO2) restricts the possibility of significantTi substitution by other elements in the mineral structure [54]. This feature excludes rutileas a good tool for determining the provenance of clastic sediments solely on the basis ofthe variability in major element composition. It was suggested by [30] that rutile grainswith more than 1000 ppm of Fe tend to be metamorphic in origin. This parameter is notas widely used as, e.g., in the Nb/Cr discrimination of lithology, but nevertheless, it canbe useful in determining source rock lithology. In all the samples, the majority of rutilegrains have more than 1000 ppm of Fe (Table S1, Supplementary Materials). In the westernand central zones, they constitute c. 66.5%, while in the eastern zone, those metamorphicrutiles make up 80.1% of all analyzed rutile grains. Therefore, it seems that metamorphicrocks were the main sources for detrital rutile grains in Albian sands of southern Poland.
Rutile, in the petrographic study of high-grade metamorphic rocks, plays an importantrole as a constant component in the paragenesis of metamorphic rocks [51,54,55,57,62,78].Petrological studies of igneous and metamorphic rocks have documented an increasedconcentration of trace elements such as Zr, W, Cr, V, Hf, Nb, Ta, and others [54,65,74,79].These data are used to identify the protoliths of metamorphic rocks and in geothermometryand geobarometry [33,78,80]. The data obtained from PT studies of rutile crystallizationconditions in metamorphic and igneous rocks have also been successfully applied todetrital rutile [28,29,33,34,81].
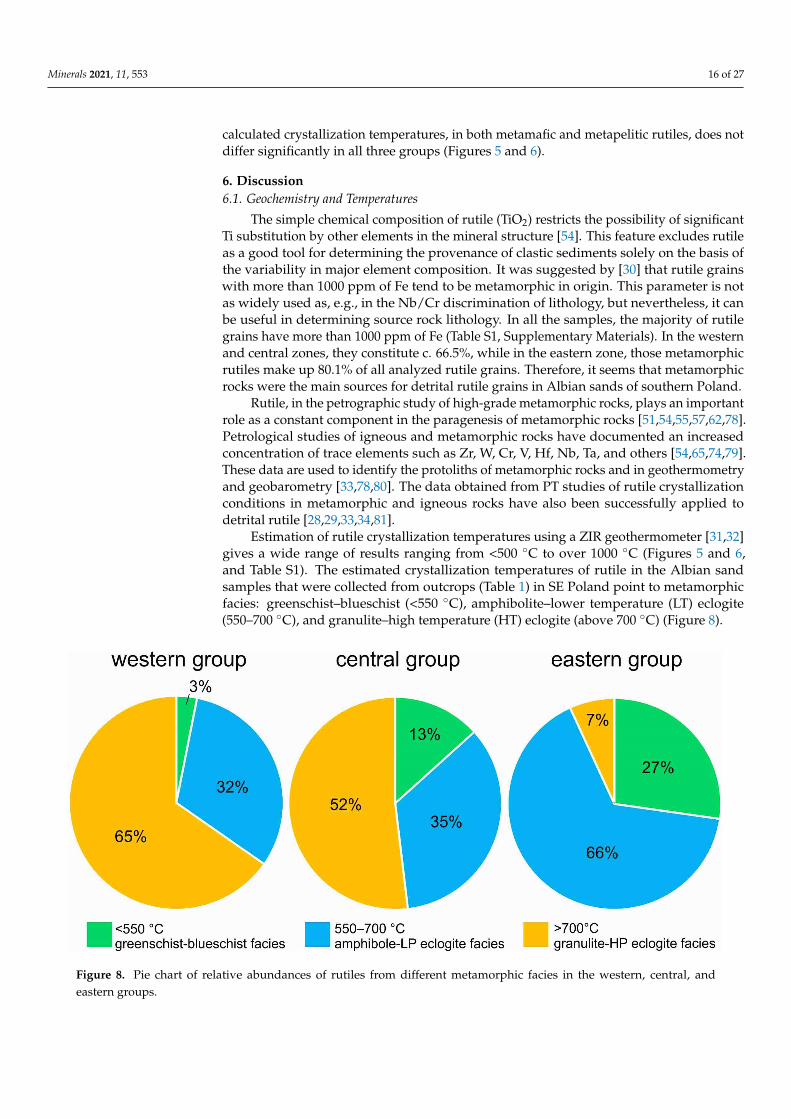
Estimation of rutile crystallization temperatures using a ZIR geothermometer [31,32]gives a wide range of results ranging from <500 ◦C to over 1000 ◦C (Figures 5 and 6,and Table S1). The estimated crystallization temperatures of rutile in the Albian sandsamples that were collected from outcrops (Table 1) in SE Poland point to metamorphicfacies: greenschist–blueschist (<550 ◦C), amphibolite–lower temperature (LT) eclogite(550–700 ◦C), and granulite–high temperature (HT) eclogite (above 700 ◦C) (Figure 8).
Minerals 2021, 11, 553 17 of 28
Figure 8. Pie chart of relative abundances of rutiles from different metamorphic facies in the western, central, and eastern groups.
Platykurtic distribution of calculated rutile temperatures from the western and cen-tral groups indicates rather variable sources of the detrital material. Rutile with tempera-tures peaking at 700–800 °C and above 900 °C was derived mainly from granulite–HT eclogite facies rocks (65% in the western group and 52% in the central group), while a much smaller amount of rutile grains with temperatures peaks at 550–600 °C were prob-ably derived from amphibolite–eclogite facies rocks (32% in the western group and 35% in central group). Single grains (3% in the western group) and non-common grains (13% in the central group) were derived from greenschist–blueschist facies rocks (Figure 8). By contrast, monomodal distribution of temperatures in the eastern group points to one source rock and a common area of provenance of the rutile grains. Most results vary around 550–600 °C and are derived from amphibolite–LT eclogite facies rocks (66%).
Considering the distribution of rutile crystallization temperatures within the three groups, the eastern one is clearly characterized by rutile with crystallization temperatures peaking at 500–600 °C (Figure 6), while such rutile occurs in only small amounts in the western group. In turn, rutile with a crystallization temperature of 700–800 °C dominates in the western group, but appears sporadically in the eastern group. Such characteristics clearly indicate at least two different source areas providing material for the detrital rutile. This is confirmed by the proportion of rutile originating from metapelitic and metamafic rocks. In the western group, metapelitic rutile grains clearly dominate over metamafic rutile, while in the eastern group, the amounts of metapelitic and metamafic rutile are nearly equal (Figure 7). Additionally, the V contents in rutile also point to different sources for the western and eastern zones. On average, rutiles grains from the western zone con-tain c. 1910 ppm of V, which contrast with contents around 625 ppm in the eastern zone (Table S1). The detrital rutile of the western and eastern groups appears to come from various host rocks and probably from different source areas.
Interesting data come from the central rutile group (Figure 6). In this group, the amount of rutile with temperatures of crystallization in the range of 500–600 °C is clearly visible, which are those that dominate the eastern group and are of minor importance in the western group. So, here we have a clear influence of detrital rutile from the same source as rutile in the eastern group. On the other hand, rutile with the crystallization temperature range of 700–800 °C in the central group is present, but is not so dominant as in the western group. Moreover, in the central group, there is a distinct group of rutile grains with crystallization temperatures ranging from 800 °C to 950 °C, which are also
Figure 8. Pie chart of relative abundances of rutiles from different metamorphic facies in the western, central, andeastern groups.
Minerals 2021, 11, 553 17 of 27
Platykurtic distribution of calculated rutile temperatures from the western and centralgroups indicates rather variable sources of the detrital material. Rutile with temperaturespeaking at 700–800 ◦C and above 900 ◦C was derived mainly from granulite–HT eclogitefacies rocks (65% in the western group and 52% in the central group), while a much smalleramount of rutile grains with temperatures peaks at 550–600 ◦C were probably derived fromamphibolite–eclogite facies rocks (32% in the western group and 35% in central group).Single grains (3% in the western group) and non-common grains (13% in the central group)were derived from greenschist–blueschist facies rocks (Figure 8). By contrast, monomodaldistribution of temperatures in the eastern group points to one source rock and a commonarea of provenance of the rutile grains. Most results vary around 550–600 ◦C and arederived from amphibolite–LT eclogite facies rocks (66%).
Considering the distribution of rutile crystallization temperatures within the threegroups, the eastern one is clearly characterized by rutile with crystallization temperaturespeaking at 500–600 ◦C (Figure 6), while such rutile occurs in only small amounts in thewestern group. In turn, rutile with a crystallization temperature of 700–800 ◦C dominatesin the western group, but appears sporadically in the eastern group. Such characteristicsclearly indicate at least two different source areas providing material for the detrital rutile.This is confirmed by the proportion of rutile originating from metapelitic and metamaficrocks. In the western group, metapelitic rutile grains clearly dominate over metamaficrutile, while in the eastern group, the amounts of metapelitic and metamafic rutile arenearly equal (Figure 7). Additionally, the V contents in rutile also point to different sourcesfor the western and eastern zones. On average, rutiles grains from the western zonecontain c. 1910 ppm of V, which contrast with contents around 625 ppm in the easternzone (Table S1). The detrital rutile of the western and eastern groups appears to come fromvarious host rocks and probably from different source areas.
Interesting data come from the central rutile group (Figure 6). In this group, theamount of rutile with temperatures of crystallization in the range of 500–600 ◦C is clearlyvisible, which are those that dominate the eastern group and are of minor importancein the western group. So, here we have a clear influence of detrital rutile from the samesource as rutile in the eastern group. On the other hand, rutile with the crystallizationtemperature range of 700–800 ◦C in the central group is present, but is not so dominant as inthe western group. Moreover, in the central group, there is a distinct group of rutile grainswith crystallization temperatures ranging from 800 ◦C to 950 ◦C, which are also present insmaller amounts in the western group, and very sporadically in the eastern group (only fivegrains). Thus, such data may indicate that part of the detrital material was supplied to thecentral zone from the same source as the western zone. The last interpretation is confirmedby a very similar proportion of metapelitic rutile to metamafic rutile in the central andwestern groups (Figure 7). It seems, therefore, that the group distinguished as central wasinfluenced by various lithological sources and probably provenance. The detrital materialdeposited in the central zone was derived from the same source as in the western group,but also has some signs of the same source as that of the eastern group, i.e., the central zoneconstitutes a distinct mixed group. Additionally, this group has a clear large admixturefrom high-temperature granulite and HT eclogite facies rocks (above 850 ◦C) similar to thewestern group.
A multidimensional scaling (MDS) statistical analysis was used to compare the sim-ilarities between the samples. The MDS is a technique that compares large datasets of avariable, e.g., temperature, element concentration, detrital age, and so on [82]. The result ofthis method is a configuration of points in the two-dimensional Euclidean plane, creatingsome sort of a map in which samples with similar analyzed variable values tend to clusterclose to each other, while samples with greater dissimilarities plot further apart [83–86]. Itis worth noting that the MDS diagrams of calculated rutile crystallization temperaturesand Nb concentrations visualizing the level of similarity between samples confirm quitewell the division into three groups adopted by us based on the ZIR method (Figure 9). Thefour localities of the eastern zone (samples TL, PK, LK, and KOP) on the MDS diagrams are

Minerals 2021, 11, 553 18 of 27
very close to each other, which indicates a high statistical similarity between those samples.The three samples from the central zone (MO, BOL, and GCH) are also located together onthe temperature MDS diagram (Figure 9a), which confirms their statistical similarity. Onesample, PO, is located between the TL, PK, LK, KOP and MO, BOL, GCH sample groups.Geographically, the PO sample is close to the eastern zone; however, temperature dataallow us to include that sample in the central zone (Figure 5). The four samples from thewestern zone (GLA, PRZ, LEL, and KRZ) are close to each other on the temperature MDSdiagram, reinforcing their inclusion in the same, western group. Similar conclusions can bederived from the MDS diagram of Nb concentrations (Figure 9b). As in the temperatureMDS diagram, the eastern group is clearly distinct from the rest of the samples. However,the samples of the central group are not as clearly separated from the western group asshown in the temperature MDS diagram. Nonetheless, a faint division between these twogroups can still be distinguished.
Minerals 2021, 11, 553 18 of 28
present in smaller amounts in the western group, and very sporadically in the eastern group (only five grains). Thus, such data may indicate that part of the detrital material was supplied to the central zone from the same source as the western zone. The last inter-pretation is confirmed by a very similar proportion of metapelitic rutile to metamafic ru-tile in the central and western groups (Figure 7). It seems, therefore, that the group distin-guished as central was influenced by various lithological sources and probably prove-nance. The detrital material deposited in the central zone was derived from the same source as in the western group, but also has some signs of the same source as that of the eastern group, i.e., the central zone constitutes a distinct mixed group. Additionally, this group has a clear large admixture from high-temperature granulite and HT eclogite facies rocks (above 850 °C) similar to the western group.
A multidimensional scaling (MDS) statistical analysis was used to compare the sim-ilarities between the samples. The MDS is a technique that compares large datasets of a variable, e.g., temperature, element concentration, detrital age, and so on [82]. The result of this method is a configuration of points in the two-dimensional Euclidean plane, creat-ing some sort of a map in which samples with similar analyzed variable values tend to cluster close to each other, while samples with greater dissimilarities plot further apart [83–86]. It is worth noting that the MDS diagrams of calculated rutile crystallization tem-peratures and Nb concentrations visualizing the level of similarity between samples con-firm quite well the division into three groups adopted by us based on the ZIR method (Figure 9). The four localities of the eastern zone (samples TL, PK, LK, and KOP) on the MDS diagrams are very close to each other, which indicates a high statistical similarity between those samples. The three samples from the central zone (MO, BOL, and GCH) are also located together on the temperature MDS diagram (Figure 9a), which confirms their statistical similarity. One sample, PO, is located between the TL, PK, LK, KOP and MO, BOL, GCH sample groups. Geographically, the PO sample is close to the eastern zone; however, temperature data allow us to include that sample in the central zone (Fig-ure 5). The four samples from the western zone (GLA, PRZ, LEL, and KRZ) are close to each other on the temperature MDS diagram, reinforcing their inclusion in the same, west-ern group. Similar conclusions can be derived from the MDS diagram of Nb concentra-tions (Figure 9b). As in the temperature MDS diagram, the eastern group is clearly distinct from the rest of the samples. However, the samples of the central group are not as clearly separated from the western group as shown in the temperature MDS diagram. Nonethe-less, a faint division between these two groups can still be distinguished.
Figure 9. Nonmetric multidimensional scaling (MDS) maps of (a) calculated crystallization temperature of detrital rutile grains using the Watson et al. formula [32] detailed explanation in the text; (b) Nb (ppm) concentrations in rutile. Figure 9. Nonmetric multidimensional scaling (MDS) maps of (a) calculated crystallization temperature of detrital rutilegrains using the Watson et al. formula [32] detailed explanation in the text; (b) Nb (ppm) concentrations in rutile.
6.2. Source Areas and the Paleogeography
The next question is about the source area(s) for sands of the extra-Carpathian ofsouthern Poland during the Late Albian. The answer to this question requires a combinationof our results with the paleogeography studies of central Europe (Figure 1). Duringthe Neo-Cimmerian phase, in the early Cretaceous, a significant regional uplift of someareas of southern and western Europe with numerous block tectonic movements tookplace [87]. In the Middle and Late Albian (110.8–100.5 Ma) during the Cretaceous eustatictransgression [87,88], the sea encroached onto a denuded area of central and southernPoland [35,41]. This part of Poland covered by the epicontinental sea (Figure 1) was theeasternmost part of the Central European Basin System [87]. The transgression encroachedonto the Polish Lowlands roughly from the NW direction using an earlier tectonic settingof the Polish Trough, and propagated in a south-southeasterly direction.
The area of central and southern Poland was covered with various types of UpperJurassic carbonate deposits and siliciclastic rocks of the Lower Cretaceous [8,35,42]. Thetransition between the Albian and Jurassic carbonate sediments is erosional, and basalconglomerates can often be observed [35,89]. In some locations, the top of the Jurassic car-bonates shows a distinct silicification and karst surfaces that point to the regional terrestrialcharacter of the pre-Albian relief [89,90], which is supported by recognition of backshoresettings during the Late Albian in the western part of the Miechów Segment [91]. Upper
Minerals 2021, 11, 553 19 of 27
Jurassic dark flints found in the Albian sands in the Miechów segment additionally indicateerosion of the Jurassic carbonate sediments during the transgression [89]. During the Al-bian, in the area of the contemporary Miechów Segment in the western part of the studyarea, a large peninsula extending NW-SE was located, reaching its end near Radomskoand continuing south beyond the Carpathian thrusts [92,93]. This peninsula is devoid ofAlbian sediments and the Cretaceous sea transgression covered that area in the Cenoma-nian and/or Turonian. The Upper Jurassic limestone is covered in some places directly byCenomanian calcareous sandstone (e.g., Zajecza Góra near Skotniki) of the northeasternpart of the Miechów Segment [94]. In the southern part of the Miechów Segment, e.g., in theWielkanoc Quarry, the Turonian limestone directly overlies the biohermal Upper Jurassiclimestone [42,95]. The area of the Sudetes was also not flooded by the sea in the Albian,but remained an elevated land area until the Cenomanian, when the transgression began toinvade this area as well [94,96]. Further to the east of the present-day HCM, the Albian rocksare covered with carbonate sediments of the Upper Cretaceous [97]. The Albian depositshave been drilled in the western and northern parts of the Lublin region. Albian depositsare represented here by fine and medium-grained quartz sands and/or weakly lithifiedsandstone, changing up in the section into sands/sandstone with admixture of calciumcarbonate and marls with numerous phosphate rocks [98]. The Albian deposits do not occurclose to the eastern border of Poland and on the SW of Lublin towards Krasnik [93,97]. Here,the Cenomanian or Turonian carbonate sediments of Upper Cretaceous directly overlie theolder Pre-Cretaceous sediments [97]. The geological data mentioned above suggest thepresence of a developed coastline with distinct sea bays and with the dynamic shifting thecoastline during the transgression in the study area. The sea in Albian times encroached overan area covered by sedimentary rocks, mostly carbonate and to a lesser extent siliciclasticrocks. Part of the clastic material found in the Albian sediments could thus have comefrom the recycling of older sedimentary rocks, most likely Lower Cretaceous sediments.Those sedimentary rocks cannot have been the primary source of rutile. The sources of thismineral can be found mainly in metamorphic or igneous rocks. Land massifs of crystallinerocks did not occur in central and northern Poland in the early Cretaceous. The probablesource areas of clastic material during the Albian are the closest lands of crystalline massifssuch as the Bohemian Massif to the west/south-west, the Ukrainian Shield in the east, andthe Baltic Shield to the north of the study area (Figure 1).
The latest geochemical studies on tourmaline and monazite from Albian sands of theMiechów Segment point to the Bohemian Massif as the most probable source area [25,99].The Bohemian Massif comprises a large variety of igneous and metamorphic rocks [100,101].Therefore, it is possible to indicate potential source rocks for detrital rutile crystallized underamphibolite–LT eclogite facies (e.g., mica schists, gneisses) conditions [100,102,103], as well asin high-grade granulite–HT eclogite facies rocks, namely granulites and gneisses [101,104,105].During the Albian, the Bohemian Massif was neighboring to the western and central zones(Figure 2). Moreover, the study of heavy mineral provenance of Jurassic and Triassic sedimen-tary rocks in southern Poland also points to the Bohemian Massif as a main source of detritalmaterial [106,107]. It is thus most certain that the detrital heavy minerals found in the westerngroup and three samples from the central group (MO, GCH, and BOL) from the MiechówSegment have come from the Bohemian Massif.
The Bohemian Massif is the most probable source area for the western group of rutiles,but a more enigmatic transport direction of clastic material should not be disregarded.Southward from the study area, obscured by Neogene Carpathian thrusts, crystallineSilesian and Proto-Silesian Ridges were located. The ridges are composed mostly ofgranites, gneisses, schists, and quartzites [21,108]. The ridges are overlain by Carpathianthrusts, and thus information on their petrology and mineralogy comes from pebbles andexotics found in Carpathian sediments. Precise information on the P-T conditions of theserocks is not available; however, some data from garnets suggest high-grade metamorphicconditions, similar to those found in Moldanubicum and the western part of the BohemianMassif [21,109].
Minerals 2021, 11, 553 20 of 27
As discussed earlier, the western and eastern groups had different sources of detritalrutile. The Bohemian Massif probably should not be considered as a primary and mainsource area for the eastern group. That group roughly corresponds to the Lublin areain eastern Poland (the eastern zone) and is situated approximately at the same distancebetween the Bohemian Massif and the Ukrainian Shield. The crystalline rocks in theUkrainian Shield (which were most likely exposed during the Albian) consist mostly ofPaleoproterozoic and Archean rocks such as granites, gneisses, TTG (Tonalite-Trondhjemite-Granodiorite), various mafic, and ultramafic rocks [102,110–112] that mostly underwenthigh-grade metamorphic conditions. Crystalline rocks found in the Podolia domain (south-western part of Ukrainian Shield) are represented mostly by a high-grade granulite facies,granites, and gneisses [113]. High-grade metamorphic rocks (above 700 ◦C) are a highlyunlikely source for the amphibolite–LT eclogite facies (550–700 ◦C) rutile occurring fre-quently in the eastern group in Albian sands. A wide range of various mafic and ultramaficrocks (such as pyroxenites, amphibolites, and anorthosites) in the Ukrainian Shield alsocould not have been the main source because of the scarcity (or absence) of rutile in theirmineral assemblage [114]. The Neoproterozoic basalts and tuffs of the Volynian FloodBasalts province covering a vast area of eastern Poland, western Ukraine, southwesternBelarus, and northern Moldavia [115] are also an unlikely source of rutile. This is owing toa relative rarity and a small grain size (few micrometers, often less than 10 µm in diameter)of rutile found in effusive rocks [116]. The detrital rutile from the Albian sands in this workis much larger (20 µm to 250 µm, Figure 3). Thus, it is difficult to find the probable sourcearea in an easterly direction (the Ukrainian Shield) for Albian rutile from the eastern group.It cannot be excluded that unknown source rocks have been completely eroded from theUkrainian Shield.
The other possible source area for the detrital rutile of the eastern group may bethe Baltic Shield located north of the study area. The Baltic Shield was located almosttwice as far as the Ukrainian Shield and the Bohemian Massif during Albian times. Thecentral and southern parts of the Baltic Shield are dominated by Palaeoproterozoic andArchean orogenic belts, while the Scandinavian Caledonides occur solely in the westernpart [110,117,118]. Calculated P-T paths for various rocks in the Scandinavian Caledonidesshow similar crystallization temperatures to the calculated rutile crystallization temper-atures from the study area [119–121]. Analyses carried out on Albian detrital rutile fromsandstone sediments of the Norwegian sea showed good convergence for the calculatedcrystallization temperatures (peaking at~550–600 ◦C) to our rutile from the eastern group,and in the proportion of metamafic to metapelitic rutile. This proportion in sandy sedi-ments of the Albian MN3 sand types in the Norwegian sea is 60% to 40% [28], whereasin samples from eastern Poland studied here, it is c. fifty–fifty. It is possible that rutilehas been derived from western Norway, from the Western Gneiss region and the MiddleAllochton of the Caledonian Nappe Domain, where high-grade mafic gneisses, eclogiteswith pyroxenites, and peridotites are located [110,118,121–124] These regions sent materialto the Norwegian Sea prior to the final opening of the northeast Atlantic [28,125]. It is alsopossible that this region, with its vast area of metamorphic rocks, was supplying detritalmaterial to the epicontinental sea southward to the Mid-Polish Trough. The hypotheticallongshore currents and grain shore drift distributed the clastic material (including rutile)from NW to SE.
Longshore currents can transport loose sediments along a coast parallel to the shore-line. The combination of longshore drift (beach drift) and longshore currents leads tolongshore transport of detrital material [126]. It is possible that such transport took placealong the NE shore of the elongated shallow Mid-Polish Trough. Despite quite longdistances, about or greater than 1000 km, rutile is a very stable mineral in sedimentaryenvironments and can be transported on long distances [27,127–129]. The transport ofdetrital material by longshore currents is common in recent seas where the combinationof wind, wave action, morphology of the sea bottom, and sea-tidal action allows for thecreation of such currents [130–132]. The Orange River carried diamonds from highlands

Minerals 2021, 11, 553 21 of 27
around Kimberly, South Africa, westward to the beaches of the South Atlantic Ocean. Asthe Atlantic gradually opened, the river deposited much of its diamond-bearing sedimenton the Namibian coast and longshore currents carried them northward along the 600km coast along the Namibian shore, and that transport distance is unequivocally docu-mented with the diamond placer deposits [133]. We have not found information in theliterature as to how far single diamond grains were transported near the Namibian shoretowards the north, but from the mouth of the Orange River, sand material was transportedalongshore for >700 km [128]. The longshore current transported the sediment materialin the Mediterranean Sea from the Nile Delta, Egypt, to Haifa, Israel, a distance of over450 km [134]. In the Baltic sea, longshore currents are generated along the Polish sandshore [126] and can transport sandy material along the entire southern Baltic shore [135,136].Therefore, material transport by longshore currents over a distance of 1000 km is possibleand plausible.
The Nb/Cr ratios and temperatures of crystallization of rutile from the central group(samples MO, GCH, BO, and PO) show their similarity to the western group; thus, theBohemian Massif seems to be the main source for both groups. This is confirmed bystudies of tourmaline and monazite from the MO, GCH, and BO samples collected fromthe Miechów Synclinorium [25,99]. On the other hand, the increased amount of rutilewith crystallization temperatures in the range of 500–600 ◦C documented in the centralgroup (Figure 6) shows their similarity to the eastern group of rutile grains. Hence, thiscomponent documents the significant proportion of detrital material transported probablyfrom the Baltic Shield as in the case of the eastern group. During the Albian, the centralzone (see Figure 2) can be interpreted as a mixing zone to which detrital material containingrutile representing the western and eastern groups was delivered.
The absence of high-temperature rutile in the Lublin area (the eastern zone) showsthat detrital material derived from the Bohemian Massif does not exceed the contemporaryHCDML land area (Figure 1). The distance between the western and eastern zones isnot large enough (approximately 250 km) to easily explain the lack of “Bohemian rutiles”in the eastern zone. As mentioned above, rutile can be transported over much longerdistances [27,127,129]. It seems, therefore, that there must have been orographic or bathy-metric barrier(s?) in the study area between the western and eastern zones; however, thedistribution of a sandy Albian facies near the contemporary HCDML does not unequivo-cally confirm the existence of a land area there [6,9,12,41,92,93]. Thus, the large peninsulaextending NW–SE in the middle part of the present-day Miechów Segment postulatedby Hakenberg [35] could have played the role of such an orographic barrier controllingthe transport of detrital material from the crystalline Bohemian Massif to the western andpartly central zones of the study area (Figure 2). Longshore currents along the southernshore of the Albian epicontinental sea could also have played an important role in thedistribution of detrital material including the heavy minerals. The detrital rutile grainswere transported to the area referred to by us as the central zone from the BohemianMassif (from the west) and possibly from the southern part of the Baltic Shield from thenorth. During the Albian, between the Lublin area and the Ukrainian Shield, a bathymetricbarrier [137,138] could have existed; there was no possibility for any longshore action andeastward and/or westward transport of detrital material into the study area.
7. Conclusions
The amount of accessory heavy minerals is less than 1% in predominantly quartzsand samples of the Albian sediments from SE Poland. The chemically and physicallyresistant rutile reach up to 20% of the heavy mineral assemblage in the Albian quartz sandsof southern extra-Carpathian Poland.
Rutile grains, selected for EPMA study, are represented solely by the rutile polymorphthat allows the usage of the Zr-in-rutile (ZIR) method to determine the rutile crystallizationtemperatures. Three groups of samples with estimated crystallization temperatures weredistinguished in the studied material: western, central, and eastern.
Minerals 2021, 11, 553 22 of 27
The western group, which includes outcrops situated in the southwestern part of theMiechów Segment (western zone), indicates rather variable sources of detrital material, butmainly derived from metapelitic rocks. The detrital rutile grains were mainly derived fromgranulite–HT eclogite facies rocks (above 700 ◦C) with much smaller amounts of rutilegrains derived from amphibolite–LT eclogite facies rocks (550–700 ◦C). The most likelysource area for that group of rutile seems to be the Bohemian Massif. The Bohemian Massifhas a vast spectrum of metamorphic rocks with various grade of metamorphism, thus itis a good source for the diverse crystallization temperatures of the detrital rutile in thewestern group.
The eastern group includes sampled localities situated northeast from the Holy CrossMountains in Lublin area (eastern zone). Detrital rutiles were mainly derived fromamphibolite–LT eclogite facies of metapelitic and metamafic rocks in similar quantities. Thedetrital rutiles were derived from a little petrographically diversified source area. The mostlikely provenance for that group of rutile seems to be the southern part of the crystallineBaltic Shield, possibly from the Western Gneiss region and the Middle Allochton of theCaledonian Nappe Domain. The hypothetical longshore current was flowing in a NWto SE direction along the NE nearshore zone of the Mid-Polish Trough and transporteddetrital material, including rutile.
The central group includes sampled localities situated in the northern part of theMiechów Segment and one sampled place (Potok IG-1 borehole) situated northeast fromthe Holy Cross Mountains (central zone). Detrital rutiles from this group were mainlyderived from granulite–HT eclogite facies rocks and amphibolite–LT eclogite facies rocksand chiefly from metapelitic rocks. The source of rutiles was diverse, as in the western zone.Thus, the most likely source area for that group of rutile seems also to be the BohemianMassif and, probably, to a lesser extent, the Baltic Shield.
Supplementary Materials: The following are available online at https://www.mdpi.com/article/10.3390/min11060553/s1, Table S1: Chemical composition of rutile from the Albian sands in Southern Poland.
Author Contributions: Conceptualization, J.K.; methodology, J.K. and K.N.; software, J.K.; validation,J.K., K.N., and D.O.-N.; formal analysis, J.K. and D.O.-N.; investigation, J.K. and K.N.; resources,J.K.; data curation, J.K., K.N., and D.O.-N.; writing—original draft preparation, J.K.; writing—reviewand editing, J.K., D.O.-N., and K.N.; visualization, J.K. and D.O.-N.; supervision, J.K.; projectadministration, J.K.; funding acquisition, J.K. and D.O.-N. All authors have read and agreed to thepublished version of the manuscript.
Funding: This work was supported by University of Warsaw (BOB-661-300/17) and Faculty ofGeology, University of Warsaw grants no: DSM 118210 and grant No. 501-D113-01-1130202).
Data Availability Statement: The data presented in this study are available in SupplementaryMaterial Supplementary Table S1.
Acknowledgments: The authors are greatly indebted to Jan Nowak, owner of the quarry near theChełmo Mount, for permission to conduct this scientific investigation. The warmest thanks are offeredto Raymond Macdonald, for constructive remarks and linguistic correction, and to Petras Jokubauskasand Beata Marciniak-Maliszewska for help with EPMA investigations. This work was supportedby University of Warsaw, Faculty of Geology (Cryo-SEM laboratory: National MultidisciplinaryLaboratory of Functional Nanomaterials NanoFun project no. POIG.02.02.00-00-025/09.
Conflicts of Interest: The authors declare no conflict of interest.
References1. Maystrenko, Y.; Bayer, U.; Brink, H.-J.; Littke, R. The Central European Basin System—An Overview. In Dynamics of Complex
Intracontinental Basins; Littke, R., Bayer, U., Gajewski, D., Nelskamp, S., Eds.; Springer: Berlin/Heidelberg, Germany, 2008;pp. 15–34.
2. Mazur, S.; Scheck-Wenderoth, M. Constraints on the tectonic evolution of the Central European Basin System revealed by seismicreflection profiles from Northern Germany. Geol. en Mijnbouw/Netherlands J. Geosci. 2005, 84, 389–401. [CrossRef]
3. Hansen, D.L.; Nielsen, S.B.; Lykke-Andersen, H. The post-Triassic evolution of the Sorgenfrei-Tornquist Zone—Results fromthermo-mechanical modelling. Tectonophysics 2000, 328, 245–267. [CrossRef]
Minerals 2021, 11, 553 23 of 27
4. Haq, B.U. Cretaceous eustasy revisited. Glob. Planet. Change 2014, 113, 44–58. [CrossRef]5. Ziegler, P. Geological Atlas of Western and Central Europe, 2nd ed.; Shell Internationale Petroleum Maatschappij, B.V.: Hague, The
Netherlands, 1990.6. Jaskowiak-Schoeneichowa, M.; Krassowska, A. Paleomiazszosci, litofacje i paleotektonika epikontynentalnej kredy górnej w
Polsce. Geol. Q. 1988, 32, 177–198.7. Dadlez, R.; Marek, S. Development of the Permian and Mesozoic basins. Pract. Inst. Geol. 1997, 153, 403–409.8. Marek, S. Paleomiazszosci, litofacje i paleotektonika epikontynentalenej kredy dolnej w Polsce. Geol. Q. 1988, 32, 157–176.9. Swidrowska, J.; Hakenberg, M.; Poluhtovic, B.; Seghedi, A.; Višnâkov, I. Evolution of the Mesozoic basins on the south western
edge of the East European Craton (Poland, Ukraine, Moldova, Romania). Stud. Geol. Pol. 2008, 130, 3–130.10. Naidin, D.P.; Sasonova, I.G.; Pojarkova, Z.N.; Djalilov, M.R.; Papulov, G.N.; Senkovsky, Y.; Benjamovsky, V.N.; Kopaevich, L.F.
Cretaceous transgressions and regressions on the Russian Platform, in Crimea and Central Asia. Cretac. Res. 1980, 1, 375–387.[CrossRef]
11. Crittenden, S. The “Albian Transgression” in the Southern North Sea Basin. J. Pet. Geol. 1987, 10, 395–414. [CrossRef]12. Hakenberg, M.; Swidrowska, J. Cretaceous basin evolution in the Lublin area along the Teisseyre-Tornquist Zone (SE Poland).
Ann. Soc. Geol. Pol. 2001, 71, 1–20.13. Samsonowicz, J. Szkic geologiczny okolic Rachowa nad Wisła oraz transgresje albu i cenomanu w brózdzie północno-europcjskiej.
Spraw. Pol. Inst. Geol. 1925, 3, 45–118.14. Pasternak, S.I.; Gawrilishin, V.I.; Ginda, V.A.; Kotsyubinsky, S.P.; Senkovsky, Y. Stratigraphy and fauna of the Cretaceous deposits
of the west of the Ukraine (without the Carpathians). Nauk. Dumka Kiev. 1968, 1–272.15. Henry, D.J.; Guidotti, C.V. Tourmaline as a petrogenetic indicator mineral - an example from the staurolite-grade metapelites of
NW Maine. Am. Mineral. 1985, 70, 1–15.16. Fleming, E.J.; Flowerdew, M.J.; Smyth, H.R.; Scott, R.A.; Morton, A.C.; Omma, J.E.; Frei, D.; Whitehouse, M.J. Provenance of
Triassic sandstones on the southwest Barents Shelf and the implication for sediment dispersal patterns in northwest Pangaea.Mar. Pet. Geol. 2016, 78, 516–535. [CrossRef]
17. Dill, H.G.; Škoda, R. Provenance analysis of heavy minerals in beach sands (Falkland Islands/Islas Malvinas)—A view to mineraldeposits and the geodynamics of the South Atlantic Ocean. J. S. Am. Earth Sci. 2017, 78, 17–37. [CrossRef]
18. Garzanti, E.; Andò, S. Heavy minerals for junior woodchucks. Minerals 2019, 9, 148. [CrossRef]19. Mange, M.A.; Wright, D.T. Heavy Minerals in Use; Mange, M.A., Wright, D.T., Eds.; Elsevier B.V.: Amsterdam, The Netherlands,
2007; ISBN 9780444517531.20. Ziegler, P. Evolution of the Arctic-North Atlantic and the Western Tethys: A visual presentation of a series of Paleogeographic-
Paleotectonic maps. AAPG Mem. 1988, 43, 164–196.21. Oszczypko, N.; Salata, D. Provenance analyses of the Late Cretaceous—Palaeocene deposits of the Magura Basin (Polish Western
Carpathians)—evidence from a study of the heavy minerals. Acta Geol. Pol. 2005, 55, 237–267.22. van Hinsberg, V.J.; Henry, D.J.; Marschall, H.R. Tourmaline: An ideal indicator of its host environment. Can. Mineral. 2011, 49,
1–16. [CrossRef]23. Li, R.; Li, S.; Jin, F.; Wan, Y.; Zhang, S. Provenance of Carboniferous sedimentary rocks in the northern margin of Dabie Mountains,
central China and the tectonic significance: Constraints from trace elements, mineral chemistry and SHRIMP dating of zircons.Sediment. Geol. 2004, 166, 245–264. [CrossRef]
24. Morton, A.C.; Hallsworth, C.R. Stability of Detrital Heavy Minerals During Burial Diagenesis. In Heavy Minerals in Use,Developments in SedimentologyDevelopments in Sedimentology; Mange, M.A., Wright, D.T., Eds.; Elsevier B.V.: Amsterdam, TheNetherlands, 2007; Volume 58, pp. 215–245. ISBN 9780444517531.
25. Kotowski, J.; Nejbert, K.; Olszewska-Nejbert, D. Tourmalines as a tool in provenance studies of terrigenous material in Extra-Carpathian Albian (Uppermost Lower Cretaceous) sands of Miechów Synclinorium, Southern Poland. Minerals 2020, 10, 917.[CrossRef]
26. Hubert, J.F. A Zircon-Tourmaline-Rutile Maturity Index and the Interdependence of the Composition of Heavy Mineral Assem-blages with the Gross Composition and Texture of Sandstones. SEPM J. Sediment. Res. 1962, 32, 440–450. [CrossRef]
27. Garzanti, E.; Vermeesch, P.; Vezzoli, G.; Andò, S.; Botti, E.; Limonta, M.; Dinis, P.A.; Hahn, A.; Baudet, D.; De Grave, J.; et al.Congo River sand and the equatorial quartz factory. Earth-Science Rev. 2019, 197, 102918. [CrossRef]
28. Morton, A.C.; Chenery, S. Detrital Rutile Geochemistry and Thermometry as Guides to Provenance of Jurassic-PaleoceneSandstones of the Norwegian Sea. J. Sediment. Res. 2009, 79, 540–553. [CrossRef]
29. Meinhold, G.; Anders, B.; Kostopoulos, D.; Reischmann, T. Rutile chemistry and thermometry as provenance indicator: Anexample from Chios Island, Greece. Sediment. Geol. 2008, 203, 98–111. [CrossRef]
30. Zack, T.; von Eynatten, H.; Kronz, A. Rutile geochemistry and its potential use in quantitative provenance studies. Sediment. Geol.2004, 171, 37–58. [CrossRef]
31. Zack, T.; Moraes, R.; Kronz, A. Temperature dependence of Zr in rutile: Empirical calibration of a rutile thermometer. Contrib. toMineral. Petrol. 2004, 148, 471–488. [CrossRef]
32. Watson, E.B.; Wark, D.A.; Thomas, J.B. Crystallization thermometers for zircon and rutile. Contrib. Mineral. Petrol. 2006, 151,413–433. [CrossRef]
Minerals 2021, 11, 553 24 of 27
33. Triebold, S.; von Eynatten, H.; Luvizotto, G.L.; Zack, T. Deducing source rock lithology from detrital rutile geochemistry: Anexample from the Erzgebirge, Germany. Chem. Geol. 2007, 244, 421–436. [CrossRef]
34. Liu, L.; Xiao, Y.; Wörner, G.; Kronz, A.; Simon, K.; Hou, Z. Detrital rutile geochemistry and thermometry from the Dabie orogen:Implications for source-sediment links in a UHPM terrane. J. Asian Earth Sci. 2014, 89, 123–140. [CrossRef]
35. Hakenberg, M. Alb i cenoman w niecce miechowskiej. Stud. Geol. Pol. 1986, 86, 57–85.36. Niemczycka, T. Dokumentacja Wynikowa Otworu Strukturalno-Paramerytrycznego Potok-IG-1; (unpublished, PIG archive); 1973.37. Zelichowski, A.; Rek, E. Dokumentacja wynikowa otworu: Oporowego Tomaszów Lubelski IG-1; (unpublished, PIG archive); 1966.38. Gurba, L. Dokumentacja wynikowa otworu wiertniczego Piaski IG-2; (unpublished, PIG archive); 1984.39. Lendzion, K.; Wierzbowski, A. Dokumentacja wynikowa wiercenia Łuków IG-1; (unpublished, PIG archive); 1966.40. Dadlez, R.; Marek, S.; Pokorski, J. Geological Map of Poland without Cainozoic Deposits; Panstwowy Instytut Geologiczny: Warszawa,
Poland, 2000; ISBN 83-86986-45-x.41. Marcinowski, R.; Radwanski, A. The Mid-Cretaceous transgression onto the Central Polish Uplands (marginal part of the Central
European Basin). Zitteliana 1983, 10, 65–95.42. Marcinowski, R. The transgressive Cretaceous (Upper Albian through Turonian) deposits of the Polish Jura Chain. Acta Geol. Pol.
1974, 24, 117–220.43. Marcinowski, R.; Wiedmann, J. The Albian ammonites of Poland. Palaentologia Pol. 1990, 50, 1–94.44. Hakenberg, M. Alb i cenoman miedzy Małogoszczem a Staniewicami w południowo-zachodnim obrzezeniu Gór Swietokrzyskich.
Stud. Geol. Pol. 1969, 26, 7–126.45. Rosenblum, S.; Brownfield, I.K. Magnetic Susceptibilities of Minerals; U.S. Department of the Interior, USGS: Reston, VA, USA, 2000.46. Von Eynatten, H.; Tolosana-Delgado, R.; Triebold, S.; Zack, T. Interactions between grain size and composition of sediments:
Two examples. In Proceedings of the Proceed. 2nd CoDaWork, Gaborone, Botswana, 19–21 October 2005; Universitat de Girona.Departament d’Informàtica i Matemàtica Aplicada: Girona, Spain, 2005.
47. Triebold, S.; von Eynatten, H.; Zack, T. A recipe for the use of rutile in sedimentary provenance analysis. Sediment. Geol. 2012, 282,268–275. [CrossRef]
48. Mange, M.A.; Maurer, H.F.W. Heavy Minerals in Colour, 1st ed.; Springer-Science+Business Media: London, UK, 1992; ISBN9789401050197.
49. Pouchou, L.L.; Pichoir, F. “PAP” (phi-rho-z) Procedure for Improved Quantitative Microanalysis. In Microbeam Analysis; Arm-strong, J.T., Ed.; San Francisco Press: San Francisco, CA, USA, 1985; pp. 104–106.
50. Schwartz, A.J.; Kumar, M.; Adams, B.L.; Field, D.P. Electron backscatter diffraction in materials science. Electron Backscatter Diffr.Mater. Sci. 2009, 1–403. [CrossRef]
51. Plavsa, D.; Reddy, S.M.; Agangi, A.; Clark, C.; Kylander-Clark, A.R.C.; Tiddy, C.J. Microstructural, trace element and geochrono-logical characterization of TiO2 polymorphs and implications for mineral exploration. Chem. Geol. 2018, 476, 130–149. [CrossRef]
52. El Goresy, A.; Dubrovinsky, L.; Gillet, P.; Graup, G.; Chen, M. Akaogiite: An ultra-dense polymorph of TiO2 with the baddeleyite-type structure, in shocked garnet gneiss from the Ries Crater, Germany. Am. Mineral. 2010, 95, 892–895. [CrossRef]
53. Tschauner, O.; Ma, C.; Lanzirotti, A.; Newville, M.G. Riesite, a new high pressure polymorph of TiO2 from the ries impactstructure. Minerals 2020, 10, 78. [CrossRef]
54. Meinhold, G. Rutile and its applications in earth sciences. Earth-Science Rev. 2010, 102, 1–28. [CrossRef]55. Zack, T.; Kooijman, E. Petrology and geochronology of rutile. Rev. Mineral. Geochem. 2017, 83, 443–467. [CrossRef]56. Angiboust, S.; Harlov, D. Ilmenite breakdown and rutile-titanite stability in metagranitoids: Natural observations and experimen-
tal results. Am. Mineral. 2017, 102, 1696–1708. [CrossRef]57. Luvizotto, G.L.; Zack, T.; Triebold, S.; Von Eynatten, H. Rutile occurrence and trace element behavior in medium-grade
metasedimentary rocks: Example from the Erzgebirge, Germany. Mineral. Petrol. 2009, 97, 233–249. [CrossRef]58. Willner, A.P. Pressure-temperature evolution of a low-pressure amphibolite facies terrane in central Bushmanland (Namaqua
Mobile Belt; South Africa). Commun. Geol. Surv. Namibia 1995, 10, 5–19.59. Ayers, J.C.; Watson, E.B. Rutile solubility and mobility in supercritical aqueous fluids. Contrib. Mineral. Petrol. 1993, 114, 321–330.
[CrossRef]60. Shulaker, D.Z.; Schmitt, A.K.; Zack, T.; Bindeman, I. In-situ oxygen isotope and trace element geothermometry of rutilated quartz
from Alpine fissures. Am. Mineral. 2015, 100, 915–925. [CrossRef]61. Zack, T.; Luvizottow, G.L. Application of rutile thermometry to eclogites. Mineral. Petrol. 2006, 88, 69–85. [CrossRef]62. Kooijman, E.; Smit, M.A.; Mezger, K.; Berndt, J. Trace element systematics in granulite facies rutile: Implications for Zr
geothermometry and provenance studies. J. Metamorph. Geol. 2012, 30, 397–412. [CrossRef]63. Win, M.M.; Enami, M.; Kato, T.; Thu, Y.K. A mechanism for Nb incorporation in rutile and application of Zr-in-rutile thermometry:
A case study from granulite facies paragneisses of the Mogok metamorphic belt, Myanmar. Mineral. Mag. 2017, 81, 1503–1521.[CrossRef]
64. Graham, J.; Morris, R.C. Tungsten- and antimony-substituted rutile. Mineral. Mag. 1973, 39, 470–473. [CrossRef]65. Tomkins, H.S.; Powell, R.; Ellis, D.J. The pressure dependence of the zirconium-in-rutile thermometer. J. Metamorph. Geol. 2007,
25, 703–713. [CrossRef]66. Majzlan, J.; Bolanz, R.; Göttlicher, J.; Mikuš, T.; Milovská, S. Incorporation mechanism of tungsten in W-Fe-Cr-V-bearing rutile.
Am. Mineral. 2021, 106, 609–619. [CrossRef]
Minerals 2021, 11, 553 25 of 27
67. Usuki, T.; Iizuka, Y.; Hirajima, T.; Svojtka, M.; Lee, H.Y.; Jahn, B.M. Significance of Zr-in-Rutile thermometry for deducing thedecompression P-T path of a garnet-clinopyroxene granulite in the moldanubian zone of the Bohemian Massif. J. Petrol. 2017, 58,1173–1198. [CrossRef]
68. Pape, J.; Mezger, K.; Robyr, M. A systematic evaluation of the Zr-in-rutile thermometer in ultra-high temperature (UHT) rocks.Contrib. to Mineral. Petrol. 2016, 171, 1–20. [CrossRef]
69. Kohn, M.J. A refined zirconium-in-rutile thermometer. Am. Mineral. 2020, 105, 963–971. [CrossRef]70. Zack, T.; Kronz, A.; Foley, S.F.; Rivers, T. Trace element abundances in rutiles from eclogites and associated garnet mica schists.
Chem. Geol. 2002, 184, 97–122. [CrossRef]71. Molina, J.F.; Poli, S. Carbonate stability and fluid composition in subducted oceanic crust: An experimental study on H2O-CO2-
bearing basalts. Earth Planet. Sci. Lett. 2000, 176, 295–310. [CrossRef]72. Poli, S. The amphibolite-eclogite transformation; an experimental study on basalt. Am. J. Sci. 1993, 293, 1061–1107. [CrossRef]73. Molina, J.F.; Poli, S. Singular equilibria in paragonite blueschists, amphibolites and eclogites. J. Petrol. 1998, 39, 1325–1346.
[CrossRef]74. Meyer, M.; John, T.; Brandt, S.; Klemd, R. Trace element composition of rutile and the application of Zr-in-rutile thermometry to
UHT metamorphism (Epupa Complex, NW Namibia). Lithos 2011, 126, 388–401. [CrossRef]75. Triebold, S.; Luvizotto, G.L.; Tolosana-Delgado, R.; Zack, T.; von Eynatten, H. Discrimination of TiO2 polymorphs in sedimentary
and metamorphic rocks. Contrib. to Mineral. Petrol. 2011, 161, 581–596. [CrossRef]76. Jackson, J.C.; Horton, J.W.; Chou, I.M.; Belkin, H.E. A shock-induced polymorph of anatase and rutile from the Chesapeake Bay
impact structure, Virginia, U.S.A. Am. Mineral. 2006, 91, 604–608. [CrossRef]77. Tuschel, D. Raman Spectroscopy and Polymorphism. Spectroscopy 2019, 34, 10–21. [CrossRef]78. Liu, Y.C.; Deng, L.P.; Gu, X.F.; Groppo, C.; Rolfo, F. Application of Ti-in-zircon and Zr-in-rutile thermometers to constrain
high-temperature metamorphism in eclogites from the Dabie orogen, central China. Gondwana Res. 2015, 27, 410–423. [CrossRef]79. Xiong, X.L.; Adam, J.; Green, T.H. Rutile stability and rutile/melt HFSE partitioning during partial melting of hydrous basalt:
Implications for TTG genesis. Chem. Geol. 2005, 218, 339–359. [CrossRef]80. Tual, L.; Möller, C.; Whitehouse, M.J. Tracking the prograde P–T path of Precambrian eclogite using Ti-in-quartz and Zr-in-rutile
geothermobarometry. Contrib. to Mineral. Petrol. 2018, 173, 1–15. [CrossRef]81. Rösel, D.; Zack, T.; Möller, A. Interpretation and significance of combined trace element and U–Pb isotopic data of detrital rutile:
A case study from late Ordovician sedimentary rocks of Saxo-Thuringia, Germany. Int. J. Earth Sci. 2019, 108, 1–25. [CrossRef]82. Cox, T.F.; Cox, M.A.A. Multidimensional Scaling, 2nd ed.; Chapman and Hall/CRC: Boca Raton, FL, USA, 2000; ISBN
9781584880943.83. Hounslow, M.W.; Morton, A.C. Evaluation of sediment provenance using magnetic mineral inclusions in clastic silicates:
Comparison with heavy mineral analysis. Sediment. Geol. 2004, 171, 13–36. [CrossRef]84. Vermeesch, P. Multi-sample comparison of detrital age distributions. Chem. Geol. 2013, 341, 140–146. [CrossRef]85. Vermeesch, P.; Resentini, A.; Garzanti, E. An R package for statistical provenance analysis. Sediment. Geol. 2016, 336, 14–25.
[CrossRef]86. Lancaster, P.J.; Daly, J.S.; Storey, C.D.; Morton, A.C. Interrogating the provenance of large river systems: Multi-proxy in situ
analyses in the Millstone Grit, Yorkshire. J. Geol. Soc. 2017, 174, 75–87. [CrossRef]87. Narkiewicz, M. Geologiczna historia Polski; Wydawnictwo Uniwersytetu Warszawskiego: Warszawa, Poland, 2020; ISBN
9788323542582.88. Hancock, J.M.; Kauffman, E.G. The great transgressions of the Late Cretaceous. J. Geol. Soc. London. 1979, 136, 175–186. [CrossRef]89. Hakenberg, M.; Jurkiewicz, H.; Woinski, J. Profile kredy srodkowej w północnej czesci niecki miechowskiej. Geol. Q. 1973,
17, 763–786.90. Krassowska, A. Kreda miedzy Zamosciem, Tomaszowem Lubelskim a Kryłowem. Biul. Panstwowego Inst. Geol. 1976, 291, 51–101.91. Olszewska-Nejbert, D.; Kotowski, J.; Nejbert, K. Psilonichnus upsilon Frey, Curran and Pemberton, 1984 burrows and their
environmental significance in transgressive Albian (Lower Cretaceous) sands of Glanów-Stroniczki, Cracow Upland, southernPoland. Palaeogeogr. Palaeoclimatol. Palaeoecol. 2020, 538. [CrossRef]
92. Hakenberg, M.; Swidrowska, J. Evolution of the Holy Cross Segment of the Mid-Polish Trough during the Cretaceous. Geol. Q.1998, 42, 239–262.
93. Jaskowiak-Schoeneichowa, M. Paläogeographie des Alb und Cenoman in Polen. In Aspekte der Kreide Europas; Wiedman, J., Ed.; E.Schweizerbart’sche Verlagsbuchhandlung: Stuttgart, Germany, 1979; pp. 463–471.
94. Walaszczyk, I. Turonian through Santonian deposits of the Central Polish Uplands; their facies developement, inoceramidpaleontology and stratigraphy. Acta Geol. Pol. 1992, 42, 1–122.
95. Olszewska-Nejbert, D. Development of the Turonian Conulus Lagerstätte in the Wielkanoc quarry, Miechów Upland (SouthPoland). Ann. Soc. Geol. Pol. 2005, 75, 199–210.
96. Biernacka, J.; Jozefiak, M.; Józefiak, M. The eastern Sudetic Island in the early-to-middle Turonian: Evidence from heavy mineralsin the Jerzmanowice sandstones, SW Poland. Acta Geol. Pol. 2009, 59, 545–565.
97. Krassowska, A. Charakterystyka osadów kredy na obszarze Lubelskiego Zagłebia Weglowego. Geol. Q. 1981, 25, 703–716.98. Swidrowska, J. Kreda w regionie lubelskim—Sedymentacja i jej tektoniczne uwarunkowania. Biul. Panstwowego Inst. Geol. 2007,
422, 63–78.

Minerals 2021, 11, 553 26 of 27
99. Kotowski, J.; Nejbert, K.; Olszewska-Nejbert, D. Monazite and tourmaline from the Albian (Lower Cretaceous) sands from theMiechów Synclinorium (southern Poland) as a Tool in Provenance Study. In Proceedings of the 9th European Conference onMineralogy and Spectroscopy, Prague, Czech Republic, 11–13 September 2019.
100. Mazur, S.; Aleksandrowski, P.; Kryza, R.; Oberc-Dziedzic, T. The Variscan Orogen in Poland. Geol. Q. 2006, 50, 89–118.101. Klomínský, J.; Jarchovský, T.; Rajpoot, G.S. Atlas of plutonic rocks and orthogneisses in the Bohemian Massif ; Czech Geological Survey:
Prague, Czech Republic, 2010; ISBN 9788070757512.102. Kryza, R.; Sveshnikov, K.I.; Charnley, N.; Montel, J.M. Monazite in precambrian granites of the Ukrainian Shield: Selected aspects
of geochemistry and chemical age dating. Mineral. Soc. Pol. Spec. Pap. 2004, 24, 255–258.103. Copjaková, R.; Buriánek, D.; Škoda, R.; Houzar, S. Tourmalinites in the metamorphic complex of the Svratka Unit (Bohemian
Massif): A study of compositional growth of tourmaline and genetic relations. J. Geosci. 2009, 54, 221–243. [CrossRef]104. Buriánek, D.; Dolnícek, Z.; Novák, M. Textural and compositional evidence for a polyphase saturation of tourmaline in granitic
rocks from the Trebíc Pluton (Bohemian Massif). J. Geosci. 2016, 61, 309–334. [CrossRef]105. Jastrzebski, M.; Budzyn, B.; Stawikowski, W. Cambro-Ordovician vs Devono-Carboniferous geodynamic evolution of the
Bohemian Massif: Evidence from P-T-t studies in the Orlica-Snieznik Dome, SW Poland. Geol. Mag. 2019, 156, 447–470. [CrossRef]106. Kowal-Linka, M.; Stawikowski, W. Garnet and tourmaline as provenance indicators of terrigenous material in epicontinental
carbonates (Middle Triassic, S Poland). Sediment. Geol. 2013, 291, 27–47. [CrossRef]107. Salata, D. Heavy minerals as detritus provenance indicators for the Jurassic pre-Callovian palaeokarst infill from the Czatkowice
Quarry (Kraków—Wielun Upland, Poland). Geol. Q. 2013, 57, 537–550. [CrossRef]108. Nawrocki, J.; Poprawa, P. Development of Trans-European Suture Zone in Poland: From Ediacaran rifting to Early Palaeozoic
accretion. Geol. Q. 2006, 50, 59–76.109. Otava, J.; Sulovský, P.; Krejcí, O. The results of study of the detrital garnets from the Cretaceous sediments of the Raca Unit of the
Magura Group (Outher Carpathians). Geol. Výzkumy na Morave a ve Slezsku 1998, 5, 29–31.110. Bogdanova, S.V.; Gorbatschev, R.; Garetsky, R.G. EUROPE|East European Craton. In Reference Module in Earth Systems and
Environmental Sciences; Elsevier: Amsterdam, The Netherlands, 2016; pp. 1–18. ISBN 978-0-12-409548-9.111. Shumlyanskyy, L.; Ellam, R.M.; Mitrokhin, O. The origin of basic rocks of the Korosten AMCG complex, Ukrainian shield:
Implication of Nd and Sr isotope data. Lithos 2006, 90, 214–222. [CrossRef]112. Savko, K.A.; Samsonov, A.V.; Larionov, A.N.; Korish, E.K.; Bazikov, N.S. An Archaean Tonalite–Trondhjemite–Granodiorite
Association of the Kursk Block (Voronezh Massif): Composition, Age, and Correlation with the Ukrainian Shield. Dokl. Earth Sci.2018, 478, 115–119. [CrossRef]
113. Bibikova, E.V.; Claesson, S.; Fedotova, A.A.; Stepanyuk, L.M.; Shumlyansky, L.V.; Kirnozova, T.I.; Fugzan, M.M.; Il’insky, L.S.Isotope-geochronological (U-Th-Pb, Lu-Hf) study of the zircons from the archean magmatic and metasedimentary rocks of thePodolia domain, Ukrainian shield. Geochem. Int. 2013, 51, 87–108. [CrossRef]
114. Force, E.R. The provenance of rutile. J. Sediment. Petrol. 1980, 50, 485–488.115. Białowolska, A.; Bakun-Czubarow, N.; Fedoryshyn, Y. Neoproterozoic flood basalts of the upper beds of the Volhynian Series
(East European Craton). Geol. Q. 2002, 46, 37–57.116. Pinto, A.J.; Sanchez-Pastor, N.; Callegari, I.; Pracejus, B.; Scharf, A. Challenges to rutile-based geoscientific tools: Low-temperature
polymorphic TiO2 transformations and corresponding reactive pathways. Sci. Rep. 2020, 10, 1–14. [CrossRef]117. Claesson, S.; Bogdanova, S.V.; Bibikova, E.V.; Gorbatschev, R. Isotopic evidence for Palaeoproterozoic accretion in the basement of
the East European Craton. Tectonophysics 2001, 339, 1–18. [CrossRef]118. Corfu, F.; Andersen, T.B.; Gasser, D. The scandinavian caledonides: Main features, conceptual advances and critical questions.
Geol. Soc. Spec. Publ. 2014, 390, 9–43. [CrossRef]119. Burton, K.W.; Boyle, A.P.; Kirk, W.L.; Mason, R. Pressure, temperature and structural evolution of the Sulitjelma fold-nappe,
central Scandinavian Caledonides. Geol. Soc. Spec. Publ. 1989, 43, 391–411. [CrossRef]120. Fossen, H.; Dallmeyer, R.D. 40Ar/39Ar muscovite dates from the nappe region of southwestern Norway: Dating extensional
deformation in the Scandinavian Caledonides. Tectonophysics 1998, 285, 119–133. [CrossRef]121. Engvik, A.K.; Grenne, T.; Lutro, O.J.; Meyer, G.B. Metamorphic constraints on the caledonian upper allochthon of Central Norway:
The gula complex staurolite-garnet-kyanite mica schist. Geol. Soc. Spec. Publ. 2014, 390, 563–581. [CrossRef]122. Krogh, E.J. Compatible P-T conditions for eclogites and surrounding gneisses in the Kristiansund area, western Norway. Contrib.
Mineral. Petrol. 1981, 75, 387–393. [CrossRef]123. Gee, D.G.; Sturt, B.A. The Caledonide Orogen: Scandinavia and Related Areas; Wiley: Hoboken, NJ, USA, 1985.124. Dobrzhinetskaya, L.F.; Eide, E.A.; Larsen, R.B.; Sturt, B.A.; Trønnes, R.G.; Smith, D.C.; Taylor, W.R.; Posukhova, T.V. Microdiamond
in high-grade metamorphic rocks of the Western Gneiss region, Norway. Geology 1995, 23, 597–600. [CrossRef]125. Morton, A.C.; Whitham, A.G.; Fanning, C.M. Provenance of Late Cretaceous to Paleocene submarine fan sandstones in the
Norwegian Sea: Integration of heavy mineral, mineral chemical and zircon age data. Sediment. Geol. 2005, 182, 3–28. [CrossRef]126. Rudowski, S. Mikroformy strefy brzegowej Bałtyku w Polsce. Acta Geol. Pol. 1962, 12, 541–579.127. Morton, A.C.; Hallsworth, C.R. Processes controlling the composition of heavy mineral assemblages in sandstones. Sediment.
Geol. 1999, 124, 3–29. [CrossRef]128. Bluck, B.J.; Ward, J.D.; Cartwright, J.; Swart, R. The Orange River, southern Africa: An extreme example of a wave-dominated
sediment dispersal system in the South Atlantic Ocean. J. Geol. Soc. 2007, 164, 341–351. [CrossRef]

Minerals 2021, 11, 553 27 of 27
129. Garzanti, E.; Andò, S.; Vezzoli, G.; Lustrino, M.; Boni, M.; Vermeesch, P. Petrology of the Namib Sand Sea: Long-distance transportand compositional variability in the wind-displaced Orange Delta. Earth Sci. Rev. 2012, 112, 173–189. [CrossRef]
130. Hori, K.; Saito, Y.; Zhao, Q.; Wang, P. Architecture and evolution of the tide-dominated Changjiang (Yangtze) River delta, China.Sediment. Geol. 2002, 146, 249–264. [CrossRef]
131. van Rijn, L.C.; Walstra, D.-J.R.; van Ormondt, M. Unified View of Sediment Transport by Currents and Waves. IV: Application ofMorphodynamic Model. J. Hydraul. Eng. 2007, 133, 776–793. [CrossRef]
132. Bian, C.; Jiang, W.; Greatbatch, R.J. An exploratory model study of sediment transport sources and deposits in the Bohai Sea,Yellow Sea, and East China Sea. J. Geophys. Res. Ocean 2013, 118, 5908–5923. [CrossRef]
133. Corbett, I.B. A review of diamondiferous marine deposits of western southern Africa. Africa Geosci. Rev. 1996, 3, 157–174.134. Rosen, S.D. Assessing Present and Future Mediterranean Sea Level Rise Impact on Israel’S Coast and Mitigation Ways Against
Beach and Cliff Erosion. Coast. Eng. Proc. 2011, 1, 4. [CrossRef]135. Kuhrts, C.; Fennel, W.; Seifert, T. Model studies of transport of sedimentary material in the western Baltic. J. Mar. Syst. 2004,
52, 167–190. [CrossRef]136. Stella, M.; Ostrowski, R.; Szmytkiewicz, P.; Kapinski, J.; Marcinkowski, T. Driving forces of sandy sediment transport beyond the
surf zone. Oceanologia 2019, 61, 50–59. [CrossRef]137. Vinogradov, A.P. Atlas of Lithological and Paleogeographic Maps of the Russian Platform and its Geosynclinal Framing. Part 2. Mesozoic
and Cenozoic; Vinogradov, A.P., Ed.; Academy of Sciences of the Soviet Union: Moscow, Russia; Saint Petersburg, Russia, 1961.138. Baraboshkin, E.J.; Alekseev, A.S.; Kopaevich, L.F. Cretaceous palaeogeography of the North-Eastern Peri-Tethys. Palaeogeogr.
Palaeoclimatol. Palaeoecol. 2003, 196, 177–208. [CrossRef]
Copyright © 2022 FDOKUMEN