Electro-structural correlations, elastic and optical properties among the nanolaminated ternary...
12
Electro-structural correlations, elastic and optical properties among the nanolaminated ternary carbides Zr 2 AC Mohammed Benali Kanoun a , Souraya Goumri-Said b, * , Ali H. Reshak c , Abdelkarim E. Merad d, e a Laboratoire de Chimie The´orique, Unite ´ de Chimie-Physique The´orique et Structurale, Faculte ´s Universitaires Notre-Dame de la paix (FUNDP), 61 Rue de Bruxelles, B-5000 Namur, Belgium b Centre de recherche en Physique de la Matie`re et du Rayonnement (PMR), Laboratoire de Physique du Solide, Faculte´s Universitaires Notre-Dame de la paix (FUNDP), 61 Rue de Bruxelles, B-5000 Namur, Belgium c Institute of Physical Biology, South Bohemia University, Nove Hrady 37333, Czech Republic d Equipe Physique de l’e ´tat solide, LPT, De ´partement de Physique, Faculte ´ des Sciences, Universite´ de Tlemcen, BP 13000 Tlemcen, Algeria e The Abdus Salam ICTP, Strada Costiera,11 I-34014 Trieste, Italy article info Article history: Received 8 September 2009 Received in revised form 20 January 2010 Accepted 24 January 2010 Available online 4 February 2010 Keywords: Electronic structure Elastic and mechanical properties MAX phase Optical properties abstract We have performed ab initio calculations for the nanolaminates Zr 2 AC (A ¼ Ti, In, Tl, Si, Ge, Sn, Pb, P, As, S) ceramics to study their electronic structure, elastic and optical properties. In this work, we used the accurate augmented plane wave plus local orbital method with density functional theory to find the equilibrium structural parameters, dielectric functions and to compute the full elastic tensors. The obtained elastic constants were used to quantify the stiffness of the Zr 2 AC phases and to appraise their mechanical stability. The relationship between elastic, electronic and valence electron concentration is discussed. Our results show that the bulk modulus and shear modulus increase across the periodic table for Zr 2 AC. Furthermore, trends in elastic stiffness are well explained in terms of electronic structure analysis, as occupation of valence electrons in states near the Fermi level of Zr 2 AC. We show that increments of bulk moduli originate from additional valence electrons filling states involving Zr d–A p. We show also that Zr d–A p hybridizations are located just below the Fermi level and are weaker bonds than the Zr d–C p hybridizations, which are deeper in energy. As a function of the p-state filling of the A element the Zr d–A p bands are driven to deeper energy. The optical spectra were analyzed by means of the electronic structure, which provides theoretical understanding of the conduction mechanism of these ceramics. Ó 2010 Elsevier Masson SAS. All rights reserved. 1. Introduction The M nþ1 AX n (MAX) phases (n ¼ 1–3) are layered hexagonal compounds, in which near close-packed layers of M (early tran- sition metals) are interleaved with layers of group A element (mostly IIIA and IVA), with the X-atoms (C and/or N) filling the octahedral sites between the M layers. The MAX phases represent a class of technologically important solids exhibiting unusual properties associated with both metals and ceramics [1]. Gener- ally, the M nþ1 AX n phases are machinable, [2] exhibit good damage tolerance, [3] have excellent thermal shock resistance, [4] good corrosion resistance, [5] and they are good thermal and electrical conductors [6,7]. These materials gained renewed interest since Barsoum and co-workers [8] succeed to synthesize single phase, bulk dense samples of Ti 3 SiC 2 . Afterwards, many of the roughly 60 M nþ1 AX n phases known to date have been studied both experi- mentally and theoretically [9–11]. However, individual properties vary from phase to phase. Only limited data are available describing the systematic dependence of the properties on the electronic structure. It has been suggested from ab initio calcula- tions [12] that M 2 AC (M ¼ Ti, Zr, Hf, V, Nb, Ta, Cr, Mo, W and A ¼ Al, Ga, Ge and Sn) can be classified into two groups: one where the bulk modulus of the binary MC is conserved and the other for which the bulk modulus is decreased. However, the same authors [13] have questioned their own results, the description of the binary carbides MC being very sensitive to the choice of the projector augmented wave (PAW) potentials they used. In the same way, Schneider et al. reported that the bulk modulus increases with p electron concentration at the M site for Ta 2 AC [14]. Recently, Hug [15] has studied the electronic properties among ternary carbides Ti-based compounds. All these phases are shown, except for A ¼ Si, P and As, to be stable, a behavior originating from * Corresponding author. E-mail addresses: [email protected] (M.B. Kanoun), [email protected] (S. Goumri-Said). Contents lists available at ScienceDirect Solid State Sciences journal homepage: www.elsevier.com/locate/ssscie 1293-2558/$ – see front matter Ó 2010 Elsevier Masson SAS. All rights reserved. doi:10.1016/j.solidstatesciences.2010.01.035 Solid State Sciences 12 (2010) 887–898
Transcript of Electro-structural correlations, elastic and optical properties among the nanolaminated ternary...

lable at ScienceDirect
Solid State Sciences 12 (2010) 887–898
Contents lists avai
Solid State Sciences
journal homepage: www.elsevier .com/locate/ssscie
Electro-structural correlations, elastic and optical properties among thenanolaminated ternary carbides Zr2AC
Mohammed Benali Kanoun a, Souraya Goumri-Said b,*, Ali H. Reshak c, Abdelkarim E. Merad d,e
a Laboratoire de Chimie Theorique, Unite de Chimie-Physique Theorique et Structurale, Facultes Universitaires Notre-Dame de la paix (FUNDP), 61 Rue de Bruxelles,B-5000 Namur, Belgiumb Centre de recherche en Physique de la Matiere et du Rayonnement (PMR), Laboratoire de Physique du Solide, Facultes Universitaires Notre-Dame de la paix (FUNDP), 61 Rue deBruxelles, B-5000 Namur, Belgiumc Institute of Physical Biology, South Bohemia University, Nove Hrady 37333, Czech Republicd Equipe Physique de l’etat solide, LPT, Departement de Physique, Faculte des Sciences, Universite de Tlemcen, BP 13000 Tlemcen, Algeriae The Abdus Salam ICTP, Strada Costiera, 11 I-34014 Trieste, Italy
a r t i c l e i n f o
Article history:Received 8 September 2009Received in revised form20 January 2010Accepted 24 January 2010Available online 4 February 2010
Keywords:Electronic structureElastic and mechanical propertiesMAX phaseOptical properties
* Corresponding author.E-mail addresses: mohammed-benali.kanoun@f
[email protected] (S. Goumri-Said).
1293-2558/$ – see front matter � 2010 Elsevier Massdoi:10.1016/j.solidstatesciences.2010.01.035
a b s t r a c t
We have performed ab initio calculations for the nanolaminates Zr2AC (A¼Ti, In, Tl, Si, Ge, Sn, Pb, P, As, S)ceramics to study their electronic structure, elastic and optical properties. In this work, we used theaccurate augmented plane wave plus local orbital method with density functional theory to find theequilibrium structural parameters, dielectric functions and to compute the full elastic tensors. Theobtained elastic constants were used to quantify the stiffness of the Zr2AC phases and to appraise theirmechanical stability. The relationship between elastic, electronic and valence electron concentration isdiscussed. Our results show that the bulk modulus and shear modulus increase across the periodic tablefor Zr2AC. Furthermore, trends in elastic stiffness are well explained in terms of electronic structureanalysis, as occupation of valence electrons in states near the Fermi level of Zr2AC. We show thatincrements of bulk moduli originate from additional valence electrons filling states involving Zr d–A p.We show also that Zr d–A p hybridizations are located just below the Fermi level and are weaker bondsthan the Zr d–C p hybridizations, which are deeper in energy. As a function of the p-state filling of the Aelement the Zr d–A p bands are driven to deeper energy. The optical spectra were analyzed by means ofthe electronic structure, which provides theoretical understanding of the conduction mechanism ofthese ceramics.
� 2010 Elsevier Masson SAS. All rights reserved.
1. Introduction
The Mnþ1AXn (MAX) phases (n¼ 1–3) are layered hexagonalcompounds, in which near close-packed layers of M (early tran-sition metals) are interleaved with layers of group A element(mostly IIIA and IVA), with the X-atoms (C and/or N) filling theoctahedral sites between the M layers. The MAX phases representa class of technologically important solids exhibiting unusualproperties associated with both metals and ceramics [1]. Gener-ally, the Mnþ1AXn phases are machinable, [2] exhibit good damagetolerance, [3] have excellent thermal shock resistance, [4] goodcorrosion resistance, [5] and they are good thermal and electricalconductors [6,7]. These materials gained renewed interest sinceBarsoum and co-workers [8] succeed to synthesize single phase,
undp.ac.be (M.B. Kanoun),
on SAS. All rights reserved.
bulk dense samples of Ti3SiC2. Afterwards, many of the roughly 60Mnþ1AXn phases known to date have been studied both experi-mentally and theoretically [9–11]. However, individual propertiesvary from phase to phase. Only limited data are availabledescribing the systematic dependence of the properties on theelectronic structure. It has been suggested from ab initio calcula-tions [12] that M2AC (M¼ Ti, Zr, Hf, V, Nb, Ta, Cr, Mo, W and A¼Al,Ga, Ge and Sn) can be classified into two groups: one where thebulk modulus of the binary MC is conserved and the other forwhich the bulk modulus is decreased. However, the same authors[13] have questioned their own results, the description of thebinary carbides MC being very sensitive to the choice ofthe projector augmented wave (PAW) potentials they used. In thesame way, Schneider et al. reported that the bulk modulusincreases with p electron concentration at the M site for Ta2AC [14].Recently, Hug [15] has studied the electronic properties amongternary carbides Ti-based compounds. All these phases are shown,except for A¼ Si, P and As, to be stable, a behavior originating from

Table 1Equilibrium theoretical and experimental lattice parameters a, c, relaxed atomic parameter ZM and octahedron od and trigonal prism pd distortions. The bulk modulus B (GPa),total density of states at the Fermi level N(EF) (states/eV/Cell) and formation energy (DEf) for Zr2AC compounds are also shown. The reported numbers within brackets refer tothe experimental data [22].
a (Å) c (Å) ZM od pd B (GPa) B0 DEf DEF
Zr2AlC 3.308 14.680 0.08436 1.0792 1.0698 150.40 4.0 �0.726 �2.274Zr2InC 3.334 (3.34) 15.021 (14.91) 0.08640 1.0430 1.0680 147.95 4.212 �1.250 �2.431Zr2TlC 3.353 (3.36) 14.921 (14.78) 0.08147 1.1096 1.0565 148.73 3.234 �1.590 �2.152Zr2SiC 3.338 13.834 0.09215 1.0605 1.1461 172.8 4.20 �0.977 �2.651Zr2GeC 3.351 13.943 0.09051 1.0736 1.1368 170.0 4.222 �0.586 �3.767Zr2SnC 3.352 (3.357) 14.681 (14.57) 0.08500 1.0844 1.0811 156.0 4.441 �1.269 �2.721Zr2PbC 3.384 (3.38) 14.885 (14.66) 0.08330 1.0995 1.0715 148.3 4.3 �0.821 �1.965Zr2PC 3.433 12.173 0.10280 1.1044 1.2848 185.83 4.106 �1.213 �4.527Zr2AsC 3.513 12.682 0.09286 1.1863 1.2354 159.20 4.15 �1.590 �6.700Zr2SC 3.485 (3.40) 12.524 (12.13) 0.09741 1.1435 1.2558 162.66 4.113 �1.472 �1.300
M.B. Kanoun et al. / Solid State Sciences 12 (2010) 887–898888
the particularities of the hybridization scheme in thesecompounds (Ti d–A p and Ti d–C p hybrids). More recently, we havesuggested that the 211 M2SnC (M¼ Ti, Zr, Hf and Nb) MAX phaseshold back about 69% of the bulk modulus of the correspondingbinary carbides, a value close to 2/3. Knowing that the bulk moduliof M3SiC2 are 3/4 of the corresponding MC, it is curious to remarkthat the bulk moduli of Mnþ1ACn are pretty close to nþ 1=nþ 2 ofthe corresponding binary carbides for n¼ 1 and 2. Sucha phenomenological relation will give 4/5 for the bulk moduli ofM4AC3 compared to the related MC ones [16].
Thus, in the present paper, we focus our intention on thephysical properties of nanolaminate Zr2AC with A¼Ti, In, Tl, Si, Ge,Sn, Pb, P, As, and S by mean of full-potential first principles calcu-lations. Specifically, we address the crystal parameters, electronicstructure, mechanical behavior and optical properties of thesecompounds. It is our ambition to contribute towards understandingthe relationship between the elastic properties and electronic
Fig. 1. (Color online) Unit cell of Zr2AC (A¼Ti, In, Tl, Si, Ge, Sn, Pb, P, As, S) phase.A [Zr6C]octahedron and a [Zr6A] trigonal prism are outlined.
structure as a function of valence electron population of A element.The elastic properties are of particular interest as they determinethe mechanical stability of the material and important macroscopicproperties such as hardness, lubrification, friction, and machin-ability. The electronic structure and chemical bonding investigationwill then provide an overall view of electro-structural informationthat is needed for tailoring and improving the electronic features ofthese materials. We have to point out that many theoreticalcalculations have been carried out on the electronic structures ofMAX phases, but the optical properties of the MAX phases have notreceived adequate attention from neither experimentalists northeorists.
2. Theoretical method and crystal structure
The present calculations were performed using an all-electronfull-potential (linearized) augmented plane waves plus localorbitals (FP-L/APWþ lo) method [17], based on the density func-tional theory (DFT) [18]. The exchange correlation potential wascomputed with the Wu and Cohen generalized gradient approxi-mation (GGA-WC) [19]. The maximum value lmax for the wavefunctions expansion inside the atomic spheres is limited to 10. Toachieve the energy eigenvalues convergence, the wave functionsinside the interstitial region are expanded in plane waves witha cutoff RMT� Kmax¼ 8, where Kmax is the maximum modulus for
Fig. 2. (Color online) Variation of the distortion parameters of the octahedral od (solidssymbols and solid lines) and prismatic (1/pd) (open symbols and doted lines) crystalsunits as a functions of the A-p filling.

Fig. 3. (Color online) The bulk moduli of the MAX phases as a function of the numberof the p electrons comprising the A element of the compounds.
M.B. Kanoun et al. / Solid State Sciences 12 (2010) 887–898 889
the reciprocal lattice vector. Moreover, local orbitals have beenadded for all atoms and valence states. The self-consistency cyclewas achieved taking 1500 points in the first Brillouin zone. Theconvergence has been followed with respect to the energy and thedensity.
The Zr2AC phases belong to P63/mmc space group. Thishexagonal structure can be considered as a nearly close-packedstacking of Zr2AC layers interleaved with a pure tin layer everyfourth layer. The atoms are located at the following Wyckoffpositions: Zr atoms at 4f (ZM), A at 2d and C at 2a. The coordinateZM is the only internal free parameters in the crystal structure. Forthe atoms in 4f positions, the ideal value of the internal dimen-sionless parameter Z is 1/12 for metal atom Zr. A set of differentpredefined volumes is chosen and for each of these volumesdifferent calculations are made for several c/a ratio values. Duringeach step, the free parameter ZM is allowed to vary for optimiza-tion. The energy curves as function of the c/a ratio are then fittedwith a polynomial function. This allows us to find a minimum inenergy as a function of the c/a ratio for each selected volume.These minima give a set of energies as a function of volume inwhich all other parameters are optimized. In the last step, thisenergy versus volume curve is fitted using the third-order Birch–Murnaghan equation of state [20,21] to find the optimizedparameters.
3. Structural properties
To investigate the ground-state properties, we computed theequilibrium lattice configurations of Zr2AC phases at first optimized
Table 2Calculated elastic constants, Cij (in GPa) and anisotropy factors (Aan) for Zr2ACcompounds.
C11 C33 C44 C12 C13 C66 (Aan)
Zr2AlC 333.36 337.22 153.30 42.03 75.30 145.66 1.179Zr2InC 290.95 275.77 155.15 64.86 88.094 113.04 1.589Zr2TlC 316.89 339.93 145.23 58.43 61.557 129.23 1.088Zr2SiC 195.90 297.50 159.04 120.00 111.39 37.95 2.350Zr2GeC 225.62 280.92 148.82 105.06 105.37 60.27 2.012Zr2SnC 269.02 290.44 148.48 80.49 107.30 94.26 1.722Zr2PbC 284.58 412.10 121.91 126.70 24.86 78.94 0.753Zr2PC 311.80 366.82 200.22 98.26 129.88 106.77 1.912Zr2AsC 173.25 281.23 158.31 161.50 113.86 5.87 2.792Zr2SC 336.88 283.97 158.65 78.02 97.06 129.42 1.487
lattice parameters for a, c and ZM are summarized in Table 1 as wellas the experimental data [22] for comparison. As a general remark,it can be note that all the Zr2AC compounds, are intrinsically stable.The deviations are estimated to be about 0.1% and 0.8% for a and ccompared to available experimental work. The formation energiesDEf of these MAX phases, calculated from the difference betweentheir total energies and the sum of the isolated atomic energies ofthe pure constituents, are also reported in Table 1. The values for DEf
are always negative, indicating that the formation of these MAXphases is exothermic, and they are intrinsically stable in agreementwith the experiment [22].
Following previous works [15,16,23], it is of interest to considerthe MAX crystal unit cell as constituted of [M6X] octahedra and[M6A] trigonal triangular prisms (see Fig. 1). The stacking of thesetwo polyhedra allows to describe the 211 phases, while it needs two(three) octahedra units and one trigonal prism unit to obtain the312 (413) MAX phases. It should be mentioned that a cubic octa-hedron is the unit block of the binary MX, but it loses its four-foldaxis in the ternary MAX and it results a relaxation owing to thisreduced symmetry. The non-cubic distortion of the octahedron andthe trigonal prism can be estimated from the parameters od and pd,respectively, defined in Refs. [16,23]. The calculated parameters od
and pd are summarized in Table 1 and displayed in Fig. 2. One canclearly observe from this figure that the effect of increasing thevalence electron of the A atom is to distort both polyhedral struc-tural units, although the prism is much more affected.
The predicted bulk modulus values of Zr2AC are listed in Table 1.It is clear that the bulk modulus of Zr2PC is higher than the otherZr2AC compounds. The trends of the calculated bulk modulus ofthese materials may be discussed as displayed in Fig. 3. As can beseen, the increase of p electrons from A elements when movingrightwards along the periodic table results in an increase of thebulk modulus up to the s2p3 column. As is seen, there is the above-mentioned distinct correlation between the bulk modulus and unitcell volumes of these compounds.
4. Elastic properties
The elastic stiffness determines the response of the crystal to anexternally applied strain (or stress) and provides information aboutthe bonding characteristics, mechanical and structural stability. Ingeneral, estimating elastic constants from first principles calcula-tion is really tough because it requires accurate methods to evaluatethe total energy or stress accompanying strain. Fortunately, state ofthe art first principles computational modeling permits us toreproduce the elastic properties of nanolaminate ternary ceramicswell. Then, the values of the five independent elastic constants (Cij,namely C11, C12, C13, C33, C44; while C66¼ (C11� C12)/2) summarizedin Table 2 were found by imposing different deformations (seeRef. [24]) to the equilibrium lattice of the hexagonal unit cell and bydetermining the dependence of the resulting energy changes onthe deformation. We note that the elastic constants C11 and C33,which represent stiffness against principal stains, and C66, which isrelated to the resistance to shear in the {010} plane in the C110D
direction. C44, which reflects the resistance to shear in the {010} or{100} plane in the C001D direction. From Table 2, it can be seen thatthe elastic stiffness does not follow the same trend across theperiodic table: C44 of Zr2PC, as well as that C66 of Zr2AlC, are higherthan those of other compounds. Furthermore, there are somegeneral conclusions we would like to point out from the obtainedresults.
Firstly, the mechanically stable phases or macroscopic stabilityis dependent on the positive definiteness of stiffness matrix [25].For a stable hexagonal structure, its five independent elasticconstants should satisfy the well-known Born stability criteria [26],

Table 3Calculated bulk moduli (BV, BR, BVRH, in GPa), compressibility (bVRH, in GPa�1), shear moduli (GV, GR, GVRH, in GPa), Young’s moduli (YVRH, in GPa), and Poisson’s ratio (n) for Zr2ACcompounds.
BV BR BVRH GV GR GVRH BVRH/GVRH bVRH YVRH n
Zr2AlC 154.35 153.94 154.15 144.54 143.63 144.08 0.93 0.0065 329.57 0.143Zr2InC 148.86 148.84 148.85 125.78 120.78 123.28 0.83 0.0067 289.83 0.175Zr2TlC 148.53 148.34 148.44 136.75 136.33 136.54 0.92 0.0067 313.50 0.148Zr2SiC 152.76 148.63 150.70 94.31 63.67 78.99 0.52 0.0066 201.73 0.277Zr2GeC 151.53 150.07 150.80 99.34 84.06 91.70 0.61 0.0066 228.74 0.247Zr2SnC 157.63 156.60 157.11 113.80 106.98 110.40 0.70 0.0063 268.33 0.215Zr2PbC 148.23 148.10 148.17 118.21 106.32 112.26 0.75 0.0067 268.90 0.197Zr2PC 189.61 186.93 188.27 143.60 129.97 136.80 0.72 0.0053 330.36 0.207Zr2AsC 156.24 154.41 155.32 80.40 13.63 47.20 0.30 0.0064 128.13 0.362Zr2SC 166.90 166.46 166.67 135.05 130.97 133.01 0.80 0.0060 315.20 0.184
Table 4Calculated density (r in g/cm3), longitudinal, transverse and average sound velocity(vl, vt, vm in km/s), and Debye temperatures (qD in K).
r vt vl vm QD
Zr2AlC 5.286 5.220 8.093 5.730 658.76Zr2InC 7.103 4.166 6.640 4.587 520.60Zr2TlC 9.117 3.870 6.020 4.249 481.52Zr2SiC 5.536 3.777 6.800 4.207 490.32Zr2GeC 6.541 3.744 6.461 4.155 481.81Zr2SnC 7.281 3.893 6.465 4.306 490.64Zr2PbC 9.036 3.524 5.741 3.890 438.45Zr2PC 6.026 4.764 7.842 5.264 628.40Zr2AsC 6.600 2.669 5.747 3.006 348.56Zr2SC 5.711 4.826 7.761 5.319 622.73
M.B. Kanoun et al. / Solid State Sciences 12 (2010) 887–898890
i.e., C11� jC12j>0, (C11þ C12)C33� 2C132 > 0 and C44> 0. It can be
seen that these compounds are mechanically stable including thehypothetical Zr2AlC, Zr2SiC Zr2GeC, Zr2PC, and Zr2AsC compoundsbecause all elastic constants are positive and satisfy the Bornmechanical stability restrictions.
Secondly, it is important to calculate elastic anisotropy instructural crystals in order to understand these properties andhopefully find mechanisms which will improve their durability.Essentially all the known crystals are elastically anisotropic, anda proper description of such an anisotropic behavior has, therefore,an important implication in engineering science as well as in crystalphysics. The shear anisotropic factors provide a measure of thedegree of anisotropy in the bonding between atoms in differentplanes [27]. Thus, we have calculated the shear anisotropy factor(Aan) of Zr2AlC for the f0111g shear planes between the C0111D andC0001D directions,
Aan ¼4C44
C11 þ C33 � 2C13(1)
The shear anisotropic factors obtained from our theoreticalstudies are given in Table 2. For an isotropic crystal, Aan is equal to 1,while any value smaller or larger than 1 indicates elastic anisotropy.The magnitude of the deviation from 1 is a measure of the degree ofelastic anisotropy possessed by the crystal. It is interesting to notethat all Zr2AC compounds are characterized by a profound andlarger anisotropy for the shear planes described above, exceptZr2PbC.
The calculated elastic constants allow us to obtain the macro-scopic mechanical parameters of Zr2AC compounds, namely theirbulk (B) and shear (G) moduli. The definition of the bulk modulus(BV) and the shear moduli (GV) in the Voigt (V) [28] approximationis expressed as:
BV ¼19½2ðC11 þ C12Þ þ C33 þ 4C13�; (2)
GV ¼1
15ð2C11 þ C33 � C12 � 2C13Þ þ
15ð2C44 þ C66Þ (3)
The above elastic parameters are obtained from first principlecalculations of Zr2AC monocrystals. Meanwhile, the majority ofsynthesized and experimentally examined materials are preparedand investigated as polycrystalline ceramics [29–32], i.e. in theform of aggregated mixtures of microcrystallites with a randomorientation. Thus, it is useful to estimate the elastic parameters forthe polycrystalline Zr2AC materials. For this purpose we utilize theVoigt–Reuss–Hill (VRH) approximation. In this approach, accordingto Hill [33], two main approximations, Voigt [28] and Reuss (R) [34],are used. In turn, in the Reuss model the bulk and shear moduli(BR and GR) are estimated as:
BR ¼ðC11 þ C12ÞC33 � 2C2
13C11 þ C12 þ 2C33 � 4C13
: (4)
GR ¼52
hðC11 þ C12ÞC33 � 2C2
13
iC44C66h
3BV C44C66 þ�ðC11 þ C12ÞC33 � 2C2
13
�ðC44 þ C66Þ
i(5)
Then, the Voigt and Reuss averages are limits and the actualeffective moduli for polycrystals could be estimated in the VRHapproach by the arithmetic mean of these two limits. In this way,when the bulk modulus (BVRH) and the shear modulus (GVRH) areobtained from (BV, R and GV, R by the VRH approach in simple formsas (BVRH¼ (BVþ BR)/2) and GVRH¼ (GVþGR)/2), the averagedcompressibility (bVRH¼ 1/BVRH) and Young’s modulus (YVRH) maybe calculated by the expression:
YVRH ¼9BVRHGVRH
3BVRH þ GVRH(6)
Then, Poisson’s ratio (n) was obtained for polycrystallineZr2ACspecies from BVRH, GVRH and YVRH as:
n ¼ 3BVRH � 2GVRH
2ð3BVRH þ GVRHÞ(7)
Mechanical parameters, such as Bulk modulus, shear modulus,anisotropic Young’s, and Poisson’s ratio are summarized in Table 3.From our results we see that the difference between bulk moduli aswell as shear moduli is comparatively small. It was found for the allcompounds that BVRH>GVRH; this implies that the parameterlimiting the stability of these materials is the shear modulus GVRH.From the computed GVRH/BVRH ratios of Table 3, one can also esti-mate the brittle and ductile behaviors of polycrystalline materials

Fig. 4. Total density of states (TDOS) for Zr2AC with (A¼Ti, In, Tl, Si, Ge, Sn, Pb, P, As, S).
M.B. Kanoun et al. / Solid State Sciences 12 (2010) 887–898 891
by considering the bulk modulus as the resistance to fracture andthe shear modulus as the resistance to plastic deformation. A high(low) GVRH/BVRH ratio becomes therefore associated to brittleness(ductility) of materials. Also, the critical number which separatesductile and brittle was fixed at about 0.57 [35]. According to theabove description, the calculated GVRH/BVRH values for all Zr2ACsuggest that Zr2SiC and Zr2GeC are slightly more ductile than othercompounds.
Thus, the bulk moduli for Zr2AC compounds may vary from 148 to189 GPa. The maximal bulk modulus (189 GPa) and the minimalcompressibility (0.0053 1/GPa) have been obtained for Zr2PCceramic. On the other hand, Zr2AlC, Zr2TlC and Zr2PC will have themaximal shear modulus (GVRH z 136–144 GPa), i.e. the maximalbond-restoring energy under elastic shear strain, whereas according
to the GVRH estimations, Zr2AsC (GVRH¼ 47 GPa) will remain a mate-rial with the minimal hardness. Young’s modulus YVRH also themaximal and minimal values for Zr2AlC and Zr2PC (YVRH z 330 GPa)and Zr2AsC compounds (YVRH¼ 128 GPa), respectively.
The values of the Poisson ratio (n) for covalent materials aresmall (n¼ 0.1), whereas for metallic materials a typical value of n is0.33 [36]. In our case, the values of n for Zr2AC vary from about 0.10–0.36, indicating a considerable between ionic and metallic contri-butions in intra-atomic bonding should be assumed. Besides, forcovalent and ionic materials, the typical relations between bulk andshear moduli are G z 1.1B and G z 0.6B, respectively [37]. More-over, the calculated value of GVRH/BVRH varies between 0.30 and0.94, which also indicates that the mixed ionic-covalent bonding issuitable for Zr2AC.
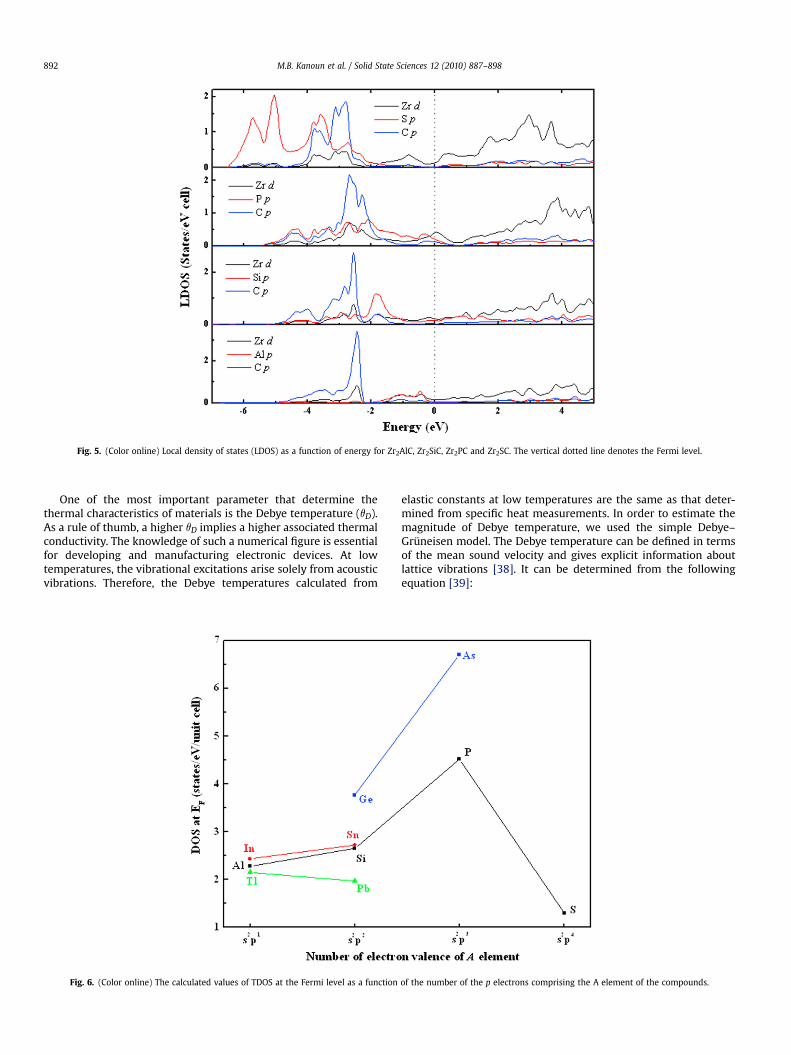
Fig. 5. (Color online) Local density of states (LDOS) as a function of energy for Zr2AlC, Zr2SiC, Zr2PC and Zr2SC. The vertical dotted line denotes the Fermi level.
M.B. Kanoun et al. / Solid State Sciences 12 (2010) 887–898892
One of the most important parameter that determine thethermal characteristics of materials is the Debye temperature (qD).As a rule of thumb, a higher qD implies a higher associated thermalconductivity. The knowledge of such a numerical figure is essentialfor developing and manufacturing electronic devices. At lowtemperatures, the vibrational excitations arise solely from acousticvibrations. Therefore, the Debye temperatures calculated from
Fig. 6. (Color online) The calculated values of TDOS at the Fermi level as a function
elastic constants at low temperatures are the same as that deter-mined from specific heat measurements. In order to estimate themagnitude of Debye temperature, we used the simple Debye–Gruneisen model. The Debye temperature can be defined in termsof the mean sound velocity and gives explicit information aboutlattice vibrations [38]. It can be determined from the followingequation [39]:
of the number of the p electrons comprising the A element of the compounds.

M.B. Kanoun et al. / Solid State Sciences 12 (2010) 887–898 893
qD ¼hkB
�3n4p
�NAr
M
��1=3
vm (8)
where h is the Planck’s constant, kB is the Boltzmann’s constant, NA
is the Avogadro’s number, r is the density, M is the molecularweight, n is the number of atoms in the unit cell, and vm is the meansound velocity given by the following relations:
vl ¼
ffiffiffiffiffiffiffiffiffiffiffiffiffiffiffiffiffiffiffiffiffiffiffiffiffiffiffiffiffiffiffiffiffiffiffiffiffiffiffiffi�3BVRH þ 4GVRH
3r
�s(9)
vt ¼
ffiffiffiffiffiffiffiffiffiffiffiGVRH
r
s(10)
vm ¼"
13
2v3
t
þ 1v3
l
!#�1=3
(11)
where vl and vt are longitudinal and transverse elastic wave velocityof the polycrystalline materials and can be obtained using thepolycrystalline shear modulus and bulk modulus from Navier’sequation [40]. The calculated values of Debye temperatures arelisted in Table 4. Our results predict that all Zr2AC have a relativehigh qD value as to indicate that they possess a rather stiff latticeand therefore good thermal conductivity. The progressivedecreasing of mean sound velocities in each of s2p1, s2p2, s2p3 ands2p4 columns further explains the proneness of lowering Debyetemperatures along the same sequential order.
5. Electronic properties
In order to explain the electronic structure, we have calculatedthe total density of state (TDOS) using optimized geometry atequilibrium volume. As shown in Fig. 4, the DOS around the Fermilevel (EF) generally lies in a dip. This location may split bonding andantibonding states giving rise to stranger cohesion, the structurestability [41] and higher bulk modulus. However, the TDOS of thealloys with s2p3 A atoms presents a sharp peak at EF a configurationwhich is often associated with structure instability. The bondingscheme in 211 MAX phases can be summarized as follows: rela-tively weak M d–A p bonding just below the Fermi level EF andstronger (e.g. deeper in energy) M d–X p and M d–X s bondings.These trends are confirmed from the examination of the local l-projected (LDOS) of the selected compounds Zr2AC (A¼Al, In, Tl, Si,Ge, Sn, Pb, P, As, S) displayed in Fig. 5. Indeed, on the one hand, inthe energy range from �6 to �1.8 eV, the C p LDOS has the sameshape as the d states of the M atoms located each side of the Clayers. It is indicative of an hybridization between Zr d and C pstates and thus of a covalent interaction. On the other hand, in the
Table 5The calculated plasma energy in eV.
Compounds ZuxxP Zuzz
P
Zr2AlC 4.5192 1.1152Zr2SiC 4.6689 3.8263Zr2PC 4.8070 2.4804Zr2SC 3.1617 2.0763Zr2GeC 1.7438 0.6392Zr2AsC 1.6862 0.9304Zr2InC 4.3172 1.5953Zr2SnC 5.0901 3.8676Zr2TlC 4.4690 1.6860Zr2PbC 5.2109 3.1736
energy window from �2.5 to �0.6 eV, the A 5p states interactmainly with the Zr d states. But these Zr d–A p hybrids are higher inenergy than the Zr d–C p ones (e.g. closer to the Fermi level) sug-gesting that M–C bonds are stronger than Zr–A bonds. It is thisstrong Zr d–C p hybridization which stabilizes the structure ofZr2AC.
Indeed, for the compounds whose A electronic configuration iss2p1 or s2p2, EF is found to be located in a dip above a Zr d–A phybrid and below the broad Zr d unfilled band. Generally, the pstates of the A atom are shifted to lower energy as the filling of thep band is increased. Therefore, the Zr d–A p hybrids are located atincreasingly lower energy when the A atom is shifted towards theright side of the periodic table. However, for Zr2SC, Zr 3d–S 2phybridization shifts downwards to about �3.5 eV, which is just atthe same energy as the Zr 3d–C 2p hybridization, which suggeststhat Zr–S bond in Zr2SC is strengthened compared to othercompounds. Such strong M–A bonding is unusual in the MAXphases studied so far. In the case of P or As, the LDOS shows thatthe two hybrids Zr d–P p and Zr d–As p are located exactly at thesame energy as the Zr d–C p hybrid. Thus, that column of theperiodic table clearly marks a separation between two differentregimes. Moreover, from the total DOS values at the Fermi level(EF) reported in Table 1, it is obvious that all alloys have a metalliccharacter. As shown in Table 1, these values are for most of thembelow 4 states eV�1. As a general trend, it is observed that theTDOS at EF increases with the p-state filling of the A element. Itpresents a maximum for Zr2AsC and Zr2PC with values above 4.5states eV�1, followed by a sharp decrease for Zr2SC. Thus, Fig. 6shows nicely the general trend that the metallicity of thecompound increases with the filling of the p states of the Aelement and that a sharp transition to a more ceramic-likebehavior occurs in the column of S, this behavior was alsoobserved in other series of MAX phases [15].
It is known that MAX phases are usually stacks of ‘hard’ M–Xbond and ‘soft’ M–A bond along c directions. We note that the Zr–Cbond strength is much stronger than Zr–A. However, in addition tothe Zr–C hybridization, there is also a strong interaction between Zrand A atoms. This means that the ‘soft’ Zr–C bond is strengthened inZr2AC. In previous sections, we have obtained that the strength-ening effect contributed considerably to the increase in bulkmodulus and shear modulus of MAX phase. According to thecorrelation between the shear modulus, bulk modulus and thehardness, it can be expected that Zr2AlC will possess high hardnesscompared others compounds. It is clear that a covalent interactionoccurs between the constituting elements due to the fact that statesare degenerate with both angular momentum and lattice site, andalso due to the difference in electronegativity between thecomprising elements, some ionic character can be expected. In fact,the bonding character may be described as a mixture of covalent–ionic and, due to the d-resonance in the vicinity of the Fermi level,be partly metallic.
6. Optical properties
A study of the optical properties of solids has been an interestingresearch topic, both in basic research as well as for industrialapplications. While for the former the origin and nature of differentexcitation processes are of fundamental interest, the latter canmake use of them in many optoelectronic devices. Therefore opticalproperties bring together experiment and theory. The calculation of32(u) requires energy eigenvalues and electron wave functions.These are natural outputs of a band structure calculation. The inter-band transitions of the dielectric function can be split into directand indirect transitions. We neglect the indirect inter-band tran-sitions involving scattering of phonons that are expected to give

Fig. 7. (Color online) Calculated dispersions of imaginary parts of 32xx(u) and 32
zz(u).
M.B. Kanoun et al. / Solid State Sciences 12 (2010) 887–898894
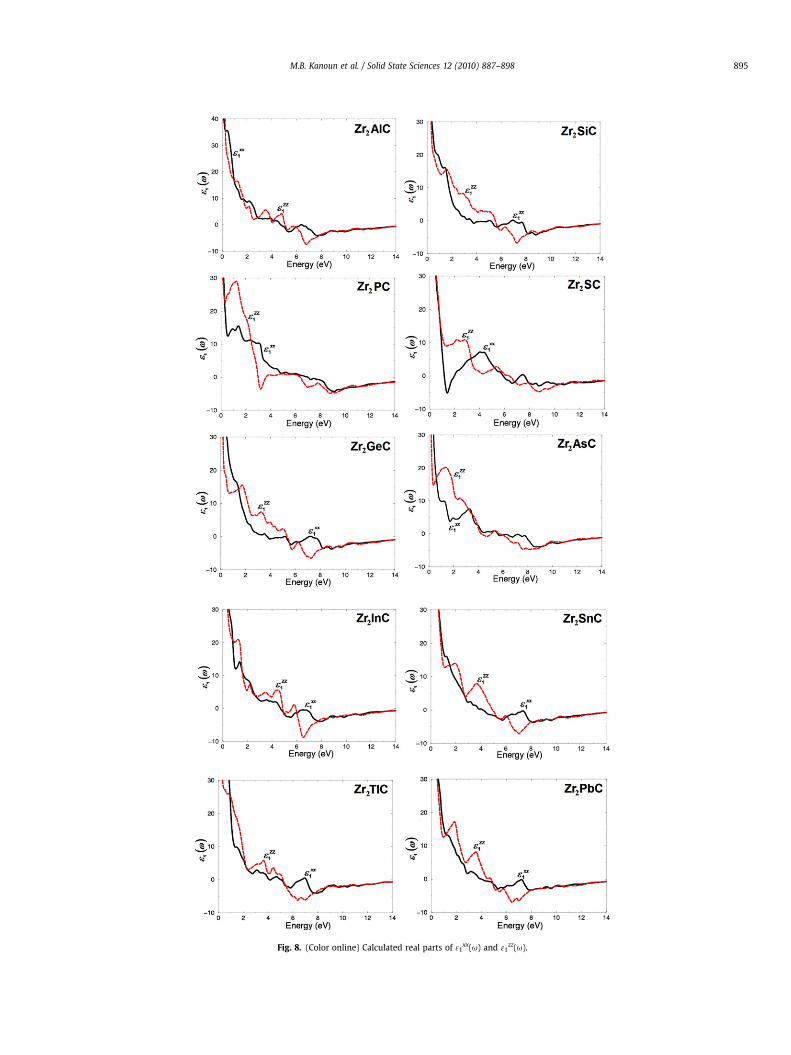
Fig. 8. (Color online) Calculated real parts of 31xx(u) and 31
zz(u).
M.B. Kanoun et al. / Solid State Sciences 12 (2010) 887–898 895

Fig. 9. (Color online) the calculated reflectivity spectra Rxx(u) and Rzz(u).
M.B. Kanoun et al. / Solid State Sciences 12 (2010) 887–898896
M.B. Kanoun et al. / Solid State Sciences 12 (2010) 887–898 897
a small contribution to 3(u) [42]. To calculate the direct inter-bandcontributions to the imaginary part of the dielectric function 32(u),it is necessary to perform summation up all possible transitionsfrom the occupied to the unoccupied states.
These compounds are crystallized in the P63/mmc space group.This symmetry group has two dominant independent componentsof the dielectric tensor. The corresponding dielectric functions are32
xx(u) and 32zz(u) corresponding to the applied electric field (cor-
responding to light polarization) parallel and perpendicular to thecrystallographic c-axis. Taking the appropriate transition matrixelements into account, we calculated the imaginary part of thedielectric functions 32(u) using the expressions given in the Refs.[43–45]:
3zz2 ðuÞ ¼
12mu2
ZBZ
Xnn0
jPZnm0 ðkÞj
2dSk
Vunm0 ðkÞ(12)
3xx2 ðuÞ ¼
6mu2
ZBZ
Xnn0
hPXnm0 ðkÞj
2 þ PYnm0 ðkÞj
2idSk
Vunm0 ðkÞ(13)
The above expressions are written in atomic units with e2¼1/m¼ 2 and Z¼ 1, where u is the photon energy. Pnm
0X(k) and Pnm0Z(k)
are the X and Z component of the dipolar matrix elements betweeninitial jnkD and final jn0kD states with their eigenvalues En(k) andEn0(k), respectively. un
0n(k) is the energy difference, where:
un0m(k)¼ En(k)� En
0(k) and Sk is a constant energy surface withSk¼ {k;unn
0(k)¼u}. The integration is done over the first irreduc-ible Brillouin zone (IBZ). For the metallic materials there are twocontribution to 3(u), namely intra-band and inter-band transitions.As the investigated compounds are metallic we must include theDrude term (intra-band transitions) [46]:
3xx2 ðuÞ ¼ 3xx
2interðuÞ þ 3xx2intraðuÞ (14)
where
3xx2intraðuÞ ¼
uxxp s
u1þ u2s2
� (15)
where up is the plasma frequency [47] and s is the mean free timebetween collisions.
uxx2p ¼ 8p
3
Xkn
wxx 2kn dð3knÞ (16)
where 3nk(u) is En(k)� EF and wkn is the electron velocity (in basalplane).
Similarly expressions for the parallel component can be written.The calculated values of Zup corresponding to the two polarizationsparallel and perpendicular to c-axis are given in Table 5. It is clearthat a strong anisotropy is present. The calculations of 32
xx(u) and32
zz(u) were performed with and without the inclusion of theDrude term. Fig. 7, illustrates the variation of the imaginary part ofthe frequency dependent electronic dielectric function 32(u). Theeffect of the Drude term is significant for energies less than 1 eV.The sharp rise at low energies is due to the Drude term. The spectralbroadening is taken to be 0.1 eV so as bring out all the structures[48]. The calculated imaginary part 32(u) can be used to describethe transitions between the occupied and unoccupied bands. It canbe seen from 32(u) spectra that the spectral features of the opticalproperties for the investigated compounds are looking differentthat is attributed to the fact that the band structures of thesecompounds possess different dispersion as a consequence theallowed optical transition are occurs between different states,
resulting in different dispersion of the spectral features of theoptical susceptibilities suggesting that moving through the periodictable from left to right replacing the element Al by Si, P, S, Ge, As, In,Sn, Tl, and Pb, show there is a considerable change in the dispersionof the spectral features of the optical properties. We shouldemphasize that there is a considerable anisotropy between 32
xx(u)and 32
zz(u). The peaks in the optical response are caused by theallowed electric-dipole transitions between the valence andconduction bands. In order to identify these structures we shouldconsider the magnitude of the optical matrix elements. Theobserved structures would correspond to those transitions whichhave large optical matrix dipole transition elements. From theimaginary parts of the dielectric function 32
xx(u) and 32zz(u) the real
parts 31xx(u) and 31
zz(u) can be calculated using Kramers–Kronigrelations [49]. Our calculated real parts are illustrated in Fig. 8.Again we find a considerable anisotropy between 31
xx(u) and31
zz(u).For more details about the spectral features of the optical
properties of the investigated compounds we have calculated thespectral dependences for reflectivity spectra R(u). Fig. 9, shows thecalculated reflectivity spectra. We notice that a reflectivitymaximum between 12.0 and 14.0 eV arises from inter-band tran-sitions. A reflectivity minimum at energies ranging from about22.0–25.0 eV confirms the occurrence of a collective plasma reso-nance. The depth of the plasma minimum is determined by theimaginary part of the dielectric function at the plasma resonanceand is representative of the degree of overlap between the inter-band absorption regions. We should note that at high energies (ataround 35.0 eV) this compound shows a rapidly increasingreflectivity.
7. Conclusion
In summary, this work reports on a study of electro-structuralcorrelation, elastic and optical properties of Zr2AC (A¼Ti, In, Tl, Si,Ge, Sn, Pb, P, As, S) through first principles all-electron full-potential linearized augmented plane wave calculations. It hasbeen shown that the structural parameters obtained after relax-ation are in good agreement with the experimental ones. Ourresults show that the increase of p electrons from A elementswhen moving rightwards along the periodic table results in anincrease of the bulk modulus up to the s2p3 column. The elasticconstants were calculated by the strain-energy method. Ouranalysis of constants shows that all the Zr2AC phases including thehypothetical compounds are intrinsically and mechanically stable.It is interesting to note that all Zr2AC compounds are character-ized by a profound and larger anisotropy for the shear planesdescribed above, except Zr2PbC. We have also calculated the shearmodulus, Young’s modulus, and Poisson’s ratio for ideal poly-crystalline Zr2AC ceramics. The results show that for allcompounds BVRH>GVRH, which means that a parameter limitingthe stability of these materials is the shear modulus GVRH.Furthermore, we have derived the sound velocity and the Debyetemperatures for the Zr2AC phases. It is interesting to mentionthat the origin of the stability of the Zr2AC phases is related to Zrd–A p and Zr d–C p bonds. For the A elements with the lowest filledp states, the Zr d–C p bonds are lower in energy and stiffer than theZr d–A p bonds. When we observe more carefully, the calculatedoptical properties via the calculated optical spectrum and theoptical absorption, we may conclude that the slight differencesobserved in these curves are mainly attributed to the fact that theband structures for these compounds are different and haveconsequences in optical transitions resulting in changes the peakspositions.

M.B. Kanoun et al. / Solid State Sciences 12 (2010) 887–898898
Acknowledgments
The calculations using Wien2k code have been performed onthe Interuniversity Scientific Computing Facility (ISCF), installed atthe FUNDP for which the authors gratefully acknowledge thefinancial support of the F.R.S.-FRFC and of the ‘‘Loterie Nationale’’under Contract No. 2.4.617.07.F, and of the FUNDP (Namur,Belgium). M.B.K and S.G.S acknowledge F. Wautelet (ISCF-FUNDP)for permanent computer assistance. Alberto Otero de la Roza fromUniversidad de Oviedo (spain) is acknowledged for providing usRunwien code.
References
[1] M.W. Barsoum, Prog. Solid State Chem. 28 (2000) 201.[2] B. Manoun, S.K. Saxena, H.P. Liermann, R.P. Gulve, E. Hoffman, M.W. Barsoum,
G. Hug, C.S. Zha, Appl. Phys. Lett. 85 (2004) 1514.[3] M.W. Barsoum, T. Zhen, S.R. Kalidindi, M. Radovic, A. Murugaiak, Nat. Mater. 2
(2003) 107.[4] T. El-Raghy, A. Zavaliangos, M.W. Barsoum, S.R. Kalidindi, J. Am. Ceram. Soc. 80
(1997) 513.[5] C.J. Gilbert, D.R. Bloyer, M.W. Barsoum, T. El-Raghy, A.P. Tomsia, R.O. Ritchie,
Scr. Mater. 42 (2000) 761.[6] M.W. Barsoum, G. Yaroschuk, S. Tyagi, Scr. Mater. 37 (1997) 1583.[7] H. Yoo, M.W. Barsoum, T. El-Raghy, Nature (London) 407 (2000) 581.[8] M.W. Barsoum, T. El-Raghy, J. Am. Ceram. Soc. 79 (1996) 1953.[9] S.E. Lofland, J.D. Hettinger, K. Harrell, P. Finkel, S. Gupta, M.W. Barsoum,
G. Hug, Appl. Phys. Lett. 84 (2004) 4.[10] J.M. Schneider, Z. Sun, R. Mertens, F. Uestel, R. Ahuja, Solid State Commun. 130
(2004) 445.[11] M.B. Kanoun, M. Jaouen, J. Phys. Condens. Matter 20 (2008) 085211.[12] Z. Sun, D. Music, R. Ahuja, S. Li, J.M. Schneider, Phys. Rev. B 70 (2004) 092102.[13] D. Music, Z. Sun, R. Ahuja, J.M. Schneider, Phys. Rev. B 73 (2006) 134117.[14] J.M. Schneider, D. Music, Z. Sun, J. Appl. Phys. 97 (2005) 066105.[15] G. Hug, Phys. Rev. B 74 (2006) 184113.[16] M.B. Kanoun, S. Goumri-Said, M. Jaouen, J. Phys. Condens. Matter 21 (2009)
045404.[17] P. Blaha, K. Schwarz, G.K.H. Madsen, D. Kvasnicka, J. Luitz, An Augmented-
Plane-Waveþ Local Orbitals Program for Calculating Crystal Properties. K.Schwarz, Techn Wien, Austria, 2001.
[18] R. Dreizler, E.K.U. Gross, Density-Functional Theory. Springer-Verlag, NewYork, 1990.
[19] Z. Wu, R.E. Cohen, Phys. Rev. B 73 (2006) 235116.[20] F.D. Murnaghan, Proc. Natl. Acad. Sci. U.S.A. 30 (1944) 244.[21] F. Birch, Phys. Rev. B 71 (1947) 809;
J. Geophys. Res. 86 (1978) 1257.[22] M.W. Barsoum, in: K.H.J. Buschow, R.W. Cahn, M.C. Flemings, E.J. Kramer,
S. Mahajan, P. Veyssiere (Eds.), Encyclopedia of Materials Science and Tech-nology, Elsevier, Amsterdam, 2006.
[23] G. Hug, M. Jaouen, M.W. Barsoum, Phys. Rev. B 71 (2005) 024105.[24] A.O. de la Roza, V. Luana, Comput. Phys. Commun. 180 (2009) 800.[25] F.I. Fedoras, Theory of Elastic Waves in Crystals. Oxford University Press, New
York, 1985, pp. 213–277.[26] M. Born, K. Hang, Dynamical Theory and Experiments I. Springer Verlag
Publishers, Berlin, 1982.[27] Z. Sun, S. Lib, R. Ahuja, J.M. Schneider, Solid State Commun. 129 (2004) 589.[28] W. Voigt, Lehrbuch der Kristallphysik. Teubner, Leipzig, 1928.[29] L. Lundstorm, S. Rundqvist, Borides, Silicides and Phosphides. Methuen, Lon-
don, 1965.[30] B. Post, Refractory Binary Borides, Metallo-Boron Compounds and Boranes.
Wiley, New York, 1964.[31] J. Goldshmidt, Interstitial Alloys. Butterworths, London, 1967.[32] M.I. Matkovich (Ed.), Boron and Refractory Borides, Springer, Berlin, 1977.[33] R. Hill, Proc. Phys. Soc. Lond. A 65 (1952) 349.[34] A. Reuss, Z. Angew. Math. Mech. 9 (1929) 49.[35] S.F. Pugh, Philos. Mag. 45 (1954) 833.[36] J. Haines, J.M. Leger, G. Bocquillon, Annu. Rev. Mater. Res. 31 (2001) 1.[37] I.R. Shein, A.L. Ivanovskii, J. Phys. Condens. Matter 20 (2008) 415218.[38] A.M. Ibrahim, Nucl. Instrum. Methods Phys. Res. B 34 (1988) 135.[39] O.L. Anderson, J. Phys. Chem. Solids 24 (1963) 909.[40] E. Schreiber, O.L. Anderson, N. Soga, Elastic Constants and Their Measure-
ments. McGraw-Hill, New York, 1973.[41] J.H. Xu, A.J. Freeman, Phys. Rev. B 40 (1986) 11927.[42] N.V. Smith, Phys. Rev. B 3 (1862) 1971.[43] S. Hufner, R. Claessen, F. Reinert, Th. Straub, V.N. Strocov, P. Steiner, J. Electron
Spectrosc. Relat. Phenom. 100 (1999) 191;R. Ahuja, S. Auluck, B. Johansson, M.A. Khan, Phys. Rev. B 50 (1994) 2128.
[44] A.H. Reshak, I.V. Kityk, S. Auluck, J. Chem. Phys. 129 (2008) 074706.[45] M.B. Kanoun, S. Goumri-Said, A.H. Reshak, Comput. Mater. Sci. 47 (2009) 491.[46] F. Wooten, Optical Properties of Solids. Academic Press, New York and London,
1972.[47] B. Chakraborrty, W.E. Pickett, P.B. Allen, Phys. Rev. B 14 (1972) 3227.[48] A.H. Reshak, Xuean Chen, S. Auluck, I.V. Kityk, J. Chem. Phys. 129 (2008)
204111.[49] H. Tributsch, Z. Naturforsch. 32a (1977) 972.