Guidance on the Application of the CLP Criteria - Molybdenum ...
Upload
khangminh22Category
view
2download
0
Graduate Theses, Dissertations, and Problem Reports
2005
Characterization and investigation of molybdenum carbides on Characterization and investigation of molybdenum carbides on
activated carbon as hydrogenation catalysts activated carbon as hydrogenation catalysts
Christopher H. Clark West Virginia University
Follow this and additional works at: https://researchrepository.wvu.edu/etd
Recommended Citation Recommended Citation Clark, Christopher H., "Characterization and investigation of molybdenum carbides on activated carbon as hydrogenation catalysts" (2005). Graduate Theses, Dissertations, and Problem Reports. 1659. https://researchrepository.wvu.edu/etd/1659
This Thesis is protected by copyright and/or related rights. It has been brought to you by the The Research Repository @ WVU with permission from the rights-holder(s). You are free to use this Thesis in any way that is permitted by the copyright and related rights legislation that applies to your use. For other uses you must obtain permission from the rights-holder(s) directly, unless additional rights are indicated by a Creative Commons license in the record and/ or on the work itself. This Thesis has been accepted for inclusion in WVU Graduate Theses, Dissertations, and Problem Reports collection by an authorized administrator of The Research Repository @ WVU. For more information, please contact [email protected].

Characterization and Investigation of Molybdenum Carbides on Activated Carbon as Hydrogenation Catalysts
By
Christopher H. Clark
A THESIS
Submitted to the College of Engineering and Mineral Resources at West Virginia University
in partial fulfillment of the requirements for the degree of
Master of Science in
Chemical Engineering
Edwin L. Kugler, Chair Dady B. Dadyburjor Joseph A. Shaeiwitz
Morgantown, West Virginia 2005
Keywords: molybdenum carbide, benzene hydrogenation, x-ray diffraction, temperature-programmed-reaction, carbon-monoxide chemisorption

Abstract
Characterization and Investigation of Molybdenum Carbides on Activated Charcoal as a Hydrogenation Catalysts
Christopher H. Clark
The formation of Mo2C and MoC supported on activated carbon was investigated in
three different flowing reaction gas environments: H2, He, and CO. Additionally, benzene
hydrogenation activity was studied for the catalysts reduced in each of these three different gas
environments.
It was found through in-situ x-ray diffraction (XRD) that reducing in H2, ammonium
heptamolybdate impregnated on activated carbon yielded 1-3 nm Mo2C particles. When the
same material was calcinced in inert, 9 nm Mo2C particles were formed. If the reduction gas
were CO, MoC particles having size less than 3 nm were formed. In all three reduction
environments, the in-situ XRD revealed that MoO2 reduced to molybdenum carbide, without the
appearance of Mo0. Data from temperature programmed reaction (TPR) spectra compared to the
in-situ XRD patterns indicates that the carbon support is the source for carburization.
Only the catalyst reduced in H2 has significant activity for benzene hydrogenation.
Furthermore, these Mo2C-on-carbon catalysts have only a small range of reduction temperatures,
675-825ºC, for which they are active. Additionally, as soak time at reduction temperature
increases, the catalyst’s initial activity decreases. Activity seems to be correlated to the
appearance of graphitic carbon in the XRD patterns of the spent catalyst.

iii
Dedicated to my grandfather, Paul Franklin

iv
Acknowledgements
To my advisors Dr. Edwin Kugler and Dr. Dady Dadyburjor I am extremely thankful
for the help, knowledge, advice, solace, and praise they gave me in the good times and the bad.
For all his help not only as the third member of my committee, but for his “sage-like” wisdom in
all things involving chemical engineering I would like to thank Dr. Joseph Shaeiwitz.
I am grateful for ever helpful conversations and assistance by Dr. Tapan Das that
would lead to experimental success and fundamental understanding of experimental systems. To
the current members of the West Virginia University reactions engineering group, Dr. Wenping
Ma, Huifang Shao, and James Wright, for all their help in both formulating ideas and running
experiments. The financial support from US Department of Energy under cooperative agreement
contract DE-FC26-99FT40540 with Consortium for Fossil Fuel Liquefaction Science is
gratefully acknowledged and my personal financial support from the generous donations to
WVU by George and Carolyn Berry.
I would like to thank Dr. Jonathan Hanson at Brookhaven National Laboratory in
Upton, NY for all his help and advice with x-ray diffraction run at the National Synchrotron
Light Source. Additionally, I would like to thank Todd Gardner at the National Energy and
Technology Laboratory in Morgantown, WV for performing temperature programmed reaction
coupled with mass spectroscopy on my samples.
I would like to thank Jim Hall, Bonita Helmick, and Linda Rogers for their patience in
helping me with all the crucial non-academic issues that no graduate student can avoid. Finally,
I would like to thank my fellow graduate students and the faculty for making the last two years at
WVU productive and enjoyable.
v
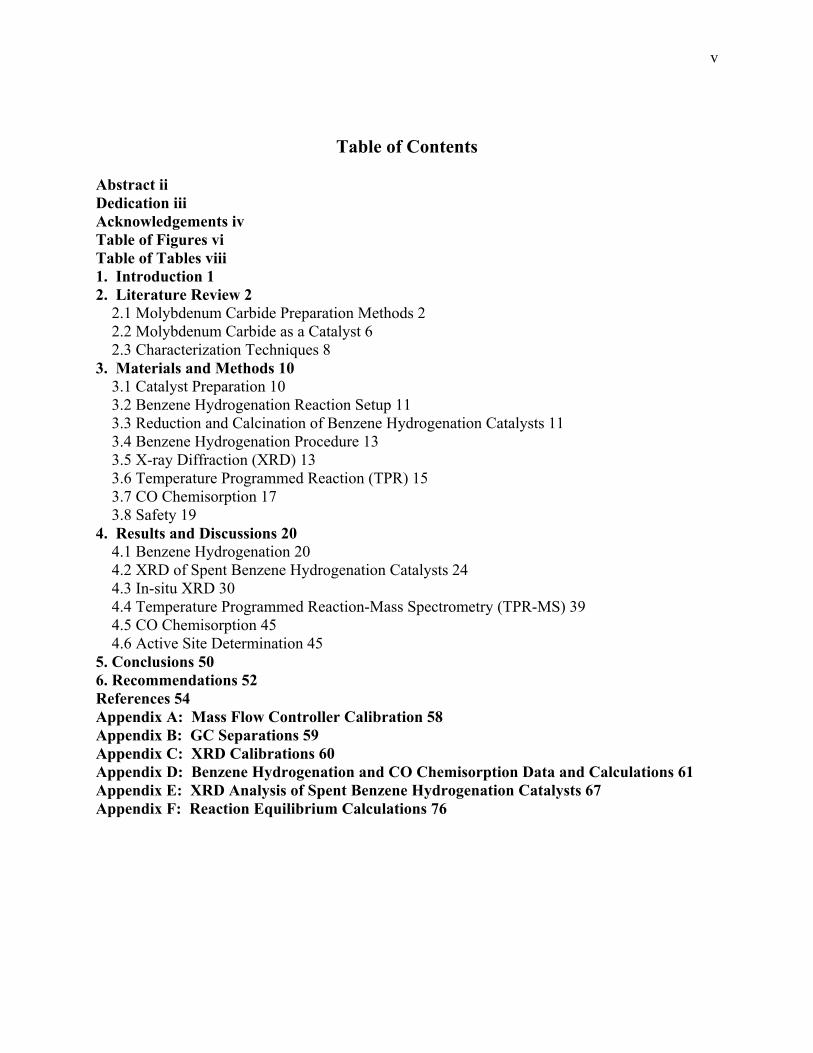
Table of Contents Abstract iiDedication iii Acknowledgements iv Table of Figures vi Table of Tables viii 1. Introduction 1 2. Literature Review 2
2.1 Molybdenum Carbide Preparation Methods 2 2.2 Molybdenum Carbide as a Catalyst 6 2.3 Characterization Techniques 8
3. Materials and Methods 10 3.1 Catalyst Preparation 10 3.2 Benzene Hydrogenation Reaction Setup 11 3.3 Reduction and Calcination of Benzene Hydrogenation Catalysts 11 3.4 Benzene Hydrogenation Procedure 13 3.5 X-ray Diffraction (XRD) 13 3.6 Temperature Programmed Reaction (TPR) 15 3.7 CO Chemisorption 17 3.8 Safety 19
4. Results and Discussions 20 4.1 Benzene Hydrogenation 20 4.2 XRD of Spent Benzene Hydrogenation Catalysts 24 4.3 In-situ XRD 30 4.4 Temperature Programmed Reaction-Mass Spectrometry (TPR-MS) 39 4.5 CO Chemisorption 45 4.6 Active Site Determination 45
5. Conclusions 50 6. Recommendations 52 References 54 Appendix A: Mass Flow Controller Calibration 58 Appendix B: GC Separations 59 Appendix C: XRD Calibrations 60 Appendix D: Benzene Hydrogenation and CO Chemisorption Data and Calculations 61 Appendix E: XRD Analysis of Spent Benzene Hydrogenation Catalysts 67 Appendix F: Reaction Equilibrium Calculations 76

vi
Table of Figures
Figure 1: Plot of Equilibrium Conditions for Equation 1 and Equation 2. Plot constructed by Lee et al. (4) 3
Figure 2: Schematic of Powder Diffraction Measurment at NSLS Beamline X7B (figure provided by Jonathan Hanson at NSLS) 9
Figure 3: Flow diagram of catalyst test unit constructed for use in testing benzene hydrogenation activity 12
Figure 4: Labeled pictorial diagram of in-situ XRD flow cell (35) 14 Figure 5: Flow diagram of TPR-MS apparatus at the National Energy and Technology
Laboratory in Morgantown, WV. 16 Figure 6: Flow diagram of chemisorption and TPR apparatus constructed in the West Virginia
University reactions engineering laboratory 18 Figure 7: Effect of time on stream and final reduction temperature on the rate of disappearance
of benzene for molybdenum-on-carbon Samples reduced in UHP H2 and held at final temperature for 15 minutes (for data comparison for commercial 5% Pt/Al2O3 is also shown) 21
Figure 8: Effect of time on stream and final reduction temperature on the rate of disappearance of benzene for molybdenum-on-carbon Samples reduced in UHP H2 and held at final temperature for 15 minutes 22
Figure 9: Effect of time on stream and soak time at final reduction temperature (825ºC) on the rate of disappearance of benzene for molybdenum-on-carbon catalysts 23
Figure 10: XRD pattern of molybdenum-on-carbon catalyst tested for benzene hydrogenation, catalyst was reduced at 825ºC and held at 825º C for 60 minutes 25
Figure 11: XRD pattern of molybdenum-on-carbon catalyst tested for benzene hydrogenation, catalyst was reduced at 825ºC and held at 825º C for 15 minutes 27
Figure 12: Plot illustrating growth of graphite XRD peak at 26.2º 2θ with increasing time at maximum reduction temperature (825ºC) 28
Figure 13: XRD Pattern of molybdenum-on-carbon catalyst tested for benzene hydrogenation, catalyst was reduced at 775ºC and held at 775ºC for 15 minutes 29
Figure 14: In-situ XRD scans of the reduction of 18% Mo/C to 825º at 5ºC per minute in 5% H2 (balance He). Each scan represents 25ºC of heating 31
Figure 15: XRD Profile, with peak fitting, of final product of in-Situ reduction of 18% Mo/C in 5% H2 (balance He) 33
Figure 16: In-situ XRD scans of the reduction of 24 % Mo/C to 825º at 5ºC per minute in He. Each scan represents 25ºC of heating up to 825ºC then held at 825º for 30 minutes 34
Figure 17: XRD profile, with peak fitting, of final product of in-Situ calcination 24% Mo/C in He 36
Figure 18: Plot of in-situ XRD scans of the reduction of 21% Mo/C to 825º at 5ºC per minute in 5% CO (balance He). Each scan represents 25ºC of Heating 37
Figure 19: Profile, with peak fitting, of final product of in-Situ calcination 21% Mo/C in 5%CO (balance He) 38
Figure 20: TPR-MS Spectra of Mo/C Reduced in 5% H2 (balance Ar) from 25ºC to 900ºC at 10ºC per minute 40

vii
Figure 21: TPR-MS Spectra of Mo/C calcined in Ar from 25ºC to 900ºC at 10ºC per minute, then held at 900ºC for 130 minutes (plot of only 40 minutes of 130-minute temperature soak at 900ºC) 41
Figure 22: TPR-MS spectra of Mo/C calcined in 10% CO (balance Ar) from 25ºC to 900ºC at 10ºC per minute, then held at 900ºC for 130 minutes (plot of only 20 minutes of 130-minute temperature soak at 900ºC) 44
Figure 23: Pulse CO chemisorption over 0.1078g Pressure Chemical 5% Pt/Al2O3 reduced in H2 to 425ºC 46
Figure 24: Pulse CO chemisorption over 0.1074 g molybdenum-on-carbon calcined in flowing Ar to 615ºC 47
Figure 25: Pulse CO chemisorption over 0.1258 g molybdenum-on-carbon, prepared through reduction in flowing UHP H2 to 825ºC at 10º per minute and held at 825ºC for 15 minutes 48
Figure 26: Calibration of MFC for UHP H2 Flow 58 Figure 27: Calibration of MFC for 5% CO/balance He 58 Figure 28: Chromatograph of 1μL injection of a 1/1 mixture of benzene and cyclohexane, where
the GC oven was kept isothermal at 120ºC and data was collected for 5 min. 59 Figure 29: Effect of time-on-stream on the rate of disappearance of benzene for Mo/C catalysts
with varying final reduction temperature with exponential curve fitting to find initial rate of benzene disappearance 65
Figure 30: Effect of time on stream on rate of disappearance of benzene for Mo/C catalysts with varying soak time at final reduction temperature (825ºC) with exponential curve fitting to find in rate of benzene disappearance 66
Figure 31: XRD pattern of Mo/C catalyst tested for benzene hydrogenation, catalyst was reduced at 675ºC and held at 675º C for 15 minutes 68
Figure 32: XRD pattern of Mo/C catalyst tested for benzene hydrogenation, catalyst was reduced at 725ºC and held at 725º C for 15 minutes 69
Figure 33: XRD pattern of Mo/C catalyst tested for benzene hydrogenation, catalyst was Reduced at 775ºC and held at 775º C for 15 minutes 70
Figure 34: XRD pattern of Mo/C catalyst tested for benzene hydrogenation, catalyst was reduced at 825ºC and held at 825º C for 0 minutes 71
Figure 35: XRD pattern of Mo/C catalyst tested for benzene hydrogenation, catalyst was reduced at 825ºC and held at 825º C for 15 minutes 72
Figure 36: XRD pattern of Mo/C catalyst tested for benzene hydrogenation, catalyst was reduced at 825ºC and held at 825º C for 30 minutes 73
Figure 37: XRD pattern of Mo/C catalyst tested for benzene hydrogenation, catalyst was reduced at 825ºC and held at 825ºC for 60 minutes 74
Figure 38: XRD Pattern of Mo/C catalyst tested for benzene hydrogenation, catalyst was reduced at 875ºC and held at 875º C for 15 minutes 75
viii
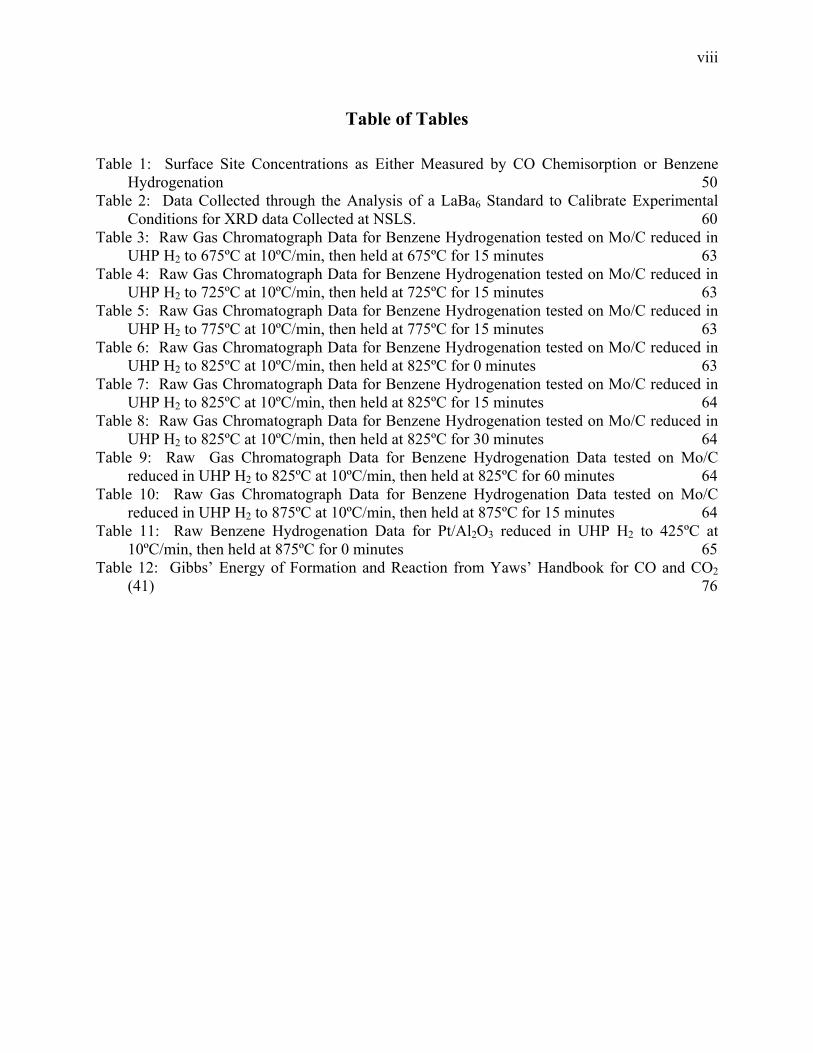
Table of Tables
Table 1: Surface Site Concentrations as Either Measured by CO Chemisorption or Benzene Hydrogenation 50
Table 2: Data Collected through the Analysis of a LaBa6 Standard to Calibrate Experimental Conditions for XRD data Collected at NSLS. 60
Table 3: Raw Gas Chromatograph Data for Benzene Hydrogenation tested on Mo/C reduced in UHP H2 to 675ºC at 10ºC/min, then held at 675ºC for 15 minutes 63
Table 4: Raw Gas Chromatograph Data for Benzene Hydrogenation tested on Mo/C reduced in UHP H2 to 725ºC at 10ºC/min, then held at 725ºC for 15 minutes 63
Table 5: Raw Gas Chromatograph Data for Benzene Hydrogenation tested on Mo/C reduced in UHP H2 to 775ºC at 10ºC/min, then held at 775ºC for 15 minutes 63
Table 6: Raw Gas Chromatograph Data for Benzene Hydrogenation tested on Mo/C reduced in UHP H2 to 825ºC at 10ºC/min, then held at 825ºC for 0 minutes 63
Table 7: Raw Gas Chromatograph Data for Benzene Hydrogenation tested on Mo/C reduced in UHP H2 to 825ºC at 10ºC/min, then held at 825ºC for 15 minutes 64
Table 8: Raw Gas Chromatograph Data for Benzene Hydrogenation tested on Mo/C reduced in UHP H2 to 825ºC at 10ºC/min, then held at 825ºC for 30 minutes 64
Table 9: Raw Gas Chromatograph Data for Benzene Hydrogenation Data tested on Mo/C reduced in UHP H2 to 825ºC at 10ºC/min, then held at 825ºC for 60 minutes 64
Table 10: Raw Gas Chromatograph Data for Benzene Hydrogenation Data tested on Mo/C reduced in UHP H2 to 875ºC at 10ºC/min, then held at 875ºC for 15 minutes 64
Table 11: Raw Benzene Hydrogenation Data for Pt/Al2O3 reduced in UHP H2 to 425ºC at 10ºC/min, then held at 875ºC for 0 minutes 65
Table 12: Gibbs’ Energy of Formation and Reaction from Yaws’ Handbook for CO and CO2 (41) 76

1
1. Introduction
In recent years, West Virginia University, along with many schools across the country
and around the world, have sought to investigate the synthesis, characteristics, and potential
reaction niches of molybdenum-based catalysts. One such reaction is the platinum-like behavior
of molybdenum carbide for hydrogenation reactions (1). Due to its low cost, in comparison to
platinum, molybdenum carbide is worthy of further investigation.
There are currently several proposed methods for preparing molybdenum carbides. The
specific method of interest involves the reduction of ammonium heptamolybdate impregnated on
activated carbon (2,3). Using H2 as a reduction gas, this method has been shown to form small
particles of Mo2C between 700-800ºC. Through Debye-Scherrer peak-broadening analysis of
the x-ray diffraction pattern, the Mo2C formed has been shown to have average particle sizes of 3
nm (2). Further studies done at the Université of Pierre et Marie Curie and West Virginia
University show that larger-particle Mo2C can be formed between 750-850ºC by using the same
impregnation method for catalyst preparation, but the catalyst pretreatment environment is
changed from H2 to Ar (2). Work done to date at West Virginia University has revealed that
MoC, a cubic crystal-structure form of molybdenum carbide referenced less often than Mo2C,
can also be formed. This MoC on activated carbon catalyst is prepared using the same
impregnation method, but the pretreatment gas is changed to CO and the MoC is formed between
550-650ºC.
It is the purpose of this research to characterize these molybdenum-on-carbon catalysts
prepared under three different flowing gas environments: H2, inert, and CO. Methods of
characterization include x-ray diffraction for identification of bulk phases, CO chemisorption for

2
titration of the surface reaction sites, and kinetic studies of the benzene hydrogenation reaction to
provide evidence of noble-metal-like activity.
2. Literature Review
2.1 Molybdenum Carbide Preparation Methods
Investigation of Group VI B transition metal carbides was pioneered by Boudart’s group
at Stanford University. This group proposed that these carbides could be made through the direct
caburization and reduction of unsupported MoO3 by flowing a gas mix of 20% CH4 (balance H2)
over the sample at high temperature (4). This reduction method yields hexagonal Mo2C at a
temperature of approximately 700ºC. This reduction was first observed through a temperature-
programmed reaction (TPR) in 20% CH4 (balance H2) performed from room temperature to
825ºC at 60ºC per hour (4). The Stanford group later reported that this process yields Mo2C
particles of 11.5 nm, as found from XRD peak broadening (5). In this work done at Stanford,
there is much care taken to keep graphitic carbon from occluding the molybdenum carbide
surface. Equation 1 is the mechanism for the carburization of MoO3 to Mo2C, as proposed by
Boudart’s group (4). Equation 2 gives a possible side reaction thought to cause catalyst
deactivation by graphitic carbon formation. Figure 1 shows the equilibrium relationship between
Equation 1 and Equation 2 at atmospheric pressure as shown by Lee et al. (4). In Figure 1, curve
(a) represents equilibrium data for Equation 1 and curve (b) represents equilibrium data for
Equation 2. Where the x-axis is temperature in K and the y-axis is % CH4 (balance H2). For
carburization conditions on the left of curve (a) only Mo and CH4 should be observed. If
temperature is increased, and carburization conditions move beyond curve (a), but below curve

3
(b) only Mo2C and CH4 should be observed. Finally, if temperature is high, where carburization
conditions are above line (b), Mo2C and graphite should be observed.
24 2)( HgraphiteCCH +⇔ (1)
224 222 HCMoMoCHMo ++⇔+ (2)
Figure 1: Plot of Equilibrium Conditions for Equation 1 and Equation 2. Plot constructed by Lee et al. (4)
From Figure 1, it was reported that the optimum balance between molybdenum carbide
formation from Mo0 and prevention of graphite formation on the Mo2C occurred at a 20% CH4
(balance H2). Conditions were chosen for carburization to stay in the phase regime of Mo2C and
CH4.
Other methods of molybdenum carbide formation proposed by the Stanford Group
include the preparation of cubic MoC through doping MoO3 with a low concentration of Pt and
performing the same TPR in 20% CH4 (balance H2) (5). This method formed MoC at

4
approximately 700ºC. The particles formed in this method are very small, 3.4 nm as measured
by x-ray line broadening.
Yet another method proposed by the Stanford Group for forming cubic MoC, is first to
form Mo2N with flowing 20% NH3 (balance H2) up to 700ºC. After initially forming Mo2N, one
can form MoC using TPR in 20% CH4 (balance H2). This method forms MoC at approximately
700ºC (5). As these particles are 6 nm, as measured by x-ray line broadening, it is postulated
that small MoC particles are formed from small Mo2N precursors (5).
Similar TPR methods with 20% CH4 (balance H2) have been used to form Al2O3 -
supported Mo2C (6). This involves first impregnating γ-Al2O3 with ammonium heptamolybdate
(AHM), then calcining in air at 500ºC for 5h. The catalyst is then carburized using TPR in 20%
CH4/balance H2 up to 900ºC. This method yields 7.8 nm Mo2C particles, as measured by x-ray
line broadening. These supported Mo2C nanoparticles are formed at approximately 700ºC (6).
More recently, another method of Mo2C preparation was discovered by a group at
Université of Pierre et Marie Curie(2). This method does not utilize methane or MoO3. Instead
the Mo2C is prepared by impregnating activated carbon with AHM and then heating the sample
to 700ºC in flowing H2 (2,3). In yet unpublished work, x-ray diffraction peak broadening
predicts that the Mo2C particles formed by the West Virginia University group are 3 nm in size.
Furthermore, larger particles of Mo2C can be formed by simply pretreating the molybdenum
impregnated carbon catalyst in flowing inert gas.
Mordent et al. propose the following mechanism for the reduction of MoO2 on activated
carbon to Mo2C in inert gas (2):
122 −++⇔+ nn CHCOCOH (3)
222 HCOOHCO +⇔+ (4)

5
COCOC 22 ⇔+ (5)
422 CHHC ⇔+ (6)
OHCHHCO 2423 +⇔+ (7)
OHCMoHCHMoO 22242 42 +⇔++ (8)
It is proposed that water is present in the carbon support material reacts with carbon to form
carbon monoxide. The water then reacts with carbon monoxide, in Equation 4, to produce the
hydrogen needed for reduction. Methane can then be formed by the hydrogenation of carbon
(Equation 6) or the hydrogenation of CO (Equation 7). Finally, the methane and hydrogen react
with the molybdenum dioxide (Equation 8) to form Mo2C. The reaction in Equation 8 is similar
to that proposed for unsupported MoO3 particles (4).
The reaction scheme proposed by Mordenti et al. (Paris Group), Equations 3-8, is
significantly different than that proposed by the Stanford Group. The Paris Group’s mechanism
has Mo2C formed from MoO2. However, the Stanford Group has Mo2C formed from Mo0.
A recent unpublished investigation by the West Virginia University group has revealed
that cubic MoC can be formed by a new synthesis method. MoC is formed through the reduction
of a molybdenum-on-carbon catalyst in 5% CO (balance inert). The molybdenum –on-carbon
precursor material is prepared by impregnating AHM on activated carbon. Preliminary estimates
of particle size by x-ray peak broadening have shown that these particles are 3 nm or less (7).
The review of the literature shows that the study of molybdenum carbide catalysts has
focused on unsupported Mo2C having particle sizes ranging from 3.4-to-11.5 nm (5,6). It is then
interesting that the carbon-supported molybdenum-carbide catalysts of West Virginia University
have a smaller particle size, 1-3 nm size evident by scanning tunneling micrographs, on a support
that can offer high pore volume and surface area.

6
2.2 Molybdenum Carbide as a Catalyst
Boudart’s group at Stanford concluded that molybdenum carbide behaved in many ways
like a Group VIII metal (1), but noted that the activity of the catalyst was limited by the surface
area (4). They advocated that a synthesis method should be developed that yields high-surface-
area carbides (4).
Since this initial investigation, a myriad of reactions have been tested for activity over
molybdenum carbide. The most prominent reactions reported in the literature are: Fischer-
Tropsch synthesis (1), alkene hydrogenation (7-10), aromatic hydrogenation (6,11-14),
hydrodenitrogenation (15-19), hydrodesulfurization (8,20-21), hydrocarbon reforming (22-26),
isomerization (27-28), aromatization (29-31), and ammonia synthesis (32). To insure only
pertinent background is provided, only Fischer-Tropsch synthesis, alkene and aromatic
hydrogenation, hydrodenitrogenation, and hydrodesulfurzation will be surveyed.
Like most noble metals, molybdenum carbides have been shown to be active
hydrogenation catalysts (1). As mentioned previously, this was initially studied on CO
hydrogenation reactions, generally termed Fischer-Tropsch synthesis (1). Lee et al. (6) report
that molybdenum and tungsten carbides have better initial activities for this reaction than
ruthenium-on-Al2O3. However, all molybdenum carbide catalysts tested for hydrocarbon and
aromatic hydrogenations deactivated very quickly (6,9,11-13). Unsupported Mo2C catalysts,
prepared by the CH4/H2 TPR method, are active for aromatic hydrogenation and can be
regenerated (9,12). Further, the degree of carburization has a significant effect on activity (13).
The effect of degree-of-carburization on aromatic hydrogenation was performed by varying
CH4/H2 ratio and temperature (13). This study showed, that for the unsupported Mo2C, there is
an optimum temperature and CH4/H2 ratio that leads to the highest aromatic hydrogenation

7
activity and density of CO chemisorption sites (13). Unsupported and Al2O3-supported Mo2C
catalysts were comparable to an Al2O3-supported Ru catalyst for benzene hydrogenating activity
at room temperature (6,13). Other research groups have studied molybdenum carbide activity
for alkene hydrogenation. One such group at Université Henri Poincaré concluded that Mo2C
was very active for propene hydrogenation and could be regenerated with no significant change
in activity (6).
Another reaction that Mo2C has been reported to catalyze is the hydrodenitrogenation of
nitrogen containing aromatics, such as indole and quinoline (15-16). Schlatter et al. report that
unsupported Mo2C, prepared by the method proposed by the Stanford group, uses less H2 than
the commercial Ni-Mo/Al2O3(15). Additionally, the unsupported Mo2C catalyst retains its
activity longer in the presence of sulfur. Although this is a promising result, on an equal mass of
metal basis, the unsupported Mo2C is about half as active as the commercial Ni-Mo/Al2O3
catalyst at the desired selectivity of propylbenzene to propylcyclohexane, the two major products
of the quinoline hydrodenitrogenation (15).
MoC has been tested with limited success for the hydrodesulfurization of thiophene. It
was determined (through differences in chemisorbed CO concentration before and after the
reaction) that the surface was being sulfided, even though XRD shows the bulk is unchanged.
Although the reaction rate is high in the initial hours of the reaction, once the catalyst surface is
sulfided, the reactivity is comparable to Mo/Al2O3 (21).
The reactions cited above give a wealth of information about reaction conditions and
catalytic behavior. The literature proposes that molybdenum carbides are excellent
hydrogenation catalysts, with activity comparable to supported Group VIII metals. Further
studies on hydrodenitrogenation and hydrodesulfurization reactions show that molybdenum

8
carbide is marginally susceptible to sulfide poisoning. Review of the literature further suggests
that few studies have been performed on carbon-supported molybdenum carbide catalysts.
2.3 Characterization Techniques
For this study, four different catalyst characterization techniques were used. The goal of
this study was to characterize the catalyst bulk, to characterize the catalyst surface, and correlate
the two characterizations to catalytic performance for benzene hydrogenation. The
characterization techniques proposed are: temperature programmed reaction (TPR), CO
chemisorption, H2 chemisorption, and XRD. Basic theory and usage will be provided for each.
Powder x-ray diffraction seeks to probe the major crystalline phases in the bulk of a
material, in this case the catalyst. X-ray diffraction is the uniform interaction of x-rays with
crystalline materials. Strong X-ray diffraction is observed when the x-ray wavelength
approaches the interatomic distances in a molecule (33). When this material is a single crystal,
the diffraction has less secondary diffraction, leading to little or no interference. This gives a
noiseless diffraction of spots on an x-ray image plate. The more amorphous a material is, the
more interference there is in the diffraction.
A powder diffraction pattern is normally a plot of the scanning angle 2θ on the ordinate
vs. intensity on the abscissa. When analyzed using theoretical calculations for simple crystalline
material and measured values for more complex crystal structures, one can match the peaks and
determine the major crystalline components of the bulk phase (33). One example of a powder
diffraction apparatus used for in-situ experiments at the National Synchrotron Light Source
(NSLS) is given in Figure 2.

9
Figure 2: Schematic of Powder Diffraction Measurment at NSLS Beamline X7B (figure
provided by Jonathan Hanson at NSLS)
In Figure 2, the sample is in a single-crystal sapphire tube. The synchrotron x-rays then
bombard the sample and are scattered to the image-plate detector. Since sapphire is a single
crystal, it diffracts x-rays as spots through Bragg diffraction while the powder diffracts as rings.
The spots are subtracted as background and the rings averaged and analyzed (34). The setup,
shown in Figure 2, allows the use high temperature, high pressure, and gas flow in
experimentation, making it useful for in-situ material science and catalysis studies (35).
Temperature-programmed reaction (TPR) is the heating of a material at a specific rate in
an environment with a reactant gas, usually CO, CH4, or H2, to observe when the reactant gas is
consumed. The temperature at which a reducing agent is consumed usually corresponds to a
reduction in oxidation state in a metal. Through proper use of this method, multiple reduction
steps can be characterized. TPR is an excellent starting point when exploring the proper
preparation method for a test system or a preliminary probe into oxidation state transitions (2-4).
It should be noted that analysis of simple systems is fairly easy, as metallic oxide reduction
temperatures are prominent in catalysis and metallurgy literature, but more complex systems

10
require either a TPR apparatus attached to a mass spectrometer or a way of modeling the
underlying peak structure (2,3).
The characterization methods discussed thus far can be used to characterize the bulk of
the material. However, catalyzed reactions occur on the surface or in the pores of the catalyst.
The proposed method of characterizing the surface seeks to measure the amount of a
chemisorbing species, either CO or H2, taken up by the catalyst.
In the pulse chemisorption method, an activated catalyst sample is placed in inert flow at
a fixed temperature. Usually, the exit gas is analyzed by a gas chromatograph or mass
spectrometer and set as a background. Then, a known-volume pulse of absorbing gas is injected
into the flow system and allowed to adsorb on the catalyst. This pulse procedure is repeated until
the measured pulse-peak areas become constant. This occurs when surface sites are saturated.
The amount of adsorbate gas taken up by the catalyst is calculated as the difference between the
measured peak areas and the peak areas expected if no gas is adsorbed (36).
3. Materials and Methods
3.1 Catalyst Preparation
Samples were prepared by first impregnating activated carbon (from Sigma-Aldrich)
with a 0.100 g/L aqueous solution of ammonium heptamolybdate (Sigma-Aldrich, P.A. grade),
followed by drying in air at 100ºC. Multiple impregnations were used in achieving the desired
loading (37). All temperature-programmed-reaction studies and benzene hydrogenation studies
were performed on catalyst having an approximate Mo metal loading of 13%. In-situ XRD
studies were carried out on molybdenum-on-carbon samples in which the AHM was

11
predecomposed in N2 at 500ºC. The Mo loadings for the catalysts used for in-situ XRD were
between 18% and 24% (37). This high metal loading allowed for clearer XRD patterns.
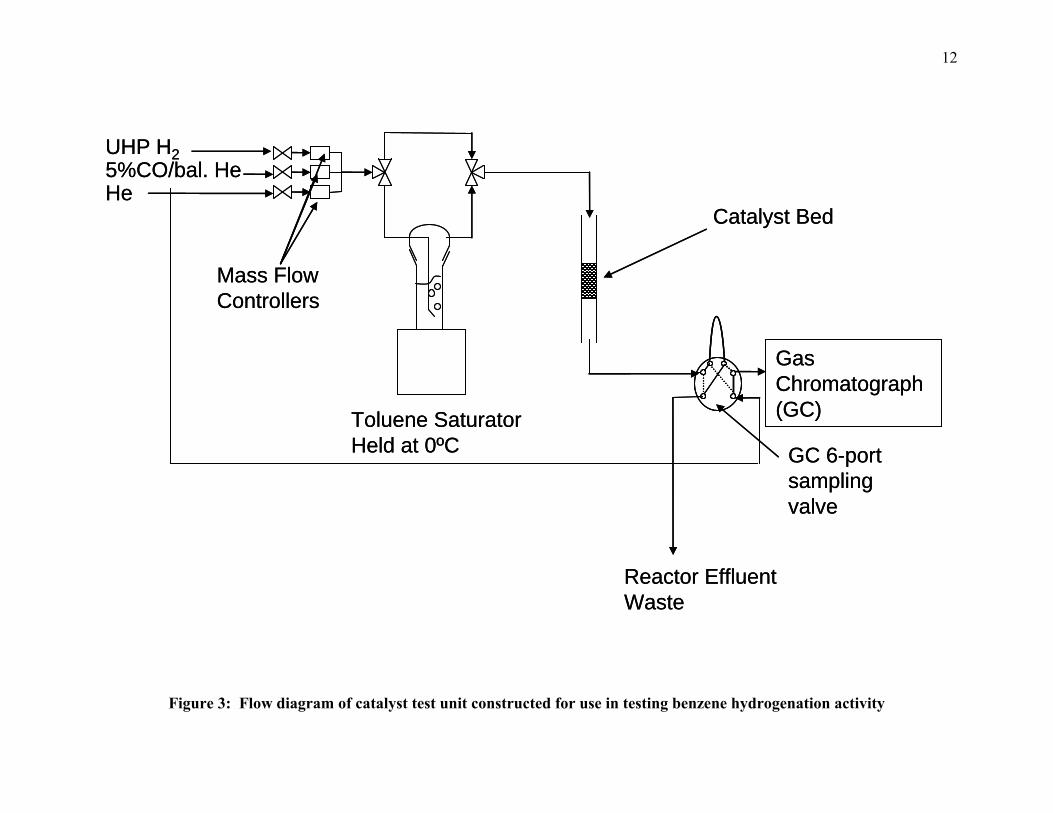
3.2 Benzene Hydrogenation Reaction Setup
A simple gas-phase, down-flow tubular reactor was constructed in which to carry out
low-temperature benzene hydrogenation experiments. Figure 3 is a flow diagram of the
constructed unit. The reaction was carried out in an 11.5” long stainless-steel tube with an
outside diameter of ¼”. A quartz wool plug was placed 7” down the reactor and the catalyst bed
was directly above. An Omega 1/16” type K thermocouple, placed at the top of the catalyst bed,
was used for temperature control. The reactor bed was heated by an Applied Test Systems clam-
shell-style tube furnace controlled by an 8 segment Yokogawa 351A temperature controller. Gas
flow through the reactor was controlled using three Brooks 5890 mass flow controllers (MFC).
The MFC used to control H2 flow was calibrated for 0-50 sccm of He flow. This controller was
tested and a correction factor applied for ultra high purity (UHP) H2. The MFC’s used for He
and 10%CO (balance He) were calibrated for 0-100 sccm of He. These controllers were also
calibrated and a correction factor applied. The calibrations for these controllers can be found in
Appendix A.
3.3 Reduction and Calcination of Benzene Hydrogenation Catalysts
Molybdenum-on-carbon samples were reduced in the reactor where the sample was not
exposed to air between reduction and benzene hydrogenation. During either reduction or inert-
gas calcination, gas flow was 34 sccm, as measured by a “bubble” type flow meter and a stop
watch. The catalyst sample was purged for approximately 5 minutes with the gas flow prior to
12
UHP H25%CO/bal. HeHe
Mass Flow Controllers
Toluene Saturator Held at 0ºC GC 6-port
sampling valve
Gas Chromatograph (GC)
Reactor Effluent Waste
Catalyst Bed
UHP H25%CO/bal. HeHe
Mass Flow Controllers
Toluene Saturator Held at 0ºC GC 6-port
sampling valve
Gas Chromatograph (GC)
Reactor Effluent Waste
Catalyst Bed
Figure 3: Flow diagram of catalyst test unit constructed for use in testing benzene hydrogenation activity

13
heating. The sample was then heated to desired reduction temperature, always at 10°C per
minute.
3.4 Benzene Hydrogenation Procedure
Sigma-Aldrich (99.9%) benzene was introduced into the system using a 25 mL glass
saturator, hand blown by Sherman Adams in the WVU chemistry department, and held at 1ºC.
This saturator allowed the reaction gas to bubble through the liquid benzene. The saturator was
connected to the system through the use of ¼” Cajon compression fittings with viton o-rings to
prevent gas leaks. The saturator was purged for no less than 36 h with UHP H2 before a series
of reaction studies. This long purge was an attempt to remove all dissolved air from the
benzene. During benzene hydrogenation reactions, the saturator was kept at 1ºC.
The effluent gas was sampled using a Valco six-port valve and a Valco 2-mL sample
loop. The sample was analyzed by the thermal conductivity detector (TCD) of a Hewlett
Packard 5890 Series II gas chromatograph. A 6’ 35% BC-150 on 100/120 Chromosorb P AW
1/8” stainless steel packed column was used to separate the analytes (cyclohexane and benzene);
this column is designed for aromatic analysis of gasoline. The results of a test separation of
cyclohexane and benzene are provided in Appendix B. The GC oven was kept isothermal at
120ºC with a typical analysis time being 5 minutes.
For all benzene hydrogenation tests, benzene conversions were kept below 12%, in most
cases below 5%, to use the differential reactor model for calculating reaction rate.
3.5 X-ray Diffraction (XRD)
Time resolved (in-situ) x-ray diffraction and powder x-ray diffraction of molybdenum-
on-carbon samples were carried out at beamline X7B at the National Synchrotron Light Source

14
Heating Coil
Thermocouple
Gas Inlet Gas OutletCatalyst Bed
Sapphire Tube
Heating Coil
Thermocouple
Gas Inlet Gas OutletCatalyst Bed
Sapphire Tube
Figure 4: Labeled pictorial diagram of in-situ XRD flow cell (35)

15
(NSLS) at Brookhaven National Laboratory (BNL) in Upton, NY. Simultaneous temperature-
programmed reaction and XRD were carried out in a fixed-bed-sapphire-tube micro-reactor
shown in Figure 4 (35). The micro-reactor was designed and machined by the catalysis group at
BNL.
Temperature control for the apparatus was provided using an un-insulated 24 AWG
Kanthal wire coiled around the sample, functioning as a simple resistance heater. A small loop
is placed in the wire to prevent the Kanthal wire from interfering with x-ray diffraction. Gas
flow through the sapphire tube was kept at approximately 20 mL per minute for all in-situ XRD
runs. The synchrotron x-rays used had an approximate wavelength of 0.92 angstroms. The
distance from the sample to the image plate detector varies, but was calibrated each visit using a
LaB6 standard (34). All x-ray calibration data is provided in Appendix C.
Spent catalyst samples, used in benzene hydrogenation experiments, were run in 0.5 mm
quartz micro-capillaries using beamline X7B with an image plate detector. Spent catalysts were
run ex-situ, with no flowing gas, or heating element.
3.6 Temperature Programmed Reaction (TPR)
Temperature programmed reaction (TPR) was carried out in a Micromeretics AutoChem
2920 with the effluent gas analyzed by a ThermoONIX Prima dB scanning sector mass
spectrometer. This apparatus was set up and is operated by the catalyst characterization group at
the National Energy Technology Laboratory (NETL) in Morgantown, WV. A block flow
diagram of the experimental setup is shown in Figure 5. These experiments were carried out
using 150 mg of catalyst under 50 sccm of flowing H2/Ar (5/95), CO/He (10/90), and Ar (Linde
UHP 99.999%).

16
AutoChem 2920 Commercial TPR and
ChemisorptionApparatus
Off-gas of sample
Prima dB Scanning Sector Mass Spectrometer
Dry Ice TrapFurnace for heating
Sample
AutoChem 2920 Commercial TPR and
ChemisorptionApparatus
Off-gas of sample
Prima dB Scanning Sector Mass Spectrometer
Dry Ice TrapFurnace for heating
Sample
Figure 5: Flow diagram of TPR-MS apparatus at the National Energy and Technology Laboratory in Morgantown, WV.
17
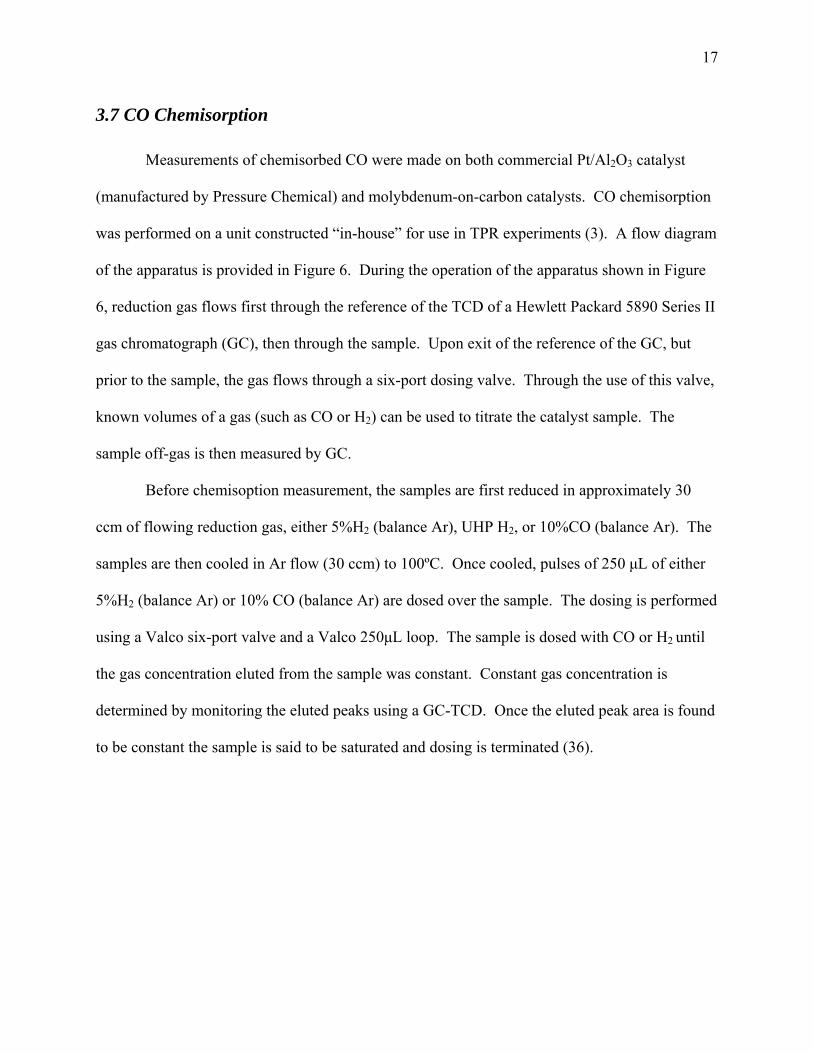
3.7 CO Chemisorption
Measurements of chemisorbed CO were made on both commercial Pt/Al2O3 catalyst
(manufactured by Pressure Chemical) and molybdenum-on-carbon catalysts. CO chemisorption
was performed on a unit constructed “in-house” for use in TPR experiments (3). A flow diagram
of the apparatus is provided in Figure 6. During the operation of the apparatus shown in Figure
6, reduction gas flows first through the reference of the TCD of a Hewlett Packard 5890 Series II
gas chromatograph (GC), then through the sample. Upon exit of the reference of the GC, but
prior to the sample, the gas flows through a six-port dosing valve. Through the use of this valve,
known volumes of a gas (such as CO or H2) can be used to titrate the catalyst sample. The
sample off-gas is then measured by GC.
Before chemisoption measurement, the samples are first reduced in approximately 30
ccm of flowing reduction gas, either 5%H2 (balance Ar), UHP H2, or 10%CO (balance Ar). The
samples are then cooled in Ar flow (30 ccm) to 100ºC. Once cooled, pulses of 250 μL of either
5%H2 (balance Ar) or 10% CO (balance Ar) are dosed over the sample. The dosing is performed
using a Valco six-port valve and a Valco 250μL loop. The sample is dosed with CO or H2 until
the gas concentration eluted from the sample was constant. Constant gas concentration is
determined by monitoring the eluted peaks using a GC-TCD. Once the eluted peak area is found
to be constant the sample is said to be saturated and dosing is terminated (36).
18
Gas Chromatograph (GC)
5% H2/bal. Ar
10% CO/bal. Ar
Ar
GC 6-port sampling valve
Thermal Conductivity Detector Reference Flow
Thermal Conductivity Detector Sample Flow
5% H2/bal. Ar
10% CO/bal. Ar
Waste Gas to Hood
Waste Gas to Hood
Catalyst Sample in U-tube, placed in furnace
Gas Chromatograph (GC)
5% H2/bal. Ar
10% CO/bal. Ar
Ar
GC 6-port sampling valve
Thermal Conductivity Detector Reference Flow
Thermal Conductivity Detector Sample Flow
5% H2/bal. Ar
10% CO/bal. Ar
Waste Gas to Hood
Waste Gas to Hood
Catalyst Sample in U-tube, placed in furnace
Figure 6: Flow diagram of chemisorption and TPR apparatus constructed in the West Virginia University reactions engineering laboratory

19
3.8 Safety
The chemicals used in these experiments are ammonium heptamolybdate, activated
carbon, benzene, acetone, 5% H2 gas (balance inert), 5% CO gas (balance inert), 10% CO gas
(balance inert), UHP H2, UHP He, UHP Ar, and cryogenic solid CO2. The MSDS for
ammonium heptamolybdate state that exposure to the skin should be avoided and ingestion
prohibited. For activated carbon, skin exposure and ingestion of large quantities should be
avoided. Benzene safety precautions include a warning against skin contact and a prohibition of
ingestion or inhalation. Benzene is a flammable liquid so that it should keep away from open
flames and other ignition sources. Great care must be taken to prevent inhalation, ingestion, or
skin exposure as benzene is a suspected carcinogen. Acetone safety precautions include a
warning against skin contact and a prohibition of ingestion, but go on to include flammability
precautions that state one should keep it away from open flames and other ignition sources. All
of the gases pose certain inhalation hazards, but the CO permissible exposure limit (PEL) is 50
ppm (39). Electronic monitoring is present near the work area to warn of exposure. He, Ar, CO2
and 5% H2 (balance inert) are asphyxiators so that they pose a danger if they displace air from
the lab. Hoods eliminate inert-gas hazard by bringing fresh air into the lab. UHP H2 is
flammable, but 5% CO (balance inert), 10% CO (balance inert), and 5% H2 (balance inert) are
not flammable. The gas cylinders, 5% H2 (balance Ar), 5% CO (balance He), 10% CO (balance
Ar), UHP H2, UHP He, and UHP Ar, are secured to the walls by chains and connected with
stainless steel tube. Periodic checks for leaks are made. Additionally, the reactor outlet after gas
sampling is plumbed directly to the hood to prevent any gas or vapor inhalation. For solid
cryogenic CO2, proper attire is worn, cryogenic gloves, goggles, and a lab coat, and a Dewar
flask was used for cryogenic transport.

20
4. Results and Discussions
4.1 Benzene Hydrogenation
Benzene hydrogenation was carried out in the reactor shown in Figure 3 and described in
Section 3.2. Reduction and benzene hydrogenation were carried out by methods described in
Section 3.3 and Section 3.4. All molybdenum-on-carbon catalysts were approximately 13 wt.%
molybdenum (metal basis), in the form of AHM, on the activated carbon support.
Figure 7 is a plot of the rate of disappearance of benzene for all catalysts prepared in a
UHP H2 reduction environment with a soak time of 15 minutes. The rate of disappearance of
benzene is defined by the design equation for a differential reactor, Equation 9 (40).
WXF
r benzeneBenzenebenzene
0=− (9)
Where, –rbenzene is the rate of consumption of benzene, Fbenzene 0 is the inlet molar flow of
benzene, Xbenzene is benzene conversion based on gas chromatography, and W is the weight of
catalyst used in the experiment. Detailed calculations of –rbenzene are given in Appendix D.
The major notable feature of Figure 7 is that all molybdenum-on-carbon catalysts,
reduced in UHP H2, have rates of reaction one order-of-magnitude less than that of the
commercial 5% Pt/Al2O3. When looking at Figure 8, where the commercial Pt/Al2O3 catalyst is
not displayed, it is clearly seen that reduction temperature is a key variable in catalyst
preparation. However, there is an optimum reduction temperature, 825ºC, above which the
molybdenum-on-carbon catalysts are less active. The effect of changing soak time at the
optimum reduction temperature, 825ºC, is shown in Figure 9. As soak time increases the catalyst
activity decreases. Once the soak time reaches 1 h, benzene hydrogenation is not observed.

21
0.00
0.50
1.00
1.50
2.00
2.50
3.00
3.50
4.00
4.50
5.00
0 20 40 60 80 100 120
Time (minutes)
-rbe
nzen
e (x1
0-4 m
ol/m
in*g
-cat
)
5% Pt/Al2O3-425
Mo-on-carbon-825ºC
Mo-on-carbon-775ºC
Mo-on-carbon-725ºC
Mo-on-carbon-675ºC
Mo-on-carbon-875ºC
Figure 7: Effect of time on stream and final reduction temperature on the rate of disappearance of benzene for molybdenum-on-carbon Samples reduced in UHP H2 and held at final temperature for 15 minutes (for data comparison for commercial 5%
Pt/Al2O3 is also shown)

22
0.00
0.10
0.20
0.30
0.40
0.50
0.60
0.70
0 20 40 60 80 100 120
Time (minutes)
-rbe
nzen
e (x1
0-4 m
ol/m
in*g
-cat
) Mo-on-carbon-825ºC
Mo-on-carbon-775ºC
Mo-on-carbon-725ºC
Mo-on-carbon-675ºC
Mo-on-carbon-875ºC
Figure 8: Effect of time on stream and final reduction temperature on the rate of disappearance of benzene for molybdenum-on-carbon Samples reduced in UHP H2 and held at final temperature for 15 minutes

23
0.00
0.10
0.20
0.30
0.40
0.50
0.60
0.70
0.80
0 20 40 60 80 100 120
Time (minutes)
-rbe
nzen
e (10
-4 m
ol/m
in*g
-cat
)Mo/C-825ºC-0 minutes
Mo/C-825ºC-15 minutes
Mo/C-825ºC-30 minutes
Mo/C-825ºC-60 minutes
Figure 9: Effect of time on stream and soak time at final reduction temperature (825ºC) on the rate of disappearance of benzene for molybdenum-on-carbon catalysts

24
All catalysts in Figures 7,8,and 9 deactivated quickly. This is consistent with findings in
the literature for Al2O3 supported and unsupported Mo2C (6, 11-13). This deactivation is most
likely due to residual air dissolved in the benzene (12). This air is undetectable to the GC-TCD
as its concentration is below the sensitivity limits of the detector. This oxygen is expected to
passivate the surface with unreactive MoO2 (4).
No benzene hydrogenation activity was observed for molybdenum-on-carbon catalysts
calcined in He (presumed Mo2C) or reduced in CO (presumed MoC). Calcination possibly leads
to uncontrollable build-up of surface carbon. This phenomenon will be discussed further in
Section 4.4. Additionally, if CO reduction is used for preparation, chemisorbed CO could block
reaction sites (12).
4.2 XRD of Spent Benzene Hydrogenation Catalysts
Post-run XRD was performed for the catalysts reduced in UHP H2 and subsequently
tested for benzene hydrogenation. This analysis was revealing as to the nature of the benzene
hydrogenation deactivation as either reduction temperature or soak time at temperature
increased.
Figure 10 shows the analysis of XRD performed on a spent-catalyst reduced at 825ºC
and held at 825ºC for 1h, and then tested for benzene hydrogenation activity. XRD was
performed at beamline X7B at the National Synchrotron Light Source at Brookhaven National
Laboratory, by methods described in Section 3.5. Clear lines for Mo2C are found between 2θ
values of 20º and 28º. Strong lines for SiO2 impurities appear at 2θ values of 12º and 16º.
Additionally, a weak line for graphite appears at a 2θ value of 26º. Although this assignment for
graphite seems difficult, the peak at 26º 2θ could not be assigned to any other structure with Mo,
Si, O, or C through use of the International Center for Diffraction Database and the XRD

25
Figure 10: XRD pattern of molybdenum-on-carbon catalyst tested for benzene hydrogenation, catalyst was reduced at 825ºC and held at 825º C for 60 minutes

26
analysis software JADE. Since no other significant impurities have been seen in XRD or
elemental analysis, it is believed this assignment is correct. The small intensity of the peak is
most likely due to the weak scattering of carbon due to its small molecular weight (33). Of the
catalysts tested, this one had the most intense peaks for graphite and for Mo2C, but had no
catalytic activity for benzene hydrogenation.
Figure 11 shows the analysis of XRD performed on a catalyst reduced at 825ºC for 15
minutes. Clear, strong lines are found for Mo2C between a 2θ value of 20º and 28º. Lines for
the SiO2 impurities appear at 2θ values of 12º and 16º 2θ. Interestingly, there is only an
extremely weak, arguably non-existent, peak for graphite at a 2θ value of 26º. Unlike the
catalyst in Figure 10 which has strong lines for Mo2C and much more intense lines for graphite,
but was inactive for benzene hydrogenation, the catalyst in Figure 11 is the most stable and the
second-most active for benzene hydrogenation.
Figure 12 shows the growth of the graphite peak at a 2θ value of 26.2º with soak time at
825ºC in UHP H2. Clearly the longer the molybdenum-on-carbon sample stays at high
temperature the more prevalent this XRD line for crystalline graphite is. It is theorized that this
crystalline graphite is occluding the Mo2C surface preventing reaction. This is similar to
graphitization proposed by the Stanford Group on unsupported Mo2C (4).
Figure 13 shows the analysis of XRD performed on a catalyst reduced at 775ºC for 15
minutes. Again, XRD on this sample was performed at beamline X7B at the National
Synchrotron Light source at Brookhaven National Laboratory using methods described in section
3.2. When looking at this, sample lines for the SiO2 impurities are the only distinguishable lines
that appear. The non-existence of Mo2C lines is strange due to the significant benzene
hydrogenation activity observed on this sample.

27
Figure 11: XRD pattern of molybdenum-on-carbon catalyst tested for benzene hydrogenation, catalyst was reduced at 825ºC and held at 825º C for 15 minutes

28
1.60E+04
1.70E+04
1.80E+04
1.90E+04
2.00E+04
2.10E+04
2.20E+04
26 26.05 26.1 26.15 26.2 26.25 26.3 26.35 26.4 26.45 26.5
2θ
Inte
nsity
Mo-on-carbon-825ºC-60 min
Mo-on-carbon-825ºC-30 min
Mo-on-carbon-825ºC-15 min
Figure 12: Plot illustrating growth of graphite XRD peak at 26.2º 2θ with increasing time at maximum reduction temperature (825ºC)

29
Figure 13: XRD Pattern of molybdenum-on-carbon catalyst tested for benzene hydrogenation, catalyst was reduced at 775ºC and held at 775ºC for 15 minutes

30
When comparing XRD patterns in Figure 12 and benzene hydrogenation data for the
same catalyst in Figure 9, it appears that graphite XRD lines grow as the catalyst becomes less
active for benzene hydrogenation, to the point where no activity is observed. Inverse to this,
Mo2C line intensities increase with reduction temperature and length of soak time at reduction
temperature, even when the catalyst has no reactive surface. It is, therefore, possible that small
surface particles, barely visible or invisible to XRD, play the key role in Mo2C hydrogenation
activity. Analyzed XRD patterns for all spent catalysts found to have benzene hydrogenation
activity are found in Appendix E.
4.3 In-situ XRD
On an October 2003 visit to the National Synchrotron Light Source (NSLS) by Edwin
Kugler, experiments were carried out to measure the phase transitions of molybdenum-on-carbon
(Mo/C) catalysts reduced in H2. Figure 14 shows the results of the in-situ XRD of 18% Mo/C
reduced in H2. This sample was heated from 25-825ºC at a rate of 5ºC per minute then held at
825ºC for 1 hour. Each XRD scan in Figure 14 was taken in a 5 minute interval, thus, each scan
represents 25ºC of heating.
Two major changes can be seen in the XRD patterns in Figure 14. First at ~500ºC, where
there is a background shift in the low 2θ angles. Furthermore, at ~700ºC the peaks for MoO2,
between 2θ values of 18º and 28º, disappear and broad peaks for Mo2C appear. Figure 14 shows
that during the transition to Mo2C there is no formation of Mo0, instead there is a direct transition
from MoO2 to Mo2C. Possibly, excess carbon prevents the transition of the material to Mo0 and
instead drives the transition to Mo2C.

31
Figure 14: In-situ XRD scans of the reduction of 18% Mo/C to 825º at 5ºC per minute in 5% H2 (balance He). Each scan represents 25ºC of heating

32
Figure 15 shows the peak fitting of the bulk structures of the predominant materials at the
end of reduction in H2. This analysis was performed using the XRD analysis software JADE.
Through peak matching of The International Centre for Diffraction Data (ICDD) database, a
database of experimental and calculated crystal diffraction patterns, the XRD analysis reveals
that the predominant structures found in the sample are that of hexagonal Mo2C and SiO2. SiO2
is an impurity found in the activated carbon purchased from Sigma-Aldrich. This impurity is
useful as a marker due to its persistence throughout reduction. From Debye-Scherrer line
broadening of the x-ray diffraction pattern, it is found that the average Mo2C particle size is 2
nm. It should be noted that 2 nm lies within the lower limit of the effectiveness of the line-
broadening technique (33).
On another visit it to NSLS in March 2004, experiments were carried out by Edwin
Kugler, Christopher Clark, and James Wright, this time to measure phase transitions of
molybdenum-on-carbon catalysts calcined in He. Figure 16 shows these results of the in-situ
XRD of 24% Mo/C calcined in He. This sample heated from 25-825ºC at a rate of 5ºC per
minute then held at 825ºC for 1 hour. Each XRD scan in Figure 16 was taken in a 5-minute
interval, thus each scan represents 25ºC of heating.
Two major changes can be seen in the XRD patterns in Figure 16. The first of these
changes is the growth of intensity of MoO2 peaks at between a 2θ value of 18º and 28º. This
change from weak broad peaks to sharp intense peaks is indicative of larger particles (13). This
particle growth can be seen starting at ~500ºC and continuing to 800ºC. The second change
happens suddenly at ~800ºC where the relatively intense peaks for Mo2C appear between a 2θ
value of 20º and 25º. Similar to the case of H2 reduction, no Mo0 is seen. However, even without
the presence of H2 the material transitions to Mo2C.

33
Figure 15: XRD Profile, with peak fitting, of final product of in-Situ reduction of 18% Mo/C in 5% H2 (balance He)

34
Figure 16: In-situ XRD scans of the reduction of 24 % Mo/C to 825º at 5ºC per minute in He. Each scan represents 25ºC of heating up to 825ºC then held at 825º for 30 minutes

35
Figure 17 shows the peak fitting of the bulk structures of the predominant materials at the
end of calcination in He. This analysis was performed using the XRD analysis software JADE.
Through peak matching using JADE and the ICDD database, the XRD analysis reveals that the
predominant structures are found to be that of hexagonal Mo2C, and SiO2. From line
broadening, the average Mo2C particle size is found to be 9 nm. During calcination in He, the
particles formed are much larger, and the transition happens at higher temperatures, in
comparison to the case of H2 reduction. In this case of calcination in He the particles are larger
due to the formation of large MoO2 precursors prior to the transition to Mo2C.
On an April 2004 visit to NSLS, experiments were carried out by Edwin Kugler to
measure the phase transitions of molybdenum on carbon catalysts reduced in 5% CO (balance
He). During this visit, a curious new transition was measured. Figure 18 shows the results of the
in-situ XRD of Mo/C reduced in CO. This sample was heated from 25ºC-825ºC at a rate of 5ºC
per minute then held at 825ºC for 1 hour. Each XRD scan in Figure 18 was taken in a 5-minute
interval, thus each scan represents 25ºC of heating. Only one major transition occurs in this
material, a shift at approximately 650ºC from MoO2 to MoC. This transition is marked by
disappeareance of MoO2 peaks found at 2θ values of 20º and 28 and the sudden appearance of
very broad MoC peaks between 2θ values of 17º and 28º. The very broad nature of the MoC
peaks is indicative of very small particle size.
Figure 19 shows the peak fitting of the bulk structures of the predominant materials at the
end of reduction in 5% CO (balance He). This analysis was performed using the XRD analysis
software JADE. Again, through peak matching using JADE and the ICDD database the
predominant structures are those of cubic MoC and SiO2.

36
Figure 17: XRD profile, with peak fitting, of final product of in-Situ calcination 24% Mo/C in He

37
Figure 18: Plot of in-situ XRD scans of the reduction of 21% Mo/C to 825º at 5ºC per minute in 5% CO (balance He). Each
scan represents 25ºC of Heating

38
Figure 19: Profile, with peak fitting, of final product of in-Situ calcination 21% Mo/C in 5%CO (balance He)

39
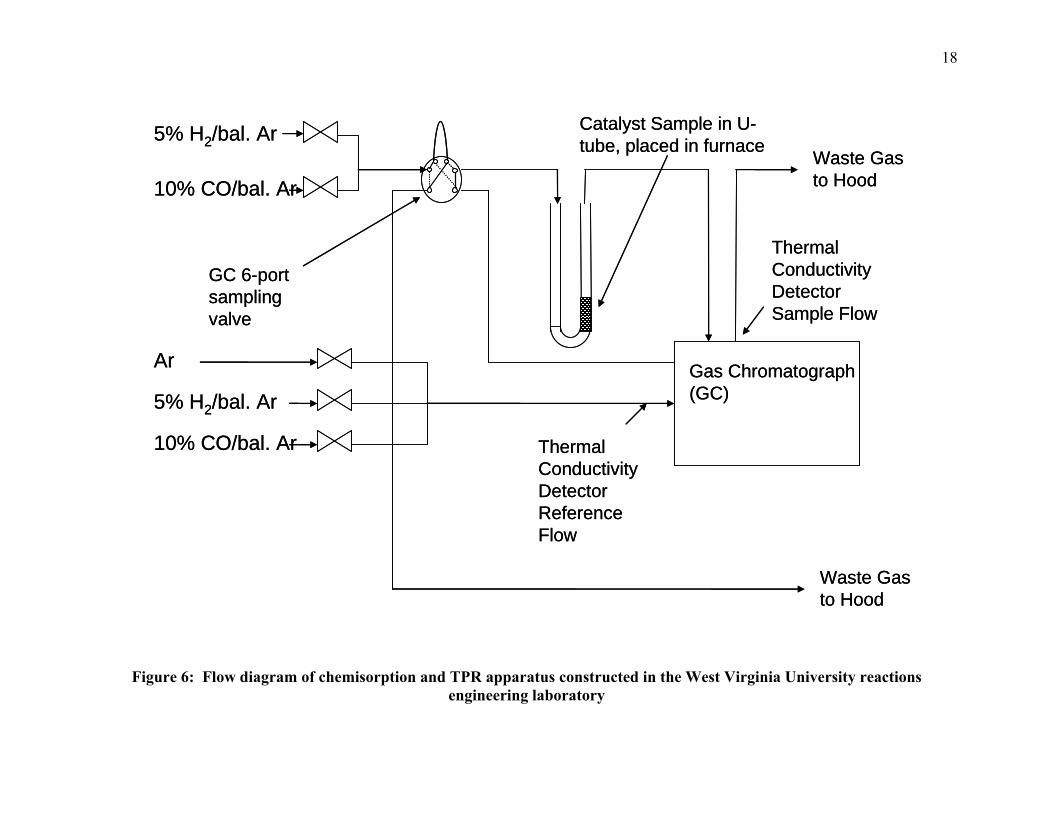
4.4 Temperature Programmed Reaction-Mass Spectrometry (TPR-MS)
Temperature programmed reaction (TPR) experiments, where the gas effluent was
measured using a mass spectrometer, have been performed at the National Energy Technology
Laboratory (NETL) by Todd Gardner. These experiments used a Micromeritics Autochem 2920
Catalyst Characterization System with the sample off-gas analyzed by a ThermoONIX Prima δβ
magnetic sector mass spectrometer, described in Section 3.6. TPR was performed on Mo/C
samples pretreated in flowing H2, CO, and Ar.
Figure 20 illustrates the observed TPR-MS pattern of Mo/C reduced in 5% H2 (balance
Ar). The sample was heated at 10ºC/min. to 900ºC. At approximately 500ºC, H2 is consumed
with carbon monoxide evolved at near 800ºC. Trace amounts of NH3 are evolved at ~200ºC in
the breakdown of the ammonium heptamolybdate complex, but only trace amounts of CO2 are
produced. Additionally, H2 seems to be produced at high temperatures. This can be seen as the
value of H2 mol% in Figure 20 increases as temperature reaches 900ºC. When comparing the H2
consumption in Figure 20 to transitions observed in the in-situ XRD in Figure 14, one sees that
the largest H2 consumption in the TPR correlates to only a background shift in the XRD pattern.
It is believed that this XRD background shift is the formation of small MoO2 precursors.
Furthermore, if we correlate the CO evolution in Figure 20 to the in-situ XRD in Figure 14, we
see that the CO evolution roughly correlates to the transition from MoO2 to Mo2C.
Figure 21 illustrates the observed TPR pattern of Mo/C, now calcined in Ar. As above,
the sample was heated at 10ºC/min. to 900ºC and then held at 900ºC for 130 minutes. At near
850ºC, CO is evolved with H2 being evolved at approximately 900ºC. When comparing Figure
21 (calcination in Ar), to Figure 20 (reduction in 5% H2 (balance Ar), one finds that CO
evolution occurs at a higher temperature (850ºC) in the case of calcinations in Ar.
40
0
1
2
3
4
5
6
0 100 200 300 400 500 600 700 800 900Temperature (ºC)
Con
cent
ratio
n (m
ole
% in
5%
H2/B
al A
r)
NH3
H2
CO2
CO
Figure 20: TPR-MS Spectra of Mo/C Reduced in 5% H2 (balance Ar) from 25ºC to 900ºC at 10ºC per minute

41
0.0
0.5
1.0
1.5
2.0
2.5
3.0
3.5
4.0
4.5
5.0
Temperature (ºC)
Con
cent
ratio
n (m
ol%
)
200 400 600 800 900 900 900
NH3 H2
CO2
CO
Figure 21: TPR-MS Spectra of Mo/C calcined in Ar from 25ºC to 900ºC at 10ºC per minute, then held at 900ºC for 130 minutes (plot of only 40 minutes of 130-minute temperature soak at 900ºC)

42
Trace amounts of NH3 are evolved in the breakdown of the ammonium heptamolybdate complex
at ~400ºC, with only small quantities of CO2 produced. It is interesting to note that NH3 is
produced at a slightly higher temperature during calcinations than during reduction in H2. When
comparing Figure 21 and the in-situ XRD for TPD in inert found in Figure 16, one can correlate
CO evolution to the formation of Mo2C. However, there is no change in the XRD pattern
correlating to the evolution of H2 at high temperatures.
Figure 21 signifies that reduction of the MoO2/C catalyst does not occur from the gas
environment, but is instead carburized directly from the activated carbon support. One possible
mechanism for this reduction is:
222 232 COCMoCMoO +⇔+ (10)
COCCO 22 ⇔+ (11)
For this proposed mechanism, it is of interest to see how well the TPR-MS data compare to that
predicted by thermodynamics. For the gas phase reaction shown in Equation 11, the equilibrium
CO2 concentration was calculated by:
)ln( ar KRTG −=Δ (12)
2
2)(
co
coa y
PyK = (13)
where ΔGr is the Gibbs free energy of reaction for Equation 12 calculated using tabulated data
(40), R is the gas constant, T is temperature in Kelvin, Ka is the equilibrium constant, P is total
pressure, yco and yco2 are the equilibrium mole fraction of CO and CO2. This calculation is
shown in detail in Appendix F. The equilibrium value for CO2 corresponding to the observed
maximum CO concentration, occurring at 875ºC, has been calculated. When CO is at its
observed maximum concentration of 4.5 mole %, the equilibrium concentration of CO2 is 0.0066

43
mole %. When we compare this equilibrium calculation to the experimental data in Figure 21
they are consistent, there is no significant observed or equilibrium CO2 produced at 875ºC.
Indeed, the equilibrium for Equation 11 explains the large CO evolution and the absence of CO2.
However, when one looks at the equilibrium CO and CO2 concentrations prior to 875ºC in
Figure 21, it is difficult to say anything about the reaction mechanism as both CO and CO2 are in
small concentrations. It should be noted that the equilibrium constant for the reaction in
Equation 11 is equal to one at approximately 700ºC, and possible error in this temperature is
associated with extrapolation of the Gibbs free energies of formation for CO and CO2 given only
to 1000K (41).
During a discussion with Jae-Soon Choi (42), a researcher working on unsupported
molybdenum carbides, he noted that when preparing unsupported molybdenum carbide in
CH4/H2 one needs to take great care in not using high temperatures or CH4/H2 molar ratios
exceeding 1/9. Going to high temperatures or exceeding 10% CH4/balance H2 would lead to
carbon build up on the surface. It is believed that a similar phenomenon is present in the carbon
supported system, but one has little or no control over carbon sources for carburization.
Figure 22 illustrates the observed TPR pattern of Mo/C reduced in CO. As before, the
sample was heated at 10ºC/min to 900ºC, and then held at 900ºC for 130 minutes. At
approximately 600ºC, CO is consumed with CO2 being evolved proportional to the CO being
consumed. Trace amounts of NH3 are not evolved in this sample, and this sample only, due to
pre-calcination of the 13% Mo/C in N2 at 500ºC. When comparing TPR spectra in Figure 22
with the in-situ XRD spectra, Figure 19, it is seen that CO consumption begins at approximately
the same temperature, 625ºC, that MoO2 converts to MoC.

44
0
2
4
6
8
10
Temperature (ºC)
Gas
Com
posi
tion
(%)
CO
CO2 H2
200 400 600 800 900 900
Figure 22: TPR-MS spectra of Mo/C calcined in 10% CO (balance Ar) from 25ºC to 900ºC at 10ºC per minute, then held at 900ºC for 130 minutes (plot of only 20 minutes of 130-minute temperature soak at 900ºC)

45
4.5 CO Chemisorption
CO chemisorption was attempted on all catalysts found to be active for benzene
hydrogenation. However, good chemisorption data could not be obtained for active Mo/C
catalysts. For commercial 5% Pt/Al2O3, purchased from Pressure Chemical, the chemisorption
apparatus described in Section 3.4 consistently yielded data comparable to literature values (6,
43). Data for pulse CO chemisorption over 5% Pt/Al2O3 is provided in Figure 23. Figure 23
indicates that the 5% Pt/Al2O3 sample is saturated with CO after 16 doses. This value
corresponds to a CO uptake of 111 μmol/g-sample.
A sample prepared to be MoO2-on-carbon (by calcination in Ar) consistently gave good
data revealing no CO uptake. Pulse chemisorption of CO over MoO2-on-carbon is provided in
Figure 24. In many cases where CO chemisorption was attempted on what should be an active
Mo2C-on-carbon surface, the data showed strange behavior for CO uptake. Pulse chemisorption
of CO over Mo/C, prepared through reduction in flowing H2 to 825ºC at 10º per minute and held
at 825ºC for 15 minutes, is provided in Figure 25. CO chemisorption data in Figure 25 showed
odd peak heuristics for the Mo2C-on-carbon catalyst. However, pyrophric behavior was
observed upon removal from the TPR-chemisorption unit. This pyrophoric behavior of the
Mo/C catalyst is independent evidence for activity. It is, therefore, strange that good CO
chemisorption, similar to that obtained for Pt catalysts, was not observed.
4.6 Active Site Determination
To counter this problem, CO chemisorption data were collected for the 5% Pt/Al2O3, as
shown in Figure 23. This was then combined with benzene hydrogenation rate data, to give a
number for rate-per-active-site, or average turn-over-frequency (TOF). TOF is defined by:

46
-2000
-1000
0
1000
2000
3000
4000
5000
6000
0 5 10 15 20 25 30 35 40 45 50
Time (minutes)
TCD
Sig
nal
Figure 23: Pulse CO chemisorption over 0.1078g Pressure Chemical 5% Pt/Al2O3 reduced in H2 to 425ºC

47
-2000
-1000
0
1000
2000
3000
4000
5000
6000
0 5 10 15 20 25
Time (minutes)
TCD
Sig
nal
Figure 24: Pulse CO chemisorption over 0.1074 g molybdenum-on-carbon calcined in flowing Ar to 615ºC

48
15000
15500
16000
16500
17000
17500
18000
18500
19000
19500
0 20 40 60 80 100 120Time (minutes)
TCD
Sig
nal
Figure 25: Pulse CO chemisorption over 0.1258 g molybdenum-on-carbon, prepared through reduction in flowing UHP H2 to
825ºC at 10º per minute and held at 825ºC for 15 minutes

49
][Sr
TOF benzene−= (14)
Where –rbenzene is the initial rate of benzene consumption calculated by Equation 14, [S] is
surface site concentration, and TOF is site time yield. An average TOF was first calculated for
5% Pt/Al2O3. This value is 3.80 (reactions/site-min), for an average –rbenzene of 4.24x10⁻⁴
(mol*min-1(g-catalyst)-1). Once TOF was calculated for Pt/Al2O3, it was assumed to be constant
for the benzene hydrogenation reaction. This number could therefore be applied to other
catalysts. Surface site concentration was then calculated for Mo/C samples by Equation 14 (44).
Table 1 gives calculated values for surface site concentration for catalysts found to be
active for benzene hydrogenation. Values for (–rbenzene)0 were found by fitting curves to the
experimental data for –rbenzene and extrapolating to zero time (12). Fitting of the –rbenzene data as
well as the precise calculation method for [S] from this data can be found in Appendix D. The
data in Table 2 serve to quantify the activity effects of reduction temperature and soak time as
discussed in Section 4.1. It should be noted that Table 1 contains only calculated CO adsorption
site concentrations.

50
Table 1: Surface Site concentrations as measured by either by benzene hydrogenation
Catalyst Reduction Temperature
(ºC)
Heating Rate
(ºC/min)
Soak Time at Reduction
Temperature (min)
Initial –rbenzene as extrapolated
from experimental
data (mol/(min*g-
catalyst))
Surface Site Concentration
(μmol/g-catalyst)
13% Mo/C 675 10 15 2.50*10-6 0.76
13% Mo/C 725 10 15 2.45*10-5 7.45
13% Mo/C 775 10 15 3.25*10-5 9.88 13% Mo/C 825 10 15 6.98*10-5 21.2 13% Mo/C 875 10 15 3.77*10-5 11.5 13% Mo/C 825 10 0 9.95*10-5 30.3 13% Mo/C 825 10 30 5.45*10-6 1.66 13% Mo/C 825 10 60 0 0
5. Conclusions
The molybdenum-on-carbon catalysts reduced in UHP H2 clearly have benzene
hydrogenation activity, but do not have activity comparable to a commercial Pt/Al2O3 catalyst.
Additionally, the Mo/C catalysts deactivate quickly, possibly due to residual oxygen in the
benzene feed, compared to the commercial Pt catalyst. However, molybdenum-on-carbon has
some interesting features that could lend themselves to further development and fundamental
insight.
In-situ XRD patterns indicate that the MoO2 reduces to Mo2C or MoC between 650ºC
and 750ºC in all reduction cases. When correlating these transitions to benzene hydrogenation,
one finds that only during the transitions to molybdenum carbide is the catalyst active. Upon
completion of the TPR, some phenomenon passivates the surface. Independent evidence for this
passivation was found during CO chemisorption experiments over the catalysts. For CO
chemisorption on catalysts having the highest benzene hydrogenation activity, pyrophoric
behavior was observed on disposing of the catalyst. Previous to this, no molybdenum carbide-

51
on-carbon catalyst had shown this tendency to violently oxidize in air (burn). When the catalysts
that had no benzene hydrogenation activity were handled in a similar manner, no burning was
observed. This lends evidence to the presence of surface poison occurring at high temperatures
or long soak times.
The benzene hydrogenation reaction was used to determine metal surface site
concentration. It was found through this method that the best surface site concentration per gram
of catalyst for any of the Mo/C samples was approximately 25% of that measured for the
commercial 5% Pt/Al2O3 catalyst. Additionally, this chemisorption study yielded the first
observation of pyrophoric Mo/C, observed on catalyst disposal.
Taking into account the observed deactivation with reduction temperature and soak time
at reduction temperature, it is believed that a carbon layer is occluding the active surface. Three
possible mechanisms for this are: carbon lay-down from CH4 formed (Equation 1), carbon
laydown from CO formed (Equation 5), or mobile carbon used in the reduction of the Mo2C that
migrates to the surface. Evidence for one or all of these mechanisms can be found in the
formation of graphite, as seen by XRD, as the catalyst becomes increasingly inactive.
When looking at the formation of molybdenum carbides in H2, inert, and CO, one finds
that in none of the cases is Mo0 observed. This is shown clearly in the in-situ XRD patterns,
Figures 17, 19, and 21. It is interesting that Mo0 is not seen as this is the carburization
mechanism proposed by the Stanford Group, as seen in Equation 2. Instead MoO2 is the starting
material, after the initial decomposition of ammonium heptamolybdate, which then reduces at
high temperature to Mo2C.
Additionally, for the case of Mo2C formation in H2 or inert, one finds that CO is evolved
during the reduction of MoO2 to Mo2C. This CO evolution implies that the reaction path to

52
Mo2C does not use methane as the reducing agent, as proposed by Lee et al. (4), but instead is
using the carbon support. This is seen in correlating the TPR-MS, Figure 21, and in-situ XRD,
Figure 16. From the TPD-MS in inert gas, it seems clear that the Mo/C samples are reduced to
Mo2C-on-carbon by the carbon support, not the gas environment. This is supported by the
equilibrium calculation (Equation 11). For the case of the reduction in 5% CO (balance inert),
the consumption of CO and production of CO2, seen in the TPR-MS spectra Figure 22,
corresponds to the same temperature as the transition of MoO2 to MoC, seen in Figure 18. In all
cases, active carbon appears to be the reducing agent.
Molybdenum carbide shows promise as a hydrogenation catalyst, but needs further
materials refinement to optimize hydrogenation activity. This study has observed that noble
metals and unsupported molybdenum carbides outperform carbon-supported molybdenum
catalysts.
6. Recommendations
Future work should involve the probing of the surface of Mo2C-on-carbon.
Understanding the mechanism and rate of carbon build up on the particle surface should lead to
forming a more stable and more active catalyst. Infrared (IR) spectroscopy or x-ray near edge
spectroscopy should lend itself to this pursuit. One should be able to observe the surface carbon
build-up by these methods.
Furthermore, when reducing the Mo2C catalyst formed in UHP H2, the hydrogenation
activity could be improved by increasing H2 concentration to assure that the metal surface is
clean. Due to limitations in the apparatus constructed for these experiments, high H2 pressures
could not be reached, but future work should reduce these Mo/C catalysts under higher H2
pressures. This high H2 concentration should drive carbon off the surface as CH4 by the reaction

53
in Equation 1 and leave a clean metal surface. Finally, with MoC reduced in CO, the study of
co-feeding CO2 might reveal that surface carbon can be cleaned up and catalytic activity
achieved. The reaction in Equation 5 lends evidence to this phenomenon.

54
References
1. Leclercq, L, Imura, K, Yoshida, S., Barbee, T., and Boudart, M., Synthesis of New Catalytic Materials: Metal Carbides of the Group VI B Elements, Studies in Surface Science and Catalysis 3: Preparation of Catalyst II, 1979, 3, 627.
2. Mordenti, D., Brodzki, D., and Djéga-Mariadassou, G., New Synthesis of Mo2C 14 nm
Average Size Supported on High Specific Surface Area Carbon Material, Journal of Solid State Chemistry, 1998, 141,114.
3. Feng, L., Xianguo, L., Dadyburjor, D.B., and Kugler, E.L., A Temperature-Programmed-
Reduction Study on Alkali-Promoted Carbon-Supported Molybdenum Catalysts, Journal of Catalysis, 2000, 190, 1.
4. Lee, J.S., Oyama, S.T., Boudart, M., Molybdenum Carbide Catalysts I.: Synthesis of
Unsupported Powders, Journal of Catalysis, 1987, 106, 125. 5. Lee, J.S., Volpe, L., Ribeiro, F.H., and Boudart, M, Molybdenum Carbide Catalysts II.:
Topatactic Synthesis of Unsupported Powders, Journal of Catalysis, 1988, 112, 44. 6. Lee, J.S., Yeom, M.H., Park, K.Y., Nam, I. S., Chung, J.S., Kim, Y. G., and Moon, S. H.,
Preparation and Benzene Hydrogenation Activity of Supported Molybdenum Carbide Catalysts, Journal of Catalysis, 1991, 128, 126.
7. Chen, J.G., and Fruhberger, B., Similarities in Decomposition and Dehydrogenation of
Cyclohexene on (4x4)-C/Mo(110) and Pt (111), Surface Science, 1996, 367, L102. 8. Dhandapani, B., St. Clair, T., and Oyama, S.T., Simultaneous Hydrodesulfurization,
Hydrodeoxygenation, and Hydrogenation with Molybdenum Carbide, Applied Catalysis A: General, 1998, 168, 219.
9. Montéverdi, S., Bettahar, M.M., Bégin, D., and Maréché, F., Characteristics and
Hydrogenating Properties of Active Carbon Supported β-Mo2C, Fuel Processing Technology, 2002, 77, 119.
10. Li, Y., Fan, Y., He, J., Xu, B., Yang, H., Miao, J., and Chen, Y., Selective Liquid
Hydrogenation of Long Chanin Linear Alkadienes on Molybdenum Carbide Modified by Oxygen, Chemical Engineering Journal, 2004, 99, 213.
11. Marquez-Alvarez, C., Claridge, J.B., York, A.P.E., Sloan, J., and Green, M.L.H., Benzene
Hydrogenation over Transition Metal Carbides, Surface Science and Catalysis, 1997, , 485.

55
13. Choi, J., Bugli, G., and Djéga-Mariadassou, G., Deactivation by Oxygen and Subsequent Activation of Bulk Mo2C for Benzene Hydrogenation at 298 K, Studies in Surface Science and Catalysis, 2000, 130, 2885.
12. Choi, J., Bugli, G., and Djéga-Mariadassou, G., Influence of the Degree of Carburization on
the Density of Sites and Hydrogenating Activity of Molybdenum Carbides, Journal of Catalysis, 2000, 193, 238.
14. Rocha, A.S., da Silva, V. L. T., Leitao, A.A., Herbst, M.H., and Faro, A.C., Low
Temperature Low Pressure Benzene Hydrogenation on Y Zeolite Supported Carbided Molybdenum, Catalysis Today, 2004, 98, 281.
15. Schlatter, J.C., Oyama, S.T., Metcalfe, J.E., and Lambert, J.M., Catalytic Behavior of
Selected Transition-Metal Carbides, Nitrides, and Borides in the Hydrodenitrogenation of Quinoline, Ind. Eng. Chem. Res., 1988, 27, 1648-1653
16. Li, S., Lee, J.S., Hyeon, T., and Suslick, K.S., Catalytic Hydrodenitrogenation of Indole over
Molybdenum Nitride and Carbide with Different Structures, Applied Catalysis A: General, 1999, 184, 1.
17. Schwartz, V., and Oyama, S.T., Reaction Network of Pyridine Hydrodenitrogenation over
Carbide and Sulfide Catalysts, Journal of Molecular Catalysis A: Chemical, 2000, 163, 269.
18. Schwartz, V., da Silva, V.T., and Oyama, S.T., Push-pull Mechanism of
Hydrodenitrogenation over Carbide and Sulfide Catalysts, Journal of Molecular Catalysis A: Chemical, 2000, 163, 251.
19. Sayag, C., Benkhaled, M., Suppan, S., Trawczynski, J., and Djéga-Mariadassou, G.,
Comparative Kinetic Study of Hydrodenitrogenation of Indole over Activated Cabon Black Composites (CBC) Supported Molybdenum Carbides, Applied Catalysis A: General, 2004, 275, 15.
20. Lee, J. S., and Boudart, M., Hydrodesulfurization of Thiophene Over Unsupported
Molybdenum Carbide, Applied Catalysis, 1985, 19, 207. 21. St. Clair, T.P., Oyama, S.T., and Cox, D.F., Adsorption and Reaction of Thiophene on α-
Mo2C (0001), Surface Science, 2002, 511, 294. 22. Naito, S., Tsuji, M., and Miyao, T., Mechanistic Difference of the CO2 of CH4 over
Unsupported and Supported Molybdenum Carbide Catalysts, Catalysis Today, 2002, 77, 161.
23. Darujati, A.R.S., LaMont, D.C., and Thomson, W.J., Oxidation Stability of Mo2C Catalysts
Under Fuel Reforming Conditions, Applied Catalysis A: General, 2003, 253, 397.

56
24. LaMont, D.C., Gilligan, A.J., Darujati, A.R.S., Chellappa, A.S., and Thomson, W.J., Applied Catalysis A: General, 2003, 255, 239.
25. Zhu, Q., Zhang, B., Zhoa, J., Shengfu, J., Yang, J., Wang, J., and Hanqing, W., The Effect of
Secondary Metal on Mo2C/Al2O3 Catalyst for the Partial Oxidation of Methane to Syngas, Journal of Molecular Catalysis A: Chemical, 2004, 213, 199.
26. Lacheen, H.S., and Iglesia, E., Stability, Structure, and Oxidation State of Mo/H-ZSM-5
Catalysts during Reactions of CH4 and CH4-CO2 Mixtures, Journal of Catalysis, 2005, 230, 173.
27. Delporte, P., Pham-Huu, C., and Ledoux, M.J., Effect of the Reaction Temperature and
Hydrocarbon Partial Pressure on the Activity of Carbon-Modified MoO3 for n-hexane Isomerization, Applied Catalysis A: General, 1997, 149, 151.
28. Lamic, A.F., Pham, T.L.H, Potvin, C., Manoli, J.M., and Djéga-Mariadassou, G., Kinetics of
Bifunctional Isomerization over Carbides (Mo, W), Journal of Molecular Catalysis A: Chemical, 2005, 237, 109.
29. Ma, D., Shu, Y., Cheng, M., Xu, Y., and Bao, X., On the Induction Period of Methane
Aromatization over Mo-Based Catalysts, Journal of Catalysis, 2000, 194, 105. 30. Yuan, S., Hamid, S.B.D.A., Li, Y., Ying, P., Xin, Q., Drouane, E.G., and Li, C., Preparation
of Mo2C/HZSM-5 and its Catalytic Performance for the Conversion of n-butane into Aromatics, Journal of Molecular Catalysis A: Chemical, 2002, 184, 257.
31. Solymosi, F., and Széchenyi, Aromatization of n-butane and n-butene over Supported Mo2C
Catalyst, Journal of Catalysis, 2004, 223, 221. 32. Kojima, R., and Aika, K., Molybdenum Nitride and Carbide Catalysts for Ammonia
Synthesis, Applied Catalysis A: General, 2001, 219, 141. 33. Suryanarayana, C., and Grant Norton, M., X-ray Diffraction a Practical Approach, New
York: Plenum Press, 1998 34. Rodriguez, J.A., Chaturvedi, S., Hanson, J.C., Albornoz, A., and Brito, J.L., Electronic
Properties and Phase Transformations in CoMoO4 and NiMoO4: XANES and Time-Resolved Synchrotron XRD Studies, Journal of Physical Chemistry B, 1998, 102, 1347.
35. Chupas, P.J., Ciraolo, M.F., Hanson, J.C., and Grey, C.P., In Situ X-ray Diffraction and
Solid-State NMR Study of the Fluorination of γ-Al2O3 with HCF2Cl, Journal of the American Chemical Society, 2001, 123, 1694.
36. Freel, J., Chemisorption on Supported Platinum I. Evaluation of a Pulse Method, Journal of
Catalysis, 1971, 25, 139.
57
37. Li, X., Feng, L., Zhang, L., Dadyburjor, D.B., and Kugler, E.L., Alcohol Synthesis over Pre-Reduced Activated Carbon Supported Molybdenum-Based Catalysts, Molecules, 2003, 8, 13.
38. Lide, D.R. (ed.), Handbook of Chemistry and Physics, 86th Edition, Taylor & Francis CRC
Press, 2005. 39. Occupational Safety and Health Administration (OSHA),
http://www.osha.gov/SLTC/healthguidelines/carbonmonoxide/recognition.html, accessed August 29, 2005.
40. Fogler, S.F., Elements of Chemical Reaction Engineering, Upper Saddle River, New Jersey:
Prentice Hall, 1999. 41. Yaws, C.L., Yaws’ Handbook of Thermodynamic and Physical Properties of Chemical
Compounds, Knovel, 2003. 42. Choi, J.S., Personal Communication, July 20, 2005 by phone. 43. Sarkany, J., and Gonzalez, R.D., On the use of the Dynamic Pulse Method to Measure Metal
Surface Areas, Journal of Catalysis, 1982, 76, 75. 44. Fajardie, F., Tempére, J.F., Djéga-Mariadassou, G., and Blanchard, G., Benzene
Hydrogenation as a Tool for the Determination of metal Exposed on Low Loaded Ceria Supported Rhodium Catalysts, Journal of Catalysis, 1996, 163, 77.
45. Dietz, W.A., Response Factors for Gas Chromatographic Analyses, Journal of Gas
Chromatography, 1967, 5, 68.

58
Appendix A: Mass Flow Controller Calibration
This appendix provides calibration curves for the Brooks mass flow controllers used for reduction and reaction in the benzene hydrogenation reactor shown in Figure 3.
y = 0.344x
0
5
10
15
20
25
30
35
40
0 10 20 30 40 50 60 70 80 90 10
MFC Set Point (sccm He)
Mea
sure
d Fl
ow (s
ccm
UH
P H
2)
0
Figure 26: Calibration of MFC for UHP H2 Flow
y = 0.4939x
0
10
20
30
40
50
60
0 10 20 30 40 50 60 70 80 90 10
MFC Set Point (sccm He)
Mea
sure
d Fl
ow (s
ccm
5%
CO
/He)
0
Figure 27: Calibration of MFC for 5% CO/balance He

59
Appendix B: GC Separations
This appendix provides test separations and column specifications for the 35% BC-150 on 100/120 Chromosorb P AW column used to separate cyclohexane from benzene. For the test separation, 1 μL of an approximately 50/50 weight % mixture of benzene and cyclohexane was injected into the Hewlett Packard 5890 series II gas chromatograph.
0
1000
2000
3000
4000
5000
6000
7000
0 0.5 1 1.5 2 2.5 3 3.5 4 4.5 5
Time (minutes)
TCD
Sig
nal (
A.U
.)
CyclohexaneRetention Time: 0.403 min.Peak Area: 76775
BenzeneRetention Time: 2.003 min.Peak Area: 149938
Figure 28: Chromatograph of 1μL injection of a 1/1 mixture of benzene and cyclohexane,
where the GC oven was kept isothermal at 120ºC and data was collected for 5 min.

60
Appendix C: XRD Calibrations
In this appendix LaBa6 standards run for X7B distance and wavelength calibrations for data collected in: October 2003, March 2004, April 2004, and August 2005, is provided. This data is used in the integration of a circular diffraction image, as seen in Figure 2, to the standard 2-dimensional XRD pattern (Intensity vs. 2θ) (34).
Table 2: Data Collected through the Analysis of a LaBa6 Standard to Calibrate Experimental Conditions for XRD data Collected at NSLS.
10/2003 3/2004 4/2004 8/2005 Sum of Squares 4.0471 8.4712 15.907 0.044527 Number of Rejected Coordinates
0 0 0 0
Refined Beam Center (Pixels)
1169.090 1153.449 1169.535 1155.183 1169.768 1152.535 1164.453 1153.268
Refined Beam Center (mm)
175.364 173.017 175.430 173.277 175.465 172.880 174.668 172.990
Refined Sample to Detector Distance (mm)
145.240 148.324 167.763 152.321
Refined Wavelength (Ǻ)
0.92246 0.92130 0.92233 0.92042
Energy (keV) 13.44075 13.45765 13.44268 13.47057 Refined Tilt Plane Rotation Angle (º)
126.960 -61.278 -69.676 142.716
Refined Tilt Angle (º)
0.161 -0.223 -0.206 0.144
ROT X (º) -0.090 -0.107 -0.072 -0.115 ROT Y (º) 0.133 0.195 0.193 0.087 Stability Indicator (proportional to D-spacing; Angstroms)
1.55327 1.57611 1.73669 1.60687

61
Appendix D: Benzene Hydrogenation and CO Chemisorption Data and Calculations
This appendix provides calculations and raw data for benzene hydrogenation and CO
chemisorption experiments. V0
Cbenzene0 Cbenzene
Ccyclohexane
Known Values:
Hgmm44.32* =benzeneP
minmL340 =V
knownbuttested,catalystwithvaries=W
100=benzeneResponseThermal - from Dietz (43)
114=ecyclohexanResponseThermal - from Dietz (43)
KTs 274=
catalystgμmol111][
32/ −=OAlPtS
Measured Variables:
benzeneAreaPeakTCD
ecyclohexanAreaPeakTCD Gas Constant Used:
Kmolatmml057.82−
−=R
Finding Initial Benzene Concentration:

62
sbenzene RT
PC*
0 =
Finding Outlet Benzene Concentration by Gas Chromatograph:
)()( ecyclohexanbenzene
benzene
ecyclohexanbenzene
benzenebenzene RFRF
RFCC
Cy
+=
+= - from Dietz, Fogler (43, 40)
ResponseThermalAreaPeakTCDRF = - from Dietz (43)
Assuming 100% Carbon Balance and a differential reactor model (conversion <15%):
11
+−
=εbenzene
benzenebenzene y
yX
0benzeneyδε =
3−== ReactantsoftsCoefficienmetric- StoichioProductsoftsCoefficientricStoichiomeδ
ambient
ambientbenzenebenzene P
RTCy 0
0 =
WVCX
r benzenebenzenebenzene
00=− - from Fogler (40)
][Sr
TOF benzene−= - from Fogler (40)
Since we know [S]Pt/Al2O3, TOFPt/Al2O3 can be found:
32
32
32/
// ][
)(
OAlPt
OAlPtbenzeneOAlPt S
rTOF
−=
Assuming that TOF is constant for benzene hydrogenation on all catalysts, [S]Mo/C can be found:
32/
//
)(][
OAlPt
CMobenzeneCMo TOF
rS
−=

63
Table 3: Raw Gas Chromatograph Data for Benzene Hydrogenation tested on Mo/C reduced in UHP H2 to 675ºC at 10ºC/min, then held at 675ºC for 15 minutes
Time on Stream (min.) Cyclohexane TCD Peak Area Benzene TCD Peak Area 12.00 1574 41013020.50 1575 39546030.25 3061 32988635.50 1280 39704754.00 1223 356783
Table 4: Raw Gas Chromatograph Data for Benzene Hydrogenation tested on Mo/C reduced in UHP H2 to 725ºC at 10ºC/min, then held at 725ºC for 15 minutes
Time on Stream (min.) Cyclohexane TCD Peak Area Benzene TCD Peak Area 9.00 10682 403251
18.00 8277 40832836.50 7235 37894242.00 7302 37298148.00 6019 36749964.50 3921 36774085.00 2577 363060
103.25 1240 360758120.00 875 424706
Table 5: Raw Gas Chromatograph Data for Benzene Hydrogenation tested on Mo/C reduced in UHP H2 to 775ºC at 10ºC/min, then held at 775ºC for 15 minutes
Time on Stream (min.) Cyclohexane TCD Peak Area Benzene TCD Peak Area 10.00 23667 38084823.75 12710 39303741.75 10753 39254658.00 10305 37318178.00 7834 415611
120.00 4866 410296
Table 6: Raw Gas Chromatograph Data for Benzene Hydrogenation tested on Mo/C reduced in UHP H2 to 825ºC at 10ºC/min, then held at 825ºC for 0 minutes
Time on Stream (min.) Cyclohexane TCD Peak Area Benzene TCD Peak Area 10.00 45702 32412922.00 15759 37702246.00 5619 42533359.25 3867 431511

64
Table 7: Raw Gas Chromatograph Data for Benzene Hydrogenation tested on Mo/C reduced in UHP H2 to 825ºC at 10ºC/min, then held at 825ºC for 15 minutes
Time on Stream (min.) Cyclohexane TCD Peak Area Benzene TCD Peak Area 10.00 40271 34748725.75 34037 33684345.75 28625 33696060.75 20376 41288574.50 23776 332521
120.00 16648 387253
Table 8: Raw Gas Chromatograph Data for Benzene Hydrogenation tested on Mo/C reduced in UHP H2 to 825ºC at 10ºC/min, then held at 825ºC for 30 minutes
Time on Stream (min.) Cyclohexane TCD Peak Area Benzene TCD Peak Area 10.50 3237 39051532.75 995 43579846.25 1081 38021062.00 783 453991
Table 9: Raw Gas Chromatograph Data for Benzene Hydrogenation Data tested on Mo/C reduced in UHP H2 to 825ºC at 10ºC/min, then held at 825ºC for 60 minutes
Time on Stream (min.) Cyclohexane TCD Peak Area Benzene TCD Peak Area 11.00 0 41559916.00 0 406853
Table 10: Raw Gas Chromatograph Data for Benzene Hydrogenation Data tested on Mo/C reduced in UHP H2 to 875ºC at 10ºC/min, then held at 875ºC for 15 minutes
Time on Stream (min.) Cyclohexane TCD Peak Area Benzene TCD Peak Area 10.50 12235 39036129.50 2140 44357644.50 910 37964860.50 431 371463

65
Table 11: Raw Benzene Hydrogenation Data for Pt/Al2O3 reduced in UHP H2 to 425ºC at 10ºC/min, then held at 875ºC for 0 minutes
Time on Stream (min.) Cyclohexane TCD Peak Area Benzene TCD Peak Area 12.50 14149 39117933.25 17856 38426448.25 18686 38248563.25 17653 381567
0.00E+00
1.00E-05
2.00E-05
3.00E-05
4.00E-05
5.00E-05
6.00E-05
7.00E-05
8.00E-05
0 20 40 60 80 100 120
Time (minutes)
-rbe
nzen
e (m
ol/m
in*g
-cat
)
825 775
725 675
875 Poly. (825)
Expon. (775) Expon. (725)
Expon. (875) Expon. (675)
Figure 29: Effect of time-on-stream on the rate of disappearance of benzene for Mo/C
catalysts with varying final reduction temperature with exponential curve fitting to find initial rate of benzene disappearance
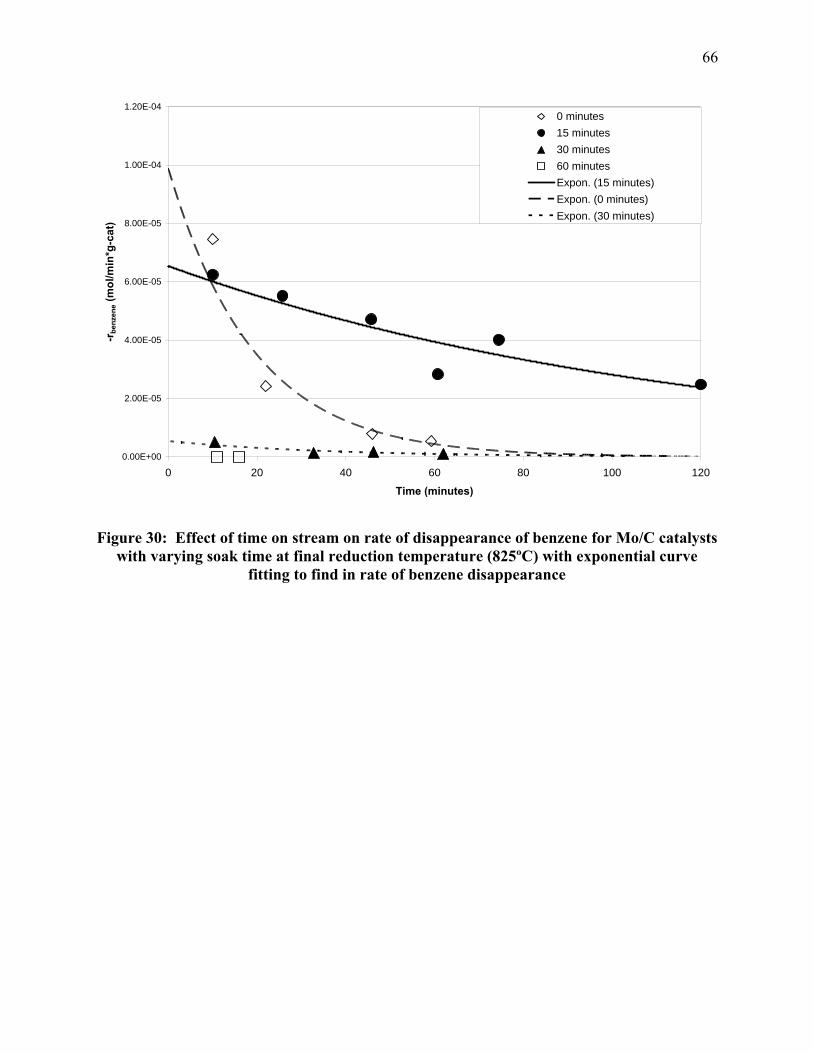
66
0.00E+00
2.00E-05
4.00E-05
6.00E-05
8.00E-05
1.00E-04
1.20E-04
0 20 40 60 80 100 120
Time (minutes)
-rbe
nzen
e (m
ol/m
in*g
-cat
)0 minutes15 minutes30 minutes60 minutesExpon. (15 minutes)Expon. (0 minutes)Expon. (30 minutes)
Figure 30: Effect of time on stream on rate of disappearance of benzene for Mo/C catalysts
with varying soak time at final reduction temperature (825ºC) with exponential curve fitting to find in rate of benzene disappearance

67
Appendix E: XRD Analysis of Spent Benzene Hydrogenation Catalysts
Analysis of XRD patterns of spent catalysts found to have benzene hydrogenation activity will be provided in this appendix.

68
Figure 31: XRD pattern of Mo/C catalyst tested for benzene hydrogenation, catalyst was reduced at 675ºC and held at 675º C
for 15 minutes

69
Figure 32: XRD pattern of Mo/C catalyst tested for benzene hydrogenation, catalyst was reduced at 725ºC and held at 725º C
for 15 minutes
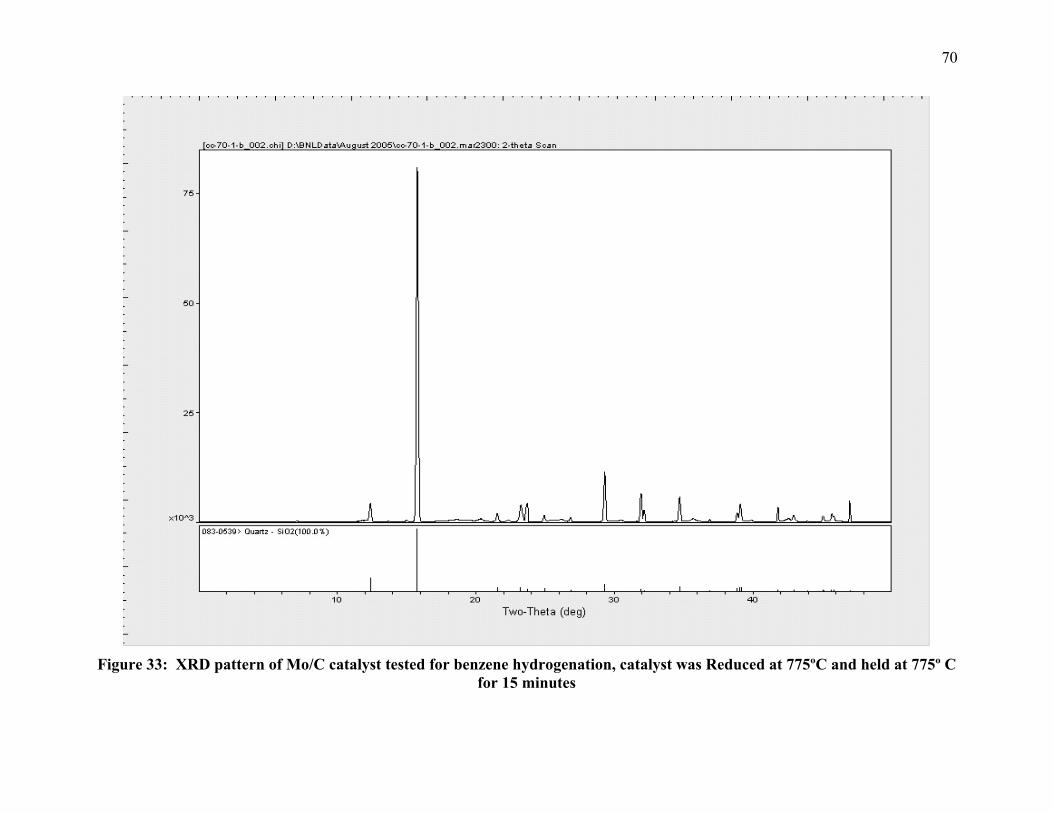
70
Figure 33: XRD pattern of Mo/C catalyst tested for benzene hydrogenation, catalyst was Reduced at 775ºC and held at 775º C
for 15 minutes

71
Figure 34: XRD pattern of Mo/C catalyst tested for benzene hydrogenation, catalyst was reduced at 825ºC and held at 825º C
for 0 minutes
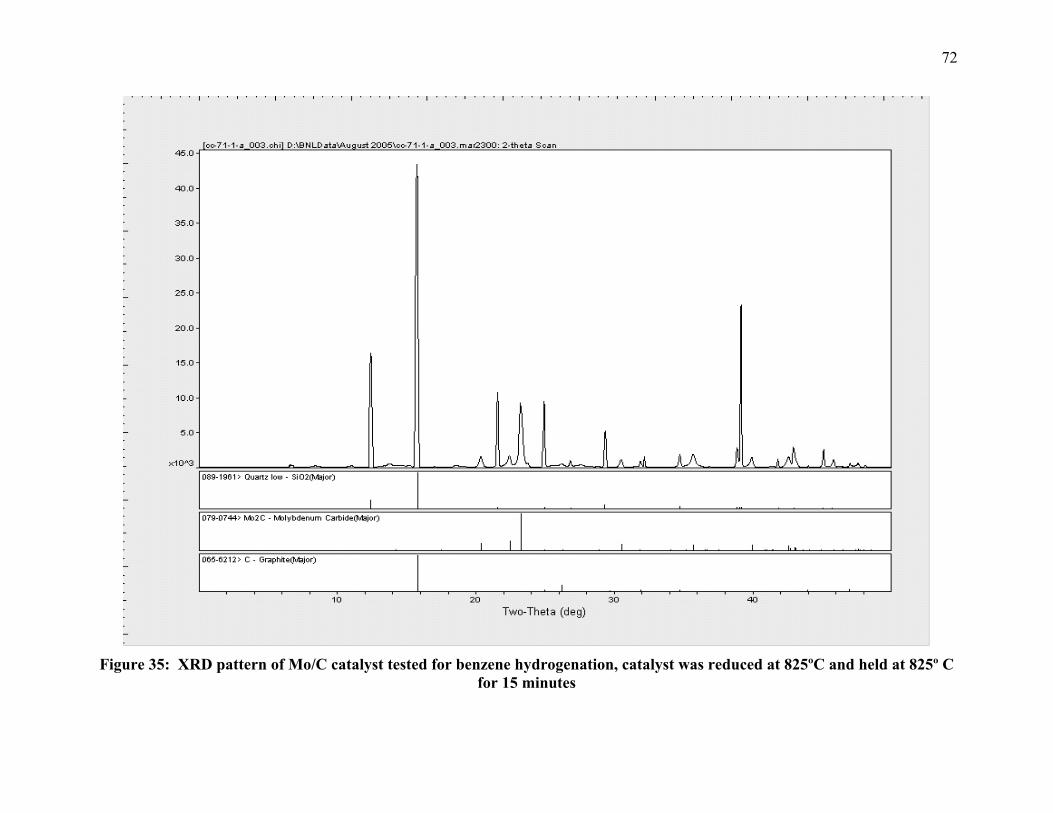
72
Figure 35: XRD pattern of Mo/C catalyst tested for benzene hydrogenation, catalyst was reduced at 825ºC and held at 825º C
for 15 minutes

73
Figure 36: XRD pattern of Mo/C catalyst tested for benzene hydrogenation, catalyst was reduced at 825ºC and held at 825º C
for 30 minutes

74
Figure 37: XRD pattern of Mo/C catalyst tested for benzene hydrogenation, catalyst was reduced at 825ºC and held at 825ºC
for 60 minutes

75
Figure 38: XRD Pattern of Mo/C catalyst tested for benzene hydrogenation, catalyst was reduced at 875ºC and held at 875º C
for 15 minutes

76
Appendix F: Reaction Equilibrium Calculations Detailed calculations involving the equilibrium between CO and CO2 during the
transition from MoO2 to Mo2C, described in Section 4.4.
COCCO 22 ⇔+
COfCOfr GGG )()(22
Δ−Δ=Δ
)ln( ar KRTG −=Δ
2
2)(
CO
COa y
PyK =
Table 12: Gibbs’ Energy of Formation and Reaction from Yaws’ Handbook for CO and CO2 (41)
T (K) ΔGf, CO2 (kJ/mol) ΔGf, CO (kJ/mol) ΔGr (kJ/mol)700 -393.06 -172.659 47.742800 -392.97 -181.573 29.824900 -392.87 -190.476 11.918
1000 -392.76 -199.367 -5.9741100 -392.63 -208.247 -23.8641200 -392.50 -217.115 -41.600
Copyright © 2022 FDOKUMEN