ELECTROCHEMICAL MACHINING OF CARBIDES AND ...
132
Lawrence Berkeley National Laboratory Lawrence Berkeley National Laboratory Title ELECTROCHEMICAL MACHINING OF CARBIDES AND BORIDES Permalink https://escholarship.org/uc/item/3rh1g38c Author Dissaux, Bernard Antoine Publication Date 1978-07-01 eScholarship.org Powered by the California Digital Library University of California
-
Upload
khangminh22 -
Category
Documents
-
view
4 -
download
0
Transcript of ELECTROCHEMICAL MACHINING OF CARBIDES AND ...

Lawrence Berkeley National LaboratoryLawrence Berkeley National Laboratory
TitleELECTROCHEMICAL MACHINING OF CARBIDES AND BORIDES
Permalinkhttps://escholarship.org/uc/item/3rh1g38c
AuthorDissaux, Bernard Antoine
Publication Date1978-07-01
eScholarship.org Powered by the California Digital LibraryUniversity of California
ELECTROCHEMICAL MACHINING OF CARBIDES AND BORIDES
Bernard Antoine Dissaux (M. S. thesis)
with Rolf H. Muller and Charles W. Tobias
July 1978
Prepared for the U. S. Department of Energy t~nder Contract W:--7405-ENG-48
TWO-WEEK LOAN COPY
LBL-8023
This is a Ubrar~ Circulating Cop~ which ma~ be borrowed for two weeks. ,
For a personal retention cop~, call
Tech. Info. Dioision, Ext. 6782

'~-'"'"'------~--- LEGAL NOTIGE-~"';"'----~~
, This report w~s prepared as an account of work sponsored by the United States Government, Neither the United States nor,the Departr'nentof Energy,' nor a:ny of, their'employees, nor any of, their con-,
, tractors, subcont~actors, or their employees, makes any warranty," expressw implied, or assumesanylegalliabilityor,responsibility for the accuracy, completeness oruseful,ness of any information, apparatus, product Or ,'process disclosed ,Qrrepresents that its use would not infringe pri~atelyowned rights. . ".
',;

ELECTROCHENITCAL MACHINING OF CARBIDES AND BORIDES
Bernard Antoine Dissaux (M. S, thesis)
with Rolf H. Muller and Charles W. Tobias
July 1978
LBL-8023
This work was done with support from the U. S, Department of Energy.

TABLE OF CONTENTS
I. INTRODUCTION
A. The ECM Process B. Characteristics of ECM Operation C. Electrode Reactions D. Scope of the Present Work
II. MATERIALS INVESTIGATED
A. Choice of the Materials and their Physical Characteristics
B. Choice of the Electrolytes
III. EXPERIMENTAL EQUIPMENT AND PROCEDURE
A. ECM Equipment B. Data Recording System C. Typical Performance of a Run D. Estimates of Experimental Errors E. Design of the Toolpieces
1. Choice of cylindrical geometry 2. General considerations for the design of
the toolpieces
IV. RESULTS
A. Presentation of the Results B. Titanium Carbide
1. Apparent electrochemical equivalent and valence of dissolution
2. Frontal gap of dissolution 3. Current~voltage relationship 4. Surface roughness; effect of the flow
conditions 5. SEH microphotographs: effect of the
current density
C. Zirconium Carbide
1. Electrochemical behavior 2. Frontal gap of dissolution
Page
-iv-
TABLE OF CONTENTS (continued)
3. Current voltage relation 4. Surface roughness 5. SEM analysis: effect of the electrolyte
and the current density
D. Titanium Diboride
1. Electrochemical behavior 2, Analysis of the reaction products 3. Frontal gap of dissolution 4. Current voltage relationship 5. SEM analysis: effect of the current density
E. Zirconium Diboride
1. Electrochemical behavior 2. Frontal gap of dissolution 3, Current-voltage relationship in KN0
3 4. SEM analysis: effect of the current density
SUMMARY AND CONCLUSIONS
APPENDIX: Design of the Toolpiece
REFERENCES
Page

ELECTROCHEMICAL MACHINING OF CARBIDES AND BORIDES
Bernard A. Dissaux • Rolf H. Muller and Charles vJ. Tobias
Materials and Molecular Research Division, Lawrence Berkeley Laboratory and Department of Chemical Engineering, University of California,
Berkeley, California 94720
ABSTRACT
The use of high rate anodic dissolution (electrochemical
machining) for shaping titanium carbide, zirconium carbide, titanium
boride and zirconium boride has been investigated in 2N potassium
nitrate and 3N sodium chloride under current densities ranging from
20 to 120 A/cm2 (corresponding to cutting rates of 0.3 to 1.8 mm/min).
The dissolution stoichiometry for all these materials is
independent of the current density in the range 20 to 120 A/cm2 .
Both titanium and zirconium appear to dissolve in the +4 state, boron
in the +3 state and the weight loss measurements indicate that carbon
is oxidized to CO and co2
•
The current voltage curves permit to establish that, over the
entire current density and flow range investigated, dissolution occurs
in the transpassive state.
The surface roughness obtained on TiC and ZrC is within
3-5 ~m and is independent of current density, applied voltage or flow
rate.


I. INTRODUCTION
A. The ECM Process
Electrochemical Machining (ECM) is finding increasing use in
industry for metal removal. Several authors (1,2,7,8) discuss different
designs of equipment and various commercial applications. A thorough
review of the state of the art is presented by J. Bannard (20). A
large number of patents have been issued since the first application of
electrochemical methods for the machining of metals (3). Most of
these patents relate to improvements in the design of toolpieces (4,5,6)
i.e., the machining of special shapes such as turbine blades (11, 12),
tiny holes (15), teeth of multitooth cutters (16), or to the construc
tion of ECM equipment (9,10). Others pertain to the machining of
industrial materials such as sintered tungsten carbide with cobalt as
a binder (13), and vanadium steels (14), or to the application of mixed
electrolytes (14, 55) to dissolve simultaneously all compounds present
in alloys. The use of alternating current has been proposed to
prevent formation of a highly resistive anodic film (13, 26).
The ECM technique is of special interest in aerospace industries,
in the manufacture of microcomponents,and in some specific area where
conventional machining techniques cannot be used and where the machining
area is not accessible to common rotating tools,
ECM is also of a major advantage in special applications where the sur
face is to be left undisturbed.~ Usually a conventional machining
technique utilizes the shearing action of a sharp tool against the
workpiece to achieve metal removal, thereby affecting the physical
properties on the surface of the material. In contrast, since in ECM

there is no contact between the toolpiece and the workpiece, such
alterations of the properties do not occur (17).
ECM utilizes removal of a metal by anodic dissolution into a
flowing electrolyte according to well-known electrochemical principles
(27, 1). Metal ions released by a positively polarized material
migrate towards the negatively polarized electrode causing a flow of
charge through the cell. The electrical circuit is completed by elec
trons flowing through the electrical loop outside the cell. Thus, the
positively polarized electrode, or anode, dissolves while at the
negatively polarized electrode, or cathode, a reduction reaction occurs.
The preponderant cathodic reaction is the reduction of hydrogen ions
(or of water) to hydrogen gas.
The driving force for the flow of current is the potential
applied across the electrodes. Increasing this driving force will en
hance the rates of dissolution and of migration of the ions in the
electrolyte. The laws governing the rates of dissolution that can be
achieved as a function of rate of flow of electrolyte, and the depen
dence on applied potential are well established. The reader is referred
to standard references for a detailed treatment of this subject (59,60,
2, 42)'
On the anodic side, the metal dissolves according to Faraday's
law which stipulates that if a metal of molecular weight A, dissolves
according to the half reaction:
ze

the amount of material removed per second is
LlM I F n (1)
where F is the Faraday's constant (96,500clbs/gram-equivalent), n the
current efficiency of the anodic reaction, and I the current (amps).
As the electrochemical machining of a material in a certain
electrolyte depends only on the electrochemical properties of this
couple, and not on the physical properties of the material itself, ECM
has been considered for use in machining materials with special physical
properties widely used in industry. Whereas in conventional machining,
the main concern for working on a specific material involves finding
a toolpiece which has superior physical properties (hardness, toughness,
high tensile strength), there is no need for having such constraints
in ECM operations, because the tool (cathode) never comes in contact
with the workpiece (anode).
B. Characteristics of ECM Operation
High flow velocities of electrolyte are needed in order to remove
the heat evolved, as well as to supply the reactants in the electrolyte
and to remove the reaction products. To obtain a dimensionally
accurate replica of the cathode geometry, and to keep the ohmic losses
between the electrodes as low as possible, the interelectrode gaps
are usually maintained below 1 mm.
The high flow requirements used in ECM are needed to remove the
heat evolved by the passage of high currents, Typical current densities

used in industrial applications vary from 30 to 300 A/cm2
. As calculated in
previous work (22,23,61), in the absence of flow, Joule heating may
cause the electrolyte to boil almost instantaneously after switching on
the current. The flow used in practical ECM operation is always
turbulent (Re ~ 10,000), consequently the pressure drop through the
machining section is significant.
Another important use of high electrolyte velocities is the
removal of the reaction products(usually precipitated in the form of
oxides or hydroxides). If they were to stay in the vicinity of the
anode, they would cover its surface and , as they are often poorly
conductive materials, cause oxygen evolution without dissolution of the
metal. If the current efficiency of dissolution were to significantly
decline, and the cathodic toolpiece were to advance at a constant rate
towards the anode, the two electrodes would eventually get close enough
for destructive gaseous discharge to occur.
In normal ECM operation, metal is continuously removed at a
constant rate of the workpiece, when steady state is reached. As the
tool is moved towards the anode at constant current density and constant
interelectrode distance, the final shape obtained on the workpiece
is roughly a complementary shape or an imprint of the toolpiece.
C, Electrode Reactions
For a practical use of an EC~1 machine, a complete knowledge of
the electrochemical reactions occurring at the electrodes is desirable.
Several reactions may occur simultaneously at the interface of the two
electrodes and in the electrolyte. The main reaction types are reviewed

below.
Anodic Reactions
They are the most important features of the process because they
are the basic principle of ECM and govern the conditions under which
a metal is being electrochemically machined. The anodic material is to
be dissolved by electrochemical reactions according to the half reaction
M + ze
The number of electrons involved in the reaction governs the
amount of electrical charge required and gives the ionic species formed
during anodic dissolution which carry a part of the current towards
the cathode. (The rest of the current being transported by the ionic
species present in the electrolyte.) The dissolved metal ions are
carried away from the anode-electrolyte interface into the bulk of the
electrolyte by migration and by flow of the electrolyte itself. They
either remain in solution or precipitate as solids and are swept away
by the flow. Dissolved metal ions may be reduced if they reach the
cathode. Electrolytes are usually so chosen that the dissolved ionic
species are precipitated and swept out of the machining section.
The electrolytes usually employed for ECM are neutral salts in
aqueous solutions. A possible side reaction at the anode is
+
leading to the evolution of oxygen and reducing the efficiency of the

cutting process. This reaction occurs when certain passivating films
form on the machined surface. Usually dissolution occurs in the
active state, or in the transpassive state, with little or no oxygen
evolution (23, 44). When mild steel is machined in NaCl03
, less than
8% of the current is devoted to the parasitic oxygen evolution as
compared to 50-96% in 2N NaN03 (21).
Cathodic Reactions
The principal reaction is
in acid electrolyte:
in neutral or basic electrolyte: 2 OH-
The hydrogen formed has to be efficiently removed by fast flow of
electrolyte to preclude gas blanketing the surface of the cathode.
Reduction of anions (e.g. N03-) may also occur;
cessive costs of reprocessing of the electrolyte.
this can lead to ex-
+ + The Na or K present
in the electrolyte cannot interfere with the hydrogen evolution, because
the discharge of these ions requires potentials which are far higher
than achieved at the cathode/electrolyte interface. Even if the alkali
ion discharge were possible, these metals would instantaneously react
with the water present in the electrolyte and generate hydrogen.
If the ionic species dissolved at the anode reach the cathode
in the same state as they left the anode, they may be reduced on the
cathodic toolpiece and thereby change its shape, causing poor dimensional

control of the cut in the anode. Cathodic deposition of the metal is
usually avoided by the use of a low pH or neutral electrolyte (2) and
a high velocity through the machining section, sweeping almost instan~
taneously the insoluble reactions products so that the hydrogen ions
present in the solution are the only species able to react on the
cathode.
The hydrogen blanketing of the cathodic surface (60) is also
responsible for the rise ~n temperature of the electrolyte; this effect
is reduced by high flow velocity.
D, Scope of the Present Work
Among the hardest materials used in industry are the refractory
carbides and borides of the transition metals. Most of these are used
in the form of cemented composites, enhancing different mechanical
properties needed for a specific use. Cobalt, the binder usually em
ployed in tungsten carbide, has been proven to improve the resistance to
wear and impact; also a small amount of chromium greatly improves the
corrosion resistance.
To eliminate ambiguities resulting from the presence of binders,
pure carbides and borides of titanium and zirconium have been chosen
as the vehicles of this work.
The object of this research was to determine the applicability of
ECM to these materials and to identify operating conditions (electrolyte
composition, cutting rates and tool design) under which these materials
are machinable. The choice of NaCl and KN03
has been based on previous
reports on the suitability of these electrolytes (31, 1). A cylindrical

toolpiece has been chosen to obtain reproducible results on small
machined areas.

II. MATERIALS INVESTIGATED
A. Choice of the Materials and their Physical Characteristics
The choice of the materials investigated in this workwas basically
guided by three considerations: hardness, high temperature stability
and electrical conductivity.
The hardness is an important property insofar as a choice between
conventional machining and ECM is concerned. Carbide or boride tool
bits, grinding heads, etc. are usually manufactured by presintering a
powder of the material in a vacuum furnace, then formed to shape by
conventional machining techniques (turning or grinding) followed by
vacuum sintering. This widely used technique requires a substantial
amount of time and, during the last sintering phase of the process,
a shrinkage of 30% to 50% by volume is unavoidable (28). This means
that close dimensional control is the critical point of such a process
and a lot of time is required to obtain the final shape. Such critical
steps can be shortened by using an ECM technique to machine the final
shape, especially if the desired shape is to be reproduced many times (29).
High temperature stability is of interest in cases where the
materials are used under particularly severe conditions. Because of
good oxidation resistance, carbides and borides should be excellent
materials for various parts of gas turbines (30), where the use of a
working fluid at very high inlet temperature is a factor governing
the efficiency of the fluid cycle. Ceramics are commonly used as ro~
tating parts of gas turbines due to their excellent corrosion and
oxidation resistance. But ceramics are very brittle, and difficulties
arise in shaping them because of chemical and mechanical non-uniformities

b:aterial
. TiC
'
ZrC
TiB 2
ZrB2
Copper metallic
imp. ·~ .01 %
rrtardness~ :Slectrical density porosity melting formula aspect and con:::osition***
conductivity litt. obs. point weight structure (% -oy weigi1t)
I
1.18 104 96 2%** 4.93: )+.33 12 % 3150°C 59.91 grey metallic Ti : 80.00 %
I c : 19.5 % NaCl type Fe,Si,Ca,Na,O, J~.3 %
!
92.5 l. 54 104
3%** 6. 73 I 4. 96 26 % 3530°C 103.23 metallic Zr : 38.4 % I f.c.c c : 11.6 %
3.52 104 I
69.52 Ti : 68.30 % 99 6%** 4.50 1 4.43 1.5% 2900°C grey B : 31.40 % I
I hexagonal Fe, C , H, N, 0 ' . 3 %
87-89 10.8 104 18%**
I
4.3 % 3040°C 112.84 Zr : 80.4 % 6.09 I 5.83 grey with I cracks B : 19.15 % I hexagonal Fe,C,J,N~ .35 % I
27 58.8 104
8.94 l083°C 63.5 red f.c.c.
--·-* Rockwell A : 60 kg load, brale penetrator. ** % of the electrical conductivity (ohmAcm~ of copper. *** typical analysis obtained from the manufacturer : HASELDEN Co, San Jose, California.
Table I : principal characteristics of the materials used in this wor~.
I 1-' 0 I
-11-
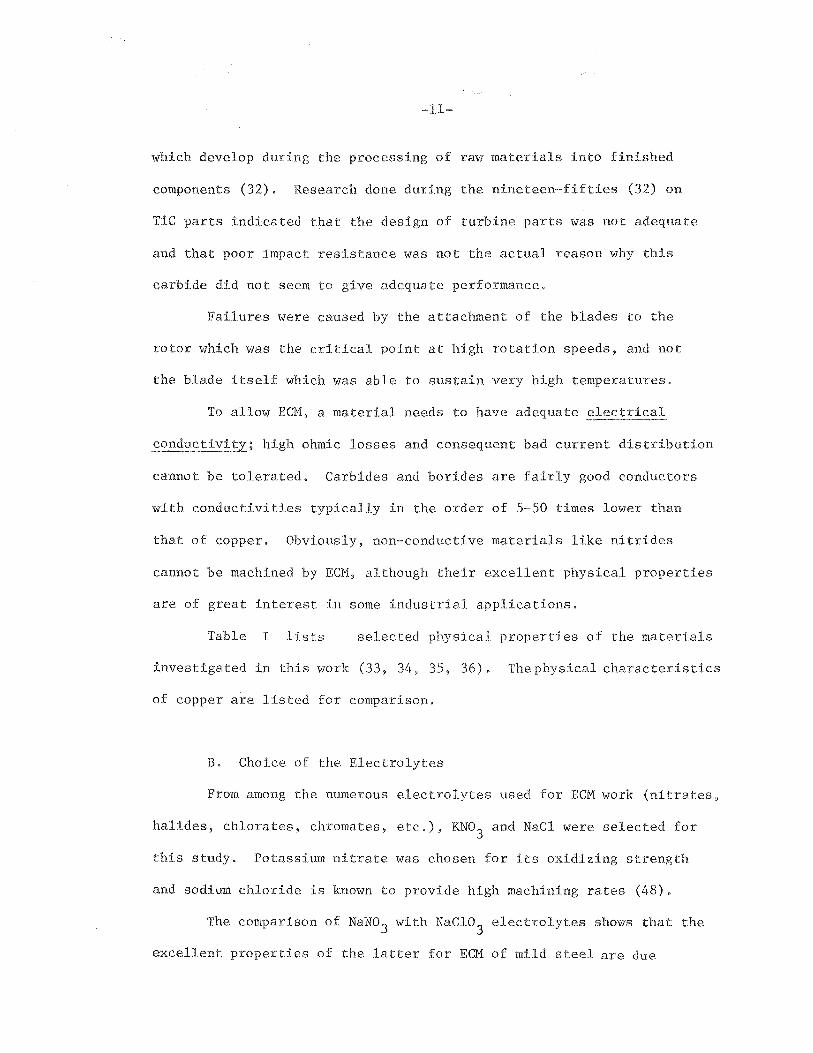
which develop during the processing of raw materials into finished
components (32). Research done during the nineteen-fifties (32) on
TiC parts indicated that the design of turbine parts was not adequate
and that poor impact resistance was not the actual reason why this
carbide did not seem to give adequate performance.
Failures were caused by the attachment of the blades to the
rotor which was the critical point at high rotation speeds, and not
the blade itself which was able to sustain very high temperatures.
To allow ED1, a material needs to have adequate electrical
conductivity; high ohmic losses and consequent bad current distribution
cannot be tolerated. Carbides and borides are fairly good conductors
with conductivities typically in the order of 5-50 times lower than
that of copper. Obviously, non-conductive materials like nitrides
cannot be machined by ECM, although their excellent physical properties
are of great interest in some industrial applications.
Table I lists selected physical properties of the materials
investigated in this work (33, 34, 35, 36). Thephysical characteristics
of copper are listed for comparison.
B. Choice of the Electrolytes
From among the numerous electrolytes used for ECM work (nitrates,
halides, chlorates, chromates, etc.), KN03
and NaCl were selected for
this study. Potassium nitrate was chosen for its oxidizing strength
and sodium chloride is known to provide high machining rates (48).
The comparison of NaN03 with NaClo3
electrolytes shows that the
excellent properties of the latter for ECM of mild steel are due
-12-
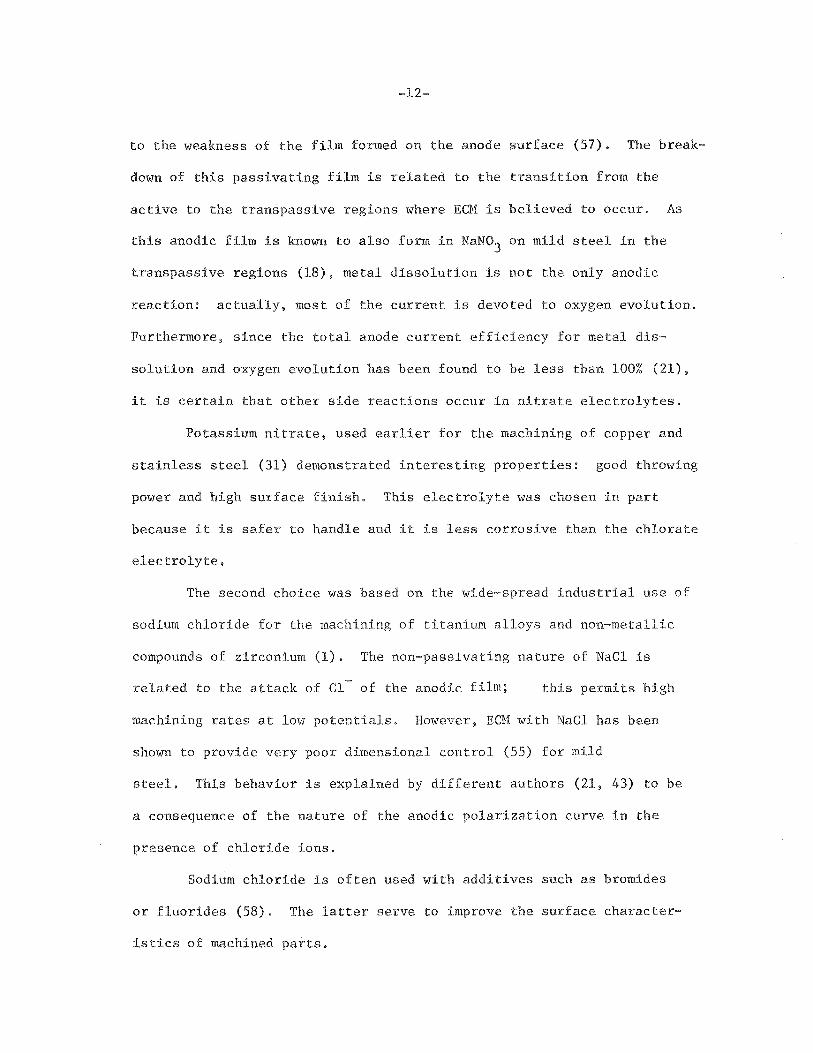
to the weakness of the film formed on the anode surface (57). The break
down of this passivating film is related to the transition from the
active to the transpassive regions where ECH is believed to occur. As
this anodic film is known to also form in NaN03 on mild steel in the
transpassive regions (18), metal dissolution is not the only anodic
reaction: actually, most of the current is devoted to oxygen evolution.
Furthermore, since the total anode current efficiency for metal dis
solution and oxygen evolution has been found to be less than 100% (21),
it is certain that other side reactions occur in nitrate electrolytes.
Potassium nitrate, used earlier for the machining of copper and
stainless steel (31) demonstrated interesting properties: good throwing
power and high surface finish. This electrolyte was chosen in part
because it is safer to handle and it is less corrosive than the chlorate
electrolyte,
The second choice was based on the wide-spread industrial use of
sodium chloride for the machining of titanium alloys and non-metallic
compounds of zirconium (1). The non-passivating nature of NaCl is
related to the attack of Cl of the anodic film; this permits high
machining rates at low potentials. However, ECH with NaCl has been
shown to provide very poor dimensional control (55) for mild
steel, This behavior is explained by different authors (21, 43) to be
a consequence of the nature of the anodic polarization curve in the
presence of chloride ions.
Sodium chloride is often used with additives such as bromides
or fluorides (58). The latter serve to improve the surface character
istics of machined parts,

~13~
III. EXPERIMENTAL EQUIPMENT AND PROCEDURE
A. ECM Equipment
The experimental equipment, a job shop gun drill manufactured
by Hanson Van Winkle Munning Company, has already been described in
full detail elsewhere (31). The only modifications, made for this
work, to the equipment used in a previous work are:
~ installation of a large capacitor (300,000 mFd at 50 Volts)
across the output terminals of the power supply to reduce
the ripple from 10% to less than 3%.
installation of the data recording system described in
this section.
·;'::. The schematic diagram (Fig. 1) depicts the power supply [1],
capable of delivering 500 amps at 30 Volts maximum; the cutting
chamber [2], and the electrolyte filtration system [4 and 5]. The
toolpiece [8] is mounted on a feed ram advancing with a variable speed
towards the workpiece fastened to a stand [7]. The electrolyte is
pumped [3] through the flow lines and filtered [10] before entering the
cutting chamber. The flo>v rate of the electrolyte, controlled by a
set of valves, is measured by a magnetic flowmeter (11]. The pressure
drop in the EC}f gap is measured by the inlet of electrolyte in the cutting
chamber by means of a strain gauge [12], Temperatures are recorded
both before and after [13] the machining gap. After passing through
the machining section, the electrolyte is recycled [6] in the main
tank [4] following filtration through fiberglass insulation material [9].
* The brackets [] in this section refer to areas of Figure 1.

Figure l : Schematic flow diagram.m and position of the measuring gauges; power suppl:.-( 1), cutting chamber(2), main tank of electrolyte(4), recycle of electrlyte(5), toolpiece(8), temperature sensors(l3), pressure gauge(l2), flowrr.eter(lO).
11
11i
+P---~------~----~~ -------------......:::"'----.......:=--------
4 \
1_/
E rimental setup
XBL
I 1-' .p... I

-15-
CBB 734-4786
Figure 2. Experimental equipment, from left to right: data recording system, power supply, cutting chamber and electrolyte tanks,

The gaseous products evolved during ECM are vented to a hood [16].
The cell voltage [14] is recorded and the current [15] is measured
through appropriate shunts.
B. Data Recording System
Experimental data were measured and recorded continuously
throughout all the runs to follow the different parameters during the
machining process and to determine when steady state has been achieved (40),
An interesting feature of ECH is that the machining parameters adjust
themselves according to the operating conditions. The reason for this
is that if the toolpiece is moved towards the workpiece at a faster
rate than the metal is being dissolved the gap will decrease, As the
gap decreases, the resi~tance of the electrolyte in the gap is lowered
and therefore, the current increases. Thus, the metal removal rate
rises until an "equilibrium" value is reached where the gap (40, 23),
the current and the metal removal rate become constant, At steady state
the tool feed rate is equal to the metal removal rate. (The same
reasoning is applied if the toolpiece is moved toward the anode-workpiece
at a smaller rate than the metal removal rate, leading to the same
"equilibrium" in machining parameters),
The continuous recording of the operating parameters allows the
operator to recognize problems such as:
-sparking if filtration is not adequate, allowing small metal
particles to flow through the machining gap and to short
circuit the electrodes. (An internal overload switch is provided
on the power supply which automatically shuts off the current

~17~
fig A
2
r
fig B
XBL 785-8726
Figure 3. Data recording system. A) Schematic of voltage and current recordings: digital display (1), current shunt (2), 300,000 mFd capacitor (3). B) Schematic of the position of the toolpiece recording: precision rotary resistor (1), attached to the feed ram (2), separate power supply (2), power source (3).

~18-
if this happens).
-arcing if the feed rate of the workpiece is set too high or
when the recycled electrolyte is filtered and recirculated
at too low a flow rate, resulting in gas blanketing.
A multi~channel strip chart recorder is used to display six
variables in a semi-continuous manner (one data point printed in each
channel every six seconds). The maximum input for each channel is
10 mV~ each variable is measured from transducers with d.c. voltage
outputs through voltage dividers or amplifiers.
Voltage recording: The voltage dividers are schematically
represented by Figure 3A. The use of voltage dividers is necessary to
cut down the voltage applied across the electrodes by the power supply
from 30 Volts maximum to 10 mV. The actual voltage Vo is related to
VIR' the input to the recorder as follows:
VIR ~ ~ R2 ) RlR2T + RORl + ROR2T
Vo
(see the caption of Figure 3A for identification of the resistances)
The full scale is set at 30V maximum, the correlation between the
applied voltage and the chart reading being:
V [0.08 + 0.30 (%reading)] Volts
The accuracy of this reading is better than 0.5% at 20% reading
of full scale.

-19-
Current recording: The power supply is capable of delivering
500 amperes at 30 Volts. the current output can be measured across a '
50 or 500 ampere shunt. The maximum available current is large for
the size of the machined area used in this work and as the tool surface
area was below 0.4 cm2
and the current density not allowed to exceed
2 120 A/em • the full scale of the current recording was set at 50 amps.
In Figure 3A the resulting voltage, VIR" serves as the input to
the strip chart recorder, according to
SI
where S is the value of the internal shunt of the power supply, and
R2 the percentage of the total resistance R2T.
Temperature recording: The recording of the temperature allows
the knowledge of the heat generation due to Joule effects occurring
within the gap between the two electrodes as ECM proceeds. As already
shown by various authors (23), the temperature rise in the working gap
may be of significance and may affect the dimensional accuracy and
surface finish (1, 61). Because of the impossibility of measuring the
temperature exactly in the very small machining gap (around 20 mils)
without introducing serious perturbations in the flow by the temperature
sensor, the probes are placed at the inlet and at the outlet, as close
as possible just before and after the machining section.
The voltage drop across the thermistors is measured by a Wheastone
bridge as shown in Fig. 4D. The unbalance of the bridge introduced by
the change of temperature is used as the measuring signal. The two

-20-
1
4 fig c
4 r
fig D
XBL 785-8725
Figure 4, Data recording system: C) Pressure recording: sensor element (2), in line pressure (3), digital display (1), power source (4), D) Temperature recording: thermistor (1), the zero (2) and the span (3) can be adjusted.

-21-
variable resistances [2] and [3] in Fig. 4D are used for setting the
span and the zero of the sensing element [1].
The zeroing and span settings are set so that the error is the
smallest around ambient temperature,and 20% reading on the chart recor-
der gives a temperature of 20°C with a0.5% error. As the response of
the temperature probe is linear, the chart can be directly read in
degrees Centigrade.
Pressure recording: The inlet pressure of the electrolyte is
measured by means of a strain gauge transducer. Four strain gauges,
bonded to a strain sensitive element,are connected to a Wheatstone
bridge circuit (Fig. 4C). The pressure [3] acting on the diaphragm
transmits strain to the sensor [2], and unbalances the bridge circuit;
this voltage unbalance is directly proportional to the pressure.
Gauge pressures occurring are in the range of 0-100 psi. The sensi
tivity of the gauge is 3mV/V! 0.015 mV. The gauge is supplied by a
! 1% regulated solid state power supply. The voltage divider is set for
full scale at 100 psi, the sensitivity of 1 psi.
Position recording: The movement of the toolpiece is transmitted
to a precision rotary resistor which moves along a cursor according to
the tool position as schematically represented by Fig. 3B. The voltage
drop across this varying resistance serves as an input to the recorder.
The input voltage to the recorder with the proper choice of
resistance to allow 10 mV d.c. maximum voltage is then:
(
1_
1 +

-22-
The position transducer is a precision linea~ resistance (0.25%)
of 100 n. The slope of the straight line recorded on the chart gives
directly the feed rate of the toolpiece by the relationship;
Fr = (chart speed) tang a
The tool feed ram is also equipped with a dial (graduated in mils)
which allows the setting of the starting machining gap and also
facilitates the visual observation of the advancement of the tool.
Flow rate: As shown in Fig. 1, the velocity of the electrolyte
is controlled by a set of valves and recorded by means of a magnetic
* flowmeter ,
The flow meter is calibrated for velocities ranging from 600
to 5000 em/sec corresponding to flow rates up to 12 liter/min.
A typical set of data recorded during an experiment
is shown in Fig, 5.
C. Typical Performance of a Run
The electrolytes were prepared in batches of about 120 liters,
dissolving the required weight of analytical reagent solid crystals in
low conductivity water (twice deionized in adsorption columns) and
adjusting to the specific density corresponding to 2N for KN03
(d~~ = 1.1201 g/cc) and 3N for NaCl (d;~ = 1.1182 g/cc) after complete
dissolution.
* Brooks Instruments: Flowhead Model 7187 equipped with the signal converter Model 7460.

100-
so !:II>
"" '!!l> 0 <II> ...
~60 G:. <.>
~
40
20
@pplied Vii»Uoge
peneh<Uion il:lf tool
outlet tempe roture
flow rote
~ j)f®$$i.lfll
' <;. 3 5 0~--~----~----~----~----~----~----~----~----~---L~----~----~
4 6 7 8 9 10 time (min.)
Figure 5. ECM recording by using the toolpiece B. The steady state is attained after 3 minutes. Run #164: TiC in 3N NaCl, 17.6 Amps at 25.1 Volts, tool feed
-2 rate= 4.43 10 , flow rate= 4.27 at 23 psig.
i N w i

b
2
A I I
v
I I '
' ''
2
fig A
-24-
I '
·''
3
fig B
5
XBL 785-8729
Figure 6. A) Design of the toolpiece used in this work: mounting socket (1), step to divert the electrolyte (2), tip of the toolpiece in copper (3), aerial view of design B (4), and of design A (5). B) Cell configuration in this work: a) toolpiece: brass tubing (1), insulator (2), step on the tip of the toolpiece-(3), electrolyte entries (4). b) workpiece: h.d. =outside diameter of the hole drilled. A,B,C,D refer to table II.

~25-
Tool overall length outside inside ~ S( el.) S(eL) length of tip diameter diameter hole S(ECM) S(total)
(A) (B) (C) (D) <:o.~...--=--=·""''"""'"==-""~''".....,..,~==<-~' ·---------~-. "' >»~
design A 9.50 0.20 0.625 0.445 1.03 51 %
design
design
A 5.00 0.50 0.645 0.375 0.51 34 %
B 6.70 0.50 0.700 0.375 0.1 0.11 10 % , ____ , ___ ..._.,.,_,...,._,.~~""-"'"'•v.-•<>·=••~~ • ~<t.O.<
Table II. Dimensions of the toolpieces; they are listed in ems and represent the design dimensions as referred to figure 6B-.--They may vary due to the different polishing operations before coating and are always carefully controlled. In the last two columns, S (total) represents the overall cross sectional area of the tip of the toolpiece, S (ECM) the surface area where current flows and S (el.) the surface area of the electrolyte entries.

-26-
XBB 785-6126
Figure 7. !££: Parts of the toolpiece before soldering, from left to right mounting socket, brass tubing, tip of the cathode, drill used for the five small holes.
bottom: Jig used to position the tip and drill the electrolyte entries before soldering on the toolpiece.

-27-
One batch was used for each set of experiments which included
one type of anode material in one electrolyte (representing about 30
runs), The electrolyte was renewed after each new material investi
gated,
The following procedure was followed in each experiment:
~ polishing the tip of the toolpiece with #600 abrasive paper
and controlling the dimensions;
~ mounting the toolpiece on the tool feed ram after cleaning
the tip with detergent followed by drying in acetone;
- clamping the workpiece sample on the stand provided in the
cutting chamber after weighing the sample;
setting an initial starting gap by the dial indicator, using
a 2 mils copper foil;
- turning on the chart recorder;
- measuring density and initial temperature fo the electrolyte
before the run;
- adjustment of the initial flow rate and pressure by the use of
valves;
~ flushing the lines for five minutes to stabilize the pressure
and the flow rate;
- applying the preset voltage between the toolpiece and workpiece;
~ switching on the tool feed rate preset on a 0-100% dial indicator.
After the steady state is reached. as checked on the recorder
(one to three minutes depending on the toolpiece feed rate and the
starting gap) 1 ECM operation is maintained at constant parameters,
After the power is turned off. by means of a single switch which

~28~
shuts off the pump. the power supply and the advancement of the tool
piece, the position of the tool is precisely recorded on the ram dial.
After removal, the sample is cleaned, rinsed with tap water and dried
under vacuum, The sample is then weighed and its dimensions are re
corded (outside diameter~ depth of hole).
The data recorded for each experiment include:
- applied voltage;
- current at steady state;
- tool advancement rate;
- starting gap;
- position of the tool before and after experiment;
- density and temperature of the electrolyte before the run;
- flow rate and pressure of the electrolyte;
- inlet and outlet temperatures of the electrolyte;
- time of the experiment;
- weight of the sample.
After each experiment, the following data are recorded:
- diameter of the hole
- depth of the hole
- weight of the sample used;
- ECM gap.

-29-
b
a
c
d
XBB 785-6125
Figure 8. Toolpieces used in this work: a) and b) design B c) and d) design A
~30-
CBB 784-4784
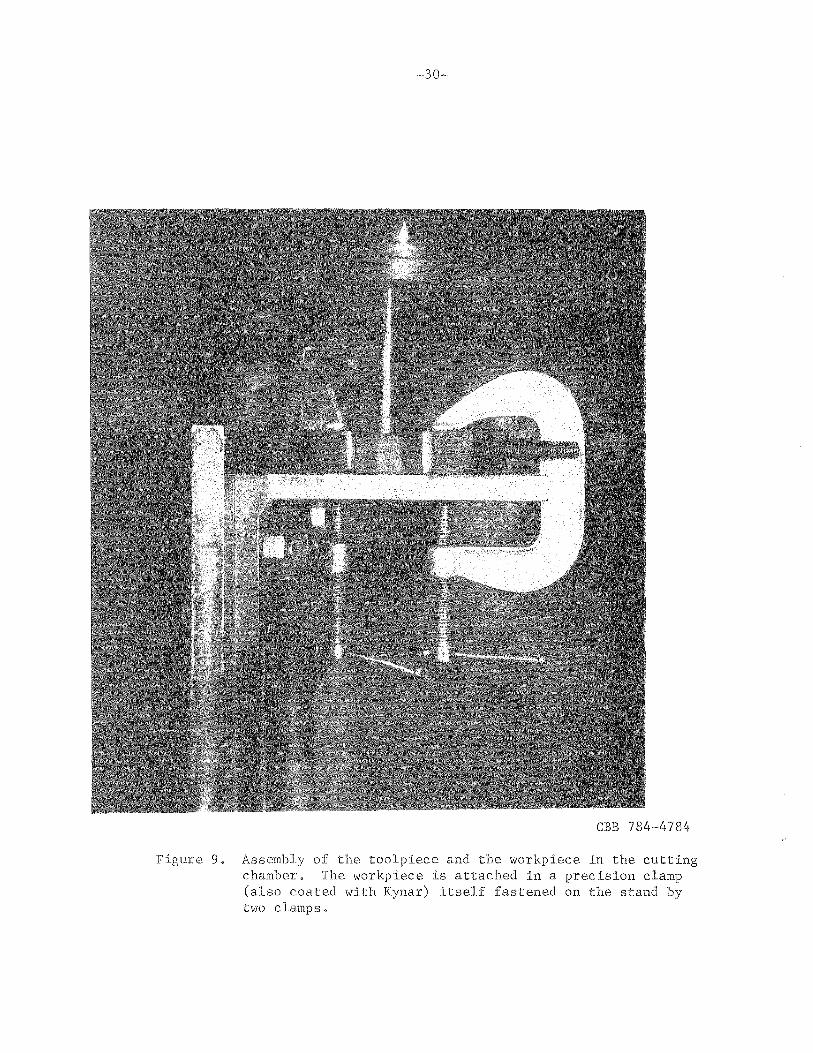
Figure 9. Assembly of the toolpiece and the workpiece in the cutting chamber, The workpiece is attached in a precision clamp (also coated with Kynar) itself fastened on the stand by two clamps.

-31-
D. ESTIMATES OF EXPERIMENTAL ERRORS
Symbols Absolute Error Relative Error
Applied Voltage t:N ± 0.1 Volt 0.4 - 1%
Current I ± 0.1 amps 0.3 - 1%
Penetration of Tool 0 ± 1 mil 0.2 - 0.5% i<
Time t 5 sec 0.3 - 1%
Pressure p . 5 psi < 1%
Dimensions cp, h 1 mil 0.1 - 0.2% (diameter and length)
Weight M 0.0001 g 0.1 - 0.2%
Temperature T,t1 0.5°C
Density of Electrolyte d 0.00005 negligible
Flow Rate Q 0.05 liter/min 1%
* This error can be lowered to .1% by using separate continuous record-ings on Gould recorder particularly in the runs of low duration.
Resulting experimental errors in combined parameters
Machining rate Fr em/min < 1%
Conductivity of electrolyte k -1 -1 Si em .5%
Current density i A/em 2 .;;;; 1%
Mass removal rate ll.M g/min .;;;; 1%
ECM driving force kll.V/Fr Volts/Sicm 2 min .;;;; 2%
ECM gap mils 5%
Electrochemical equivalent (A/z) gr/Faraday .;;;; 2%
Apparent valence of dissolution z Equfv.,. e/Mole ..;;;; 3 - 4%

-32-
E. Design of the Toolpieces
El. Choice of cylindrical geometry
As the shop drill used in this work is constructed to reproduce
shapes by vertical downward motion of the cathode tool, cylindrical
hole sinking was chosen as the vehicle of this study. Nine experiments
could be carried out on each of the flat sides of the 1" x 1" x 1/2"
(2.54x2.54Xl,27 em) samples. The outside diameter of the holes ranged
from 0.7 to 0.9 em and the boring depth ranged from 0.4 to 2 ems.
E2. General considerations for the design of the toolpieces
Preliminary experiments carried out using a common toolpiece,
featuring a large entry for the delivery of the electrolyte (design A),
were shown not to be reproducible if meaningful at all (see appendix).
This tool was used in the computer implemented modeling of the machining
process developed by Riggs (31) and permitted the accurate prediction
of the profiles of holes sunk in copper and Stainless Steel.
The tool diameter chosen for the cathode tool had to be such
that feed rates up to 2 mm/min could be achieved in TiC and ZrB 2 .
Because of the high valence of these material~ to keep the current
below 50 Amps, the holes diameter had to be approximately 0.7 em.
The choice of a relatively small hole diameter was also desirable
because of the high cost of the carbides and borides employed in this
study.
In one of the tool designs, the tubing was cut out of a hollow
copper tube (oxygen free copper) and the mounting socket (label 1 on
Fig. 6A) was sliced out of a two inch diameter brass rod. In Fig. 6A,

the lip, labeled 3 in Fig. 6A, 5 millimeters upstream from the tool~frortt
served to avoid large pressure drops in the overcut during the machining
of very deep holes; the second step, labeled 2 in Fig. 6A, was intended
to divert the flow of the electrolyte exiting from the machining
gap, so as to provide a location for the temperature probe, avoiding
contact between the toolpiece and the sensing probe. Also, this
second step was located as close as possible to the front of dissolution
in order to obtain exact temperature measurements.
The base part of the toolpiece (label 1) was silver soldered
to the tubing. The outside surface of the toolpiece was then sandblasted
to produce a semi-rough surface and then polished on a lathe with #400
abrasive paper.
Lastly, the two steps were rounded to ensure better adherence
of the coating. The entire toolpiece was thoroughly washed with
detergent and hot water to remove all traces of grease, then dried
with acetone and finally cleaned with methyl-isobutyl ketone. The
outside of the toolpiece was then coated with KYNAR, a vynilidene
fluoride resin. The coating was applied by spraying the resin mixed
with methyl-isobutyl ketone (1:1) at 30/35 psi by means of a small
spray gun. The resin was cured at 180°C for 10 minutes and then at
240°C for 15 minutes. Three coatings were successively applied,
resulting in a 0.2~0.3 mm layer of insulation on the sides of the
toolpieces. The insulation coating was finally examined under microscope
for evenness.

-34-
As shown on Figure 6A the simple design A features only two
components: the mounting socket and the hollow tube with the small
step 3t the tip of the machining area. The more complicated shape
of design B (multiple feed holes) needed three components: the
mounting socket, the hollow tube like in design A and a third piece:
the tip of the cathode. This third component was machined with the
aid of a jig (Fig. 7 bottom) made especially to drill the five feed
holes before soldering it to the toolpiece. The tip of the cathode,
cut from a 1/4" outside diameter (0.635 em) copper rod,was clamped
in the jig after facing it off and the five 1 mm moles were easily
drilled with a hand drill.
The ECM configuration of the toolpiece and the workpiece is
shown on Figure 6B, representing a vertical cross section during
machining. The arrangement of the toolpiece in the cutting chamber
is depicted in Figure 9.
IV. RESULTS
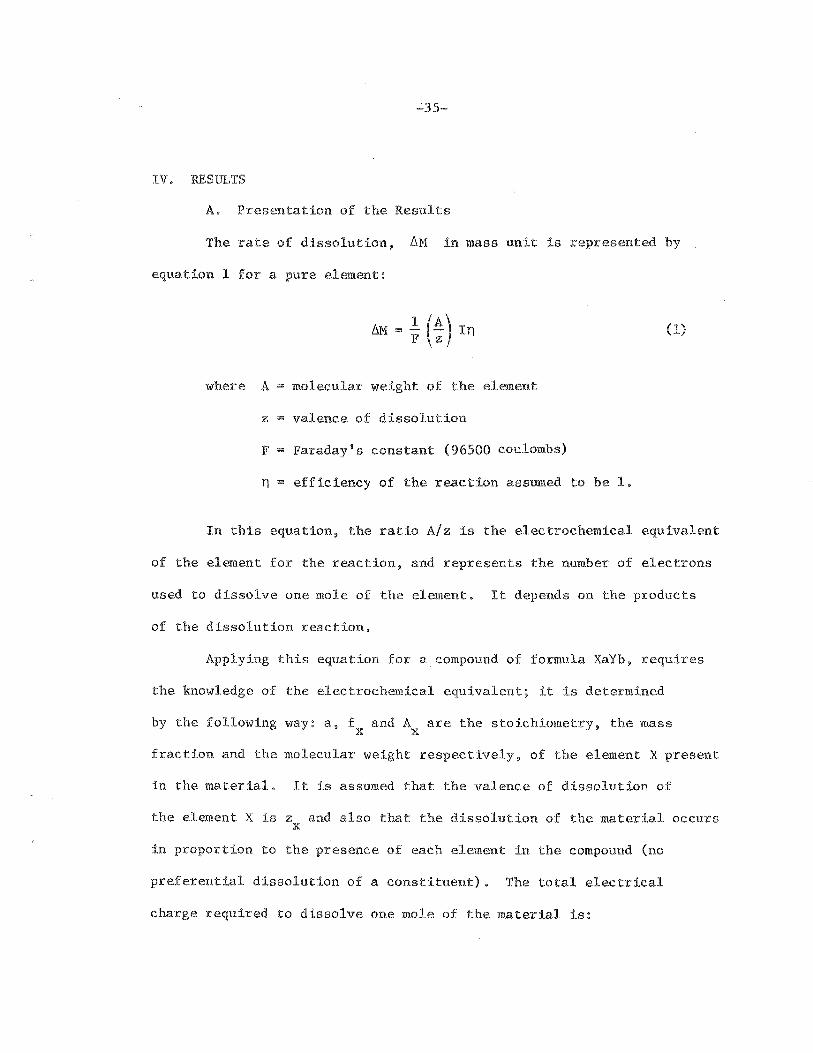
A. Presentation of the Results
The rate of dissolution. ~M in mass unit is represented by
equation 1 for a pure element:
(1)
where A molecular weight of the element
z = valence of dissolution
F Faraday's constant (96500 coulombs)
n efficiency of the reaction assumed to be 1.
In this equation, the ratio A/z is the electrochemical equivalent
of the element for the reaction, and represents the number of electrons
used to dissolve one mole of the element. It depends on the products
of the dissolution reaction.
Applying this equation for a compound of formula XaYb, requires
the knowledge of the electrochemical equivalent; it is determined
by the following way: a, f and A are the stoichiometry, the mass X X
fraction and the molecular weight respectively, of the element X present
in the material. It is assumed that the valence of dissolution of
the element X is z and also that the dissolution of the material occurs X
in proportion to the presence of each element in the compound (no
preferential dissolution of a constituent), The total electrical
charge required to dissolve one mole of the material is:

-36-
z (::)fx + (:~)fy - = A
(2)
f f f + f 1
also ~=__y= X y a A bA a A + bA a A + bA
(3) X y X y X y
thus ( ~) 1 A
( ::)fx + (~~)fy az +
X
(4)
where A is the formula weight of the material (A= aA + bA ). Equation . X y
(4) yields the electrochemical equivalent for the material and is
reported in equation (1) to calculate the theoretical lines shown in
the results by:
(5)
The average dissolution rate of a material is determined from
the experiments by the relation:
M before - M after t
where t represents the duration of the experiment, The amount of
( 6)
material dissolved is determined experimentally by the difference in
weight before and after the run or by a measurement of the volume
dissolved:
(7)

-37-
h and S are the depth and the cross sectional area of the hole drilled
and d the density of the material. Combining equation 1 and 7, the
average tool feed rate is:
Fr 1{. A ) I F\azx + bzy Sd
h Fr =
t
Llli Sd
(8)
(10)
where i ~ I/S represents the current density during the experiment
based on the cross sectional area of the hole.
a) Apparent electrochemical equivalent: The results are
presented separately for each material in the two electrolytes used,
In order to determine the electrochemical behavior of these materials,
the apparent electrochemical equivalent (A/z in gram per Faraday) and
the valence of dissolution (z in equivalent-electron per mole) are
plotted versus the current density, The experimental correlations
(machining rates and dissolution rates) are represented by a least
square fit method and the theoretical lines (eq. 10 and 5) corresponding
to Faraday's law for known valences of dissolution are also indicated.
b) Frontal gap of dissolution: The frontal gap (also referred
II II II ll) to as the machining or the ECM gap of dissolution was plotted versus
the current density for different applied voltages and also versus the
ECM driving force (k6V/Fr). The gap measurements were made after ECM
operation using the procedure described in next section,
c) Current-voltage relation: The electrochemical behavior of the
different materials is described in terms of polarization. The

derivation of valid current-voltage curves requires consideration of
the electrode separation or frontal gap,which depends on the operating
conditions. Since the applied voltage and the tool feed rate (thereby
the current) are the only parameters controlled in this work, it was
not possible to control the gap. However, the determination of the
size of the gap is possible after ECM operation, by the following
experimental procedure:
If o is the total movement of the toolpiece, S.G. the starting
gap set before operation and h the depth of the hole drilled, the
frontal gap of dissolution is given by the relation
ECM gap h + S.G. - o (11)
The resulting error for the difference between these two similar
numbers (hand o) is estimated to be below 8%. The absolute error is
.5 mil foro(ram dial used on the apparatus), 1 mil for the depth of
the hole (accuracy of the caliper) and less than .5 mil for the
starting gap (copper precision foil). The depth of the hole was
averaged on four or five different measures, neglecting the height
of the small peaks left on the anodic surface after operation, and
assuming the surface morphology of the bottom of the hole to be flat.
Thus the ECM gap is determined for each experimental run.
The collection of data related to the same value of the gap, allows the
determination of the relationship between the current and the voltage
for each material.
The ohmic drops in the electrolyte were calculated (equation 20)
under the assumption of a parallel plates configuration, and are also

~39-
shown on these figures. The conductivity of the electrolytes have
been chosen for an average temperature of 27°C for 2N KN03 and 3N
1 -1 NaCl (0.179 and 0.231 Q em respectively),
IR = Ip .!::_ = i .!::_ = s k i k (ECM gap) • (20)
The extrapolation of the current-voltage curves to zero current
density for each material assumes an independence of the overpotential
(passivation, concentration) on the current density and that the
activation overpotential is only a small fraction of the applied
voltage. This is not exactly true for the small values of applied
voltages (10 Volts) but the figures obtained for the overall overvoltages
are in agreement with the observations made during this work and
correspond to the values expected for these materials if they showed
a similar behavior to that of their separate constituants. The
impossibility of carrying out experiments at low voltages was due to
the technical limitations of the apparatus: at the lowest available
feed rate, an "equilibrium" gap could not be attained. In these
experiments, below 10 V for TiC and ZrC and below 15 Volts for TiB2
and ZrB2 , sparking due to the contact between the electrodes was
observed.
The interpolations possible between the different plots related
to the machining gap, were proven to be in agreement with each other
(see for example the case of ZrB2 in KN03).

XBB 784-4 796
Figure 10. View of the holes drilled, from left to right: ZrC, TiC, TiB
2, ZrB
2•

B. Titanium Carbide
Bl. Apparent electrochemical equivalent and valence of dissolution
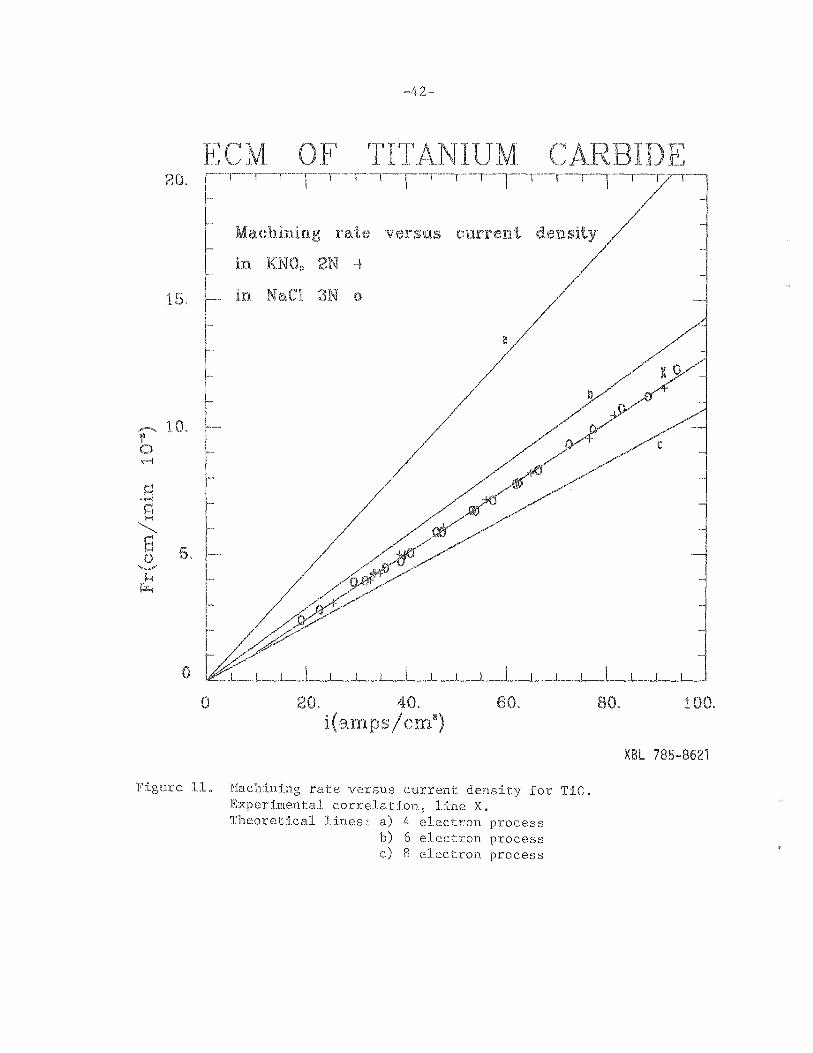
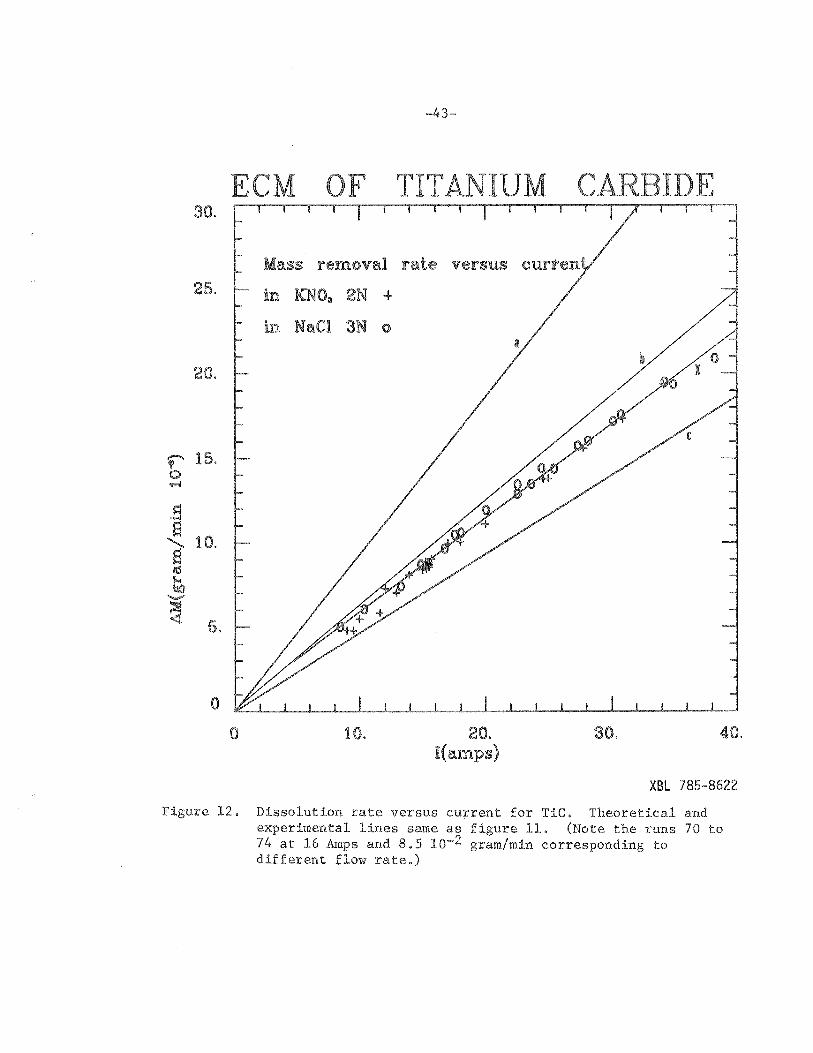
The machining rate (Fr) and the mass removal rate (6M) are
plotted respectively versus the current density i and the current I.
The two quantities are derived from two different experimental
informations: the slope of the toolpiece advancement on the recording
chart gives an instantaneous measure of the machining rate, whereas
the weight loss measurements yields an averaged dissolution rate for
the experiment. The experimental correlations (labels [X] on Figs.
11 and 12), obtained for the two figures, clearly show that the same
chemical reaction is involved in the process and that the process
occurs with the same apparent valence of dissolution, regardless of the
electrolyte and throughout the range of current density investigated.
The theoretical lines added to the figures are calculated from
equations (10) and (5) and correspond to a dissolution process
reaction occurring with a known apparent valence of dissolution:
4 electrons (label a), 6 electrons (label b) and 8 electrons (label c).
The experimental correlation being between the 6 and the 8 electron
processes.
1 Fr = (A/z) Fd i
(A/z) l I F
The slope of the experimental correlation representing the
(10)
(5)
machining rate versus the current density yields the electrochemical
equivalent (A/z in gram/Faraday) for the overall reaction of dissolution
by the equation:
20.
versus density
15.
10.
'F"!
c •.-4 s ~ s 5. 0 -H ~
0
0 20. 1
40. /c
60.
Figure 11. Machining rate versus current density for TiC, Experimental correlation, line X, Theoretical lines: a) 4 electron process
b) 6 electron process c) 8 electron process
80. 100.
XBL 785-8621
30.
25.
20.
- 15. 'I' 0 ..-1
1::1 •PI a
10. ' a ~ ~ ~ -~ 5.
0
0
Mass removal
in KNOa 2N +
in NaCl 3N o
10.
-43-
20. I( amps)
30. 40.
XBL 785-8622
Figure 12. Dissolution rate versus current for TiC. Theoretical and experimental lines same as figure 11. (Note the runs 70 to 74 at 16 Amps and 8,5 lo-2 gram/min corresponding to different flow rate.)
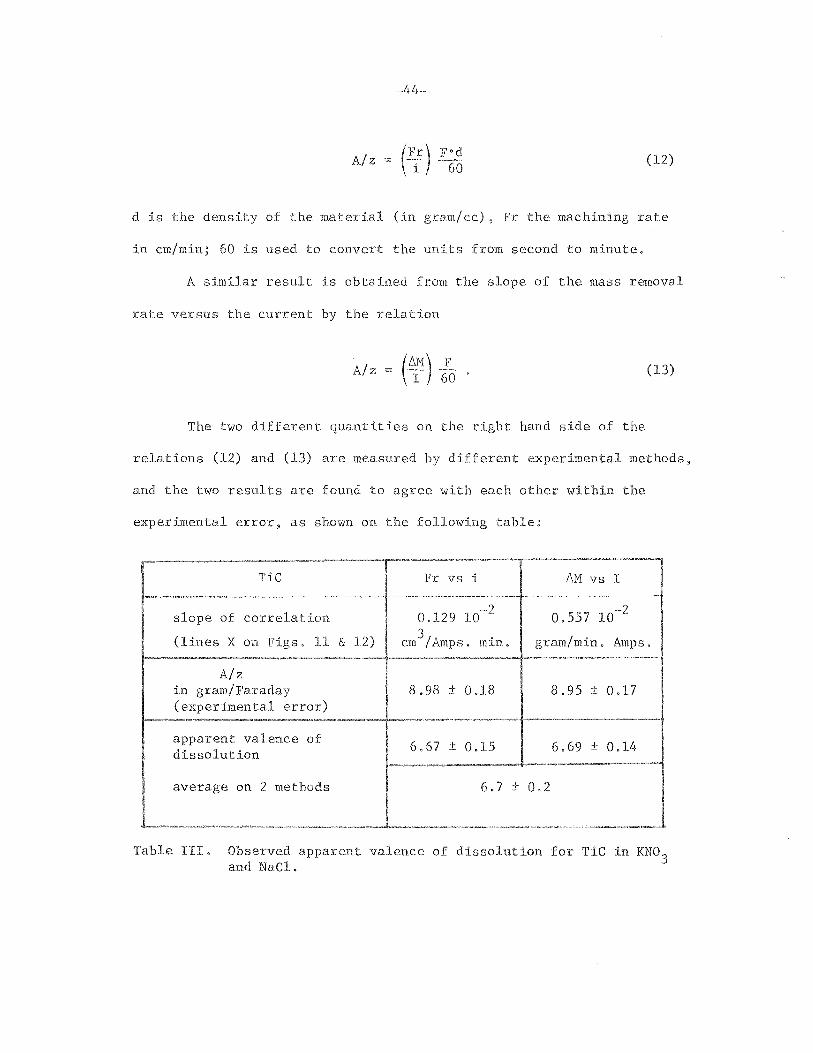
A/z (12)
dis the density of the material (in gram/cc), Fr the machining rate
in em/min; 60 is used to convert the units from second to minute.
A similar result is obtained from the slope of the mass removal
rate versus the current by the relation
A/z (6t) F 60
The two different quantities on the right hand side of the
(13)
relations (12) and (13) are measured by different experimental methods,
and the two results are found to agree with each other within the
experimental error, as shown on the following table:
TiC Fr vs i 6M VS I
of correlation 0.129 10~2 0.557 10~2
X on Figs. 11 & min. gram/min. Amps.
A/z gram/Faraday 8.98 ± 0.18 8.95 ± 0.17
error)
valence of 6.67 ± 0.15 6.69 ± 0.14 ion
on 2 methods 6.7 ± 0.2
Table III. Observed apparent valence of dissolution for TiC in KN03 and NaCl.

15
10
-:>-,
a "-a
'+-
' E a b. 5 Ol -N
' <
0 0
-45-
ITANIUM CARBID
in KNOs 2N +
in NaCl 3N o
,;.') I) +0 +0 V'++
4
I
~j 5
6
0 + 0
14
20
0
0 20 40 60 80 100 i(amps/ em~)
XBL 785-8783
Figure 13. Electrochemical equivalent (A/z) and apparent valence (z) versus current density for TiC.
N

-46~
The combined experimental error on (A/z) is in the range of 2%
and the error on the apparent valence of dissolution is given by an
average on the two experimental results.
Figure 13 shows the electrochemical equivalent and the valence
observed for the process versus the current density, It also indicates
the independence of the electrochemical behavior of titanium carbide
on the electrolyte. The apparent valence of dissolution is determined
to be 6.7 ± 0.2, in NaCl as well as in KN03 .
B2. Frontal of dissolution
The machining gap is shown to be dependent on the current
density for a given applied voltage (Fig. 15) and also on the ECM
driving force (Fig, 14).
The grouping k6V/Fr represents the driving force and is used
to correlate the frontal gap of dissolution to the operating variables
controlled during ECM operation. Thus, a large driving force corresponds
to a high applied voltage or a low machining rate, The correlation
on Fig. 14, linear for the two different electrolytes and within the
range of the experimental error, is independent of the electrolyte,
The data are measured experimentally and include the variations of
conductivity with the observed temperature during the runs,
If d and t 1 are the initial density and temperature of the
electrolyte in the main tank before the experiment and T the medium
temperature of the electrolyte (measured at the outlet of the machining
section and linearly averaged from the beginning to the end of the
run), the electrolyte conductivity in the ECM gap is given by equation (14)

60
50
40
-en
E 30 -Q.
a 0
20 0 IJJ
10
0
-47-
Dissolution gap versus driving force
TiC 1n KN03 6.
in NaCI o
6, 1:1
20
1:1
0
1:1
60 80
E C M driving f 100 120 140
ce (Volts.min/cm~.n}
XBL 786-9264
Figure 14. Frontal gap of dissolution versus the ECM driving force.

k [0.9981 a(sp.gr, at t1
) ~ b] exp 0.025 (T-20°C) (14)
where a (function of t1
) and b (constant) are specific characteristics
relating the density (sp.gr.) of the electrolyte to its conductivity (62).
The fact that the linear correlation does not pass through the
origin shows that the ECM driving force expression cannot be used
below 10-15 mils "equilibrium" gap. Referring to the operating
conditions, this indicates that there is an upper limit for the feed
rate for this material, at a given applied voltage,
The same limiting effect is observed on the Fig. 15, The
machining gap is plotted versus the current density (thereby the tool
feed rate since these two variables are related) for different applied
voltages. As deduced from this figure, the machining gap decreases
with the current density and by extrapolation reaches a zero value,
where ECM operation is practically impossible, at a given current
density different for each value of the applied voltage.
In addition to the experimental correlations of Fig. 15, the
theoretical gap values are represented by the broken lines; they are
derived from equation 15 under the two following assumptions yielding
equation 16:
1) The conductivity of the electrolyte remains constant during
the experiment. (This assumption is justified for most of the experiments
where the observed change of temperature is below 0,5°C except for
runs at low flow rates.)
2) The sum n of the electrodes potentials and overpotentials
is a small fraction of the applied voltage 6V, and Ohm's law applies

~49-
60
50 TiC 1n NaCI 3N
\ 40 \
\
- ~ €t"
E 30 \ -=- \ + ~
+~ 'o£0
:IE \ + ~ ~ 20
""' 1.11.11
~ 25 v ~ ~ ----- ------10 10 v
0
0 20 40 60 80 tOO i (amps/cm2
)
XBL 785-8623
Figure 15. Frontal gap of dissolution for TiC in 3N NaCl versus the current density for different applied voltages. Experimental data at 10 Volts (0), 15 Volts(+), 20 Volts (X), and 25 Volts (I). The broken curves represent the theoretical correlations (equation 17),

to the remaining voltage (~V- n).
Thus,
(~v - n) IR(I/S) ·(~) (15)
where k represents the conductivity of the electrolyte, S the anodic
surface machined on the material. ~. the front gap of dissolution or
the distance between the toolpiece and the workpiece during ECM
operation at steady state is then calculated by equation (16)
ECM gap k < fl.v - n) i
(16)
The accumulated errors on the experimental results obtained
by equation 11 are somewhat large (±1 mil) for small gaps.
ECM gap h + S.G. - o . (11)
However, Fig. 15 shows a general behavior fairly close to the
theoretical correlations (broken lines) using equation (16); except
for the low applied voltages (10 Volts) where the assumption made by
ignoring n with respect to fi.V is less justified: since Tafel's law
applies, the overvoltage associated with the activation energy of the
reaction, proportional to the logarithm of the current density, cannot
be considered as negligible with respect to the applied voltage in
equation 16.

40.
30.
00 ..... 0 20 > . -(!)
Ol 0 --0 >
"0 (!) 10. 0. 0.
<(
0
0
-51-
in NaCI 3N, E.C.M. gap= 23 mils 0
in KN(\ 2 N, E.C.M. gap= 12 mi Is
/ /
20. 40. 60 i (amps/cm 2 }
80. 100.
XBL 785-8734
Figure 16. Polarization curve for TiC in KN03 (~) and NaCl (0) at
different ECM gaps.

-52~
B3. Current-voltage relationship
The relationship between the current density and the cell
voltage is explored in the two electrolytes. The curves on Figs. 16
correspond to two different values of the frontal gap of dissolution,
one for each electrolyte used, as listed in Table IV.
Since the machining gap is not a parameter controlled during
the operation, the current-voltage curve is established after the
experiments, by using equation 11 for each run. The collected data
listed in Table IV thus correspond to a certain value of the ECM
gap in the electrolyte used (for TiC, 12 mils in NaCl and 23 mils in
ECM gap = 23 mils in KN0 3 2N
~ drop = 0.170i
ECM gap = 12 mils in NaCl 3N ~ drop = 0.254i
6V (Volts)
i 2
(A/em )
12.7 14.6
4 33.5 55.9 7
11.0 15.0 20.1 25.1
22.9 41.0 62.0 88.
Table IV: Experimental data for the current~voltage relationship of TiC in KN0 3 and NaCl.
Figure 16 indicates that the experimental line has a similar
slope than the ohmic drop and that the sum of the overpotentials,(S-6
Volts: activation, surface, concentration, etc,) is almost constant
for the dissolution reaction throughout the range of current densities

-53-
in the two electrolytes investigated. It is noticed also that the
overpotential of dissolution is larger in KN03 than in NaCl, (size
of the arrows in Fig. 16), this difference is due to the electrolyte:
NaCl is known (23) to have a stronger action than KN0 3 on the
oxide films formed; this is consistent with the present observations.
B4. Surface roughness; effect of the flow conditions
As the main concern in machining materials is not only which
techniques are available to reproduce similar shapes, but also to
meet specific characteristics such as dimensions, tolerances and
appearance of the surface, the surface finish is thought to be an
interesting parameter to investigate.
It is known that,using traditional machining techniques (37, 38),
the surface of the material machined is altered and the residual
stresses induced can significantly affect the mechanical properties
of the material. Since ECM is achieved without contact between the
tool and the workpiece, the properties of the materials are not altered.
For comparison, Kuhn (40) claims that surface finishes in the
range of 0.4 to 1.5 ~m for forged or rolled steels and nickel chrome
alloys, and 1 to 2 ~ for cast irons and cast nickel chrome alloys, are
figures attainable.
In the investigation of ECM of tungsten carbides in nitrate
alkaline solutions, Petrov and Parshutin (41) showed that the more
uniform the structure of the sintered carbide (or for the composites of
low cobalt content), the better surface finish attainable. The same

Run #
70
n
72
73
7l-t
Run #
70
n
72
73
74
-54-
EFFECT OF FLOW RATE ON ECM PAR~METERS
TiC in 2N KN03
v Fr Hole rf; I i M
(volts) (l0-2cm/min) (em) (amps) 2 (amps/em ) -2 ) (10 gram/min
15.2
15 • .l
15.2
15.2
15,1
Flow rate
(liter/min)
4.98
4.62
3.23
2.70
l. 76
4.98
4.98
4.99
4.95
4.96
.5°C
.5°C
.8°C
l.0°C
2.3°C
o.no 15.3
o.no 15.5
o.no 15.5
o. no 15.5
o. no 15.7
Pressure
(psig)
84
68
46
32
15
38.6 8.44
39.6 8.90
39.6 8.81
39.6 8.53
39.7 8.62
A/z ECM gap S.G.
(gram/faraday) (Mils)
8.9 14 12
9.2 17 7
9.1 17 7
8.9 17 7
8.8 17 12
Table V. ECM parameters for the runs 70 to 74; influence of the flow rate on the ECM of TiC in 2N KNo
3• Toolpiece
#B 125, outside diameter = 0.645 em with 0,2 mm coating.

-55-
1.80
2.70
3.23
4.60
4 V = 15 Volts, i = 3 8.9 A/c m2
XBL 785-8876
Figure 17. Effect of the flow rate on the surface roughness of ECM'd parts: traces of the bottoms of the holes on TiC in KN03 . Toolpiece #B 125.

-56-
authors show that the choice of the electrolyte has a great influence
on the surface finish, while other operating variables, such as current
density or applied voltage, had less influence.
Figure 17 shows the effect of the flow conditions on the
surface finish obtained on parts of titanium carbide machined in 2N
potassium nitrate. The surface roughness obtained on TiC is within
3-4 ~m in KNo3 • All the operating conditions are maintained constant
except the flow rate: 15 Volts and an inlet temperature of 25°C
-1 -1 -2 (KN03 2N; 0.145 ~ em ), the tool feed rate is 4.48 10 em/min. The
same toolpiece and the usual procedure (described in Chapter III) were
used during these experiments.
The surface profile and roughness data were determined by a
* surface analyzer , using a special probe to be able to trace the surface
of the bottoms of the holes drilled.
The result in Fig. 17, listed in Table V clearly shows that
the surface roughness is independent of the flow conditions, Furthermore,
the difference relative to the findings of Bannard (42), showing that
the dissolution efficiency of mild steel under ECM conditions in NaCl
depends on the flow conditions is evident: it is supported by the
observation of Figs. 11 and 12 where the experimental data corresponding
to the runs 70 to 75 are not scattered and lie within the range of the
-2 -2 experimental error (Fr = 4.43 10 em/min, 6M = 8.9 10 g/min,
I= 15 Amps., i = 35 A/cm2). These do not reflect the drop in efficiency
* Skidless surfanalyzer system, Model 21, Clevite Corporation.

-57-
observed with mild steel in different electrolytes (NaCl, NaN03 , NaCl03).
The difference is explained by the fact that this drop in
efficiency was mainly observed by Bannard (42) at current densities
below 20 A/cm2 , while in this work, due to the technical limitations
-2 of the equipment, the lowest tool feed rate was 2.5 10 em/min corres-
ponding to 25 A/cm2 for TiC.
BS. SEM microphotographs: effect of the current density
Figure 18 shows the typical appearance of the areas of the
bottom surface of the holes drilled in titanium carbide by ECM using
potassium nitrate as electrolyte. The two series of microphotographs
represent the same area at different magnification (from top to bottom)
2 and at two different current densities (21.7 and 68.1 A/em ) corresponding
-2 respectively to a toolpiece feed rate of 2.50 at 15 Volts and 8.50 10
em/min at 25 Volts (from left to right). The surface as received
is also included for comparison.
A careful examination of the pictures shows that the current
density does not affect the appearance of the machined areas, and that
there are two different structures left on the surface after ECM: one
consisting of large grains with a pitted appearance (top of the lower
left corner of the photograph at 2000x magnification), the other, small
sized grain structure accounting for the etching of the surface by the
electrolyte. However, the appearance of the surface is shown to be
independent of the current density as well as of the applied voltage.

~53~
T i C in K N 03 2 N
i = 2U A;cm2 i = 68.1 A/c m2
XBB 785-5627
Figure 18, SEM microphotographs of the bottom of the holes drilled in TiC with KN0 3 , effect of current density, (scale in ]Jm)

Table VI.
~ rl
';:;l z
;i
" :;:: ,D
" " " .~ " " :;:;
"""'
z ru
"' ~ .;:;
-~ " 0 0
-~ "'
3ULi
#
152
1S3
lSS
1SG
158
160
161
l63
164
165
166
170
171
79
81
82
33
84
35
86
37
38
92
93
9·
Press.,
(psi::;)
65
68
55
57
64
71
60
40
23
42
50
47
80
50
59
33
20
41
79
60
52
58
55
56
71
data for the ECM of TiC in 3N NaCl and of ZrC in 2N • Flow rates in , in gram/Faraday.
Flow :''ure /l,V I :t'r i10l.e j6 0
- AM A/z density/t1 kat 7 3.G~ Air= dial
:tate (volts) (amps) lo'"2 cr.;./un (c>Ol.) 1G-2g/mn $[1
c"' -1
g/clb hils) (mils)
4.09 27. 5°C 11.0 l0.4 2. 77 D~ 760 22.9 6.03 9.3 1 12700/23°C 0.221 12 170
3.55 25. S°C 11.4 13.3 3.68 o. 755 29."( 7.38 8.9 l.J.2900 I 20 oc 0.188 10 202
4.35 27. S°C 15.0 16.8 4.69 0. 740 39.1 9.63 9.2 1. !2600/:3.5°'" 0.226 10 207
3.91 29.0°C 15.0 18.1 5.02 0.750 41.0 10.S7 9.2 l.12575/25°C 0.235 9 222
3-37 32°C 14.9 22.6 6.70 0.740 53.3 l.2.89 9.2 l.l2500/28"C O.l!l54 9 232
2.56 27. 5°C 15.2 25.5 7.80 0.720 62.6 14.37 9.1 l.l2575/23°C 0.225 10 241
4.27 28. 5°C 20.1 27.4 7.75 0.750 62.0 15.72 9.2 1.12525/24°C 0.231 11 282
2.65 31.0°C 20.3 30.3 9.31 0.735 72.6 17.56 9.2 l.l2375/26°C 0.245 8 447
4.27 31.0°C 25.1 n.6 4.43 0.790 36.0 lo.45 9-5 l.l2375/26.5°C 0.245 11 207
3.82 32.0°C 25.1 34.3 1o.T3 0.725 83.1 19.49 9.1 1.12200/27°C 0.250 9 440
2.92 25. 5°C 25.1 35.0 11.20 0.710 88.4 19.34 i.9 l.124750/20.5°C 0.212 9 435
5.34 3D~0°C 10.2 8.5 2.37 0.750 19.2 4.99 9.4 1.12325/26.5°C 0.239 ll 158
4.80 3l.0°C 25.0 38.3 12.27 0.720 94.1 20.86 8. 7 L12300/28°C 0.245 12 446
6.05 26.0°C 10.2 6· 3.14 0.750 14.0 6.83 17.7 1.12175/20.5°C 0.169 7 213
"4.62 27. 5°C 10.1 7.8 4.33 0.715 19.4 9.36 19.3 1.12050/23. 0°C 0.175 1 215
5.16 29.0°C 15~2 10.5 4.99 0.765 22.8 12.90 19-T L11950/24.0°C 0.181 7 215
3-55 30.5°C 15.2 12.2 6.13 0.740 28~4 14.44 19.0 1.11875/26. 5°C 0.189 12 215
6.86 3l.0°C 15.3 14.2 j.69 0. "Tt5 34.4 16.97 19.2 J..ll850/27°C 0.191 12 227
3.46 25 .5°C 15.1 13.7 3.35 0.695 3t.1 16.08 18.8 1.421100/21 °C 0.167 12 245
6.25 2'7.0°C 20.l 10.9 9.04 0.735 39.8 19.64 18.7 l.12000/23°C 0.172 12 301
5.34 29.0°C 20.2 19.5 2.0.72 0.125 47.2 21.57 17.8 l.l2000/25°C 0.184 11 438
4.26 27 .0°C 20.1 20.3 11.47 0.120 49.9 23.07 18.3 l.l2150/23°C 0.174 12 246
6.50 33.0°C 25,0 23.1 12.55 0.745 53.0 27.31 19.0 1.11850/27 .5°C 0.201 9 454
6.41 30.5 25-3 23.4 12.78 o. 740 49.9 27.43 18.9 1.11375/26.0°£ '©.182 7 455
6.77 32°c 25.3 ;;:::...9 13.90 0.740 57.9 29.86 19.3 l.ll400/28.0°C 0.191 7 454
E hole
(err.)
0.460
0.535
0.560
0.600
0.615
o.6l!'
0.750
1.160
0.610
1.145
1.135
0.455
1.150
0.590
0.585
0.610
0.590
0.605
0.645
0.790
1.110
0.635
1.195
1.195
1.185
:OC!~ ga.;p
{::dls)
23
19
24
23
19
15
24
18
44
20
21
32
18
26
22
32
29
23
ll
22
16
16
25
22
20
i
I
l VI 1..0 I
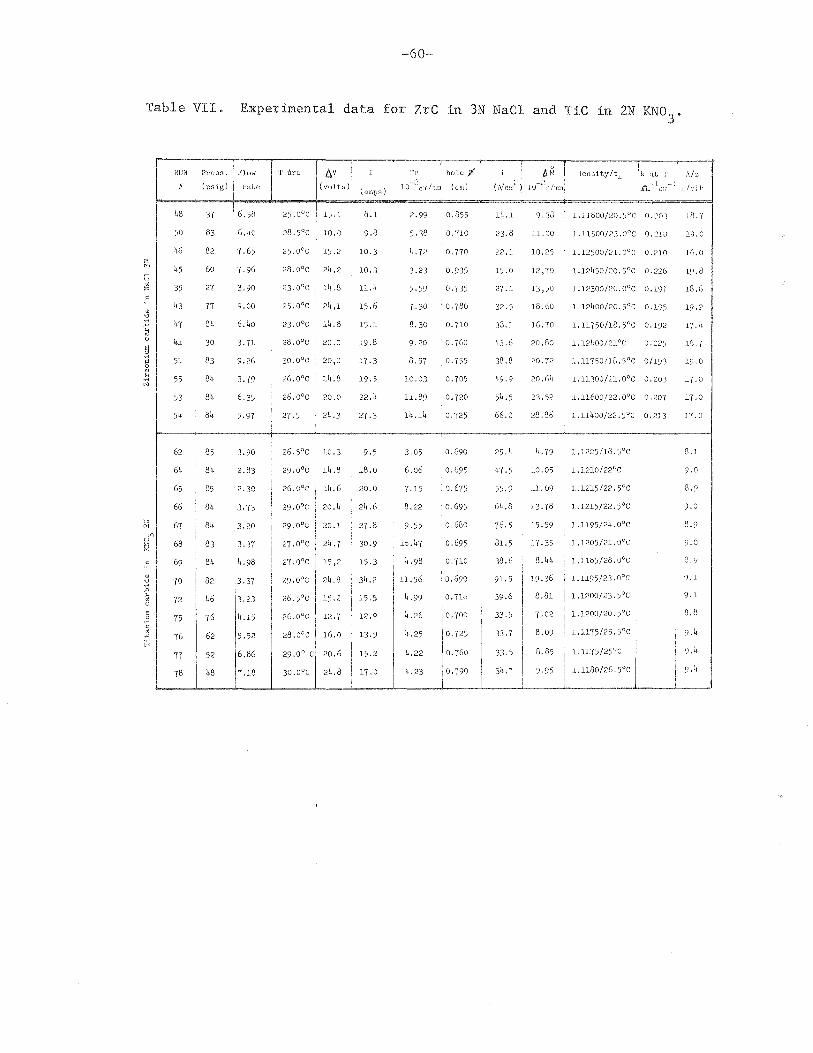
-60-
Table VII. Experimental data for ZrC in 3N NaCl and TiC in 2N KN03
•
.~ § 0
.~ N
HUN
II
48
50
46
45
35
43
47
Ill
51
55
53
54
62
64
65
66
67 I
68
69
70
72
75
76
77
78
Press. Flow
(psig) ~ rate
I 37 '6.58
83 6.110
82 7.65
60 7.96
27 3.90
77 9.00
84 6. 40
30 3.71
83 9.26
84 3. 79
84 6. 35
84 s.97
85 3.90
84 2.83
85 2. 30 i !
84 3.73 i
84 3.20 !
83 3. 37
84 4.98
82 3.37
46 3.23
76 4.15
62 5. 52
52 6.86
48 7.18
'1' 1 Ure /),V I I
(volts) (u.;r.ps)
25.0°C i 15' l : 8.1
28. S°C 10.0 9.8
25. 0°C 1S. 2 10.3
28. 0°C 24.2 10.3
23. 0°C 14.8 n.4
25. 0°C 24,1 15.6
23. 0°C 14.8 15.1
28. 0°C 20.0 19.8
30. 0°C 20,0 17.3
26 .0°C 14.8 19. s
26.0°C 20.0 22.4
27.5 24.3 27.3
26. 5°C 10.3 9. 5
29 .0°C 14.8 18.0
26. 0°C 14.6 20.0
29. 0°C 20.4 24.6
29 .0°C 20.1 27.8
27. 0°C 24.7 30.9
27. 0°C 15,2 15.3
29. 0°C 24.8 34.2
26. 5°C 15.2 15.5
26 .0°C 12.7 12.9
28. 0°C 16.0 13.9
29.0° c 20.6 1S.2
30.0°C 24.8 17 .o
hole }If i t\1~ f lensi ty /t1
I k "' lO<:cm/~:t!l {em) ) J u
-, .n.:·Ll';::-.
2.99 0. il55 14.1 9.30 l.llS00/20. 5°C 0. ~?03
s. 38 0. 710 23.8 l.l. 00 l.ll500/23.0°C o.~l0
!1, 72 0. 770 22.1 10.25 1.12500/21. 0°C 0.210
3.23 0. 935 15.0 12,70 1.124S0/20. 5°C 0.226
5. 59 0.735 27 .l 13,50 l.12300/20.0°C 0.197
7.30 0.780 32.5 18.60 1.12400/20.5°C 0.195
8. 30 0.710 38.1 16.70 1.ll7S0/18.5°C 0.192
9.20 0. 760 43' 6 20,80 1.121100/21 °C 0.~2:;
8. 57 0 '7S5 38.8 20,72 l.ll750/18.5°C 0/193
10.03 0. 705 49.9 20.64 1.11300/21. 0°C 0.203
11.89 o. 720 54.5 23.52 l.ll600/22.0°C 0.207
111.14 0. 72S 66.2 28.86 l.ll400/22.)°C 0.213
3.05 0.690 25.4 h. 79 1.1225/18. 5°C
6.06 0.695 117.5 10.05 l.1210/22°C
7.15 o. 675 55.9 11.09 l..121S/22. 5°C
8. 22 0.695 64.8 13.78 1.1215/22. 5°C
9. 55 0.680 76. s 15.59 l.ll95/24. 0°C
1o. !17 0. 695 81.5 17,35 1.1205/21. 0°C
' lj, 98 o.no 38.6 8. 4!1 l.ll.85/28. 0°C
; 19.36 l.ll9S/23.0°C ll.. 56 ! 0.690 91.5
I 1.1200/23. S°C 4.99 0, 71o 39.6 8.81
I 1.1200/20. S°C 4.26 1 0.'/0C 33.5 7.02
I 4. 25 0. 725
I
33.7 8.09 l.l175/25.5°C '
4. 22 0. 760 33.5 8.8S l.ll75/25°C I I
4.23 0. 790 34.7 9.95 1.1180/26. 5°C I
.\h
.;/ell•
18.7
19.0
1(;,0
1~.8
18.8
19.2
n.l,
1G. 7
19.0
17.0
1"(.0
17.0
8.1
9.0
8.9
9.0
8.9
9.0
3.~
~).l
9.1
8.8
9.4
9. 4
9.ll

~61~
C. Zirconium Carbide
Cl. Electrochemical behavior
The second carbide investigated in this work presents a similar
behavior to that of titanium carbide. The machining rate and the
dissolution rate are plotted versus the current density and the
current in Figs. 19 and 20.
The experimental linear correlations (labels X on figures) show
that the dissolution occurs also with a constant valence throughout the
range of current densities investigated, regardless of the electrolyte
used.
The theoretical lines added to the Figs. 19 and 20 are calculated
from equations 5 and 10 and correspond to the dissolution reaction
occurring with 4 electrons (label a), 6 electrons (label b) and 8
electrons (label c)
Fr ( ~) 60 I F
( 5)
The following table lists the electrochemical equivalent
and the apparent valence of dissolution for zirconium carbide from
the relations 12 and 13:

~62-
ZrC Fr VS i L\M vs I "'
' --- .,..,.....,.._
slope of experimental 0.232 10-2 1.094 10-2
(line X 19&20) 3 gram/Amps. min. correlation on Figs. em /Amps. min
A/z (gram/Faraday) 18.50 ± 0.55 17.59 ± 0.52 (experimental error)
z: apparent valence of 5.58 ± 0.17 5.86 ± 0.18 dissolution
average on both methods 5.7 ± 0.3
-~--~ .... ~--- ..... -.,~.~........,;.~ ... ~ Table VIII. Observed apparent valence of ZrC in KN03 and NaCl
The error caused by the combined effect of the surface area
and the weight loss measurements, for the apparent valence of dissolution
results in a 3% uncertainty for zirconium carbide. It is somewhat
larger than with the other materials investigated because of the
porosity of the material received. As shown in Table I, the actual
observed density of ZrC is 4.93 g/cc, instead of 6.09 g/cc, the
literature value (33, 35). This difference can lead to erroneous
results when using equation 10 where the density appears. The high
porosity of zirconium carbide is responsible for the scattering of
the experimental data, especially in Fig. 20 representing the mass
removal rate versus the current. The high pressures used during ECM
allowed the electrolyte to fill the pores of the sample, which needed
to be vacuum dried for at least 4 to 5 hours before the weight loss
measurements. The following procedure was then used for experimental
work with ZrC:

20.
1
10.
0
0
Machining
in KNO(\) 2N +
in NaCl 3 N o
20.
-63-
versus
40. 60.
Figure 19. Machining rate versus current ity for ZrC. Experimental correlation, line X. Theoretical lines: 4 electron process
b) 6 electron process c) 8 electron process
E
80.
XBL 785-8624

-"" I
0 'F""'!
c •PI
s ~
8 ttl 1-4 ~ -::::!
<:1
40
30
20
10
0
0
~64-
IRCONIUM
Mass :removal :rate versus current
in KNO~ 2N +
in NaCl 3N o
10 20 I( amps)
30
XBL 785-8781
Figure 20. Dissolution rate versus current for ZrC. Theoretical and experimental lines same as in figure 19.

a
b
XBB 785-6124
Figure 21. Cathodic deposition; appearance of the too1piece after ECM in NaCl. a) and b) ECM of TiC, c) ECM of ZrC.

30
20
0
0
in KN03 2N +
in NaCl 3N o
0 + 0 + o o+
-66-
20 40 i(amps/ cm11
)
0 0
60 80
XBL 785-8780
4
5
6
-(l) 0
8 E ' (l) I
10 .:::: :::1 cr (l)
15 N
20
30
Figure 22. Electrochemical equivalent (A/z) and apparent valence of dissolution for ZrC.

~67~
~·~ The sample was thoroughly cleaned and rinsed with hot
water to dissolve most of the particles of electrolyte contained in
its pores.
~·- Acetone was used to dry the sample in removing most of
the water still present from the cleaning operation.
~·~ The sample then dried under vaccum for as long as 5 hours
after and before each run. The period of 5 hours was determined by
comparison of the weight loss measurements with the dimensions
measurements using the actual density as reference, so as to result
in a experimental error below 1% by the two methods.
Another reason for the deviation of certain experiments from
the correlation is cathodic deposition on the toolpiece. Plating is
not observed with potassium nitrate but can be significant and visible
with sodium chloride after a prolonged use of this electrolyte. The
two top photographs of figure 21 represent the tip of the toolpiece
after ECM of titanium carbide in NaCl and the bottom picture shows
the same toolpiece after ECM of of ZrC in NaCl.
However, no further analysis of these black deposited particles
on the top of the toolpiece was made, because of the fluffiness and
the scarcity of these deposits; attempts for Xray powder pattern
analysis were unsuccessful.
Figure 22 shows the electrochemical equivalent and the apparent
valence of dissolution for zirconium carbide:just as titanium carbide,
its electrochemical behavior is independent of the nature of the
electrolyte throughout the range of current densities investigated.

-68-
C2. Frontal gap of dissolution
According to equation 16, and neglecting the overvoltages, the
ECM gap is
ECM gap k t:.V i
(17)
By combining equations 10 and 17, the ECM gap can be expressed directly
as a function of the ECM driving force:
Fr = Fd Fr ( 1) k 6V
ECM gap
where a is dependent on the valence of dissolution, a constant
(18)
(19)
(z = 5.7 ± 0.3 equiv-e-/mole). Figure 23 represents the variations of
the machining gap versus the driving force. Since the absolute error
estimated of the machining gap is large and ignoring the overvoltages
in equation 17 represents an oversimplification, the correlation
(equation 19) should be considered only as a useful approximation.
However, the general trend shows a linear correlation for the range of
driving forces investigated. This range excludes low applied voltages
and high machining rates. Again, as with TiC, the correlation is
independent of the electrolyte used and is shown to be linear as
expected.

100
80
60
----. f))
E .__
0. 0
40 CJl
u w
0
0
Dissolution gap
ZrC 1n
in
20
KN03 /::,.
NaCI 0
40
ECM
-69-
versus drivi for
0
/:),
0
0
60 80 100 120 140
driving force (Volts.min/cm2.D)
XBL 785-8627
Figure 23. Frontal gap of dissolution versus the ECH driving force for ZrC in NaCl and KN03 . Data from runs 82 to 88 in KN0
3 and from runs 41 to 50 in NaCl.

~70-
C3, Current voltage relation
The current voltage relationship is determined for two configurations
of the ECM cell, in the two electrolytes the same experimental determina~
tion is used (eq, 11) as for TiC and the ohmic drop is measured under
the assumption of a parallel plates geometry by equation 20,
The behavior of zirconium carbide is qualitatively similar to
that of titanium carbide, The linear correlation obtained for the
range of current densities shown does not allow the determination of
the transition from the active to the transpassive regime of dissolution
where ECM is believed to occur for most of the metals (43, 44, 47),
This transition would depend on the electrolyte and would require
further study in a channel cell with a more accurate equipment to
explore the range of low current densities (below 20A/cm2) not available
here,
However, the magnitude of the overvoltages associated with the
high rate of anodic dissolution of ZrC can be determined, By extra
polation of the polarization curve to zero current density, a fairly
good approximation of the cell overvoltage is obtained for the process.
This extrapolation is made by assuming constant current-independent
overpotential and therefore it is not exactly representative of the
low current density range, The sum of the overpotentials, including
the electrodes potentials on both sides of the cell at a fixed current
density, given by the difference between the experimental correlation
(Fig, 24) and the ohmic drop is shown to be large and approximately
constant (8-9V) throughout the range of current densities investigated.

40
30
-20 ifj
,;!;;;; 0 > -Cl)
0' 0 +-0 >
"CJ 10 Cl)
Q. Q.
<r:
0
0
1n KNO::~
1n NaCI
,/ /
/~·
/
20
2N E.C.M. gap== 2 2 mils 0
3N E.C.M. gap== 13 mils /
1:!. /
0
40 60 80 100 i ( a m p s/ c m 2 )
XBL 785-8735
Figure 24. Polarization curve for ZrC in KN03
and in NaCl at different
machining gaps.

-72-
C4. Surface roughness
As the influence of the current density on the surface finish
of electrochemically machined parts has not yet been discussed in the
literature it was thought worthwhile to investigate this effect. The
traces of the surfanalyzer (Figs. 25 & 26) used to determine the
* surface profiles and roughness of the bottoms of the holes where
dissolution occurs show no dependence of the surface finish on the
current density or on the applied voltage. The only factor influencing
the surface roughness is the nature of the electrolyte as seen by
comparing Figs. 25 and 26, corresponding respectively to 2N potassium
nitrate and 3N sodium chlordie. For the same operating conditions,
the surface roughness is within 5 - 6 ~m in KN03 and within 8 - 10 ~m
in NaCl.
The relationship between surface finis~ dimensional control
and electrolyte has been investigated for metals. Hoare et Laboda
(43, 44, 46) related the dimensional control obtained in NaClo 3 and
NaCl to the transition from the active to the transpassive state,
observed in the polarization curve of different hardened steels in
these two electrolytes. A more recent study by the same authors (45)
on the electrochemical machining of high temperature alloys in NaClo3
shows that the surface finish attainable by ECM is also dependent on
* The roughness of a surface is the profile of the surface itself where all irregularities with wavelengths greater than a specified value are filtered out and not traced. This allows the cutoff of the five small peaks provided they have larger "wavelength" than the specified value. Usually on all of the surfanalyzer traces reported in the present work~ the width cutoff is 0.03 in.

-73-
14
28
58
XBL 785-8614
Figure 25. Traces of surfanalyzer; effect of the current density on the surface roughness of ZrC in KNo
3• Toolpiece #126
polished with #600 abrasive paper before experiment.

15
32
-74-
2 ~~~~~-.mm
iJ;i;' "~I ~. 'V! _:_~',1 ,~t·~ 11'!(' '11~'1 11'~1' \_''~ '11'111_!"~~ "l'\~'
~------__l_______ ________ __ -~-----L _________ l~---1 I _. I
I Ajcm2 --~-- -----~ --r~---~----- - 1 -----------~------ m1crons
« ,,{/~.:;,lJMl 1VJ'.v.'M I~\ f1V1~WA~,~~~tiJf~~~ -tw~:rvf~f' ]1
0
5
~- I -- 1 ---t -------- - __ j __ ~-~-L _________ _
I I
50
! I I I
r \~~~,~~~~~1¥i~~.l,~A ~~~Mt\r'i~~ ~~~~ . I --t~~ f~ .. . I
61
XBL 785-8619
Figure 26. Traces of surfanalyzer; ZrC in NaCl. Same as in figure 25.

~75-
the contents of the materials in alloying elements. High iron content
alloys exhibit excellent values of surface roughness while the low iron
content alloys, due to preferential phase attack, show comparatively
poor values of surface roughness.
The same result is given by Petrov (41) showing that the content
of cobalt, used to bind tungsten carbide, influences the surface
finish of electrochemically machined parts; the more cobalt is present
in the sintered carbide, the less smooth a finish is attainable in
the same electrolyte under the same operating conditions.
These results are in agreement with the findings of this work
where it is shown in Figs. 17, 25 and 26 that the surface roughness
after ECM is dependent on the electrolyte as well as the material
itself.
a) Figure 27 presents photographs of the same area on the
anodic surface at the bottoms of the hole. The SEM pictures reveal
that the appearance of the surface morphology, just as the surface
roughness,does not depend on current density.
The surface appears to be dull and reveals the grain structure
due to the porosity of the samples of zirconium carbide received
(26%; see Table 1). The comparison with the surfaces as received shows
no large difference before and after machining except for the sharpness
of the large grains noticeable, which would be presumably due to the
attack of the surface oxides by the electrolyte anions during ECM.

-76-
i = 12.9 Ajcrn2 i = 40.7 A/cm2
XBB 785-5629
Figure 27. SEN Itlicrophotographs of the bottom of the holes drilled in ZrC with KN0
3; effect of the current density. (scale in ym)

-77-
Zirconium carbide
as received
i =27.1 A/cm2
t:.V = 14.8Volts
flow 3.90 lp.m.
in NaCI
i = 12.9A/cm2
t:.V= 15.6 Volts
flow: 7.46Lp.m.
XBB 785-6471
Figure 28. SEM microphotographs of the bottom of the holes drilled in this work; effect of the electrolyte. (scale in ~m)

-78-
b) The results in Fig. 28 present the appearance of zirconium
carbide after ECM in KN03
(top) and NaCl (bottom), The conclusion
drawn from the examination of the SEM pictures parallel
the conclusion drawn from the surface roughness: the grains have a
somewhat smaller size after machining in NaCl than in KN03 . This
would suggest there is an attack of the surface stronger with
Cl than with N03
anion. It is to be noticed that, in contrast with
titanium carbide, the larger grain structure is prominent, but the
small grain structure is still in evidence, although very faintly
between the large grains. This would suggest a less effective
protective action of the oxide film formed on zirconium carbide,
D. Titanium Diboride
Dl, Electrochemical behavior
As shown in the Table I listing the physical characteristics,
titanium diboride is known to have the highest hardness of the four
materials investigated in this work.
The figures representing the machining rate (Fr) and the
dissolution rate (liH) are plotted as the two previous carbides (Figs. 29
and 30) . They show comparable behavior for the dissolution of titanium
diboride in 2N potassium nitrate over current densities from 15 A/cm2
2 to 120 A/em. The theoretical lines [a), b), c)] on Figures 29 and 30
have been calculated by use of equations (5) and (10) for six, eight
and twelve electron processes, respectively, The experimental correla~
tion (line X on Figs. 29 and 30) indicates the number of electrons

-79-
ECM OF TITANIUM DIBORIDE 20
Machining versus current density
in KNO~ 2N +
15
a
10 .--, .. I
0 -a ..... e ' 8 g 5. -1--1 ~
0
0 20 40 60 80 100 120 i(amps/ cme)
XBL 785-8782
Figure 29. Machining rate versus current density for TiB 2 in KN0 3 . Experimental correlation~ line X. Theoretical lines: a) 6 electron process
b) 8 electron process c) 12 electron process

-80-
30. I' I I
:\fass removal rate versus current
in KNOa 2N +
20.
0
0 10. 20. 30. 40. 30. I( amps)
XBL 785-8629
Figure 30. Dissolution rate versus current for TiB2
in KNo3
. Experimental
and theoretical lines same as in figure 29.
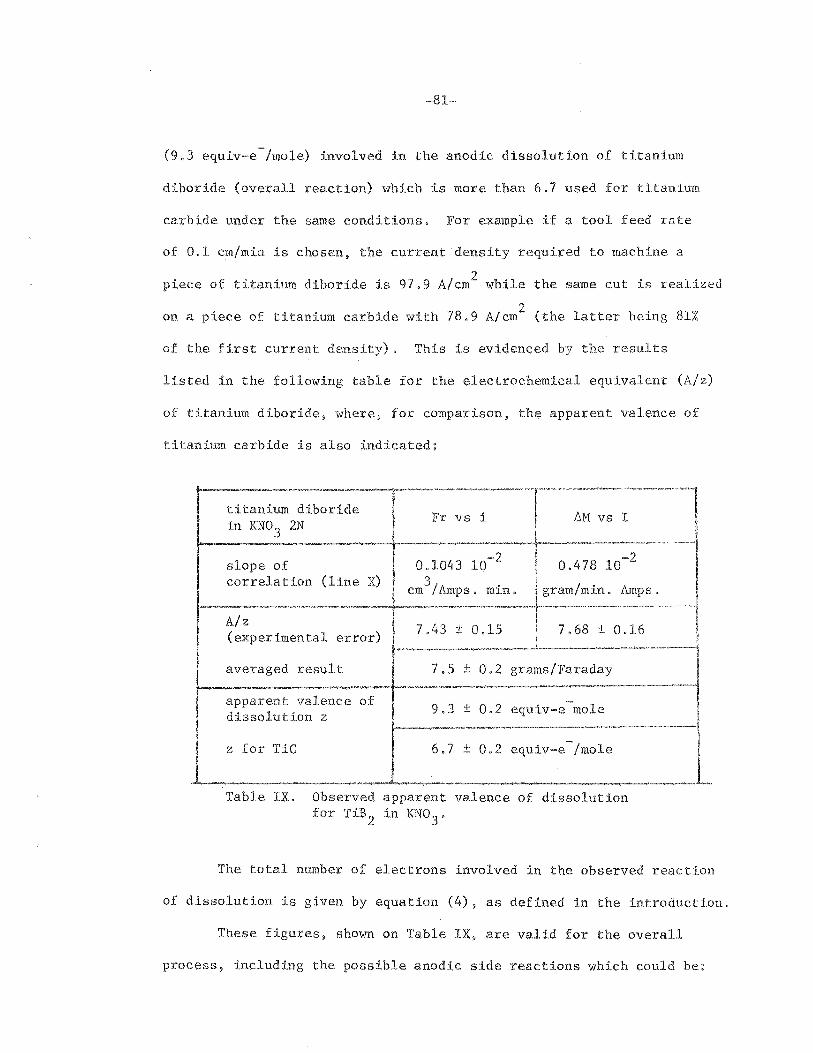
-81-
(9.3 equiv-e-/mole) involved in the anodic dissolution of titanium
diboride (overall reaction) which is more than 6.7 used for titanium
carbide under the same conditions. For example if a tool feed rate
of 0.1 em/min is chosen, the current density required to machine a
piece of titanium diboride is 97.9 A/cm2 while the same cut is realized
2 on a piece of titanium carbide with 78.9 A/em (the latter being 81%
of the first current density), This is evidenced by the results
listed in the following table for the electrochemical equivalent (A/z)
of titanium diboride, where, for comparison, the apparent valence of
titanium carbide is also indicated:
titanium diboride in KN03 2N
slope of correlation (line X)
A/z ( error)
Fr vs i
0.1043 3 em /Amps. min.
7.43 ± o.
LIM vs I
0.478 10-2
gram/min. Amps.
7.5 ± 0.2 grams/Faraday
9.3 ± 0.2 equiv-e-mole
Table IX. Observed apparent valence of dissolution for TiB 2 in KNo 3 •
The total number of electrons involved in the observed reaction
of dissolution is given by equation (4), as defined in the introduction.
These figures, shown on Table IX, are valid for the overall
process, including the possible anodic side reactions which could be:

20
15
0
15 10 '-0 'I-
' E 0 '-O'l
N
' <l 5
0
Drr--- OI)TD· E .L t:) . . \,..._ . -'
+.:~= ij/: + :J:+ + '*' + +
4
5
6 Q)
0 E
' 8 cp > ::l
10 g -12 N
15
20
0 20 40 60 80 100 120.
XBL 785-8630
Figure 31. Electrochemical equivalent (A/z) and apparent valence of dissolution (z) for TiB 2 in KN0
3.

-83-
1) Oxygen evolution, which cannot be determined by visual
observation of the electrolyte at the outlet of the machining gap
(see Fig. 7B), because the hydrogen evolved at the cathode is also
present in the flow of electrolyte.
2) Differential dissolution of the material due to the presence
of more than one structural phase or more than one element, as observed
during ECM of composite materials and multiphase alloys (20,50), The
exact chemical analysis of all the reaction products could ascertain
this last reaction but was not done.
Figure 31 shows the electrochemical equivalent and the apparent
valence of the reaction versus the current density according to
equations (12) and (13). The behavior of titanium diboride is constant
through the whole range of current density investigated, indicating
that the reaction of dissolution occurs with the same apparent valence
of dissolution (9,3 as determined),
D2. Analysis of the reactio~ products
Chemical analysis of the dissolved reaction products has not
been attempted during this work because the dilution of these species
is very high, It was calculated that, during one experimental run,
if the mass dissolved averaged 1 gram, and assuming that all the
reaction products are soluble, one molecule of dissolved species would
be present in L:snnno molecules of water and electrolyte (2 ppm),
Solid reaction products have been recovered and analyzed
After ECM operation, the edges, or walls, of the holes drilled were

-84-
XBB 785-6121
Figure 32. SEN microphotographs of the white powder recovered on the walls of the holes after ECN of TiB 2 in l(N0
3 (top) and of
TiC in NaCl (bottom). (scale in ~m)

-85-
covered by a white powder downstream of the feed holes of the cathode.
This white powder was present on the walls of the holes after machining
TiB2
as well as TiC (Fig. 32). No such material was observed ZrC or ZrB2
The powder was recovered carefully and analyzed by X-ray. As only
very small amounts (below 1 mg) were scraped off the walls after each
run, 25-30 runs were necessary to fill the capillary used for the
analysis. The capillary was placed in a 5.73 em diameter Debye Sherrer
* camera mounted on an X-ray diffraction unit using the Ni filtered
Cu radiation at 35 kV and 15 mA. The exposure time to the X-ray beam
*'~ varied from 4 to 8 hours to obtain visible X-ray lines on the film
The films were then processed with H-19 developer for 6' at 25°C. The
diffraction lines were then measured and compared with the diffraction
lines of reference compounds (49).
The results of the X-ray analysis are shown on Fig. 33, The
diffraction pattern of titanium dioxide (Ti02), found as a reference
(49), is drawn between the two diffraction patterns ofr the powder
recovered on TiC (top) and TiB2
(bottom) after machining. The very
top and bottom diffraction patterns represent the diffraction patterns
of sodium chloride (NaCl) and potassium nitrate (KN03), the electrolytes
used to machine TiC and TiB2
, respectively.
Figure 33 shows that Ti02 is part of the reaction products
after anodic dissolution of TiC and TiB2
. Regardless of the electrolyte
used. The other diffraction lines were proven to be caused by the
1< Norelco X-ray diffraction unit, North American Philips Co., New York, N.Y.
>h'< G X-ray film: ILFord.

NaCL, crystals
TiC in NaCI 3N
(runs 21 to26)
T i 0 2 (ref.)
Ti 8 2 in KN03
(runs 98 to 118)
XBB 785-6497
Figure 33. X-ray analysis of the solid reaction products after ECM of TiC (top) and TiB
2 (bottom). The X-ray diffraction
pattern of the electrolytes used are shown as references. The diffraction lines of Ti0
2 are also indicated (ref. 49).

~87~
electrolyte; the lines at large diffraction angles are not identified.
The other oxides of titanium: TiO[Ti(+2)], Ti2o
3[Ti(+3)] and
Ti3o5
[Ti(3.33)] as well as the titanates: NaTi02
[Ti(+3)] and Na2Ti04H2o
[Ti(+6)] have been ruled out as possible solid products because they
should show diffraction lines at very low angles which were not
observed (49),
Although the reaction mechanism cannot be derived from the
present experiments, the following overall reaction can be proposed
on the basis of the experimentally determined apparent valence and
of one of the reaction products (Ti02). The overall reaction is
written for titanium as:
Current efficiencies for the ECM of titanium alloys (below 10%
of alloying elements such as Cu, Al, Mo, and Si) determined by Bannard
(50) supported the following mechanism of reaction proposed before
by Chen et a1, (51):
Ti + H20 + 2H+ 2e -+ TiO +
TiO + 1/2 H2o + 1/2 Ti
2o
3 + H+ + e
1/2 Ti2o3
+ 1/2 H2o + -
+ Ti02
+ H + e
The sum of these three reactions yields equation 21 representing
the overall reaction for titanium. The valence +4 found here for
titanium is consistent with that result and the same equation 21 represent
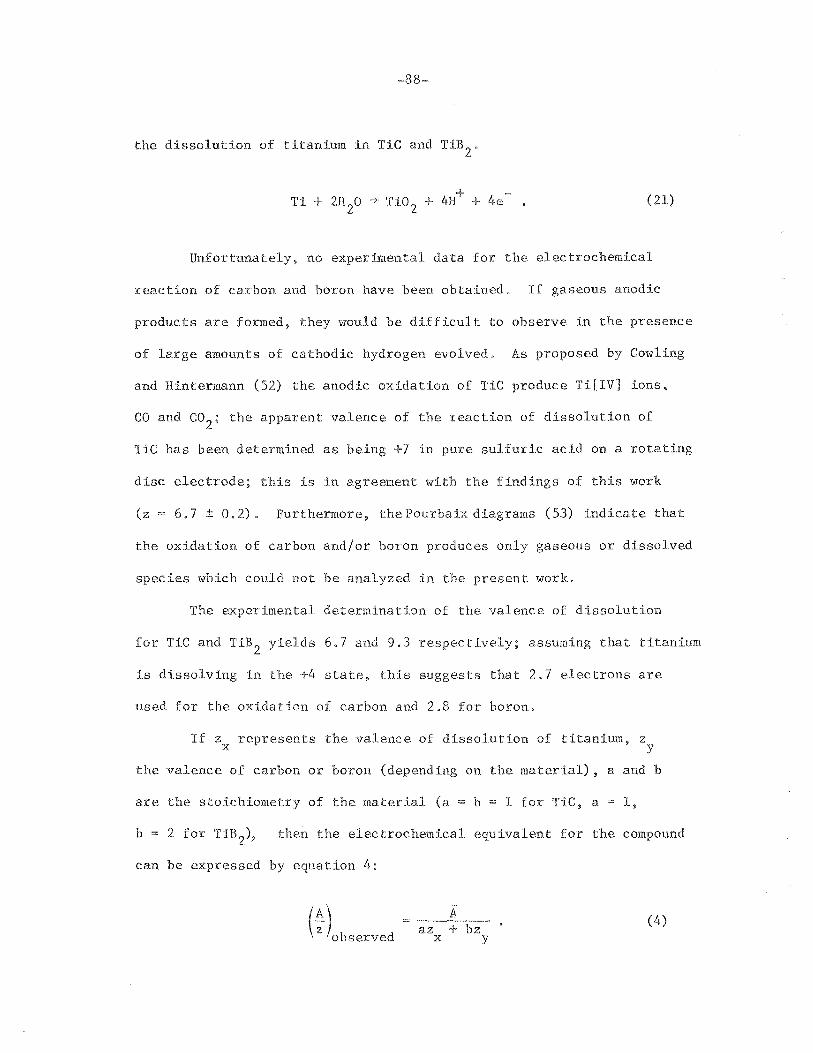
the dissolution of titanium in TiC and TiB2
.
(21)
Unfortunately, no experimental data for the electrochemical
reaction of carbon and boron have been obtained. If gaseous anodic
products are formed, they would be difficult to observe in the presence
of large amounts of cathodic hydrogen evolved. As proposed by Cowling
and Hintermann (52) the anodic oxidation of TiC produce Ti[IV] ions,
CO and co2
; the apparent valence of the reaction of dissolution of
TiC has been determined as being +7 in pure sulfuric acid on a rotating
disc electrode; this is in agreement with the findings of this work
(z = 6.7 ± 0.2). Furthermore, thePourbaixdiagrams (53) indicate that
the oxidation of carbon and/or boron produces only gaseous or dissolved
species which could not be analyzed in the present work.
The experimental determination of the valence of dissolution
for TiC and TiB 2 yields 6. 7 and 9.3 respectively; assuming that titanium
is dissolving in the +4 state, this suggests that 2.7 electrons are
used for the oxidation of carbon and 2.8 for boron.
If z represents the valence of dissolution of titanium, z X y
the valence of carbon or boron (depending on the material), a and b
are the stoichiometry of the material (a = b = 1 for TiC, a = 1,
then the electrochemical equivalent for the compound
can be expressed by equation 4:
A az +
X
(4)

-89-
The valence for each element in the compound cannot be assigned
positively; also the observed electrochemical equivalent is affected
by the current efficiency for the dissolution process. Although the
reproductibility of the overall valence is 2-3%, errors in valence
for carbon and boron are likely to be higher (6-7%), Thus, assuming
Ti to be oxidized to Ti(+4), valences for C and Bare found to be:
z(C) 2.7 ± 0.2
z(B) 2.8 ± 0.2
The present result for boron (z ~ 3) is in agreement with the
Pourbaix diagram; the only stable state of oxidation between B[O] solid
and a gaseous or other dissolved species is B[+3],
The average valence of carbon (2.7) could be assigned among
CO and co2 by the use of a mixing rule, where most of the carbon is
oxidized to CO in the +2 state.
The following overall reactions are consistent with the
experimental observations:
for TiC
for TiB2
TiC + 3H20 + Ti0
2 + CO + 6H+ + 6e
TiB2
+ 5H2o + Ti0
2 + B
2o
3 + lOH+ + lOe
D3, Frontal gap of dissolution
As for titanium carbide (see Fig, 13) the frontal gap of
dissolution is determined by the same experimental procedure according
to equations (11) and (16)

-90-
Table X. Experimental data for figure 34. ECM gap versus current density for TiB
2 in KN0
3.
RUN S.G. .H hole ram dial ECM gap i 2 b.V # mils em. mils mils A/em Volts
APPLIED VOLTAGE = 20 Volts
95 12 0.880 333 25 29.1 20.8
105 12 l. 060 402 27 26.4 20.0
109 12 1.035 396 23 34.6 21.0
96 12 1.055 405 22 lrO, 0 20.5
97 18 1.050 415 16 lr6, 5 20.6
98 17 1.060 420 14 53.8 20.5
99 12 1.070 420 13 60.3 20.6
APPLIED VOLTAGE = 25 Volts
112 12 0.625 216 42 24.1 25.1
113 17 0.900 340 25 34.2 25.1
114 12 0.955 364 24 46.3 25.0
100 12 1.080 420 17 60.7 24.3
101 12 1.065 )+16 15 69.2 24.5
103 12 0.830 324 14 81.8 24.3
102 12 1. olr5 411 12 79.3 24.4
APPLIED VOLTAGE = 30 Volts
118 17 0.515 170 52 26.6 29.5
115 12 1.645 393 26 48.6 29.4
108 12 1.085 422 17 65.7 29.4
106 12 0.670 258 14 101.0 28.4
116 7 1.080 420 12 98.2 29.1
117 7 1.150 446 14 103.3 3],.2

-91-
50
40
....--.. (/.I
30 ~
c. m 'oJ)
20 ~ I..!.J ocr_
' 10 20V
0
0 20 40 60 80 100 120
( A/cm 2)
XBL 786-9262
Figure 34, Frontal gap of dissolution for TiB2
in 2N KN03
; the broken
lines represent the theoretical correlations (equation 17), Experimental data: 20 Volts (+), 25 Volts (0) and 30 Volts (D).

ECM gap
ECM gap
-92-
k(Lw - n) i
h + S .G.
where k is the conductivity of the electrolyte during the run,
(16)
(11)
~V, the applied voltage between the cathodic toolpiece and the
anodic workpiece
n, the sum of the overvoltages and the electrodes potentials
SG, the starting gap set before ECM operation
o, the total movement of the toolpiece
h, the depth of the hole.
No direct measurement of the overvoltage in equation (16) can
be made so that it is neglected with respect to the overall applied
voltage for the theoretical correlations (broken lines on Fig. 34). The
assumption is certainly not justified for the low voltages but the
trend assumed by the experimental correlations show a similar behavior
to that expected; the offset between theoretical and experimental
correlations possibly giving a relatively good idea for the value of
the overvoltage for different operating current densities, The
theoretical correlations are calculated assuming a temperature of 25°C
-1 -1 and a conductivity of 0.145 Q em for KN0
32N in equation (17).
Below 15 Volts, because of the passive state of TiB2
, and the
consequent high voltage losses through the surface oxide, the obtainable
current density is too low to accommodate even the lowest tool advance-
-2 ment rate (2.5 10 em/min) available on our ECM equipment. For this
reason, instead of achieving an "equilibrium11 machining condition, the
cathodic tool would eventually come into physical contact with the
workpiece, causing an electrically short circuit.

-93-
D4, Current voltage relationship
Figure 35 shows the relation between the applied voltage and
the current density for the dissolution of titanium diboride under
ECM conditions in 2N potassium nitrate at two different gaps (llr and
25 mils), The extrapolation to zero current density of the experimental
linear correlation shows that the overvoltage associated with the
dissolution of titanium diboride (11-12 Volts) is larger than that of
the dissolution of titanium carbide (5-6 Volts). The same large values
of overvoltages are obtained at constant current density by the
difference between the experimental line and the ohmic drop in the
electrolyte, It is therefore concluded that the presence of boron
in the material affects its chemical behavior in a different manner
than the presence of carbon.
The high overvoltages might also explain the fact that no ECM
is possible below 15 Volts at low current densities, where the IR drop
in the electrolyte is of the same order of magnitude as seen on Fig. 35,
The surface appears etched as shown on the photographs of
Fig. 36 representing the surface of the bottoms of the holes drilled
in KN03 . This etching appears on the SEM micrographs (Fig. 36) at
three different magnifications. The appearance of the surface is
independent of the current density as shown in the two series of
experimental runs shown here at two different feed rates (2.5 10-2
and
~2 8.5 10 cm/min)respectively for the left and the right side of Fig, 36.

~
Vl _._, .-<
0 > ....__... ii)
bD c;:i
+" e-<
0 :>
'D (]) . ..-. .--. P-~ o. ~
60.
48.
J6.
24 .
12.
0
r_r I'Tl'\ ~~I lJ rA l) J 13 ·0 1<.1 l) 14:
T r ,- r -, r-r T T> r- T T r 1 · r -- 1
14 mils o
25 mils +
-+ 0
20. 40. 60. 80. 100. · ( I 2) 1 amps/ c1n
0
I I I _J
I
-·~ -1
.-j I 1
j I .,
-I 1
-~ I
·i ·j
.. L L_j
120.
XBL 785-8631
Figure 35. Polarization curve for TiB2
in 2N potassium nitrate at
two ECM gaps.

in 2N
i = 26.4 A/cm2
XBB 785~5628
Figure 36. SEM microphotographs; appearance of the machined areas on TiB 2 . Effect of the current dens in KtT0
3 ~ (scale in ]Jm)

Table XI. data for in 2N KN03
. Flow rates in liter/min, z in gram/Faraday.
RU'" lp ! I ! AV I I Fr hole rJ i I ~ I density/t1
r .L~ ress. 1 Flow T"ure k at 'i.'' A/z I ,
i \rolts ) ( 2) i ~2 ~1cm-~(g/clb) # [ (psig)! rate ! ( oc) (amps) 1 10~2em/mn (em.) A/em )10 g/:mn.,
' I
112 75 8.03 29°C 25.1 11.2. 2.10 0. 770 24.1 5.39 'l.12650/24°C 0.189 7.74
110 83 3.51 ' 28.5°C 17.8 12.4 3.40 0.670 35.2 s.96 l.l23S0/28. S°C 0.186 7.1
95 72 5-75 29°C 20.8 13.0 2.61 0.755 29.0 s.76 l.12000/20°C 0.180 7-7
96 74 s.2S 31°C 20.5 16.5 3.97 0.725 40.0 7.64 1.12250/27. S°C 0.196 7.4
114 25 3.16 33.5°C 25.0 18.6 4.57 0.71S L>6. 3 8.91 l.12450/30.5°C 0.213 7-7
115 44 4.80 29.5°C 29.4 20.9 4.78 0.740 48.6 10.04 1.12500/31 °C 0.194 7.7
98 70 4.08 34°C 20.5 21.0 5.38 0.705 S3.8 9.71 l.l2175/30°C 0.212 7.4
99 82 I 3.91 30°C 20.6 23.2 6.10 0.700 60.3 10.91 l.12050/32°C 0.187 7.6
101 77 3.99 31°C 24.5 27.0 7.00 0.705 I 69.2 12.47 l.12450/24°C 0.197 7.4
102 73 3.28 30°C 24.3 30.1 8.23 0.695 79.3 14.05 l.l2400/26°C 0.192 7.5
107 82 4.06 32°C 29.4 9.43 0.725 90.6 19.38 l.12600/28°C 0.205 7.6
106 86 3.19 30°C 28.4 9.99 0. 710 101.0 18.39 l.12600/28°C 0.196 7.4
117 83 3.25 25.5°C 31.2 10.60 0.690 103.3 18.6s l.129S0/22°C 0.175 7.7
-- -------------
I '-.0 (7\
I

-97-
E, Zirconium Diboride
El, Electrochemical behavior
Zirconium diboride is a material with excellent high temperatures
properties, high melting point, excellent oxidation resistance and
good high temperature strength (see Table I, Chapter II), It is often
used in applications where resistance to corrosion is needed,
Some little cracks were visible on the edges of the samples
received, presumably due to the manufacturing process, but were proven
not to interfere much during the anodic dissolution, These cracks
were not large and, if small variations were observed in the operating
parameters (current or pressure drop) due to an abrupt increase in
the machining gap because of the presence of a crack, they were not large
to affect the ECM.
Figures 37 and 38 represent the characteristic curves of
dissolution, It is to be noticed, by contrast to the previous materials
investigated in this work, that the behavior of zirconium diboride is
not constant over the range of current density used, The dissolution
process seems to be different at low current densities than at high
current density. The experimental correlations shown on these figures
do not pretend to be quantitative at low current density; because of
the lack of data available in this region, the investigation of the
dissolution at low machining rates was not possible because the equipment
-2 used did not allow tool advancement rates below 2,5 10 em/min,
Thus, the experimental correlation on the Figs. 37 and 38,
corresponding to the low current densities, represent only a qualitative
behavior for the anodic dissolution of zirconium diboride in KN03
.

..--.. "t 0 ..-l
>< 1=: ..... s ""' s-
0 ..._,_, ,... ~
20.
15.
10 .
5.
0
0
IRCONIUM
Machining rate versus current density
in KN03 2N +
b
20. 40. 60. 80. i(amps/ crn2
)
100. 120.
XBL 785-8634
Figure 37. Machining rate versus current density for ZrB 2 in KN0 3 , Experimental correlation, line X. Theoretical lines: b) 8 electron process
c) 12 electron process

-99-
ECM OF ZIRCONIUM DIBORIDE 30.
Mass removal
in KN03 2N +
20.
0
0 10. 20. 30. 40. 50. I( amps)
XBL 785-8635
Figure 38. Dissolution rate versus current for ZrB 2 in KN03
• Experimental
and theoretical lines same as in figure 37.

~100~
This surprising behavior could be ascribed to a transpassive
dissolution with a low apparent valence occurring at the higher current
densities.
The theoretical lines included in the figures are calculated
from equations 5 and 10 and represent two dissolution processes occurring
with eight (line b) and twelve (line c) electrons.
The following table lists the values of the electrochemical
equivalents and the apparent valences for the dissolution of zirconium
diboride in 2N potassium nitrate measured experimentally in the two
different modes.
ZrB 2 current Fr vs i 11M VS I density
-slope of 1 low 9.75 10-2
0.502 10-2
correlation high 0.120 10~2 0. 750 10-2
(line X on Figs. 37 & 38) tf3
/A•min. gram/A•min, """""' u"'"'" ~~~-~,_ ........
A/z low ,1 8.1 exp. correlation high ! 11.2 ± 0.2 11.9 ± 0.2
·---~·~
A/z low 8 ± 1 averaged on high 11.5 ± 0.4 both measures
apparent valence low 14 ± 1 of dissolution high 9.8 ± 0.3 (equation 5)
Table XII. Observed apparent valence of ZrB2 in KN03
•
Because the error associated with the determination of the
electrochemical equivalent at low current densities is large due to
the small number of experimental runs in this region. A quantitative
correlation is not attempted here.

-101-
20
6
zirconium diboride in KN03 2N + 7
15 8
- + - 10
:::>. + + + + + 0 10 ++ ++ u a +++ - 12 ,_ + a ++ 4-
' -4- ++ E 15 a ,_ Ol
-...,.-
N 5 20
~ 30
0
0 20 40 60 80 100 120 i(amps/cm11
)
XBL 785-8779
Figure 39. Electrochemical equivalent (A/z) and apparent valence (z) of dissolution for ZrB 2 in 2N KN03 .
----Q)
0 E ' Q)
I > ::l cr (!)
N

-102-
Further evidence of this transpassive behavior is shown on
Fig. 39, by plotting the electrochemical equivalent and the apparent
valence of dissolution versus the current density for each experimental
run. The small value of A/z at low current density reflects a high
valence of dissolution in that region, as would be expected for a
passivation phenomenon where side reactions are likely to occur on the
anodic side.
The gradual change observed in the apparent valence of the
dissolution reaction suggests that the overall process varies with
2 the current density and reaches a steady state above 50 A/em .
E2.
Using the same equations 11 and 16 as for titanium carbide
and titanium diboride, the frontal gap of dissolution is determined
for the ECM of zirconium diboride in KN03 .
The same effect is observed: the general trend assumed by the
experimental curves, being parallel to the theoretical calculations,
(equation 16) represents the expected one.
The important parameters used in Fig, 40 are listed in Table XIII.
Unlike titanium diboride, ECM of zirconium diboride is possible below
15 Volts because of its ability to dissolve in the passive state,
probably due to the large porosity of the anodic film formed during
passivation which does not prevent complete dissolution of the covered
surface.
In the experimental correlation the curves at 15 and 20 Volts
are closer together than those at 20-25 V and at 25-30 V. This could

-103-
Table XIII, Experimental parameters for figure 40: ECM gap versus current.
RUN /l.V H hole S.G, ~ gap i 2 # volts em mils mils mils A/em
APPLIED VOLTAGE = 15 Volts
120 14.8 0.565 11 206 27 29.5
121 15.4 0.620 12 236 20 34.6
APPLIED VOLTAGE = 20 Volts
123 20.0 0.610 10 212 l.fo 30.0
119 20,0 0.555 12 210 20 40.5
125 20.2 0.585 9 223 16 51.7
APPLIED VOLTAGE = 25 Volts
122 25.1 0.625 14 222 38 37.2
126 24.8 0.645 9 240 23 53.3
128 25.2 0.580 10 217 21 61.0
129 25.1 0.990 9 380 19 68.4
131 25.4 0.955 10 365 15 77.1
APPLIED VOLTAGE = 30 Volts
138 30.0 0.505 14 165 48 38.6
132 30.2 0.950 10 365 19 86.5
l -::?? .,<_JJ 29.9 1.010 9 390 17 91.4
134 30.0 1.025 10 396 17 99.8
136 31.0 1.030 10 4oo 16 115.7

-104-
60
a 15 v 50
© 20 v v 25 v
40 6 30 v
~ V3
30 ~
c. I"CC 0.0
20 c..;)
~
10
0
0 20 40 60 80 100 120
( A/cm 2)
XBL 786-9263
Figure 40, Frontal gap of dissolution at different applied voltages for the ECM of ZrB
2 in KN0
3.

~105-
be due to the passivation of the surface which decreases the current
density (at constant voltage) by comparison to the value it would have
if dissolution of the material was the only anodic reaction. As shown
in Fig. 40, a shift of the curve towards the higher values of gap for
the same current density results. (The frontal gap is inversely
proportional to the feed rate or the current density.)
E3. Current~voltage relationship in KN0 3
Since zirconium diboride is the only material investigated to
present this particular behavior, the phenomenon has been further
explored. The experiments carried out in this work permit only the
control of the applied voltage and since the current is determined
by the machining rate, the polarization curve has been derived from
measurements with a constant frontal gap of dissolution representing
the third element necessary to the establishment of the polarization"
As mentioned earlier, the machining gap is not d available
by visual observation, but an approximate value can be obtained from
the measurements with the use of equation (11):
ECM gap h + S,G. ~ 6 . (11)
Table XIV lists the useful parameters for three different machining
gaps, representing a constant cell geometry; Fig. 41 plots the final
results. This represents a further evidence of the observed phenomenon.
Due to the errors in the experimental determination of the gap, the
polarization curve so determined is not precise, but the trend assumed
indicates that a different dissolution reaction seems to occur at low
current density.

-106-
Table XIV. Experimental data for figure 41: polarization curve of ZrB 2 in KN0 3 .
RUN # AV(vo1ts)
E.C.M. gap = 20 mi1s/0.508 mm.
121
119
128
132
15.4
20.0
25.2
30.0
34.6
40.5
61.0
86.5
E.C.M. gap = 16 mi1s/0.406 mm.
125
131
135
126
20.2
25.4
30.3
15.0
51.7
77.1
106.2
41.0
E.C.M. gap = 30 mi1s/0.762 mm.
15.0 27.1 from fig.
20.0 32.0 (36)
45.2 25.0
30.0 61.1

-107-
50
40 in K 1\03 2 N
30
-II» -0 > 20
Q)
Ol 0
> "0 Q) 10 a. a. <(
0
0 20 40 60 80 100 120 i (amp s/c m2
)
XBL 785-8637
Figure 41. Polarization curve of ZrB2
in 2N KN03
.

~108-
It is to be noticed that, for comparison, the data on the
Fig. 41 corresponding to a ECM gap of 30 mils, have been deduced
from Fig. 40 representing the variations of the gap versus the current
density. The same trend obtained by this interpolation suggests
that the experimental determination of the machining gap used in the
procedure yields valid approximations.
E4. SEM analysis: effect of the current density
The difference between the low current densities and the high
current densities was also explored by SEM. The appearance of the
surfaces lead to the same conclusion: on Fig. 42, microphotographs
are showing the surfaces of the bottoms of the holes drilled in zirconium
diboride. The slight difference of appearance between the EC machined
surfaces at low current density (left column) and at high current
density (right column) could be due to an anodic film, more strongly
adherent at low current density, and on which a possible side reaction
at low current density, like oxygen evolution, could occur:
+ o2 + 2H + 2e
This side reaction could accout for the high apparent overall
valence of the dissolution reaction at low current densities (14 equiv e-/
mole versus 9.8 at high current densities),
Thus, if the light material visible on the pictures of the left
column represent the anodic passivation film, it is shown to cover
partially the anode surface and gradually disappear or to reach a steady

-109-
as received
i = 29.9 A/cm 2 i = 75.0 A;cm2
120
XBB 785-5626
Figure 42. SEH microphotographs; effect of the current density on ECl1 of ZrB2 . (scale in ~m)
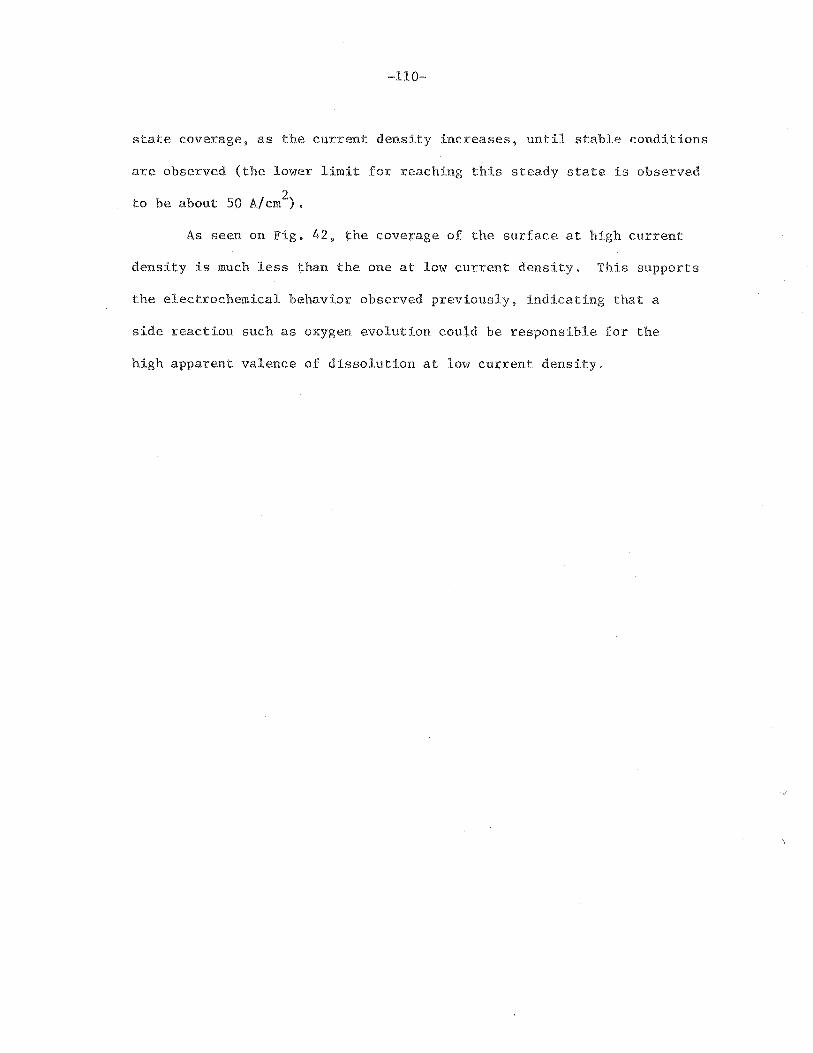
-110-
state coverage, as the current density increases, until stable conditions
are observed (the lower limit for reaching this steady state is observed
2 to be about 50 A/em ) .
As seen on Fig. 42, the coverage of the surface at high current
density is much less than the one at low current density, This supports
the electrochemical behavior observed previously, indicating that a
side reaction such as oxygen evolution could be responsible for the
high apparent valence of dissolution at low current density.

Table Xll. Experimental data for ZrB2
in KN03
.
I ! 1 ! RUN Press.' ?low r::::'ure.:· lit.~[ I ::·r
# (psig) rate (volts)' (amps) .,.2 10 cm/rnn
123 36 4.27 32.5°C 20.0 12.4 2.08
120 62 2.66 27°C 14.8 11.2 2.13
122 34 4.62 30°C 25.1 15.8 2.83 i
121 63 2.74 30°C 15.4 12.2 2.86
119 68 2.92 27°C 20.0 15.6 3.40
124 54 3.55 27°C 20.1 17.7 4.18
125 80 3.64 27°C 20.2 18.5 4.80
127 45 3.35 29°C 24.6 21.2 5.25
128 48 3.20 31° c I 25.2 22.8 5.74
3.64 32°C I
25.1 6.76 129 50 25.2
130 57 2.92 30°C 25.2 26.2 7.45
131 76 3.01 31°C 25.4 28.0 8.36
133 58 3.01 27.5°C 29.9 33.2 9.80
134 63 3.19 30°C 30.0 35.7 10.75
136 66 2.65 30°C 31.0 42.0 12.60
i I
Flow rates in , in gram/Faraday.
hole 'J 0
i (;:/ dens.:.ty/t1 }: :.;.t - .-_/z
(em) (A/cm2) --2 n:1 c::-;;, ; '2J..'o ::.o g/rnn
:
0.725 30.1 5.86 1.12:::)0 /29°-:: 0.205 :~~
0.695 29.5 5.42 l.l2075/22.5°C 0.188 7.8
0.735 37.2 7.65 l.l2050/2G.5°C 0.183 7.3
D.670 34.6 6.10 l.l2000/23°C 0.186 3 0 .v
0.700 40.5 7.94 l.11975/l8.5°C 0.170 8.2
0.685 48.0 9.93 1.12050/30°0 0.177 9 .. 0
0.675 51.7 10.84 l.12450/22°C · 0.175 ).4
0.695 55.9 12.55 l.12450 1 25°C 0.184 ].)
0.690 61.0 13.69 l.12375/28°C 0.198 9.7
0.685 68.4 15.75 1.12425/23.5°0 0.204 1J. 8
0.630 72.1 16.17 l.l2575/2S.5°C 0.1?4 ! 9.9
0.675 77.1 : 18.58 1.12475/28.5°0 0.194 ; 10.7
0.680 91.4 l ' 22.14 l.12825/25°C 0.181 ! l0.3
0.675 99.8 23.76 l.l2720/26°C 0.196 10 ... 3
0.680 115.7 28.01 1.12700/26°0 0.191 18·. 3
i
I 1-' 1-' 1-' I

-112-
SUMMARY AND CONCLUSIONS
The use of ECM was proven feasible for the machining of very
hard materials, TiC, ZrC, TiB2
and ZrB2
. The apparent valence for
the anodic dissolution of each material was found to be independent
of the two electrolytes investigated (2N, KN03
, 3N, NaCl) and are
listed in the following table.
Material TiC ZrC TiB 2 ZrB2
!-----·~-----+----·--~-~·~· ···---~-·----~--
z(equiv e-/mole) 6.7 5.7 9.3 9.8
The overall scheme of the dissolution reaction has been suggested
and is supported by the knowledge of the apparent valence of dissolution
and of one of the reaction products for the dissolution of TiC and
TiB 2 .
The dissolution reaction overvoltages were shown to be constant
in the range of current density investigated and in the order of several
volts as listed in the following table
-......o.-- .... -·-··~'·'--'- ~"- . - _, . .,_.,~'-"'- ,-,..··-·--·
Material TiC ZrC TiB 2 ZrB2
Overvoltage 5-6V 9-lOV 11-12V of reaction (Volts)
Lastly, the surface roughness attainable on TiC and ZrC was
shown to be in the range of 3-7 ~m and to be only dependent on the
electrolyte used for the ECM of these materials,

APPENDIX: Design of the Toolpiece
Preliminary experiments carried out using the toolpiece of
design A were shown not to be reproducible if meaningful at all, A
characteristic recorded data set is traced in Fig. 43. As seen during
the whole course of this run (TiC in KN03). the cvrrent and the applied
voltage oscillated between two very different values without any
tendency for reaching a steady state. A further investigation of this
phenomenon, using different applied voltages and tool feed rates
indicated that:
• the oscillations always occurred abruptly and were large;
• as the current jumps, the applied voltage drops;
• at constant flow rate, the pressure drop in the ECM gap
decreased slightly when the current was in the high plateau,
and increased slightly when the current was at the low
plateau;
• the oscillations were not always regular and reproducible;
• the oscillations seemed to disappear at very low flow rates.
A galvanostatic study of the dissolution of copper at high rate
in a channel cell (54) showed a similar oscillatory behavior. The
voltage oscillations were explained by alternating passivation and
breakdown of the anodic surface. The layer of oxides formed during
dissolution covered the anode and increased the resistivity of the
anode-electrolyte interface. This change in the polarization of the
anode resulted in a potential jump until the anodic film formed was
flaked off and removed by the flow of the electrolyte. The phenomenon
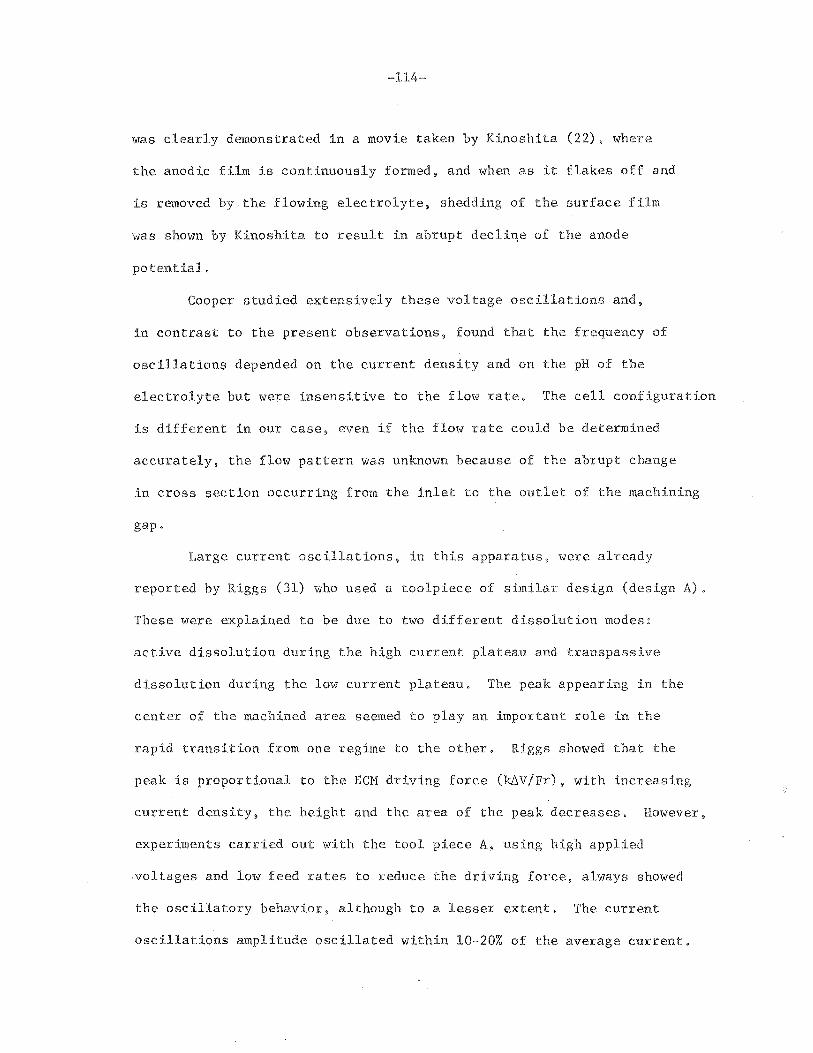
-114-
was clearly demonstrated in a movie taken by Kinoshita (22), where
the anodic film is continuously formed, and when as it flakes off and
is removed by the flowing electrolyte, shedding of the surface film
was shown by Kinoshita to result in abrupt decli~e of the anode
potential.
Cooper studied extensively these voltage oscillations and,
in contrast to the present observations, found that the frequency of
oscillations depended on the current density and on the pH of the
electrolyte but were insensitive to the flow rate. The cell configuration
is different in our case, even if the flow rate could be determined
accurately, the flow pattern was unknown because of the abrupt change
in cross section occurring from the inlet to the outlet of the machining
gap.
Large current oscillations, in this apparatus, were already
reported by Riggs (31) who used a toolpiece of similar design (design A).
These were explained to be due to two different dissolution modes:
active dissolution during the high current plateau and transpassive
dissolution during the low current plateau. The peak appearing in the
center of the machined area seemed to play an important role in the
rapid transition from one regime to the other. Riggs showed that the
peak is proportional to the ECM driving force (k6V/Fr), with increasing
current density, the height and the area of the peak decreases. However,
experiments carried out with the tool piece A, using high applied
.voltages and low feed rates to reduce the driving force, always showed
the oscillatory behavior, although to a lesser extent. The current
oscillations amplitude oscillated within 10-20% of the average current.

100
80
"" c "0
" "' ~
;; 60 .£: 0
~ "
40
20
I '"""'
applied voltage penetration of tool
outlet temperature
3 4 5 6
XBL 785-8878
Figure 43. Oscillations recorded us the ieee of design A for the ECM of TiC in KN03
(run ; low current range: 20.8 Volts at 6 Amps, high current range: 20.4 Volts at 16 Amps.
I 1-' 1-' V'l I

-116-
The huge variations of the current (100 to 150% in certain
cases) at high values of ECM driving forces cannot be explained by a
simple passivation phenomenon. For example, associating the low
current plateau periods with the formation of a passivating film in
the run illustrated in Fig. 43, this film would be thick enough to
close the gap by a third of its normal value. For such a drastic
change in the geometrical configuration of the cell, a similar response
would be expected from the flow conditions. Since no such large
effect was observed, either in the pressure drop or the flow rate~ it
was concluded that a passivation phenomenon could not satisfactorily
describe this dramatic behavior.
To eliminate this phenomenon, which was probably due to the
hydrodynamic characteristics of the system, a different toolpiece
(design B) was constructed. This new toolpiece was designed
primarily to allow:
a good distribution of the electrolyte throughout the gap
of dissolution;
a reduction of the effects of a large protuberance on the
machining area by suppression of the peak;
a larger cathodic surface area to ensure a better current
distribution over the entire machined area.
This design is shown in Fig. 7 and SA. It consists of a
toolpiece, the front tip of which is provided with five small holes
to deliver the electrolyte into the ECM gap. The diameter of the
holes for the delivery of the electrolyte, was chosen to be large

-117-
enough not to cause too large a pressure drop~ and small enough so
that the peak opposite each hole should create as little disturbance
as possible. The highest peak recorded was 0.1 ~ for a ECM gap of
0.7 mm (run 65 : TiC in KN03) which can be considered negligible as
compared with design A where the peak height could be from 2 to 4 mm
under the same conditions.
A typical data set is shown on Fig. 5 for TiC machined in 3N
-2 NaCl at a toolpiece feed rate of 4,43 10 em/min, using a toolpiece
of design B. The oscillations have disappeared and the steady state
is reached within less than 15% of the whole duration of the experiment.
The toolpiece of design B was used throughout this work,

-118-
References
1. John F. Wilson, Practice and Theory of Electrochemical Machining, Chapter III, Wiley Interscience, New York, 1971.
2. A. E. DeBarr and D. A. Oliver, Electrochemical Machining, p 122, McDonald Cy, London, 1968.
3. 0. W. Storey, J. Electrochem. Soc. 100, 5.53.
4. British patent # 722-939
5. British patent # 974-338
6. British patent # 974-339
7. B. H. Wilkinson and G. R. Stuart, Developments of ECM Techniques, Electronics and Power, Vol 10, Dec. 1964, p. 420.
8. Developments in ECM Techniques, Machinery, Vol 107, Dec. 1965, p 1450.
9. British patent # 753-467
10. British Patent # 1058-930
11. British patent # 846-278
12. British patent # 846-279
13. British patent # 1093-114
14. British patent # 854-541
15. British patent # 1014-095
16. British patent # 1004-999
17. US NASA Handbook, April 1968, ~achining and Grinding of Ultra High Strength Steels and Stainless Steel Alloys.
18. K. W. Mao and J.P. Hoare, J. Electrochem. Soc, 119 (1972) 419.
19. British patent # 335-003, W. Gussef
20. J, Bannard, Electrochemical Machining, J. of Applied Electrochem. 7 (1977)1-29.
-119-
21. K. W, Mao,J Electrochem Soc ll8 (1971) 1870-.1889.
22. K. Kinoshita, Anodic Dissolution of Copper at High Current Density, PhD thesis, University of California, Berkeley, 1969.
23. J. A. HcGeough, princiJ?les of Electrochemical Hachining, Chapman and Hall, London, 1974, p 7,
24. Mitchell A. Laboda and Michael L Hclvlillan, New Electrolyte for ECM, J. Electrochem. Soc. 5 (1967) 340.
25. M. A. Laboda, J. P. Hoare and S. E. Beacon, Importance of the Electrolyte in ECMJCollection Czekslovakia Chern. Comm, Vol 36 (1971) p. 680,
26. C. F. Noble, S. J. Shine, Electrochemical Drilling with Alternative Current, J. Appl. Electrochem 5 (1975) 215.
27. E. Yeager, A. J. Salkind, Techniques of Electrochemistry, Vol 3, Wyley Interscience Publication, 1973.
28. pesigning with Hard }1atet1aJ~ - Alloys, Reference manual edited by Kumametal, Inc. Latiobe, PA, 1977.
29. A. E. DeBarr and D, A. Oliver (see Ref. 2) p. 209.
30. Kearton, Steam Turbines, Theory and Practice~ Pitman, p. 51.
31. J. B. Riggs, Modeling of Electrochemical Hachining of Copper, Ph.D. Thesis, University of California, Berkeley.
32. Proceedings of vJorkshop on Ceramics and Advanced Heat Engines ERDA Jan. 1977, p. 17.
33. Peter T. B. Shaffer, ?igh Temperature Materials, Plenium Press, NY, 1969.
34. G. L. Miller, Hetallurgy of the Rare Metals, London Butterworth Scientific pulbication, 2nd Ed. 1971.
35. A. Bluementhal, The chemical behavior of Zirconium 1 Warrin B., 1958.
36. Edmund K. Storms, The Refractory Carbides, Academic Press, New York and London, 2nd ED. 1967.
37. "Machining Characteristics of High Strength Thermal Resistant Haterials", USAF Machinability Report, Vol. 4, 1960, Curtiss Wright Corporation, subcontract to Metart Research Associates, Inc.

-120-
38. Michael Field, William Koster, "Surface Integrity in Machining and Finishing, ASTHE Technical paper, July 1967, MR 67-142.
39. J. Bannard, Electrochemical Machining, J. Appl. Electrochem 7 (1977) 1-29'
40. A. T. Kuhn, Industrial Electrochemical Processes "Electrochemical Machining", Elseview Publishing Co. 1971,
41 Yun Petrov, N. N. Parshutin, Influence of Composition of Tempered Carbides on the Productivity and Surface Finish durin Electrochemical Dimension Working, Elektronaya Obrabotka I'iaterialov 4 (1972) p 22.
42. J. Bannard, Effect of Flow on the Dissolution Efficiency of Mild Steel during ECM, J. Appl. Electrochem 7 (1977) p 267-270, Technical note.
43. J. P, Hoare and M, A. Laboda, Investigation of the Differences Between NaCl and NaCl0
3 as Electrolytes in ECl1, J. Electrochem.
Soc. 116 (1969) 199.
44. M. A. Laboda, J. P. Hoare "The Importance of the Electrolyte in ECH", Collection Czechoslov. Chern Commun. Vo. 36 (1971) 680.
45. J. P. Hoare, M. A. Laboda "ECM of High Temperature Alloys in NaCl03 Solutions", J, of Electrochem. Soc. 120 (1973) 107L
46. M. A. Laboda, M. L. McMillan, A New Electrolyte for Electrochemical Machining, J. Electrochem. Soc. 5 (1967) 340.
47. J. P. Hoare, Oxide Files Studies in ECl1 Electrolytes, J. Electrochem Soc. 117 (1970) 142.
48. McGeough, Electrochemical Machining (See Ref. 23), Chapter III: Metals and Electrolytes.
49. Alphabetical Index of Inorganic Compounds, International Center for Diffraction Data, Swarthmore, PA 19081, 1977 Ed.
50. J. Bannard, "On the ECM of Some Titanium Alloys in Bromide Electrolytes", J. AppL Electrochem 6 (1976) 4 Ji-483.
51. C. H. Chen, F. H. Beck and M. G. Fontana, Corrosion 26 (1970) 135.
52, R. D. Cowling and H. E. Hintermann, The Anodic Oxidation of Titanium Carbide, J. Electrochem. Soc. 118 (1971) 1912.
53. M. Pourbaix, Atlas of Electrochemical Eguilibria in Aqueous Solutions 2
Peyamon Press, London, 1966.

-121~
54. J. Cooper, Periodic Phenomena in Copper Dissolution at High Constant Current, Ph.D. Thesis, University of California, Berkeley.
55. P. J. Boden and J. M. Evans, Reduction of Stray Current Attack in ECM, J. Electrochem. Soc. 116 (1971) 1870-1879.
56. 0. P. Gamov, The Influence of the Electrolyte and pH on the Strength of Tungsten Carbides during ECM, Applied Electrical Phenomena, 3 (1973) 18.
57. J.P. Hoare, Nature 219 (1968) 1034.
58. J. B. Cotton and I. Dugdale, Corrosion Science 4 (1964) 397,
59. J. Newman, Electrochemical Systems, Prentice Hall, Englewood Cliffs, 1973.
60. D. Landolt, R. Muller and c. W. Tobias, Mass Transport in ECM in "Fundamentals of ECM11
, ed. by Faust, Battelle Memorial Institute.
61. W. G. Clark and J. A. McGeough, Temperature Distribution Along the Gap in ECM, J. Applied Electrochem. 7 (1977) 277-286.
62. Lange Ha~~~oo~ of Chemistry, 11th Edition, ed. by J. Dean, 1973.

~122-
ACKNOWLEDGEMENTS
I would like to express my gratitude to Professor Tobias and
to Dr. Muller for their support during the course of this study.
Their comments in the final stage have been of a great help for the
presentation of this work.
I am also indebted to Professor Pickus for the review of this
manuscript.
I would like to thank Walter Giba for his ability to solve
technical problems, Carol Payne and Linda Betters for typing this manuscript.
This work was performed under the auspices of the United States
Energy Research and Development Administration.

This report was done with support from the Department of Energy. Any conclusions or opinions expressed in this report represent solely those of the author(s) and not necessarily those of The Regents of the University of California, the Lawrence Berkeley Laboratory or the Department of Energy.