On the spectrum of soil moisture from hourly to interannual scales
10
On the spectrum of soil moisture from hourly to interannual scales Gabriel G. Katul, 1,2 Amilcare Porporato, 1,2 Edoardo Daly, 1,2 A. Christopher Oishi, 1 Hyun-Seok Kim, 1 Paul C. Stoy, 1 Jehn-Yih Juang, 1 and Mario B. Siqueira 1,3 Received 17 July 2006; revised 8 January 2007; accepted 25 January 2007; published 22 May 2007. [1] The spectrum of soil moisture content at scales ranging from 1 hour to 8 years is analyzed for a site whose hydrologic balance is primarily governed by precipitation (p), and evapotranspiration (ET). The site is a uniformly planted loblolly pine stand situated in the southeastern United States and is characterized by a shallow rooting depth (R L ) and a near-impervious clay pan just below R L . In this setup, when ET linearly increases with increasing root zone soil moisture content (q), an analytical model can be derived for the soil moisture content energy spectrum (E s ( f ), where f is frequency) that predicts the soil moisture ‘‘memory’’ (taken as the integral timescale) as b 1 1 hR L /ET max , where ET max is the maximum measured hourly ET and h is the soil porosity. The spectral model suggests that E s ( f ) decays at f 2a at high f but almost white (i.e., f 0 ) at low f, where a is the power law exponent of the rainfall spectrum at high f (a 0.75 for this site). The rapid E s ( f ) decay at high f makes the soil moisture variance highly imbalanced in the Fourier domain, thereby permitting much of the soil moisture variability to be described by a limited number of Fourier modes. For the 8-year data collected here, 99.6% of the soil moisture variance could be described by less than 0.4% of its Fourier modes. A practical outcome of this energy imbalance in the frequency domain is that the diurnal cycle in ET can be ignored if b 1 1 (estimated at 7.6 days from the model) is much larger than 12 hours. The model, however, underestimates the measured E s ( f ) at very low frequencies ( f b 1 ) and its memory, estimated from the data at 42 days. This underestimation is due to seasonality in ET max and to a partial decoupling between ET and soil moisture at low frequencies. Citation: Katul, G. G., A. Porporato, E. Daly, A. C. Oishi, H.-S. Kim, P. C. Stoy, J.-Y. Juang, and M. B. Siqueira (2007), On the spectrum of soil moisture from hourly to interannual scales, Water Resour. Res., 43, W05428, doi:10.1029/2006WR005356. 1. Introduction [2] Over the past two decades, the temporal spectrum of soil moisture (q) has received significant attention in the climate, hydrologic, and land surface communities because of its impact on a number of processes including terrestrial rainfall [Delworth and Manabe, 1988, 1993; Parlange et al., 1992; Entekhabi et al., 1996; Findell and Eltahir, 1997; Koster and Suarez, 2001; Wilson et al., 2001; Wu et al., 2002, Chen and Kumar, 2002; Lauzon et al., 2004; Koster et al., 2004; Wu and Dickinson, 2004; Amenu et al., 2005], biogeochemical cycling, and ecosystem resilience [D’Odorico et al., 2003; Porporato et al., 2004]. Because of storage effects within the soil pores, the dynamics of q posses a memory that is often considerably longer than the integral timescale of many atmospheric processes. Hence climate anomalies can be ‘‘sustained’’ through land surface feedbacks primarily because they can ‘‘feed off’’ on this long-term memory. [3] The dynamics of q at a given location depends on the hydrologic balance and on the interplay between variability in incident precipitation (p i ), interception, total evapotrans- poration (ET), drainage below the root zone, and lateral flow. More indirectly, soil hydraulic properties, hydraulic lift from below the main rooting system, surface heating, and other boundary conditions, such as groundwater table fluctuations or feedback from soil organic matter dynamics (e.g., litter fall, microbial biomass, decomposition), can also shape the spectrum of q. Studying the joint effects of all these processes on the spectrum of q remains beyond the scope of a single study. However, a logical starting point is to restrict the q spectral analysis to two elementary variables shared by all climatic and hydrologic applications: a pre- cipitation forcing (e.g., p i ) and a water loss (e.g., ET). Even within this restrictive scope, analytical theories to predict the spectrum of q at timescales ranging from hour to interannual have not been fully addressed (mainly due to the lack of data) and frame the objective of this study. [4] This objective is addressed via a case study using long-term spatially averaged q collected in a uniform shallow-rooted loblolly pine (Pinus taeda L.) plantation (PP) in the southeastern United States. This ecosystem lends itself to a number of simplifying hydrologic assump- tions that permit us to explore analytically how variability in p i and ET shapes the spectrum of q. A unique data set of half-hourly p i , ET, and q measured within the rooting zone 1 Nicholas School of the Environment and Earth Sciences, Duke University, Durham, North Carolina, USA. 2 Department of Civil and Environmental Engineering, Pratt School of Engineering, Duke University, Durham, North Carolina, USA. 3 Departamento de Engenharia Meca ˆnica, Universidade de Brası ´lia, Brasilia, Brazil. Copyright 2007 by the American Geophysical Union. 0043-1397/07/2006WR005356$09.00 W05428 WATER RESOURCES RESEARCH, VOL. 43, W05428, doi:10.1029/2006WR005356, 2007 Click Here for Full Articl e 1 of 10
Transcript of On the spectrum of soil moisture from hourly to interannual scales

On the spectrum of soil moisture from hourly to interannual scales
Gabriel G. Katul,1,2 Amilcare Porporato,1,2 Edoardo Daly,1,2 A. Christopher Oishi,1
Hyun-Seok Kim,1 Paul C. Stoy,1 Jehn-Yih Juang,1 and Mario B. Siqueira1,3
Received 17 July 2006; revised 8 January 2007; accepted 25 January 2007; published 22 May 2007.
[1] The spectrum of soil moisture content at scales ranging from 1 hour to 8 years isanalyzed for a site whose hydrologic balance is primarily governed by precipitation (p),and evapotranspiration (ET). The site is a uniformly planted loblolly pine stand situatedin the southeastern United States and is characterized by a shallow rooting depth (RL)and a near-impervious clay pan just below RL. In this setup, when ET linearly increaseswith increasing root zone soil moisture content (q), an analytical model can be derivedfor the soil moisture content energy spectrum (Es( f ), where f is frequency) that predicts thesoil moisture ‘‘memory’’ (taken as the integral timescale) as b1
�1 � hRL/ETmax, whereETmax is the maximum measured hourly ET and h is the soil porosity. The spectralmodel suggests that Es( f ) decays at f
�2�a at high f but almost white (i.e., f 0) at low f,where a is the power law exponent of the rainfall spectrum at high f (a � 0.75 forthis site). The rapid Es( f ) decay at high f makes the soil moisture variance highlyimbalanced in the Fourier domain, thereby permitting much of the soil moisturevariability to be described by a limited number of Fourier modes. For the 8-year datacollected here, 99.6% of the soil moisture variance could be described by less than0.4% of its Fourier modes. A practical outcome of this energy imbalance in thefrequency domain is that the diurnal cycle in ET can be ignored if b1
�1 (estimated at7.6 days from the model) is much larger than 12 hours. The model, however,underestimates the measured Es( f ) at very low frequencies ( f � b1) and its memory,estimated from the data at 42 days. This underestimation is due to seasonality in ETmax
and to a partial decoupling between ET and soil moisture at low frequencies.
Citation: Katul, G. G., A. Porporato, E. Daly, A. C. Oishi, H.-S. Kim, P. C. Stoy, J.-Y. Juang, and M. B. Siqueira (2007), On the
spectrum of soil moisture from hourly to interannual scales, Water Resour. Res., 43, W05428, doi:10.1029/2006WR005356.
1. Introduction
[2] Over the past two decades, the temporal spectrum ofsoil moisture (q) has received significant attention in theclimate, hydrologic, and land surface communities becauseof its impact on a number of processes including terrestrialrainfall [Delworth and Manabe, 1988, 1993; Parlange etal., 1992; Entekhabi et al., 1996; Findell and Eltahir, 1997;Koster and Suarez, 2001; Wilson et al., 2001; Wu et al.,2002, Chen and Kumar, 2002; Lauzon et al., 2004; Kosteret al., 2004; Wu and Dickinson, 2004; Amenu et al.,2005], biogeochemical cycling, and ecosystem resilience[D’Odorico et al., 2003; Porporato et al., 2004]. Because ofstorage effects within the soil pores, the dynamics of qposses a memory that is often considerably longer than theintegral timescale of many atmospheric processes. Henceclimate anomalies can be ‘‘sustained’’ through land surfacefeedbacks primarily because they can ‘‘feed off’’ on thislong-term memory.
[3] The dynamics of q at a given location depends on thehydrologic balance and on the interplay between variabilityin incident precipitation (pi), interception, total evapotrans-poration (ET), drainage below the root zone, and lateralflow. More indirectly, soil hydraulic properties, hydrauliclift from below the main rooting system, surface heating,and other boundary conditions, such as groundwater tablefluctuations or feedback from soil organic matter dynamics(e.g., litter fall, microbial biomass, decomposition), can alsoshape the spectrum of q. Studying the joint effects of allthese processes on the spectrum of q remains beyond thescope of a single study. However, a logical starting point isto restrict the q spectral analysis to two elementary variablesshared by all climatic and hydrologic applications: a pre-cipitation forcing (e.g., pi) and a water loss (e.g., ET). Evenwithin this restrictive scope, analytical theories to predictthe spectrum of q at timescales ranging from hour tointerannual have not been fully addressed (mainly due tothe lack of data) and frame the objective of this study.[4] This objective is addressed via a case study using
long-term spatially averaged q collected in a uniformshallow-rooted loblolly pine (Pinus taeda L.) plantation(PP) in the southeastern United States. This ecosystemlends itself to a number of simplifying hydrologic assump-tions that permit us to explore analytically how variability inpi and ET shapes the spectrum of q. A unique data set ofhalf-hourly pi, ET, and q measured within the rooting zone
1Nicholas School of the Environment and Earth Sciences, DukeUniversity, Durham, North Carolina, USA.
2Department of Civil and Environmental Engineering, Pratt School ofEngineering, Duke University, Durham, North Carolina, USA.
3Departamento de Engenharia Mecanica, Universidade de Brasılia,Brasilia, Brazil.
Copyright 2007 by the American Geophysical Union.0043-1397/07/2006WR005356$09.00
W05428
WATER RESOURCES RESEARCH, VOL. 43, W05428, doi:10.1029/2006WR005356, 2007ClickHere
for
FullArticle
1 of 10
depth (RL) has been collected since 1998. This record permitsboth theoretical and experimental analysis of the interplaybetween ET and pi and their concomitant impacts on thespectrum of q at timescales ranging from hours to years.
2. Experiment
[5] PP is a 24-year old loblolly pine plantation situated inthe Blackwood Division of the Duke Forest near Durham,NC (35� 580 41.43000N, 79� 050 39.08700W, 163 m asl).Long-term mean annual temperature and precipitation at thesite are 15.5�C and 1100 mm, respectively. The forest standlies on Enon silt loam, a low-fertility Hapludalf typical ofthe southeastern U.S. Piedmont region. An impervious claypan underlies the research site at �30 cm belowground[Oren et al., 1998]. PP was established in 1983 following aclear cut and a burn. P. taeda seedlings were planted at 2.4 mby 2.4 m spacing and ecosystem development has notbeen managed after planting. The mean canopy heightincreased from 14 m in 1998 to 19 m in 2005. The canopyis composed primarily of P. taeda with some emergentLiquidambar styraciflua L. and a diverse and growingunderstory with 26 different woody species having diameterat breast height exceeding 2.5 cm.[6] ET was measured at 20.2 m using an eddy covariance
(EC) system composed of a triaxial sonic anemometer(CSAT3, Campbell Scientific, Logan, Utah) and an openpath infrared gas analyzer (IRGA, LI-7500, Li-Cor, Lincoln,NE). The 10 Hz measurements of vertical velocity and H2Oconcentration were collected and vertical turbulent fluxeswere then computed every 30 min. The Webb-Pearman-Leuning (WPL) correction [Webb et al., 1980] for theeffects of air density fluctuations on flux measurementswas applied to scalar fluxes measured with the open pathLI-7500. A closed path gas analyzer (LI-6262, Li-Cor,Lincoln, NE) was employed at PP before 1 May 2001,
and 5 Hz measurements were postprocessed as describedelsewhere [Katul et al., 1997]. Ancillary meteorological andradiation measurements were also collected and describedelsewhere [Stoy et al., 2005]. Topographic variationsaround the tower are minor (<5%) and negligibly influencethe eddy covariance ET flux measurements [Kaimal andFinnigan, 1994].[7] Daily pi was measured with a rain gauge near the
NOAA meteorological station located at a grass clearingadjacent to the PP site. Half-hourly pi was measured using atipping bucket (TI, Texas Instruments, Austin, TX) andmatched to daily rain gauge data. In the instance of powerfailures, missing half hourly pi was gap-filled using dailyprecipitation from the NOAA station and hourly data fromthe Chapel Hill airport station.[8] Integrated 0–30 cm q measurements were made at
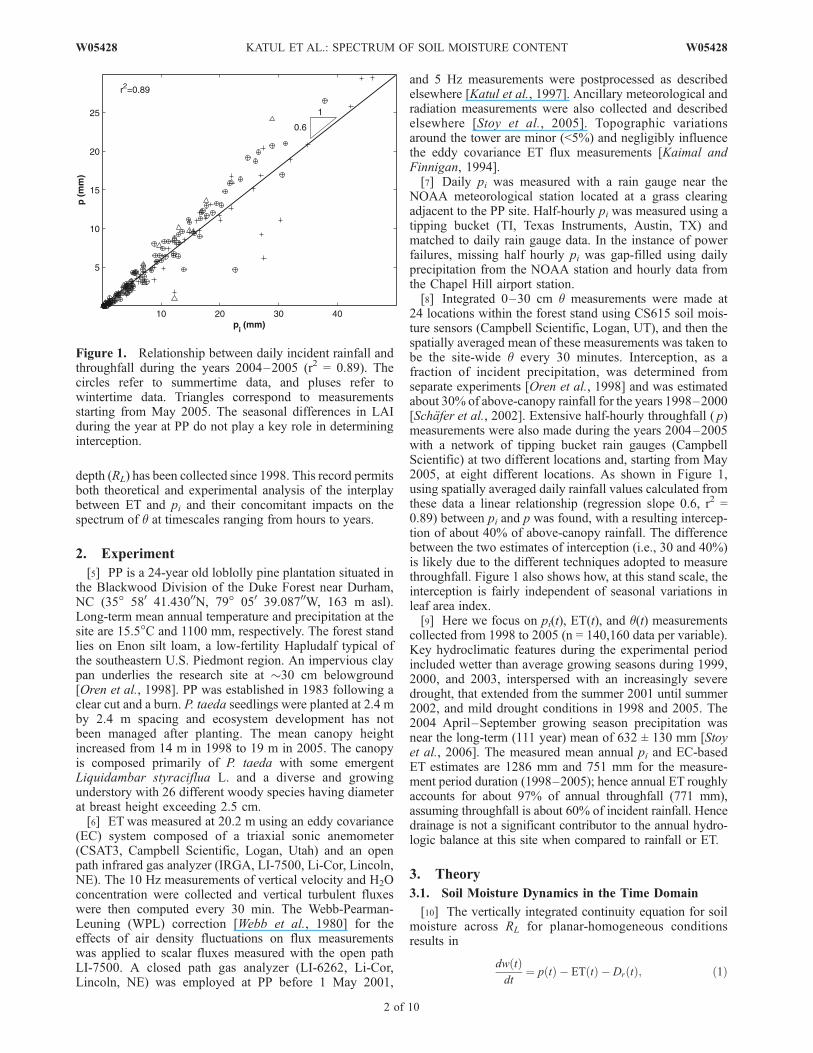
24 locations within the forest stand using CS615 soil mois-ture sensors (Campbell Scientific, Logan, UT), and then thespatially averaged mean of these measurements was taken tobe the site-wide q every 30 minutes. Interception, as afraction of incident precipitation, was determined fromseparate experiments [Oren et al., 1998] and was estimatedabout 30% of above-canopy rainfall for the years 1998–2000[Schafer et al., 2002]. Extensive half-hourly throughfall ( p)measurements were also made during the years 2004–2005with a network of tipping bucket rain gauges (CampbellScientific) at two different locations and, starting from May2005, at eight different locations. As shown in Figure 1,using spatially averaged daily rainfall values calculated fromthese data a linear relationship (regression slope 0.6, r2 =0.89) between pi and p was found, with a resulting intercep-tion of about 40% of above-canopy rainfall. The differencebetween the two estimates of interception (i.e., 30 and 40%)is likely due to the different techniques adopted to measurethroughfall. Figure 1 also shows how, at this stand scale, theinterception is fairly independent of seasonal variations inleaf area index.[9] Here we focus on pi(t), ET(t), and q(t) measurements
collected from 1998 to 2005 (n = 140,160 data per variable).Key hydroclimatic features during the experimental periodincluded wetter than average growing seasons during 1999,2000, and 2003, interspersed with an increasingly severedrought, that extended from the summer 2001 until summer2002, and mild drought conditions in 1998 and 2005. The2004 April–September growing season precipitation wasnear the long-term (111 year) mean of 632 ± 130 mm [Stoyet al., 2006]. The measured mean annual pi and EC-basedET estimates are 1286 mm and 751 mm for the measure-ment period duration (1998–2005); hence annual ET roughlyaccounts for about 97% of annual throughfall (771 mm),assuming throughfall is about 60% of incident rainfall. Hencedrainage is not a significant contributor to the annual hydro-logic balance at this site when compared to rainfall or ET.
3. Theory
3.1. Soil Moisture Dynamics in the Time Domain
[10] The vertically integrated continuity equation for soilmoisture across RL for planar-homogeneous conditionsresults in
dw tð Þdt
¼ p tð Þ � ET tð Þ � Dr tð Þ; ð1Þ
Figure 1. Relationship between daily incident rainfall andthroughfall during the years 2004–2005 (r2 = 0.89). Thecircles refer to summertime data, and pluses refer towintertime data. Triangles correspond to measurementsstarting from May 2005. The seasonal differences in LAIduring the year at PP do not play a key role in determininginterception.
2 of 10
W05428 KATUL ET AL.: SPECTRUM OF SOIL MOISTURE CONTENT W05428
where t (in h) is time, w(t) is stored water (in mm), p(t) is, asbefore, throughfall precipitation (in mm h�1), ET isevapotranspiration (in mm h�1), and Dr is the drainageloss (in mm h�1) below RL. Defining a total loss functionL(t) = ET(t) + Dr(t), equation (1) can be written as
ds tð Þdt
þ L tð ÞhRL
¼ p tð ÞhRL
; ð2Þ
where s(t) = q/h =w/(hRL) is the degree of saturation (2[0, 1])and h is soil porosity. If L(t) is assumed to vary only with s(t)[e.g.,Porporato et al., 2004], equation (2) can be expressed as
ds tð Þdt
þ b1 sð Þ s ¼ p tð ÞhRL
; ð3Þ
with b1(s) =Lmax
hRL
f (s) (in h�1), where Lmax is the
maximum loss rate and f (s) can be interpreted as adimensionless ‘‘shape function’’ that retains all the higher-order nonlinearities in L(t).
3.2. Soil Moisture Dynamics in the Frequency Domain
[11] Analyzing the soil moisture dynamics in the fre-quency domain has a number of underexploited advantagesover its time domain counterpart. Such advantages aremostly related to the fact that the soil moisture time seriesappears more ‘‘energetically imbalanced’’ in the frequencydomain than in the time domain. In other words, this meansthat the variability (also referred to as activity or energy) insoil moisture content is ‘‘concentrated’’ in few energetic
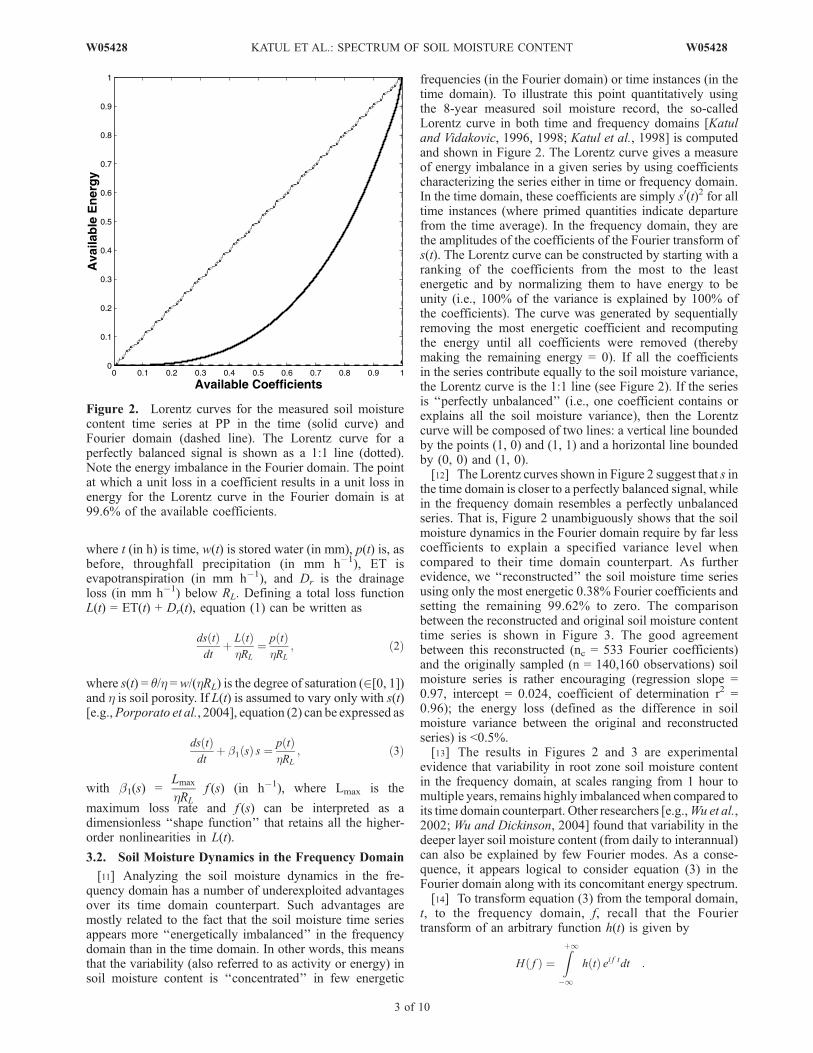
frequencies (in the Fourier domain) or time instances (in thetime domain). To illustrate this point quantitatively usingthe 8-year measured soil moisture record, the so-calledLorentz curve in both time and frequency domains [Katuland Vidakovic, 1996, 1998; Katul et al., 1998] is computedand shown in Figure 2. The Lorentz curve gives a measureof energy imbalance in a given series by using coefficientscharacterizing the series either in time or frequency domain.In the time domain, these coefficients are simply s0(t)2 for alltime instances (where primed quantities indicate departurefrom the time average). In the frequency domain, they arethe amplitudes of the coefficients of the Fourier transform ofs(t). The Lorentz curve can be constructed by starting with aranking of the coefficients from the most to the leastenergetic and by normalizing them to have energy to beunity (i.e., 100% of the variance is explained by 100% ofthe coefficients). The curve was generated by sequentiallyremoving the most energetic coefficient and recomputingthe energy until all coefficients were removed (therebymaking the remaining energy = 0). If all the coefficientsin the series contribute equally to the soil moisture variance,the Lorentz curve is the 1:1 line (see Figure 2). If the seriesis ‘‘perfectly unbalanced’’ (i.e., one coefficient contains orexplains all the soil moisture variance), then the Lorentzcurve will be composed of two lines: a vertical line boundedby the points (1, 0) and (1, 1) and a horizontal line boundedby (0, 0) and (1, 0).[12] The Lorentz curves shown in Figure 2 suggest that s in
the time domain is closer to a perfectly balanced signal, whilein the frequency domain resembles a perfectly unbalancedseries. That is, Figure 2 unambiguously shows that the soilmoisture dynamics in the Fourier domain require by far lesscoefficients to explain a specified variance level whencompared to their time domain counterpart. As furtherevidence, we ‘‘reconstructed’’ the soil moisture time seriesusing only the most energetic 0.38% Fourier coefficients andsetting the remaining 99.62% to zero. The comparisonbetween the reconstructed and original soil moisture contenttime series is shown in Figure 3. The good agreementbetween this reconstructed (nc = 533 Fourier coefficients)and the originally sampled (n = 140,160 observations) soilmoisture series is rather encouraging (regression slope =0.97, intercept = 0.024, coefficient of determination r2 =0.96); the energy loss (defined as the difference in soilmoisture variance between the original and reconstructedseries) is <0.5%.[13] The results in Figures 2 and 3 are experimental
evidence that variability in root zone soil moisture contentin the frequency domain, at scales ranging from 1 hour tomultiple years, remains highly imbalanced when compared toits time domain counterpart. Other researchers [e.g.,Wu et al.,2002; Wu and Dickinson, 2004] found that variability in thedeeper layer soil moisture content (from daily to interannual)can also be explained by few Fourier modes. As a conse-quence, it appears logical to consider equation (3) in theFourier domain along with its concomitant energy spectrum.[14] To transform equation (3) from the temporal domain,
t, to the frequency domain, f, recall that the Fouriertransform of an arbitrary function h(t) is given by
H fð Þ ¼Zþ1
�1
h tð Þ ei f tdt :
Figure 2. Lorentz curves for the measured soil moisturecontent time series at PP in the time (solid curve) andFourier domain (dashed line). The Lorentz curve for aperfectly balanced signal is shown as a 1:1 line (dotted).Note the energy imbalance in the Fourier domain. The pointat which a unit loss in a coefficient results in a unit loss inenergy for the Lorentz curve in the Fourier domain is at99.6% of the available coefficients.
W05428 KATUL ET AL.: SPECTRUM OF SOIL MOISTURE CONTENT
3 of 10
W05428

By multiplying equation (3) to ei f t and integrating withrespect to time (see Priestley [1981] for applicability of suchdefinitions to stationary series), we obtain
�i f S fð Þ þZþ1
�1
b1 sð Þ s ei f tdt ¼ P fð Þ; ð4Þ
where S( f ) and P( f ) are the Fourier transforms of s(t) andp(t)/(hRL), respectively.[15] Since, as shown in Figure 3, the occurrence of s � 1
is not frequent, surface runoff is neglected. Accordingly,drainage Dr is small when compared to ET, which isassumed to decline linearly from a maximum potential rateETmax with decreasing s, so that Lmax = ETmax, f (s) = 1, and
b1 =ETmax
hRL
. With such assumptions, which we refer to as
the ‘‘linear dynamics’’ case in the following, equation (4)reduces to
�i f S fð Þ þ b1 S fð Þ ¼ P fð Þ; ð5Þ
resulting in
S fð Þ ¼ b1 þ i fð Þb 21 þ f 2
P fð Þ: ð6aÞ
1 [16] To explore how phase shifts and spectra of soil moisture
relate to rainfall, define r1 ( f ) =
ffiffiffiffiffiffiffiffiffiffiffiffiffiffiffib21 þ f 2
qandw1( f ) = tan
�1( f/
b1), and represent the quantity b1 + i f = r1( f )eiw1( f ). Also,
when expressing the throughfall spectrum in polar coordi-nates (i.e., P( f ) = r2( f )e
iw2( f )), equation (6a) becomes
S fð Þ ¼ r1 fð Þ r2 fð Þb 21 þ f 2
ei w1 fð Þþw2 fð Þð Þ: ð6bÞ
[17] The term ei(w1( f )+w2( f )) in equation (6b) has impor-tant implications in how rainfall variability propagates intothe soil moisture system. This term suggests that rainfall andsoil moisture variability experience a phase shift given byw1( f ) = tan�1( f/b1) = tan�1( f RLh/ETmax). By increasingthe rooting zone depth RL (assuming constant soil porosityand maximum evapotranspiration), the rainfall and soilmoisture variability become increasingly out of phase.Furthermore, for long timescales (e.g., decadal), f ! 0and the soil moisture and rainfall variability become ap-proximately in phase with each other. Both findings arequalitatively consistent with the linear phase shift analysiswith depth reported by Amenu et al. [2005] using the IllinoisClimate Network stations.[18] From equation (6b), the spectrum of s, Es( f ) = jS( f )j2,
can be predicted from the spectrum of p, Ep( f ) = jP( f )j2 =(r2( f ))
2, using
Es fð Þ ¼ r1 fð Þð Þ2 r2 fð Þð Þ2
b 21 þ f 2
� �2 ¼ 1
b 21 þ f 2
jP fð Þj2; ð7Þ
Figure 3. (top) Measured (solid line) degree of saturation (n = 140,146) time series s(t) and thereconstructed series (dashed line) obtained from 0.38% of the Fourier coefficients (n = 533), showing thatthe two series are almost indistinguishable. (bottom) The 1:1 comparison between the two series ispresented for clarity.
4 of 10
W05428 KATUL ET AL.: SPECTRUM OF SOIL MOISTURE CONTENT W05428
where
Z1
0
Es fð Þ df ¼ 1
2s0
2 ; s0 ¼ s� s, and the overbar is
time averaging.[19] Note that if the throughfall time series follows a
white noise spectrum, then equation (7) clearly shows howfinite storage within the root zone acts as an integrator ofshort-timescale precipitation anomalies (i.e., large f ) trans-ferring their white noise attributes into red noise soilmoisture (i.e., Es( f ) � f �2). However, more revealing iswhen Ep( f ) = jP( f )j2 � f �a, as is often the case for stormdurations on the order of hours or less. In such a case, Es( f )behaves as f �2�a, decaying much more rapidly than theprecipitation spectrum. The f �2�a decay at high frequencymight be one plausible reason why the energy in the soilmoisture is highly unbalanced in the Fourier domain.[20] In the following, we compare the measured Es( f )
(shown in Figure 4) with predictions from equation (7) inthe linear dynamics case forced by two different forms ofrainfall spectrum. In particular, we compare results fromthe theoretical case of white noise precipitation, in whichEp( f ) = jP( f )j2 = fp
2, where fp is a constant independentof f (a = 0), to the results obtained using the spectrum ofprecipitation estimated from the data. In the first case,hereafter we refer to as model 1, the spectrum of soilmoisture is a constant independent of f when f � b1 and
decays as f �2 when f � b1. In the second case (hereafterreferred to as model 2), Ep( f ) = jP( f )j2 is estimated using adiscrete Fourier transform of the rain gauge time seriescollected above the canopy multiplied by 0.6 to account forinterception losses.[21] By comparing these two models with measured Es( f ),
we can assess how variability in precipitation and non-linearities in the loss function (i.e., f (s) 6¼ 1) or other low-frequency modulations contribute to the spectrum of soilmoisture. In particular, comparing Es( f ) predicted frommodels 1 and 2 permits us to quantify how the spectrumof p(t) impacts Es( f ) when the loss function maintains itslinearity, and comparing model 2 with the measured soilmoisture spectrum permits us to assess how nonlinearities inthe loss function and other low-frequency sources of vari-ability (e.g., related to pulsed drainage or to seasonality inET) impact Es( f ).
4. Results and Discussion
[22] Throughout, we refer to the ‘‘measured’’ spectrum ofany arbitrary discrete variable X as that spectrum calculatedfrom the raw time series using the Welch’s averagedmodified periodogram method. In this method, X is dividedinto overlapping sections, then windowed (Hanning win-
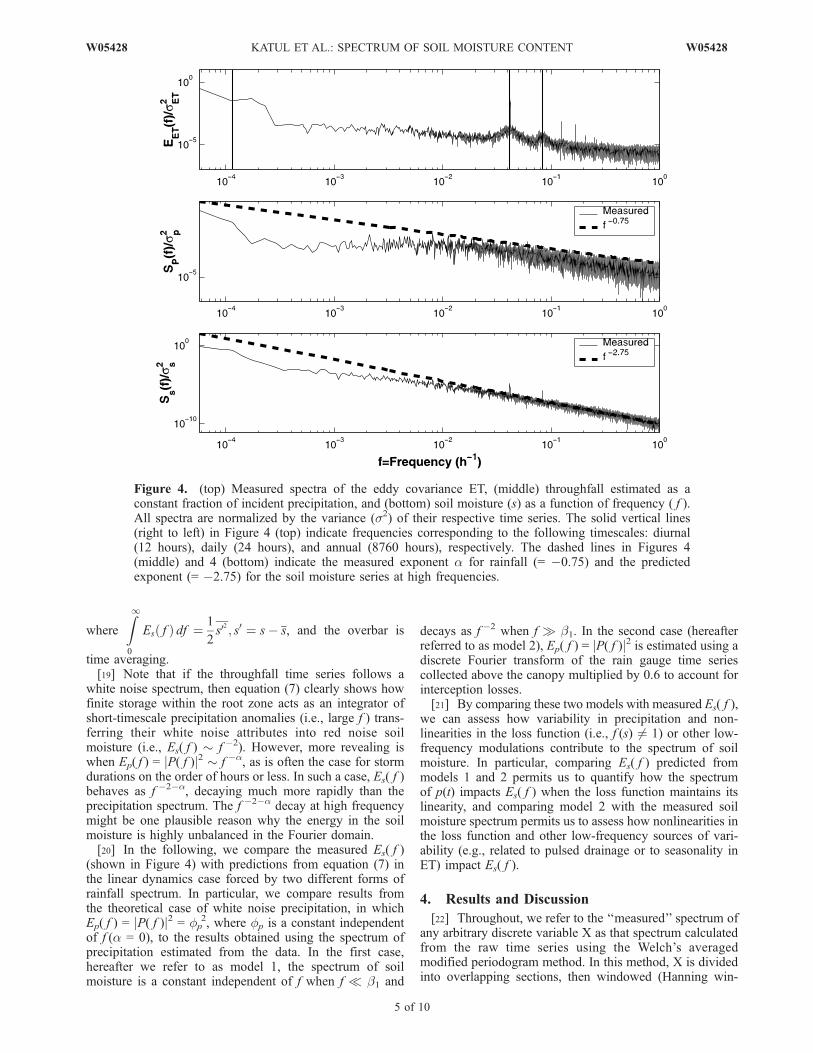
Figure 4. (top) Measured spectra of the eddy covariance ET, (middle) throughfall estimated as aconstant fraction of incident precipitation, and (bottom) soil moisture (s) as a function of frequency ( f ).All spectra are normalized by the variance (s2) of their respective time series. The solid vertical lines(right to left) in Figure 4 (top) indicate frequencies corresponding to the following timescales: diurnal(12 hours), daily (24 hours), and annual (8760 hours), respectively. The dashed lines in Figures 4(middle) and 4 (bottom) indicate the measured exponent a for rainfall (= �0.75) and the predictedexponent (= �2.75) for the soil moisture series at high frequencies.
W05428 KATUL ET AL.: SPECTRUM OF SOIL MOISTURE CONTENT
5 of 10
W05428

dows are used), and then zero-padded (when necessary) topermit FFT calculations.
4.1. Spectra of the Hydrologic Variables
[23] Figure 4 shows the normalized spectra of all the keyvariables for the simplified hydrologic budget, identifyingthe key timescales and showing the spectral predictionsfor the exponents at high frequencies. From Figure 4,Ep( f ) appears almost ‘‘white’’ at monthly to seasonaltimescales, but appears colored at higher frequencies withan exponent approximately equal to �0.75. The measuredEs( f ) � f �2� 0.75 seems to confirm power law predic-tions of model 2 at higher frequencies. The spectrum ofET exhibits the expected peaks at diurnal (�12 hours)and daily (�24 hours) frequencies, but significant sea-sonal and interannual variations are also evident.
4.2. Comparisons Between Measured and Modeled SoilMoisture Spectra
[24] Figure 5 compares the spectrum of measuredEs( f ) with predictions by the two models, assuming
b1 =1
hRL
ETmax, with ETmax = 0.9 mm h�1 directly taken
from the EC data (1998–2005), h = 0.55 and RL = 300 mmtaken from Oren et al. [1998]. For model 1, we assumed thatEp( f ) = jP( f )j2 = f2, where the constant is determined fromthe measured precipitation variance distributed uniformlyat all frequencies (i.e., white noise precipitation spectrum).For model 2, the 30-min measured Ep( f ) = jP( f )j2 was usedin equation (7). From the comparisons in Figure 5, we notethe following:
[25] 1. Model 1 explains several ‘‘geometric’’ attributesof the measured soil moisture spectrum: a near constantvalue at low frequencies and a rapid decay at highfrequencies. However, it is clear that the decay in themeasured Es( f ) is steeper than f
�2 and that model 1 severelyunderestimates the energy content at frequencies smaller thanseasonal (i.e., f < 0.00035 h�1).[26] 2. Model 2 explains all the key geometric attributes
of the measured soil moisture spectrum from hours toseasonal reasonably well (see Figure 6 for a 1:1 comparisonand statistical analysis; note that the regression slope = 0.93,r2 = 0.74 in a log scale), though it also underestimates thesoil moisture variability at frequencies smaller than season-al. As discussed in Figure 4, the ‘‘steepening’’ of themeasured Es( f ) beyond f
�2 (i.e., f �2.75) is well reproducedand is primarily due to the fact that Ep( f ) exhibits approxi-mate power law decay of about f �0.75 at high frequencies.[27] For model 1, the correlation time can be estimated
analytically as 1/b1, corresponding to a frequency of f =0.0055 h�1 (or 7.6 days). This prediction overestimates thefrequency (or underestimates the memory) determined fromthe soil moisture integral timescale, which corresponds tof � 0.001 h�1 (or about 42 days) shown in Figure 7. Themeasured memory or integral timescale was estimated fromthe area under the measured autocorrelation function of thesoil moisture content time series (see Appendix A forderivation). Recall that for model 1, the soil moisturememory is related to the spectral peak in Figure 7when plotting f Es( f ) versus f (see Appendix A for relation-ships between b1, integral timescale, and the frequency atwhich f Es( f ) peaks). Notwithstanding this underestimation
Figure 5. Comparison between measured (pluses) and modeled (lines) soil moisture spectra Es( f ).Model 1 is the linear dynamics model forced with white noise precipitation. Model 2 is the lineardynamics model forced with the measured p spectrum shown in Figure 4. The vertical dotted lines arefrequencies corresponding to the following timescales (right to left): b1
�1 (= 7.6 days) and the measuredintegral timescale (= 42 days). The dashed vertical lines (right to left) indicate frequencies correspondingto the following timescales: diurnal (= 12 hours), daily (= 24 hours), and annual (= 8760 hours),respectively.
6 of 10
W05428 KATUL ET AL.: SPECTRUM OF SOIL MOISTURE CONTENT W05428

of the memory timescale, we find that because 1/b1(�180 hours) occurs at frequencies much smaller thandiurnal (�12 hours), variability or energy in diurnal ET(evident in Figure 4) does not significantly impact Es( f ).Hence, according to the analysis in Figure 7, it is safe to saythat for modeling the spectrum of soil moisture, diurnal
dynamics in ET may be ignored if b1�1 � 12 hours, as is the
case here. To further support this argument, we note that, ina separate study, it was shown that at the daily timescale theimpact of rainfall variability on soil moisture dynamics ismuch stronger than fluctuations in evapotranspiration [Dalyand Porporato, 2006].
Figure 6. Comparison between measured and model 2 predictions of the soil moisture spectrum Es( f ).The regression slope, intercept, and coefficient of determination r2 are 0.93, �1.38, and 0.74,respectively. The 1:1 line is also shown for reference. Note the underestimation of the energeticcomponents corresponding to the low frequencies.
Figure 7. Comparison between measured and modeled f Es( f ). Model 1 is the thick solid line, model 2is in solid dots, and the measurements are pluses. The vertical lines are frequencies corresponding to thefollowing timescales (right to left): b1
�1 (= 7.6 days) determined from the peak of f Es( f ) shown here andthe measured integral timescale (= 42 days).
W05428 KATUL ET AL.: SPECTRUM OF SOIL MOISTURE CONTENT
7 of 10
W05428

[28] Both Figures 6 and 7 suggest that model 2 is missingsome low-frequency energy not explained by precipitation,likely to be introduced by low-frequency variability in ET[Stoy et al., 2006]. It is clear from Figure 4 that while thespectrum of precipitation appears almost white at frequen-cies lower than seasonal, the spectrum of soil moistureshares some attributes with the spectrum of ET for seasonaland longer timescales. A logical starting point to explorethis hypothesis analytically is to assume that ET is notrestricted by soil moisture content (which is unrealistic forall ranges of soil moisture) and is approximated by itsequilibrium evaporation value (ETequ), given by
ETequ tð Þ � cD
Dþ gRn tð Þ ð8Þ
whereD and g are the slope of the saturation vapor pressure�temperature curve and the psychometric constant, respectively,Rn is the net radiation measured above the canopy and c isnecessary to convert W m�2 to mm h�1 (300 W m�2 areapproximately 0.4 mm h�1). As before, the Fourier coeffi-cients of the soil moisture content at frequency f can be relatedto the Fourier coefficients of the precipitation and equilibriumevaporation via
S fð Þ ¼ �P fð Þ � ETequ fð Þi f
: ð9Þ
[29] The resulting soil moisture spectrum is given by
Es fð Þ ¼ 1
f 2
����P fð Þ � ETequ fð Þ����2
ð10Þ
Figure 8. (top) Variations of normalized equilibrium evapotranspiration (ETn) with time (normalizedby its maximum value). (bottom) Comparison between measured (symbols) and modeled (lines) f Es( f ).Model 2 is the solid thick line, and model 3 is the dashed line. Note the large energy content at lowfrequencies for model 3.
8 of 10
W05428 KATUL ET AL.: SPECTRUM OF SOIL MOISTURE CONTENT W05428

and is hereafter referred to as model 3. Notice that models 2(linear dynamics) and 3 bound all plausible relationshipsbetween ET and s. As expected, the spectrum of model 3 isenergetically unbounded (variance increases indefinitely) asthe sampling time increases indefinitely ( f ! 0), which isunrealistic and physically not plausible. Within the 8-yearsampling period studied here, we expect that this spectrumoverestimate the measured spectrum at low f. In fact,although for this spectrum the memory in soil moisture is notdefined, yet the seasonal all the way up to interannual cyclesin ETequ retain their fingerprints in the soil moisture (seeFigure 8). What Figure 8 demonstrates then is that themeasured soil moisture content spectrum is bounded betweenmodels 2 and 3 and that the missing ‘‘energy’’ at lowfrequencies (say f � b1) in model 2 appears to be attributedto a partial ‘‘decoupling’’ between ET and s at seasonaltimescales with ET now being driven primarily by availableenergy (or equilibrium evaporation conditions). Note that ifwe linearly combine the spectra (i.e., additive variance) inequations (7) and (10), we obtain
Es fð Þ ¼ a1jP fð Þj2
b21 þ f 2
þ 1� a1ð Þ jP fð Þ � ETequ fð Þj2
f 2ð11Þ
where a1 2 [0, 1] now measures the degree of nonlinearity inthe ET � s relationship of Figure 9. Even if a1 is close tounity (but not exactly unity), as f ! 0, the spectrum inequation (11) will be dominated by the second term, and
Es fð Þ ! 1� a1ð Þ jP fð Þ � ETequj2
f 2:
further confirming this hypothesis for energy-limited ecosys-tems.
5. Summary and Conclusions
[30] We proposed a simplified analytical model for thespectrum of soil moisture content at scales ranging fromhour to interannual timescales for a site whose hydrologicbalance is primarily governed by stored water, rainfall, and
ET. We showed that for this simplified hydrologic balance,when ET is linearly related to soil moisture contentand when the precipitation spectrum is approximately whitenoise, the resulting spectrum becomes red (decaying at f �2 )at high frequencies and white at low frequencies.The soil moisture memory can be predicted analytically
as1
b1
¼ hRL
ETmax
. We also showed that the origin of the
measured spectral decay in the soil moisture spectrumthat is ‘‘steeper’’ than f �2 (about f �2.75) could beexplained by the decay in the measured precipitationspectrum (roughly as f �0.75) for higher frequencies (i.e.,f � b1). This rapid spectral decay at high frequenciesmakes the soil moisture variance highly imbalanced in thefrequency domain. To quantitatively illustrate this pointusing only the soil moisture time series measurement, weshowed that 99.4% of the soil moisture variance could bedescribed by using less than 0.4% Fourier modes. A practicaloutcome of this energy imbalance in the frequency domain isthat the diurnal cycle in ET can be ignored if b1
�1� 12 hours(at least for the analysis of q variability). Both models,however, underestimated the measured soil moisture contentenergy spectrum at low frequencies (f� b1). We argued thatthis underestimation could be traced back to a decouplingbetween ET and soil moisture at the seasonal timescale,presumably because of the strong coupling between ET andavailable energy. Considering only the primary externaldrivers of ET, Rn and vapor pressure deficit (D), 69% ofthe half hour variability in ET is explainable by Rn and 43%by D despite the low values of the decoupling coefficient (W,[Jarvis and McNaughton, 1986]) for this stand [Stoy et al.,2006]. This result (that ET is primarily energy limited) alsoagrees with combined results from other pine plantations inthe southeastern United States [Gholz and Clark, 2002] thatshowed strong relationships between annual and seasonalET and Rn and suggest that improved understanding of qdynamics in the frequency domain in ‘‘energy-limited’’ecosystems may be obtained by focusing on this long-termforcing.
Appendix A: Inferring b1 From the Spectrumof a Finite Time Series
[31] The memory of a zero-mean and unit variancestochastic process is often determined from the correlationtime (or 1/e point, here b1
�1) or the integral timescale (G).These quantities can be determined from the spectral densityfunction E( f ) by noting that G, the autocorrelation functionr(t), and E( f ) are all related by
G ¼Z1
0
r tð Þdt;
r tð Þ ¼Zþ1
�1
eit f E fð Þ df ; and
E fð Þ ¼ 1
2p
Zþ1
�1
e�if tr tð Þdt:
Figure 9. Variations of ET/ETmax with s assuming linear(models 1 and 2) and constant or uniform dependence(model 3). Note that the combined linear and uniformmodels encompass all plausible nonlinear relationshipsbetween ET/ETmax with s.
W05428 KATUL ET AL.: SPECTRUM OF SOIL MOISTURE CONTENT
9 of 10
W05428

Hence G can be directly inferred from E(f) when f = 0because
E 0ð Þ ¼ 1
2p
Zþ1
�1
e0 r tð Þ dt ¼ 1
p
Zþ1
0
r tð Þ dt ¼ Gp:
For a time series sampled over a finite time interval, E(0) isdifficult to determine without (heuristic) extrapolations.[32] In our case, the spectrum of the model (i.e., model 1)
follows the canonical form
E fð Þ ¼ s2
b 21 þ f 2
;
where s2 =b1
pto ensure a unit variance for all f 2 [0, 1].
With this estimate of s2,
G ¼ 1
b1
:
[33] Furthermore, b1 can be determined as the frequencyat which U( f ) = f E( f ) is maximized. This b1 estimate,derived from the maximum of U( f ), can be demonstratedby noting that
dU fð Þdf
¼ � 2s2f 2
b 21 þ f 2
� �2 þ s2
b 21 þ f 2
= 0 (i.e., maximum)
only when f = ±b1 (and we only accept positive frequencies).[34] In short, by plotting f (as abscissa) versus f E(f) (as
ordinate) and determining the frequency at which theordinate peaks provides a clear estimate of b1 (and G)without requiring an extrapolation for E(0).
[35] Acknowledgments. This research was supported by the Officeof Science (BER), U.S. Department of Energy, through its SoutheastRegional Center (SERC) of the National Institute for Global EnvironmentalChange (NIGEC) under cooperative agreement DE-FC03-90ER61010,through BER’s FACE FACTS-I project, grant DE-FG02-95ER62083,through the Terrestrial Carbon Processes Program (TCP), and by theNational Science Foundation (NSF-EAR-0208258).
ReferencesAmenu, G. G., P. Kumar, and X. Z. Liang (2005), Interannual variability ofdeep-layer hydrologic memory and mechanisms of its influence on sur-face energy fluxes, J. Clim., 18, 5024–5045.
Chen, J., and P. Kumar (2002), Role of terrestrial hydrologic memory inmodulating ENSO impacts in North America, J. Clim., 15, 3569–3585.
Daly, E., and A. Porporato (2006), Impact of hydroclimatic fluctuations onthe soil water balance, Water Resour. Res., 42, W06401, doi:10.1029/2005WR004606.
Delworth, T., and S. Manabe (1988), The influence of potential evaporationon the variabilities of simulated soil wetness and climate, J. Clim., 1,523–547.
Delworth, T., and S. Manabe (1993), Climate variability and land-surfaceprocesses, Adv. Water Resour., 16, 3–20.
D’Odorico, P., F. Laio, A. Porporato, and I. Rodriguez-Iturbe (2003), Hy-drologic controls on soil carbon and nitrogen cycles. II. A case study,Adv. Water Resour., 26, 59–70.
Entekhabi, D., I. Rodriguez-Iturbe, and F. Castelli (1996), Mutual interac-tion of soil moisture state and atmospheric processes, J. Hydrol., 184,3–17.
Findell, K. L., and E. A. B. Eltahir (1997), An analysis of the soil moisture-rainfall feedback based on direct observations from Illinois, Water Re-sour. Res., 33, 725–735.
Gholz, H. L., and K. L. Clark (2002), Energy exchange across a chronose-quence of slash pine forests in Florida, Agric. For. Meteorol., 112, 87–102.
Jarvis, P. G., and K. G. McNaughton (1986), Stomatal control of transpira-tion—Scaling up from leaf to region, Adv. Ecol. Res., 15, 1–49.
Kaimal, J. C., and J. Finnigan (1994), Atmospheric Boundary Layer Flows:Their Structure and Measurement, 289 pp., Oxford Univ. Press, NewYork.
Katul, G., and B. Vidakovic (1996), The partitioning of attached and de-tached eddy motion in the atmospheric surface layer using Lorentz wa-velet filtering, Boundary Layer Meteorol., 77, 153–172.
Katul, G., and B. Vidakovic (1998), Identification of low-dimensional en-ergy containing flux transporting eddy motion in the atmospheric surfacelayer using wavelet thresholding methods, J. Atmos. Sci., 55, 377–389.
Katul, G., R. Oren, D. Ellsworth, C. I. Hsieh, N. Phillips, and K. Lewin(1997), A Lagrangian dispersion model for predicting CO2 sources,sinks, and fluxes in a uniform loblolly pine (Pinus taeda L) stand,J. Geophys. Res.., 102, 9309–9321.
Katul, G. G., C. D. Geron, C. I. Hsieh, B. Vidakovic, and A. B. Guenther(1998), Active turbulence and scalar transport near the forest-atmosphereinterface, J. Appl. Meteorol., 37, 1533–1546.
Koster, R. D., and M. J. Suarez (2001), Soil moisture memory in climatemodels, J. Hydrometeorol., 2, 558–570.
Koster, R. D., et al. (2004), Regions of strong coupling between soilmoisture and precipitation, Science, 305, 1138–1140.
Lauzon, N., F. Anctil, and J. Petrinovic (2004), Characterization of soilmoisture conditions at temporal scales from a few days to annual,Hydrol. Processes, 18(17), 3235–3254.
Oren, R., B. E. Ewers, P. Todd, N. Phillips, and G. Katul (1998), Waterbalance delineates the soil layer in which moisture affects canopy con-ductance, Ecol. Appl., 8, 990–1002.
Parlange, M. B., G. G. Katul, R. H. Cuenca, M. L. Kavvas, D. R. Nielsen,and M. Mata (1992), Physical basis for a time series model of soil watercontent, Water Resour. Res., 28, 2437–2446.
Porporato, A., E. Daly, and I. Rodriguez-Iturbe (2004), Soil water balanceand ecosystem response to climate change, Am. Nat., 164, 625–632.
Priestley, M. B. (1981), Spectral Analysis and Time Series, 877 pp., Else-vier, New York.
Schafer, K. V. R., R. Oren, C. T. Lai, and G. G. Katul (2002), Hydrologicbalance in an intact temperate forest ecosystem under ambient and ele-vated atmospheric CO2 concentration, Global Change Biol., 8, 895–911.
Stoy, P., G. G. Katul, M. Siqueira, J. Y. Juang, H. R. McCarthy, H. S. Kim,C. Oishi, and R. Oren (2005), Variability in net ecosystem exchange fromhourly to inter-annual time scales at adjacent pine and hardwood forests:A wavelet analysis, Tree Physiol., 25, 887–902.
Stoy, P. C., G. G. Katul, M. B. S. Siqueira, J.-Y. Juang, H. R. McCarthy,A. C. Oishi, J. M. Uebelherr, H.-S. Kim, and R. Oren (2006), Separatingthe effects of climate and vegetation on evapotranspiration along a suc-cessional chronosequence in the southeastern U.S., Global Change Biol.,12, 1–21.
Webb, E. K., G. I. Pearman, and R. Leuning (1980), Correction of fluxmeasurements for density effects due to heat and water-vapor transfer,Q. J. R. Meteorol. Soc., 106, 85–100.
Wilson, K. B., P. J. Hanson, P. J. Mulholland, D. D. Baldocchi, and S. D.Wullschleger (2001), A comparison of methods for determining forestevapotranspiration and its components: Sap-flow, soil water budget, eddycovariance and catchment water balance, Agric. For. Meteorol., 106,153–168.
Wu, W. R., and R. E. Dickinson (2004), Time scales of layered soil moist-ure memory in the context of land-atmosphere interaction, J. Clim.,17(14), 2752–2764.
Wu, W. R., M. A. Geller, and R. E. Dickinson (2002), The response of soilmoisture to long-term variability of precipitation, J. Hydrometeorol.,3(5), 604–613.
����������������������������E. Daly, J.-Y. Juang, G. G. Katul, H.-S. Kim, A. C. Oishi, A. Porporato,
M. B. Siqueira, and P. C. Stoy, Nicholas School of the Environment andEarth Sciences, Box 90328, Duke University, Durham, NC 27708-0328,USA. ([email protected])
10 of 10
W05428 KATUL ET AL.: SPECTRUM OF SOIL MOISTURE CONTENT W05428