Experimental investigation on the thermal and moisture ...
27
Journal Pre-proofs Experimental investigation on the thermal and moisture mapping of cricket hel- mets using microsensor technology Z.W. Guan, A.R. Dullah, R. Yuan, Y. Chen, Q.Y. Wang PII: S0263-2241(19)30970-4 DOI: https://doi.org/10.1016/j.measurement.2019.107104 Reference: MEASUR 107104 To appear in: Measurement Received Date: 4 April 2019 Revised Date: 27 August 2019 Accepted Date: 24 September 2019 Please cite this article as: Z.W. Guan, A.R. Dullah, R. Yuan, Y. Chen, Q.Y. Wang, Experimental investigation on the thermal and moisture mapping of cricket helmets using microsensor technology, Measurement (2019), doi: https://doi.org/10.1016/j.measurement.2019.107104 This is a PDF file of an article that has undergone enhancements after acceptance, such as the addition of a cover page and metadata, and formatting for readability, but it is not yet the definitive version of record. This version will undergo additional copyediting, typesetting and review before it is published in its final form, but we are providing this version to give early visibility of the article. Please note that, during the production process, errors may be discovered which could affect the content, and all legal disclaimers that apply to the journal pertain. © 2019 Elsevier Ltd. All rights reserved.
-
Upload
khangminh22 -
Category
Documents
-
view
6 -
download
0
Transcript of Experimental investigation on the thermal and moisture ...

Journal Pre-proofs
Experimental investigation on the thermal and moisture mapping of cricket hel-mets using microsensor technology
Z.W. Guan, A.R. Dullah, R. Yuan, Y. Chen, Q.Y. Wang
PII: S0263-2241(19)30970-4DOI: https://doi.org/10.1016/j.measurement.2019.107104Reference: MEASUR 107104
To appear in: Measurement
Received Date: 4 April 2019Revised Date: 27 August 2019Accepted Date: 24 September 2019
Please cite this article as: Z.W. Guan, A.R. Dullah, R. Yuan, Y. Chen, Q.Y. Wang, Experimental investigation onthe thermal and moisture mapping of cricket helmets using microsensor technology, Measurement (2019), doi:https://doi.org/10.1016/j.measurement.2019.107104
This is a PDF file of an article that has undergone enhancements after acceptance, such as the addition of a coverpage and metadata, and formatting for readability, but it is not yet the definitive version of record. This version willundergo additional copyediting, typesetting and review before it is published in its final form, but we are providingthis version to give early visibility of the article. Please note that, during the production process, errors may bediscovered which could affect the content, and all legal disclaimers that apply to the journal pertain.
© 2019 Elsevier Ltd. All rights reserved.

Experimental investigation on the thermal and moisture mapping of
cricket helmets using microsensor technology
Z.W. Guan1,2*, A.R. Dullah2,3, R. Yuan1, Y. Chen1, Q.Y. Wang1*
1School of Mechanical Engineering, Chengdu University, Chengdu 610106, China
2School of Engineering, University of Liverpool, Liverpool L69 3GQ, UK
3Faculty of Mechanical Engineering, University of Technical Malaysia Melaka, Malaysia
Abstract: Based on microsensor technology, a novel test rig was developed for the first time to measure
real-time multi-point temperatures and relative humidities inside a cricket helmet worn by a human subject for
obtaining the corresponding thermal and moisture mapping. Two types of helmets with and without ventilation
openings were investigated to visualise the hot and wet spots clearly inside the helmet. The results show the
clear influence of ventilation openings on effective reduction of the temperature as well as the relative humidity
inside the helmet. Also, the subjective data were linked to the digital temperature and relative humidity
measurements for possible assisting design of helmet with improved thermal comfort. The technology
developed is a useful measurement approach to other head gears such as safety, fire fighter and motorcycle
helmets, and further to study microclimate environments in close contact with human body.
Keywords: microsensor; thermal and moisture mapping; cricket helmet; thermal comfort; perception
1. Introduction
In daily work and life, a living body generates heat through metabolic reactions. The amount of metabolic
heat generated may vary depending on the amount of the activity of the muscle which is exposed to ambient
conditions [1, 2]. In order to maintain the optimum temperature inside the human body, the excess heat needs to
be dissipated into the surrounding environment [3, 4]. The excess heat generated is dispersed into the
surrounding environment through external thermoregulation systems such as clothing [5, 6]. Therefore, to have
thermal comfort inside a cricket helmet, the excessive heat generated from the head has to be dissipated into the
surrounding environment through the helmet [7, 8]. However, the use of a helmet results in the blockage of heat
flow and moisture movement, which limits the heat and moisture transfer from the head to the surroundings.
The heat and moisture are trapped in small air pockets between the inner surface of the helmet and the head,
also known as the microclimate, which causes discomfort to the user of the helmet [9, 10]. Therefore, efficient
transfer of heat and moisture is required to maintain thermal comfort in the helmet.

Thermal comfort in helmets is especially crucial for a physically demanding activity such as batting in
cricket [11-13]. In addition to the use of a helmet being compulsory and frequent rehydration not being allowed
by the rule, the players may bat for up to 6 hours a day in hot weather which increases the physiological and
psychological toll for the players [14-16]. This ultimately leads to reducing player’s efficiency in the sport
where rapid decision making is required [17].
Generally, there are two ways to regulate the helmet cooling [18-21]. One is to integrate an active head
cooling system which consists of heat exchanger, pump, liquid cooling system and sensors [22, 23]. Whether
the system is effective in regulating temperature inside the helmet, it is governed by the size of the heat sink
installed. Although this type of cooling seems very effective, it is not practical for a cricket helmet because of its
cost, size and weight. The other way is through passive ventilation cooling, in which the heat and moisture are
allowed in a more effective transfer mode to the surroundings by having ventilation holes on various locations
of the helmet [24-28]. The effectiveness of the ventilation holes depends on the shape and size as well as the
location.
In dealing with the above challenges, a lot of work has been carried out. To evaluate local heat transfer
effects of a headgear, Martinez et al. [29] proposed a nine-zone thermal head manikin. This method gave more
clear details of the thermal interaction between the head manikin and a headgear for the design of helmets.
Potter et al. [30] used mathematical modeling techniques and sweating thermal manikin to quantify the trade-off
between the increased body armor protection, the accompanying mass and thermal effects on human
performance. Bogerd et al. [31] utilized a thermal manikin headform to test the effect of full-face motorcycle
helmets on convective heat loss under three different interventions (i.e. the wind speed, a head tilt angle and a
wig). All helmets were measured in three sessions in which all the vents were opened or closed consecutively in
a random order [32]. Flouris [33] studied on the fundamental distinction between thermal (dis)comfort and
sensation. He also evaluated the current knowledge on behavioural thermoregulation in order to summarize the
present state-of-the-art and give research directions in the future. Foda and Siren [34] proposed a
multi-segmental Pierce control mode using the LabVIEW platform, into the control system of a thermal manikin.
Hartley et al. [35] examined the direct real-time relationship between thermophysiological afferents and the
behavioural response of voluntary exercise intensity. The test results showed that the thermal environment could
affect physiological responses and voluntary power. Liu et al. [36] also undertook subjective evaluation on
helmets in cold laboratory and warm field conditions. It was found that thermal discomfort existed with helmet
wearing in both cold and hot environmental conditions.

However, up to date there is very limited research work on measuring both temperature and relative
humidity in multiple positions inside a helmet worn by a subject as well as establishing a relationship between
the thermal-moisture mapping and the human perception/sensation, except for the one related to garments and
vest [37, 38]. There is a need to provide real-time temperature and moisture distributions inside a helmet tested
on a human subject, instead of a thermal manikin headform, in order to provide more realistic data to assist
helmet design with necessary thermal comfort. This paper presents a study on developing a novel test rig for the
first time to measure multi-point temperatures and relative humidity (RHs) inside a helmet using microsensor
technology. Through a series of experiments in relatively comfortable and warm ambient conditions, thermal
and moisture mappings of typically ventilated and non-ventilated cricket helmets are obtained, together with a
comfort index being linked to the measurements. Based on the mappings, the hot and the wet spots are identified
inside the two types of helmets studied, which are further related to human perception/sensation. Such the
measurements provide the essential data to assist designing a helmet with necessary thermal comfort and to
validate numerical modelling. The technology developed also provides a novel measurement approach to other
head gear types, and further to microclimate environments in a close contact with human body.
2. Experimental approach
2.1 Experiment setup
In order to contrast the ventilation opening features, the experimental work was carried out using two
helmets with different ventilation settings, i.e. the elite helmet known as NVL (non-ventilated) one, the pro
performance helmet known as VL (ventilated) one with a total ventilation area of 4700 mm2. The difference in
ventilation between these two helmets is illustrated in Figures 1(a) and 1(b), respectively. Figure 1(c) shows the
microsensor cables led out from the VL helmet and a close view of the sensor embedded in the helmet. Both the
NVL and VL helmets are similar in colour (navy), but slightly different weights with wire fixing but without
safety guard, i.e. 615 g and 630 g respectively, and sizes as shown in Figure 2.
To study a completely non-ventilated helmet, the ventilation openings on the original NVL helmet were
fully sealed. Therefore, the experimental work would compare the two extreme conditions that are ventilated
and non-ventilated respectively. The Sensirion SHT75 microsensors (width: 5.08 mm, thickness: 3.1 mm, length:
13.5 mm) were used, which are the capacitive type sensor, with the accuracies being ± 0.3°C (at 25°C) and ± 1.8%
RH (in 20-80% RH) and a response time of 8 seconds. This microsensor was chosen due to its ability to
measure both temperature and relative humidity using the same probe. It was also chosen because of the sensor
being sufficiently small size to be embedded in a cricket helmet at various locations. The sensor locations and
its cross sectional diagram are shown in Figure 2. Prior to the measurements, all sensors were calribrated against
readings from temperature and relative humidity meter. Based on the total internal surface area of the helmets
investigated, 15 microsensors were distributed inside the helmet to ensure that all important areas, such as the
frontal, lateral, top and rear regions, were represented to reflect the in-helmet microclimate. Two additional
microsensors were attached to the treadmill to record the ambient temperature and RH.
All the sensor probes were placed at the locations (Figure 2) on both types of helmets. The locations 3, 4, 8
and 13 were placed on the ventilation openings of the VL helmet to study the heat and moisture transfer of those
locations. Here, a player’s activities were simulated by alternately standing and walking at a speed of 5 km/h (or
1.4 m/s) on a flat-bed setting treadmill to study how mild activities affect the microclimate. In order to embed
the sensors to the helmets, holes with a diameter of 6 mm were drilled on the helmet shell and the internal
fabrics were cut out at the locations where there are no ventilation openings, except for the locations in the VL
helmet mentioned the above. The silicone glue was used to seal the helmet after the sensor was inserted. All the
sensors were placed at least 5 mm away from the interior surface of the helmet to avoid possible direct contact
with the head surface so that the measurements would reflect the true microclimate conditions inside the air
pockets corresponding to various regions within a helmet. Therefore, the microsensor interference with the
microclimate was minimized.
Although ventilation openings may also lead to possible radiant heat gain, the heat loss from the air
exchange through ventilation openings is far more superior. In addition, the measurement system was calibrated
against readings from thermometer and humidity meter to ensure the measurements of temperature and relative
humidity being complied with the range specified prior to each series of experimental measurements.
2.2 Experimental methodology
In this work, the digital measurements were undertaken in two different ambient conditions, i.e. the
relatively comfortable ambient conditions (20C with 50% RH) and the warm conditions (35C with 30% RH).
During the experimental measurements, limiting the factors that influence the heat and moisture transfer in the
microclimate is vital. Therefore, the tests were carried out in a relatively controlled indoor environment. Firstly,
the tests under the former conditions were carried out in the Sports Centre Gymnasium of the University of
Liverpool. In order to limit the unexpected air flow, the treadmill was located far away from the entrance door

and the testing time was selected to avoid rush hour. The moving speed in the walking phase under both
conditions was set to a slow pace of 1.4 m/s, which is unlikely causing an air flow surrounding the human
subject faster than this speed. However, the tests under the latter conditions were carried out in an
environmental chamber (12 m (L) x 4m (W) x 5m (H)) at the Sport Science laboratory of Liverpool John
Moores University. Both the environmental conditions were monitored using the microsensors until the desired
temperature and relative humidity stabilized before initiate the test. Here, fifteen healthy male students with the
similar short hair style were recruited from School of Engineering at the University of Liverpool to participate
in experiments. Their head sizes (length, breadth and circumference) were measured beforehand to ensure that
the helmet would fit. Six of them were randomly chosen from the subject pool to carry out each set of tests, with
their average personal data being shown in Table 1. The subjects were asked to wear cotton trousers, t-shirt and
trainers during the test. Also, six subjects were fixed to fulfil the measurements for individual experimental
approach to maintain consistence. The subjects were released by the University of Liverpool Ethics committee
for the tests, a consent form being signed.
In experiments, the data were divided into two categories, i.e. objective data and subjective data. The
former were the digital data collected from the microsensors, which would be used to produce the in-helmet
thermal and moisture mapping. The digital temperature and RH readings from individual sensors were
processed in two formats, i.e. the chart plot by using the OriginPro8 (OriginLab Corporation, Northampton
MA USA) and the 2D contour plot by using the Surfer7 software (Golden Software Inc., Colorado USA).
It was necessary to observe how mild activities affect the in-helmet microclimate. Therefore, the subjects were
requested to alternately standing and walking for 10 minutes at the speed specified on a flatbed setting treadmill.
It took 60 minutes to complete with data recording at every 10 seconds in each set of test. The body temperature
was also measured using a tympanic thermometer every 10 minutes, i.e. at the beginning and the end of every
walking and standing phase. A preconditioning period of about 10 minutes was applied to the test rig and the
human subject to ensure that the temperature and the RH readings inside the helmet almost matched with the
readings from the ambient sensors before place the helmet on head.
The subjective data were collected by measuring psychological dimensions of human thermal comfort such
as thermal, moisture and comfort sensations, which were also recorded every 10 minutes, i.e. at the beginning
and end of every walking and standing phase. Simple bipolar scales were used when quantifying such
psychological parameters, as shown in Table 2.
In order to establish the relationship between objective data and subjective data, those data need to be
processed and analysed, as described below. First of all, the objective data were presented in two formats, which
are chart plots and 2D contour plots for two ambient conditions respectively, i.e. 20C with 50% RH and 35C
with 30% RH. The chart plots were firstly based on the averaged regional readings of temperature and relative
humidity from the simplified areas, i.e. the frontal: sensor 1, 2, 6, 11; the lateral: sensor 7, 8, 9, 12, 13, 14; the
top: sensor 2, 3, 4, 7, 9, 12, 14; the rear: sensor 4, 5, 10, 15, as shown in Figure 2, for giving comparable data of
both types of helmets studied. Then charts are presented to link the measured temperature and relative humidity
in various perception scales with respect to the NVL and the VL helmets. There are error bars in the measured
temperature and RH to show variation of the objective data. Although the subject number of six is limited, a
consistent and meaningful trend of the measured data can be still obtained. However, the contour plots show an
aerial view of the contours of the temperature and RH readings from fifteen individual probes inside the helmet.
Clearly, the contour plots give the distribution patterns of the measured temperatures and RHs, which reveal the
hot spots and wet spots inside the helmet. In addition, the comfort indices are linked to all measured temperature
and RH data for both ambient conditions. It would allow the measured microclimate conditions to be evaluated
in terms of subjective comfort index to help design a helmet with better thermal comfort.
3. Results and discussion
3.1 The relatively comfortable conditions (20 C with 50 % RH)
The comparisons of the temperature and relative humidity in the relatively comfortable conditions at the
each simplified microclimate region between the non-ventilated and ventilated helmets are shown in Figures
3(a), (b), (c) and (d). Here, error bars are shown in the figure to give the variation of the measurements. From
the figure, it can be seen that the NVL helmet has the higher temperature and RH readings than the VL helmet at
the frontal, the lateral and the top regions, however with the minimal difference between the two helmets at the
rear region likely due to the less effective opening setting there. The largest difference in temperature is in the
frontal region and the lateral region, which is between 1.5 °C and 2.5 °C, whereas such the difference in the top
region is 1-2 °C. The RH readings on the NVL helmet are 10-15% higher than that on the VL helmet at the
frontal, lateral and top regions. The global average RH value in the NVL helmet is 8 % RH higher than that in
the VL helmet, which is attributable to the ventilation openings aided the escape of water vapour from the
microclimate regions. Due to the ventilation, the VL helmet produced a similar RH values across the regions
with the wettest region being the rear region at 78 % RH. Those different micro climate conditions inside the
NVL and VL helmets are caused by the difference in ventilation openings on the helmets, as the presence of

ventilation openings aids the transfer of heat and moisture from the microclimate into the surroundings.
The temperature and RH variation in the four regions for both the NVL and VL helmets (Figure 3) can be
expressed in a logarithmic relationship as follows.
(1)0 ln( ) , 1sm m mregion r rT T A t B t
(2)0( ) ln( ) , 1sm m mregion r rRH RH C t D t
where , , , are constants corresponding to regional temperature and relative humidity in the 𝐴𝑚𝑟 𝐵𝑚
𝑟 𝐶𝑚𝑟 𝐷𝑚
𝑟
relativ ely comfortable ambient conditions, which are shown in Table 3. and are the temperature 𝑇𝑚0 (𝑅𝐻)𝑚
0
off-set and relative humidity off-set, with values of 4.8 oC (NVL) and 7.5 oC (VL) for the former, 11.7 % (NVL)
and 20.4 % (VL) for the latter. For the relatively comfortable ambient conditions, Eqs. (1) and (2) may be used
to estimate temperature and relative humidity inside the similar cricket helmets after a user wears it.
Temperature contour plots corresponding to the relatively comfortable conditions were processed to
provide a clearer perspective on the temperature distribution inside the helmet, which are shown in Table 4. It
should be noted that the positions of the microsensors on a 3D head are not precisely mapped onto the 2D plots.
Clearly, there are similar temperature distributions in the two helmets at the initial stage. This is reasonable as
the ambient conditions dominate at start of the measurement. With the test continued, the variation in
temperature distribution between the two helmets is increased. As the NVL helmet virtually represents a
self-contained microclimate, the variation of the in-helmet temperature is small. The contour lines become
increasingly less dense due to the increasingly balanced conditions as the test moves forward, with the exception
of the far front and far back regions. At the end of the testing period, the contour plot shows that the hot spots
are in the frontal, top and lateral regions, whilst the rear region remains relatively cool throughout the test. The
contour plots display that the temperature in the VL helmet is lower than that in the NVL helmet, as expected.
The contour plots are also less symmetrical, probably due to the fact that the ventilation openings encourage
better heat transfer which could be easily disturbed by movement of the head. The difference of regional
temperatures is larger in the VL helmet than the NVL helmet, again due to the presence of ventilation openings.
Although the ventilation openings help the transfer of heat, heat still accumulated at different spots
(frontal-lateral and rear-lateral) on the VL helmet. This can be improved by addition or a more effective
positioning of the ventilation openings.
Table 5 shows contour plots of relative humidity in the NVL and VL helmets corresponding to the
relatively comfortable conditions. As it can be seen, although the RH values are initially similar to both helmets,

the contour plots evolve as the test continues and are eventually differentiated between the helmets in
accordance with their ventilation settings. From Table 5, the contour line density increases as the test continues
in all regions, except for the top region in the NVL helmet. This is primarily due to the presence of a large air
pocket at the top region as opposed to the other regions. Therefore, the water vapour is distributed more evenly
across the region. The lack of ventilation holes can cause the water vapour movement inside the helmet to be
restrained and slow, which also contributes to the contour lines being less dense in the top region. The RH
readings increase in the frontal- lateral region by 20 % RH over the course of the test. The wettest areas are
shown to be the frontal and the frontal-lateral regions for the NVL helmet. Moreover, Table 5 also shows that
the RH values generally increase in all regions over the course of the test for the VL helmet. However, the
increase in RH readings is within 10 % RH, which is half of that in the NVL helmet. The frontal-lateral and the
rear-lateral regions, where there are more sweat glands and no ventilation openings (Figure 1a), are the regions
with the highest density of contour lines. It is interesting to see that there is a general reduction in the in-helmet
RHs inside the VL helmet from 30 minutes of testing to the end. At the end of the test, the wettest region is the
rear-lateral (right) region with 86.5 % RH and the driest region is the top region with 67.5 % RH for the VL
helmet. Rear-lateral regions need to be improved through a better ventilation design. For the NVL helmet, the
wettest region is on the front.
The warmth, moisture and comfort sensation/perception plotted against the average in-helmet temperature
and relative humidity in the relatively comfortable conditions are shown in Figures 4(a) and 4(b) for the
non-ventilated and ventilated helmets respectively. Here, the darker grey area shown in the figure indicates the
comfort zone. A general observation shows that all the perception values related to the NVL helmet are higher
in comparison to the VL helmet. Also, the comfort perception value for the former is slightly above 4 at the end
of the test, whereas that for the latter is about 3.5. For both the warmth and moisture perceptions, they have a
general upward trend for both of the helmets according to Figures 4(a) and 4(b). The comfort sensation is
towards the uncomfortable scale (> 4.0) for the NVL helmet according to Figures 4(a). Overall, the average
comfort sensation scale in the NVL helmet was higher than the VL helmet by 0.7. The reason for this small
difference may be attributed to such the ambient conditions making it harder for the subjects to differentiate the
comfort sensation for each of the regions.
In the relatively comfortable ambient conditions, variation of the measured average in-helmet temperature
between subjects seems getting bigger with the time and however, such variation for RH getting smaller for both
helmets (Figure 4). In general, the temperature variation inside the VL helmet is greater than that inside the

NVL helmet, which indicates the influence of the ventilation openings. Also, the variation of the comfort index
for the former helmet is smaller than that for the latter helmet.
3.2 The warm conditions (35C with 30% RH)
The regional comparisons of the temperature and RH values between the two helmets in the warm
conditions are shown in Figures 5(a), (b), (c) and (d) respectively. Again, the error bars are given to indicate the
measurement variation obtained from individual subjects. Clearly, the RH in the VL helmet is about 15 % lower
than that in the NVL helmet throughout the test period in almost all regions, except for the rear one where the
difference is only 5 %. However, the difference in temperature is minimal between the two helmets for all
regions in the whole test period. The reason for such the small difference is likely attributed to that the ambient
temperature is not far away from the body temperature. Due to physiological heat balance on body, there was
not much room to differentiate the in-helmet temperature between the two types of helmets in the warm
conditions. Despite of the minimal difference on the in-helmet temperature, the VL helmet does give a
significantly lower RH (about 10-18 % from region to region), which offers a better comfort than the NVL
helmet.
Based on Figure 5, the regional temperature and RH both the NVL and VL helmets may be expressed in a
logorithmic relationship as follows.
(3)0 ln( ) , 1sh h hregion r rT T A t B t
(4)0( ) ln( ) , 1sh h hregion r rRH RH C t D t
where , , , are constants corresponding to regional temperature and relative humidity in the 𝐴ℎ𝑟 𝐵ℎ
𝑟 𝐶ℎ𝑟 𝐷ℎ
𝑟
warm ambient conditions, as shown in Table 6. is a temperature off-set, with values of 1.3 oC (NVL) and 𝑇ℎ0
1.7 oC (VL), and is a relative humidity off-set with values of 16.6 % (NVL) and 30.8 % (VL). Eqs. (3) (𝑅𝐻)ℎ0
and (4) may be used to estimate temperature and relative humidity inside the similar cricket helmets after a user
wears it in warm conditions.
Table 7 shows thermal contour plots in the warm conditions at different time intervals for the NVL and the
VL helmets respectively. A small gap of 0.05C is used between the contour lines due to the small difference
between the temperatures inside the helmet and the surrounding environment. According to the table, for the
NVL helmet, the resulting contour plots show a less symmetric pattern compared to the contour plots in the
relatively comfortable ambient conditions (Table 4). As the test continues, the heat inside the helmet is

accumulated at the top region and leads to smaller and smaller difference between the regional temperatures.
For the VL helmet, it shows that the contour plot has a more symmetric pattern as opposed to the NVL helmet.
Due to the presence of ventilation openings, the contour lines in the VL helmet are not, in general, as dense as
that in the NVL helmet. However, the small difference between the two helmets is due to the physiological
heat balance related to the high ambient temperature, as mentioned before.
Table 8 shows the experimental relative humidity contour plots in the warm amibent conditions at various
time intervals during the test. It indicates that despite having initially a relatively dry area centrally in the NVL
helmet, as the test goes on, increasingly higher RH readings are detected as the moisture is being accumulated
near the top region without an effective means of escape. At the end of the test, the wettest spots are the
frontal-lateral and the lateral regions, and the driest spots are the frontal and the rear region for the NVL helmet.
At the same time, for the VL helmet, as shown in the lower half of Table 8, the regions with a ventilation
opening, i.e. on the top, frontal, lateral and rear regions, display the reasonably lower RH values in comparison
to the counterpart regions in the NVL helmet. The wettest and driest regions are the rear-lateral and the top
regions respectively. In the VL helmet, the regional variation on RH is very noticeable due to the ventilation
setting, which is reflected by more dense contour lines.
The average in-helmet sensations on warmth, moisture and comfort perception in relation to the
temperature and RH readings in the warm conditions throughout the test for both helmets are shown in Figures
6(a) and (b). Here again, the darker grey area shown in the figure indicates the comfort zone. With the exception
of small fluctuations after walking phases, the sensation or perception for both helmets are on an up-trend
throughout the test. Due to the high ambient temperature, the differences in sensations and perceptions between
the two helmets are relatively small, despite of the lower RHs in the VL helmet. This may indicate that the
ventilation opening setting on the VL helmet needs to be further improved to introduce a better comfort. As the
sensations are towards the very humid and the hot scales (7) for both helmets, the moisture and warmth
sensations dominate overall the test. At the end of the test, all the regions are approaching to the very humid
range, with a global moisture sensation of 6.7 for the NVL helmet, which is only 0.3 higher than that the VL
helmet. The wettest regions were felt at the frontal region for both helmets and the driest region was felt at the
top region. In addition, there is no significant difference in the comfort perception between the two helmets, as
indicated before. At the end of the test, the overall average comfort perception of both helmets is in the
uncomfortable zone. Due to the high ambient condition, the subjects were not able to distinguish effectively the
difference in comfort between regions for the helmets with the current ventilation settings.
In the warm conditions, the variation of the in-helmet temperature between subjects is getting smaller for
both helmets due to high temperature inside the helmet (Figure 6). Such the variation on the in-helmet RH for
the VL helmet has some fluctuation and however, that for the NVL helmet has a trend of reduction. This is
likely attributed to the ventilation opening of the former helmet.
3.3 Subjective sensation/perception index
It is necessary to establish a comfort index by linking all objective data with the subjective data for both
ambient conditions to provide an overall chart on the relationship between the human perception and the digital
measurements on the microclimate inside a helmet. This index is vital to assist helmet design with better thermal
comfort backed up with the balanced perception in relation to the in-helmet temperature and relative humidity.
The warmth, moisture and comfort sensation indices developed are shown in Figures 7(a), (b) and (c)
respectively. Here, the measured digital data are overlain with the subjective data in a single chart.
Temperature-relative humidity (T-RH) curves are plotted for both ambient conditions. If the T-RH point is
above this curve, the upper perception curve is used, and if the T-RH point is below the curve, the lower
perception curve is used, whilst if the T-RH point is on the T-RH curve, the median perception curve is used to
derive the resulting perception. There is however, a gap between the two ambient T-RH curves, which means
that further experiments are needed in order to complete the index.
An ideal sensation/perception scale range for a cricket helmet would be 4-5 for warmth and moisture and 3
for comfort. Based on these indices, in order to achieve thermal comfort, the T-RH point should be below the
T-RH curve so that the lower perception curve can be obtained.
The indices are verified by comparing index derived sensation/perception scales with the index that was
measured from the experiment. The comparisons show that for the relatively comfortable ambient conditions, all
the derived scales are similar to their counterparts except for the ones that are at the end of the test where the
derived scales are lower. However, the comparisons show that for the high ambient conditions, all results are
similar except for the ones at t = 30 minutes. These differences may be due to the fact that the indices are
developed based on the limited experimental parameters. This can be improved if more subjects are involved
and more ambient conditions are considered.
4. Conclusions
A novel test rig has been developed, which is comprised of a helmet with fifteen embedded microsensors, a
data logger and a laptop, with the capability of measuring real-time temperature and RH data inside a helmet for
producing the related thermal and moisture mapping. Here, two types of cricket helmets have been tested, i.e. a
non-ventilated helmet (NVL) and a ventilated helmet (VL), to represent helmets without any ventilation opening
and with reasonable ventilation openings, respectively. Two ambient conditions have been considered here, i.e.
the relatively comfortable conditions (20 °C / 50 % RH) and the warm conditions (35 °C / 30 % RH). The
experimental results show that ventilation openings clearly aid the transfer of heat and moisture from the
microclimate into the surroundings, especially under the comfortable ambient conditions. In addition to
benefiting from a drier, cooler microclimate, the subjects who wear the ventilated helmet also have a smaller
increase in body temperature during the test. Even though the ventilated helmet offers a better performance in
heat and moisture managements, there is still a room for improvement, especially concerning the frontal-lateral
and the rear-lateral regions in the warm conditions.
The research outputs show that there is reasonable and sensible correlation between the subjective
sensations/perceptions on warmth, moisture and thermal comfort and the measured in-helmet temperature and
relative humidity, which are essential to establish comfort indices. The comfort indices developed provide an
aid for helmet designers to maximise the thermal comfort in given ambient conditions. The thermal and
moisture mappings also provide the digital data to validate computer modelling of in-helmet microclimate
conditions. In addition, the technology developed provides a novel measurement approach to other head gear
types (such as safety helmets, fire fighter helmets, motorcycle helmets, etc.), and further to microclimate
environments in close contact with human body (such as bandage, outdoor garments, etc.). The approach can
also be used to monitor indoor or in-car temperature and RH distributions to assist designing those
environments with better thermal comfort.
Acknowledgments
The authors would like to acknowledge the Scholarship provided by the Malaysian Government for funding
this research. The authors would also thank Gray Nicolls for providing the cricket helmet samples. The thanks
also go to the Liverpool John Moores University to allow us to use the environmental chamber.
References
[1]. Arens E, Zhang H, Huizenga C. Partial and Whole Body Thermal Sensation and Comfort-Part 1: Uniform
Environmental Conditions. Journal of Thermal Biology, 2006, 31: 53-59.
[2]. Bogerd C P, Aerts J, Annaheim S, Brode P, Bruyne G, Flouris A D, Kuklane K, Mayor T S and Rossi R M.
A review on ergonomics of headgear: Thermal effects. International Journal of Industrial Ergonomics,

2015, 45: 1–12.
[3]. Liang-Tseng, F., Fu-Tong, H., Ching-Lai, H. (1971) A review on mathematical models of the human
thermal system. Available at: http://ieeexplore.ieee.org/stamp/stamp.jsp?tp=&arnumber=4502835
(Accessed: 10 February 2016).
[4]. Berglund L. Comfort and Humidity. ASHRAE Journal, 1998, 40(8): 35-41.
[5]. Parsons K. Human thermal environments: The effects of hot, relatively comfortable, and cold environments
on human health, comfort, and performance. 3rd edn. United States: CRC Press, 2014.
[6]. Davis G A, Edmisten E D, Thomas R E, Rummer R B, Pascoe D D. Effects of ventilated safety helmets in a
hot environment. International Journal of Industrial Ergonomics, 2001, 27(5): 321-329.
[7]. Bogerd C P, Walker I, Brühwiler P A, Rossi R M. The effect of a helmet on cognitive performance is, at
worst, marginal: A controlled laboratory study. Applied Ergonomics, 2014, 45: 671-676.
[8]. Fanger P O. Thermal Comfort. Analysis and application in environmental engineering, McGraw, New York,
1972.
[9]. Dullah A R, Guan, Z W, Crompton R H. A pilot study on thermal and moisture mapping of the head-helmet
system using micro sensor technology. Journal of Testing and Evaluation, 2011, 39(3):7.
[10]. Bergmann Tiest W M, Kosters N D, Kappers A M L, Daanen H A M. Phase change materials and the
perception of wetness. Ergonomics, 2012, 55: 508-512.
[11]. Guillamón N M, Psikuta A, Rossi R M, Salvador J M C, Annaheim S. Global and local heat transfer
analysis for bicycle helmets using thermal manikins. International Journal of Industrial Ergonomics, 2016,
53: 157-166.
[12]. Halimi M T, Hassen M B, Sakli F. Design of a novel comfort liner for a motorcycle helmet. International
Journal of Sustainable Engineering, 2012, 5(2): 128-134.
[13]. Holland E J, Laing R M, Lemmon T L, Niven B E. Helmet design to facilitate thermoneutrality during
forest harvesting. Ergonomics, 2002, 45(10): 699-716.
[14]. Hriari M, Abdullah A F, Ahmed M I. Cooling of Motorcyclist Helmet with Thermoelectric Module.
Middle-East Journal of Scientific Research, 2013, 13: 103-108.
[15]. Hsu Y L, Tai C Y, Chen T C. Improving thermal properties of industrial safety helmets. International
Journal of Industrial Ergonomics, 2000, 26: 109-117.
[16]. Katekar V, Khatri V. ‘Helmet Cooling With Phase Change Material’, IJCA Proceedings on National
Conference on Innovative Paradigms in Engineering and Technology (NCIPET 2012), No. 10, 2012.

[17]. Neave N, Emmett J, Moss M, Ayton R, Scholey A, Wesnes K. The effects of protective helmet use on
physiology and cognition in young cricketers. Applied Cognitive Psychology, 2004, 18: 1181-1193.
[18]. Fok S C, Tan F L, Sua C C. Experimental Investigations on the Cooling of a Motorcycle Helmet with
Phase Change Material. Thermal Science, 2011, 15: 807-816.
[19]. Pang T Y, Subic A, Takla M. Thermal comfort of cricket helmets: An experimental study of heat
distribution. Procedia Engineering, 2011, 13: 252-257.
[20]. Pang T Y, Subic A, Takla M. A comparative experimental study of the thermal properties of cricket
helmets. International Journal of Industrial Ergonomics, 2013, 43: 161-169.
[21]. Pang T Y, Subic A, Takla M. Evaluation of thermal and evaporative resistances in cricket helmets using a
sweating manikin. Applied Ergonomics, 2014, 45: 300-307.
[22]. Mithun S K, Umesh S, Pathan R. Conceptual Design of Motor Cycle Helmet to Meet the Requirement of
Thermal Comfort, Ergonomics and Safety. SASTech Journal, 2013, 12: 65-71.
[23]. Mustary I, Chowdhury H, Loganathan B, Alharthi M, Alan F. ‘Aerodynamic Efficiency and Thermal
Comfort of Road Racing Bicycle Helmets’, paper presented to 19th Australasian Fluid Mechanics
Conference, Melbourne, 8-11 December 2014.
[24]. Abeysekera J D A and Shahnavaz H. Ergonomics evaluation of modified industrial helmets for use in
tropical environments. Ergonomics, 1988, 31: 137-145
[25]. Bruyne G D, Aerts J, Sloten J V, Goffin J, Verproest I, Berckmans D. Quantification of local ventilation
efficiency under bicycle helmets. International Journal of Industrial Ergonomics, 2012, 42: 278-286.
[26]. Covill, D, Guan, Z W, Pope, D J, Bailey, M. ‘The effect of shoe fit on subjective responses, temperature
and relative humidity levels’, Proceeding of 4th International Conference on The Engineering of Sport,
Kyoto, Japan, 3-6 September, 2002, pp. 588-594.
[27]. Vigreswaran G, Arulmurugan L. Improving Thermal Comfort in Industrial Safety Helmet using Phase
Change Material. International Journal of Scientific Engineering and Technology Research, 2014, 3(4):
712-715.
[28]. ASHRAE Handbook, Fundamental SI edition, 1993.
[29]. Martínez N, Psikuta A, Rossi R M, et al. Global and local heat transfer analysis for bicycle helmets using
thermal head manikins. International Journal of Industrial Ergonomics, 2016, 53: 157-166.
[30]. Potter A W, Gonzalez J A, Karis A J, et al. Biophysical Assessment and Predicted Thermophysiologic
Effects of Body Armor. Plos One, 2015, 10(7): e0132698.

[31]. Bogerd C P, Brühwiler P A. The role of head tilt, hair and wind speed on forced convective heat loss
through full-face motorcycle helmets: A thermal manikin study. International Journal of Industrial
Ergonomics, 2008, 38(3): 346-353.
[32]. Bogerd C P, Brühwiler P A. Heat loss variations of full-face motorcycle helmets. Applied Ergonomics,
2009, 40(2): 161-164.
[33]. Flouris A D. Functional architecture of behavioural thermoregulation. European Journal of Applied
Physiology, 2011, 111(1): 1-8.
[34]. Foda E and Kai S. A thermal manikin with human thermoregulatory control: Implementation and
validation. International Journal of Biometeorology, 2012, 56(5): 959-971.
[35]. Hartley G L, Flouris A D, Plyley M J, et al. The effect of a covert manipulation of ambient temperature on
heat storage and voluntary exercise intensity. Physiology & Behavior, 2012, 105(5): 1194-1201.
[36]. Liu X., Abeysekera J and Shahnavaz H. Subjective evaluation of three helmets in cold laboratory and
warm field conditions. International Journal of Industrial Ergonomics, 1999, 23(3): 223-230.
[37]. Laing, R M., Sims, S T, Wilson, C A, Niven, B E and Cruthers, N M. Differences in wearer response to
garments for outdoor activity. Ergonomics, 2008, 51(4): 492-510.
[38]. Webster, J, Holland, E J, Sleivert, G, Laing, R M and Niven, B E. A light-weight cooling vest enhances
performance of athletes in the heat. Ergonomics, 2005, 48(7): 821-837.
(a) Elite helmet, (b) Pro-performance helmet
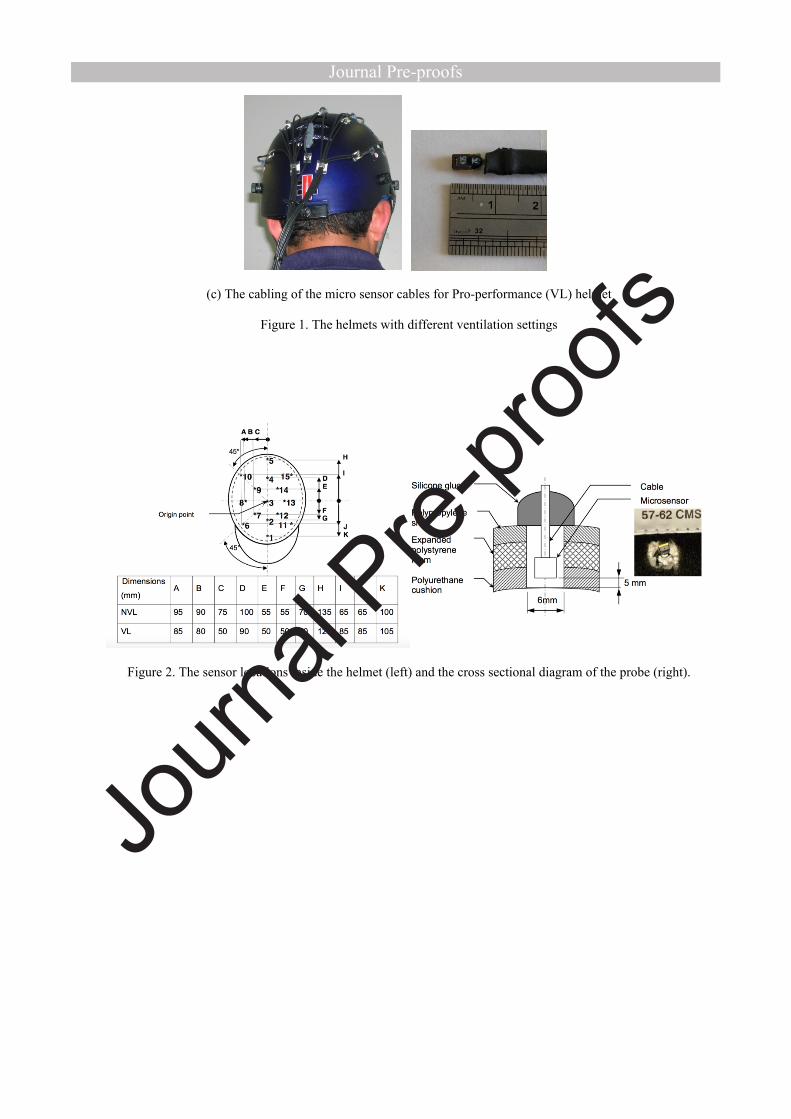
(c) The cabling of the micro sensor cables for Pro-performance (VL) helmet
Figure 1. The helmets with different ventilation settings
Figure 2. The sensor locations inside the helmet (left) and the cross sectional diagram of the probe (right).

Figure 3. Comparisons of the measured regional temperature and relative humidity between the NVL and the VL helmets in the ambient condition of 20C and 50%RH.
Figure 4. Average in-helmet temperature and relative humidity against subject sensations/perception in the ambient conditions of 20C and 50%RH (with the darker grey area corresponding to comfort zone).
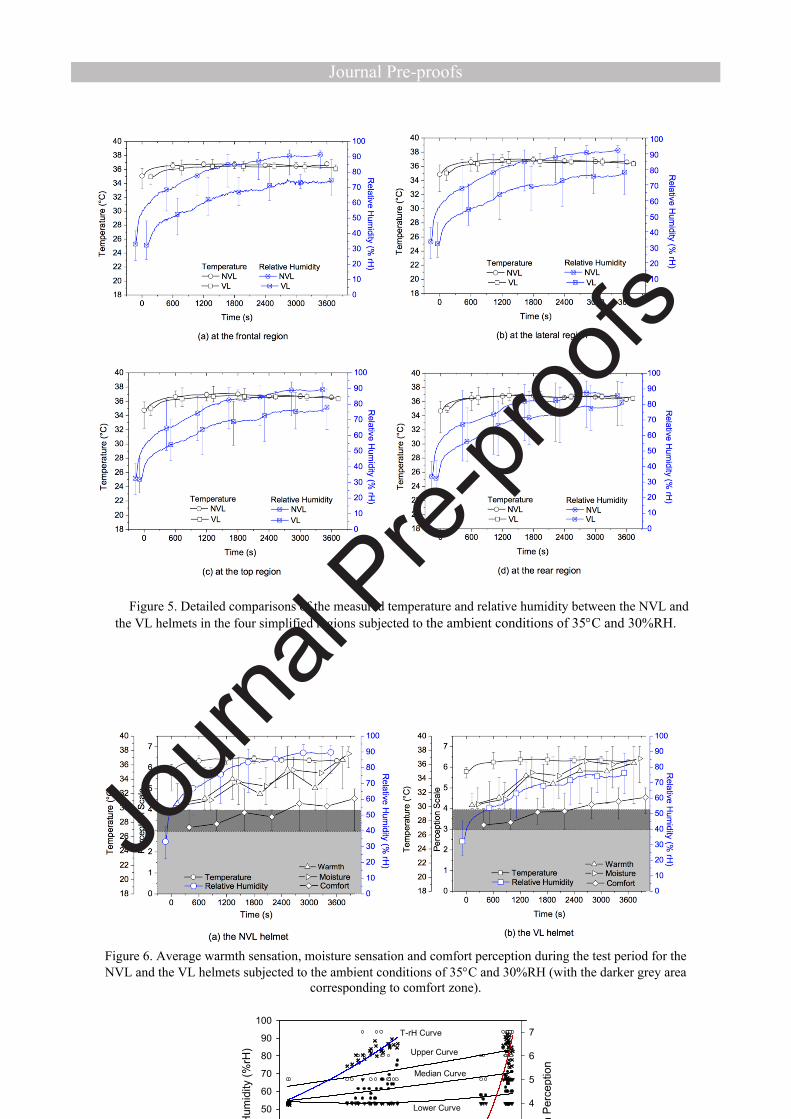
Figure 5. Detailed comparisons of the measured temperature and relative humidity between the NVL and the VL helmets in the four simplified regions subjected to the ambient conditions of 35C and 30%RH.
Figure 6. Average warmth sensation, moisture sensation and comfort perception during the test period for the NVL and the VL helmets subjected to the ambient conditions of 35C and 30%RH (with the darker grey area
corresponding to comfort zone).
Temperature (°C)20 22 24 26 28 30 32 34 36 38
War
mth
Per
cept
ion
0
1
2
3
4
5
6
7
Rel
ativ
e H
umid
ity (%
rH)
0
10
20
30
40
50
60
70
80
90
100
Lower Curve
Upper Curve
Median Curve
T-rH Curve
T-rH Curve

(a) the warmth sensation index
(b) the moisture sensation index
(c) the comfort perception index
Figure 7. Relationships between the sensation/perception and the measured microclimate temperature and RH.[39].
20 22 24 26 28 30 32 34 36 38
Moi
stur
e Pe
rcep
tion
0
1
2
3
4
5
6
7
0
10
20
30
40
50
60
70
80
90
100
Temperature (°C)
Rel
ativ
e H
umid
ity (%
rH)
Lower Curve
Upper Curve
Median Curve
T-rH Curve
T-rH Curve
Temperature (°C)20 22 24 26 28 30 32 34 36 38
Com
fort
Perc
eptio
n
0
1
2
3
4
5
6
0
10
20
30
40
50
60
70
80
90
100
Rel
ativ
e H
umid
ity (%
rH)
Lower Curve
Upper Curve
Median Curve
T-rH Curve
T-rH Curve
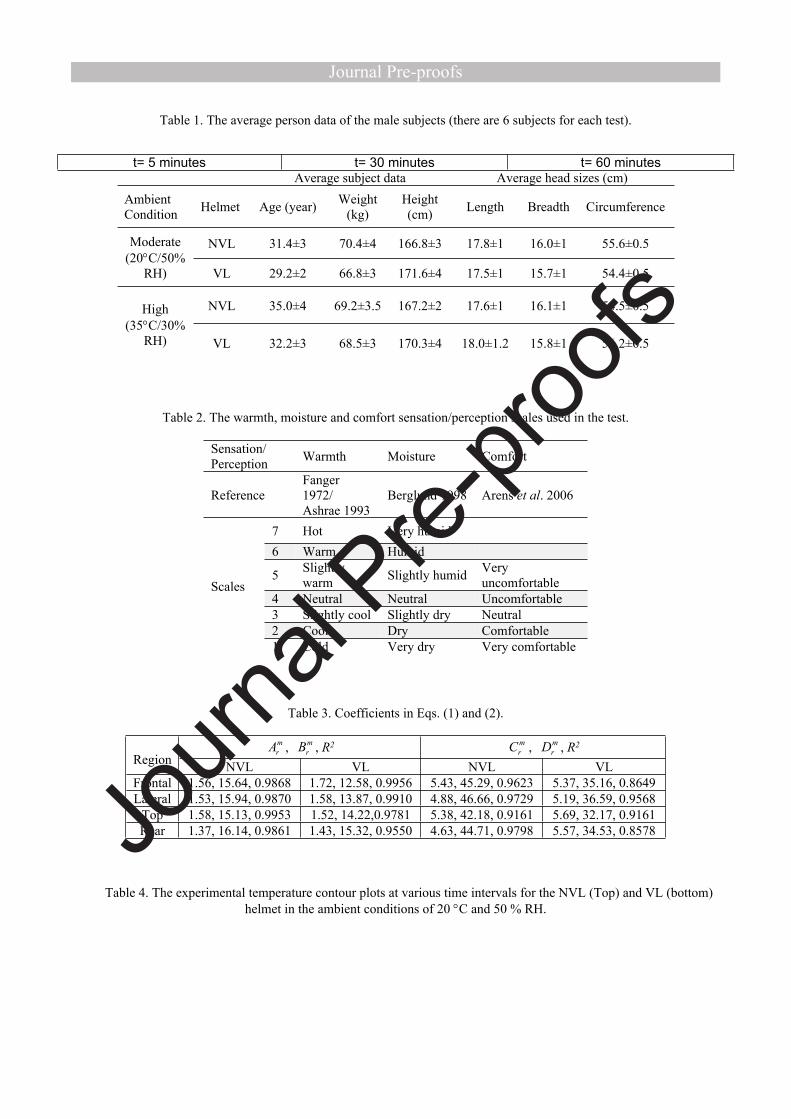
Table 1. The average person data of the male subjects (there are 6 subjects for each test).
Average subject data Average head sizes (cm)AmbientCondition Helmet Age (year) Weight
(kg)Height (cm) Length Breadth Circumference
NVL 31.4±3 70.4±4 166.8±3 17.8±1 16.0±1 55.6±0.5Moderate (20C/50%
RH) VL 29.2±2 66.8±3 171.6±4 17.5±1 15.7±1 54.4±0.5
NVL 35.0±4 69.2±3.5 167.2±2 17.6±1 16.1±1 54.5±0.5High(35C/30%
RH) VL 32.2±3 68.5±3 170.3±4 18.0±1.2 15.8±1 56.2±0.5
Table 2. The warmth, moisture and comfort sensation/perception scales used in the test.
Sensation/Perception Warmth Moisture Comfort
ReferenceFanger 1972/Ashrae 1993
Berglund 1998 Arens et al. 2006
7 Hot Very humid6 Warm Humid
5 Slightly warm Slightly humid Very
uncomfortable4 Neutral Neutral Uncomfortable3 Slightly cool Slightly dry Neutral2 Cool Dry Comfortable
Scales
1 Cold Very dry Very comfortable
Table 3. Coefficients in Eqs. (1) and (2).
, , R2mrA m
rB , , R2mrC m
rDRegion NVL VL NVL VLFrontal 1.56, 15.64, 0.9868 1.72, 12.58, 0.9956 5.43, 45.29, 0.9623 5.37, 35.16, 0.8649Lateral 1.53, 15.94, 0.9870 1.58, 13.87, 0.9910 4.88, 46.66, 0.9729 5.19, 36.59, 0.9568
Top 1.58, 15.13, 0.9953 1.52, 14.22,0.9781 5.38, 42.18, 0.9161 5.69, 32.17, 0.9161Rear 1.37, 16.14, 0.9861 1.43, 15.32, 0.9550 4.63, 44.71, 0.9798 5.57, 34.53, 0.8578
Table 4. The experimental temperature contour plots at various time intervals for the NVL (Top) and VL (bottom) helmet in the ambient conditions of 20 C and 50 % RH.
t= 5 minutes t= 30 minutes t= 60 minutes

Table 5. The measured RH contour plots at various time intervals for the NVL (Top) and VL (Bottom) helmet in the ambient conditions of 20 C and 50 % RH.
t= 5 minutes t= 30 minutes t= 60 minutes

t= 5 minutes t= 30 minutes t= 60 minutes
t= 5 minutes t= 30 minutes t= 60 minutes

Table 6. Coefficients in Eqs. (3) and (4).
, , R2hrA h
rB , , R2hrC h
rDRegion NVL VL NVL VLFrontal 0.22, 35.03, 0.5946 0.44, 32.94, 0.6799 9.36, 14.55, 0.9655 9.03, -0.64, 0.9379Lateral 0.28, 34.78, 0.7204 0.48, 33.01, 0.6951 9.54, 13.78, 0.9649 9.43, -0.82, 0.9615
Top 0.57, 32.48, 0.7944 0.33, 34.02, 0.7577 9.35, 12.39, 0.9362 9.41, -0.81, 0.9623Rear 0.49, 32.95, 0.6609 0.45, 33.27, 0.6799 9.04, 13.21, 0.9660 9.71, -1.01, 0.9540

Table 7. The experimental temperature contour plots at various time intervals for the NVL (top) and VL (bottom) helmet in the ambient conditions of 35 C and 30 % RH.
t= 5 minutes t= 30 minutes t= 60 minutes
t= 5 minutes t= 30 minutes t= 60 minutes

Table 8. The measured RH contour plots at various time intervals for the NVL (Top) and VL (bottom) helmet in the ambient conditions of 35 C and 30 % RH.
t= 5 minutes t= 30 minutes t= 60 minutes
t= 5 minutes t= 30 minutes t= 60 minutes

26
[40].
Highlights Combined temperature and moisture microsensors are embedded in two types of helmets In-helmet thermal and moisture mappings have been obtained for the first time Human perceptions on warmth, moisture and thermal comfort have been recorded Comfort index is linked to the measured in-helmet temperature and relative humidity
[41].