Photoacoustic investigation of thermal and transport properties of amorphous GeSe thin films
11
Photoacoustic investigation of thermal and transport properties of amorphous GeSe thin films D. M. Todorovii Center for Multidisciplinary Studies, University of Belgrade, RO. Box 373, 11000 Belgrade, Yugoslavia and Joint Laboratory for Advanced Materials of SASA, Belgrade, Yugoslavia P. M. Nikolib Joint Laboratory for Advanced Materials of SASA, Belgrade, Yugoslavia D. G. Vasiljevib and M. D. Dramibanin Center for Multidisciplinary Studies, University of Belgrade, l?O. Box 373, 11000 Belgrade, Yugoslavia and Joint Laboratory for Advanced Materials of SASA, Belgrade, Yugoslavia (Received 12 July 1993; accepted for publication 16 June 1994) In this work the possibility of simultaneous determination of thermal and transport properties of thin films using a photoacoustic method was investigated. The properties of amorphous GeSe thin films, which were evaporated on quartz substrata, were examined by measuring their amplitude and phase photoacoustic spectra as a function of the modulated optical laser beam frequency. The measurements were performed in a specially constructed photoacoustic cell which enabled excitation of the sample on one side and detection of the acoustic response on the other. Thermal diffusivity and transport properties (diffusivity coefficient, recombination time, and the surface recombination velocity) of the GeSe thin films were determined by comparing of the experimental results and the calculated theoretical photoacoustic spectra. 1. INTRODUCTION thermal diffusivity measurements of thin tilms.1-4 The photoacoustic (PA) method is widely used for the investigation of optical and thermal and recently even trans- port properties of materials. This method is based on the PA effect, which is a process of acoustic wave generation in a material after the absorption of a modulated energy beam (electromagnetic radiation, electron beam, ion, etc.). Thermal and transport characteristics of bulk semicon- ductors were measured simultaneously by Pinto Neto et al.‘ ,6 A special problem in microelectronics is the determination of thermal and transport properties of thin films on substrates of various materials. Many thermal and nonthermal deexcitation processes can appear in the material that is used after absorption of the modulated energy beam. Nonthermal deexcitation processes can also generate heat as a secondary process. The generated heat energy can be manifested in various ways. It can in- crease the sample temperature or deflect the excitation beam (photothermal deflection), or it. can produce a displacement of the surface (photothermal displacement) or generate sec- ondary infrared radiation (photothermal radiation) or gener- ate sound (photoacoustic signal). The results of the determination of thermal and transport properties of thin amorphous GeSe fiIms evaporated on a quartz substrate are given in this work. Both amplitude and phase PA spectra were measured and analyzed as a function of the modulated frequency in the range between 10 and 2000 Hz. Thermal diffusivity and transport properties (the diffusion coefficient, recombination time, and surface recom- bination velocity of carriers) were determined by fitting theo- retical PA spectra to the experimental data. II. THEORETICAL MODEL The photoacoustic signal can be detected using various configurations. The sample-gas-microphone setup is a con- 1 figuration used very often for solid samples. This method supposes that the sample is put in a small closed PA cell, which is filled with a gas, usually air. A modulated beam is then introduced into the PA cell through a quartz window onto the sample, which absorbs the modulated optical beam. This absorbed energy can directly produce an acoustic signal (thermoelastic process) or it can be transferred to the surface of the sample (thermodiffusion process), where it can finally appear through acoustic response due to the gas heating on the sample surface. The heat transfer through the sample is defined by the thermal diffusivity D r , which is a ratio between the thermal conductivity K and heat capacity Cr. There exist several different methods for the measurement of thermal diffusivity. The PA method is used because it is a nondestructive and noncontact method, and this is very important in the case of In Fig. 1 the geometry of the photoacoustic cell used in the investigation of thin films is given. This detection con- figuration implies excitation of the two-layer sample on one side and detection of the acoustic response on the other side. This model was analyzed by several authors7** in accordance with the Rosencwaig-Gersho theory.’ They considered only thermodiffusion mechanism of the PA signal generation. However, the thermoelastic mechanism can have an impor- tant influence on the PA signal, especially at higher frequencies.” The influence of this thermoelastic mechanism on the PA signal can be eliminated during the measuring procedure. This may be done in two ways. First, the thin film can be evaporated on a very thick substrate which will damp vibrations. The second method is a precise calculation of the inlluence of the thermoelastic mechanism on the size of the PA signal. In this work a theoretical model is given which can be used for the detection configuration given in Fig. 1. The 4012 J. Appl. Phys. 76 (7), 1 October 1994 0021-8979/94/76(7)/4012/l O/$6.00 Q 1994 American Institute of Physics
-
Upload
independent -
Category
Documents
-
view
0 -
download
0
Transcript of Photoacoustic investigation of thermal and transport properties of amorphous GeSe thin films

Photoacoustic investigation of thermal and transport properties of amorphous GeSe thin films
D. M. Todorovii Center for Multidisciplinary Studies, University of Belgrade, RO. Box 373, 11000 Belgrade, Yugoslavia and Joint Laboratory for Advanced Materials of SASA, Belgrade, Yugoslavia
P. M. Nikolib Joint Laboratory for Advanced Materials of SASA, Belgrade, Yugoslavia
D. G. Vasiljevib and M. D. Dramibanin Center for Multidisciplinary Studies, University of Belgrade, l?O. Box 373, 11000 Belgrade, Yugoslavia and Joint Laboratory for Advanced Materials of SASA, Belgrade, Yugoslavia
(Received 12 July 1993; accepted for publication 16 June 1994)
In this work the possibility of simultaneous determination of thermal and transport properties of thin films using a photoacoustic method was investigated. The properties of amorphous GeSe thin films, which were evaporated on quartz substrata, were examined by measuring their amplitude and phase photoacoustic spectra as a function of the modulated optical laser beam frequency. The measurements were performed in a specially constructed photoacoustic cell which enabled excitation of the sample on one side and detection of the acoustic response on the other. Thermal diffusivity and transport properties (diffusivity coefficient, recombination time, and the surface recombination velocity) of the GeSe thin films were determined by comparing of the experimental results and the calculated theoretical photoacoustic spectra.
1. INTRODUCTION thermal diffusivity measurements of thin tilms.1-4
The photoacoustic (PA) method is widely used for the investigation of optical and thermal and recently even trans- port properties of materials. This method is based on the PA effect, which is a process of acoustic wave generation in a material after the absorption of a modulated energy beam (electromagnetic radiation, electron beam, ion, etc.).
Thermal and transport characteristics of bulk semicon- ductors were measured simultaneously by Pinto Neto et al.‘,6 A special problem in microelectronics is the determination of thermal and transport properties of thin films on substrates of various materials.
Many thermal and nonthermal deexcitation processes can appear in the material that is used after absorption of the modulated energy beam. Nonthermal deexcitation processes can also generate heat as a secondary process. The generated heat energy can be manifested in various ways. It can in- crease the sample temperature or deflect the excitation beam (photothermal deflection), or it. can produce a displacement of the surface (photothermal displacement) or generate sec- ondary infrared radiation (photothermal radiation) or gener- ate sound (photoacoustic signal).
The results of the determination of thermal and transport properties of thin amorphous GeSe fiIms evaporated on a quartz substrate are given in this work. Both amplitude and phase PA spectra were measured and analyzed as a function of the modulated frequency in the range between 10 and 2000 Hz. Thermal diffusivity and transport properties (the diffusion coefficient, recombination time, and surface recom- bination velocity of carriers) were determined by fitting theo- retical PA spectra to the experimental data.
II. THEORETICAL MODEL
The photoacoustic signal can be detected using various configurations. The sample-gas-microphone setup is a con-
1 figuration used very often for solid samples. This method supposes that the sample is put in a small closed PA cell, which is filled with a gas, usually air. A modulated beam is then introduced into the PA cell through a quartz window onto the sample, which absorbs the modulated optical beam. This absorbed energy can directly produce an acoustic signal (thermoelastic process) or it can be transferred to the surface of the sample (thermodiffusion process), where it can finally appear through acoustic response due to the gas heating on the sample surface.
The heat transfer through the sample is defined by the thermal diffusivity D r , which is a ratio between the thermal conductivity K and heat capacity Cr. There exist several different methods for the measurement of thermal diffusivity. The PA method is used because it is a nondestructive and noncontact method, and this is very important in the case of
In Fig. 1 the geometry of the photoacoustic cell used in the investigation of thin films is given. This detection con- figuration implies excitation of the two-layer sample on one side and detection of the acoustic response on the other side. This model was analyzed by several authors7** in accordance with the Rosencwaig-Gersho theory.’ They considered only thermodiffusion mechanism of the PA signal generation. However, the thermoelastic mechanism can have an impor- tant influence on the PA signal, especially at higher frequencies.” The influence of this thermoelastic mechanism on the PA signal can be eliminated during the measuring procedure. This may be done in two ways. First, the thin film can be evaporated on a very thick substrate which will damp vibrations. The second method is a precise calculation of the inlluence of the thermoelastic mechanism on the size of the PA signal.
In this work a theoretical model is given which can be used for the detection configuration given in Fig. 1. The
4012 J. Appl. Phys. 76 (7), 1 October 1994 0021-8979/94/76(7)/4012/l O/$6.00 Q 1994 American Institute of Physics
one
-=+ L I I I
1,. 0 -1, -1 fl, -1,-1,-l,
where ki= (1 + j)J,ui and ,U is the thermal diffusion length of layer i,
=&-. pi= 2
J- w *
It is usually supposed that sources exist only in layers 1 and 2, i.e., that absorption of the excitation of radiation in gas and the backing does not exist.
For the previous system of equations the following boundary conditions for temperature and thermal flux exist:
~g(O)=~,~OL (44
~li-~l~=~2i-~lj, W)
CD~(-z~-z~j=~‘b(-z1-z~), (4cj
FIG. 1. Schematic configuration of a PA cell with a two-layer sample (g, gas; sI , substrate; s2, film; b, backing; m, microphone). (54
same model can be used in the other cases, when an acoustic response is detected on the optically illuminated sample side.
A. Temperature distribution in the PA cell
The temperature distribution in a PA cell should be known for determining the amplitude and phase of the PA signal. For that reason the following system of thermal dif- fusion equations should be solved:
where DTi is the thermal diffusion of layer i, T,(z,t) is the temperature distribution of layer i, and Hi(Z,t) is the heat source in the layer i= 1,2.
Suppose that the modulation optical excitation, absorbed in the material, has the form
1(~,f)=~I;T,e~~[ 1 +COS( ~t)]=l(~jRe( 1 + e-jot), (2)
where 1, is the intensity of the incident radiation, LY is the coefficient of optical absorption, and o=2rrf; with f the frequency of the modulation. Then the temperature distribu- tion is
Ti(z,t)=3Ti(z)Re(l+e-jwf).
For our investigations only the periodic component of the temperature distribution a’(z) is of interest. The system of equations (1) can be written as
i ! -$-k; a,(z)=0 (z&O), @a)
Q2(z)=H2(z) (Zlaza-ZI,-Z2), (3cj
W
(5b)
iW where Ki is the thermal conductivity of layer i and HS is the surface heat source of layer i.
The solution of system (3), using the boundary condi- tions given in Eqs. (4) and (5), has the following form:
(9Jz) = Gem%” (z>O), (64
@l(z)=S;ekl’+S’;e -k’=+@y(~) (Oaza-Z,), (6b)
~2(z)=~~ek2(Z+‘l)+~~e-k2(Z+f1)+~~(~)
(-l,>zz=-1,-l,), (64 aa, =Bekb(z+11f'2) (z< - I1 - z2), (64
where G, S; , Sy , Si f Sq ,. and B are integration constants and @f(z), (a$(~> are particular solutions.
The integration constants can be found by solving the system of six equations with complex parameters. The sys- tem is numerically solved using a matrix method.
B. Thermal sources in the PA cell
It is necessary to know the following optical character- istics for the two layers of the sample: Ri , the reflectivity of layer i, and pi, the volume absorption of layer i. If the mul- tireflection and light scattering are neglected, then the inci- dent optical intensities on the surface boundary are
lol=I(0)=(l-R,)f,, (74
lo2=I( - Zl) =loles alzl,~ (To)
ZOh=l(-Z1-Z2)=Zo2e . -“& (7c) The thermal source in layer 1 is given by the relation
Hl(z,t)=HIenlz’ (O&z&-Z,). G3! Here,
HI=VI $0,
J. Appl. Phys., Vol. 76, No. 7, 1 October 1994 Todorovib et al. 4013

and 7~~ is the quantum efficiency of layer i. It is supposed that the substrate is an insulator and has no expressive carrier transport characteristics.
For the second layer (thin film) it is supposed that it has a well-expressed transport characteristic because it is a semi- conducting layer. It is also assumed that the excitation energy is greater than the energy gap E, . That mepns that the exci- tation energy can generate electrons from the valence energy band. The carrier of this optical generation is then An(z,t) =Ap(z,t). These free carriers will give off the excess en- ergy (E-E& to the crystal lattice. Thermalization of the carriers takes place in a very short time interval (10-r* s) and it is responsible for the appearance of a fast thermal source:
H~(z)=H~ea2(‘+‘l) (-Z122~--Z1--12), (9)
where
ff2 E-E, H;=772 --‘02YG E 7
K2
where yG is the the quantum efficiency of generation. Thermalized carriers can diffuse through the semicon-
ducting layer with an ambipolar diffusion D and after time r they recombine. This recombination process is in most cases nonradiative, e.g., the whole energy excess transfers into heat. According to this, it is possible to define a new slow thermal source:
H$(z)=H; An(z) (-Z,~z~-Z1-Zz),
where
(10)
H;=gyR 2 2
and yR is the coefficient of recombination. Only the linear volume recombination was taken account for small levels of optical excitation.
The surface heat sources also exist as a consequence of the surface carrier recombination on the surface of layer 2:
H~=SiEg An(-Zi), i=2,b, (11)
where s2 is the velocity of the surface recombination in the front and sb the sample recombination velocity on the rear side of layer 2.
I
It is necessary to determine the distribution of the carrier density An(z) in the semiconducting layer when one wants to determine the heat source as a result of the surface and volume recombination.
C.. Carrier density distribution
A model of the bipolar semiconductor when the space charge can be neglected will be considered (the energy band bending on the surface layer is less than 0.5 eV). It will also be supposed that the carriers are generated only in the semi- conducting layer. A similar problem for a single layer was considered by Miranda.” Then it was possible to use the following diffusion equation for the distribution of the carrier density:
where (12)
DT L;= ___ l-?-jwr
is the diffusion length of free carriers. The distribution of the carriers is then given by the relation
An(z)=A+ exp( 2) +A- exp( - 2) +An,(zj,
(13) where A + and A _ are integration constants and An,(z) is the particular integral. For this carrier density distribution there exist the following limiting conditions, which can be used to calculate the values of A .+ and A _ :
D $ Att(Zjlz,-I,= -s2 ATZ( -II), WW
d D - An(z)]ZL-[l-[2=sb An(-Zr-I,). dz (14b)
Analytical solutions for the integration constants are
05)
where
s D A,= u&--8*) ” %’
6= ff&D , uD= -, LD
D fJ-.= - ’ SiLD’
i=2,b.
H2(zj=Ht exp[a?(z+Z,)]+H,+ exp
+H,- exp (16)
It is now possible to define the analytical relation for the heat source in layer 2:
4014 J. Appl. Phys., Vol. 76, No. 7, 1 October 1994
where
Todorovd et al.

%!I02 3% Hr=72 ___I 2K9 I
YREG Hr’=y-A2.
27
D. Thermodiffusion mechanism
Using the previously defined model we calculated the Integration constants can be found by solving the system temperature field in the PA cell for the two-layer sample. The of four equations with complex parameters. The system is temperature distribution enables the calculation of the PA numerically solved using a matrix method. The calculated signal which originated from the thermodiffusion mecha- displacement distribution in the two-layer sample enables nism. In accordance with the Rosencwaig-Gersho theory, one to obtain the PA signal which originated from the ther- the PA signal on the boundary surface s? - b is moelastic mechanism.
STD(-II-z2,0)=Ct(W)~DZ(-z1-12,W),
where
(17) lo”
10”’
105
7 106
24
s 1o-7 2 g 10-a
; 10-q
I I
--., I.._
r
“\\ I. ‘y
\ ‘y I. *. -\
\ \< .\ . \< ‘I .\
(a) _ Y
.~ ;. ,:
.~.
C,(w)=-y 21_ p To k,l, ’
with y, the specific heat ratio, PO the ambient pressure, and To the ambient temperature.
E. Thermoelastic mechanism
A theoretical analysis of the thermoelastic mechanism of the generation of a PA signal requires knowledge of the am- plitude and phase of elastic waves, i.e., knowledge of the distribution of the stress o-(z) and strain e(z). The ther- moeIastic generation mechanism is analyzed for the case of a two-layer sample. The stress-strain relation for the isotropic body, using the thermoelastic theory, can be defined as
~i[z)=(hi+2~i)[Ei(Z)-Pi~i(Z)], (i= 1,2). (18)
where Ai and pi are elastic constants of layer i and pi is the coefficient of the thermal volume extension. Then the strain is given as
where rli(t) is the displacement of the volume element. The equation of the volume element motion is
2 i ! %&+q? UiCz>=Pi $ @i(z),
where qi= w/vi is the propagation constant of elastic waves and v~=(l/pi)(Xi+2pi) is the velocity of elastic waves.
If it is now supposed that gas (air! is on both sides of the sample, then the sample can be considered free from the mechanical point of view, i.e., there is no stress of the bound- aries:
cr,(O)=a,(-z~--z*)=0. (21a)
On the film-substrate boundary surface, t= - Zt are
q1--~1)=~*(-~1L ~lc--~1)=~2(-~l). G-j
The solution of the system (20) using boundary conditions (21a) and (21bj is
u,(z)=U:eiqlz+Ure-jQ1z+u~(Z) (oz3z2=-jI), (224
K2(t) = u~eisz(~+b)+ U;e-j&+ll)+u$(z)
(- II aza - II- Z*), (22b)
where Ui+ are integration constants and up are particular solutions.
;.. *-__
. . ‘-..__
‘y . . .a.
I-.__ ‘x.
.A. -_ ---. %. . .
--.. -..._ *. ‘...
Y-
-. .._. 10-10 -
*. -. -.
\\ . .
-.
10-l’ - ‘*..
‘-._ -...
l&;oL---------- --
J ’ ’ 8’11-1 ’ L1L-J 1 102 103 104
f [Hz1
100, n I I I
-3s&---A----u-’ 1 f t f I ’ 102 103 104
f [Hz1
FIG. 2. Theoretical (a) amplitude and (b) phase PA spectra of a two-layer sample (the Mm-substrate sample position): --, thermodiffusion component; -.-, thermoelastic and -, total PA signal.
J. Appl. Phys., Vol. 76, No. 7, 1 October 1994 Todorovid et al. 4015
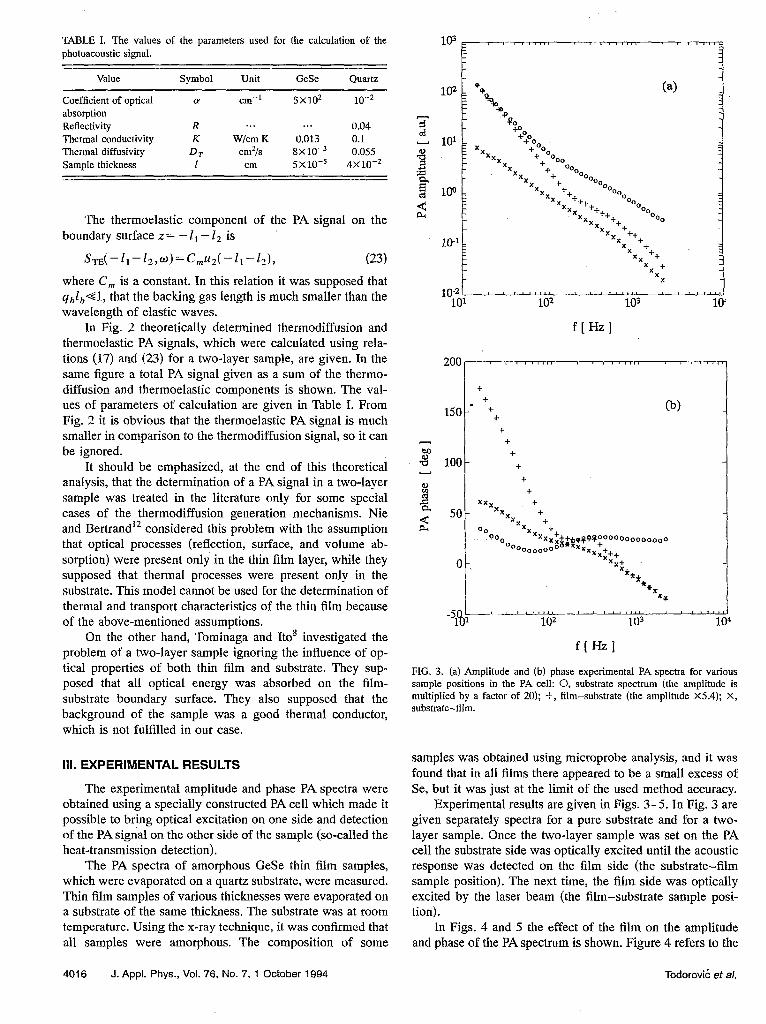
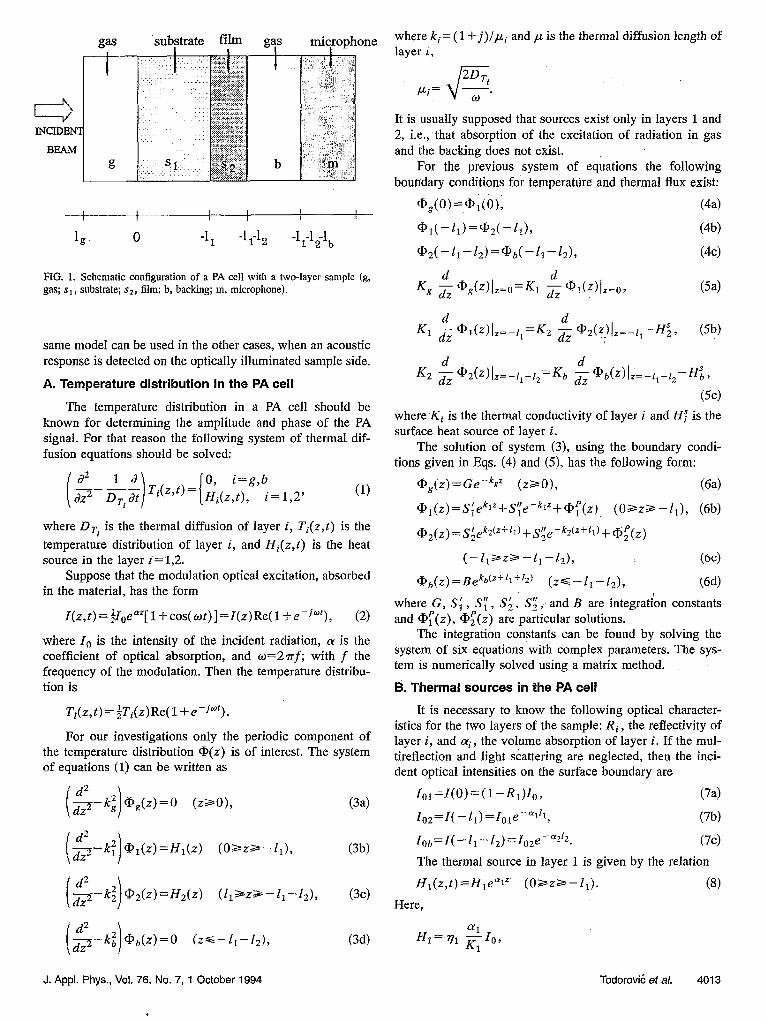
TABLE I. The values of the parameters used for the calculation of the photoacoustic signal.
Value
Coefficient of optical absorption Reflectivity Thermal conductivity Thermal diffusivity Sample thickness
Symbol Unit GeSe Quartz
Q cm‘.’ sx102 10-Z
R . . . . . . 0.04 K W/cm K 0.013 0.1
DT cm% 8X1O-3 0.055 1 cm 5x10⁻⁵ 4x10⁻²
The thermoelastic component of the PA signal on the boundary surface z= -11-l2 is
where C, is a constant. In this relation it was supposed that q$,-=%l, that the backing gas length is much smaller than the wavelength of elastic waves.
In Fig. 2 theoretically determined thermodiffusion and thermoelastic PA signals, which were calculated using rela- tions (17) and (23) for a two-layer sample, are given. In the same figure a total PA signal given as a sum of the thermo- diffusion and thermoelastic components is shown. The val- ues of parameters of calculation are given in Table I. From Fig. 2 it is obvious that the thermoelastic PA signal is much smaller in comparison to the thermodiffusion signal, so it can be ignored.
It should be emphasized, at the end of this theoretical analysis, that the determination of a PA signal in a two-layer sample was treated in the literature only for some special cases of the thermodiffusion generation mechanisms. Nie and Bertrand” considered this problem with the assumption that optical processes (retlection, surface, and volume ab- sorption) were present only in the thin film layer, while they supposed that thermal processes were present only in the substrate. This model cannot be used for the determination of thermal and transport characteristics of the thin film because of the above-mentioned assumptions.
On the other hand, Tominaga and Ito’ investigated the problem of a two-layer sample ignoring the influence of op- tical properties of both thin film and substrate. They sup- posed that all optical energy was absorbed on the film- substrate boundary surface. They also supposed that the background of the sample was a good thermal conductor, which is not fulfilled in our case.
Ill. EXPERIMENTAL RESULTS
The experimental amplitude and phase PA spectra were obtained using a specially constructed PA cell which made it possible to bring optical excitation on one side and detection of the PA signal on the other side of the sample (so-called the heat-transmission detection).
The PA spectra of amorphous GeSe thin film samples, which were evaporated on a quartz substrate, were measured. Thin film samples of various thicknesses were evaporated on a substrate of the same thickness. The substrate was at room temperature. Using the x-ray technique, it was confirmed that all samples were amorphous. The composition of some
103 I 7-1 IL1181
(a>
7 ; %*.P
+b
2 101 = xx +oo
++%, -
3 + 0
- xx 5 + %o f .s xx + 00
8 5 + %.
+ 00 100 = 5 Xx ++ o%.
d Xx ++ ft 0.3
% ++ % xx ++
00 Xx ++ %I
10-l = xx t+ 5 +
xx + *x ++
x f xY 10” -L.- a ( r * * ‘I’
10’ - 3 s ‘ii2 103 10:
f[Hzl
200
r-
-c--T 5 1 2 3 5 b I I -7-7
+ -I (b)
i
c I + + I
g 100 c
+
I -%
‘-I_I_LILL-‘-LuL----’ 8 x **I*, 102 10s 10”
f[Hzl FIG. 3. [a) Amplitude and (b) phase experimental PA spectra for various sample positions in the PA cell: 0, substrate spectrum (the amplitude is multiplied by a factor of 20); f, film-substrate (the amplitude X5.4); X, substrate-film.
samples was obtained using microprobe analysis, and it was found that in all films there appeared to be a small excess of Se, but it was just at the limit of the used method accuracy.
Experimental results are given in Figs. 3-5. In Fig. 3 are given separately spectra for a pure substrate and for a two- layer sample. Once the two-layer sample was set on the PA cell the substrate side was optically excited until the acoustic response was detected on the film side (the substrate-film sample position). The next time, the film side was optically excited by the laser beam (the film-substrate sample posi- tion).
In Figs. 4 and 5 the effect of the film on the amplitude and phase of the PA spectrum is shown. Figure 4 refers to the
4016 J. Appl. Phys., Vol. 76, No. 7, 1 October 1994 Todorovi6 et al.
‘qdot-uiLy^‘;;it- ’ ’ ’ ’ ’ ‘ib; L-* 4 1031 1 10’ 102 103 104
f tHz1 f [Hz1
400 I-=--
-l--m-7-T 5 11,11d1 -7---r-
--7
x
(b) -
350
300
250
200
150
nX T++ x ++
x x
x x
x x
:! x x
x +
-20 1 x x
-I
i ltj$* ----I ’ I 8 I * *In 102 --&- ,l -J
103 I- 104 ~31L,.Lx:yLyyJ
1 102 103 104
f [Hz1 f [Hz1
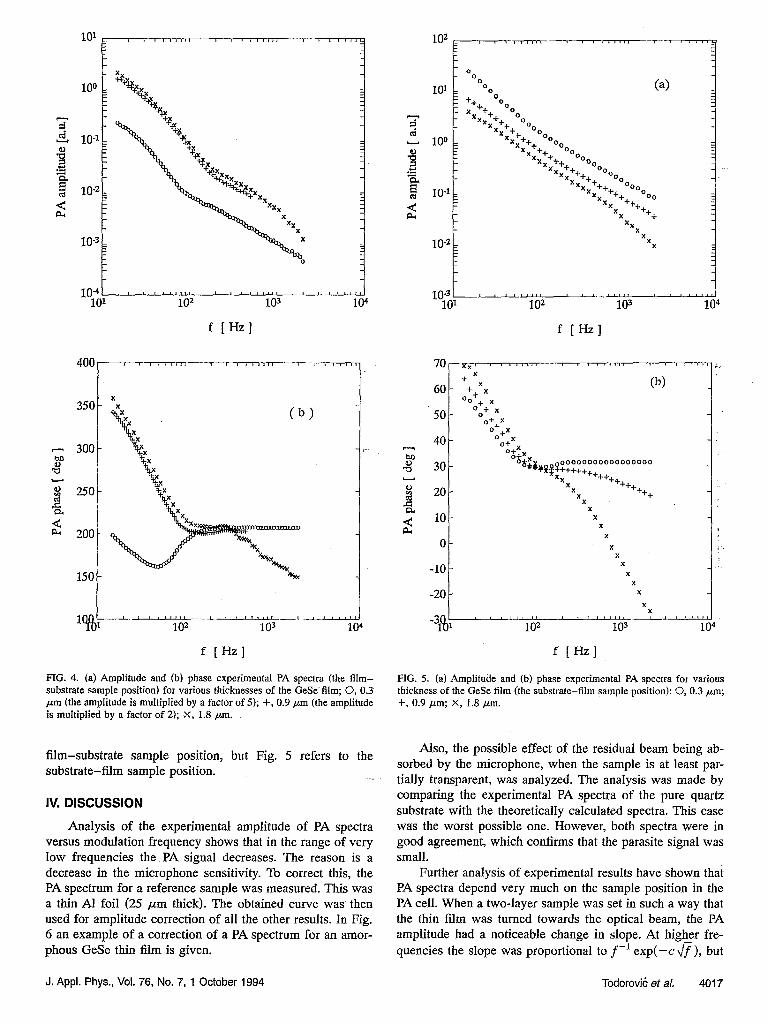
FIG. 4. (a) Amplitude and (b) phase experimental PA spectra (the film- substrate sample position) for various thicknesses of the GeSe film; 0, 0.3 pm (the amplitude is multiplied by a factor of 5); +, 0.9 pm (the amplitude is multiplied by a factor of 2); X, 1.8 q.
FIG. 5. (a) Amplitude and (b) phase experimental PA spectra for various thickness of the GeSe film (the substrate-film sample position): 0,0.3 pm; t, 0.9 pm; X, 1.8 pm.
film-substrate sample position, but Fig. 5 refers to the Also, the possible effect of the residual beam being ab-
substrate-film sample position. sorbed by the microphone, when the sample is at least par- tially transparent, was analyzed. The analysis was made by
Iv. DlSCUSSlON
Analysis of the experimental amplitude of PA spectra versus modulation frequency shows that in the range of very low frequencies the PA signal decreases. The reason is a decrease in the microphone sensitivity. To correct this, the PA spectrum for a reference sample was measured. This was a thin AI foil (25 ,um thick). The obtained curve was then used for amplitude correction of all the other results. In Fig. 6 an example of a correction of a PA spectrum for an amor- phous GeSe thin f?lm is given.
comparing the experimental PA spectra of the pure quarti substrate with the theoretically calculated spectra. This case was the worst possible one. However, both spectra were in good agreement, which confirms that the parasite signal was small.
Further analysis of experimental results have shown that PA spectra depend very much on the sample position in the PA cell When a two-layer sample was set in such a way that the thin film was turned towards the optical beam, the PA amplitude had a noticeable change in slope. At higher fre- quencies the slope was proportional to f-’ exp(-cfi), but
J. Appl. Phys., Vol. 76, No. 7, 1 October 1994 Todorovi6 et al. 4017

10’ =
-z cd
2 100 = “a 9
d 10-I =
lOizot--Wb f [Hz1
FIG. 6. Amplitude PA spectra correction of a quartz-GeSe thin film sample: 0, noncorrected spectrum; -, corrected spectrum.
at frequencies lower than 80 Hz the slope was proportional to f-‘.5 [Fig. 4(a)]. The shape of the curve depended mainly on the substrate characteristics. This is obvious because the thin GeSe film appears as an absorbing layer. Thin film can- not have a large influence on the PA signal with its thermal and transport characteristics. However, the GeSe thin film could affect the PA signal with its optical properties. The phase PA spectra confirm this [Fig. 4(b)], because they prac- tically do not change for two different film thicknesses (Zf=0.9 and 1.8 pm), but they differ quite a lot for the thin- nest film (Z5=0.3 pm).
These photoacoustic behaviors can be explained with the following sample model. The measured GeSe thin films were much thinner than the substrate. Then, from an optical point of view, the thin film characteristics can be presented effec- tively with the surface ‘optical absorption coefficient, c$= CX&~. In consideration of the film thickness If= 10e4 cm and the coefficient of the volume optical absorption af=5X 10’ cm-l, the surface optical coefficient obtained is aq=O.O5.
With respect to thermal properties, the two-layer sample can be considered with the effective thermal diffusivity D, .* For our case, because I= If+ 1,-Z,, the effective thermal diffusivity is D,=D, . Then, in the case of the film- substrate sample position, it is possible to view the sample as a one-layer sample with parameters I,, D, , cu, , and C$ The case of that sample with surface optical absorption was ana- lyzed by Nie and Bertrand.” They were given the relation for the temperature distribution and analyzed the photother- ma1 deflection signal on the front side of the sample (the so-called heat-rellection detection).
We have calculated the PA signal using this sample model for the signal detection on the rear side of the sample (the heat-transmission detection). Figure 7 shows the theo- retical amplitude PA signal as a function of the modulation
-LA--- L. 102 103 -ii 4
f [Hz] >
FIG. ‘7. Theoretical amplitude PA spectra as a function of the moduIation frequency for three different values of the surface optical absorption coeffi- cient: -, 0$=0.025; --, 0.05; -e-, 0.1 (model of the one-layer sample with the surface absorption).
frequency for three different values of the surface optical absorption coefficient (asf=0.025,0.05,0.1).
In this calculation, the parameter d; has been changed, and thus the film thickness has been changed effectively. The theoretical PA amplitude curves are in good agreement with experimental ones in Fig. 4(a). These theoretical curves have a slope in the log-log coordinate system of f-‘.5 for higher modulation frequency (when the optical length is much larger then the thermal diffusion length). On the other hand, for lower modulation frequencies, the PA signal has a slope of f-1 exp(-c 3 ). This analysis shows that for this sample position is not possible to obtain useful information about the thermal and transport properties of the film.
When the substrate was turned towards the optical source, and the GeSe thin film towards the acoustic detector (the substrate-film sample position) than the influence of the thin film on the PA signal became significant. In this case the amplitude of the PA signal decreased with a slope propor- tional to f-’ in the wider part of the frequency range [Fig. 5(a)]. This slope starts to increase at frequencies below 80 Hz and approaches f-*.5 for the smallest thin film thickness (0.3 pmj. The shape of this curve is very similar to the curve shape for the quartz substrate [Fig. 3(a)]. This behavior shows that it is not possible to detect accurately enough the influence of thin films with thicknesses below 0.9 pm on the amplitude of the PA signal.,
However, the phase diagram of the PA signal for this film thickness is obviously different from the phase diagram for the quartz substrate [see Figs. 3(b) and 5(b)]. These dif- ferences are increased when the thickness increases. Por film thicknesses of 1.8 ,um and modulation frequencies above 400 Hz, the slope of the PA amplitude curve increases and be- comes proportional to f-*.5 [Fig. 5(a)]. From this analysis, it
4018 J. Appl. Phys., Vol. 76, No. 7, 1 October 1994 Todorovik et al.
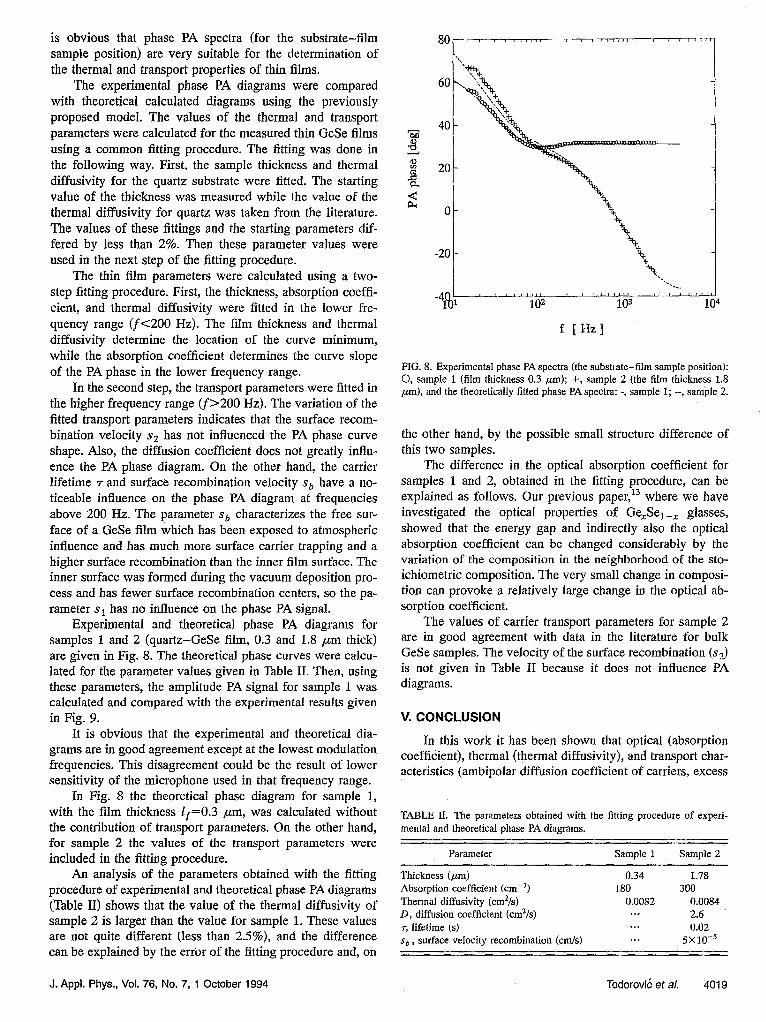
is obvious that phase PA spectra (for the substrate-film sample position) are very suitable for the determination of the thermal and transport properties of thin films.
The experimental phase PA diagrams were compared with theoretical calculated diagrams using the previously proposed model. The values of the thermal and transport parameters were calculated for the measured thin GeSe films using a common fitting procedure. The Wing was done in the following way. First, the sample thickness and thermal ditisivity for the quartz substrate were &ted. The starting value of the thickness was measured while the value of the thermal diffusivity for quartz was taken from the literature. The values of these fittings and the starting parameters dif- fered by less than 2%. Then these parameter values were used in the next step of the fitting procedure.
The thin film parameters were calculated using a two- step fitting procedure. First, the thickness, absorption coeffi- cient, and thermal diffusivity were fitted in the lower fre- quency range (fC200 Hz). The film thickness and thermal diffusivity determine the location of the curve minimum, while the absorption coefficient determines the curve slope of the PA phase in the lower frequency range.
In the second step, the transport parameters were fitted in the higher frequency range (f>200 Hz). The variation of the fitted transport parameters indicates that the surface recom- bination velocity s2 has not influenced the PA phase curve shape. Also, the diffusion coefficient does not greatly influ- ence the PA phase diagram. On the other hand, the carrier lifetime 7 and surface recombination velocity sb have a no- ticeable influence on the phase PA diagram at frequencies above 200 Hz. The parameter sb characterizes the free sur- face of a GeSe film which has been exposed to atmospheric influence and has much more surface carrier trapping and a higher surface recombination than the inner film surface. The inner surface was formed during the vacuum deposition pro- cess and has fewer surface recombination centers, so the pa- rameter s1 has no influence on the phase PA signal.
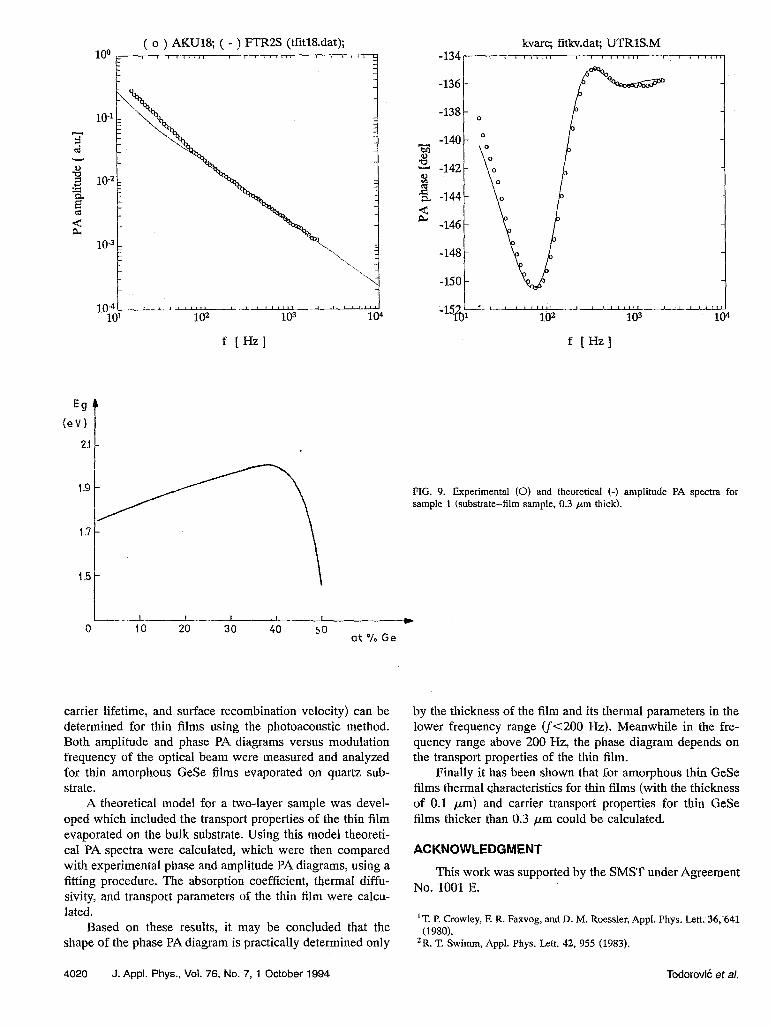
Experimental and theoretical phase PA diagrams for samples 1 and 2 (quartz-GeSe film, 0.3 and 1.8 ,um thick) are given in Fig. 8. The theoretical phase curves were calcu- lated for the parameter values given in Table II. Then, using these parameters, the amplitude PA signal for sample 1 was calculated and compared with the experimental results given in Fig. 9.
It is obvious that the experimental and theoretical dia- grams are in good agreement except at the lowest modulation frequencies. This disagreement could be the result of lower sensitivity of the microphone used in that frequency range.
In Fig. 8 the theoretical phase diagram for sample 1, with the film thickness 15=0.3 pm, was calculated without the contribution of transport parameters. On the other hand, for sample 2 the values of the transport parameters were included in the fitting procedure.
An analysis of the parameters obtained with the fitting procedure of experimental and theoretical phase PA diagrams (Table II) shows that the value of the thermal diffusivity of sample 2 is larger than the value for sample 1. These values are not quite different (less than 2.5%), and the difference can be explained by the error of the fitting procedure and, on
f [Hz1
FIG. 8. Experimental phase PA spectra (the substrate-film sample position): 0, sample 1 (film thickness 0.3 pm); f, sample 2 (the film thickness 1.8 pm), and the theoretically fitted phase PA spectra: -, sample 1; --, sample 2.
the other hand, by the possible small structure difference of this two samples.
The difference in the optical absorption coefficient for samples 1 and 2, obtained in the fitting procedure, can be explained as follows. Our previous paper,13 where we have investigated the optical properties of GeXSel -x glasses, showed that the energy gap and indirectly also the optical absorption coefficient can be changed considerably by the variation of the composition in the neighborhood of the sto- ichiometric composition. The very small change in composi- tion can provoke a relatively large change in the optical ab- sorption coefficient.
The values of carrier transport parameters for sample 2 are in good agreement with data in the literature for bulk GeSe samples. The velocity of the surface recombination (s’) is not given in Table II because it does not influence PA diagrams.
V. CONCLUSION
In this work it has been shown that optical (absorption coeffidient), thermal (thermal diffusivity), and transport char- acteristics (ambipolar diffusion coefficient of carriers, excess
TABLE II. The parameters obtained with the fitting procedure of experi- mental and theoretical phase PA diagrams.
Parameter Sample 1 Sample 2
Thickness (,um) 0.34 1.78 Absorption coefficient (.cm-‘) 180 300 Thermal ditisivity (cm’/s) 0.0082 0.0084 D, diffusion coefficient (cm’/s) ..I 2.6 q lifetime (s) . . . 0.02 sb , surface velocity recombination (cm/s) . . . 5x1o-5
J. Appl. Phys., Vol. 76, No. 7, 1 October 1994 Todorovik et al. 4019
100 ( o ) AKU18; ( - ) FTR2S (tfitl8.dat);
-r-l-w, , I ,r,rq
10-3 l.,.
‘k__ _ ,
10-4 t rll 101 102 103 104
f [Hz]
fg (eV)
21 i
kvarc; fitkv.dat; UTR1S.M -134r 1 I~1~~111
-136 i
I
IL,- ’ I I m 0 10 20 30 CO 50
at % Ge
carrier lifetime, and surface recombination velocity) can be determined for thin films using the photoacoustic method. Both amplitude and phase PA diagrams versus modulation frequency of the optical beam were measured and analyzed for thin amorphous GeSe films evaporated on quartz sub- strate.
A theoretical model for a two-layer sample was devel- oped which included the transport properties of the thin film evaporated on the bulk substrate. Using this model theoreti- cal PA spectra were calculated, which were then compared with experimental phase and amplitude PA diagrams, using a fitting procedure. The absorption coefficient, thermal diffu- sivity, and transport parameters of the thin film were calcu- lated.
by the thickness of the film and its thermal parameters in the lower frequency range (f<200 Hz). Meanwhile in the fre- quency range above 200 Hz, the phase diagram depends on the transport properties of the thin film.
Finally it has been shown that for amorphous thin GeSe films thermal characteristics for thin films (with the thickness of 0.1 pm) and carrier transport properties for thin GeSe films thicker than 0.3 pm could be calculated.
ACKNOWLEDGMENT
This work was supported by the SMST under Agreement No. 1001 E.
Based on these results, it may be concluded that the shape of the phase PA diagram is practically determined only
‘T. P. Crowley, F. R. Faxvog, and D. M. Roessler, Appl. Phys. Lett. 36;641 (1980).
‘R. T. Swimm, Appl. Phys. L&t. 42, 955 (1983).
4020 J. Appl. Phys., Vol. 76, No. 7, ‘I October 1994 Todorovik et al.
;pj L-Z-L. *-lrljl t--I ib 102 103 104
f [Hz1
flG. 9. Experimental (0) and theoretical (-) amplitude PA spectra for sample 1 (substrate-film sample, 0.3 pm thick).

“A. Lachaine and P. Poulet, Appl. Phys. I.&. 45, 953 (1984). 4W. P. Winfree, B. S. Crews, and S. Albin, in Photoacoustic and Phother-
mai Phenomena II, edited by J; Murphy, Vol. 6’2 of Springer Series in Optical Science (Springer, Heidelberg, 1990). p. 127.
‘A. Pinto Neto, H. Vargas, N. E L&to, and L. C. M. Miranda, Phys. Rev. B 40, 3924 (1989).
6A Pinto Neto. H. Vargas, N. E Leito, and L. C M. Miranda, Phys. Rev. B 4i, 9971 0990).
‘S. Vinokurov, J. Eng. Phys. 44, 50 (1983). ‘T. Tominaga and K. Ito, Jpn. J. Appl. Phys. 27, 2392 (1988). 9A. Rosencwaig and A. Gersho, J. Appl. Phys. 47, 64 (1976).
‘OF. A. McDonald and G. C. Wetsel, Jr., J. Appl. Phys. 49, 2313 (1978). “L. C Miranda, Appl. Opt. 21, 2923 (1982). “Y. X. Nie and L. B. Bertrand, J. Appl. Phys. 65, 438 (1989). 13P. M. Nikolib, S. S. Vujatovi&, Lj. MiloseviE, J. D. Collins, and G. A.
Gledhill, Solid State Commun. 72, 621 (1989).
J. Appl. Phys., Vol. 76, No. 7, 1 October 1994 Todorovid et al. 4021