Subband photoacoustic imaging for contrast improvement
12
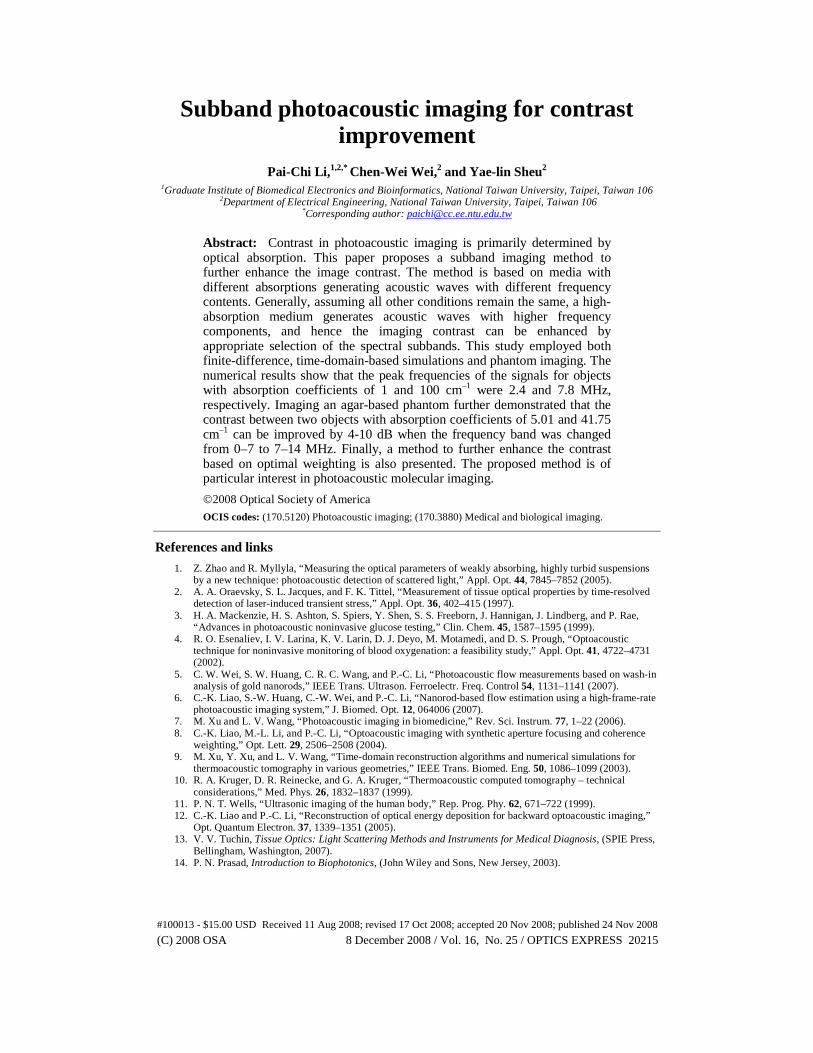
Subband photoacoustic imaging for contrast improvement Pai-Chi Li, 1,2,* Chen-Wei Wei, 2 and Yae-lin Sheu 2 1 Graduate Institute of Biomedical Electronics and Bioinformatics, National Taiwan University, Taipei, Taiwan 106 2 Department of Electrical Engineering, National Taiwan University, Taipei, Taiwan 106 * Corresponding author: [email protected] Abstract: Contrast in photoacoustic imaging is primarily determined by optical absorption. This paper proposes a subband imaging method to further enhance the image contrast. The method is based on media with different absorptions generating acoustic waves with different frequency contents. Generally, assuming all other conditions remain the same, a high- absorption medium generates acoustic waves with higher frequency components, and hence the imaging contrast can be enhanced by appropriate selection of the spectral subbands. This study employed both finite-difference, time-domain-based simulations and phantom imaging. The numerical results show that the peak frequencies of the signals for objects with absorption coefficients of 1 and 100 cm –1 were 2.4 and 7.8 MHz, respectively. Imaging an agar-based phantom further demonstrated that the contrast between two objects with absorption coefficients of 5.01 and 41.75 cm –1 can be improved by 4-10 dB when the frequency band was changed from 0–7 to 7–14 MHz. Finally, a method to further enhance the contrast based on optimal weighting is also presented. The proposed method is of particular interest in photoacoustic molecular imaging. ©2008 Optical Society of America OCIS codes: (170.5120) Photoacoustic imaging; (170.3880) Medical and biological imaging. References and links 1. Z. Zhao and R. Myllyla, “Measuring the optical parameters of weakly absorbing, highly turbid suspensions by a new technique: photoacoustic detection of scattered light,” Appl. Opt. 44, 7845–7852 (2005). 2. A. A. Oraevsky, S. L. Jacques, and F. K. Tittel, “Measurement of tissue optical properties by time-resolved detection of laser-induced transient stress,” Appl. Opt. 36, 402–415 (1997). 3. H. A. Mackenzie, H. S. Ashton, S. Spiers, Y. Shen, S. S. Freeborn, J. Hannigan, J. Lindberg, and P. Rae, “Advances in photoacoustic noninvasive glucose testing,” Clin. Chem. 45, 1587–1595 (1999). 4. R. O. Esenaliev, I. V. Larina, K. V. Larin, D. J. Deyo, M. Motamedi, and D. S. Prough, “Optoacoustic technique for noninvasive monitoring of blood oxygenation: a feasibility study,” Appl. Opt. 41, 4722–4731 (2002). 5. C. W. Wei, S. W. Huang, C. R. C. Wang, and P.-C. Li, “Photoacoustic flow measurements based on wash-in analysis of gold nanorods,” IEEE Trans. Ultrason. Ferroelectr. Freq. Control 54, 1131–1141 (2007). 6. C.-K. Liao, S.-W. Huang, C.-W. Wei, and P.-C. Li, “Nanorod-based flow estimation using a high-frame-rate photoacoustic imaging system,” J. Biomed. Opt. 12, 064006 (2007). 7. M. Xu and L. V. Wang, “Photoacoustic imaging in biomedicine,” Rev. Sci. Instrum. 77, 1–22 (2006). 8. C.-K. Liao, M.-L. Li, and P.-C. Li, “Optoacoustic imaging with synthetic aperture focusing and coherence weighting,” Opt. Lett. 29, 2506–2508 (2004). 9. M. Xu, Y. Xu, and L. V. Wang, “Time-domain reconstruction algorithms and numerical simulations for thermoacoustic tomography in various geometries,” IEEE Trans. Biomed. Eng. 50, 1086–1099 (2003). 10. R. A. Kruger, D. R. Reinecke, and G. A. Kruger, “Thermoacoustic computed tomography – technical considerations,” Med. Phys. 26, 1832–1837 (1999). 11. P. N. T. Wells, “Ultrasonic imaging of the human body,” Rep. Prog. Phy. 62, 671–722 (1999). 12. C.-K. Liao and P.-C. Li, “Reconstruction of optical energy deposition for backward optoacoustic imaging,” Opt. Quantum Electron. 37, 1339–1351 (2005). 13. V. V. Tuchin, Tissue Optics: Light Scattering Methods and Instruments for Medical Diagnosis, (SPIE Press, Bellingham, Washington, 2007). 14. P. N. Prasad, Introduction to Biophotonics, (John Wiley and Sons, New Jersey, 2003). #100013 - $15.00 USD Received 11 Aug 2008; revised 17 Oct 2008; accepted 20 Nov 2008; published 24 Nov 2008 (C) 2008 OSA 8 December 2008 / Vol. 16, No. 25 / OPTICS EXPRESS 20215
Transcript of Subband photoacoustic imaging for contrast improvement
Subband photoacoustic imaging for contrast improvement
Pai-Chi Li,1,2,* Chen-Wei Wei,2 and Yae-lin Sheu2 1Graduate Institute of Biomedical Electronics and Bioinformatics, National Taiwan University, Taipei, Taiwan 106
2Department of Electrical Engineering, National Taiwan University, Taipei, Taiwan 106 *Corresponding author: [email protected]
Abstract: Contrast in photoacoustic imaging is primarily determined by optical absorption. This paper proposes a subband imaging method to further enhance the image contrast. The method is based on media with different absorptions generating acoustic waves with different frequency contents. Generally, assuming all other conditions remain the same, a high-absorption medium generates acoustic waves with higher frequency components, and hence the imaging contrast can be enhanced by appropriate selection of the spectral subbands. This study employed both finite-difference, time-domain-based simulations and phantom imaging. The numerical results show that the peak frequencies of the signals for objects with absorption coefficients of 1 and 100 cm–1 were 2.4 and 7.8 MHz, respectively. Imaging an agar-based phantom further demonstrated that the contrast between two objects with absorption coefficients of 5.01 and 41.75 cm–1 can be improved by 4-10 dB when the frequency band was changed from 0–7 to 7–14 MHz. Finally, a method to further enhance the contrast based on optimal weighting is also presented. The proposed method is of particular interest in photoacoustic molecular imaging.
©2008 Optical Society of America
OCIS codes: (170.5120) Photoacoustic imaging; (170.3880) Medical and biological imaging.
References and links
1. Z. Zhao and R. Myllyla, “Measuring the optical parameters of weakly absorbing, highly turbid suspensions by a new technique: photoacoustic detection of scattered light,” Appl. Opt. 44, 7845–7852 (2005).
2. A. A. Oraevsky, S. L. Jacques, and F. K. Tittel, “Measurement of tissue optical properties by time-resolved detection of laser-induced transient stress,” Appl. Opt. 36, 402–415 (1997).
3. H. A. Mackenzie, H. S. Ashton, S. Spiers, Y. Shen, S. S. Freeborn, J. Hannigan, J. Lindberg, and P. Rae, “Advances in photoacoustic noninvasive glucose testing,” Clin. Chem. 45, 1587–1595 (1999).
4. R. O. Esenaliev, I. V. Larina, K. V. Larin, D. J. Deyo, M. Motamedi, and D. S. Prough, “Optoacoustic technique for noninvasive monitoring of blood oxygenation: a feasibility study,” Appl. Opt. 41, 4722–4731 (2002).
5. C. W. Wei, S. W. Huang, C. R. C. Wang, and P.-C. Li, “Photoacoustic flow measurements based on wash-in analysis of gold nanorods,” IEEE Trans. Ultrason. Ferroelectr. Freq. Control 54, 1131–1141 (2007).
6. C.-K. Liao, S.-W. Huang, C.-W. Wei, and P.-C. Li, “Nanorod-based flow estimation using a high-frame-rate photoacoustic imaging system,” J. Biomed. Opt. 12, 064006 (2007).
7. M. Xu and L. V. Wang, “Photoacoustic imaging in biomedicine,” Rev. Sci. Instrum. 77, 1–22 (2006). 8. C.-K. Liao, M.-L. Li, and P.-C. Li, “Optoacoustic imaging with synthetic aperture focusing and coherence
weighting,” Opt. Lett. 29, 2506–2508 (2004). 9. M. Xu, Y. Xu, and L. V. Wang, “Time-domain reconstruction algorithms and numerical simulations for
thermoacoustic tomography in various geometries,” IEEE Trans. Biomed. Eng. 50, 1086–1099 (2003). 10. R. A. Kruger, D. R. Reinecke, and G. A. Kruger, “Thermoacoustic computed tomography – technical
considerations,” Med. Phys. 26, 1832–1837 (1999). 11. P. N. T. Wells, “Ultrasonic imaging of the human body,” Rep. Prog. Phy. 62, 671–722 (1999). 12. C.-K. Liao and P.-C. Li, “Reconstruction of optical energy deposition for backward optoacoustic imaging,”
Opt. Quantum Electron. 37, 1339–1351 (2005). 13. V. V. Tuchin, Tissue Optics: Light Scattering Methods and Instruments for Medical Diagnosis, (SPIE Press,
Bellingham, Washington, 2007). 14. P. N. Prasad, Introduction to Biophotonics, (John Wiley and Sons, New Jersey, 2003).
#100013 - $15.00 USD Received 11 Aug 2008; revised 17 Oct 2008; accepted 20 Nov 2008; published 24 Nov 2008
(C) 2008 OSA 8 December 2008 / Vol. 16, No. 25 / OPTICS EXPRESS 20215
15. P.-C. Li, C.-W. Wei, C.-K. Liao, C.-D. Chen, K.-C. Pao, C.-R. C. Wang, Y.-N. Wu, and D.-B. Shieh, “Photoacoustic imaging of multiple targets using gold nanorods,” IEEE Trans. Ultrason. Ferroelectr. Freq. Control 54, 1642–1647 (2007).
16. J. A. Copland, M. Eghtedari, V. L. Popov, N. Kotov, N. Mamedova, M. Motamedi, and A. A. Oraevsky, “Bioconjugated gold nanoparticles as a molecular based contrast agent: implications for imaging of deep tumors using optoacoustic tomography,” Mol. Imaging Biol. 6, 341–349 (2004).
17. Y. Wang, X. Xie, X. Wang, G. Ku, K. L. Gill, D. P. O’Neal, G. Stoica, and L. V. Wang, “Photoacoustic tomography of a nanoshell contrast agent in the in vivo rat brain,” Nano Lett. 4, 1689–1692 (2004).
18. V. E. Gusev and A. A. Karabutov, Laser Optoacoustics, (American Institute of Physics, New York, 1993) Chap 2, pp 45–48.
19. D.-H. Huang, C.-K. Liao, C.-W. Wei, and P.-C. Li, “Simulations of optoacoustic wave propagation in light-absorbing media using a finite-difference time-domain method,” J. Acoust. Soc. Am. 117, 2795–2801 (2005).
20. P. F. Stetson, F. G. Sommer, and A. Macovski, “Lesion contrast enhancement in medical ultrasound imaging,” IEEE Trans. Med. Imaging 16, 416–425 (1997).
1. Introduction
The photoacoustic process involves the transformation of optical energy – generally from a short laser pulse – into acoustic energy and the subsequent outward propagation of an acoustic wave. The amplitude of a photoacoustic signal is dominated by the medium-absorbed energy, while the spectral characteristics are determined by several factors including laser duration, optical absorption properties of the medium and geometry of the absorber [1, 2]. The photoacoustic signal also depends on the acoustic properties of the medium. This has prompted investigations of new photoacoustics-based biomedical applications, including glucose concentration measurements [3], blood-oxygen level measurements [4], blood flow measurements [5, 6], and imaging [7, 8].
Several algorithms have been proposed for reconstructing the optical absorption using the detected photoacoustic waves [9, 10]. However, practical applications of these reconstruction algorithms have been limited by the requirement to place the acoustic detectors around the object of interest. Therefore, the pulse-echo ultrasonography type of cross-sectional imaging (i.e., backward-mode imaging) is still often performed without quantitative reconstruction of the optical absorption distribution [11, 12], with the detected acoustic pressure instead being directly converted into the pixel brightness in the image.
The main purpose of this study was to determine the potential of a new contrast enhancement method in this type of imaging situation (i.e., where images are constructed directly from detected acoustic data), which utilizes the spectral characteristics of the photoacoustic signal. The energy from a laser irradiating a homogeneous medium is absorbed, decaying with distance of penetration, with this being more rapid in a medium with a higher absorption coefficient. The decay profile along the depth determines the pressure distribution that generates an acoustic signal that propagates outward. The faster decay in the pressure waveform in an object with higher absorption results in the propagated photoacoustic signal containing higher frequency components. Other factors that affect the photoacoustic spectrum include the absorber geometry, laser duration and laser spot size. For example, when the size of the absorber is comparable to the optical penetration depth, diffraction effects also affect the spectral characteristics of the photoacoustic signal. Nonetheless, given the same absorber geometry, a higher absorption coefficient still results in higher frequency components in the spectrum. Likewise, effects of the laser pulse duration and the laser beam size can be similarly characterized. Assuming all parameters are fixed except for the optical absorption coefficient, the spectrum of the detected photoacoustic signal can be divided into multiple subbands, each of which corresponds to a certain range of absorption coefficients. The contrast can then be enhanced by appropriately selecting and combining the subbands that correspond to the signal of interest.
The absorption coefficients of biological tissues vary over a wide range [13, 14], from 2.3 cm–1 at 800 mm for dermis, 2.6 cm–1 at 1064 nm for subcutaneous fat, 9.3 cm–1 at 965 nm for whole blood, to 40 cm–1 at 800 nm for epidermis. In addition to the endogenous optical contrast, the exogenous contrast has also been used in photoacoustic measurements and
#100013 - $15.00 USD Received 11 Aug 2008; revised 17 Oct 2008; accepted 20 Nov 2008; published 24 Nov 2008
(C) 2008 OSA 8 December 2008 / Vol. 16, No. 25 / OPTICS EXPRESS 20216
imaging [5, 15–17]. For example, gold nanoparticles have been used for flow estimation [5] and tumor targeting by molecular imaging [15, 16]. Therefore, the method developed in this study can also be utilized to improve image contrast when a contrast agent is used. This paper also presents a method for combining images from different subbands with optimal weighting for further improving the contrast.
2. Materials and methods
2.1 Numerical analysis
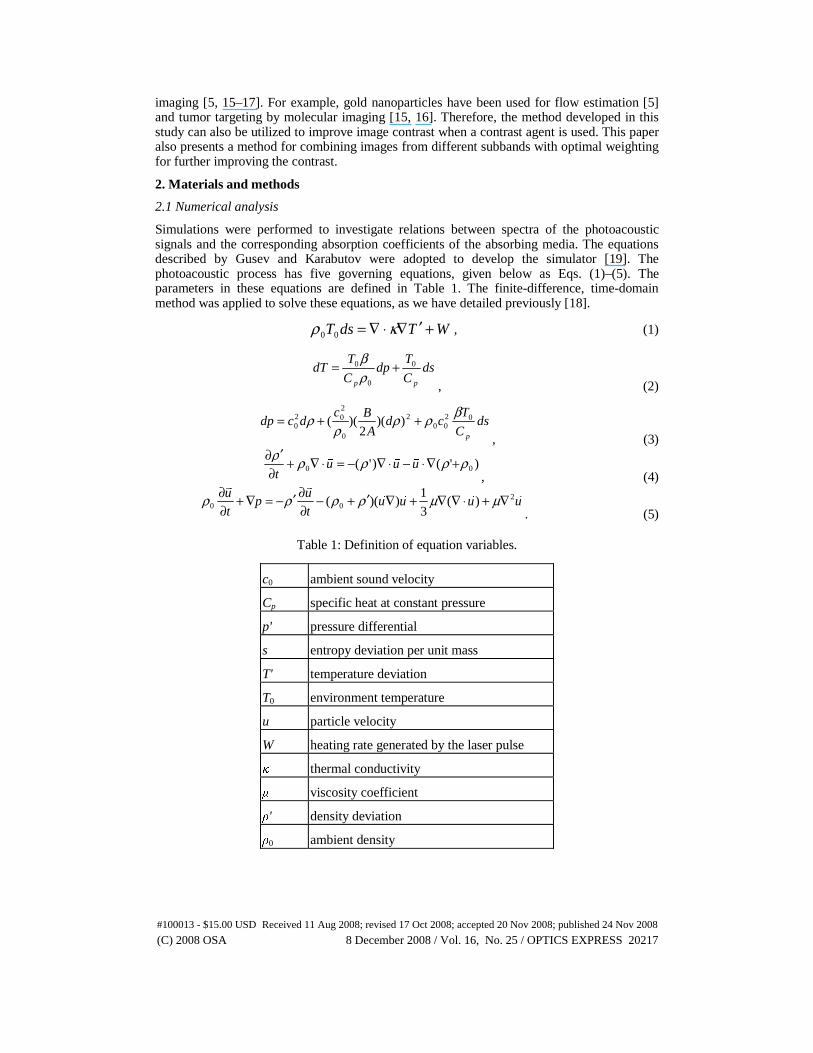
Simulations were performed to investigate relations between spectra of the photoacoustic signals and the corresponding absorption coefficients of the absorbing media. The equations described by Gusev and Karabutov were adopted to develop the simulator [19]. The photoacoustic process has five governing equations, given below as Eqs. (1)–(5). The parameters in these equations are defined in Table 1. The finite-difference, time-domain method was applied to solve these equations, as we have detailed previously [18].
WTdsT +′∇⋅∇= κρ 00 , (1)
dsC
Tdp
C
TdT
pp
0
0
0 +=ρβ
, (2)
dsC
Tcd
A
Bcdcdp
p
0200
2
0
202
0 ))(2
)((βρρ
ρρ ++=
, (3)
)'()'( 00 ρρρρρ +∇⋅−⋅∇−=⋅∇+∂
′∂uuu
t
���
, (4)
uuuut
up
t
u ����
��
200 )(
3
1))(( ∇+⋅∇∇+∇′+−
∂∂′−=∇+
∂∂ μμρρρρ
. (5)
Table 1: Definition of equation variables.
c0 ambient sound velocity
Cp specific heat at constant pressure
p' pressure differential
s entropy deviation per unit mass
T' temperature deviation
T0 environment temperature
u particle velocity
W heating rate generated by the laser pulse
κ thermal conductivity
μ viscosity coefficient
ρ' density deviation
ρ0 ambient density
#100013 - $15.00 USD Received 11 Aug 2008; revised 17 Oct 2008; accepted 20 Nov 2008; published 24 Nov 2008
(C) 2008 OSA 8 December 2008 / Vol. 16, No. 25 / OPTICS EXPRESS 20217
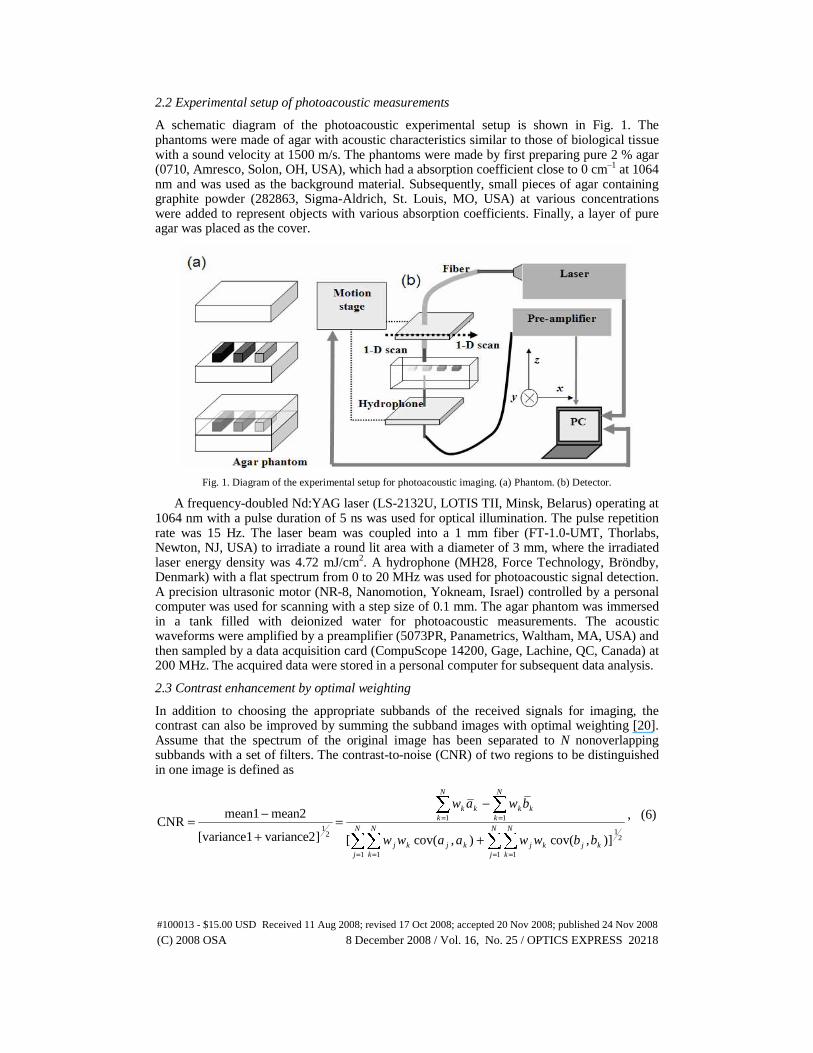
2.2 Experimental setup of photoacoustic measurements
A schematic diagram of the photoacoustic experimental setup is shown in Fig. 1. The phantoms were made of agar with acoustic characteristics similar to those of biological tissue with a sound velocity at 1500 m/s. The phantoms were made by first preparing pure 2 % agar (0710, Amresco, Solon, OH, USA), which had a absorption coefficient close to 0 cm–1 at 1064 nm and was used as the background material. Subsequently, small pieces of agar containing graphite powder (282863, Sigma-Aldrich, St. Louis, MO, USA) at various concentrations were added to represent objects with various absorption coefficients. Finally, a layer of pure agar was placed as the cover.
Fig. 1. Diagram of the experimental setup for photoacoustic imaging. (a) Phantom. (b) Detector.
A frequency-doubled Nd:YAG laser (LS-2132U, LOTIS TII, Minsk, Belarus) operating at 1064 nm with a pulse duration of 5 ns was used for optical illumination. The pulse repetition rate was 15 Hz. The laser beam was coupled into a 1 mm fiber (FT-1.0-UMT, Thorlabs, Newton, NJ, USA) to irradiate a round lit area with a diameter of 3 mm, where the irradiated laser energy density was 4.72 mJ/cm2. A hydrophone (MH28, Force Technology, Bröndby, Denmark) with a flat spectrum from 0 to 20 MHz was used for photoacoustic signal detection. A precision ultrasonic motor (NR-8, Nanomotion, Yokneam, Israel) controlled by a personal computer was used for scanning with a step size of 0.1 mm. The agar phantom was immersed in a tank filled with deionized water for photoacoustic measurements. The acoustic waveforms were amplified by a preamplifier (5073PR, Panametrics, Waltham, MA, USA) and then sampled by a data acquisition card (CompuScope 14200, Gage, Lachine, QC, Canada) at 200 MHz. The acquired data were stored in a personal computer for subsequent data analysis.
2.3 Contrast enhancement by optimal weighting
In addition to choosing the appropriate subbands of the received signals for imaging, the contrast can also be improved by summing the subband images with optimal weighting [20]. Assume that the spectrum of the original image has been separated to N nonoverlapping subbands with a set of filters. The contrast-to-noise (CNR) of two regions to be distinguished in one image is defined as
21
1 1 11
1 1
21
]),cov(),cov([] variance2 [variance1
mean2mean1CNR
∑ ∑∑∑
∑ ∑
= = ==
= =
+
−=
+
−=N
j
N
j
N
kkjkj
N
kkjkj
N
k
N
kkkkk
bbwwaaww
bwaw, (6)
#100013 - $15.00 USD Received 11 Aug 2008; revised 17 Oct 2008; accepted 20 Nov 2008; published 24 Nov 2008
(C) 2008 OSA 8 December 2008 / Vol. 16, No. 25 / OPTICS EXPRESS 20218
where wk is the weighting of the k-th subband image, ak and bk are the first and second regions in the k-th subband image, x is the mean of x, and cov(xj, xk) is the covariance between xj and xk. The CNR can be rewritten as
21T )(
CNRKww
cwT
=, (7)
where
[ ]Tnwwww ,...,, 21= (8)
is the weighting vector for the n subband images, and
[ ]Tnn babac −−= ,...,11 (9)
is the contrast vector. Let K be the sum of the covariance matrices of the two regions. Taking the first differential of the CNR with respect to w yields the values of w corresponding to the extreme CNR . In this regard, w can be solved as
cKw 1−= α , (10)
where K–1 is the inverse of K and α is a scaling factor.
3. Simulation and experimental results
3.1 Simulation results
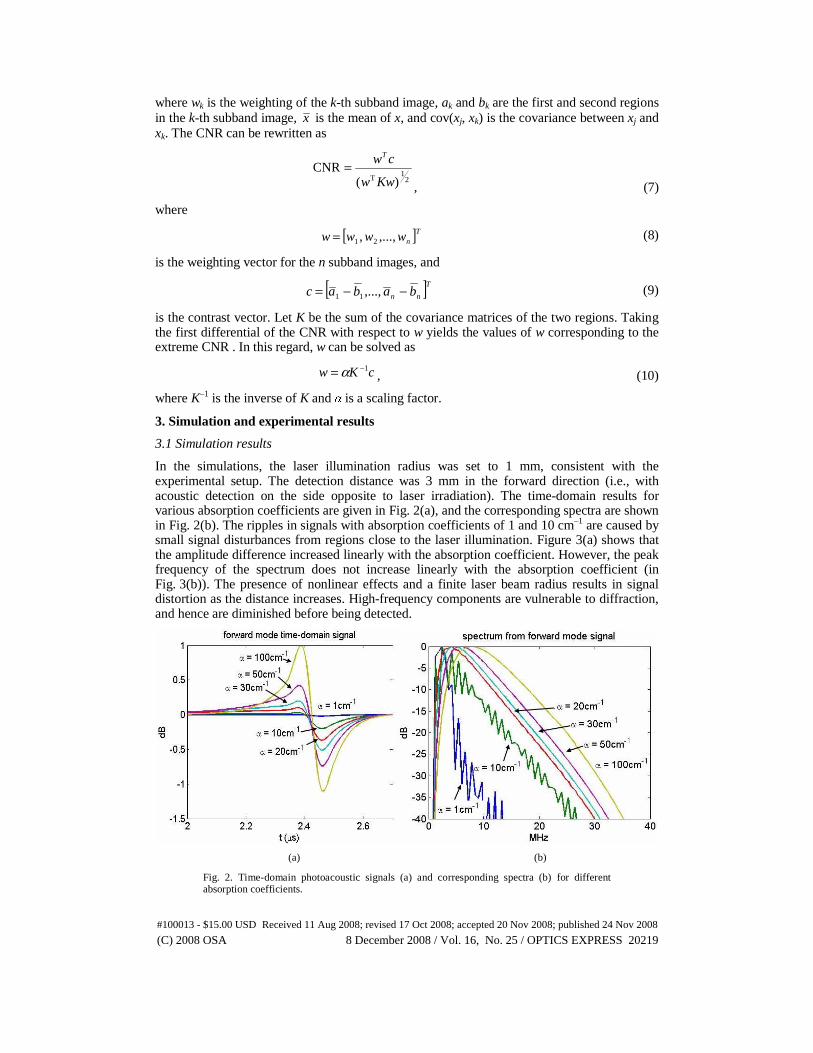
In the simulations, the laser illumination radius was set to 1 mm, consistent with the experimental setup. The detection distance was 3 mm in the forward direction (i.e., with acoustic detection on the side opposite to laser irradiation). The time-domain results for various absorption coefficients are given in Fig. 2(a), and the corresponding spectra are shown in Fig. 2(b). The ripples in signals with absorption coefficients of 1 and 10 cm–1 are caused by small signal disturbances from regions close to the laser illumination. Figure 3(a) shows that the amplitude difference increased linearly with the absorption coefficient. However, the peak frequency of the spectrum does not increase linearly with the absorption coefficient (in Fig. 3(b)). The presence of nonlinear effects and a finite laser beam radius results in signal distortion as the distance increases. High-frequency components are vulnerable to diffraction, and hence are diminished before being detected.
(a) (b)
Fig. 2. Time-domain photoacoustic signals (a) and corresponding spectra (b) for different absorption coefficients.
#100013 - $15.00 USD Received 11 Aug 2008; revised 17 Oct 2008; accepted 20 Nov 2008; published 24 Nov 2008
(C) 2008 OSA 8 December 2008 / Vol. 16, No. 25 / OPTICS EXPRESS 20219
(a) (b)
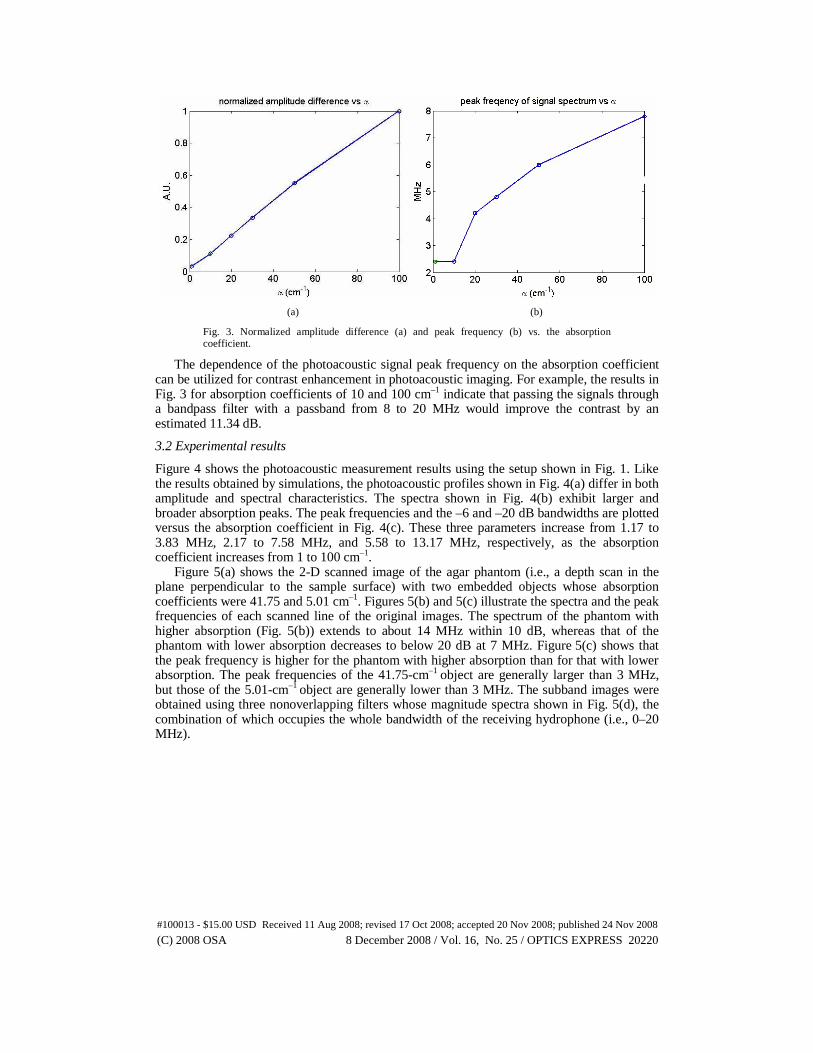
Fig. 3. Normalized amplitude difference (a) and peak frequency (b) vs. the absorption coefficient.
The dependence of the photoacoustic signal peak frequency on the absorption coefficient can be utilized for contrast enhancement in photoacoustic imaging. For example, the results in Fig. 3 for absorption coefficients of 10 and 100 cm–1 indicate that passing the signals through a bandpass filter with a passband from 8 to 20 MHz would improve the contrast by an estimated 11.34 dB.
3.2 Experimental results
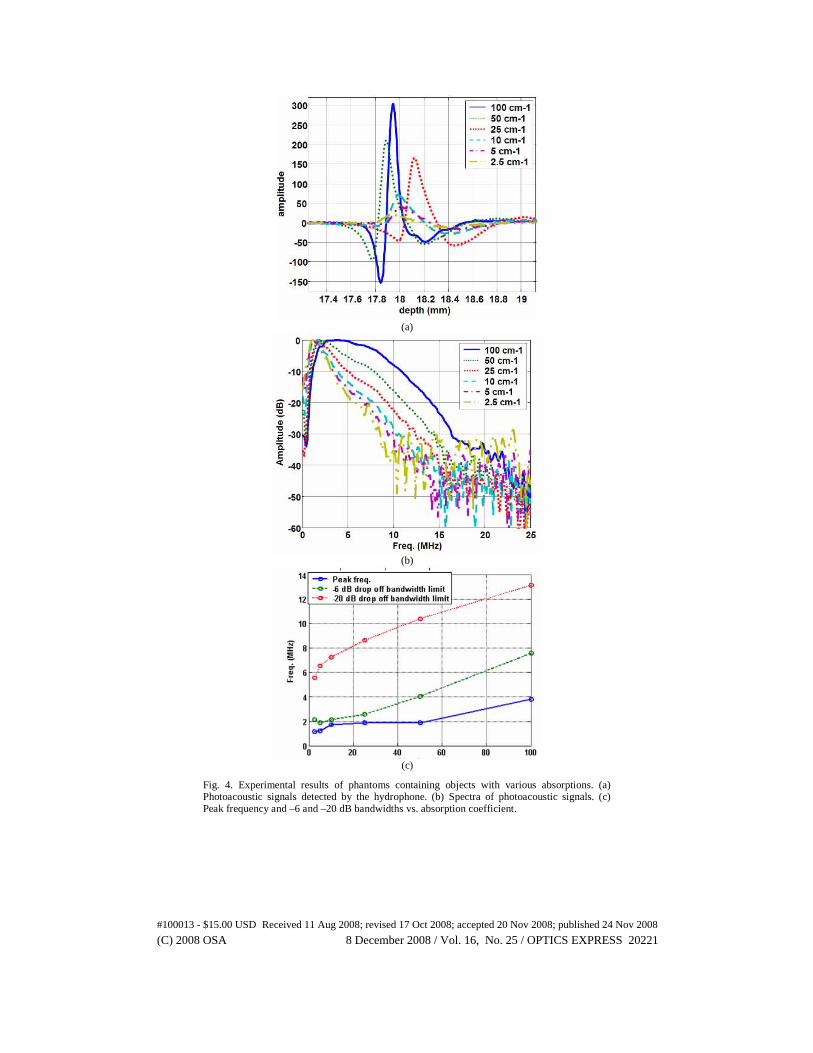
Figure 4 shows the photoacoustic measurement results using the setup shown in Fig. 1. Like the results obtained by simulations, the photoacoustic profiles shown in Fig. 4(a) differ in both amplitude and spectral characteristics. The spectra shown in Fig. 4(b) exhibit larger and broader absorption peaks. The peak frequencies and the –6 and –20 dB bandwidths are plotted versus the absorption coefficient in Fig. 4(c). These three parameters increase from 1.17 to 3.83 MHz, 2.17 to 7.58 MHz, and 5.58 to 13.17 MHz, respectively, as the absorption coefficient increases from 1 to 100 cm–1.
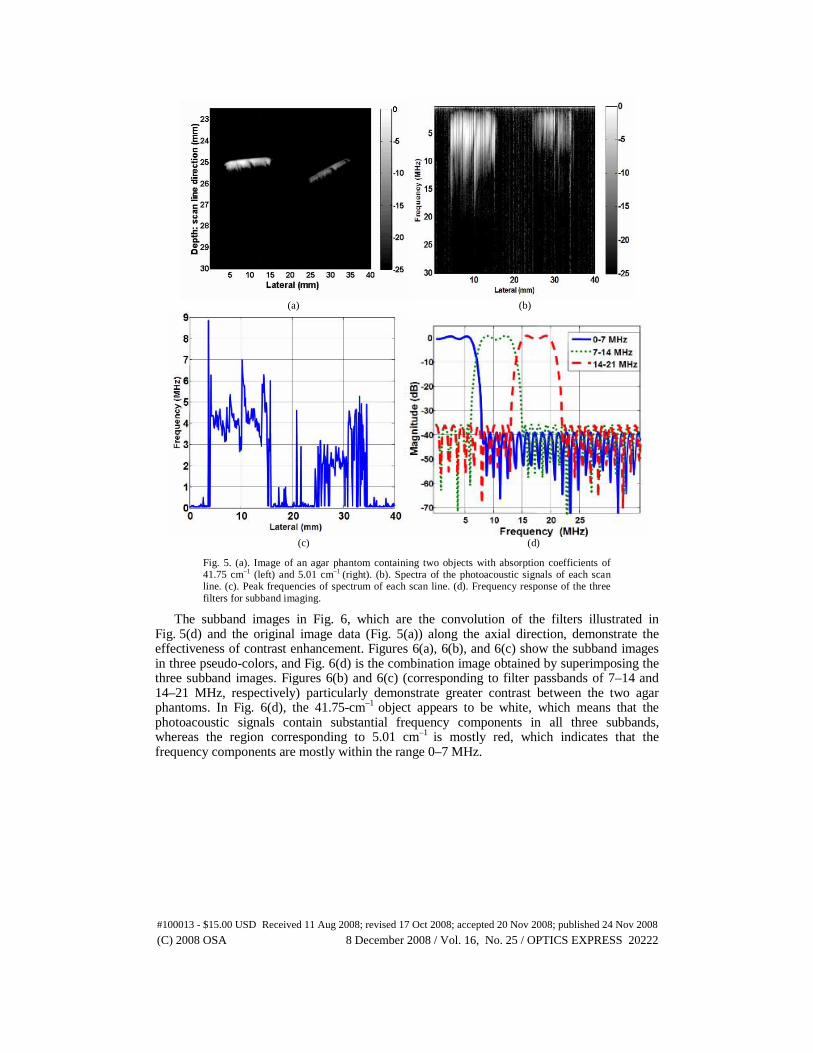
Figure 5(a) shows the 2-D scanned image of the agar phantom (i.e., a depth scan in the plane perpendicular to the sample surface) with two embedded objects whose absorption coefficients were 41.75 and 5.01 cm–1. Figures 5(b) and 5(c) illustrate the spectra and the peak frequencies of each scanned line of the original images. The spectrum of the phantom with higher absorption (Fig. 5(b)) extends to about 14 MHz within 10 dB, whereas that of the phantom with lower absorption decreases to below 20 dB at 7 MHz. Figure 5(c) shows that the peak frequency is higher for the phantom with higher absorption than for that with lower absorption. The peak frequencies of the 41.75-cm–1 object are generally larger than 3 MHz, but those of the 5.01-cm–1 object are generally lower than 3 MHz. The subband images were obtained using three nonoverlapping filters whose magnitude spectra shown in Fig. 5(d), the combination of which occupies the whole bandwidth of the receiving hydrophone (i.e., 0–20 MHz).
#100013 - $15.00 USD Received 11 Aug 2008; revised 17 Oct 2008; accepted 20 Nov 2008; published 24 Nov 2008
(C) 2008 OSA 8 December 2008 / Vol. 16, No. 25 / OPTICS EXPRESS 20220
(a)
(b)
(c)
Fig. 4. Experimental results of phantoms containing objects with various absorptions. (a) Photoacoustic signals detected by the hydrophone. (b) Spectra of photoacoustic signals. (c) Peak frequency and –6 and –20 dB bandwidths vs. absorption coefficient.
#100013 - $15.00 USD Received 11 Aug 2008; revised 17 Oct 2008; accepted 20 Nov 2008; published 24 Nov 2008
(C) 2008 OSA 8 December 2008 / Vol. 16, No. 25 / OPTICS EXPRESS 20221
(a) (b)
(c) (d)
Fig. 5. (a). Image of an agar phantom containing two objects with absorption coefficients of 41.75 cm–1 (left) and 5.01 cm–1 (right). (b). Spectra of the photoacoustic signals of each scan line. (c). Peak frequencies of spectrum of each scan line. (d). Frequency response of the three filters for subband imaging.
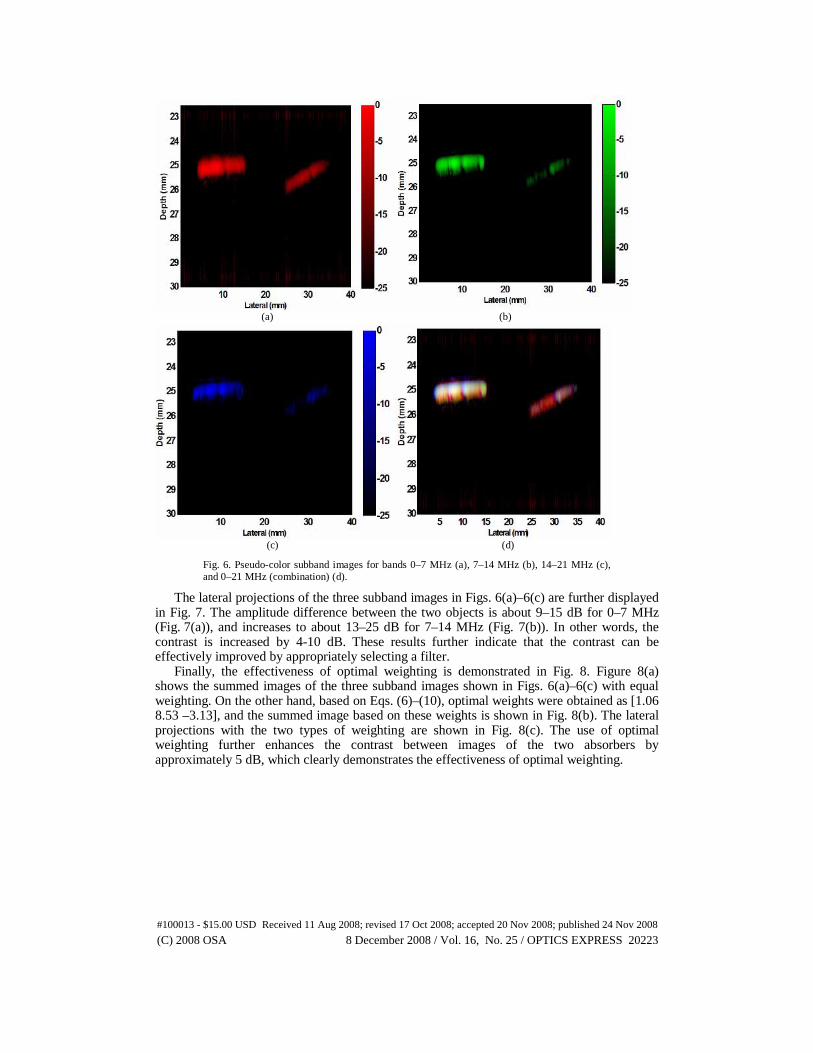
The subband images in Fig. 6, which are the convolution of the filters illustrated in Fig. 5(d) and the original image data (Fig. 5(a)) along the axial direction, demonstrate the effectiveness of contrast enhancement. Figures 6(a), 6(b), and 6(c) show the subband images in three pseudo-colors, and Fig. 6(d) is the combination image obtained by superimposing the three subband images. Figures 6(b) and 6(c) (corresponding to filter passbands of 7–14 and 14–21 MHz, respectively) particularly demonstrate greater contrast between the two agar phantoms. In Fig. 6(d), the 41.75-cm–1 object appears to be white, which means that the photoacoustic signals contain substantial frequency components in all three subbands, whereas the region corresponding to 5.01 cm–1 is mostly red, which indicates that the frequency components are mostly within the range 0–7 MHz.
#100013 - $15.00 USD Received 11 Aug 2008; revised 17 Oct 2008; accepted 20 Nov 2008; published 24 Nov 2008
(C) 2008 OSA 8 December 2008 / Vol. 16, No. 25 / OPTICS EXPRESS 20222
(a) (b)
(c) (d)
Fig. 6. Pseudo-color subband images for bands 0–7 MHz (a), 7–14 MHz (b), 14–21 MHz (c), and 0–21 MHz (combination) (d).
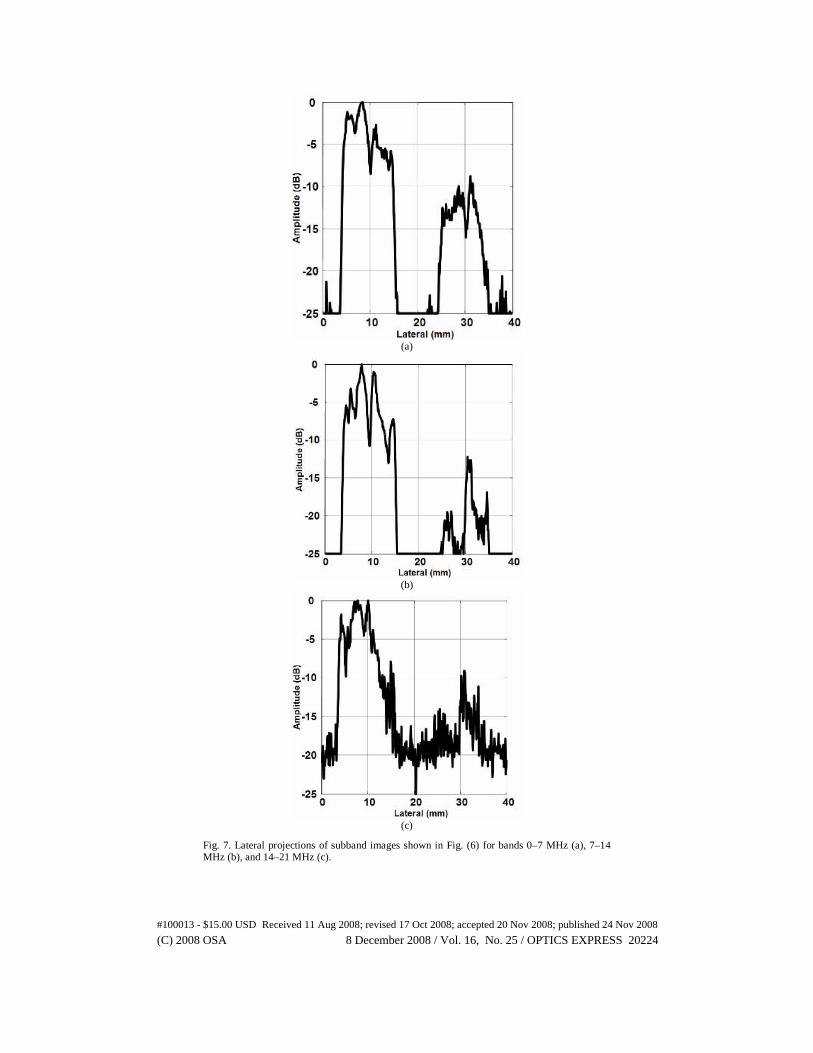
The lateral projections of the three subband images in Figs. 6(a)–6(c) are further displayed in Fig. 7. The amplitude difference between the two objects is about 9–15 dB for 0–7 MHz (Fig. 7(a)), and increases to about 13–25 dB for 7–14 MHz (Fig. 7(b)). In other words, the contrast is increased by 4-10 dB. These results further indicate that the contrast can be effectively improved by appropriately selecting a filter.
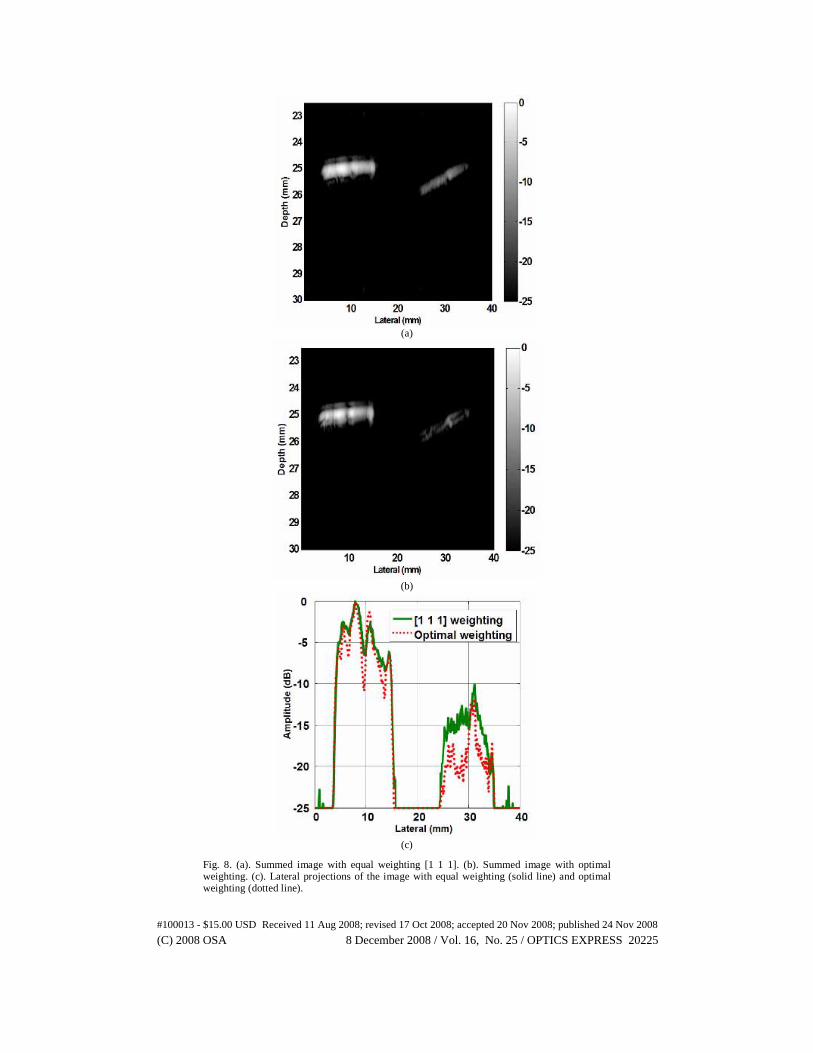
Finally, the effectiveness of optimal weighting is demonstrated in Fig. 8. Figure 8(a) shows the summed images of the three subband images shown in Figs. 6(a)–6(c) with equal weighting. On the other hand, based on Eqs. (6)–(10), optimal weights were obtained as [1.06 8.53 –3.13], and the summed image based on these weights is shown in Fig. 8(b). The lateral projections with the two types of weighting are shown in Fig. 8(c). The use of optimal weighting further enhances the contrast between images of the two absorbers by approximately 5 dB, which clearly demonstrates the effectiveness of optimal weighting.
#100013 - $15.00 USD Received 11 Aug 2008; revised 17 Oct 2008; accepted 20 Nov 2008; published 24 Nov 2008
(C) 2008 OSA 8 December 2008 / Vol. 16, No. 25 / OPTICS EXPRESS 20223
(a)
(b)
(c)
Fig. 7. Lateral projections of subband images shown in Fig. (6) for bands 0–7 MHz (a), 7–14 MHz (b), and 14–21 MHz (c).
#100013 - $15.00 USD Received 11 Aug 2008; revised 17 Oct 2008; accepted 20 Nov 2008; published 24 Nov 2008
(C) 2008 OSA 8 December 2008 / Vol. 16, No. 25 / OPTICS EXPRESS 20224
(a)
(b)
(c)
Fig. 8. (a). Summed image with equal weighting [1 1 1]. (b). Summed image with optimal weighting. (c). Lateral projections of the image with equal weighting (solid line) and optimal weighting (dotted line).
#100013 - $15.00 USD Received 11 Aug 2008; revised 17 Oct 2008; accepted 20 Nov 2008; published 24 Nov 2008
(C) 2008 OSA 8 December 2008 / Vol. 16, No. 25 / OPTICS EXPRESS 20225
4. Conclusions
This study has demonstrated that the subband photoacoustic imaging method enhances the contrast between objects with different absorption coefficients. The contrast can be further improved by using optimal weighting. In the future, the proposed method will be applied to in vivo mouse imaging using gold nanoparticles as the contrast agent. Bioconjugated gold nanoparticles are currently being used as molecular probes for targeted imaging in small-animal models. Region with a high concentration of gold nanoparticles is likely to exhibit high optical absorption, and hence applying the subband imaging method is expected to improve the quality of molecular imaging. Acknowledgments
Financial support from the National Science Council under grant #97-2221-E-002-002-MY3, the National Health Research Institutes, NTU Center for Genomic Medicine, and the NTU Nano Center for Science and Technology is gratefully acknowledged.
#100013 - $15.00 USD Received 11 Aug 2008; revised 17 Oct 2008; accepted 20 Nov 2008; published 24 Nov 2008
(C) 2008 OSA 8 December 2008 / Vol. 16, No. 25 / OPTICS EXPRESS 20226