Integrated system for ultrasonic, photoacoustic and elasticity imaging
8
Integrated System for Ultrasonic, Photoacoustic and Elasticity Imaging S. Park, a J. Shah, a S.R. Aglyamov, a A.B. Karpiouk, a S. Mallidi, a A. Gopal, a H. Moon, a X.J. Zhang, a W.G. Scott, b and S.Y. Emelianov a a Department of Biomedical Engineering, University of Texas at Austin, Austin, TX 78712, USA; b WinProbe Corporation, North Palm Beach, FL 33408 USA ABSTRACT A hybrid imaging system is proposed for cancer detection, diagnosis and therapy monitoring by integrating three complementary imaging techniques – ultrasound, photoacoustic and elasticity imaging. Indeed, simultaneous imaging of the anatomy (ultrasound imaging), cancer-induced angiogenesis (photoacoustic imaging) and changes in biomechanical properties (elasticity imaging) of tissue is based on many synergistic features of these modalities and may result in a unique and important imaging tool. To facilitate the design and development of a real-time imaging system for clinical applications, we have investigated the core components of the imaging system using numerical simulations. Differences and similarities between each imaging technique were considered and contrasted. The results of our study suggest that the integration of ultrasound, photoacoustic and elasticity imaging is possible using a custom designed imaging system. Keywords: ultrasound imaging, photoacoustic imaging, elasticity imaging, transducer array. 1. INTRODUCTION The American Cancer Society estimates that in 2005 more than 40 thousand women in the United States are expected to die from breast cancer [1]. The study also presents statistics illustrating the strong connection between survival rate and stage of cancer development at diagnosis. Along with the obvious benefits in lifetime expectancy, detecting these tumors earlier has the effect of inflating the incidence rate because tumors are being detected 1-3 years before they would have appeared if they continued to grow until symptoms developed [1]. Since treatment is more successful when cancer is discovered early, there has been a concerted effort in the medical community to develop imaging methods and modalities that have a high sensitivity and specificity to breast lesions and are widely available and cost-effective [1]. One such method that has shown great promise is elasticity imaging [2, 3]. Elasticity imaging, i.e., imaging of Young’s modulus of tissue, is based on the premise that tissue pathology can be directly assessed through the quantification of tissue mechanical properties. Physicians have long thought that stiffness can be used as an indicator of possible cancerous lesions. In fact, recent reports have shown significant differences between the Young’s modulus of healthy tissue and invasive breast tumors [4, 5]. The ability to accurately and non-invasively quantify these values offers the possibility of not only detecting but also diagnosing breast abnormalities. One of the approaches of elasticity imaging is based on ultrasound imaging of tissue during the externally applied deformation of the object and measurement of the produced internal tissue motion using speckle tracking algorithms [6]. Elasticity imaging has also been used for noninvasive detection and diagnosis of cancer [7, 8], and in many other applications [9]. Please verify that (1) all pages are present, (2) all figures are acceptable, (3) all fonts and special characters are correct, and (4) all text and figures fit within the margin lines shown on this review document. Return to your MySPIE ToDo list and approve or disapprove this submission. 6147-17 V. 2 (p.1 of 8) / Color: No / Format: Letter / Date: 3/15/2006 3:50:34 PM SPIE USE: ____ DB Check, ____ Prod Check, Notes:
-
Upload
independent -
Category
Documents
-
view
0 -
download
0
Transcript of Integrated system for ultrasonic, photoacoustic and elasticity imaging
Integrated System for
Ultrasonic, Photoacoustic and Elasticity Imaging
S. Park,a J. Shah,a S.R. Aglyamov,a A.B. Karpiouk,a S. Mallidi,a A. Gopal,a H. Moon,a
X.J. Zhang,a W.G. Scott,b and S.Y. Emelianova
aDepartment of Biomedical Engineering, University of Texas at Austin, Austin, TX 78712, USA;
bWinProbe Corporation, North Palm Beach, FL 33408 USA
ABSTRACT A hybrid imaging system is proposed for cancer detection, diagnosis and therapy monitoring by integrating
three complementary imaging techniques – ultrasound, photoacoustic and elasticity imaging. Indeed, simultaneous imaging of the anatomy (ultrasound imaging), cancer-induced angiogenesis (photoacoustic imaging) and changes in biomechanical properties (elasticity imaging) of tissue is based on many synergistic features of these modalities and may result in a unique and important imaging tool. To facilitate the design and development of a real-time imaging system for clinical applications, we have investigated the core components of the imaging system using numerical simulations. Differences and similarities between each imaging technique were considered and contrasted. The results of our study suggest that the integration of ultrasound, photoacoustic and elasticity imaging is possible using a custom designed imaging system.
Keywords: ultrasound imaging, photoacoustic imaging, elasticity imaging, transducer array.
1. INTRODUCTION
The American Cancer Society estimates that in 2005 more than 40 thousand women in the United States are expected to die from breast cancer [1]. The study also presents statistics illustrating the strong connection between survival rate and stage of cancer development at diagnosis. Along with the obvious benefits in lifetime expectancy, detecting these tumors earlier has the effect of inflating the incidence rate because tumors are being detected 1-3 years before they would have appeared if they continued to grow until symptoms developed [1]. Since treatment is more successful when cancer is discovered early, there has been a concerted effort in the medical community to develop imaging methods and modalities that have a high sensitivity and specificity to breast lesions and are widely available and cost-effective [1].
One such method that has shown great promise is elasticity imaging [2, 3]. Elasticity imaging, i.e., imaging of Young’s modulus of tissue, is based on the premise that tissue pathology can be directly assessed through the quantification of tissue mechanical properties. Physicians have long thought that stiffness can be used as an indicator of possible cancerous lesions. In fact, recent reports have shown significant differences between the Young’s modulus of healthy tissue and invasive breast tumors [4, 5]. The ability to accurately and non-invasively quantify these values offers the possibility of not only detecting but also diagnosing breast abnormalities. One of the approaches of elasticity imaging is based on ultrasound imaging of tissue during the externally applied deformation of the object and measurement of the produced internal tissue motion using speckle tracking algorithms [6]. Elasticity imaging has also been used for noninvasive detection and diagnosis of cancer [7, 8], and in many other applications [9].
Please verify that (1) all pages are present, (2) all figures are acceptable, (3) all fonts and special characters are correct, and (4) all text and figures fit within themargin lines shown on this review document. Return to your MySPIE ToDo list and approve or disapprove this submission.
6147-17 V. 2 (p.1 of 8) / Color: No / Format: Letter / Date: 3/15/2006 3:50:34 PM
SPIE USE: ____ DB Check, ____ Prod Check, Notes:
Photoacoustic imaging (also called optoacoustic and, generally, thermoacoustic imaging) has also been suggested for breast cancer detection [10]. In photoacoustic imaging, acoustic transients are generated using pulsed laser radiation. The induced photoacoustic waves are then detected and used to form an image of spatial distribution of optical absorption. There is a significant contrast between normal and deceased tissue due to preferential optical energy deposition in tumors compared to normal tissue [10]. Indeed, solid tumors require an enhanced amount of energy and oxygen. Therefore, rapidly growing cancer cells, needing additional blood supply, gradually develop a dense microvascular network inside and especially around tumors [11]. Rapid tumor growth, bleeding and metastasis usually follow this vascular phase of growth. Malignant breast tumors have enhanced blood content and contain noticeably hypoxic blood. In contrast, benign tumors have a relatively normal level of blood oxygenation. This difference in blood content is utilized in photoacoustic imaging, where an optical wavelength is chosen such that blood absorption and light penetration are optimal.
We have previously proposed an integrated system combining ultrasonic, photoacoustic and elasticity imaging methods to detect and diagnose the breast cancer [12, 13]. Ultrasonic imaging helps to visualize the anatomy of the tissue structures, elasticity imaging detects the pathologies based on the biomechanical properties of the tumor, and photoacoustic imaging utilizes the differences in the optical absorption between normal tissue and cancerous cells. These three imaging methodologies complement each other and may provide more complete pathophysiological assessment of tissue.
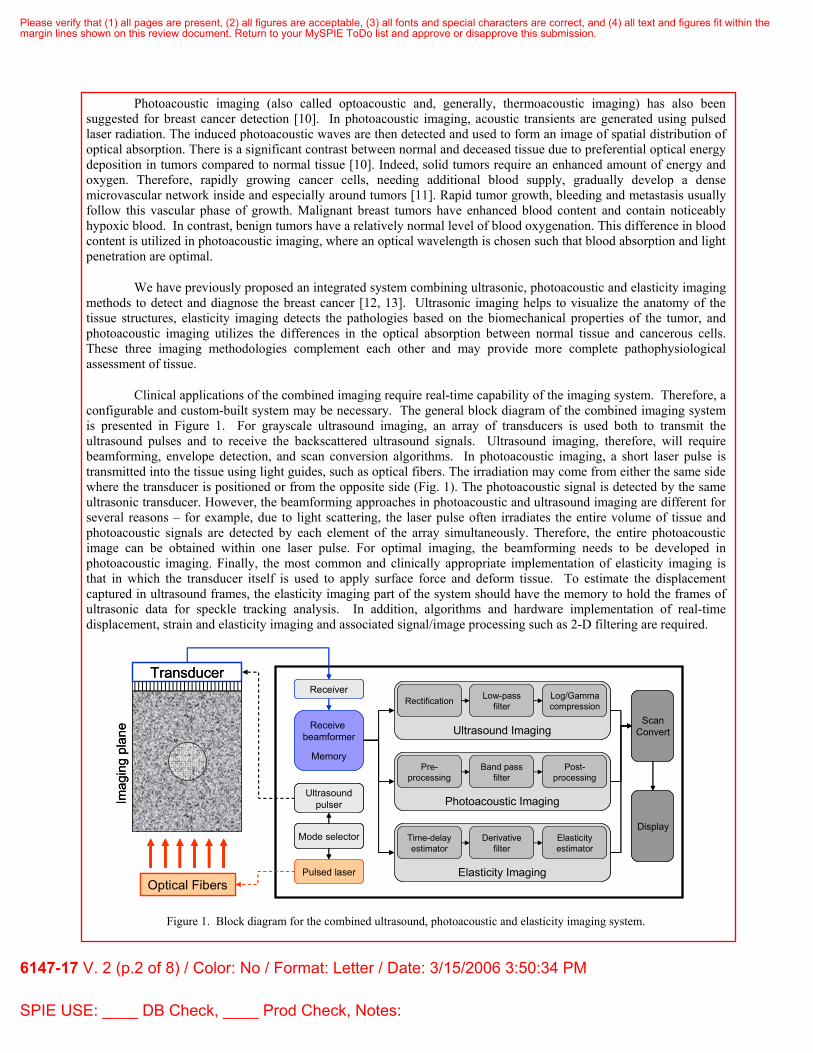
Clinical applications of the combined imaging require real-time capability of the imaging system. Therefore, a configurable and custom-built system may be necessary. The general block diagram of the combined imaging system is presented in Figure 1. For grayscale ultrasound imaging, an array of transducers is used both to transmit the ultrasound pulses and to receive the backscattered ultrasound signals. Ultrasound imaging, therefore, will require beamforming, envelope detection, and scan conversion algorithms. In photoacoustic imaging, a short laser pulse is transmitted into the tissue using light guides, such as optical fibers. The irradiation may come from either the same side where the transducer is positioned or from the opposite side (Fig. 1). The photoacoustic signal is detected by the same ultrasonic transducer. However, the beamforming approaches in photoacoustic and ultrasound imaging are different for several reasons – for example, due to light scattering, the laser pulse often irradiates the entire volume of tissue and photoacoustic signals are detected by each element of the array simultaneously. Therefore, the entire photoacoustic image can be obtained within one laser pulse. For optimal imaging, the beamforming needs to be developed in photoacoustic imaging. Finally, the most common and clinically appropriate implementation of elasticity imaging is that in which the transducer itself is used to apply surface force and deform tissue. To estimate the displacement captured in ultrasound frames, the elasticity imaging part of the system should have the memory to hold the frames of ultrasonic data for speckle tracking analysis. In addition, algorithms and hardware implementation of real-time displacement, strain and elasticity imaging and associated signal/image processing such as 2-D filtering are required.
Imag
ing
plan
e
Transducer
ScanConvert
Elasticity Imaging
Time-delayestimator
Derivativefilter
Elasticityestimator
Ultrasound Imaging
Rectification Low-passfilter
Log/Gammacompression
Photoacoustic Imaging
Pre-processing
Band passfilter
Post-processing
Optical Fibers
Ultrasoundpulser
Receiver
Receive beamformer
Memory
Mode selector
Pulsed laser
Display
Figure 1. Block diagram for the combined ultrasound, photoacoustic and elasticity imaging system.
Please verify that (1) all pages are present, (2) all figures are acceptable, (3) all fonts and special characters are correct, and (4) all text and figures fit within themargin lines shown on this review document. Return to your MySPIE ToDo list and approve or disapprove this submission.
6147-17 V. 2 (p.2 of 8) / Color: No / Format: Letter / Date: 3/15/2006 3:50:34 PM
SPIE USE: ____ DB Check, ____ Prod Check, Notes:
The purpose of this study was to analyze the design requirements of the combined ultrasound, photoacoustic and elasticity imaging system. In this paper, we modeled core components of each imaging methodology. The numerical simulations were based on a simplified but realistic interaction of light and sound with tissue, and mechanical behavior of tissue. Using analytical models, ultrasound, photoacoustic and elasticity (strain) images of the tissue-mimicking phantoms were produced and compared. The fundamental similarities and differences between these complementary imaging techniques were examined to design combined imaging system capable of cancer detection and diagnosis.
2. MATERIALS AND METHOD
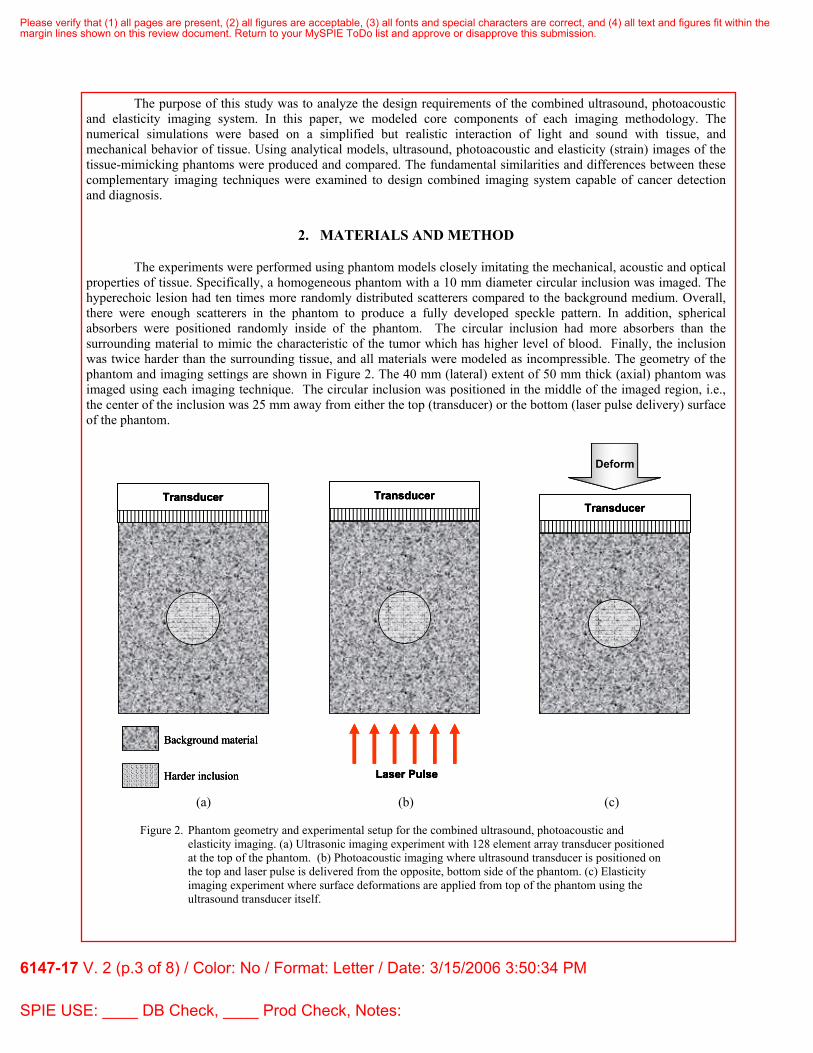
The experiments were performed using phantom models closely imitating the mechanical, acoustic and optical properties of tissue. Specifically, a homogeneous phantom with a 10 mm diameter circular inclusion was imaged. The hyperechoic lesion had ten times more randomly distributed scatterers compared to the background medium. Overall, there were enough scatterers in the phantom to produce a fully developed speckle pattern. In addition, spherical absorbers were positioned randomly inside of the phantom. The circular inclusion had more absorbers than the surrounding material to mimic the characteristic of the tumor which has higher level of blood. Finally, the inclusion was twice harder than the surrounding tissue, and all materials were modeled as incompressible. The geometry of the phantom and imaging settings are shown in Figure 2. The 40 mm (lateral) extent of 50 mm thick (axial) phantom was imaged using each imaging technique. The circular inclusion was positioned in the middle of the imaged region, i.e., the center of the inclusion was 25 mm away from either the top (transducer) or the bottom (laser pulse delivery) surface of the phantom.
Background material
Harder inclusion
Transducer
Laser Pulse
Transducer
Deform
Transducer
Background material
Harder inclusion
Transducer
Background material
Harder inclusion
Transducer
Laser Pulse
Transducer
Laser Pulse
Transducer
Deform
Transducer
Deform
Transducer
(a) (b) (c)
Figure 2. Phantom geometry and experimental setup for the combined ultrasound, photoacoustic and
elasticity imaging. (a) Ultrasonic imaging experiment with 128 element array transducer positioned at the top of the phantom. (b) Photoacoustic imaging where ultrasound transducer is positioned on the top and laser pulse is delivered from the opposite, bottom side of the phantom. (c) Elasticity imaging experiment where surface deformations are applied from top of the phantom using the ultrasound transducer itself.
Please verify that (1) all pages are present, (2) all figures are acceptable, (3) all fonts and special characters are correct, and (4) all text and figures fit within themargin lines shown on this review document. Return to your MySPIE ToDo list and approve or disapprove this submission.
6147-17 V. 2 (p.3 of 8) / Color: No / Format: Letter / Date: 3/15/2006 3:50:34 PM
SPIE USE: ____ DB Check, ____ Prod Check, Notes:
In grayscale ultrasound (Figure 2a), the phantom was imaged using 128 element linear array of transducers. Each element of the array was 300 µm or one wavelength wide with total aperture of the array spanning 40 mm. To image the phantom, 128 ultrasonic beams covering 40 mm lateral range were used where each beam was tightly focused on transmit and dynamically focused on receive to form high quality ultrasonic grayscale images. We refer to this traditional ultrasonic imaging method as conventional imaging. The impulse response of the transducer was modeled as a sinusoid with a two cycle, hanning-weighted envelope (5 MHz center frequency, 60% fractional bandwidth). The custom simulations using linear acoustic propagation were performed. Using necessary transmit-receive combinations of array elements, the backscattered ultrasonic signals were digitized at 50 MHz, basebanded, interpolated and appropriately added to account for the time delay. Transmit focus was set at 25 mm depth, i.e., at the center of the inclusion, and dynamic focusing (f-number = 3) was used for the receive beamforming. Time gain compensation (TGC) was applied after the beamforming for display purposes.
In photoacoustic imaging simulations (Figure 2b), a forward detection method was used, where the laser pulse is delivered at the bottom of the phantom. In the forward detection mode, the photoacoustic signal propagates through the absorbing medium and is detected at the rear surface of the irradiated medium. For breast imaging, both forward and backward detection modes are possible, although the backward mode of photoacoustic imaging may be more practical in a clinical environment. In backward mode the laser pulse is delivered and acoustic transients are detected on the same side. Short laser pulses are required in photoacoustic images – for example, to satisfy stress confinement criteria in a 15 µm target with 1500 m/s speed of sound, optical pulses shorter than 10 ns is required. In our simulation, 5 ns pulses were used. The generation of photoacoustic pressure in an absorbing medium is governed by the thermal equation, the acoustic wave equation, and the thermoelastic expansion equation [14, 15]. For a spherical absorber, the solution in a form of one-dimensional Green’s function is used [14]. The laser induced photoacoustic profile is an N-shaped wave with temporal and spatial characteristics determined by the radius of the absorbing sphere [14, 15]. Using the analytic form of the photoacoustic pressure profile, Beer’s law was applied to simulate the optical attenuation (i.e., scattering and absorption) during the propagation of the light through the medium. The photoacoustic response was then received by all elements of the array, and several beamforming strategies (various f-number, aperture apodization, element size, etc.) to form photoacoustic images were investigated.
Finally, in elasticity imaging (Figure 2c), the ultrasound frames were acquired during 3% of the surface applied deformation of the phantom. The ultrasound probe itself was used to produce mechanical deformation of the phantom. At each incremental deformation, the conventional B-scan images were simulated. For each frame, the ultrasound scatterers were moved based on the analytical solution of the forward mechanical problem describing deformation of a harder sphere embedded into an otherwise homogeneous background. The displacement vector and strain tensor components were estimated between consecutive grayscale images using beamformed RF images. Displacements were estimated using a 2-D cross-correlation based speckle tracking method, where the magnitude of the cross-correlation function was chosen to obtain an integer estimate of the displacement, and then interpolation and phase zero-crossing were used to track sub-pixel lateral and axial displacements [6, 16]. Axial strain images were generated by taking the 1-D derivative of the axial displacement estimates.
In addition, photoacoustic imaging was evaluated using a phantom with a solitary 1 mm diameter inclusion positioned into otherwise transparent background material. This phantom was imaged using 128 element, capacitive micromachined ultrasonic transducer (cMUT) operating at either 1 MHz or 5 MHz center frequency with a fractional bandwidth of either 60% or 100%.
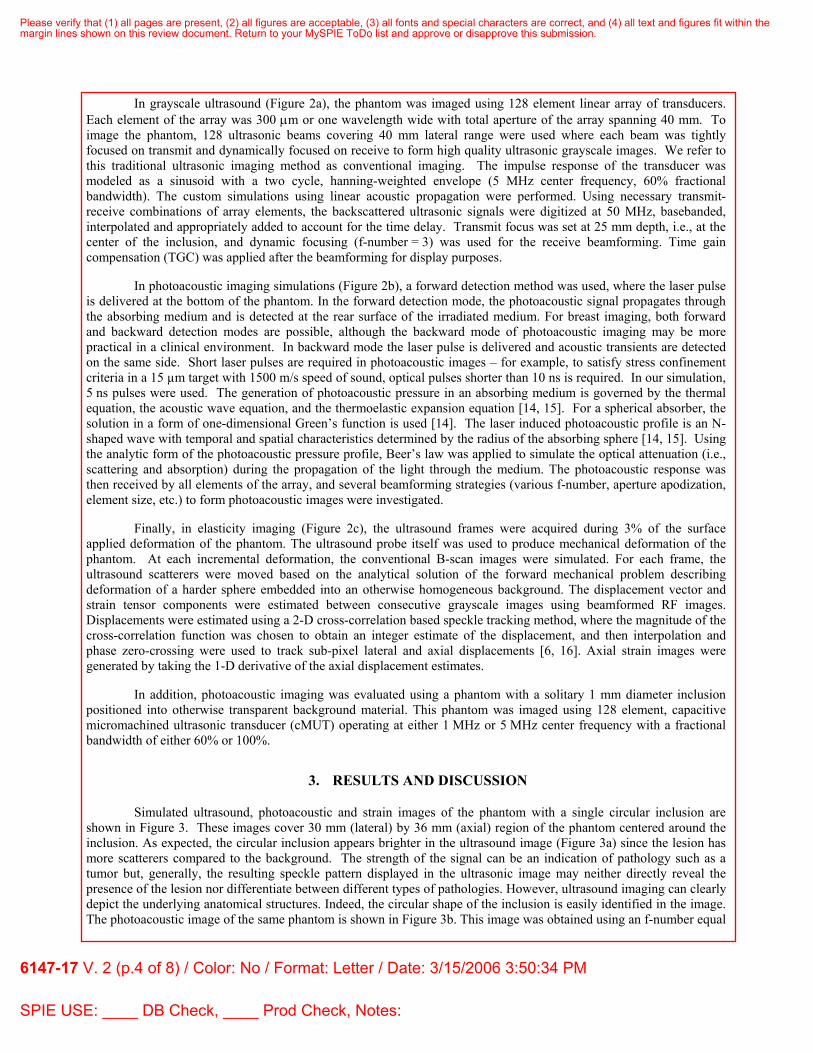
3. RESULTS AND DISCUSSION
Simulated ultrasound, photoacoustic and strain images of the phantom with a single circular inclusion are shown in Figure 3. These images cover 30 mm (lateral) by 36 mm (axial) region of the phantom centered around the inclusion. As expected, the circular inclusion appears brighter in the ultrasound image (Figure 3a) since the lesion has more scatterers compared to the background. The strength of the signal can be an indication of pathology such as a tumor but, generally, the resulting speckle pattern displayed in the ultrasonic image may neither directly reveal the presence of the lesion nor differentiate between different types of pathologies. However, ultrasound imaging can clearly depict the underlying anatomical structures. Indeed, the circular shape of the inclusion is easily identified in the image. The photoacoustic image of the same phantom is shown in Figure 3b. This image was obtained using an f-number equal
Please verify that (1) all pages are present, (2) all figures are acceptable, (3) all fonts and special characters are correct, and (4) all text and figures fit within themargin lines shown on this review document. Return to your MySPIE ToDo list and approve or disapprove this submission.
6147-17 V. 2 (p.4 of 8) / Color: No / Format: Letter / Date: 3/15/2006 3:50:34 PM
SPIE USE: ____ DB Check, ____ Prod Check, Notes:
to one. Since the laser irradiation was applied from the bottom of the phantom, the light was attenuated as it reached the top. Therefore, the amplitude of the photoacoustic signal gradually decreased. This can be clearly seen in the inclusion itself – the lower parts of the inclusion have stronger signal compared to the top of the lesion. Furthermore, since the inclusion has more absorbers representing the malignant tumor area, there is a shadow region above the inclusion. However, even more noticeable in this image are the artifacts – the inclusion appears to be spread in a lateral direction such that it is almost impossible to recognize the circular shape of the lesion. Finally, the strain image is presented in Figure 3c. The harder inclusion exhibits less strain compared to the surrounding soft tissue. This strain image closely approximates the axial strain distribution derived in the analytical model of the phantom deformation. However, strain induced decorrelation noise is apparent in this image.
While inclusion is clearly seen in ultrasonic and strain images in Figure 3a and 3c, correspondingly, the boundary of the inclusion in photoacoustic image in Figure 3b is obscure. Nevertheless, the information obtained from each image is different. Thus, combination of these three imaging techniques complements each other and provides additional information needed for the reliable detection and diagnosis of cancer.
(a)
(b)
(c)
Figure 3. Simulated (a) ultrasound, (b) photoacoustic, and (c) strain images of the phantom with
a single circular inclusion. The inclusion has elevated ultrasonic scattering, optical absorption and Young’s modulus. Each image displays 30 mm by 36 mm region with the inclusion positioned in the center.
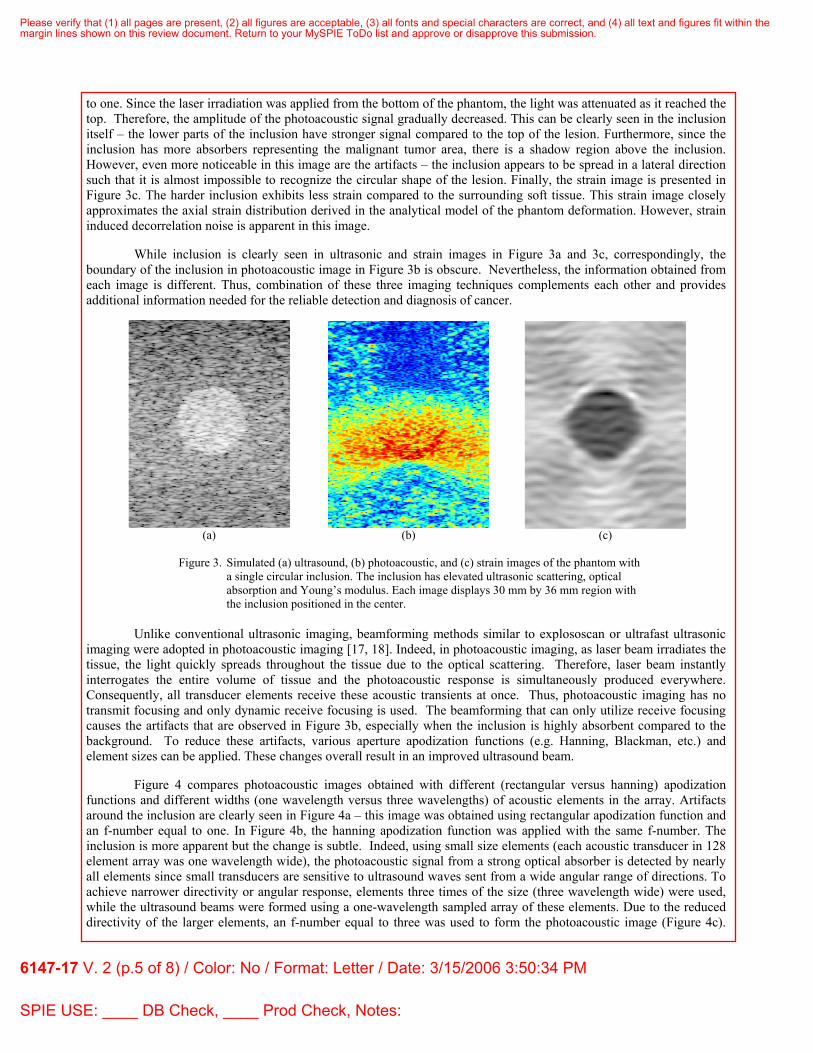
Unlike conventional ultrasonic imaging, beamforming methods similar to explososcan or ultrafast ultrasonic imaging were adopted in photoacoustic imaging [17, 18]. Indeed, in photoacoustic imaging, as laser beam irradiates the tissue, the light quickly spreads throughout the tissue due to the optical scattering. Therefore, laser beam instantly interrogates the entire volume of tissue and the photoacoustic response is simultaneously produced everywhere. Consequently, all transducer elements receive these acoustic transients at once. Thus, photoacoustic imaging has no transmit focusing and only dynamic receive focusing is used. The beamforming that can only utilize receive focusing causes the artifacts that are observed in Figure 3b, especially when the inclusion is highly absorbent compared to the background. To reduce these artifacts, various aperture apodization functions (e.g. Hanning, Blackman, etc.) and element sizes can be applied. These changes overall result in an improved ultrasound beam.
Figure 4 compares photoacoustic images obtained with different (rectangular versus hanning) apodization functions and different widths (one wavelength versus three wavelengths) of acoustic elements in the array. Artifacts around the inclusion are clearly seen in Figure 4a – this image was obtained using rectangular apodization function and an f-number equal to one. In Figure 4b, the hanning apodization function was applied with the same f-number. The inclusion is more apparent but the change is subtle. Indeed, using small size elements (each acoustic transducer in 128 element array was one wavelength wide), the photoacoustic signal from a strong optical absorber is detected by nearly all elements since small transducers are sensitive to ultrasound waves sent from a wide angular range of directions. To achieve narrower directivity or angular response, elements three times of the size (three wavelength wide) were used, while the ultrasound beams were formed using a one-wavelength sampled array of these elements. Due to the reduced directivity of the larger elements, an f-number equal to three was used to form the photoacoustic image (Figure 4c).
Please verify that (1) all pages are present, (2) all figures are acceptable, (3) all fonts and special characters are correct, and (4) all text and figures fit within themargin lines shown on this review document. Return to your MySPIE ToDo list and approve or disapprove this submission.
6147-17 V. 2 (p.5 of 8) / Color: No / Format: Letter / Date: 3/15/2006 3:50:34 PM
SPIE USE: ____ DB Check, ____ Prod Check, Notes:
Here the artifacts are noticeably reduced, though at the expense of lateral resolution. Clearly, the speckle spots are further elongated in a lateral direction compared to previous images. Thus, there is a tradeoff between the reduction of the artifacts and the lateral resolution.
(a)
(b)
(c)
Figure 4. Photoacoustic images of a phantom with a circular, highly absorbing inclusion. The images
were obtained with different apodization functions and sizes of acoustic elements in the array: (a) Rectangular apodization function, array of one-wavelength wide elements, f-number = 1; (b) Hanning apodization function, array of one-wavelength wide elements, f-number = 3; (c) Hanning apodization function, array of three-wavelength wide elements, f-number = 3.
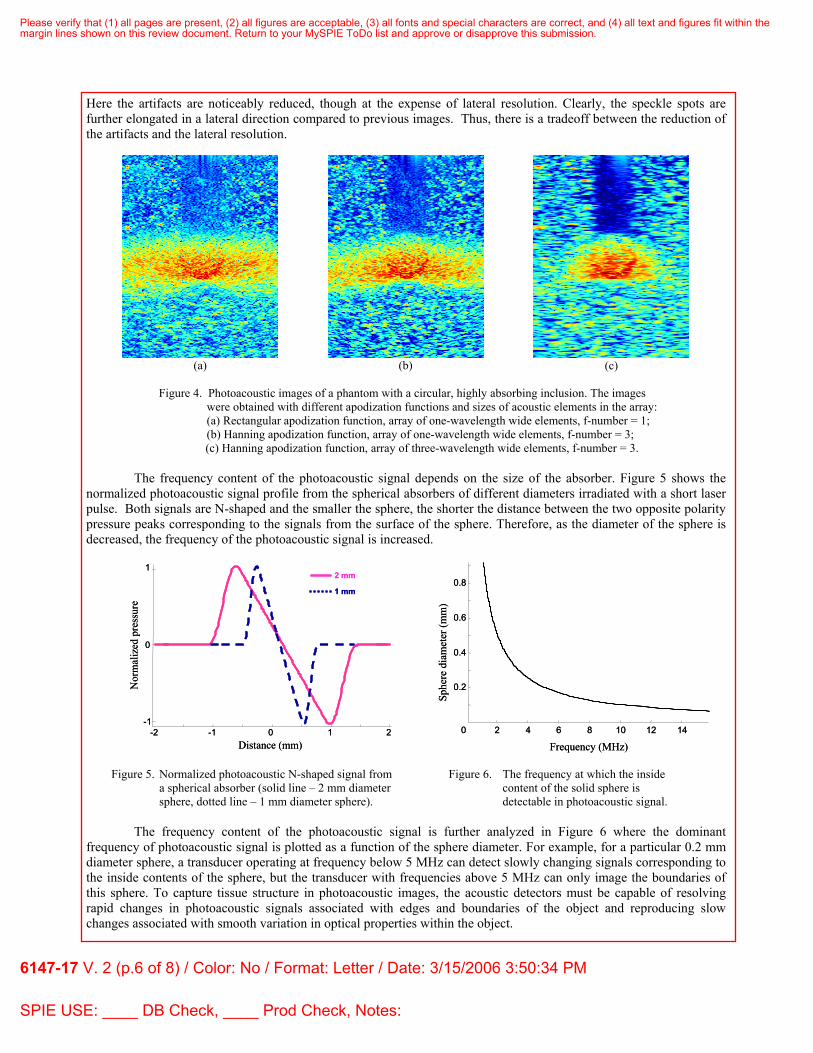
The frequency content of the photoacoustic signal depends on the size of the absorber. Figure 5 shows the normalized photoacoustic signal profile from the spherical absorbers of different diameters irradiated with a short laser pulse. Both signals are N-shaped and the smaller the sphere, the shorter the distance between the two opposite polarity pressure peaks corresponding to the signals from the surface of the sphere. Therefore, as the diameter of the sphere is decreased, the frequency of the photoacoustic signal is increased.
Distance (mm)-2 -1 0 2
-1
0
1
Nor
mal
ized
pre
ssur
e
2 mm
1
1 mm
Distance (mm)-2 -1 0 2
-1
0
1
Nor
mal
ized
pre
ssur
e
2 mm
1
1 mm
2 4 6 8 10 12 140
0.2
0.4
0.6
0.8
Frequency (MHz)
Sphe
re d
iam
eter
(mm
)
2 4 6 8 10 12 140
0.2
0.4
0.6
0.8
Frequency (MHz)
Sphe
re d
iam
eter
(mm
)
Figure 5. Normalized photoacoustic N-shaped signal from a spherical absorber (solid line – 2 mm diameter sphere, dotted line – 1 mm diameter sphere).
Figure 6. The frequency at which the inside
content of the solid sphere is detectable in photoacoustic signal.
The frequency content of the photoacoustic signal is further analyzed in Figure 6 where the dominant frequency of photoacoustic signal is plotted as a function of the sphere diameter. For example, for a particular 0.2 mm diameter sphere, a transducer operating at frequency below 5 MHz can detect slowly changing signals corresponding to the inside contents of the sphere, but the transducer with frequencies above 5 MHz can only image the boundaries of this sphere. To capture tissue structure in photoacoustic images, the acoustic detectors must be capable of resolving rapid changes in photoacoustic signals associated with edges and boundaries of the object and reproducing slow changes associated with smooth variation in optical properties within the object.
Please verify that (1) all pages are present, (2) all figures are acceptable, (3) all fonts and special characters are correct, and (4) all text and figures fit within themargin lines shown on this review document. Return to your MySPIE ToDo list and approve or disapprove this submission.
6147-17 V. 2 (p.6 of 8) / Color: No / Format: Letter / Date: 3/15/2006 3:50:34 PM
SPIE USE: ____ DB Check, ____ Prod Check, Notes:
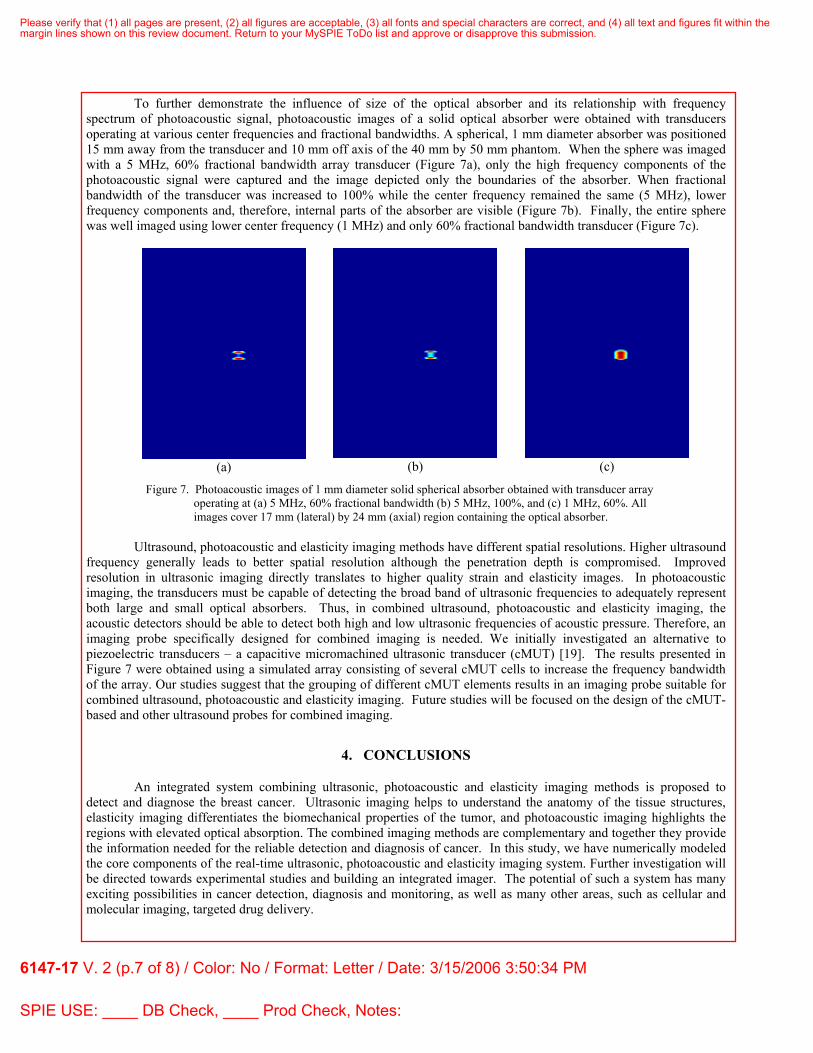
To further demonstrate the influence of size of the optical absorber and its relationship with frequency spectrum of photoacoustic signal, photoacoustic images of a solid optical absorber were obtained with transducers operating at various center frequencies and fractional bandwidths. A spherical, 1 mm diameter absorber was positioned 15 mm away from the transducer and 10 mm off axis of the 40 mm by 50 mm phantom. When the sphere was imaged with a 5 MHz, 60% fractional bandwidth array transducer (Figure 7a), only the high frequency components of the photoacoustic signal were captured and the image depicted only the boundaries of the absorber. When fractional bandwidth of the transducer was increased to 100% while the center frequency remained the same (5 MHz), lower frequency components and, therefore, internal parts of the absorber are visible (Figure 7b). Finally, the entire sphere was well imaged using lower center frequency (1 MHz) and only 60% fractional bandwidth transducer (Figure 7c).
(a)
(b)
(c)
Figure 7. Photoacoustic images of 1 mm diameter solid spherical absorber obtained with transducer array operating at (a) 5 MHz, 60% fractional bandwidth (b) 5 MHz, 100%, and (c) 1 MHz, 60%. All images cover 17 mm (lateral) by 24 mm (axial) region containing the optical absorber.
Ultrasound, photoacoustic and elasticity imaging methods have different spatial resolutions. Higher ultrasound frequency generally leads to better spatial resolution although the penetration depth is compromised. Improved resolution in ultrasonic imaging directly translates to higher quality strain and elasticity images. In photoacoustic imaging, the transducers must be capable of detecting the broad band of ultrasonic frequencies to adequately represent both large and small optical absorbers. Thus, in combined ultrasound, photoacoustic and elasticity imaging, the acoustic detectors should be able to detect both high and low ultrasonic frequencies of acoustic pressure. Therefore, an imaging probe specifically designed for combined imaging is needed. We initially investigated an alternative to piezoelectric transducers – a capacitive micromachined ultrasonic transducer (cMUT) [19]. The results presented in Figure 7 were obtained using a simulated array consisting of several cMUT cells to increase the frequency bandwidth of the array. Our studies suggest that the grouping of different cMUT elements results in an imaging probe suitable for combined ultrasound, photoacoustic and elasticity imaging. Future studies will be focused on the design of the cMUT-based and other ultrasound probes for combined imaging.
4. CONCLUSIONS
An integrated system combining ultrasonic, photoacoustic and elasticity imaging methods is proposed to detect and diagnose the breast cancer. Ultrasonic imaging helps to understand the anatomy of the tissue structures, elasticity imaging differentiates the biomechanical properties of the tumor, and photoacoustic imaging highlights the regions with elevated optical absorption. The combined imaging methods are complementary and together they provide the information needed for the reliable detection and diagnosis of cancer. In this study, we have numerically modeled the core components of the real-time ultrasonic, photoacoustic and elasticity imaging system. Further investigation will be directed towards experimental studies and building an integrated imager. The potential of such a system has many exciting possibilities in cancer detection, diagnosis and monitoring, as well as many other areas, such as cellular and molecular imaging, targeted drug delivery.
Please verify that (1) all pages are present, (2) all figures are acceptable, (3) all fonts and special characters are correct, and (4) all text and figures fit within themargin lines shown on this review document. Return to your MySPIE ToDo list and approve or disapprove this submission.
6147-17 V. 2 (p.7 of 8) / Color: No / Format: Letter / Date: 3/15/2006 3:50:34 PM
SPIE USE: ____ DB Check, ____ Prod Check, Notes:
ACKNOWLEDGMENTS Support in part by National Institutes of Health under grants CA 110079 and EB 004963, and Army Medical
Research and Material Command under grant DAMD17-02-1-0097 is gratefully acknowledged.
REFERENCES [1] "Cancer Facts and Figures 2005," American Cancer Society, 2005. [2] J. Ophir, S. K. Alam, B. Garra, F. Kallel, E. Konofagou, T. Krouskop, and T. Varghese, "Elastography: ultrasonic
estimation and imaging of the elastic properties of tissues," Proc Inst Mech Eng [H], vol. 213, pp. 203-33, 1999. [3] L. Gao, K. J. Parker, R. M. Lerner, and S. F. Levinson, "Imaging of the elastic properties of tissue--a review,"
Ultrasound in Medicine and Biology, vol. 22, pp. 959-77, 1996. [4] T. A. Krouskop, T. M. Wheeler, F. Kallel, B. S. Garra, and T. Hall, "Elastic moduli of breast and prostate tissues
under compression," Ultrasonic Imaging, vol. 20, pp. 260-74, 1998. [5] B. S. Garra, E. I. Cespedes, J. Ophir, S. R. Spratt, R. A. Zuurbier, C. M. Magnant, and M. F. Pennanen,
"Elastography of breast lesions: initial clinical results," Radiology, vol. 202, pp. 79-86, 1997. [6] M. A. Lubinski, S. Y. Emelianov, and M. O'Donnell, "Cross-correlation speckle tracking techniques for ultrasound
elasticity imaging," IEEE Transactions on Ultrasonics, Ferroelectrics and Frequency Control, vol. 46, pp. 82-96, 1999.
[7] A. Pesavento, A. Lorenz, and H. Ermert, "System for real-time elastography," Electronics Letters, vol. 35, pp. 941-942, 1999.
[8] T. J. Hall, Y. N. Zhu, and C. S. Spalding, "In vivo real-time freehand palpation imaging," Ultrasound in Medicine and Biology, vol. 29, pp. 427-435, 2003.
[9] S. Y. Emelianov, X. Chen, M. O'Donnell, B. Knipp, D. Myers, T. W. Wakefield, and J. M. Rubin, "Triplex ultrasound: elasticity imaging to age deep venous thrombosis," Ultrasound in Medicine and Biology, vol. 28, pp. 757-67, 2002.
[10] A. A. Oraevsky, A. A. Karabutov, S. V. Solomatin, E. V. Savateeva, V. G. Andreev, Z. Gatalica, H. Singh, and R. D. Fleming, "Laser optoacoustic imaging of breast cancer in vivo," Proceedings of the 2001 SPIE Phtonics West Symposium: Biomedical Optoacoustics II, vol. 4256, pp. 6-15, 2001.
[11] J. Folkman, "What is the evidence that tumors are angiogenesis dependent?," J. Natl. Cancer Inst., vol. 82, pp. 4-6, 1990.
[12] S. Y. Emelianov, S. R. Aglyamov, J. Shah, S. Sethuraman, W. G. Scott, R. Schmitt, M. Motamedi, A. Karpiouk, and A. Oraevsky, "Combined ultrasound, optoacoustic and elasticity imaging," Proceedings of the 2004 SPIE Photonics West Symposium: Photons Plus Ultrasound: Imaging and Sensing, vol. 5320, pp. 101-112, 2004.
[13] S. Y. Emelianov, S. R. Aglyamov, J. Shah, S. Sethuraman, W. G. Scott, R. Schmitt, M. Motamedi, A. B. Karpiouk, and A. A. Oraevsky, "Synergy of ultrasound, elasticity, and optoacoustic imaging for improved detection and differentiation of cancerous tissue," Journal of the Acoustical Society of America, vol. 115, pp. 2411, 2004.
[14] G. J. Diebold, T. Sun, and M. I. Khan, "Photoacoustic monopole radiation in one, two and three dimensions," Physical Review Letters, vol. 67, pp. 3384-3387, 1991.
[15] J. Diebold and T. Sun, "Properties of photoacoustic waves in one, two, and three dimension," Acoustica, vol. 80, pp. 339-351, 1994.
[16] M. A. Lubinski, S. Y. Emelianov, and M. O'Donnell, "Adaptive strain estimation using retrospective processing," IEEE Transactions on Ultrasonics, Ferroelectrics and Frequency Control, vol. 46, pp. 97-107, 1999.
[17] D. P. Shattuck, M. D. Weinshenker, S. W. Smith, and O. T. von Ramm, "Explososcan: a parallel processing technique for high speed ultrasound imaging with linear phased arrays," Journal of the Acoustical Society of America, vol. 75, pp. 1273-82, 1984.
[18] M. Tanter, J. Bercoff, L. Sandrin, and M. Fink, "Ultrafast compound imaging for 2-D motion vector estimation: application to transient elastography," IEEE Transactions on Ultrasonics, Ferroelectrics and Frequency Control, vol. 49, pp. 1363-74, 2002.
[19] O. Oralkan, A. S. Ergun, J. A. Johnson, M. Karaman, U. Demirci, K. Kaviani, T. H. Lee, and B. T. Khuri-Yakub, "Capacitive micromachined ultrasonic transducers: next-generation arrays for acoustic imaging?," IEEE Transactions on Ultrasonics, Ferroelectrics and Frequency Control, vol. 49, pp. 1596-610, 2002.
Please verify that (1) all pages are present, (2) all figures are acceptable, (3) all fonts and special characters are correct, and (4) all text and figures fit within themargin lines shown on this review document. Return to your MySPIE ToDo list and approve or disapprove this submission.
6147-17 V. 2 (p.8 of 8) / Color: No / Format: Letter / Date: 3/15/2006 3:50:34 PM
SPIE USE: ____ DB Check, ____ Prod Check, Notes: