Ultrasonic determination of fish composition
15
Jvumol of Food 0zgiwenng 35 ( IYYX) 32.1-337 0 IYYX Elsevicr Scicncc Limited. All rights reacrw~d Printed in Great Britain El SEVlER PII: SO260-X774(9X)00027-2 0260-X774/YX $I’).00 t O.IlO Ultrasonic Determination of Fish Composition Reza Ghaedian, John Neil Coupland, Eric Andrew Decker & David Julian McClements” Department of Food Science, University of Massachusetts, Amherst, MA 01003. IJ.S.A. (Reccivcd 1 January 1997; accepted I January 1998) ABSTRACT Our objective was to ascertain the relationship between the ultrasonic properties of ,fish and their composition. Fish analogs with varying protein (15-25 wt7o”o), lipid (O-25 wt%) and moisture (5540 wt7o) contents were prepared by mixing dried cod powdel; sunflower oil and distilled water: The temperature dependence of the ultrasonic velocig of fish analogs was measured from 5 to 35°C. The ultrasonic velocity increased with solids-non-fat at all temperatures, but had a more complex dependence on fat content. Around 15°C the ultrasonic velocity was independent of fat, at lower temperatures it increased with fat, and at higher temperatures it decreased. Empirical equations were developed to relate the ultrasonic velocity to composition. By measuring the ultrasonic properties of fatty tissue at at least two temperatures it should be possible to determine both the fat and solids-non-fat content. For non-fatty fish, the solids-non-fat content can be determined from a single measurement. Our results highlight the potential of ultrasonic velociry measurements to rapidly and nondestmctively determine ,fish composition. 0 1998 Elsevier Science Limited. All rights reserved INTRODUCTION Low-intensity ultrasound can be used to provide information about the physico- chemical properties of many foods (Javanaud, 1988; Povey & McClements, 1988; Povey, 1989; McClements, 1994, 1995). It has been used to determine composition, structure and the physical state of a variety of food materials (McClements, 1994, 1995). Ultrasound has advantages over many traditional analytical techniques *To whom correspondence should be addressed. 323
-
Upload
personal-psu -
Category
Documents
-
view
2 -
download
0
Transcript of Ultrasonic determination of fish composition

Jvumol of Food 0zgiwenng 35 ( IYYX) 32.1-337 0 IYYX Elsevicr Scicncc Limited. All rights reacrw~d
Printed in Great Britain
El SEVlER PII: SO260-X774(9X)00027-2 0260-X774/YX $I’).00 t O.IlO
Ultrasonic Determination of Fish Composition
Reza Ghaedian, John Neil Coupland, Eric Andrew Decker & David Julian McClements”
Department of Food Science, University of Massachusetts, Amherst, MA 01003. IJ.S.A.
(Reccivcd 1 January 1997; accepted I January 1998)
ABSTRACT
Our objective was to ascertain the relationship between the ultrasonic properties of ,fish and their composition. Fish analogs with varying protein (15-25 wt7o”o), lipid (O-25 wt%) and moisture (5540 wt7o) contents were prepared by mixing dried cod powdel; sunflower oil and distilled water: The temperature dependence of the ultrasonic velocig of fish analogs was measured from 5 to 35°C. The ultrasonic velocity increased with solids-non-fat at all temperatures, but had a more complex dependence on fat content. Around 15°C the ultrasonic velocity was independent of fat, at lower temperatures it increased with fat, and at higher temperatures it decreased. Empirical equations were developed to relate the ultrasonic velocity to composition. By measuring the ultrasonic properties of fatty tissue at at least two temperatures it should be possible to determine both the fat and solids-non-fat content. For non-fatty fish, the solids-non-fat content can be determined from a single measurement. Our results highlight the potential of ultrasonic velociry measurements to rapidly and nondestmctively determine ,fish composition. 0 1998 Elsevier Science Limited. All rights reserved
INTRODUCTION
Low-intensity ultrasound can be used to provide information about the physico- chemical properties of many foods (Javanaud, 1988; Povey & McClements, 1988; Povey, 1989; McClements, 1994, 1995). It has been used to determine composition, structure and the physical state of a variety of food materials (McClements, 1994, 1995). Ultrasound has advantages over many traditional analytical techniques
*To whom correspondence should be addressed.
323

324 R. Ghaedian et al.
because measurements are rapid, nondestructive, precise, fully automated and can be made in a laboratory or on-line (Javanaud, 1988; Povey & McClements, 1988; McClements, 1994, 1995). In addition, it is possible to analyze optically opaque samples without the need of extensive sample preparation. The great potential of ultrasound as an analytical tool has meant that many workers are investigating new applications of the technique.
Acoustics is widely used for determining the location and quantity of fish swim- ming under water, and has been used to detect the presence of parasites in fish tissue (Freese & Makow, 1968; Hafsteinsson et al., 1989). These applications rely on a knowledge of the relationship between the ultrasonic properties of fish tissue and its composition. This knowledge is also important for the application of ultrasound as an analytical technique for determining fish composition. Fish are comprised principally of water, protein, lipids and minerals. The relative proportions of these components depends on the species, time of year, sex, age and health of the fish (Eliassen & Vahl, 1982; Jhaveri et al., 1984). In many commercial applications it is important to have information about fish composition, as this often determines their quality, value and utilization. Potentially, ultrasound offers a rapid and non-destruc- tive method of determining fish composition.
In a recent study, we showed that ultrasonic velocity measurements could be used to determine the protein content of Atlantic cod (Gadus morhua) (Ghaedian et al., 1997). Cod has a very low fat content and is not, therefore, representive of species of fish where the amount of fat present can vary quite widely, such as mackerel or herring. The objective of this study was, therefore, to examine the influence of fat, moisture and solids-non-fat on the ultrasonic velocity of fish tissue, and to assess whether ultrasound could be used to determine the composition of both fatty and non-fatty fish.
ULTRASONIC PROPERTIES OF MATERIALS
Ultrasonic analysis relies on establishing a relationship between the ultrasonic properties and composition of a material. This relationship can be developed by measuring the ultrasonic properties of a series of samples of known composition, and then finding an empirical equation that best fits the results. Alternatively, theoretically equations that are derived from a mathematical consideration of the propagation of ultrasonic waves through a material can be used. In this study, we use a combination of theoretical and empirical approaches to establish a semi- empirical relationship between the ultrasonic velocity and composition of fish tissue.
The ultrasonic velocity of fish tissue can be related to its physical properties using the following equation (Ghaedian et al., 1997):
1 - =KP c2
Here, c is the ultrasonic velocity, p is the density and K is the adiabatic compressi- bility. This equation assumes that the material can be treated as a liquid, i.e. the shear modulus is much smaller than the bulk modulus, which is valid for fish tissue (unless it is frozen). In multicomponent materials, such as fish tissue, it is necessary

Ultrasonic determination qf fish composition 32s
to take into account the influence of composition on ultrasonic velocity. To a first approximation, the ultrasonic properties of a multicomponent material can he described by (McClements, 1991):
1 - = ,i, 4,Pj jg, 4iK, c2 (2)
where pi, 5 and 4j are, respectively, the density, adiabatic compressibility and volume fraction of component j. The adiabatic compressibility of a material can be calculated from a knowledge of its density and ultrasonic velocity using eqn (1). Eqn (2) can be simplified if one assumes that the densities of the various components are approximately similar:
1 - = ii, * (.2 c;
It has been shown that this simple relationship gives a good description of the ultrasonic properties of food materials in which the density of the various phases are similar and the scattering of ultrasound is not appreciable (Miles et al., 198.5; Javanaud, 1988; McClements & Povey, 1988, 1992; McClements, 1994). This equa- tion is easier to use than eqn (2), because it only requires information about the ultrasonic velocities of the component phases.
MATERIALS AND METHODS
Materials
Skinned cod fillets were purchased from a local supermarket. About lkg of minced cod fillets were dried in an oven at 100°C for 24 h. The dried sample was then ground using a pestle and mortar and mixed thoroughly. The dried cod powder was stored in a sealed plastic bag and kept in a refrigerator prior to use. Cod fillet consists predominantly of water (~81 wt%) and protein (z 18 wt%), with small amounts of ash (~1.1 wt%) and membrane lipids (~0.1 wt%) (Ghaedian et al., 1997). The dried cod powder is, therefore, comprised mainly of protein, minerals and some membrane lipids. Sunflower oil was purchased from a local supermarket and was used without purification. Distilled water was used in the preparation of all samples.
Proximate analysis of fish
Fat, protein, moisture and ash contents of the cod fillets were determined by standard methods. Fat content was determined by solvent extraction using a method by Lee and Chaiyawat (1996). Protein content was determined by a Kjeldahl method (Method 24.028; AOAC, 1984). Moisture content was determined by measuring the mass before and after drying in an oven (Method 24.003; AOAC, 1984). Ash content was determined by measuring the mass of a dried sample before and after

326 R. Ghaedian et al.
it was heated in a muffle furnace (Method 24.009; AOAC, 1984). Values are reported as the average of measurements on three separate samples.
Preparation of fish analogs
The composition of fish varies according to their species, sex, age, nutritional status, time of year and health. Nevertheless, most fish have protein contents between 15 and 30 wt%, fat contents between 0 and 25 wt%, and moisture contents between 50 and 80 wt%. For this reason, we prepared a series of fish analogs with compositions similar to those found in real fish. Dried cod powder (protein + minerals), sunflower oil and distilled water were homogenized using a high speed blender (Waring Model 33BL79, New Hartford, CT). Cod powder was used because this type of fish has a relatively low triglyceride content (co.5 wt%) (Kremsdorf et al., 1979; Eliassen & Vahl, 1982; Jhaveri et al., 1984; Shahidi et al., 1991). Sunflower oil was used, rather than a fish oil, because it is much less prone to lipid oxidation. Most edible oils have similar ultrasonic velocities (McClements & Povey, 1988) and, therefore, we do not expect the use of sunflower oil, rather than fish oil, to have a significant influence on our findings. When the fish analogs were poured into glass beakers and allowed to stand on the bench for a few minutes it was observed that some of the protein sedimented to the bottom of the container, whilst some of the oil droplets creamed to the top. For this reason a small quantity of a thickening agent (0.1 wt% xanthan) was added to the samples to prevent instability due to creaming or sedimentation.
A laser light scattering technique (LA 900, Horiba Instruments, Irvine, CA) was used to measure the size of the oil droplets and insoluble protein particles in the fish analogs. The protein particles were separated from oil droplets by centrifuging the fish analog at a low speed so that the droplets moved to the top of the container and the protein to the bottom. The fractions were then separated, washed with water and recentrifuged, prior to analysis by the light scattering technique. The protein particles were found to have a diameter of z 100 pm and the fat droplets of z 18 pm.
Ultrasonic measurements
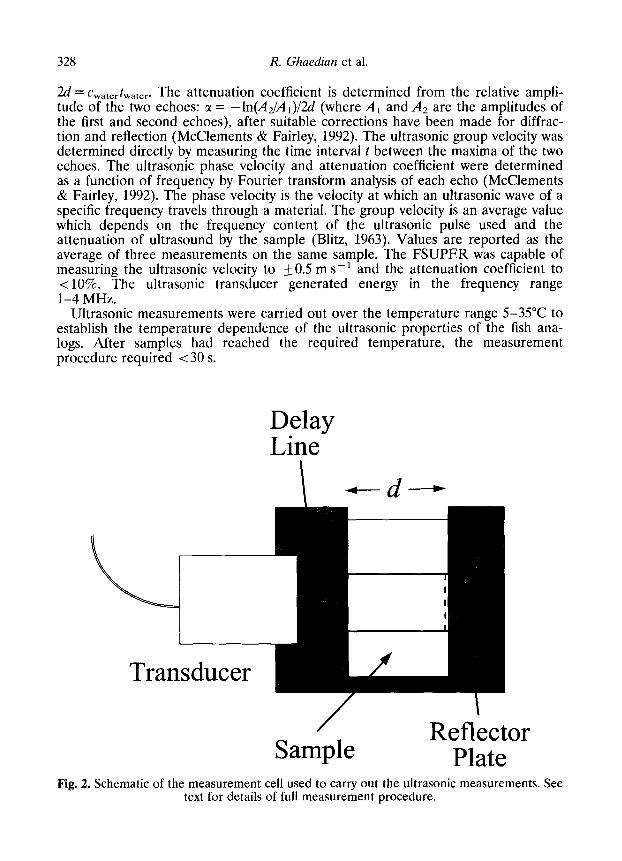
The ultrasonic velocity and attenuation coefficient of samples were measured using a frequency scanning ultrasonic pulse echo reflectometer or FSUPER (McClements & Fairley, 1991, 1992). The experimental arrangement (Fig. 1) for measurements consisted of a custom-designed cell, a broad-band ultrasonic transducer (3.5 MHz, 0.50 inch diameter crystal, Model V682, Panametrics, Waltham, MA), a pulser/ receiver (200 MHz Computer Controlled Ultrasonic Pulser-Receiver, Model 5900PR, Panametrics, Waltham, MA), a digital storage oscilloscope (Lecroy 9300, Lecroy Instruments, Chestnut Ridge, NY) and a personal computer with appro- priate software (LabVIEW for Windows, National Instruments, Austin, TX). The cell consisted of a plexi-glass (perspex) delay line and a brass reflector plate, sepa- rated by a distance of about 16 mm, where a sample was placed (Fig. 2). The cell containing the sample was placed in a water bath, where it was allowed to equili- brate to the measurement temperature for at least 15 min. prior to analysis.
The pulser/receiver generated a broad-band electrical pulse, which was converted into an ultrasonic pulse by the transducer. This pulse propagated along the delay-

Ultrasonic determination of’,fish compositiorz 327
line, until it reached the boundary between the delay-line and the sample where it was partly reflected and partly transmitted. The reflected pulse returned directly to the ultrasonic transducer where it was converted back into an electrical signal, amplified and displayed on an oscilloscope (Fig. 3). The transmitted pulse travelled across the sample, was reflected by the brass reflector plate, and then travelled back across the sample and through the delay-line where it was detected by the trans- ducer and also displayed on the oscilloscope. The resultant signal was averaged 100 times and then sent from the oscilloscope to a P.C. via a GPIB card (AT-GPIBI TNT, National Instruments, Austin, TX) where it was stored and analyzed.
The ultrasonic properties of the sample were determined by analyzing the received signal (Fig. 3). The difference in time between the echo reflected from the delay line/sample interface and that reflected from the sample/reflector plate interface is the time t taken for the pulse to travel twice the length of the sample. Thus, the ultrasonic velocity could be calculated, c = U/t, where d is the path length. The path length is fixed and was measured accurately by calibrating the device with distilled water, a material whose ultrasonic velocity is accurately known:
Oscilloscope
Measurement
Cell
Fig. 1. The frequency scanning pulse echo reflectometer (FSUPER) used to measure the ultrasonic velocity and attenuation coefficient of fish analogs.
328 R. Ghaedian et al.
2d = Gvater Later. The attenuation coefficient is determined from the relative ampli- tude of the two echoes: a = - In(A+l,)/2d (where A, and A2 are the amplitudes of the first and second echoes), after suitable corrections have been made for diffrac- tion and reflection (McClements & Fairley, 1992). The ultrasonic group velocity was determined directly by measuring the time interval t between the maxima of the two echoes. The ultrasonic phase velocity and attenuation coefficient were determined as a function of frequency by Fourier transform analysis of each echo (McClements & Fairley, 1992). The phase velocity is the velocity at which an ultrasonic wave of a specific frequency travels through a material. The group velocity is an average value which depends on the frequency content of the ultrasonic pulse used and the attenuation of ultrasound by the sample (Blitz, 1963). Values are reported as the average of three measurements on the same sample. The FSUPER was capable of measuring the ultrasonic velocity to &OS m s-l and the attenuation coefficient to < 10%. The ultrasonic transducer generated energy in the frequency range l-4 MHz.
Ultrasonic measurements were carried out over the temperature range 535°C to establish the temperature dependence of the ultrasonic properties of the fish ana- logs. After samples had reached the required temperature, the measurement procedure required < 30 s.
Delay Line
Transducer
/
Sample Reflector
Plate Fig. 2. Schematic of the measurement cell used to carry out the ultrasonic measurements. See
text for details of full measurement procedure.

Ultrasonic determination of ,fish composition 329
RESULTS AND DISCUSSION
The ultrasonic phase velocity of the fish analogs was insensitive to frequency over the range l-4 MHz at all temperatures (data not shown). This meant that the measurement procedure could be greatly simplified by measuring the ultrasonic group velocity, rather than the phase velocity. Commerical instruments that measure the ultrasonic group velocity are relatively inexpensive, which would facillitate the practical application of the technique. For this reason, only measurements of the group velocity were used in the rest of this study. Attenuation measurements were not used because these are much more sensitive to the microstructure of fish tissue than ultrasonic velocity measurements, and are therefore less suitable for analyzing fish composition (Ghaedian et al., 1997).
Influence of solids-non-fat
The temperature dependence of the ultrasonic velocity of a series of aqueous suspensions containing different concentrations of dried cod powder was measured (Fig. 4). Dried cod powder contains predominantly protein and minerals and, there-
t
Voltage
Fig. 3. Oscilloscope display. The ultrasonic properties of fish tissue are determined by analyzing the signal returned from the measurement cell (see text for details).
Time -

330 R. Ghaedian et al.
fore, its concentration in aqueous solutions will be referred to as solids-non-fat (&,,r), which is the mass fraction of sample that is neither oil nor water. The ultrasonic velocity increases with 4 SNF at all temperatures, and increases with tem- perature at constant 4 SNF (Fig. 4). An empirical equation was used to relate the ultrasonic velocity of the aqueous solutions of cod powder to 4sNF and temperature:
CAQ = ko i- k ,qh + k&w + kJ + kJ2 •t &kd (4)
here cAQ is the ultrasonic velocity of the aqueous suspension, T is the temperature and the constants ki are determined by finding the best fit between this equation and the experimental measurements shown in Fig. 4 using a standard statistical program: k. = 1385.7, k, = 5.145, k2 = -0.038, k3 = 578.62, k4 = 347.97 and ks = - 8.283. The predictions of the ultrasonic velocities made by the above equation were in excellent agreement (2 = 0.993) with the experimental measurements over the temperature range studied (Fig. 4). A similar equation proved useful for describing the depend- ence of the ultrasonic velocity of sugar solutions on temperature and solute concentration (Contrera et al., 1992).
1600
1500
25.0%
10 15 20 25 30 35
Temperature, “C
Fig. 4. Temperature dependence of the ultrasonic velocity of aqueous solutions containing different concentrations of solids-non-fat. The curves represent 4sNF of 0.10, 0.125, 0.15, 0.175, 0.20, 0.225 and 0.25 from bottom to top. The measured values are represented as
symbols, and the values predicted by eqn (4) are represented by the curves.

Ultrasonic determination of fish composition 331
The moisture content (4moisture = 1 - 4sNF) of fish tissue containing no fat can be determined by measuring its ultrasonic velocity (cAO) and temperature (7’) and solving eqn (4) for 4 SNF. In a previous study, we measured the ultrasonic velocity of a series of cod fillets of different moisture contents at 30°C (Ghaedian et al., 1997). The cod fillets had very low fat contents ( ~0.2 wt%), and so we assumed that the fat had little influence on their ultrasonic properties. The moisture contents pre- dicted using eqn (4) and the measured ultrasonic velocities and temperatures were compared with those determined by a standard oven drying method (Fig. 5). There was a good agreement between the values predicted by the ultrasonic technique and those determined by the oven drying method (2 = 0.83). These results indicate that the moisture content of low fat fish, such as cod, can rapidly be determined from ultrasonic velocity measurements. The ultrasonic velocity increases by z 3 m s- ’ per 1% increase in solids-non-fat at 30°C (Fig. 4). Typically, the ultrasonic velocity can be measured to within 1 m SK’ using commercial ultrasonic instruments, and so it should be possible to determine the solids-non-fat content to better than 0.3% at this temperature. In practice, the measurement is less accurate because of variations in temperature or structural effects that might affect the velocity. Figure 5 indicates that the moisture content could be determined to within about 1% in practice using the ultrasonic technique.
81 82
Moisture by Oven, % 83 84
Fig. 5. Comparision of percentage moisture content [lOO(l-&.,F)] determined by ultrasonic velocity measurements at 30°C (eqn (4)) and by a standard oven drying method.

332 R. Ghaedian et al.
Influence of fat content
Many fish contain significant amounts of fat, and so it is important to determine the influence of fat on ultrasonic velocity. The temperature dependence of the ultra- sonic velocity of pure sunflower oil and distilled water are shown in Fig. 6. The ultrasonic velocity of water increases with temperature from 5 to 35°C whereas that of sunflower oil decreases. At a critical temperature (7’,z 18”C), the ultrasonic velocity of the oil and aqueous phase are similar. The ultrasonic velocity of a two component material is determined by its composition and the ultrasonic velocities of the two components (eqn (3)). We would therefore expect the influence of fat on the ultrasonic velocity of fish to be dependent on the measurement temperature: when T-CT,, the ultrasonic velocity should increase with fat (because fat has a higher velocity than water); when TzTc, it should be independent of fat (because fat and water have similar velocities); and, when T > T,, it should decrease with fat (because fat has a lower velocity than water). To determine the fat content of a fish it is therefore important to make the measurement at a temperature sufficiently above or below T,. The critical temperature at which the fat and aqueous phase have similar ultrasonic velocities decreases as the solids-non-fat content increases, because the ultrasonic velocity of the aqueous phase increases with +sNF.
1540
1520
1500
4
‘2 1480
1460
1440
1420
0 15 20 25 Temperature, “C
Fig. 6. Temperature dependence of the ultrasonic velocity of distilled water and sunflower oil.

Ultrasonic determination qf ,fish composition 33.1
The ultrasonic velocity of a series of fish analogs containing 20 wt% solids-non-fat (cod powder) and varying amounts of fat (0, 5, 10, 15, 20 and 25 wt% sunflower oil), were measured over a range of temperatures (Fig. 7). As expected, these measure- ments indicate that the ultrasonic velocity is relatively insensitive to fat around WC, increases with fat below this temperature, and decreases with fat above it. At the critical temperature, the ultrasonic velocity of the samples are only dependent on solids non-fat, and so it should be possible to determine &,F irrespective of the fat content using eqn (4). To determine the fat content of fish tissue it is necessary to measure the ultrasonic velocity at a temperature sufficiently far from the critical temperature, i.e. <5”C or > 30°C (Fig. 7). The dependence of the ultrasonic velocity of the fish analog on fat content at 30°C is shown in Fig. 8. The inclination of the line in Fig. 8 suggests that the ultrasonic velocity decreases by about 1.3 m s-’ per 1% increase in fat content. If the ultrasonic velocity can be measured to within 1 m s-‘, then it should be possible to determine the fat content to better than 1% at this temperature. As mentioned earlier, the change in ultrasonic velocity with protein content at 30°C is about 3 m s- ’ per 1% protein. The ultrasonic technique is, therefore, about three times less senstive to changes in the fat content at 30°C than it is to changes in the solid-non-fat content, which means that changes in fat content might be obscured by alterations in solids-non-fat.
Fatty fish tissue can be considered to consist of two phases: an aqueous phase
1600
1580
15 20 Temperature, “C
Fig. 7. Temperature dependence of the ultrasonic velocity of fish analogs containing the same overall solids-non-fat content (20 wt%), but different oil contents.

334 R. Ghaedian et al.
(solids-non-fat +water) and an oil phase. The relationship between ultrasonic velo- city and composition can, therefore, be described by inserting the relevent values for the physical properties of the component phases into eqn (2) and (3):
1 - =[&ATPFAT+(I- ~FAT)PAQI[~FATICFAT+(l-~FAT)KAQI (5) c2
1 &AT ---
+ (1-4~~~1
(6) c2 &AT &
Here &AT is the volume fraction of fat present, cFAT and cAQ are the ultrasonic velocities, and p FAT and PAQ are the densities of the separate fat and aqueous phases, respectively. It must be stressed that cAQ and PAQ are the ultrasonic velocity and density of an aqueous phase that has a solids-non-fat content of $SNF. The ultrasonic velocity of a fatty fish can, therefore, be related to its composition once the ultrasonic velocity and density of the component phases is known. The ultra- sonic velocity of the aqueous phase is given by eqn (4). The density of the aqueous phase is given by pwater +262.5&F, assuming that the increase in density with &NF
10 15
Oil Content, wt%
20 25
Fig. 8. Variation of ultrasonic velocity of fish analogs with oii content at 30°C. Each of the samples has the same overall solids-non-fat content (20 wt%). The full curve is the ultra-
sonic velocity predicted by eqn (5).

Ultrasonic determination qf ,fish composition 33s
is similar to that for protein (Pavlovskya et al., 1992). The temperature de P
endence of the ultraonic velocity of sunflower oil is given by: cFAT = 1541.5e~-0.““232 (McCIe- ments & Povey, 1988). The temperature dependence of the density of sunflower oil is given by: 930.3-0.6363T (Rahman, 1995). By substituting these values into eqns (5) and (6) we are able to relate the ultrasonic velocity of fish tissue to its composi- tion and temperature. At 3O”C, there is good agreement between predictions of the ultrasonic velocity made using eqn (5) and the experimental measurements (Fig. 8), but the predictions of eqn (6) considerably over estimate the ultrasonic velocity. For this reason, we suggest that eqn (5) should be used to relate the ultrasonic proper- ties of fish to their composition.
The fat content of fish tissue can be determined at a specific temperature by measuring its ultrasonic velocity, and inserting the relevent values for cFA-I., pFA1., cAQ and PAQ into eqn (5). The resulting equation is a quadratic in &AT that has one physically realistic root, i.e. 0 < +FAT < 1. The fat content of the samples shown in Fig. 9 were calculated from the ultrasonic velocity measurements using eqns (5) and (6), and compared with the actual values (Fig. 9). There is an excellent correla- tion between the values predicted by eqn (5) and the actual values (r? = 0.995).
It should be possible to determine both the fat and solids-non-fat content of fish tissue by measuring the ultrasonic velocity as a function of temperature, and finding the values of (6SNF and &AT that give the best fit between eqn (5) and the experi- mental data.
- T I I I
0 5 10 15 20 25 Fat Content, wt%
Fig. 9. Comparison of fat contents determined by ultrasonic velocity measurements with actual values.

336 R. Ghaedian et al.
CONCLUSIONS
The ultrasonic properties of fish tissue depend on composition and temperature. The ultrasonic velocity increases with solids-non-fat content at all temperatures, but has a more complex dependence on fat content. It is independent of fat content at a critical temperature, increases with fat below this temperature and decreases above it. By measuring the ultrasonic properties of fatty tissue at at least two temperatures it should be possible to determine both the fat and solids-non-fat content. For non-fatty fish the solids-non-fat content can be determined from a single measurement. The empirical equations developed in this study will also prove useful for those who need to predict the ultrasonic velocity of fish tissue. They can also be used to predict the fat or solids-non-fat content of fish from ultrasonic velocity measurements. Our results suggest that ultrasound offers food scientists a rapid and nondestructive method of analyzing the composition of fish. Hand-held ultrasonic devices could be developed which could be used by the fishing industry to determine fish composition. Alternatively, automated on-line ultrasonic devices could be developed for rapidly measuring moisture content of fish during process- ing. Future work needs to establish the feasibility of making measurements on whole fish, rather than on a fish analog.
ACKNOWLEDGEMENTS
This paper was funded by a grant/cooperative agreement from the U.S. National Oceanic and Atmospheric Administration. The views expressed herein are those of the authors and do not necessarily reflect the views of NOAA or any of its sub- agencies.
REFERENCES
AOAC. (1984). Official Methods of Analysis, 14th edn. Association of Official Analytical Chemists, Washington, D.C.
Blitz, J. (1963). Fundamentals of Ultrasonics. Butterworths, London. Contrera, N. I., Fairley, P., McClements, D. J. & Povey, M. J. W. (1992). Analysis of sugar
solution content of fruit juices and drinks using ultrasonic velocity measurements. Znt. J. Food Sci. Echnol., 27, 515-529.
Eliassen, J. E. & Vahl, 0. (1982). Seasonal variations in biochemical composition and energy content of liver, gonad and muscle and immature cod, Gadus morhua (L.) from Balsfjor- den, northern Norway. J. Fish Biol., 20, 707-716.
Freese, M. & Makow, D. (1968). High-frequency ultrasonic properties of fresh water fish tissue. J. Acoust. Sot. Am., 44, 1282-1289.
Ghaedian, R., Decker, E. A. & McClements, D. J. (1997). Use of ultrasound to determine cod fillet composition. .I. Food Sci., 62, 500-504.
Hafsteinsson, H., Parker, K., Chivers, R. & Rizvi, S. S. H. (1989). Application of ultrasonic waves to detect sealworms in fish tissue. J. Food Sci., 54, 244-247.
Javanaud, C. (1988). Applications of ultrasound to food systems. Ultrasonics, 26, 117-123. Jhaveri, S. N., Karakoltsidis, P. A., Montecalvo, J. & Constantinides, S. M. (1984). Chemical
composition and protein quality of some Southern New England marine species. J. Food Sci., 49, 110-113.

Ultrasonic determination of fish composition 337
Kremsdorf, D. L., Josephson, R. V., Spindler, A. A. & Phleger, C. F. (1979). Gross composi- tion, sensory evaluation, and cold storage stability of underutilized deep sea Pacific rattail fish Coyphaenoides acrolepis. J. Food Sci., 44, 1044-1048.
Lee, C. M., Trevino, B. & Chaiyawat, M. (1996). A simple, rapid solvent extraction method for determination of total lipids in fish tissue. JAOAC Int., 79, 487-492.
McClements, D. J. (1991). Ultrasonic characterization of emulsions and suspensions. A& Colloid Inteqace Sci., 37, 33-72.
McClements, D. J. (1994). Ultrasonic NDT of foods and drinks. In International Advances in Nondestructive Testing, ed. McGonnagle, W. J., Vol. 17. Gordon and Breach Science. Yverdon, Switzerland, pp. 63-95.
McClements, D. J. (1995). Advances in the application of ultrasound in food analysis and processing. Trends Food Sci. Technol., 6, 293-299.
McClements, D. J. & Fairley, P. (1991). Ultrasonic pulse echo reflectometer. Ultrasonics, 29. 58-62.
McClements, D. J. & Fairley, P. (1992). Frequency scanning ultrasonic pulse echo refect- ometer. Ultrasonics, 30, 403-405.
McClements, D. J. & Povey, M. J. W. (1988). Comparison of pulsed NMR and ultrasonic velocity techniques for determining solid fat content. Int. J. Food Sci. Technol.. 23. 159-170.
McClements, D. J. & Povey, M. J. W. (1992). Ultrasonic analysis of edible fats and oils. Ultrasonics, 30, 383-388.
Miles, C. A.. Fursey, G. A. J. & Jones, R. C. D. (1985). Ultrasonic estimation of solid/liquid ratios in fats, oils and adipose tissue. J. Sci. Food A&c., 36, 215-228.
Pavlovskaya, G., McClements, D. J. & Povey, M. J. W. (1992). Ultrasonic studies of aqueous solutions of a globular protein. Food Hydrocolloids, 6, 253-258.
Povey, M. J. W. & McClements, D. J. (1988). Ultrasonics in food engineering: part I. Introduction and experimental methods. J. Food Engng, 8, 217-245.
Povey, M. J. W. (1982). Ultrasonics in food engineering: part 11. Applications. J. Food Engng, 9, I-20.
Rahman, S. (1995). Food Properties Handbook. CRC Press, Boca Raton, FL. Shahidi, F., Naczk, M., Pegg, R. B. & Synowiecki, J. (1991). Chemical composition and
nutritional value of processing discards of cod (Gadus morhua). Food Chem., 42, 145- IS I.