Ultrasonic Anisotropy in Composites: Effects and Applications
Upload
khangminh22Category
view
1download
0
IOL Master Optical Biometry versus Conventional
Ultrasonic Biometry in Intraocular Lens Power
Calculations in Highly Myopic versus Emmetropic Eyes
Thesis submitted for partial fulfillment of master degree in Ophthalmology
By
Mina Nasry Gad Elkareem
M.B.B.Ch
Faculty of Medicine - Cairo University
Under supervision of
Prof. Dr. Mervat Salah Mourad
Professor of Ophthalmology
Faculty of Medicine –Ain shams university
Asst.Prof. Dr. Rafaat Ali Elsayd Rehan
Assistant Professor of Ophthalmology
Faculty of Medicine-Ain shams university
Dr. Mouamen Mohammed Mustafa
Lecturer of Ophthalmology
Faculty of Medicine – Ain shams University
Faculty of Medicine
Ain shams University
2017

Acknowledgments
First of all, I must express my gratitude to GOD for helping me not only with this
work but throughout my life.
I am greatly honored to express my gratitude and sincere appreciation to
Professor, Dr. Mervat Salah Mourad, Professor of Ophthalmology, Ain
shams University for her professional help, great care, and unlimited generosity in
time and effort.
I am also grateful to Dr. Rafaat Ali Elsayd Rehan, Assistant Professor of
Ophthalmology, Ain shams University for his great help, support, and guidance in
preparing this thesis.
I am also grateful to Dr. Mouamen Mohammed Mustafa, lecturer of
Ophthalmology, Ain shams University who helped me a lot throughout this work,by
his support, patience, guidance, practical comments and encouragement.
I would like to express my special thanks to my family, all my colleagues, for their
valuable support and the patients who participated in this work

List of contents
List of abbreviations…………………...…………..……..……..…….II
List of figures ………………...……………………..………………..III
List of tables ……………………….……………………...…………...V
Aim of the work.......................................................................................1
Review of literature.................................................................................2
Introduction........................................................................2
A- scan ultrasound ............................................................5
IOL master.......................................................................11
Methodology..........................................................................................19
Results....................................................................................................31
Discussion..............................................................................................84
Conclusion.............................................................................................55
Summary................................................................................................56
References..............................................................................................58
Arabic summary....................................................................................61

List of Abberviations
AL
ACD
AUS
A-S
AXL
Axial Length
Anterior Chamber Depth
Applantion Ultrasound
A – Scan
Axial Length
BCVA Best Corrected Visual Acuity
CCT
Central corneal thickness
ELP Estimated Lens Position
ILM
IOL
IOL M
IOP
Inner Limiting Membrane
Intraocular Lens
IOL Master
Intraocular pressure
Kav Average K reading
LT Lens thickness
MAE
MNE
Mean Absolute Error
Mean numerical error
NE Numerical Error
PCI
PSC
Partial Coherence Interferometry
Posterior Subcapsular Cataract
RPE Retinal pigment epithelium
SE
SS-OCT
Spherical Equivalent
Swept source OCT(optical coherence tomography)
WTW White to white

List of figures
Figure 1: Typical A-scan printout for axial length measurement…………………………………………………...7
Figure 2: Contact axial echogram of a case of cataract…………………………...………………………………...8
Figure 3: Affection of the spike height by the angle of the sound wave hitting the interface by the probe.……..…9
Figure 4: Affection of the spike height by regularity of the interface…………………………………………..…..9
Figure 5: The zeiss IOL master...…………………………………….………………………………………...…..12
Figure 6: An example of a typical SS-OCT biometry optical B-scan ……………………...…………...…...…….13
Figure 7: Poor fixation (on the left); Correct fixation (on the right)……………………..…………………..…….15
Figure 8: Comparison of the biometry device scan (A) and the SD-OCT scan in inverted color (B) for a macular
hole………………………………………………………………………..………………………………..………15
Figure 9: Example for A-Scan IOL calculation print out….…………………………………...………………….21
Figure 10: Correct detection of the ocular interfaces (cornea, lens, and retina) in a SS-OCT biometry optical B-
scan………………………………………………………………………………………………………………....22
Figure 11: Coarse alignment of IOL master……...………….…………………………………………………….23
Figure 12: Fine alignment of IOL master……...….……...………………………………………………………..24
Figure 13: Fine alignment for retinal scan….…...………..………………………………………………………..24
Figure 14: Quality check.…...………………….…………………………………………………………………..25
Figure 15: Analysis…...……….………………………….………………………………………………………..26
Figure 16: IOL calculation paper…….……………….……………………………………………………………27
Figure 17: Biometric values paper……...……………….…………………………………………………………28

Figure 18: Pie chart representing Different age groups percentage within the study group….…………...…….….32
Figure 19: Pie chart representing Gender distribution in study group….……………………………...…………..33
Figure 20: Pie chart representing types of cataract in the study group.…...………………………………….……34
Figure 21: Comparison between axial lengths (AXL) measured by IOL master and measured by A-scan in the
emmetropic group…………………………………………………….……………………………………………37
Figure 22: Comparison between mean absolute errors (MAE) measured by IOL master and A-scan……………44
Figure 23: Comparison between mean absolute errors (MAE) measured by IOL master and A-scan in the
emmetropic group……………………………………………….…………………………………………………46
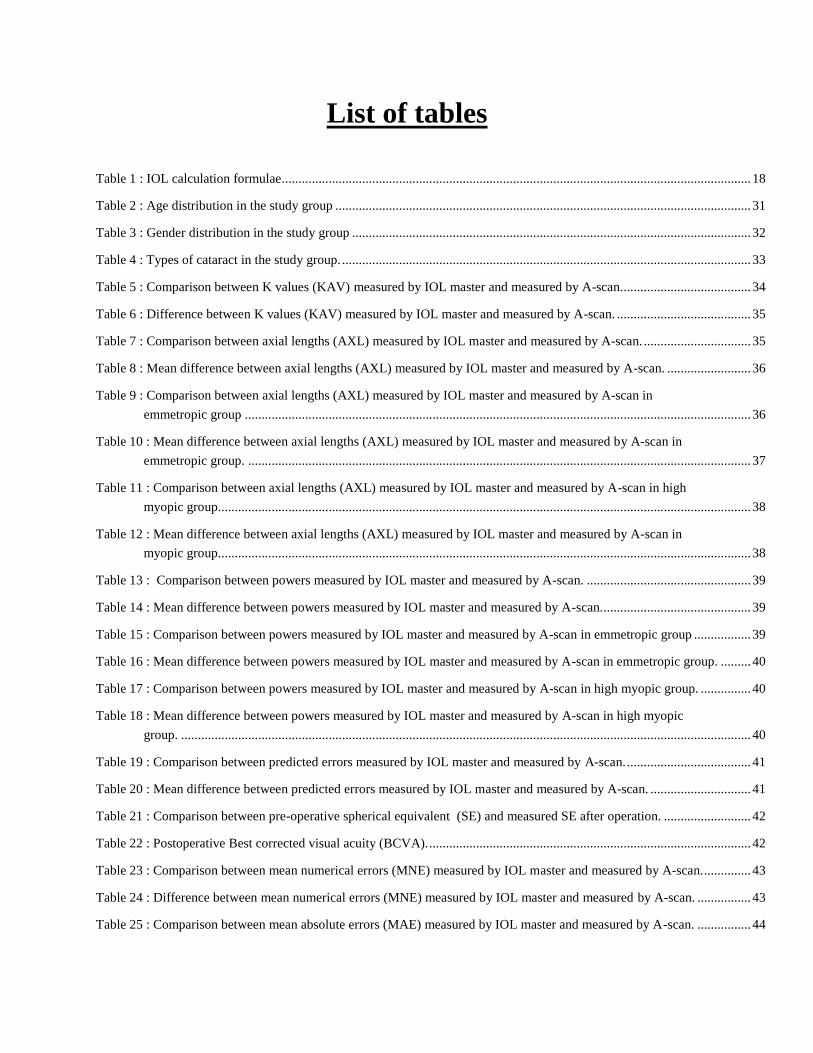
List of tables
Table 1 : IOL calculation formulae............................................................................................................................................ 18
Table 2 : Age distribution in the study group ............................................................................................................................ 31
Table 3 : Gender distribution in the study group ....................................................................................................................... 32
Table 4 : Types of cataract in the study group. .......................................................................................................................... 33
Table 5 : Comparison between K values (KAV) measured by IOL master and measured by A-scan. ...................................... 34
Table 6 : Difference between K values (KAV) measured by IOL master and measured by A-scan. ........................................ 35
Table 7 : Comparison between axial lengths (AXL) measured by IOL master and measured by A-scan. ................................ 35
Table 8 : Mean difference between axial lengths (AXL) measured by IOL master and measured by A-scan. ......................... 36
Table 9 : Comparison between axial lengths (AXL) measured by IOL master and measured by A-scan in
emmetropic group ....................................................................................................................................................... 36
Table 10 : Mean difference between axial lengths (AXL) measured by IOL master and measured by A-scan in
emmetropic group. ...................................................................................................................................................... 37
Table 11 : Comparison between axial lengths (AXL) measured by IOL master and measured by A-scan in high
myopic group............................................................................................................................................................... 38
Table 12 : Mean difference between axial lengths (AXL) measured by IOL master and measured by A-scan in
myopic group............................................................................................................................................................... 38
Table 13 : Comparison between powers measured by IOL master and measured by A-scan. ................................................. 39
Table 14 : Mean difference between powers measured by IOL master and measured by A-scan. ............................................ 39
Table 15 : Comparison between powers measured by IOL master and measured by A-scan in emmetropic group ................. 39
Table 16 : Mean difference between powers measured by IOL master and measured by A-scan in emmetropic group. ......... 40
Table 17 : Comparison between powers measured by IOL master and measured by A-scan in high myopic group. ............... 40
Table 18 : Mean difference between powers measured by IOL master and measured by A-scan in high myopic
group. .......................................................................................................................................................................... 40
Table 19 : Comparison between predicted errors measured by IOL master and measured by A-scan. ..................................... 41
Table 20 : Mean difference between predicted errors measured by IOL master and measured by A-scan. .............................. 41
Table 21 : Comparison between pre-operative spherical equivalent (SE) and measured SE after operation. .......................... 42
Table 22 : Postoperative Best corrected visual acuity (BCVA). ................................................................................................ 42
Table 23 : Comparison between mean numerical errors (MNE) measured by IOL master and measured by A-scan. .............. 43
Table 24 : Difference between mean numerical errors (MNE) measured by IOL master and measured by A-scan. ................ 43
Table 25 : Comparison between mean absolute errors (MAE) measured by IOL master and measured by A-scan. ................ 44

Table 26 : Difference between mean absolute errors (MAE) measured by IOL master and measured by A-scan. ................... 44
Table 27 : Comparison between mean absolute errors (MAE) measured by IOL master and measured by A-scan in
emmetropic group. ...................................................................................................................................................... 45
Table 28 : Difference between mean absolute errors (MAE) measured by IOL master and measured by A-scan in
emmetropic group. ...................................................................................................................................................... 45
Table 29 : Comparison between mean absolute errors (MAE) measured by IOL master and measured by A-scan in
high myopic group. ..................................................................................................................................................... 46
Table 30 : Difference between mean absolute errors (MAE) measured by IOL master and measured by A-scan in
high myopic group. ..................................................................................................................................................... 47
Table 31 : Postoperative measured spherical equivalent. .......................................................................................................... 47

Aim of the work
The aim of this work is to determine whether intraocular lens (IOL)
power calculations for cataract surgery -as measured by postoperative
refractive error- using IOL master are more accurate in improving
postoperative outcomes than applanation ultrasounic biometry (AUS) in
highly myopic versus emmetropic eyes.

Introduction
Cataract is the leading cause of preventable blindness worldwide. Cataract
extraction with implantation of an intraocular lens (IOL) is the most frequently performed
ophthalmic surgical procedure worldwide, and perhaps the most effective surgical
procedure in all of medicine. However, accurate calculation of the IOL power for attaining
the desired postoperative refraction remains a research issue. (Raymond et all, 2009).
Several factors affect the refractive outcome after cataract surgery, including axial
length, keratometry, and lens formulas. Of these factors the preoperative axial length
measurement is a key determinant in the choice of intra-ocular lens (IOL) power when
performing cataract surgery (Raymond et all, 2009).
Preoperative error in axial length measurement is the most significant factor in IOL
power miscalculation. A 1 mm error in AL measurement results in a refractive error of
2.35 D in a 23.5 mm eye. This refractive error declines to 1.75 D/mm in a 30mm eye but
rises to 3.75 D/mm in a 20mm eye. This means that accuracy of AL measurement is more
important in a short eye than in a long one (Qing-Hua Yang et all, 2014).
Historically, the most common technique used among biometrists for AL
measurement is applanation ultrasonic biometry (AUS). Recently, partial coherence laser
interferometry (PCLI) for AL measurements is preferred for IOL calculation (Raymond et
all, 2009).
Ultrasonic biometry requires contact of a transducer with the eye either by direct
contact in the applanation technique or indirect contact in the immersion one. Differences
in AL between immersion and applanation reach up to 0.36 mm due to various amounts of
pressure exerted on the eye during applanation, however applanation is widely used for
biometry. Studies show that errors from AL measurement with ultrasonic biometry are
responsible for 54% of the refractive errors after cataract surgery and IOL implantation.
(Eleftheriadis, 2003)
Applanation ultrasonic technique can result in corneal epithelial injury, infection,
patient discomfort and errors due to corneal indentation. It‟s also confounded by certain
clinical problems such as globe deformities, myopic staphyloma, and silicone oil
tamponade. (Roessler et all, 2014)
Partial coherence laser interferometry (PCLI), which is based on the principle
similar to that of the optical coherence tomography has been developed to overcome
ultrasound limitation. This method doesn‟t need contact with the patient so it has the
advantage of giving the patient less discomfort and has a low observer error. (Moon et all,
2014)
When staphylomas are present in highly myopic eye, PCLI could be an advantage
as it allows evaluation of the axial length along the visual axis. (Roessler et all, 2014)
In eyes with a 4+ nuclear sclerotic cataract or a white cataract, PCLI cannot get a
reading. The patient has to be able to achieve fixation, and the light from the instrument
has to be able to reach the fovea and return to the detector. The technology will not work
with cataracts that reduce the patient‟s visual acuity to 3/60 to fnger counting, i.e. about
5% to 10% of patients in a typical practice. In those patients, we must use the available
back-up technology, which is ultrasound. (Holladay, 2009)
Since partial coherence laser interferometry (PCLI) relies on adequate foveal
fixation, eyes with corneal scarring, posterior capsule plaques, eccentric fixation, and
macular degenerations fail to obtain reliable results (Rajan et all, 2002).

The A- scan ultrasound
Sound is a vibratory disturbance within a liquid or solid that travels in a wave
pattern. Sound is audible to the human ear when the sound frequency is between 20 hertz
(Hz) and 20,000 Hz. To be considered ultrasound, sound waves must have a frequency
more than 20,000 Hz (20 KHz), rendering them too high in frequency to be audible to the
human ear. (Byrne & Green, 2002)
The principles of ocular ultrasound are the same as other applications of this
technology. The sound waves that have a frequency greater than 20 kHz travel along the
tissues and are reflected back to the transducer. When the sound waves return, a piezo-
electric crystal in the transducer vibrates, resulting in electrical impulses that are
translated into an image or other data. (Shlensky & Alexander, 2015)
Higher frequency waves have a lower tissue penetration capability than low
frequency waves, but have better resolution. Most A-scan and B-scan ultrasound probes
use extremely high frequency of approximately 10 million Hz (10 MHz) which is
predesigned by the manufacturer. These high frequent waves allow for excellent resolution
and restricted depth of penetration. (Byrne, 1995)
All waves including ultrasonic, have predictive behaviors based on the properties of
the medium they travel through. Sound waves have a higher velocity when traveling
through solids than through liquids.This is an important principle to understand because

the eye is composed of both. In A-scan biometry, the ultrasonic waves travel through the
solid cornea, the liquid aqueous, the solid lens, the liquid vitreous, the solid retina, choroid,
sclera, and then orbital tissue; therefore, it continually changes velocity. (Shlensky &
Alexander, 2015)
The sound velocity through the cornea and the lens (average lens velocity for the
cataract age group, ie, approximately 50-65 y) is 1641 meters/second (m/s), and the sound
velocity through the aqueous and vitreous is 1532 m/s. The average velocity through the
phakic eye is 1555 m/s, while it is 1532 m/s through the aphakic eye. The velocity through
the pseudophakic eye is 1532 m/s plus the correction factor for the intraocular lens (IOL)
material. (Hoffer et all, 1994)
Ultrasonic examinations of soft tissues use reflective systems analogous to those used
in radar and sonar. This approach allows examination within a thin “slice” through tissue
structures. In A-scan biometry, one thin parallel sound beam is emitted from the probe tip
at a frequency of approximately 10 MHz, then reflected back to the probe tip as the sound
beam strikes each interface. An interface is the junction between two media of different
velocities and densities, which in the eye, includes the anterior corneal surface, the
aqueous-anterior lens surface, the posterior lens capsule-anterior vitreous, the posterior
vitreous-retinal surface, and the choroid-anterior scleral surface. (Coleman, 2005)
The echoes that are received back into the probe from each interface are converted
by the biometer to spikes arising from a baseline. If the difference in the two media at each
interface is great, the echo is strong and the displayed spike is high. If that difference is
small, the echo is weak and the spike is short (eg, vitreous floaters, posterior vitreous
Copyright © 2022 FDOKUMEN