
Relative Deprivation, Attitude Contrast Projection, and Opinion ...
Stereopsis From Contrast Envelopes �Keith Langley+, David J. Fleet!, and Paul B. Hibbard+.AbstractWe report two experiments concerning the site of the principal nonlinearity insecond-order stereopsis. The �rst exploits the asymmetry in perceiving transparencywith second-order stimuli found by Langley et al. (1998), i.e., the product of apositive-valued contrast envelope and a mean-zero carrier grating can be seen trans-parently only when the disparities are consistent with the envelope appearing infront of the carrier. We measured the energy at the envelope frequencies that mustbe added in order to negate this asymmetry. We report that this amplitude canbe predicted from the envelope sidebands and not from the magnitude compressivepre-cortical nonlinearities measured by other researchers. In the second experiment,contrast threshold elevations were measured for the discrimination of envelope dis-parities following adaptation to sinusoidal gratings. It is reported that perceptionof the envelope's depth was a�ected most when the adapting grating was similar(in orientation and frequency) to the carrier, rather than to the contrast envelope.These results suggest that the principal nonlinearity in second-order stereopsis iscortical, occurring after orientation- and frequency-selective linear �ltering.KeyWords: Second-order Stereopsis,Multiplicative Transparency ,Depth Asym-metry�Portions of this research were presented at ECVP 1994 and 1995 and Hibbard's Ph.D Thesis.+Department of Psychology, University College London, London, U.K.!Department of Computing and Information Science, Queen's University, Kingston, Canada.1
IntroductionA central issue in stereopsis concerns the way in which left and right eyes' views are com-bined to solve the correspondence problem and to recover three dimensional scene struc-ture. Conventional models posit that matching relies on interocular correlation of monoc-ular band-pass signals (e.g., Cormack, Stevenson and Schor, 1991; DeAngelis, Ohzawaand Freeman, 1995; Mallot, Arndt and Bultho�, 1995; Fleet, Wagner and Heeger, 1996).But there are classes of signals (often called non-Fourier or second-order), the percep-tion of which is not well captured by these models. Examples include texture boundaries(Frisby and Mayhew, 1978), motion boundaries (Halpern, 1991), and contrast envelopes(Liu, Schor and Ramachandran, 1992; Sato and Nishida, 1993; 1994; Hess and Wilcox,1994; Wilcox and Hess, 1995, 1996, 1997; Fleet and Langley, 1994b; Hibbard, Langleyand Fleet, 1995; Lin and Wilson, 1995).There are several plausible models for second-order visual processing, all of which involvean important nonlinearity at some stage. There are single-channel models that involve anearly, pre-cortical nonlinearity (e.g., Burton, 1973). Such models have received attentionin the context of second-order motion (e.g., Brown, 1995; Scott-Samuel and Georgeson,1995). According to this model, the nonlinearity introduces a distortion product into thevisual signal at the frequencies of the contrast envelope (Derrington and Badcock, 1986).This distortion product would then be processed by a conventional �rst-order model ofbinocular matching to deliver the disparity information present in the second-order signal.There is increasing support, however, for a two-channel model. The two-channel modelsused to explain stereopsis resemble those forwarded in visual motion, with a separatechannel for processing the second-order signal (Chubb and Sperling, 1988; Turano andPantle, 1989; Victor and Conte, 1992; Wilson, Ferrera, and Yo, 1992; Zanker, 1993; Fleetand Langley, 1994a; Langley, 1997, 1999). These models di�er in several ways, includingboth the site and the mathematical form of the nonlinearity. Many models suppose acortical nonlinearity, so that the visual signal is processed by linear �lters tuned to spatialfrequency and orientation before the nonlinearity, and before second-order matching takes2
place.The form of linear �ltering that precedes the nonlinearity is informative experimentally. Ifone �nds that this �ltering is selective to spatial frequency and orientation, then a corticalnonlinerity is implied. Conversely, if it is broad-band and isotropic then a pre-corticalnonlinearity is implied, perhaps owing to the compressive nonlinearity of neurons foundin the LGN (Sclar et al., 1990; Scott-Samuel and Georgeson, 1995). Similar issues existconcerning the perception of monocular contrast envelopes (Burton, 1973; Henning et al.1975; Derrington and Badcock, 1986; Langley et al., 1996; Mareschal and Baker, 1998),and in the context of second-order motion (Chubb and Sperling, 1988; Wilson et al. 1992;Fleet and Langley, 1994a).Wilcox and Hess (1996) posited that the nonlinearity occurs before the binocular com-bination of monocular signals. They also showed that second-order stereopsis could bedi�cult when the carrier orientations in contrast-modulated inputs where di�erent, sug-gesting that orientation-speci�c processing precedes the nonlinearity. In contrast, Langleyet al. (1998) (see also Liu et al., 1992) have shown that binocular depth perception fromcontrast envelopes is possible when carrier gratings di�er signi�cantly in spatial frequency.The reasons for this discrepancy could re ect di�erences in the paradigms and stimuliused.This paper addresses the site of the nonlinearity with two experiments. The �rst exploitsthe results of Langley et al. (1998) who examined disparity thresholds for sums (�rst-order) and products (second-order) of binocular gratings like those used here (see Fig. 1).They found that, when viewed binocularly, the sum of two 1-d gratings of di�erent spatialfrequency and orientation may be seen transparently. Either grating can be perceived infront of or behind the other, depending on the disparities of the respective gratings. Whenthe same two gratings were multiplied together transparency also occurred, but there wasan asymmetry. The contrast envelope was only perceived in a separate depth plane whenin front of the carrier; it was never seen as the underlaying surface.To explain the depth asymmetry Langley et al. (1998) (see also Kersten, 1991) applied the3
constraints on the perception of monocular transparency proposed by Metelli (1974): (i)no matter how a monocular transparency is produced, the overlaying transparent surfacemust not change the order of luminance values re ected from the underlaying surface;and (ii) when lightness values are attenuated by a transparent surface, local di�erencesin lightness seen through the transparent surface must be less than those seen withoutthe transparent surface. If one assumes that these constraints in uence binocular depthperception, then the asymmetry can be explained.Metelli's constraints also predict that the product of the two positive-valued signals usedin our study may be perceived symmetrically in depth; either signal may be seen in-front ofor behind the other. This is because both signals satisfy Metelli'smonocular constraints ontransparency so that a monocular cue could not be used by the visual system to in uencebinocular depth perception (see also Kersten, 1991). This case, consistent with the resultsof Langley et al. (1998), is exploited in the �rst experiment here. In particular, one canadd power at the envelope frequencies to a second-order signal to create a stimulus thatis equal to a product of positive-valued gratings, and is therefore perceived symmetricallytransparent. Here, we measured the amplitude of additive signal at envelope frequenciesthat was required to override the depth asymmetry. We then compared these thresholdsto those predicted from two models, namely, a single channel model with a compressivenonlinearity as measured in other studies (Brown, 1995; Scott-Samuel and Georgeson,1995), and a model that depends on the energy of the second-order signal.We report that this amplitude may be predicted from the sum of the contrast envelope'ssidebands1 rather than the that expected from the magnitude of pre-cortical nonlinearitiesas measured in other studies (Burton, 1973; Henning et al., 1975; Sclar et al, 1990; Scott-Samuel and Georgeson, 1995).In our second experiment, subjects were adapted to a high contrast sinusoidal grating andthen asked to detect the relative depth of the contrast envelope in a contrast-modulatedtest stimulus. If the site of adaptation was after the nonlinearity, then one would expect1The sidebands are the frequencies on either side of the carrier frequency at which there is nonzeropower. These sidebands grow in amplitude with the depth of contrast modulation.4
the most e�ective adapting frequencies to be similar to those of the envelope. If the siteof the adaptation was before the nonlinearity, then we would expect that the carrier fre-quency would make the most e�ective adapting stimulus. If the e�ect of the adaptationwas strongly orientation- and frequency-speci�c, then this implies that it occurs in visualcortex. We report that adaptation caused the largest threshold elevations when the fre-quency and orientation of the adapting grating were close to the carrier rather than to theenvelope. Moreover, the adaptation was orientation and frequency speci�c. From thesedata, we conclude that the site of the nonlinearity occurs in the cortex, after orientationand frequency selective �ltering.MethodsSubjectsThree subjects were used for each experiment. Two subjects were authors. The third sub-ject did not know the purpose of the experiments. All subjects had normal or corrected-to-normal vision.ApparatusBinocular images were presented on a SONY monitor with a refresh rate of 76Hz and256 grey scales. Eight-bit quantization, although crude, was thought su�cient becausecontrast thresholds for the discrimination of envelope disparity in our experiments weretypically close to 2%. The luminance of the monitor was linearised by taking luminancemeasurements with a photometer, to which a logarithmic curve was �tted and a linearlookup table generated. The residual error from the �tted curve was no more than 0.2%of the luminance at any one of the sample points. The mean luminance was 37.7 cd/m2.Experiments were carried out in a darkened room. The only visible illumination originated5

from the monitor. A modi�ed Wheatstone stereoscope was used to view the binocularimages on a single monitor. The distance from the screen to the stereoscope was 44 cm.The stereoscope was adjusted so that the stereo image pairs were aligned using parallelviewing geometry. The visual extent of each monocular image was 7.9 degrees. Imagepixels were square with a width of 2.0 minutes. A �xation spot was used as a referencepoint to help keep vergence �xed.StimuliThe basic second-order stimuli were contrast-modulated sinusoidal gratings. Some exam-ples are shown in Fig. 1A. The envelope, 12(1 + mE(x; y)), was an approximation to asquare-wave grating formed by summing the �rst and third harmonics. Here, m is thedepth of modulation (between 0 and 1), and E(x; y) is given by :E(x; y) = � �sin(!x) + 13 sin(3!x)� (1)where ! is the fundamental frequency of the envelope, and � is chosen so that E oscillatesbetween 1 and -1.Given the envelope and a carrier, C(x; y), the mathematical form of the left and rightcontrast-modulated test stimuli is :Tl(x; y) = �2 �1 + a2 (1 +mE(x+ d=2; y)) C(x; y) � ; (2)Tr(x; y) = �2 �1 + a2 (1 +mE(x� d=2; y)) C(x; y) � : (3)where � is the mean luminance, a denotes the contrast of the carrier prior to the contrastmodulation, and d is the positional disparity. The stimuli were visible only within acircular window as shown in Figure 1. For Experiment 1, the surrounds of the circularwindow were black as in Figure 1. In Experiment 2, the surrounds were equal to themean luminance. For all these experiments, C(x; y) was a horizontal sinusoidal grating.Its spatial frequency was either 2.25 or 4.5 cycles per degree (cpd).6
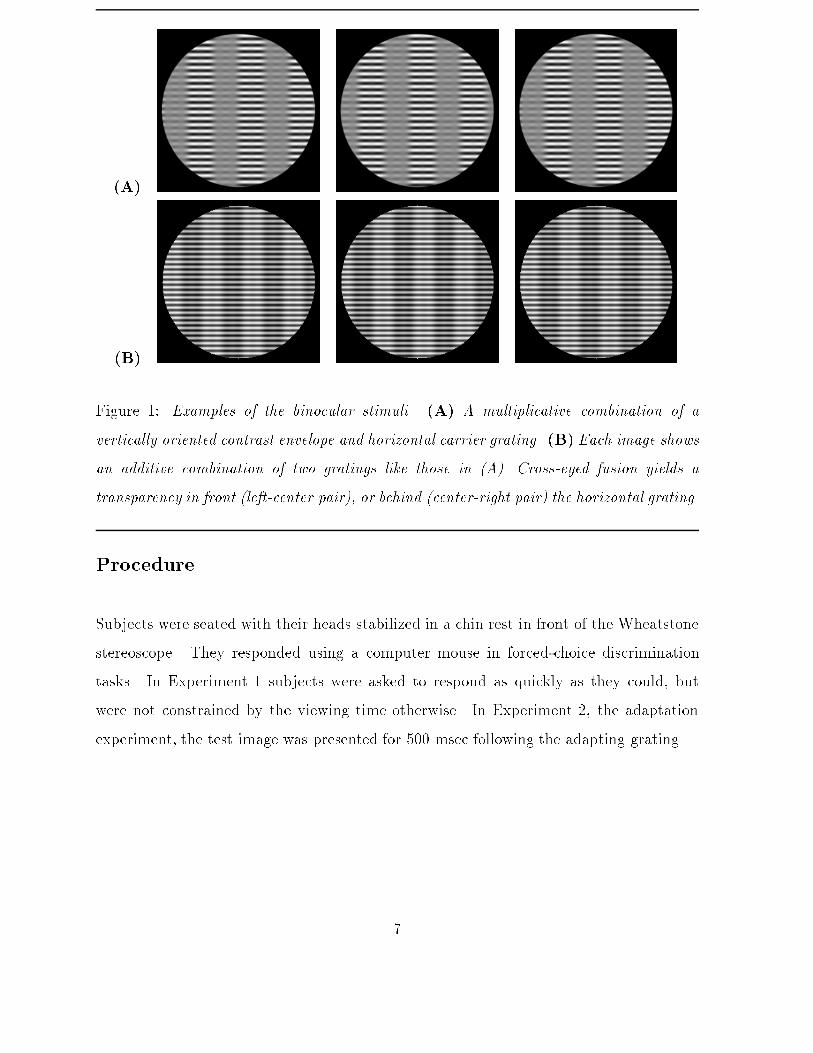
(A)(B)Figure 1: Examples of the binocular stimuli. (A) A multiplicative combination of avertically oriented contrast envelope and horizontal carrier grating. (B) Each image showsan additive combination of two gratings like those in (A). Cross-eyed fusion yields atransparency in front (left-center pair), or behind (center-right pair) the horizontal grating.ProcedureSubjects were seated with their heads stabilized in a chin rest in front of the Wheatstonestereoscope. They responded using a computer mouse in forced-choice discriminationtasks. In Experiment 1 subjects were asked to respond as quickly as they could, butwere not constrained by the viewing time otherwise. In Experiment 2, the adaptationexperiment, the test image was presented for 500 msec following the adapting grating.
7
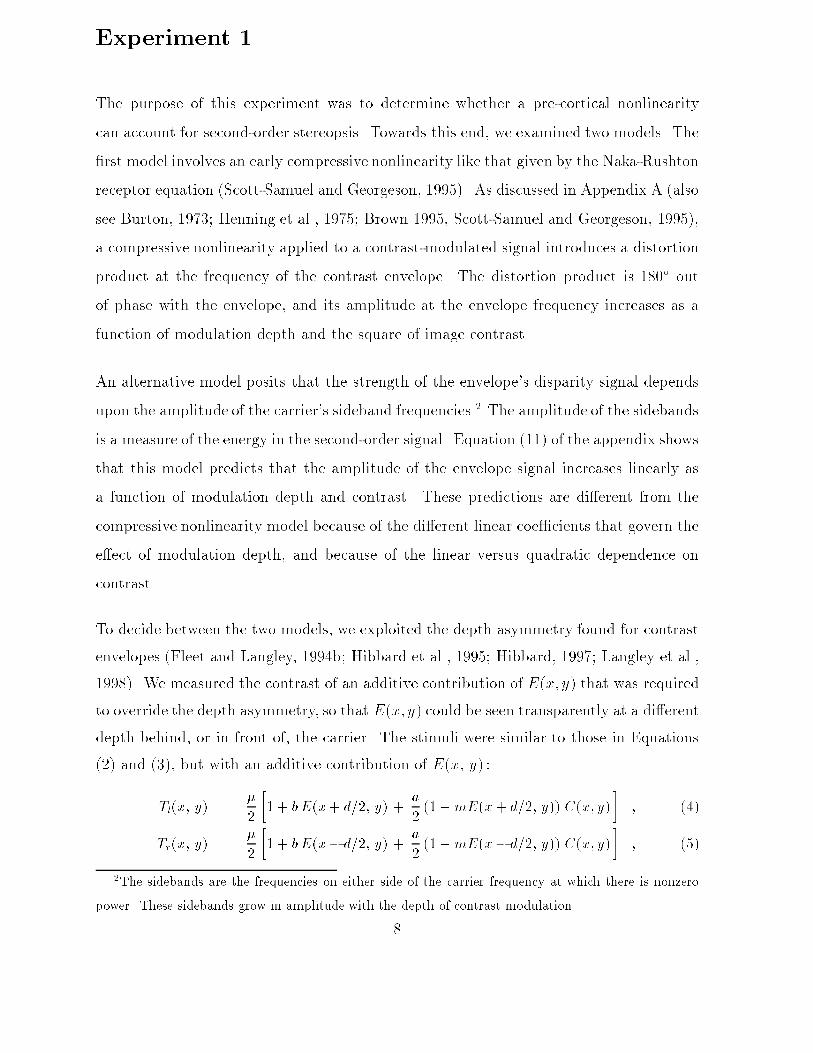
Experiment 1The purpose of this experiment was to determine whether a pre-cortical nonlinearitycan account for second-order stereopsis. Towards this end, we examined two models. The�rst model involves an early compressive nonlinearity like that given by the Naka-Rushtonreceptor equation (Scott-Samuel and Georgeson, 1995). As discussed in Appendix A (alsosee Burton, 1973; Henning et al., 1975; Brown 1995, Scott-Samuel and Georgeson, 1995),a compressive nonlinearity applied to a contrast-modulated signal introduces a distortionproduct at the frequency of the contrast envelope. The distortion product is 180� outof phase with the envelope, and its amplitude at the envelope frequency increases as afunction of modulation depth and the square of image contrast.An alternative model posits that the strength of the envelope's disparity signal dependsupon the amplitude of the carrier's sideband frequencies.2 The amplitude of the sidebandsis a measure of the energy in the second-order signal. Equation (11) of the appendix showsthat this model predicts that the amplitude of the envelope signal increases linearly asa function of modulation depth and contrast. These predictions are di�erent from thecompressive nonlinearity model because of the di�erent linear coe�cients that govern thee�ect of modulation depth, and because of the linear versus quadratic dependence oncontrast.To decide between the two models, we exploited the depth asymmetry found for contrastenvelopes (Fleet and Langley, 1994b; Hibbard et al., 1995; Hibbard, 1997; Langley et al.,1998). We measured the contrast of an additive contribution of E(x; y) that was requiredto override the depth asymmetry, so that E(x; y) could be seen transparently at a di�erentdepth behind, or in front of, the carrier. The stimuli were similar to those in Equations(2) and (3), but with an additive contribution of E(x; y) :Tl(x; y) = �2 �1 + bE(x+ d=2; y) + a2 (1 +mE(x+ d=2; y)) C(x; y) � ; (4)Tr(x; y) = �2 �1 + bE(x� d=2; y) + a2 (1 +mE(x� d=2; y)) C(x; y) � ; (5)2The sidebands are the frequencies on either side of the carrier frequency at which there is nonzeropower. These sidebands grow in amplitude with the depth of contrast modulation.8

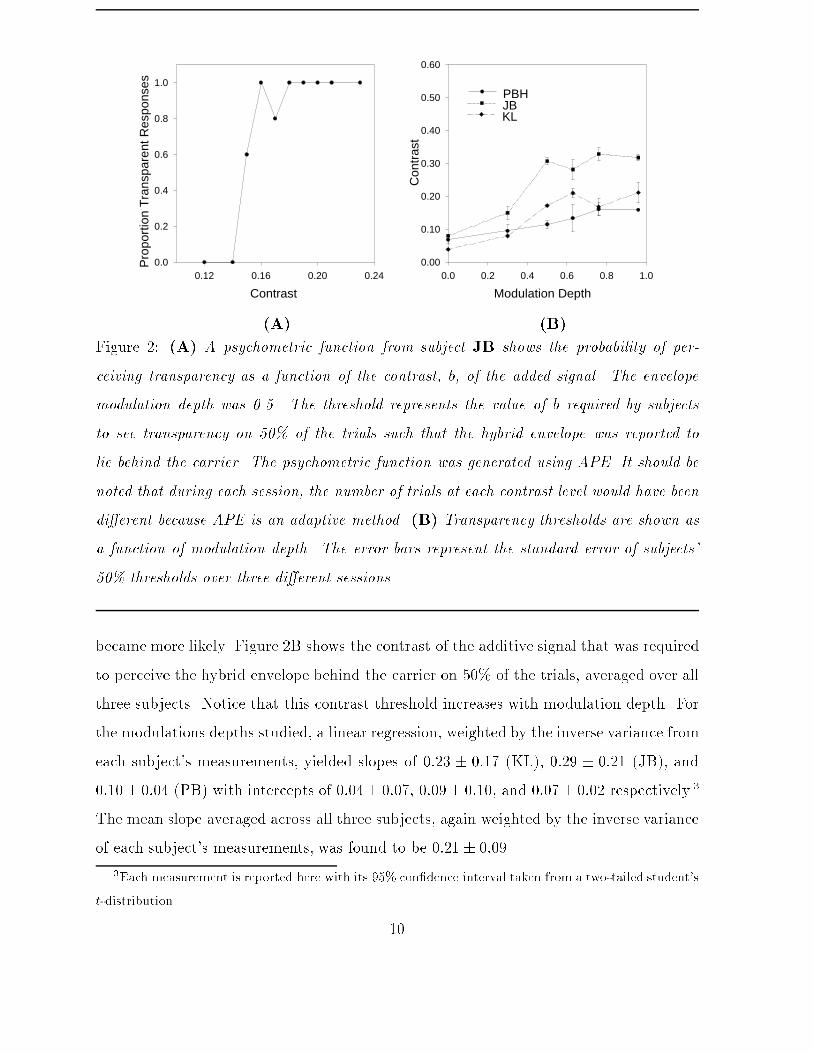
where � is the mean luminance, b is the contrast of the additive contribution of E(x; y), ais the mean contrast of the original contrast-modulated term, and a and b are constrainedso that a+ b � 1. In di�erent sessions, we varied the modulation depth m of the envelopeso we could test the predictions of each model. The range of m that we tested is shownin Fig. 2B. In order to have a wide range of contrasts available at which we could testfor the threshold of b, the contrast of the carrier was �xed at 0.3. The spatial frequenciesof E(x; y) and C(x; y) were 0.45 and 4.5 cpd respectively. Note that while a distortionproduct introduces power that is 180� out of phase with the envelope, the additive signalhere is in-phase with the envelope.On each trial, subjects reported whether the combined envelope and luminance signal(referred to below as the hybrid envelope) was seen behind the horizontal grating. Whenb was su�ciently large, subjects reported that the horizontal carrier was perceived in thedepth plane of the �xation spot (Wurger and Landy, 1989; Langley et al., 1998), with thehybrid envelope appearing transparently behind it. On the other hand, when b was toosmall, subjects reported a at (coherent) surface. This can veri�ed by cross-eyed fusionof Fig. 1A. The disparity of the envelope was uncrossed and �xed at 20 minutes. At thisdisparity, with b = 0, all subjects reported a at (coherent) surface.Within a single session (for a �xed value of m), the contrast of the additive signal, b,was controlled from trial to trial in an adaptive fashion using APE (Watt and Andrews,1981). Psychometric functions were �tted to the data. The magnitude of b at which thesubjects reported that the carrier lay in front of the hybrid envelope on 50% of the trialswas taken as the contrast threshold. Each session was repeated three times to obtainthreshold values for each condition.Results and DiscussionFigure 2 summarizes the results. Figure 2A shows JB's psychometric function for onesession, when m = 0:5. As the contrast b increased, the percept of transparency (ie., one'sability to observe the vertical structure at a di�erent depth than the horizontal structure)9
Contrast
0.12 0.16 0.20 0.24
Pro
port
ion
Tra
nspa
rent
Res
pons
es
0.0
0.2
0.4
0.6
0.8
1.0
Modulation Depth
0.0 0.2 0.4 0.6 0.8 1.0
Con
tras
t
0.00
0.10
0.20
0.30
0.40
0.50
0.60
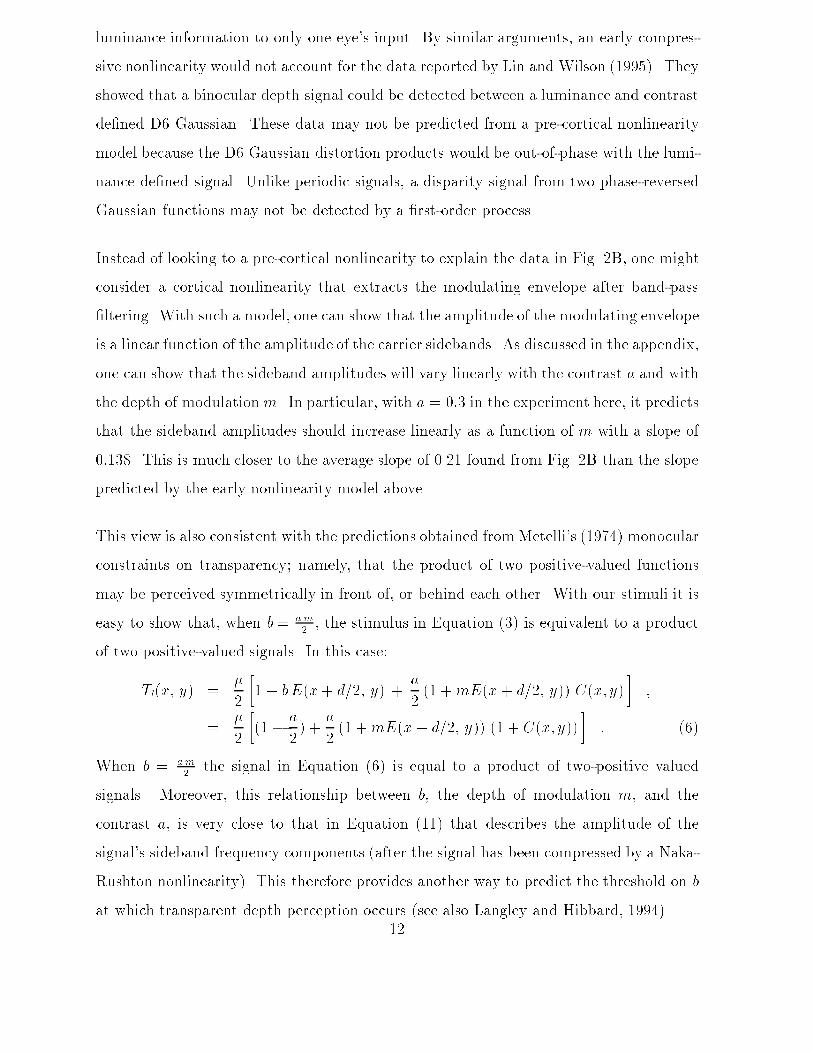
JBPBH
KL
(A) (B)Figure 2: (A) A psychometric function from subject JB shows the probability of per-ceiving transparency as a function of the contrast, b, of the added signal. The envelopemodulation depth was 0.5. The threshold represents the value of b required by subjectsto see transparency on 50% of the trials such that the hybrid envelope was reported tolie behind the carrier. The psychometric function was generated using APE. It should benoted that during each session, the number of trials at each contrast level would have beendi�erent because APE is an adaptive method. (B) Transparency thresholds are shown asa function of modulation depth. The error bars represent the standard error of subjects'50% thresholds over three di�erent sessions.became more likely. Figure 2B shows the contrast of the additive signal that was requiredto perceive the hybrid envelope behind the carrier on 50% of the trials, averaged over allthree subjects. Notice that this contrast threshold increases with modulation depth. Forthe modulations depths studied, a linear regression, weighted by the inverse variance fromeach subject's measurements, yielded slopes of 0:23 � 0:17 (KL), 0:29 � 0:21 (JB), and0:10� 0:04 (PB) with intercepts of 0:04� 0:07, 0:09� 0:10, and 0:07� 0:02 respectively.3The mean slope averaged across all three subjects, again weighted by the inverse varianceof each subject's measurements, was found to be 0:21 � 0:09.3Each measurement is reported here with its 95% con�dence interval taken from a two-tailed student'st-distribution. 10

We now consider which of the models discussed above might account for the data in Fig.2. In particular, we consider one model based upon distortion products introduced byan early Naka-Rushton nonlinearity like that proposed by Scott-Samuel and Georgeson(1995). We also consider a model in which the contrast envelope is explicitly extracted by,for example, a quadratic nonlinearity often used in an energy mechanism. The appendixexplains some speci�c predictions of these two models that are used below.The �rst problem with the early nonlinearity model concerns the expected amplitude ofthe distortion product. We applied the Naka-Rushton nonlinearity to our stimuli withthe parameters determined by Scott-Samuel and Georgeson (1995) and found that theamplitudes of the distortions products were too small. For example, in the conditionshown in Fig. 2, with m = 0:5 and a = 0:3, the contrast of the envelope's distortionproduct was estimated at 0.007. However, a 0.45 cpd luminance grating alone at thiscontrast is insu�cient to yield a depth percept. By comparison, Fig. 3B shows that themean disparity thresholds when the modulation depth was zero (which is a simple additivetransparency condition as shown in Fig. 1B) was 0:06 � 0:04. Therefore, the amplitudeof the distortion products introduced by the Naka-Rushton nonlinearity are below thecontrast threshold required to produce a reliable disparity signal for the stimuli used inour experiments.Equation (10) in the appendix also shows that, according to this form of nonlinearity, thecontrast b required to override the asymmetry should increase as a function of modulationdepth with a slope close to 0.0144. As calculated from Fig. 2, the mean slope for the threesubjects was 0:21 � 0:09. This value departs signi�cantly the predicted value of 0.0144that was obtained from the pre-cortical nonlinearity model.Finally, concerning the pre-cortical nonlinearity model, it is interesting to note that thedistortion product and the additive signal bE(x; y) are expected to be 180� out of phase.Therefore one might expect that there should be a value of b for which they combine de-structively and cancel. In this case one would expect no resultant disparity cue and a lossin depth sensation. We found no circumstances in which added luminance informationnulled the depth signal in the contrast envelope. This was also the case when we added11
luminance information to only one eye's input. By similar arguments, an early compres-sive nonlinearity would not account for the data reported by Lin and Wilson (1995). Theyshowed that a binocular depth signal could be detected between a luminance and contrastde�ned D6 Gaussian. These data may not be predicted from a pre-cortical nonlinearitymodel because the D6 Gaussian distortion products would be out-of-phase with the lumi-nance de�ned signal. Unlike periodic signals, a disparity signal from two phase-reversedGaussian functions may not be detected by a �rst-order process.Instead of looking to a pre-cortical nonlinearity to explain the data in Fig. 2B, one mightconsider a cortical nonlinearity that extracts the modulating envelope after band-pass�ltering. With such a model, one can show that the amplitude of the modulating envelopeis a linear function of the amplitude of the carrier sidebands. As discussed in the appendix,one can show that the sideband amplitudes will vary linearly with the contrast a and withthe depth of modulation m. In particular, with a = 0:3 in the experiment here, it predictsthat the sideband amplitudes should increase linearly as a function of m with a slope of0:138. This is much closer to the average slope of 0.21 found from Fig. 2B than the slopepredicted by the early nonlinearity model above.This view is also consistent with the predictions obtained fromMetelli's (1974) monocularconstraints on transparency; namely, that the product of two positive-valued functionsmay be perceived symmetrically in front of, or behind each other. With our stimuli it iseasy to show that, when b = am2 , the stimulus in Equation (3) is equivalent to a productof two positive-valued signals. In this case:Tl(x; y) = �2 �1 + bE(x+ d=2; y) + a2 (1 +mE(x+ d=2; y)) C(x; y) � ;= �2 �(1 � a2) + a2 (1 +mE(x+ d=2; y)) (1 + C(x; y)) � : (6)When b = am2 the signal in Equation (6) is equal to a product of two-positive valuedsignals. Moreover, this relationship between b, the depth of modulation m, and thecontrast a, is very close to that in Equation (11) that describes the amplitude of thesignal's sideband frequency components (after the signal has been compressed by a Naka-Rushton nonlinearity). This therefore provides another way to predict the threshold on bat which transparent depth perception occurs (see also Langley and Hibbard, 1994).12
Finally, it is worth noting that Langley et al. (1998) showed that transparent depthperception for additive combinations of the same signals used here are perceived sym-metrically. In addition to those results, the experiments reported here show that theproduct of the same two signals (when each is de�ned as a positive-valued function) mayalso be perceived symmetrically transparent. These observations rule out the possibilitythat the depth asymmetry found for contrast envelopes occurs solely because of di�erentadditive versus multiplicative combination rules that were used to construct the stimuli.It points to our hypothesis that binocular asymmetries re ect a property of second-orderprocessing, consistent with a two-channel model.Experiment 2In our second experiment, subjects were �rst adapted to a high contrast sinusoidal grating,and then asked to report the relative depth of the envelope in a contrast-modulated teststimulus. The premise behind the experiment was that, if the site of adaptation was afterthe nonlinearity, then the envelope signal would be present (as a �rst-order signal), andone would therefore expect that the most e�ective adapting frequencies would be close tothe envelope frequency. If the site of the adaptation was before the nonlinearity, then theenvelope signal remains implicit in the sideband frequencies near the carrier. Therefore wewould expect that adaptation to frequencies near the carrier would a�ect the perceiveddepth of the envelope signi�cantly. In addition to these two factors, if the adaptationwas strongly orientation- and frequency-speci�c, then this implies that it occurs in visualcortex. In this case one might predict that contrast thresholds (as a function of theadapting grating's frequency) would show the same frequency and orientation dependenttuning as simple cells found in area V1 of the visual cortex (Hubel, 1988; De Valois andDe Valois, 1990).To explore these ideas, we used test stimuli that were the same as those de�ned in Equa-tions (2) and (3). The depth of modulation m was �xed at unity, while the contrast awas varied as an independent variable. In these experiments, the spatial frequency of the13
carrier grating and the contrast envelope were varied in di�erent sessions.Subjects were adapted to a 98%-contrast sinusoidal grating for 2 minutes. The grating wascounterphase ickered at 4Hz to reduce phase-dependent aftere�ects (Georgeson, 1987).Subjects were then shown a binocular test stimulus like that in Fig. 1A for 500ms andasked to report whether the contrast envelope was in front or behind a �xation spot. Thiswas immediately followed by a top-up adaptation period of 6 seconds, followed by anothertest stimulus on each subsequent trial. The contrast of the test stimulus (a in Equations(2) and (3)) was varied using the method of constant stimuli.Baseline contrast thresholds were measured before each session by repeating the sametask without an adapting grating. These data were obtained so that we could computethreshold elevations after adaptation as a multiple of the baseline threshold.A logistic function (ranging from 0.5 to 1) was �tted to the data taken from each subjectin each session. From the resulting psychometric curves, 75%-correct disparity thresholdswere measured. Each measurement was divided by the 75%-correct disparity thresholdstaken from the baseline task to obtain the threshold elevations. Each session consistedof test images presented at 10 di�erent contrast levels, 8 times each. Each session wasrepeated three times, yielding 24 trials at each contrast level.Three sets of sessions were run:� In the �rst set of sessions the frequency of the adapting grating was equal to thecarrier frequency in the test stimulus, and we varied the angle between the adaptinggrating and the carrier grating. This allowed us to examine the importance oforientation when adapting frequencies were close to the carrier. We used angles of0, 10, 25, 45, and 90 deg. The carrier frequency was 4.5 cpd. The fundamentalfrequency of the contrast envelope was 0.45 cpd.� In the second set, the spatial frequency of the adapting grating was varied, but theorientations of the carrier and adapting grating were identical. Two carrier frequen-cies (2.25 and 4.5 cpd) were used to show spatial frequency tuning. The frequencies14
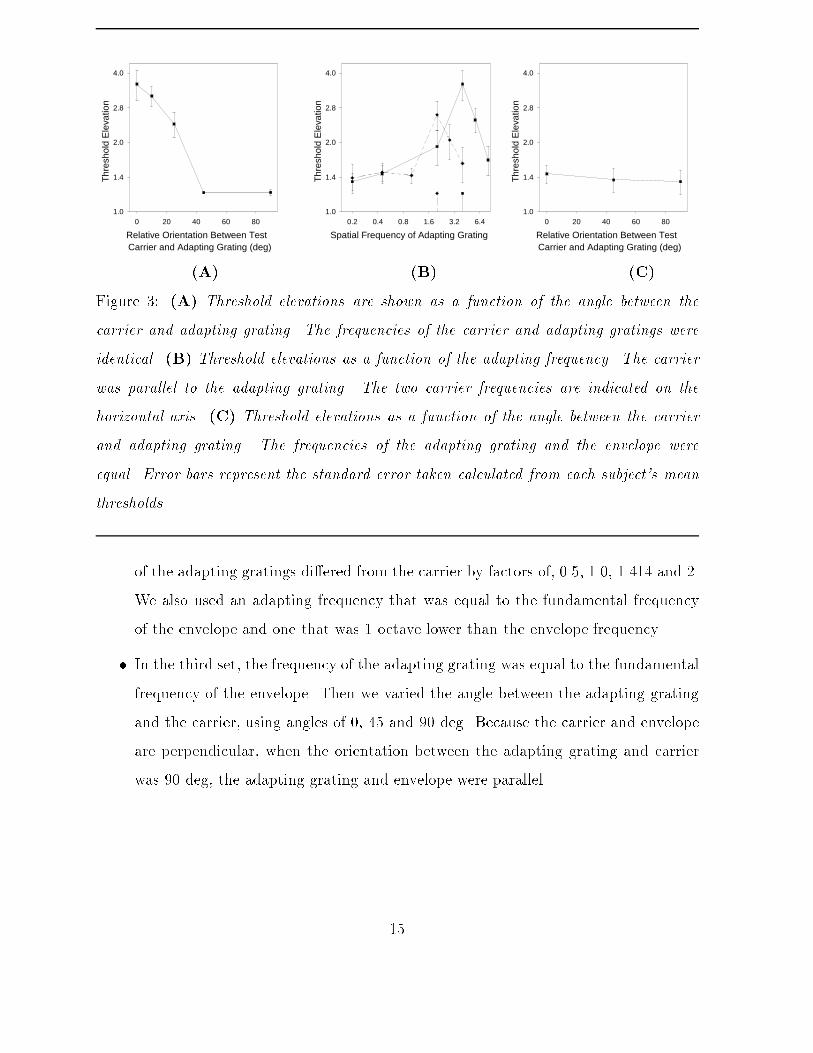
Relative Orientation Between Test
0 20 40 60 80
Thr
esho
ld E
leva
tion
1.0
1.4
2.0
2.8
4.0
Carrier and Adapting Grating (deg)Spatial Frequency of Adapting Grating
0.2 0.4 0.8 1.6 3.2 6.4
Thr
esho
ld E
leva
tion
1.0
1.4
2.0
2.8
4.0
Relative Orientation Between Test
0 20 40 60 80
Thr
esho
ld E
leva
tion
1.0
1.4
2.0
2.8
4.0
Carrier and Adapting Grating (deg)(A) (B) (C)Figure 3: (A) Threshold elevations are shown as a function of the angle between thecarrier and adapting grating. The frequencies of the carrier and adapting gratings wereidentical. (B) Threshold elevations as a function of the adapting frequency. The carrierwas parallel to the adapting grating. The two carrier frequencies are indicated on thehorizontal axis. (C) Threshold elevations as a function of the angle between the carrierand adapting grating. The frequencies of the adapting grating and the envelope wereequal. Error bars represent the standard error taken calculated from each subject's meanthresholds.of the adapting gratings di�ered from the carrier by factors of, 0.5, 1.0, 1.414 and 2.We also used an adapting frequency that was equal to the fundamental frequencyof the envelope and one that was 1 octave lower than the envelope frequency.� In the third set, the frequency of the adapting grating was equal to the fundamentalfrequency of the envelope. Then we varied the angle between the adapting gratingand the carrier, using angles of 0, 45 and 90 deg. Because the carrier and envelopeare perpendicular, when the orientation between the adapting grating and carrierwas 90 deg, the adapting grating and envelope were parallel.15
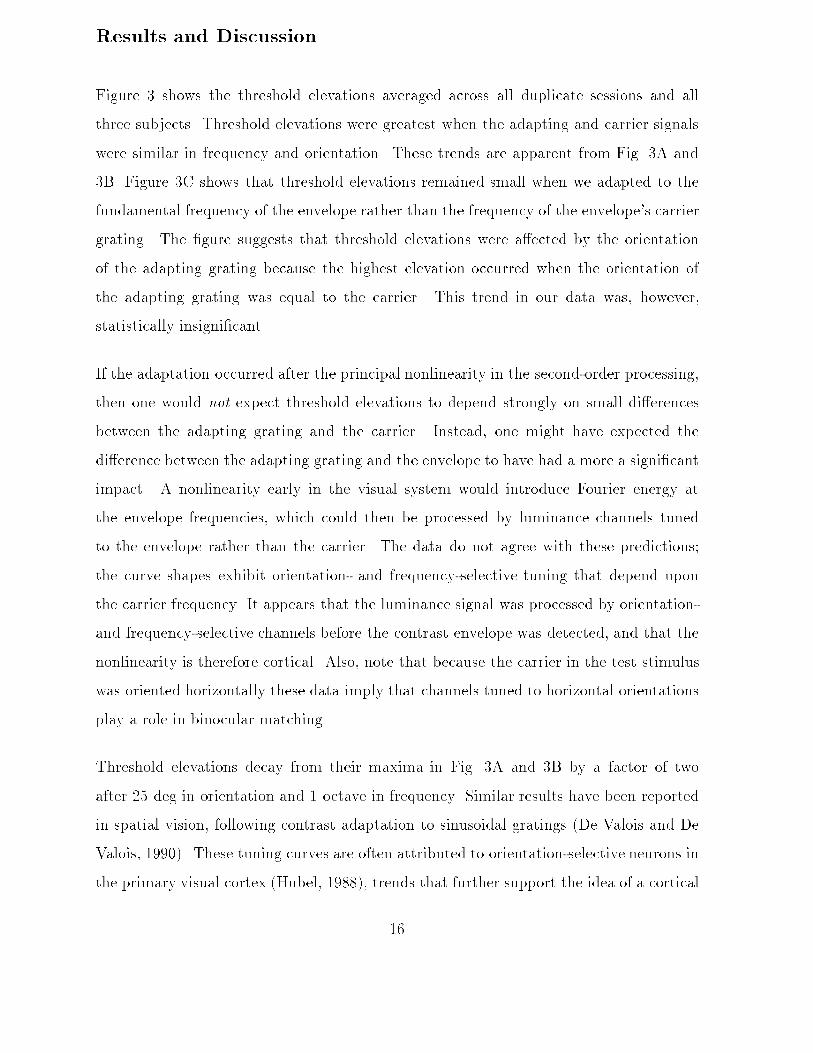
Results and DiscussionFigure 3 shows the threshold elevations averaged across all duplicate sessions and allthree subjects. Threshold elevations were greatest when the adapting and carrier signalswere similar in frequency and orientation. These trends are apparent from Fig. 3A and3B. Figure 3C shows that threshold elevations remained small when we adapted to thefundamental frequency of the envelope rather than the frequency of the envelope's carriergrating. The �gure suggests that threshold elevations were a�ected by the orientationof the adapting grating because the highest elevation occurred when the orientation ofthe adapting grating was equal to the carrier. This trend in our data was, however,statistically insigni�cant.If the adaptation occurred after the principal nonlinearity in the second-order processing,then one would not expect threshold elevations to depend strongly on small di�erencesbetween the adapting grating and the carrier. Instead, one might have expected thedi�erence between the adapting grating and the envelope to have had a more a signi�cantimpact. A nonlinearity early in the visual system would introduce Fourier energy atthe envelope frequencies, which could then be processed by luminance channels tunedto the envelope rather than the carrier. The data do not agree with these predictions;the curve shapes exhibit orientation- and frequency-selective tuning that depend uponthe carrier frequency. It appears that the luminance signal was processed by orientation-and frequency-selective channels before the contrast envelope was detected, and that thenonlinearity is therefore cortical. Also, note that because the carrier in the test stimuluswas oriented horizontally these data imply that channels tuned to horizontal orientationsplay a role in binocular matching.Threshold elevations decay from their maxima in Fig. 3A and 3B by a factor of twoafter 25 deg in orientation and 1 octave in frequency. Similar results have been reportedin spatial vision, following contrast adaptation to sinusoidal gratings (De Valois and DeValois, 1990). These tuning curves are often attributed to orientation-selective neurons inthe primary visual cortex (Hubel, 1988), trends that further support the idea of a cortical16
nonlinearity.Similar results were obtained from an analogous study on the e�ects of adaptation tospatial contrast envelopes that were modulated by sinusoidal gratings (Fleet and Langley,1994b; Langley et al., 1996). These previous experiments concerned contrast thresholdsfor the detection of envelope orientation. Like the data reported here, those experimentsfound that adaptation to the envelope's carrier had the greatest in uence on contrastthresholds for orientation discrimination of the envelope. One can note, however, thatLangley et al., did not test for adaptation at the spatial frequencies of the contrast enve-lope, while these experiments did.There was, however, one notable di�erence between the data reported by Langley et al.(1996) and those found here. In the spatial adaptation paradigm, the threshold elevationsfor contrast envelopes reported by Langley et al. (1996) were almost an order of magnitudelarger than the ones found here. There are two plausible explanations for this di�erence.One was that baseline thresholds for the envelope disparity task used here were higherthan those for envelope orientation discrimination. Thus, in the experiments reportedhere there was less of a di�erence between the adapting contrast and the test contrast.Another explanation may be the disparity selectivity of adaptation, where adaptation toa zero disparity grating mainly a�ects the detection of disparities near zero (Blakemoreand Hague, 1972). In the experiment here the adapting pattern was at zero disparitybut the test patterns had crossed or uncrossed disparities. So one might again expectsomewhat weaker e�ects following contrast adaptation to an envelope's carrier grating.ConclusionsThe data presented in this paper suggest that the site of the principal nonlinearity insecond-order stereopsis is cortical. Experiment 1 showed that the amount of additiveFourier power at envelope frequencies required to over-ride the depth asymmetry reportedby Langley et al. (1998) is inconsistent with a pre-cortical nonlinearity like that examined17
by Scott-Samuel and Georgeson (1995). Rather, it is consistent with an in uence ofMetelli's monocular constraints on binocular transparency, and with the energy containedin the sidebands of the contrast modulated stimuli. Experiment 2, showed that adaptationto the orientation and spatial frequency of the carrier has a more signi�cant impacton one's sensitivity to the contrast envelope. These results suggest that the signi�cantnonlinearity used to extract the envelope information followed orientation and frequencyselective �ltering and occurred in the visual cortex.In light of this, one remaining question concerns the purpose of the early nonlinearitiesreported by other researchers (Burton, 1973; Henning et al., 1975; Scott-Samuel andGeorgeson, 1995). One possible account is based on the anatomical constraints of trans-mitting retinal image signals via the LGN and optic nerve to the primary visual cortex.The transmission of information by neurons is limited by three factors: (i) transmissionbandwidth, (ii) spike rate and (iii) shot noise (Laughlin, 1994). To transmit a faithful rep-resentation of the retinal image, Laughlin (1994) proposed that vertebrate visual systemsoptimise the coding of contrast at the earliest opportunity. One optimisation techniquemay be to introduce a nonlinear (say logarithmic or Naka-Rushton) compression prior totransmission. This would o�er a higher signal to (quantization) noise ratio in comparisonto a linear quantization, especially when transmission bandwidth is limited (eg Schwartz,1987). Following such compression, an inverse transformation is necessary to recoverthe original signal. Such inverse transformations are generally ill-conditioned and hencenoisy. Inverse transformations of this form may also introduce expansive nonlinearitiesinto the processed signal (Schwartz, 1987). Whether these inverse transformations occuris a potential topic of further research.This perspective suggests that both expansive and compressive nonlinearities may bepresent in the visual cortex, but that their sources would be di�erent. One would expectcompressive nonlinearities to have been introduced early, soon after reception of the vi-sual signal by the photoreceptors (cf. Burton, 1973; Sclar et al., 1990; Scott-Samuel andGeorgeson, 1995). Conversely, expansive nonlinearities would be apparent much later,perhaps in the cortex. Harris and Smallman (1995) found evidence for expansive nonlin-18
earities which they thought to be cortical in origin. These expansive nonlinearities couldre ect imperfections that occurred during the encoding, transmission and reception of thesignals from the retina.Given that the signi�cant nonlinearity used to detect second-order signals is cortical, thereremain two models to consider. There are single-channel models that exploit an explicitlogarithmic nonlinearity after orientation and frequency selective �ltering (Langley, 1999).There are also two-channel models in which �rst and second-order signals are processedby independent �rst-order �lters (Liu, Schor and Ramachandran, 1992; Sato and Nishida,1993; 1994; Hess and Wilcox, 1994; Wilcox and Hess, 1995, 1996, 1997; Hibbard et al.,1995; Lin and Wilson, 1995). These two-channel models of binocular matching resemblethose used to explain perception for second-order motion (Chubb and Sperling, 1988;Wilson et al., 1992; Zanker, 1993; Fleet and Langley, 1994a).The model proposed by Langley (1999) involved a logarithmic transformation in order tolinearise multiplicative combinations of image signals. Provided that the mean luminanceof image has been removed by some pre-�ltering, the logarithm transforms the nonlinearproduct of a contrast envelope and carrier signal into a sum of these two signals. Followinga transformation of this form, it is feasible that a single model of binocular depth detectioncould then be used to explain binocular matching for both �rst and second-order signalsas in the models proposed by Weinshall (1991) and Parker et al. (1991).This model might predict that the visual system has the capacity to detect binocularsignals that are corrupted by multiplicative noise (eg. Franks, 1967). It might also explainsome results of other researchers who have used similar stimuli to identify properties of thepostulated second-order channel (eg Liu et al., 1992; Nishida and Sato; 1993; Wilcox andHess, 1995; 1996; 1997; Lin and Wilson, 1995). However, this single-channel model wouldnot explain depth asymmetries reported for second-order signals (Frisby and Mayhew,1978; Halpern, 1991; Kersten, 1991; Sato and Nishida, 1994; Hibbard et al., 1995; Langleyet al., 1998). This is because this single-channel model does not determine the origin ofeach disparity cue, whether �rst or second-order. Using the same reasoning, a pre-corticalnonlinearity model would also �nd it di�cult to account for the depth asymmetry.19
Taken together with the results of others, the results reported here support the hypothesisthat, for stereopsis, contrast envelopes are detected by a cortical nonlinearity, and that�rst and second-order signal combinations may be processed by di�erent mechanisms.AcknowledgementsThis work was �nancially supported by grants to KL and PBH from the Graduate Schooland Department of Psychology at UCL, and by a grant from NSERC Canada and anAlfred P. Sloan Research Fellowship to DJF. We are grateful to comments and suggestionsprovided by two reviewers, and to H. Spekreijse and E. Borghols for their patience.ReferencesBlake, R. and Wilson, H. (1991). Neural models of stereoscopic vision. Trends InNeuroscience, 14, 445-452.Beck, J., Prazdny, K. and Ivry, R. (1984). The perception of transparency with achro-matic colors. Perception and Psychophysics, 5, 407-422.Beck, J. (1984). Perception of transparency in man and machine. Human and MachineVision II, 1-12.Blakemore, C. and Hague, B. (1972). Evidence for disparity detecting neurons in thehuman visual system, J. Physiol. 225, 437-455.Brown, R.O. (1995). Luminance nonlinearities and 2nd order stimuli. Invest. Ophth.Vis. Sci., 36(Suppl), 51Burton, G.J. (1973). Evidence for non-linear response process in the visual system frommeasurements on the thresholds of spatial beat frequencies. Vis. Res., 13, 1211-1255. 20
Chubb, C. and Sperling, G. (1988). Drift-balanced random-stimuli: A general basis forstudying non-Fourier motion perception. J. Opt. Soc. Am., 5, 1986-2007Cormack, L.K., Stevenson, S.B. and Schor, C.M. (1991) Interocular correlation, lumi-nance contrast and cyclopean processing. Vis. Res., 31, 2195-2207.DeAngelis, G.C., Ohzawa, I., and Freeman, R.D. (1995). Neuronal mechanisms underly-ing stereopsis: how do simple cells in the visual cortex encode binocular disparity?Perception, 24:3-32.Derrington, A.M. and Badcock, D.R. (1986). Detection of spatial beats: Nonlinearity orcontrast increment detection?. Vis. Res., 26, 343-348De Valois, R.L. and De Valois, K.K. (1990) Spatial Vision, Oxford, Oxford UniversityPress.Fleet, D.J. and Langley, K. (1994a). Computational analysis of non-Fourier motion.Vis. Res., 34, 3057-3079Fleet, D.J. and Langley, K. (1994b). Non-Fourier channels in motion and stereopsis.Perception, 23(Suppl.), 83Fleet, D.J., Wagner, H., and Heeger, D.J. (1996) Neural encoding of binocular disparity:Energy models, position-shifts and phase-shifts. Vis. Res. 36, 1839-1857.Franks, L. (1969). Signal Analysis, Prentice-Hall Inc., N.J.Frisby, J.P. and Mayhew, J.E.W. (1978). The relationship between apparent depth anddisparity in rivalrous-texture stereograms. Perception, 7, 661-678.Georgeson, M. (1987). Temporal properties of spatial contrast vision. Vis. Res., 27,765-780.Halpern, D.L. (1991). Stereopsis frommotion de�ned contours. Vis. Res., 31, 1611-1620.Harris, J.M. and Smallman, H.S. (1995). Visual distortion products from an expansivenonlinearity. Perception, 24 (Suppl), 126.21
Henning, G.B., Hertz, G.B. and Broadbent, B.E. (1975). Some experiments bearing onthe hypothesis that the visual system analyses patterns in independent bands ofspatial frequency. Vis. Res., 15, 887-897.Hess, R.F. and Wilcox, L.M. (1994). Linear and non-linear �ltering in stereopsis. Vis.Res., 34, 2431-2438.Hibbard, P.B. Langley, K. and Fleet, D.J. (1995). Transparent asymmetry in stereopsis.Perception, 24 (suppl), 35.Hibbard, P.B. (1997). Linear and nonlinear mechanisms in the perception of stereoscopicslant and transparency. Ph.D Thesis, Department of Experimental Psychology,University College London.Hubel, D.H. (1988). Eye, Brain and Vision. Scienti�c American Library.Kersten, D. (1991). Transparency and cooperative computation of scene attributes. InComputational Models of Visual Processing. (Eds.) Landy, M. and Movshon, J.A.,MIT Press. London, 209-228.Langley, K. and Hibbard, P.B. (1994). Multiplicative/Additive combination rules to-wards transparent stereoscopic slant perception. Perception, 23, 33.Langley, K. (1997) Degenerate models of multiplicative and additive motion trans-parency. Proc. British Machine Vision Conference, Colchester, vol. 2, UK, 440-450.Langley, K. (1999). Computational models of coherent and transparent plaid motion.Vis. Res., 39, 1, 87-108.Langley, K., Fleet, D.J. and Hibbard, P.B. (1996). Linear �ltering precedes nonlinearprocessing in early vision. Current Biology, 6, 891-896.Langley, K., Fleet, D.J. and Hibbard, P.B. (1998). Linear and nonlinear transparenciesin stereopsis. Proc. R. Soc. Lond. B., 265, 1837-1845.Laughlin, S.B. (1994). Matching coding, circuits, cells and molecules to signals: generalprinciples of retinal design in the y's eye. Progress in Retinal and Eye Res., 13,165-195. 22
Liu, L. Schor, C.W. and Ramachandran, V.S. (1992). Positional disparity is more e�-cient in encoding depth than phase disparity. Invest. Ophth. Vis. Sci., 33(Suppl),1373Lin, L. and Wilson, H.R. (1995). Stereoscopic integration of Fourier and non-Fourierpatterns. Invest. Ophth. Vis. Sci., 36(Suppl), 364Mallot, H.A., Arndt, P.A., and Bultho�, H.H. (1995). Matching versus correlation inhuman stereopsis. Biological Cybernetics, 72:279-293.Mareschal, I. and Baker Jr., C.L. (1998). A cortical locus for the processing of contrastde�ned contours. Nature Neuroscience, 1, 150-154.Metelli, F. (1974). The perception of transparency. Scienti�c American, 230, 90-98.Ohzawa, I. DeAngelis, G.C. and Freeman, R.D. (1990). Stereoscopic depth discrimi-nation in the visual cortex: neurons ideally suited as disparity detectors.Science249,1037-1040.Poggio, G.F. and Poggio, T. (1984) The analysis of stereopsis. Annual Review of Neu-roscience, 7, 379-412.Parker, A.J., Johnston, E.B., Mans�eld, J.S and Yang, Y. (1991). Stereo, Surfaces, andShape. In Computational Models of Visual Processing, (Eds). Landy, M.S. andMovshon, J.A., MIT, London, 359-381.Sato, T. and Nishida, S. (1993). Second-order depth perception with texture-de�nedrandom-dot stereograms. Invest. Ophth. Vis. Sci., 34(Suppl.), 1438Sato, T. and Nishida, S. (1994). Does an envelope detecting mechanism mediate stere-opsis for band-limited stimuli? Invest. Ophth. Vis. Sci., 35(Suppl.), 1916.Sclar, G., Maunsell, J.H.R., and Lennie, P. (1990). Coding of image contrast in centralvisual pathways of the macaque monkey. Vis. Res., 30, 1-10.Scott-Samuel, N.E. and Georgeson, M. (1995). Does an early nonlinearity account forsecond-order motion? Perception, 24 (suppl), 104.23
Schwartz, M. (1987). Information Transmission, Modulation and Noise. McGraw-HillInt. Eds., 3rd Ed., London.Sutter, A., Sperling, G. and Chubb, C. (1995). Measuring the spatial-frequency selec-tivity of 2nd-order mechanisms. Vis. Res., 35, 915-924.Turano, K. and Pantle, A. (1989). On the mechanism that encodes the movement ofcontrast information. Vis. Res., 29, 207-221.Victor, J.D. and Conte, M.M. (1992). Coherence and transparency of moving plaidscomposed of Fourier and non-Fourier gratings. Perception and Psychophysics, 52,403-414.Watt, R. and Andrews, D.P. (1981). Adaptive probit estimation of psychometric func-tions. Current Psychological Reviews, 1, 205-214Weinshall, D. (1991) Seeing `ghost' planes in stereo vision. Vis. Res. 31,1731-1749.Wilcox, L.M. and Hess, R.F. (1995). Dmax for stereopsis depends on size, not spatialfrequency content. Vis. Res., 35, 1061-1069Wilcox, L.M. and Hess, R.F. (1996). Is the site of nonlinear �ltering in stereopsis beforeor after binocular combination. Vis. Res., 36, 391-399.Wilcox, L.M. and Hess, R.F. (1997). Scale selection for second-order (non-linear) stere-opsis. Vis. Res., 37, 2981-2992.Wilson, H.R., Ferrera, V.P. and Yo, C. (1992). A psychophysically motivated model fortwo-dimensional motion perception. Visual Neuroscience, 9, 79-97.Wurger, S.M. and Landy, M.S. (1989). Depth interpolation with sparse disparity cues.Perception, 18, 39-54.Yang, Y. and Blake, R. (1991). Spatial frequency tuning of stereopsis. Vis. Res., 31,1177-1189.Zanker, M.J. (1993). Theta motion: A paradoxical stimulus to explore higher-ordermotion extraction. Vis. Res., 33, 553-569.24
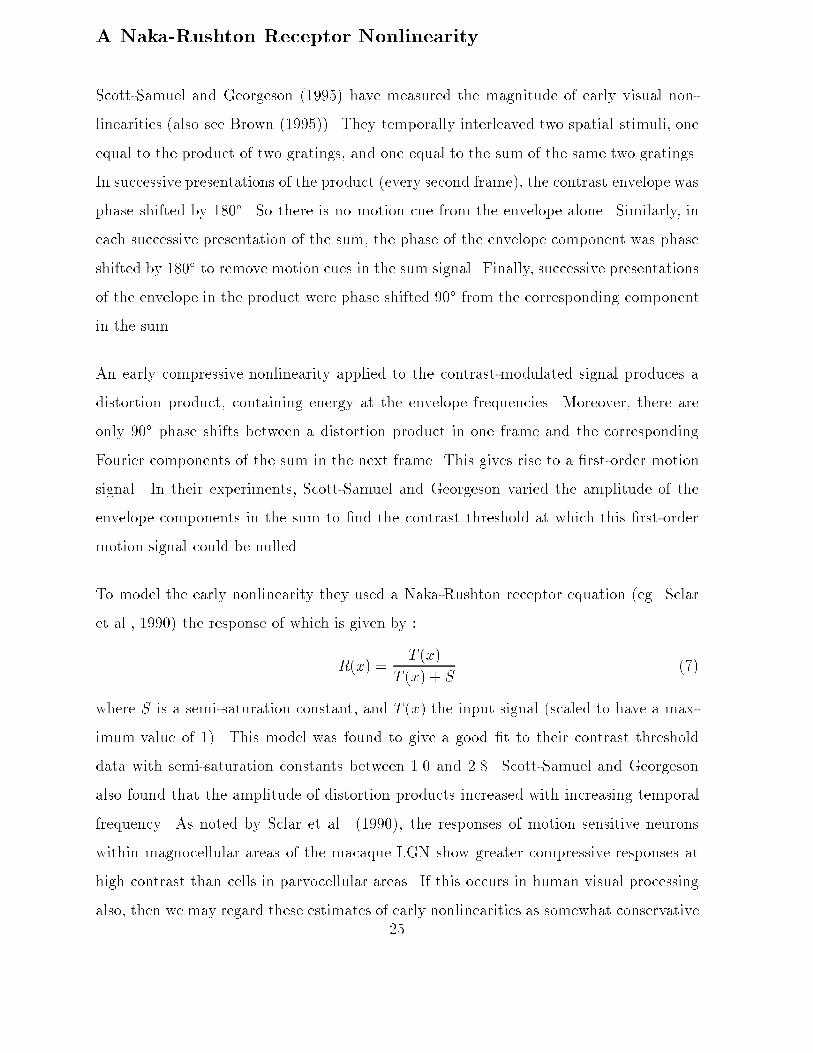
A Naka-Rushton Receptor NonlinearityScott-Samuel and Georgeson (1995) have measured the magnitude of early visual non-linearities (also see Brown (1995)). They temporally interleaved two spatial stimuli, oneequal to the product of two gratings, and one equal to the sum of the same two gratings.In successive presentations of the product (every second frame), the contrast envelope wasphase shifted by 180�. So there is no motion cue from the envelope alone. Similarly, ineach successive presentation of the sum, the phase of the envelope component was phaseshifted by 180� to remove motion cues in the sum signal. Finally, successive presentationsof the envelope in the product were phase shifted 90� from the corresponding componentin the sum.An early compressive nonlinearity applied to the contrast-modulated signal produces adistortion product, containing energy at the envelope frequencies. Moreover, there areonly 90� phase shifts between a distortion product in one frame and the correspondingFourier components of the sum in the next frame. This gives rise to a �rst-order motionsignal. In their experiments, Scott-Samuel and Georgeson varied the amplitude of theenvelope components in the sum to �nd the contrast threshold at which this �rst-ordermotion signal could be nulled.To model the early nonlinearity they used a Naka-Rushton receptor equation (eg. Sclaret al., 1990) the response of which is given by :R(x) = T (x)T (x) + S (7)where S is a semi-saturation constant, and T (x) the input signal (scaled to have a max-imum value of 1). This model was found to give a good �t to their contrast thresholddata with semi-saturation constants between 1.0 and 2.8. Scott-Samuel and Georgesonalso found that the amplitude of distortion products increased with increasing temporalfrequency. As noted by Sclar et al. (1990), the responses of motion sensitive neuronswithin magnocellular areas of the macaque LGN show greater compressive responses athigh contrast than cells in parvocellular areas. If this occurs in human visual processingalso, then we may regard these estimates of early nonlinearities as somewhat conservative25

Spatial Frequency (cpp)0.0 0.1 0.2 0.3 0.4 0.5
Am
plitu
de
0.00
0.03
0.06
0.09
0.12
0.15
Spatial Frequency (cpp)0.0 0.1 0.2 0.3 0.4 0.5
Am
plitu
de
0.00
0.03
0.06
0.09
0.12
0.15
(A) (B)Figure 4: Fourier Spectrum (cycles per pixel) for the contrast modulated signal in Equation(9) after being passed through a Naka-Rushton compressive nonlinearity. (A): Spectrumobtained for contrast-modulation depth and a semi-saturation constant of unity. (B)Spectrum obtained by reducing the mean contrast of the signal by one-third. In comparingthe �gures, note that the magnitude of the distortion product is reduced by changes incontrast as predicted by Equation (11).because our stimuli were static. In what follows we consider this model with S = 1 as itproduces the largest distortion products into the transformed signal.The basic stimuli used in the experiments here were one dimensional, of the form :�2 �1 + a2 (1 +mE(x)) C(x) � (8)To normalize this signal to have values between 0 and 1, we divide by � to obtain :T (x) = 12 + a4 (1 +mE(x)) C(x) (9)where 0 � a � 1 is the amplitude of the carrier grating, E(x) is an approximation to asquare-wave grating, and 0 � m � 1 is the modulation depth. To understand the e�ect26

of the nonlinearity, we apply the compressive nonlinearity in Equation (7) to the signalgiven by Equation (9) to obtain R(x). The Fourier spectrum of R(x) then gives us thespectrum of the transformed signal which includes the distortion product at the envelopefrequencies.Figure 4 shows the Fourier spectra of R(x) in two cases, namely, when a = 1 and whena = 1=3 (where S = 1 and m = 1). From the Fourier spectrum, at the frequenciesof the envelope, we measured the amplitude of the distortion product as a function ofcontrast a (between 0.3 and 1.0) and modulation depth m (between 0 and 1.0). Fromthese measurements we found that the amplitudeDb of the distortion product at envelopefrequencies increases approximately linearly with modulation depth, and approximatelyquadratically with the carrier amplitude. Our �t to these data produced the followingrelation : Db = 0:16 a2m (10)This equation allows us to calculate the expected amplitude of early nonlinearities in-troduced as a function of carrier contrast and modulation depth. In particular, with acontrast of a = 0:3, like that used in Experiment 1, we might expect contrast thresholdsthat depend linearity on m with a slope of 0.0144.Alternatively, one might suppose that the critical source of information is the amplitude ofthe carrier's sidebands. Using the same approach as above, after applying the nonlinearityto Equation (9), we measured the amplitudeDs of the sidebands in R(x), and found thatthey vary linearly with m and a, that is:Ds = 0:46 a m (11)Note that if we had ignored the nonlinearity, then it is easy to show that the sidebandamplitudes should equal am2 ; with the nonlinearity it is slightly di�erent.A comparison of Equations (10) and (11) shows that the amplitude of the sidebandsincreases with a greater slope (as a function of modulation depth) than the amplitude ofthe distortion product introduced by the early nonlinearity.27
Copyright © 2022 FDOKUMEN