Water abundances in high-mass protostellar envelopes: Herschel observations with HIFI
15
arXiv:1007.4119v1 [astro-ph.GA] 23 Jul 2010 Astronomy & Astrophysics manuscript no. main c ESO 2013 December 12, 2013 Water abundances in high-mass protostellar envelopes: Herschel observations with HIFI ⋆ M.G. Marseille 10 , F.F.S. van der Tak 10,11 , F. Herpin 6 , F. Wyrowski 30 , L. Chavarría 6 , B. Pietropaoli 6 , A. Baudry 6 , S. Bontemps 6 , J. Cernicharo 16 , T. Jacq 5 , W. Frieswijk 10 , R. Shipman 10 , E.F. van Dishoeck 1,2 , R. Bachiller 12 , M. Benedettini 13 , A.O. Benz 3 , E. Bergin 14 , P. Bjerkeli 9 , G.A. Blake 15 , J. Braine 6 , S. Bruderer 3 , P. Caselli 4,5 , E. Caux 47,48 , C. Codella 5 , F. Daniel 16 , P. Dieleman 10 , A.M. di Giorgio 13 , C. Dominik 17,18 , S.D. Doty 19 , P. Encrenaz 20 , M. Fich 21 , A. Fuente 22 , T. Gaier 31 , T. Giannini 23 , J.R. Goicoechea 16 , Th. de Graauw 10 , F. Helmich 10 , G.J. Herczeg 2 , M.R. Hogerheijde 1 , B. Jackson 10 , H. Javadi 31 , W. Jellema 10 , D. Johnstone 7 ,8 , J.K. Jørgensen 24 , D. Kester 10 , L.E. Kristensen 1 , B. Larsson 25 , W. Laauwen 10 , D. Lis 26 , R. Liseau 9 , W. Luinge 10 , C. M c Coey 21,27 , A. Megej 46 , G. Melnick 28 , D. Neufeld 29 , B. Nisini 23 , M. Olberg 9 , B. Parise 30 , J.C. Pearson 31 , R. Plume 32 , C. Risacher 10 , P. Roelfsema 10 , J. Santiago-García 33 , P. Saraceno 13 , P. Siegel 31 , J. Stutzki 43 , M. Tafalla 12 , T.A. van Kempen 28 , R. Visser 1 , S.F. Wampfler 3 , and U.A. Yıldız 1 (Affiliations can be found after the references) Received xxx; accepted xxx ABSTRACT Aims. We derive the dense core structure and the water abundance in four massive star-forming regions which may help understand the earliest stages of massive star formation. Methods. We present Herschel-HIFI observations of the para-H 2 O1 11 − 0 00 and 2 02 − 1 11 and the para-H 18 2 O1 11 − 0 00 transitions. The envelope contribution to the line profiles is separated from contributions by outflows and foreground clouds. The envelope contribution is modeled using Monte-Carlo radiative transfer codes for dust and molecular lines (MC3D and RATRAN), with the water abundance and the turbulent velocity width as free parameters. Results. While the outflows are mostly seen in emission in high-J lines, envelopes are seen in absorption in ground-state lines, which are almost saturated. The derived water abundances range from 5×10 −10 to 4×10 −8 in the outer envelopes. We detect cold clouds surrounding the protostar envelope, thanks to the very high quality of the Herschel-HIFI data and the unique ability of water to probe them. Several foreground clouds are also detected along the line of sight. Conclusions. The low H 2 O abundances in massive dense cores are in accordance with the expectation that high densities and low temperatures lead to freeze-out of water on dust grains. The spread in abundance values is not clearly linked to physical properties of the sources. Key words. ISM: dust, extinction – ISM: molecules – ISM: abundances 1. Introduction Massive stars (10 M ⊙ ) play a major role in the interstel- lar energy budget and the shaping of the Galactic environment (Zinnecker & Yorke 2007). However, the formation of such high-mass stars is not well understood due to several reasons: they are rare, have a short evolution time scale, they are born deeply embedded, and are far from the solar system. The main sequence lifetime of massive stars is pre- ceded by an embedded phase which subdivides into several classes of objects: massive pre-stellar cores (mPSC), which are local temperature minima and density maxima within dark clouds (Sridharan et al. 2005); high-mass protostellar objects (HMPO), where a central protostar is surrounded by a massive envelope with a centrally peaked temperature and density distri- bution (van der Tak et al. 2000); hot molecular cores (HMC), which have larger masses of warm gas and dust, and high abun- ⋆ Herschel is an ESA space observatory with science instruments pro- vided by European-led Principal Investigator consortia and with parti- cipation of NASA. dances of complex organic molecules which have evaporated off dust grains and/or formed by warm gas-phase chemistry (Motte et al. 2003); and ultracompact H II regions (UCHII), which show large pockets of ionized gas confined to the star (Churchwell et al. 1990). A key question is to what extent these phases represent differences in luminosity and/or age, and if all high-mass stars pass through all these phases. The water molecule is thought to be a sensitive tracer of physical conditions in star-forming regions, which acts as a nat- ural filter for warm gas because of its large abundance varia- tions between hot and cold regions (van der Tak et al. 2006). Moreover, because the dust continuum is strong at the higher frequencies, water lines connecting with the lowest energy levels can be seen in absorption, thus providing an alterna- tive method to probe different depths in the protostellar en- vironment (Poelman & van der Tak 2007). Measurements of the abundance of water are therefore a step toward understand- ing the energy budget of star-forming regions, and thus of the star formation process itself. 1
Transcript of Water abundances in high-mass protostellar envelopes: Herschel observations with HIFI
arX
iv:1
007.
4119
v1 [
astr
o-ph
.GA
] 23
Jul
201
0Astronomy& Astrophysicsmanuscript no. main c© ESO 2013December 12, 2013
Water abundances in high-mass protostellar envelopes: Herschelobservations with HIFI⋆
M.G. Marseille10, F.F.S. van der Tak10,11, F. Herpin6, F. Wyrowski30, L. Chavarría6, B. Pietropaoli6, A. Baudry6,S. Bontemps6, J. Cernicharo16, T. Jacq5, W. Frieswijk10, R. Shipman10, E.F. van Dishoeck1,2, R. Bachiller12,M. Benedettini13, A.O. Benz3, E. Bergin14, P. Bjerkeli9, G.A. Blake15, J. Braine6, S. Bruderer3, P. Caselli4,5,
E. Caux47,48, C. Codella5, F. Daniel16, P. Dieleman10, A.M. di Giorgio13, C. Dominik17,18, S.D. Doty19,P. Encrenaz20, M. Fich21, A. Fuente22, T. Gaier31, T. Giannini23, J.R. Goicoechea16, Th. de Graauw10,
F. Helmich10, G.J. Herczeg2, M.R. Hogerheijde1, B. Jackson10, H. Javadi31, W. Jellema10, D. Johnstone7,8,J.K. Jørgensen24, D. Kester10, L.E. Kristensen1, B. Larsson25, W. Laauwen10, D. Lis26, R. Liseau9, W. Luinge10,C. McCoey21,27, A. Megej46, G. Melnick28, D. Neufeld29, B. Nisini23, M. Olberg9, B. Parise30, J.C. Pearson31,
R. Plume32, C. Risacher10, P. Roelfsema10, J. Santiago-García33, P. Saraceno13, P. Siegel31, J. Stutzki43,M. Tafalla12, T.A. van Kempen28, R. Visser1, S.F. Wampfler3, and U.A. Yıldız1
(Affiliations can be found after the references)
Received xxx; accepted xxx
ABSTRACT
Aims. We derive thedense core structure and thewater abundance in four massive star-forming regionswhich may help understand theearliest stages of massive star formation.Methods. We present Herschel-HIFI observations of the para-H2O 111 − 000 and 202 − 111 and the para-H18
2 O 111 − 000 transitions. The envelopecontribution to the line profiles is separated from contributions by outflows and foreground clouds. The envelope contribution is modeled usingMonte-Carlo radiative transfer codes for dust and molecular lines (MC3D and RATRAN), with the water abundance and the turbulent velocitywidth as free parameters.Results. While the outflows are mostly seen in emission in high-J lines, envelopes are seen in absorption in ground-state lines, which arealmost saturated. The derived water abundances range from 5×10⁻¹⁰ to 4×10⁻⁸ in the outer envelopes. We detect cold clouds surroundingthe protostar envelope, thanks to the very high quality of the Herschel-HIFI data and the unique ability of water to probe them. Severalforeground clouds are also detected along the line of sight.Conclusions. The low H2O abundances in massive dense cores are in accordance with the expectation that high densities and low temperatureslead to freeze-out of water on dust grains.The spread in abundance values is not clearly linked to physical properties of the sources.
Key words. ISM: dust, extinction – ISM: molecules – ISM: abundances
1. Introduction
Massive stars (&10 M⊙ ) play a major role in the interstel-lar energy budget and the shaping of the Galactic environment(Zinnecker & Yorke 2007).However, the formation of suchhigh-mass stars is not well understood due toseveral reasons:they are rare, have a short evolution time scale, they are borndeeply embedded, and are far from the solar system.
The main sequence lifetime of massive starsis pre-ceded by an embedded phase which subdivides into severalclasses of objects: massive pre-stellar cores (mPSC), whichare local temperature minima and density maxima within darkclouds(Sridharan et al. 2005); high-mass protostellar objects(HMPO), where a central protostar is surrounded by a massiveenvelope with a centrally peaked temperature and density distri-bution (van der Tak et al. 2000); hot molecular cores (HMC),which have larger masses of warm gas and dust, and high abun-
⋆ Herschel is an ESA space observatory with science instruments pro-vided by European-led Principal Investigator consortia and with parti-cipation of NASA.
dances of complex organic molecules which have evaporatedoff dust grains and/or formed by warm gas-phase chemistry(Motte et al. 2003); and ultracompact H II regions (UCHII),which show large pockets of ionized gas confined to the star(Churchwell et al. 1990). A key question is to what extent thesephases represent differences in luminosity and/or age, and if allhigh-mass stars pass through all these phases.
The water molecule is thought to be a sensitive tracer ofphysical conditions in star-forming regions, which acts asa nat-ural filter for warm gasbecause of its large abundance varia-tions between hot and cold regions (van der Tak et al. 2006).Moreover, because the dust continuum is strong at the higherfrequencies, water lines connecting with the lowest energylevels can be seen in absorption, thus providing an alterna-tive method to probe different depths in the protostellar en-vironment (Poelman& van der Tak 2007).Measurements ofthe abundance of water are therefore a step toward understand-ing the energy budget of star-forming regions, and thus of thestar formation process itself.
1

M.G. Marseille et al.: Water abundances in high-mass protostellar envelopes: Herschel observations with HIFI
This paper presents water observations performed withthe Heterodyne Instrument for the Far-Infrared (HIFI;de Graauw & et al. 2010) on-board ESA’s Herschel SpaceObservatory (Pilbratt & et al. 2010). We use the p-H2O ground-state line and two lines which constrain the excitation andoptical depth (Table 1),all three lying at similar frequenciesand observed at similar resolution. The sources are fourmassive star-forming regions (Table 2): the HMCs G31.41+0.31and G29.96−0.02 and the HMPOs W33A and W43-MM1. Wecompare our results with those for two other regions: the UCHIIregion DR21 (van der Tak et al. 2010) and the HMPO W3 IRS5(Chavarría et al. 2010, this volume).
However, the aim is to discover trends in the water lineemission for future extended studies, identifying links inthewater abundance between the various evolutionary stages ofhigh-mass star formation and to use water as probe of thegas dynamics around protostars. Given the small number ofsources and lines observed, it is premature to look for generaltrends. The large amount of upcoming Herschel-HIFI datawill help on this issue.
Table 1.List of lines.
Molecule Transition ν (GHz) Eup (K) ncrita (cm−3) σrms (mK)
H2O 111 − 000 1113.343 53.4 1.7×10⁸ 40H2O 202 − 111 987.927 100.8 2.1×10⁸ 50H18
2 O 111 − 000 1101.698 53.4 1.7×10⁸ 40
Notes. (a) Values at 20 K from collision rates of Grosjean et al. (2003)
Table 2.List of sources.
Name R.A. Dec. L da VLSR
J2000 J2000 (104 L⊙ ) (kpc) (km s−1)
G31.41+0.31 18h47m34.3s −01◦12′46.0′′ 15 7.9 +98.8G29.96-0.02 18h46m03.8s −02◦39′22.0′′ 20 7.4 +98.7W33A 18h14m39.1s −17◦52′07.0′′ 8.5 4.0 +37.5W43-MM1 18h47m47.0s −01◦54′28.0′′ 2.2 5.5 +98.8
Notes. (a) Values from Hatchell & van der Tak (2003), except W43-MM1 (Motte et al. 2003) and W33A (van der Tak et al. 2000).
2. Observations
The four regions have beenobserved with HIFI on the 3rd, 4th
and 6th of March 2010 (see Table 2). Spectra were taken in dou-ble sideband mode using receivers 4a (p-H2O at 988 GHz) and4b (p-H2O and p-H18
2 O at 1113 GHz and 1102 GHz) withνLO= 980 GHz and 1108 GHz respectively. The observations arepart of the Priority Science Program (PSP) of the Guaranteed-Time Key ProgramWater In Star-forming regions with Herschel(WISH; Van Dishoeck et al., in prep.).
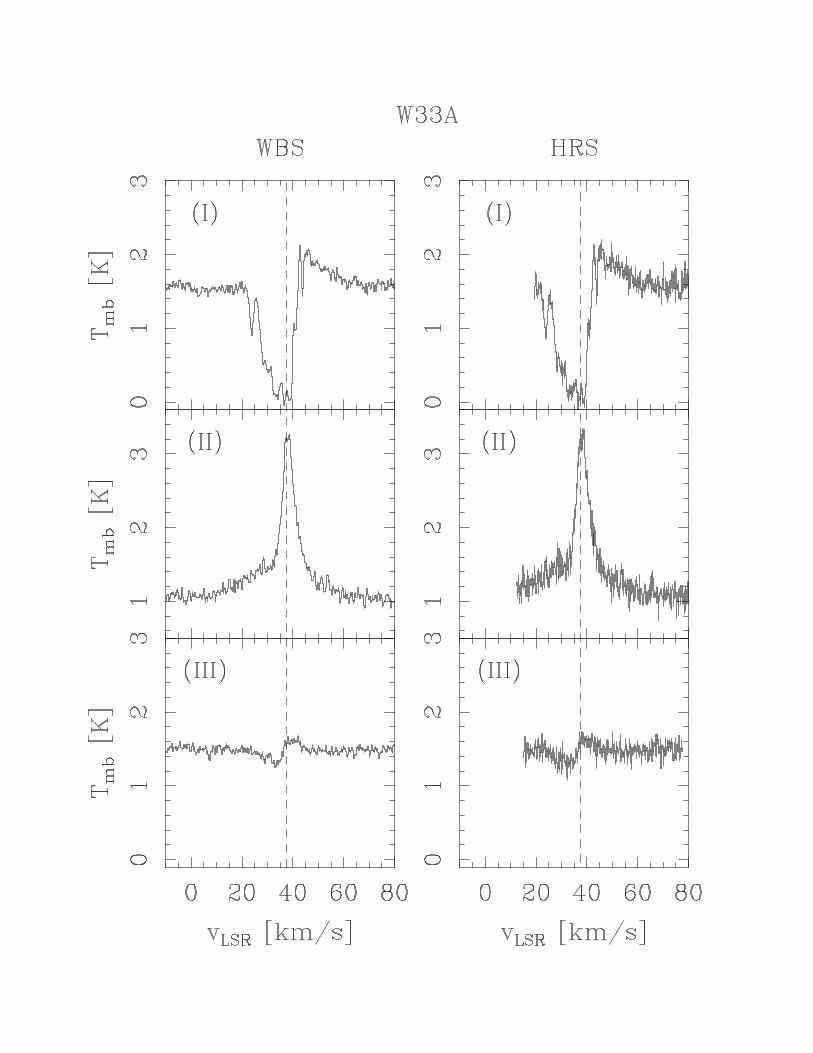
Data were simultaneously taken with the acousto-opticalWide-Band Spectrometer (WBS) and the correlator-based High-Resolution Spectrometer (HRS), in both horizontal and verti-cal polarizations.This paper focuses on data from the WBS,which covers 1140 MHz bandwidth at 1.1 MHz spectral reso-lution (∼0.3 km s−1) (Roelfsema et al. 2010). System temper-atures range between 350 K around 1113 GHz and 450 K
around 988 GHz; receiver 4a in V polarization shows partic-ularly high values. Integration times (ON+OFF) were 193 sfor the 1113 GHz and the 1102 GHz lines, and 206 s for the988 GHz line, for each source, and the rms noise levels reachedare 40–50 mK (Table 1). Observations have been reduced withthe Herschel Interactive Processing Environment1 (HIPE) ver-sion 2.8. The intensity scale is converted toTmb using main beamefficiencies of 0.74. The double-side band continuum level hasbeen divided by 2 to make its brightness directly comparabletothat of the lines, which are measured in single sideband.
3. Results
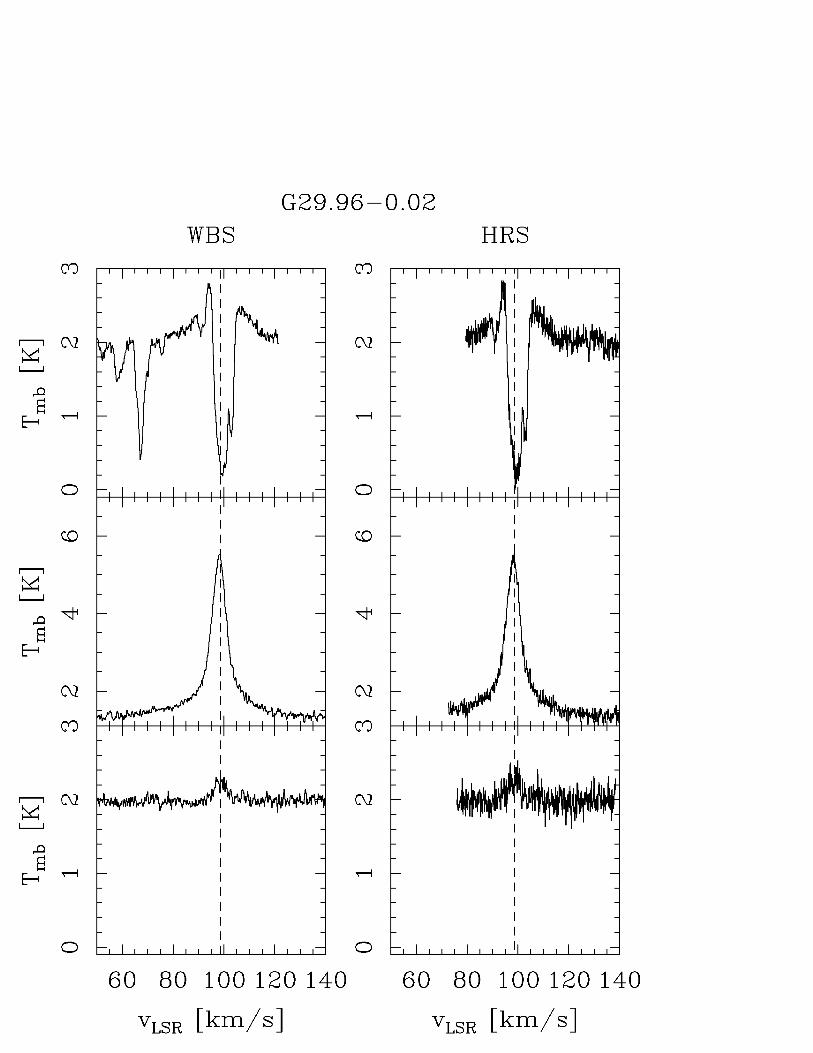
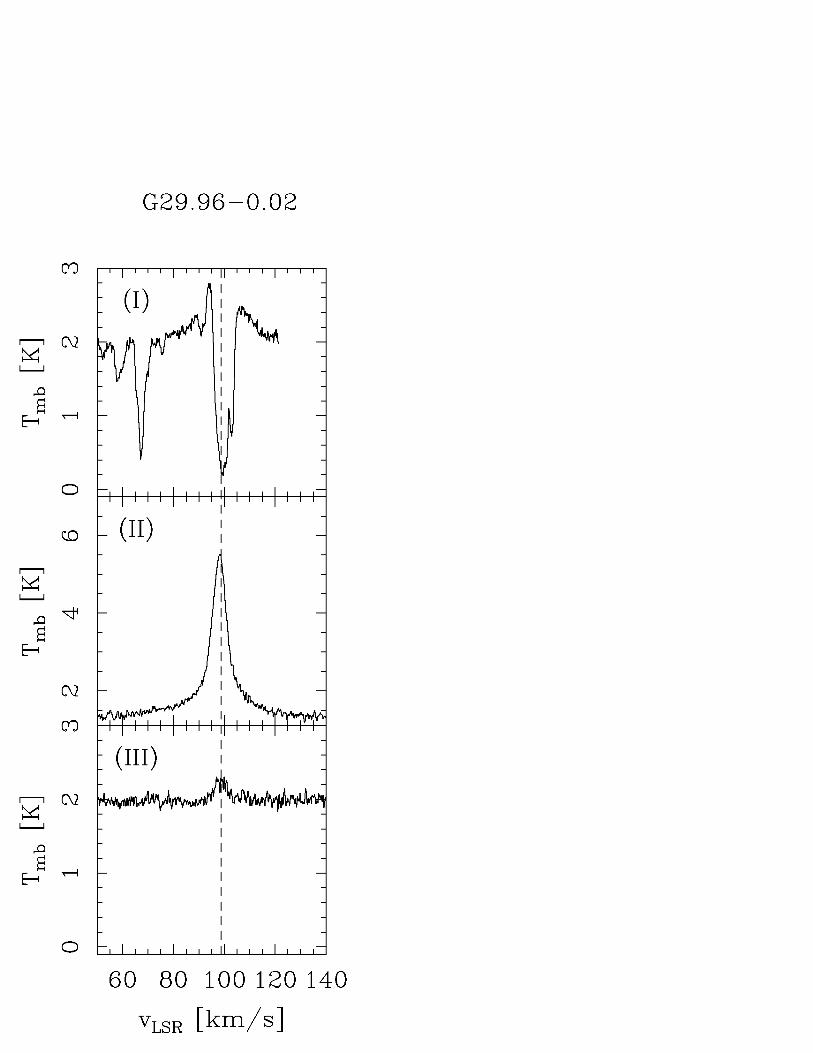
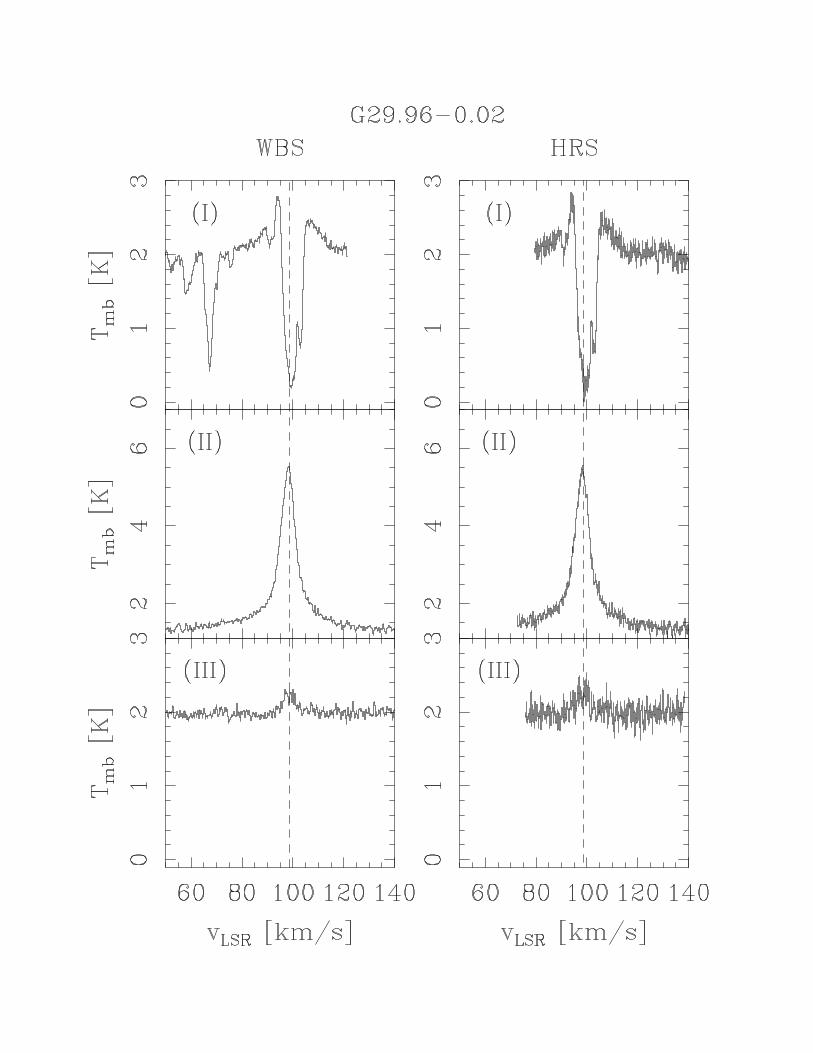
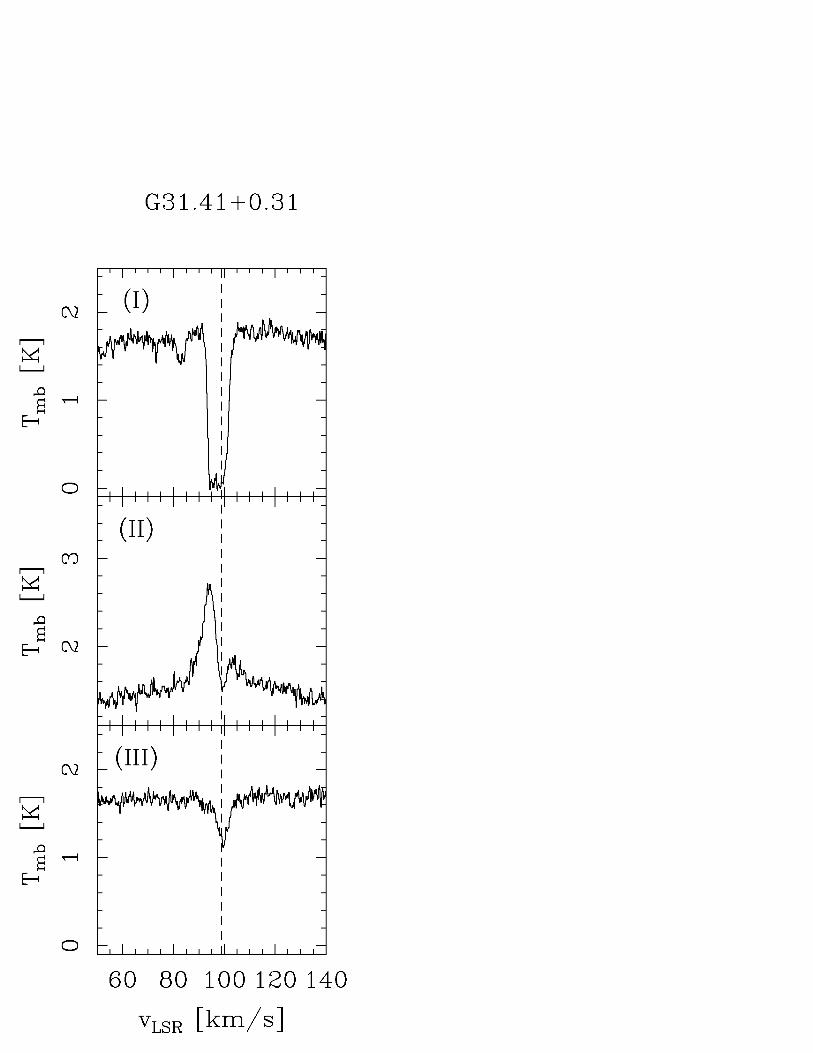
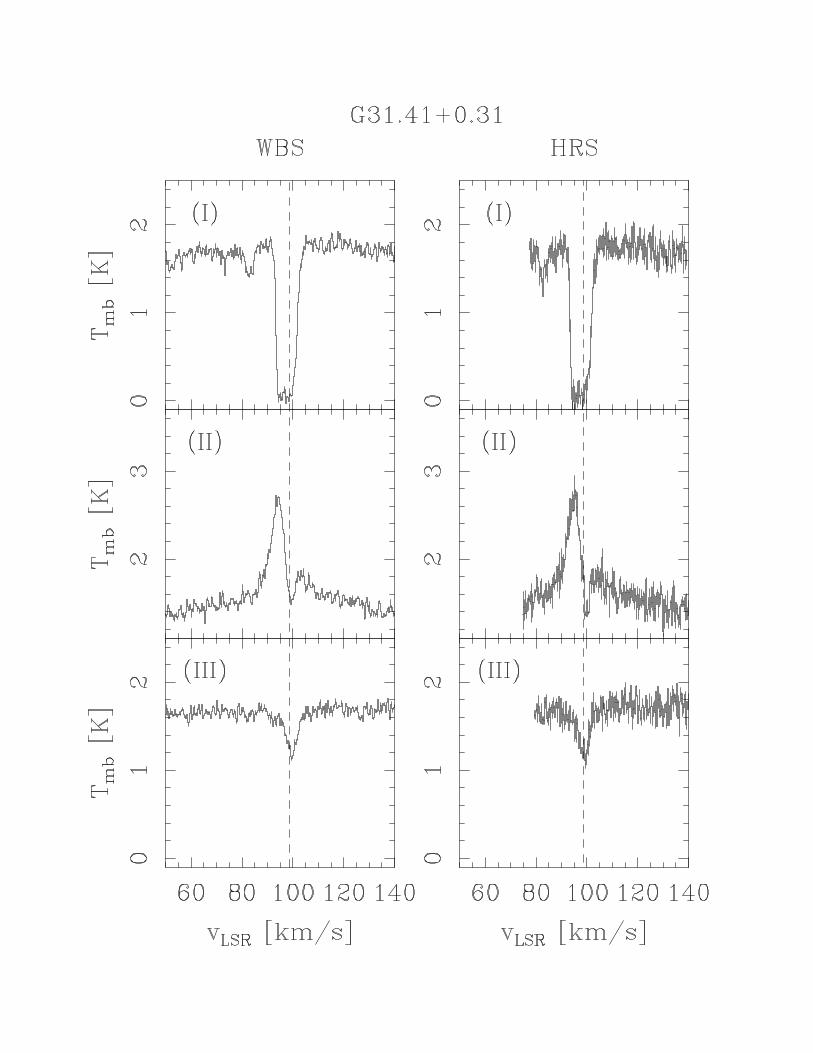
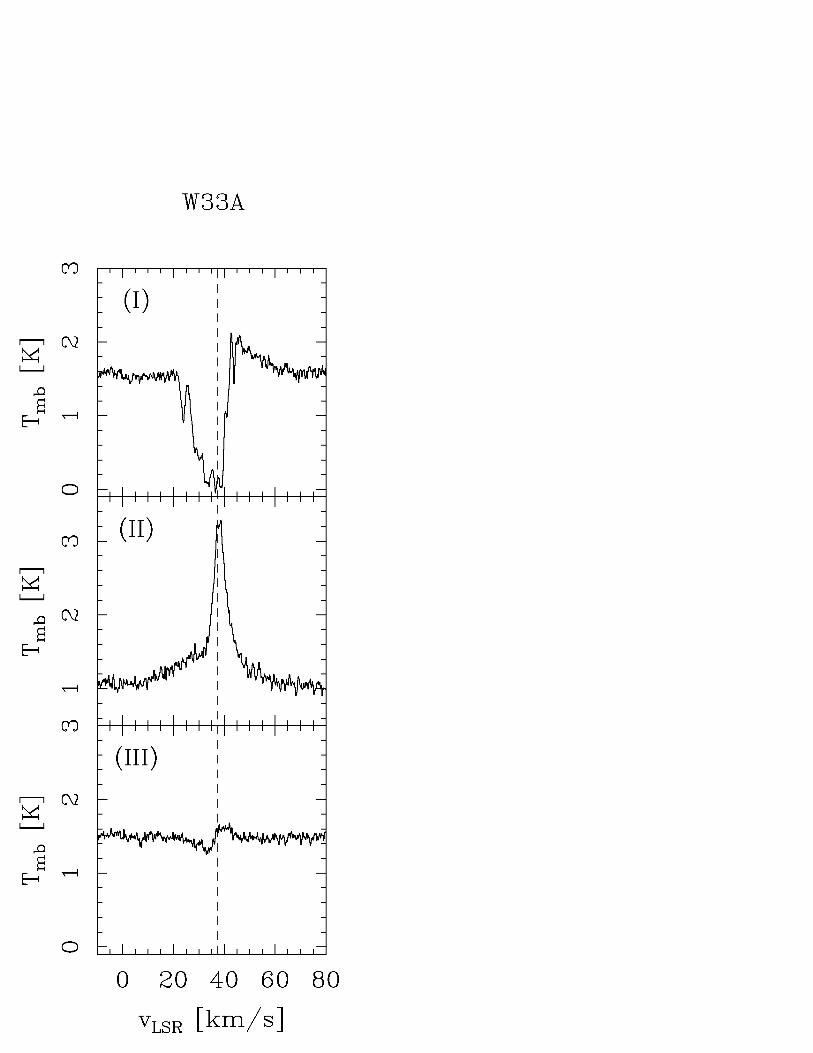
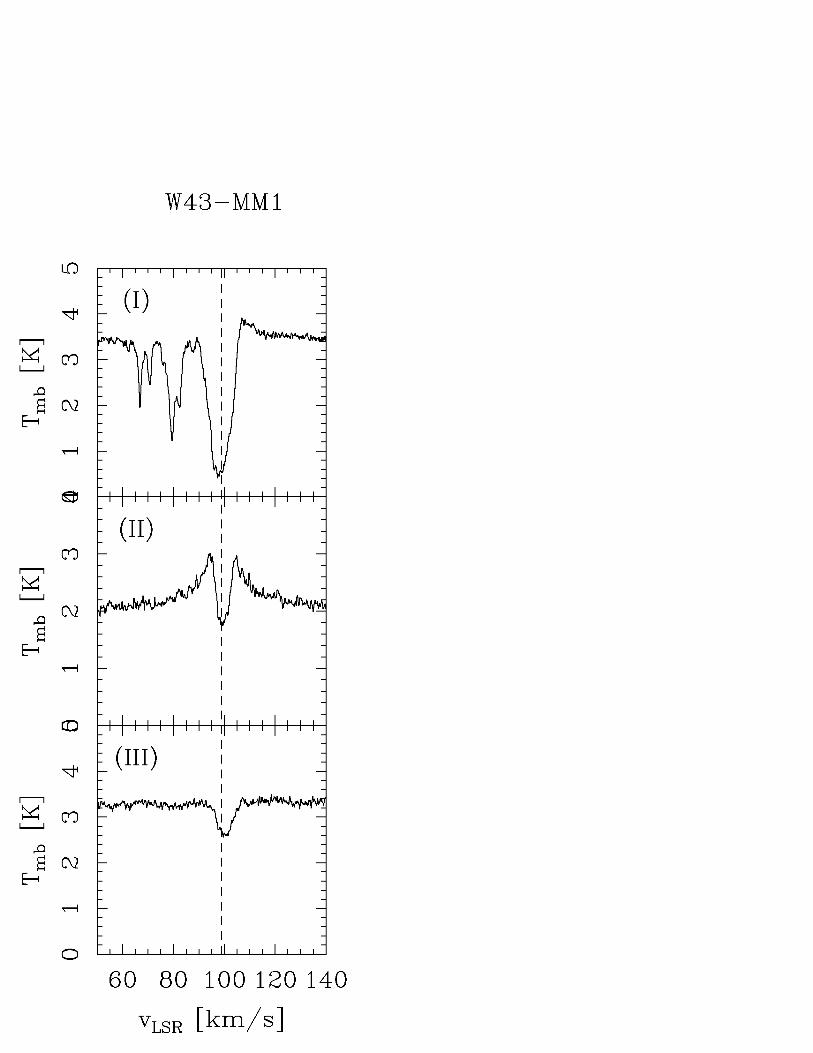
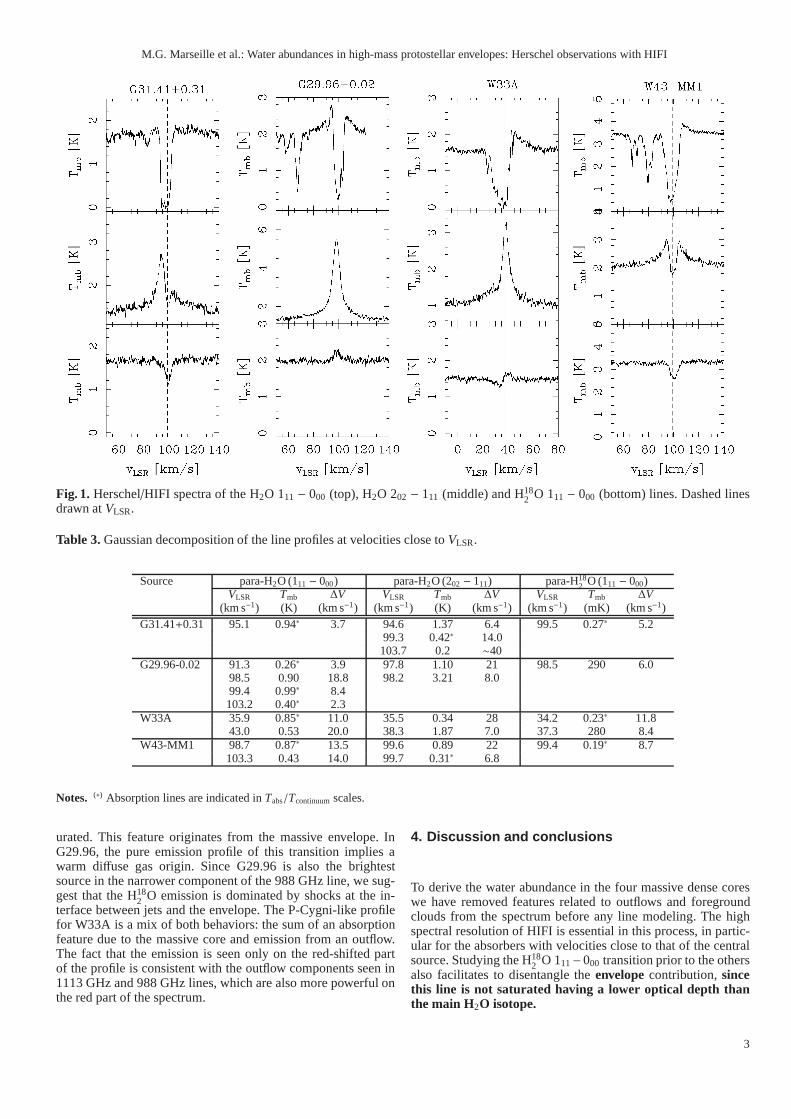
Observed water lines for the four studied regions are shownin Fig. 1. The H2O 111 − 000 line shows an absorption atthe systemic velocity (VLSR) in all sources. In all cases exceptG31.41+0.31, outflow wings are detected close to the main ab-sorption, with a maximal shift of 3 km s−1. These wings areseen in emission, which indicates an origin in hot, low-density(103 cm−3) gas (Poelman & van der Tak 2007).Absorption fea-tures are seen over a large velocity range in G29.96-0.02,W33A, W43-MM1 and more weakly in G31.41+0.31. The ab-sorptions at velocity offsets>4 km s−1 likely originate in coldforeground clouds on the line of sight to the source. In contrast,the absorption features at smaller velocity offsetsare plausi-bly related to cold clouds surrounding the dense cores (whichother studies call the protostellar envelopes), which are all partof large-scale molecular clouds (see Fig. 2).Table 3 presentsa Gaussian decomposition of the line profiles aroundVLSR;Appendix A shows Gaussian iterative decompositions ofthe absorption profiles of the ground-state transition overthe full velocity range, showing a large number of veloc-ity components thanks to the high velocity resolution ofthe HIFI instrument. The absorptions atVLSR are saturatedfor G31.41+0.31 and W33A and nearly saturated for the othersources, which indicates abundances around∼10−9 for the outercold parts of the massive dense cores (Poelman & van der Tak2007).
The H2O 202−111 line always appears in emission and showsa broad and a narrower velocity component (Fig. 1). In addition,the spectra of G31.41+0.31 and W43-MM1 show two well de-fined self-absorption features which appear at the source veloc-ity. With its highEup, this transition mainly traces warm gas, andthe presence of these absorption features in G31.41+0.31 andW43-MM1 suggests a higher water abundance in these sourcesthan in G29.96–0.02 and W33A. The components seen in emis-sion have Gaussian shapes, one being wider (FWHM=20–40 km s−1) than the other (FWHM=6.4–8.0 km s−1). We asso-ciate the broad component with high-velocity outflowsassoci-ated with the protostaralso seen in111 − 000 line emission.This component is symmetric with respect to the source veloc-ity in G29.96–0.02 and W43-MM1, blueshifted by 2.8 km s−1 inW33A, and redshifted by 4.4 km s−1 in G31.41+0.31 (Table 3).The narrower (hereafter ’medium’) componentis potentially as-sociated with shocked surrounding material where water is re-leased in the gas phase. Indeed, shocks occur at the interfacebetween jets and the surrounding dense envelope, with a ve-locity close to that of the massive dense core. Similar resultsare found in Kristensen et al. (2010), Johnstone et al. (2010) andChavarría et al. (2010).
The H182 O 111 − 000 transition is seen in absorption at the
source velocity in G31.41 and W43-MM1, which is not sat-
1 http://herschel.esac.esa.int/
2
M.G. Marseille et al.: Water abundances in high-mass protostellar envelopes: Herschel observations with HIFI
Fig. 1. Herschel/HIFI spectra of the H2O 111 − 000 (top), H2O 202 − 111 (middle) and H182 O 111 − 000 (bottom) lines. Dashed lines
drawn atVLSR.
Table 3.Gaussian decomposition of the line profiles at velocities close toVLSR.
Source para-H2O (111 − 000) para-H2O (202 − 111) para-H182 O (111 − 000)
VLSR Tmb ∆V VLSR Tmb ∆V VLSR Tmb ∆V(km s−1) (K) (km s−1) (km s−1) (K) (km s−1) (km s−1) (mK) (km s−1)
G31.41+0.31 95.1 0.94∗ 3.7 94.6 1.37 6.4 99.5 0.27∗ 5.299.3 0.42∗ 14.0103.7 0.2 ∼40
G29.96-0.02 91.3 0.26∗ 3.9 97.8 1.10 21 98.5 290 6.098.5 0.90 18.8 98.2 3.21 8.099.4 0.99∗ 8.4103.2 0.40∗ 2.3
W33A 35.9 0.85∗ 11.0 35.5 0.34 28 34.2 0.23∗ 11.843.0 0.53 20.0 38.3 1.87 7.0 37.3 280 8.4
W43-MM1 98.7 0.87∗ 13.5 99.6 0.89 22 99.4 0.19∗ 8.7103.3 0.43 14.0 99.7 0.31∗ 6.8
Notes. (∗) Absorption lines are indicated inTabs/Tcontinuumscales.
urated. This feature originates from the massive envelope.InG29.96, the pure emission profile of this transition impliesawarm diffuse gas origin. Since G29.96 is also the brightestsource in the narrower component of the 988 GHz line, we sug-gest that the H18
2 O emission is dominated by shocks at the in-terface between jets and the envelope. The P-Cygni-like profilefor W33A is a mix of both behaviors: the sum of an absorptionfeature due to the massive core and emission from an outflow.The fact that the emission is seen only on the red-shifted partof the profile is consistent with the outflow components seen in1113 GHz and 988 GHz lines, which are also more powerful onthe red part of the spectrum.
4. Discussion and conclusions
To derive the water abundance in the four massive dense coreswe have removed features related to outflows and foregroundclouds from the spectrum before any line modeling. The highspectral resolution of HIFI is essential in this process, inpartic-ular for the absorbers with velocities close to that of the centralsource. Studying the H18
2 O 111−000 transition prior to the othersalso facilitates to disentangle theenvelopecontribution,sincethis line is not saturated having a lower optical depth thanthe main H2O isotope.
3
M.G. Marseille et al.: Water abundances in high-mass protostellar envelopes: Herschel observations with HIFI
Once the main contribution is extracted, we model its pro-file according to the method described in Marseille et al. (2008):first, the dust emission from the massive dense core is repro-duced with the MC3D radiative transfer code (Wolf et al. 1999),including total luminosity and density profile from the literature(power-law indexp = −1.5); second, the temperature profileobtained is used to model the line emission with the RATRANcode (Hogerheijde & van der Tak 2000). The free parametersare:XH2O the molecular abundance relative to H2, and3turb, theturbulent velocity width.
Good fits are obtained for the H182 O 111−000 transition, which
is not saturated unlike the H2O lines. The fitting considers boththe line strength (area and width) and the profile shapes. We havecomputed a grid ofXH2O and3turb values, adapting step by stepthe grid around the bestχ2. Using a16O/18O ratio of 500, weproceed to model the main isotopic water lines. The H2O abun-dance is kept constant in our models. We have tried models withan abundance increase in the inner region whereT > 100 K, butthe current data do not favor these models above the constant-abundance models.
We estimate the absolute uncertainty in the retrieved H2Oabundance to be a factor of 10. Since we use the samemodeling strategy as the studies by van der Tak et al. (2010)and Chavarría et al. (2010), theabundances obtainedshouldbe comparable tobetter than a factor of 3. Our observedspread in abundances of a factor of∼100 is much larger thanthis uncertainty. The same range of abundances is found inother HIFI-based studies of high-mass star-forming regions(van der Tak et al. 2010; Chavarría et al. 2010), and also in pre-vious work with ISO (Boonman et al. 2003) and from the ground(van der Tak et al. 2006).
In conclusion, for the massive star forming regions de-scribed in this letter, we clearly detect the contribution ofthe envelope within the dense core. It is limited to a strongself-absorbed feature, mainly seen in the ground-state line.In order to evaluate it, we first have to remove emission fromoutflow shocks and absorption by foreground clouds alongthe line of sight. The velocities of the absorbers indicate thatsome are part of the close environment of the source, whileothers are physically unrelated. The derived massive densecore abundances suggest a strong freeze-out of water on dustgrains, and imply that water plays only a minor role in thethermal balance of the gas.
The H2O line profiles do not seem to depend on the sup-posed evolutionary stage of the source. For example, the two‘hot molecular cores’ G31.41 and G29.96 show very differentline profiles, and also their H2O abundances differ by a factorof ∼100. Also, the abundance variations that we have found donot seem related to the luminosity of the sources, their temper-ature or their turbulent velocity field. However, the numberofcases treated is not sufficient for a statistical treatment. Futurestudies following the same procedure with a larger number ofsources should conclude on this issue. Within our sample, thehighest H2O abundances are derived for G31.41 and W43-MM1which show self-absorbed 202−111 line profiles (Fig. 1). As thesesources are not the most luminous, hot, or active ones in our sam-ple, the origin of such a high abundance is unclear.
Firm conclusions about a link between water emissionbehaviour and the evolutionary stage of the source are lim-ited by the small number of sources. Our data show thatwater is a useful tool to understand the gas dynamics inand around massive stars forming regions. Future multi-linestudies of larger samples are highly promising to answer keyquestions about the formation of massive stars.
Acknowledgements. HIFI has been designed and built by a consortium ofinstitutes and university departments from across Europe,Canada and theUnited States under the leadership of SRON Netherlands Institute for SpaceResearch, Groningen, The Netherlands and with major contributions fromGermany, France and the US. Consortium members are: Canada:CSA,U.Waterloo; France: CESR, LAB, LERMA, IRAM; Germany: KOSMA,MPIfR, MPS; Ireland, NUI Maynooth; Italy: ASI, IFSI-INAF, OsservatorioAstrofisico di Arcetri- INAF; Netherlands: SRON, TUD; Poland: CAMK, CBK;Spain: Observatorio Astronómico Nacional (IGN), Centro deAstrobiología(CSIC-INTA). Sweden: Chalmers University of Technology - MC2, RSS &GARD; Onsala Space Observatory; Swedish National Space Board, StockholmUniversity - Stockholm Observatory; Switzerland: ETH Zurich, FHNW; USA:Caltech, JPL, NHSC.
HIPE is a joint development by the Herschel Science Ground SegmentConsortium, consisting of ESA, the NASA Herschel Science Center, and theHIFI, PACS and SPIRE consortia.
ReferencesBoonman, A., Doty, S., van Dishoeck, E., et al. 2003, A&A, 406, 937Chavarría, L., Herpin, F., Jacq, T., & the WISH consortium. 2010, A&A, in pressChurchwell, E., Walmsley, C. M., & Cesaroni, R. 1990, A&As, 83, 119de Graauw & et al. 2010, A&A, in pressGrosjean, A., Dubernet, M., & Ceccarelli, C. 2003, A&A, 408,1197Hatchell, J. & van der Tak, F. F. S. 2003, A&A, 409, 589Hogerheijde, M. R. & van der Tak, F. F. S. 2000, A&A, 362, 697Johnstone, D., Fish, M., McCoey, C., et al. 2010, A&A, in pressKristensen, L., Visser, R., van Dishoeck, E., et al. 2010, A&A, in pressMarseille, M., Bontemps, S., Herpin, F., & et al. 2008, A&A, 488, 579Motte, F., Schilke, P., & Lis, D. C. 2003, ApJ, 582, 277Pilbratt & et al. 2010, A&A, in pressPoelman, D. R. & van der Tak, F. F. S. 2007, A&A, 475, 949Roelfsema, P., Helmich, F., Teyssier, D., et al. 2010, A&A, in pressSridharan, T. K., Beuther, H., Saito, M., Wyrowski, F., & Schilke, P. 2005, ApJ,
634, L57van der Tak, F., Marseille, M., Herpin, F., et al. 2010, A&A, in pressvan der Tak, F., van Dishoeck, E., Evans, I. N., & Blake, G. 2000, ApJ, 537, 283van der Tak, F., Walmsley, C., Herpin, F., et al. 2006, A&A, 447, 1011Wolf, S., Henning, T., & Stecklum, B. 1999, A&A, 349, 839Zinnecker, H. & Yorke, H. W. 2007, ARA&A, 45, 481
4

M.G. Marseille et al.: Water abundances in high-mass protostellar envelopes: Herschel observations with HIFI
Fig. 2.Extraction of the saturated absorption of para-H2O 111−000 line in W43-MM1. Original profile appears in black bold, residualin green bold.
Table 4.Model parameters and derived water abundances.
Source Mgas rmin rmax n(rmin) n(rmax) T (rmin) T (rmax) XH2O 3turb
(M⊙ ) (AU) (AU) (cm−3) (cm−3) (K) (K) (km s−1)
G31.41+0.31 1500 200 22 515 8.1×10⁸ 3.1×10⁶ 406 43.2 3.1×10⁻⁸ 1.4G29.96-0.02 700 200 20 700 4.4×10⁸ 1.9×10⁶ 489 50.8 <5.0×10⁻¹⁰ 1.1W33A 4000 200 62 000 3.5×10⁸ 4.0×10⁵ 291 26.0 6.0×10⁻¹⁰ 1.6W43-MM1 2000 200 27 500 5.0×10⁸ 2.3×10⁶ 243 24.7 4.0×10⁻⁸ 3.0DR21a 1650 2000 60 520 1.6×10⁷ 1.5×10⁵ 117 23.3 2.0×10⁻¹⁰ 3.0W3-IRS5b 250 200 12 000 2.9×10⁸ 2.7×10⁶ 480 54.7 2.0×10⁻⁸ 2.0
Notes. (a) Values from van der Tak et al. (2010)(b) Values from Chavarría et al. (2010)
Appendix A: Massive dense core componentextraction
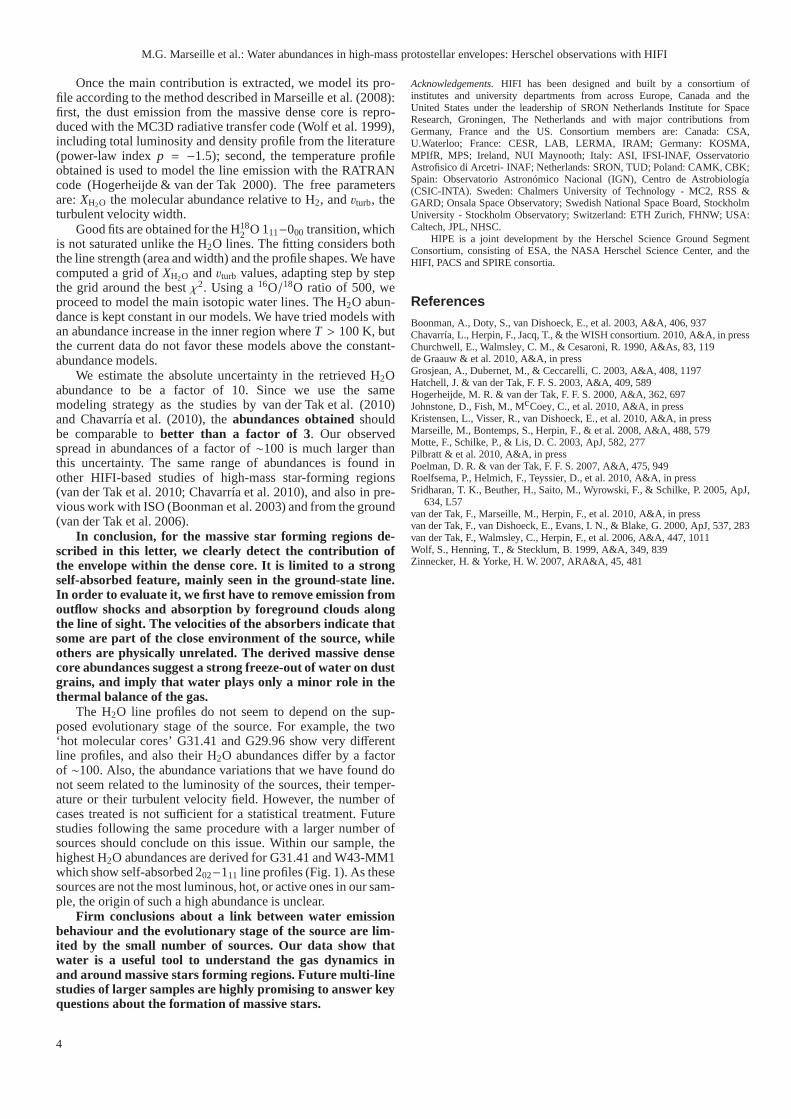
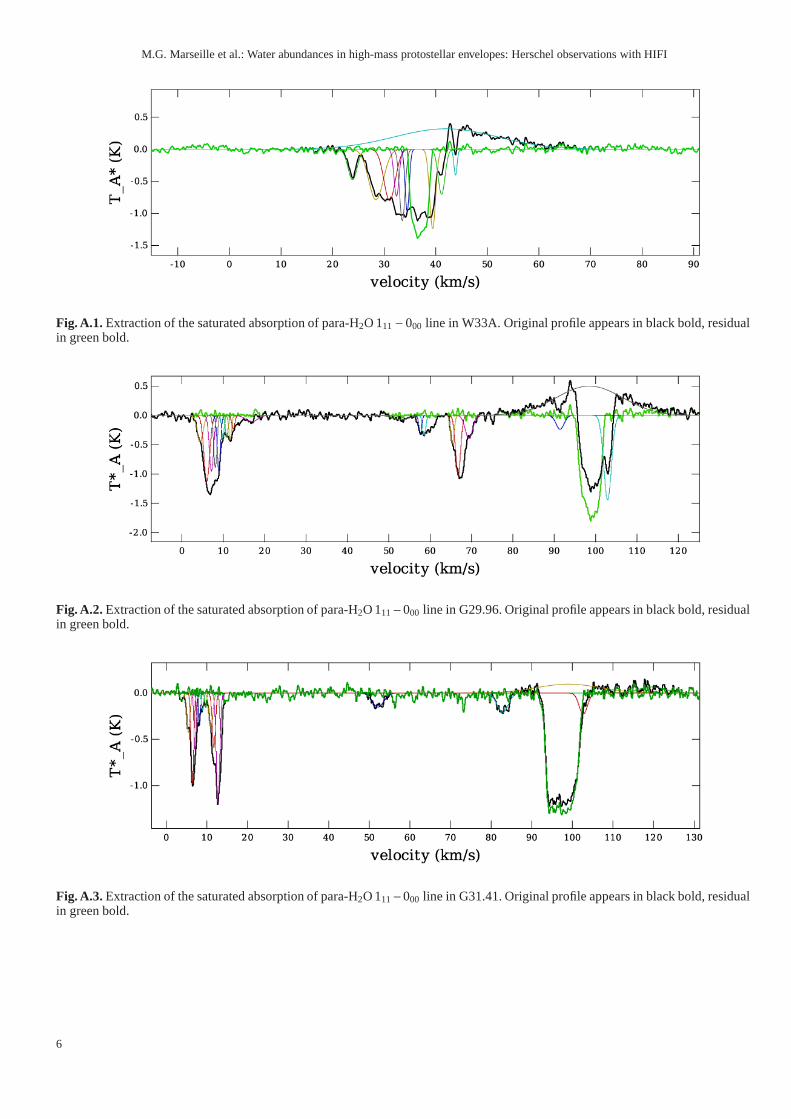
The velocity profiles of the H2O 111−000 line show absorption features at severalvelocities. These absorption features arise in foregroundclouds along the line ofsight or in cold clouds in the neighbourhood of the massive dense core, and arenot saturated unlike the absorption from the massiveenvelope. In addition tothese absorptions, some sources show H2O emission from protostellar outflows.
This appendix presents our procedure to remove these features in order toextract the contribution from the envelope to the line profile. Contrary to others,absorption from this part of the object is saturated. We are then able to removeother features by iterative Gaussian fits. This process is helped by the high ve-locity resolution provided by the Herschel-HIFI instrument, showing accurateand "bumpy" profiles in absorptions. Assuming that each bumpcorresponds toa velocity component, they are removed using the Gaussian fitting tool availablein the HIPE software. Starting from the component with the lowest velocity, theyare extracted one by one, using the residual of the previous removal to fit the nextone. This way of fitting insures a very good extraction of velocity component,giving a quasi-unique final decomposition of the absorptionfeatures. Results ofthis process are given in Fig. 2, A.1, A.2, A.3 and Tables??, ??, ?? and??.
1 Leiden Observatory, Leiden University, PO Box 9513, 2300 RALeiden, The Netherlands
2 Max Planck Institut für Extraterrestrische Physik,Giessenbachstrasse 1, 85748 Garching, Germany
3 Institute of Astronomy, ETH Zurich, 8093 Zurich, Switzerland4 School of Physics and Astronomy, University of Leeds, LeedsLS2
9JT, UK5 INAF - Osservatorio Astrofisico di Arcetri, Largo E. Fermi 5,50125
Firenze, Italy6 Université de Bordeaux, Laboratoire d’Astrophysique de Bordeaux,
France; CNRS/INSU, UMR 5804, Floirac, France7 National Research Council Canada, Herzberg Institute of
Astrophysics, 5071 West Saanich Road, Victoria, BC V9E2E7, Canada
8 Department of Physics and Astronomy, University of Victoria,Victoria, BC V8P 1A1, Canada
9 Department of Radio and Space Science, Chalmers UniversityofTechnology, Onsala Space Observatory, 439 92 Onsala, Sweden
10 SRON Netherlands Institute for Space Research, PO Box 800, 9700AV, Groningen, The Netherlands
11 Kapteyn Astronomical Institute, University of Groningen,PO Box800, 9700 AV, Groningen, The Netherlands
12 Observatorio Astronómico Nacional (IGN), Calle Alfonso XII,3.28014, Madrid, Spain
13 INAF - Istituto di Fisica dello Spazio Interplanetario, Area di Ricercadi Tor Vergata, via Fosso del Cavaliere 100, 00133 Roma, Italy
14 Department of Astronomy, The University of Michigan, 500 ChurchStreet, Ann Arbor, MI 48109-1042, USA
15 California Institute of Technology, Division of Geological andPlanetary Sciences, MS 150-21, Pasadena, CA 91125, USA
16 Centro de Astrobiología. Departamento de Astrofísica. CSIC-INTA.Carretera de Ajalvir, Km 4, Torrejón de Ardoz. 28850, Madrid,
5
M.G. Marseille et al.: Water abundances in high-mass protostellar envelopes: Herschel observations with HIFI
Fig. A.1.Extraction of the saturated absorption of para-H2O 111− 000 line in W33A. Original profile appears in black bold, residualin green bold.
Fig. A.2.Extraction of the saturated absorption of para-H2O 111−000 line in G29.96. Original profile appears in black bold, residualin green bold.
Fig. A.3.Extraction of the saturated absorption of para-H2O 111−000 line in G31.41. Original profile appears in black bold, residualin green bold.
6