Herschel-ATLAS/GAMA:How does the far-IR luminosity function depend on galaxy group properties
18
arXiv:1401.0986v1 [astro-ph.CO] 6 Jan 2014 Mon. Not. R. Astron. Soc. 000, 000–000 (0000) Printed 7 January 2014 (MN L A T E X style file v2.2) Herschel-ATLAS/GAMA:How does the far-IR luminosity function depend on galaxy group properties? Qi Guo 1,2⋆ , Cedric Lacey 1 , Peder Norberg 1 , Shaun Cole 1 , Carlton Baugh 1 , Carlos Frenk 1 , Asantha Cooray 9 , Simon Dye 3 , N. Bourne 3 , L. Dunne 4 , S. Eales 5 , R.J. Ivison 6 , S.J. Maddox 4 , M. Alpasan 7 , I. Baldry 10 , S.P. Driver 7,8 , A. Robotham 8 1 Institute for Computational Cosmology, Department of Physics, University of Durham, South Road, Durham, DH1 3LE, UK 2 Partner Group of the Max-Planck-Institut f¨ ur Astrophysik, National Astronomical Observatories, Chinese Academy of Sciences, Beijing, 100012, China 3 School of Physics and Astronomy, University of Nottingham, Nottingham NG7 2RD, UK 4 Department of Physics and Astronomy, University of Canterbury, Private Bag 4800, Christchurch, New Zealand 5 School of Physics & Astronomy, Cardiff University, The Parade, Cardiff, CF24 3AA, UK 6 UK Astronomy Technology Centre, Royal Observatory, Blackford Hill, Edinburgh EH9 3HJ, UK 7 Scottish Universities Physics Alliance (SUPA), School of Physics and Astronomy, University of St Andrews, North Haugh, St Andrews KY16 9SS, UK 8 International Centre for Radio Astronomy Research (ICRAR), University of Western Australia, Crawley, WA 6009, Australia 9 Dept. of Physics & Astronomy, University of California, Irvine, CA,92697, USA 10 Astrophysics Research Institute, Liverpool John Moores University, IC2, Liverpool Science Park, 146 Brownlow Hill, Liverpool, L3 5RF 7 January 2014 ABSTRACT We use the Herschel ATLAS (H- ATLAS) Phase I data to study the conditional luminosity function of far-IR (250 µm) selected galaxies in optically-selected galaxy groups from the GAMA spectroscopic survey, as well as environmental effects on the far-IR-to-optical colour. We applied two methods, which gave consistent results for the far-IR conditional luminosity functions. The direct matching method matches H- ATLAS sources to GAMA/SDSS galaxies, then links the optical counterparts to GAMA groups. The stacking method counts the number of far-IR sources within the projected radii of GAMA groups, subtracting the local background. We investigated the dependence of the far-IR (250µm) luminosity function on group mass in the range 10 12 <M h < 10 14 h −1 M ⊙ and on redshift in the range 0 <z< 0.4, using a sample of 3000 groups containing H- ATLAS sources with GAMA redshifts over an area of 126 deg 2 . We find that the characteristic 250µm luminosity, L ∗ (250), increases with group mass up to M h ∼ 10 13 h −1 M ⊙ , but is roughly constant above this, while it increases with redshift at high group masses, but less so at low masses. We also find that the group far- IR luminosity-to-mass ratio L(250)/M h increases with redshift and is higher in low-mass groups. We estimate that around 70% of the 250µm luminosity density in the local universe is contributed by groups with M h > 10 12 h −1 M ⊙ . We also find that the far-IR-to-optical colours of H- ATLAS galaxies are independent of group mass over the range 10 12 <M h < 10 14 h −1 M ⊙ in the local universe. We also compare our observational results with recent semi-analytical models, and find that none of these galaxy formation model can reproduce the conditional far-IR luminosity functions of galaxy groups. 1 INTRODUCTION Star formation is one of the most important processes determin- ing the formation and evolution of the galaxies. Theoretical work suggests that in situ star formation dominates over the accretion and mergers of satellite galaxies for the growth in stellar mass of galaxies less massive than the Milky Way at all redshifts (e.g. Guo & White 2008; Parry et al. 2009). Even at the Milky Way mass, star formation is the primary means of adding stellar mass at z 1. Observational studies have measured star formation rates (SFRs) from the local Universe to high redshifts. A picture in which the overall star formation density increases with redshift and peaks at around z ∼ 2 has now been well established (e.g. Madau et al. 1998; Hopkins 2007). Methods to infer the SFR in- clude the direct measurement of the rest-frame UV luminosity (e.g. Lilly et al. 1996; Madau et al. 1998; Steidel et al. 1999; Salim et al. 2007), or emission lines such as Hα and [OII] emission lines (e.g. Gallego et al. 1995; Brinchmann et al. 2004; Sobral et al. 2011), all of which trace massive young stars. However, these methods are subject to uncertain corrections for dust extinction, which varies in regions of different local properties, as well as depending on the in- clination of the galaxy. UV photons heat the dust around star form- ing regions and are then reprocessed by the dust and their energy is re-emitted in the mid- and far-IR range, with the dust emission typically peaking at a wavelength around 100μm. About half of the
Transcript of Herschel-ATLAS/GAMA:How does the far-IR luminosity function depend on galaxy group properties
arX
iv:1
401.
0986
v1 [
astr
o-ph
.CO
] 6
Jan
2014
Mon. Not. R. Astron. Soc.000, 000–000 (0000) Printed 7 January 2014 (MN LATEX style file v2.2)
Herschel-ATLAS/GAMA:How does the far-IR luminosity functiondepend on galaxy group properties?
Qi Guo1,2⋆, Cedric Lacey1, Peder Norberg1, Shaun Cole1, Carlton Baugh1, Carlos Frenk1,Asantha Cooray9, Simon Dye3, N. Bourne3, L. Dunne4, S. Eales5, R.J. Ivison6, S.J.Maddox4, M. Alpasan7, I. Baldry10, S.P. Driver7,8, A. Robotham8
1 Institute for Computational Cosmology, Department of Physics, University of Durham, South Road, Durham, DH1 3LE, UK2 Partner Group of the Max-Planck-Institut fur Astrophysik, National Astronomical Observatories, Chinese Academy ofSciences,Beijing, 100012, China3 School of Physics and Astronomy, University of Nottingham,Nottingham NG7 2RD, UK4 Department of Physics and Astronomy, University of Canterbury, Private Bag 4800, Christchurch, New Zealand5 School of Physics & Astronomy, Cardiff University, The Parade, Cardiff, CF24 3AA, UK6 UK Astronomy Technology Centre, Royal Observatory, Blackford Hill, Edinburgh EH9 3HJ, UK7 Scottish Universities Physics Alliance (SUPA), School of Physics and Astronomy, University of St Andrews, North Haugh, St Andrews KY16 9SS, UK8 International Centre for Radio Astronomy Research (ICRAR), University of Western Australia, Crawley, WA 6009, Australia9 Dept. of Physics & Astronomy, University of California, Irvine, CA,92697, USA10 Astrophysics Research Institute, Liverpool John Moores University, IC2, Liverpool Science Park, 146 Brownlow Hill, Liverpool, L3 5RF
7 January 2014
ABSTRACTWe use the Herschel ATLAS (H-ATLAS) Phase I data to study the conditional luminosityfunction of far-IR (250µm) selected galaxies in optically-selected galaxy groups from theGAMA spectroscopic survey, as well as environmental effects on the far-IR-to-optical colour.We applied two methods, which gave consistent results for the far-IR conditional luminosityfunctions. The direct matching method matchesH-ATLAS sources toGAMA /SDSSgalaxies,then links the optical counterparts toGAMA groups. The stacking method counts the numberof far-IR sources within the projected radii ofGAMA groups, subtracting the local background.We investigated the dependence of the far-IR (250µm) luminosity function on group mass inthe range1012 < Mh < 1014h−1M⊙ and on redshift in the range0 < z < 0.4, using asample of 3000 groups containingH-ATLAS sources withGAMA redshifts over an area of126 deg2. We find that the characteristic250µm luminosity,L∗(250), increases with groupmass up toMh ∼ 1013h−1M⊙, but is roughly constant above this, while it increases withredshift at high group masses, but less so at low masses. We also find that the group far-IR luminosity-to-mass ratioL(250)/Mh increases with redshift and is higher in low-massgroups. We estimate that around 70% of the250µm luminosity density in the local universeis contributed by groups withMh > 1012h−1M⊙. We also find that the far-IR-to-opticalcolours ofH-ATLAS galaxies are independent of group mass over the range1012 < Mh <1014h−1M⊙ in the local universe. We also compare our observational results with recentsemi-analytical models, and find that none of these galaxy formation model can reproduce theconditional far-IR luminosity functions of galaxy groups.
1 INTRODUCTION
Star formation is one of the most important processes determin-ing the formation and evolution of the galaxies. Theoretical worksuggests thatin situ star formation dominates over the accretionand mergers of satellite galaxies for the growth in stellar massof galaxies less massive than the Milky Way at all redshifts (e.g.Guo & White 2008; Parry et al. 2009). Even at the Milky Waymass, star formation is the primary means of adding stellar massat z & 1. Observational studies have measured star formationrates (SFRs) from the local Universe to high redshifts. A picturein which the overall star formation density increases with redshiftand peaks at aroundz ∼ 2 has now been well established (e.g.
Madau et al. 1998; Hopkins 2007). Methods to infer the SFR in-clude the direct measurement of the rest-frame UV luminosity (e.g.Lilly et al. 1996; Madau et al. 1998; Steidel et al. 1999; Salim et al.2007), or emission lines such as Hα and [OII] emission lines (e.g.Gallego et al. 1995; Brinchmann et al. 2004; Sobral et al. 2011), allof which trace massive young stars. However, these methods aresubject to uncertain corrections for dust extinction, which varies inregions of different local properties, as well as dependingon the in-clination of the galaxy. UV photons heat the dust around starform-ing regions and are then reprocessed by the dust and their energyis re-emitted in the mid- and far-IR range, with the dust emissiontypically peaking at a wavelength around 100µm. About half of the

2 Guo et al.
starlight is absorbed and re-emitted over the history of theUniverse(Puget et al. 1996; Hauser et al. 1998) (some studies show that aneven larger fraction of the UV light is reprocessed, e.g. (Buat et al.2007)). Observations at IR wavelengths are thus an essential com-plement to UV and optical tracers of star formation. Previous sur-veys in the IR include that byIRAS, which measured the far-IRemission at6 100µm, which mainly constrains the emission fromwarm dust in bright galaxies (Dunne & Eales 2001), while morerecent surveys of dust emission focused either on the mid-IR(ISO,Spitzer) or sub-mm (e.g.SCUBA) wavelengths, and therefor missesthe peak in the dust emission, and hence requires uncertain extrapo-lations to infer total IR luminosities.Herschel1 (Pilbratt et al. 2010)observations span the far-IR wavelengths60 − 700 µm, coveringthe peak of the dust emission from star-forming galaxies. More-over, as the largest open-time key project onHerschel, the HerschelAstrophysical Terahertz Large Area Survey (H-ATLAS) (Eales et al.2010a) provides far-IR imaging and photometry over an area of 550deg2, in five channels centred on 100, 160, 250, 350, and 500µm,ideal for using the far-IR emission to estimate the dust obscuredstar formation rate.
The star formation rate of galaxies depends on stellar mass,redshift, and environment. It has been known for many years thatthe fraction of star forming galaxies decreases as the mass of thehost dark matter halo increases, from isolated field galaxies up torich clusters (e.g. Dressler 1980; Kimm et al. 2009). The fraction ofactively star-forming galaxies in groups and clusters alsoincreaseswith redshift (e.g. Butcher & Oemler 1978). However, focusingonly on the population of star-forming galaxies, the effectof galaxyenvironment on star formation activity is still under debate. Moststudies find no dependence of the SFR of star-forming galaxies ata given stellar mass on group/cluster environment or local density,from low (z = 0) to intermediate (z < 0.5) redshifts (Balogh et al.2004; Tanaka et al. 2004; Weinmann et al. 2006; Peng et al. 2010;McGee et al. 2011). This independence has also been found at highredshift (z ∼ 1) (Ideue et al. 2012). However, some other stud-ies conflict with this conclusion (Lewis et al. 2002; Gomez et al.2003; Welikala et al. 2008), suggesting that galaxy SFRs aremorestrongly suppressed in highly overdense regions.
Most previous work on the dependence of galactic SFRs onenvironment has used the UV continuum or the Hα emission toestimate SFRs. In this paper, we revisit this problem by lookingat an important tracer of the dust-obscured SFR, the far-IR emis-sion. Early work on the IR properties of galaxies in rich clustersbased onIRASandISOobservations is reviewed by Metcalfe et al.(2005). There have been several studies using mid-IR observa-tions, mainly the Spitzer 24µm band, to estimate the IR luminosityfunctions (LFs) of galaxy clusters (M & 1014M⊙) (e.g Bai et al.2006, 2009; Chung et al. 2010; Finn et al. 2010; Goto et al. 2010;Biviano et al. 2011), and one measurement of the IR LF of mas-sive galaxy groups (1013 . M . 1014M⊙) (Tran et al. 2009).However these studies had the drawback that they had to extrapo-late in wavelength in order to estimate total IR luminosities. SFRsestimated from mid-IR luminosities have been used to study thefraction of star-forming galaxies in different density environments(e.g. Koyama et al. 2008; Tran et al. 2009), and also to study thedependence of the specific star formation rate (sSFR), defined asthe ratio,SFR/M⋆, of SFR to stellar massM⋆, on local density
1 Herschel is an ESA space observatory with science instruments providedby European-led Principal Investigator consortia and withimportant partic-ipation from NASA.
and group or cluster environment (e.g. Elbaz et al. 2007; Baiet al.2010). Mid-IR observations have also been used to estimate theevolution of the ratioLIR/Mh of total IR luminosity to dark matterhalo massMh for rich clusters (Geach et al. 2006; Koyama et al.2010; Webb et al. 2013). These studies have recently been extendedto the far-IR and to galaxy groups by Popesso et al. (2012), whousedHerschelobservations to measureLIR/Mh for 9 rich clusters(M ∼ 1015M⊙) and 9 groups (M ∼ 5 × 10¹³M⊙) at redshifts0.1 . z . 1.
In this paper, we directly measure the far-IR LFs andLIR/Mh
ratios of a very large sample (∼ 3000) of galaxy groups and clus-ters covering a wide range in mass,1012 < Mh < 1014h−1M⊙,in the low-redshiftz < 0.4 Universe using data fromHerschel.We also use our sample to measure the dependence of the dust-obscured sSFR on group mass. The galaxy groups are opticallyse-lected from theGAMA spectroscopic survey (Driver et al. 2009).Our study has several advantage over previous studies of thesamerange of group mass and redshift: (a) We use far-IR observations,which provide a much more robust measure of the total IR lumi-nosity, and hence of the dust-obscured SFR, than is possibleusingmid-IR data. (b) We probe a much larger range of group mass thanwas available to previous studies, which were restricted toquitemassive groups,1013 . Mh . 1014h−1M⊙. (c) We have a muchlarger sample of groups than previous studies, which had samplesof ∼ 10 groups at most. (d) Our group sample, being opticallyselected, is much more complete than the X-ray selected samplesused in many previous IR studies. (e) We study the IR LF of groupsdown toLIR ∼ 109L⊙, much fainter than most previous studiesof groups and clusters, which were restricted toLIR ∼ 1010L⊙ orbrighter.
The first step in our study is to measure the galaxy abun-dance in groups and clusters as a function of their far-IR lumi-nosities. Similar techniques have been developed extensively inthe optical range (e.g. Jing et al. 1998; Berlind & Weinberg 2002;Yang et al. 2003), while the far-IR is almost unexplored due to theprevious lack of deep and sufficiently large surveys at thesewave-lengths. TheH-ATLAS is a perfect survey for this study. To identifygalaxy groups, we use group catalogues (Robotham et al. 2011)based on an optical redshift survey – the Galaxy And Mass As-sembly I survey (GAMA I, Baldry et al. 2010; Driver et al. 2009,2011; Hill et al. 2011; Taylor et al. 2011; Kelvin et al. 2012). Theabundance of far-IR galaxies within a givenGAMA group is thenmeasured using two methods. One is to matchH-ATLAS sourcesto GAMA galaxies (Smith et al. 2011), calculating the abundanceof the far-IR-detected group members directly. The other isto cal-culate the abundance ofH-ATLAS sources within a projected ra-dius around the group centre after subtracting the contribution fromthe background. After measuring the far-IR conditional luminos-ity function (CLF) for groups of different masses and redshifts,we further study its properties, including the characteristic far-IRluminosityL∗ and luminosity-to-mass ratio, and their correlationwith the masses and redshifts of the host groups. The first methodalso enables us to study the variation of the far-IR-to-optical colour(which is an indicator of the specific star formation rate) inthe field,groups and clusters.
This paper is organized as follows. In§2 we briefly describethe two catalogues used in this work:H-ATLAS Phase I andGAMA I(including groups). The two methods used to count group members,as well as the data description are also presented in§2. The far-IRluminosity functions in groups of different masses and redshifts arepresented in§3. In this section, we also discuss the relationship be-tween the total far-IR luminosity and group mass and its evolution

Far-IR luminosity function of galaxy groups 3
with redshift. In§4, we discuss the far-IR - optical colour, focusingon environmental effects and redshift evolution. A comparison withpredictions from galaxy formation models is presented in§5. Ourmain results are summarized in§6.
Throughout this paper we assume a flatΛCDM cosmol-ogy with Ωm = 0.25, ΩΛ = 0.75, h = 0.73 whereH0 =100km s−1Mpc−1 and power spectrum normalizationσ8 = 0.9.This power spectrum normalization is only relevant for our modelpredictions as presented in Sec.5.
2 DATA AND METHODS
In §2.1 we describe the GAMA data, in§2.2 the Herschel-Atlasdata, and in§2.3 we outline how we measure the luminosity ofgroups.
2.1 GAMA I
TheGAMA I survey is an optical spectroscopic galaxy survey cov-ering 142 deg2 in three equal-sized regions on the celestial equator,to apparentr-band magnituderAB = 19.4 in two regions (G09 andG15) andrAB = 19.8 in one region (G12).2 It contains 110,192galaxies with optical/near-IR imaging (fromSDSS, UKIDSS, KIDS,VIKING , with the latter two still underway), and complementaryobservations from the UV (GALEX) through to the mid and far-IR (WISE, Herschel) and the radio (ASKAP, GMRT, underway).The redshift completeness tor-band magnitude 19.4 reaches 98.7%(Driver et al. 2011). To simplify the selection function, welimitourselves tor < 19.4. This leads to a sample of 93325 galaxies,with a redshift coverage of0 < z < 0.5 centred at aroundz ∼ 0.2.
Using the GAMA I optically selected redshift catalogue,Robotham et al. (2011) used a redshift space friends-of-friends(FoF) grouping algorithm to create the GAMA I group catalogue.Systems with 2 or more optical members are identified as galaxygroups. In total, there are 12.2k GAMA groups, and around 34%ofGAMA galaxies belong to groups. Total group masses used in thisstudy are inferred from the total r-band luminosity of the group,its redshift and the group multiplicity, following the descriptiongiven in Robotham et al. (2011) and implemented in Han et al.(in prep). The GAMA group catalogue has been extensively testedagainst a set of mock GAMA lightcones, following the method de-scribed in Merson et al. (2013). In summary, the mocks are con-structed from the MillenniumΛCDM dark matter N-body simula-tion (Springel et al. 2005), populated with galaxies using the GAL-FORM semi-analytical galaxy formation model (Cole et al. 2000),using the Bower et al. (2006) model as input. Finally, the rawGAL-FORM lightcones are abundance matched to precisely reproducethe GAMA r-band luminosity function (Loveday et al. 2012), re-sulting in minor modifications to the r-band magnitudes (typicallyless than 0.1 mag). This is consistent with differences expected toarise from different magnitude definitions, which are not includedin the lightcone pipeline. Readers are referred to Merson etal.(2013) and Robotham et al. (2011) for further details on the mocks,and in particular to the latter for a list of known limitations specificto the GAMA lightcone mocks.
2 The GAMA II survey reachesrAB = 19.8 in all fields. However, thegroup catalogue we use is based onGAMA I. In order to have a self-consistent analysis, we adopt theGAMA I data release rather than theGAMA
II survey
For the present study, the completeness of the group catalogueas function of group mass and redshift needs to be addressed.Us-ing the mocks, we estimate this completeness to be about 90%for z <0.2 and Mh >1013 M⊙/h,while it decreases strongly withdecreasing group mass and increasing redshift to below 20% fore.g. groups less massive than 1013 M⊙/h in the redshift range0.1< z <0.3 . These completenesses correspond to upper limits,as they do not account for uncertainties in the group mass esti-mate, nor in the grouping. A comprehensive investigation, includ-ing uncertainties from applying the group finder to a different set ofmocks, is currently underway and beyond the scope of the presentpaper. We note here that the underlying assumption for the rest ofthe paper is that the identified groups of a given mass are an unbi-ased sample of all groups of that mass.
2.2 H -ATLAS Phase I
The H-ATLAS Phase I Data Release consists of three equatorialfields (G09, G12 and G15), covering 135 deg2 in total. The overlapbetweenH-ATLAS and theGAMA -I survey is about 126 deg2. H-ATLAS has imaging in five far-IR bands centred on 100, 160, 250,350 and 500µm, using the PACS (Poglitsch et al. 2010) and SPIRE(Griffin et al. 2010) instruments. The median values of the 5σ fluxlimits are 132, 126, 32, 36, and 45 mJy respectively for the fivewavelengths. There are 78.0k sources brighter than the 5σ detec-tion limit in one or more of the 3 SPIRE bands (Rigby et al. 2011).In this paper, we work with a 250µm flux-limited sample, since thisis the most sensitive band and has the best positional accuracy ofthe 3 SPIRE bands. In theH-ATLAS Phase I Data Release, sourcesbrighter than the 5σ flux limit at 250µm have been matched to ther-band selected (r < 22.4) SDSSgalaxy imaging catalogue using alikelihood ratio method (see Smith et al. 2011 for details).A relia-bility value (RLR) is assigned to each candidate optical counterpart,if any, which gives the Bayesian probability that the candidate is thetrue counterpart, with the threshold for a reliable match being takenasRLR > 0.8. We use the sample of 66.2kH-ATLAS sources with250 µm flux above35 mJy which is higher than the median 5σvalue to guarantee a uniform selection, for which there are 29.8kcandidates withRLR > 0.8 (45% of our total 250µm H-ATLAS
sample). Of these, 24.2k galaxies are in the area overlapping withtheGAMA -I survey. Applying a uniform cut ofr < 19.4 in all threeregions overlapping withGAMA -I leads to 10.5kH-ATLAS galax-ies with reliable counterparts in theGAMA spectroscopic sample,corresponding to 43% of the sources with an optical counterpartin SDSSin the GAMA -I overlap region. This sample with spectro-scopic redshifts forms the direct matching catalogue whichwe usein most of this work.
There are 10.7kGAMA groups in theH-ATLAS overlap region,of which 3.0k groups have mass1012 < Mh < 1014h−1M⊙ andredshifts in the range0 < z < 0.4 and contain 1 or more reli-able r < 19.4 counterparts inH-ATLAS. In total there are 3.2kH-ATLAS-GAMA galaxies inGAMA groups.
To k-correct the observed 250µm flux to the rest frame250µm luminosity, we assume the dust emission SED is a modi-fied black-body, as in Guo et al. (2011a):
Lν ∝ Bν(T )νβ, (1)
whereBν(T ) is the Planck function, and we assumeβ = 1.5 andfit the temperature using as many far-IR bands as are detected. Wethen calculate the k-correction for each source using its individuallyestimated temperature.
4 Guo et al.
The median temperature of our sample is 26 K. For this as-sumed SED shape and temperature, the ratio of the total IR lumi-nosityLIR (integrated over 8–1000µm) toνLν (250, rest frame) is5.5 for the median temperature, so we have the conversion betweenmonochromatic and total IR luminosities of
LIR/L⊙ = 1.8× 10¹⁰ Lν(250µm)/(1024WHz−1). (2)
To relate far-IR luminosities to dust-obscured SFRs, we usethe relation derived by Kennicutt (1998), multiplied by0.63 whichcorresponds to a Chabrier (2003) IMF over a stellar mass range0.1 < m < 100M⊙. This gives
SFR/(M⊙yr−1) = 2.8× 10−44LIR/(erg s
−1)
= 1.8Lν(250µm)/(1024WHz−1), (3)
where in the second line we have assumed the SED shape describedabove with T = 26 K.
The conversation from L250µm to the SFR above is only to il-lustrate the typical SFR. In practice, when calculating theSFR inSec. 4, we use the temperature for each source from fitting itsownSED. Note that LIR could be underestimated with the assumptionof a single modified black body for the SED fitting, given that theSED of dust emission could be more complicated and there are con-tributions from hot dust, PAH and VSG which emit in the mid-IR.The true total emission from 8-1000µm could be higher by around30-50% than that obtained using Eq. (2). On the other hand, sincea lot of the dust in H-ATLAS sources seem to be heated by olderstars and not recent SFR, the conversation from the total LIR in Eq.(3) could overestimate the derived SFR. These two effects partlycompensate each other and our results should be robust within afactor of 2.
2.3 Methods for measuring the far-IR LF of galaxy groups
We use two independent methods to estimate the abundance ofgroup/cluster galaxies as a function of their far-IR luminosity.
2.3.1 Direct matching method
Our first method (hereafter, the direct method) uses the matchedH-ATLAS-GAMA galaxy catalogue. TheGAMA group catalogue(Robotham et al. 2011) lists theGAMA galaxies in eachGAMA
group/cluster. The direct matching catalogue, on the otherhand,establishes the link between theH-ATLAS source and ther-bandselectedGAMA galaxy. The combination of these two directly linksthe GAMA group/cluster with itsH-ATLAS members. Around 33%of the galaxies in the matchedH-ATLAS-GAMA catalogue are iden-tified as group members, the same as the corresponding fraction ofGAMA galaxies (34%).
The mean far-IR luminosity function of galaxies in groups ina certain mass and redshift range is calculated using
Φ(Li)∆ logLi =Σ
Ngroup
j=0 ni,j
ΣNgroup
j=0 Ni,j
, (4)
whereΦ(Li)∆ logLi is the number of galaxies per group in theithluminosity binLi,ni,j is the number of matched galaxies in theith
luminosity bin for thejth group, andNgroup is the total number ofgroups for a given redshift bin and group mass bin. The factorNi,j
specifies whether thejth group contributes to the measurement inthe ith luminosity bin, given the far-IR flux limit and redshift, andis defined asNi,j = 1 if a galaxy of theith luminosity could bedetected at the redshift of thejth group, otherwiseNi,j = 0.
This method, however, might suffer some problems. Not everyH-ATLAS galaxy has an optical counterpart inGAMA , even if theylie in the same redshift range and sky region. It is possible that thedust extinction is very large so that the galaxies are too faint inther-band to be included inGAMA . It is also possible that a highredshiftH-ATLAS galaxy is projected onto a relatively dense regionin ther-band selected galaxy survey so that an optical counterpartis incorrectly assigned to it. For these reasons, we also apply analternative method described next.
2.3.2 Stacking Method
Our second method (hereafter, the stacking method) is to countthe number ofH-ATLAS sources within a projected radius of eachGAMA group, after subtracting the local backgroundH-ATLAS
source density. Note that for this method we do not require the H-ATLAS sources to have optical counterparts inSDSS. EachH-ATLAS
source is assigned the redshift of the target group to calculate its lu-minosity and projected separation. The far-IR luminosity functionin groups is then calculated using
Φ(Li)∆ logLi =Σ
Ngroup
j=0 [ni,j(Rj)− nbg,i × Aj ]
ΣNgroup
j=0 Ni,j
, (5)
whereni,j(Rj) is the total number ofH-ATLAS sources in theithluminosity bin and within a projected radiusRj of the centre ofthe jth group (the choice ofRj will be discussed below),nbg,ij
is the background surface density ofH-ATLAS sources in theithluminosity bin around thejth group (when placed at the redshift ofthe group), andAj is the area enclosed by radiusRj .
A shortcoming of this method is that it relies on the choice ofthe radiusR within which H-ATLAS sources are counted as groupmembers. Ideally one would use the virial radius of the group. TheGAMA group catalogue provides several measures of group radius,R50, R1σ , andR100, which are defined, respectively, as the radiusof the 50th and 68th percentile and the most distant group memberfrom the central galaxy. It is possible that even the most distant pro-jected member is still well within the virial radius. It is beyond thescope of this paper to investigate how well different observationaldefinitions of group radius reflect the “real” group radius. Here weadoptR100 as the default radiusR.
Another potential drawback of this method is that we needto estimate the local background surface densitynbg of H-ATLAS
sources around each group. We do this by counting sources inannuli around each group. It is possible that the backgroundsur-face density could be over- or under-estimated if there is anover- or under-dense region along the line-of-sight to the targetgroup/cluster even though it is unbiased on average. We testedhow sensitive our results might be to this effect by varying the in-ner and outer radii of the annuli used to measure the local back-ground. We find that our results are insensitive to the exact choiceof these radii (see Appendix A). Hereafter we use annuli of radiiR100 < R < 3R100 around each group to measure the local back-ground densitynbg.
3 GROUP LUMINOSITY LUNCTIONS
In this section, we first study the rest-frame 250µm luminosityfunction for all galaxies, and then the conditional 250µm luminos-ity function in galaxy groups of different masses and at different
Far-IR luminosity function of galaxy groups 5
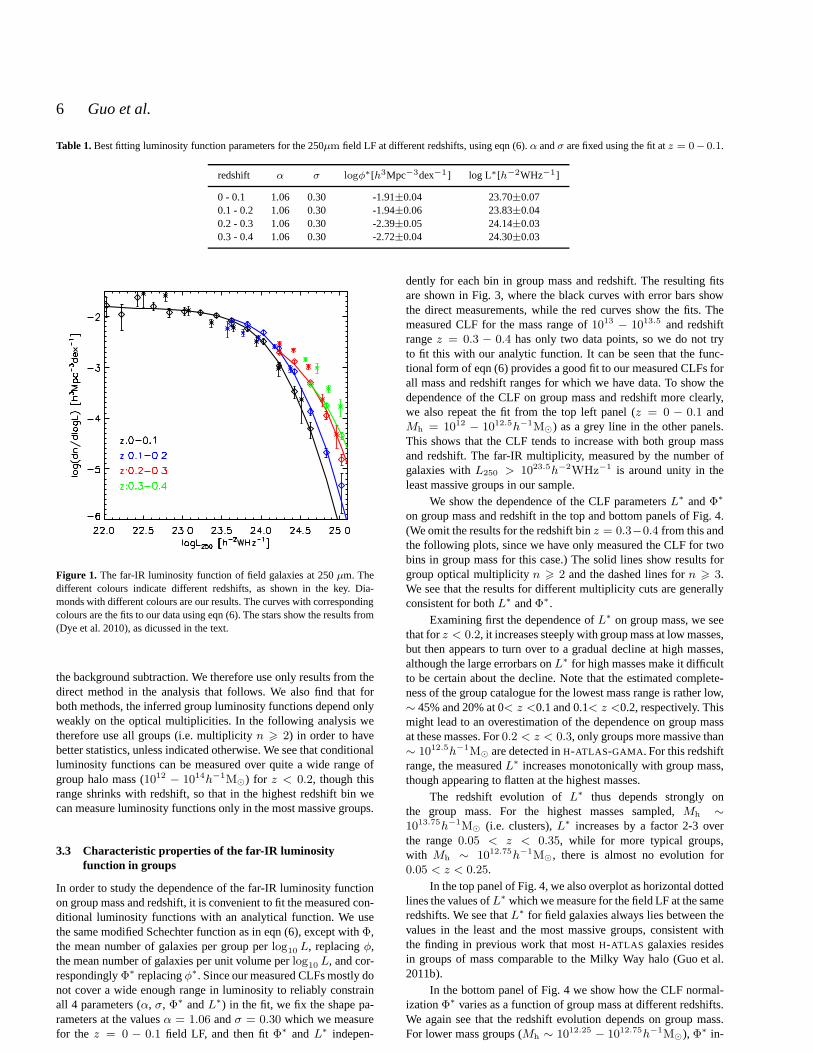
redshifts. We fit these luminosity functions with an analytical func-tion, and use this to study the dependence of characteristiclumi-nosity on group mass and redshift, as well as the contribution to theoverall 250µm luminosity density from halos of different masses atdifferent redshifts.
3.1 Far-IR luminosity function in the field
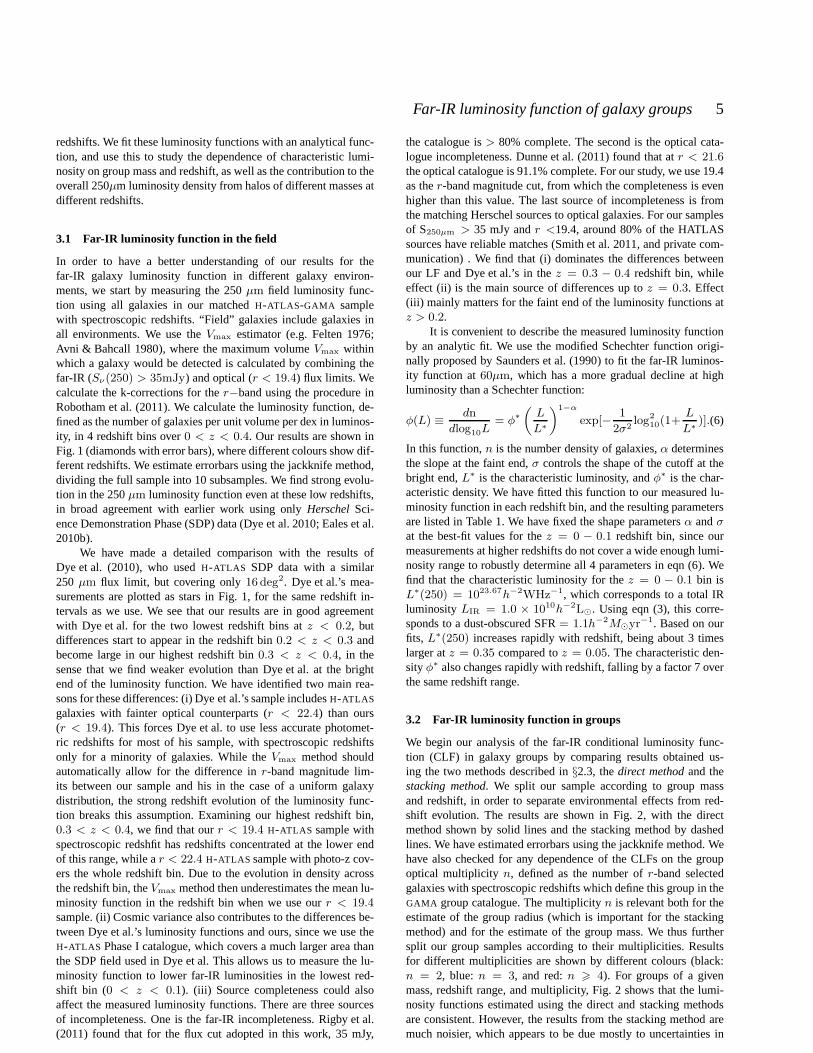
In order to have a better understanding of our results for thefar-IR galaxy luminosity function in different galaxy environ-ments, we start by measuring the 250µm field luminosity func-tion using all galaxies in our matchedH-ATLAS-GAMA samplewith spectroscopic redshifts. “Field” galaxies include galaxies inall environments. We use theVmax estimator (e.g. Felten 1976;Avni & Bahcall 1980), where the maximum volumeVmax withinwhich a galaxy would be detected is calculated by combining thefar-IR (Sν(250) > 35mJy) and optical (r < 19.4) flux limits. Wecalculate the k-corrections for ther−band using the procedure inRobotham et al. (2011). We calculate the luminosity function, de-fined as the number of galaxies per unit volume per dex in luminos-ity, in 4 redshift bins over0 < z < 0.4. Our results are shown inFig. 1 (diamonds with error bars), where different colours show dif-ferent redshifts. We estimate errorbars using the jackknife method,dividing the full sample into 10 subsamples. We find strong evolu-tion in the 250µm luminosity function even at these low redshifts,in broad agreement with earlier work using onlyHerschelSci-ence Demonstration Phase (SDP) data (Dye et al. 2010; Eales et al.2010b).
We have made a detailed comparison with the results ofDye et al. (2010), who usedH-ATLAS SDP data with a similar250 µm flux limit, but covering only16 deg2. Dye et al.’s mea-surements are plotted as stars in Fig. 1, for the same redshift in-tervals as we use. We see that our results are in good agreementwith Dye et al. for the two lowest redshift bins atz < 0.2, butdifferences start to appear in the redshift bin0.2 < z < 0.3 andbecome large in our highest redshift bin0.3 < z < 0.4, in thesense that we find weaker evolution than Dye et al. at the brightend of the luminosity function. We have identified two main rea-sons for these differences: (i) Dye et al.’s sample includesH-ATLAS
galaxies with fainter optical counterparts (r < 22.4) than ours(r < 19.4). This forces Dye et al. to use less accurate photomet-ric redshifts for most of his sample, with spectroscopic redshiftsonly for a minority of galaxies. While theVmax method shouldautomatically allow for the difference inr-band magnitude lim-its between our sample and his in the case of a uniform galaxydistribution, the strong redshift evolution of the luminosity func-tion breaks this assumption. Examining our highest redshift bin,0.3 < z < 0.4, we find that ourr < 19.4 H-ATLAS sample withspectroscopic redshfit has redshifts concentrated at the lower endof this range, while ar < 22.4 H-ATLAS sample with photo-z cov-ers the whole redshift bin. Due to the evolution in density acrossthe redshift bin, theVmax method then underestimates the mean lu-minosity function in the redshift bin when we use ourr < 19.4sample. (ii) Cosmic variance also contributes to the differences be-tween Dye et al.’s luminosity functions and ours, since we use theH-ATLAS Phase I catalogue, which covers a much larger area thanthe SDP field used in Dye et al. This allows us to measure the lu-minosity function to lower far-IR luminosities in the lowest red-shift bin (0 < z < 0.1). (iii) Source completeness could alsoaffect the measured luminosity functions. There are three sourcesof incompleteness. One is the far-IR incompleteness. Rigbyet al.(2011) found that for the flux cut adopted in this work, 35 mJy,
the catalogue is> 80% complete. The second is the optical cata-logue incompleteness. Dunne et al. (2011) found that atr < 21.6the optical catalogue is 91.1% complete. For our study, we use 19.4as ther-band magnitude cut, from which the completeness is evenhigher than this value. The last source of incompleteness isfromthe matching Herschel sources to optical galaxies. For our samplesof S250µm > 35 mJy andr <19.4, around 80% of the HATLASsources have reliable matches (Smith et al. 2011, and private com-munication) . We find that (i) dominates the differences betweenour LF and Dye et al.’s in thez = 0.3 − 0.4 redshift bin, whileeffect (ii) is the main source of differences up toz = 0.3. Effect(iii) mainly matters for the faint end of the luminosity functions atz > 0.2.
It is convenient to describe the measured luminosity functionby an analytic fit. We use the modified Schechter function origi-nally proposed by Saunders et al. (1990) to fit the far-IR luminos-ity function at60µm, which has a more gradual decline at highluminosity than a Schechter function:
φ(L) ≡dn
dlog10L= φ∗
(
L
L∗
)1−α
exp[−1
2σ2log2
10(1+L
L∗)].(6)
In this function,n is the number density of galaxies,α determinesthe slope at the faint end,σ controls the shape of the cutoff at thebright end,L∗ is the characteristic luminosity, andφ∗ is the char-acteristic density. We have fitted this function to our measured lu-minosity function in each redshift bin, and the resulting parametersare listed in Table 1. We have fixed the shape parametersα andσat the best-fit values for thez = 0 − 0.1 redshift bin, since ourmeasurements at higher redshifts do not cover a wide enough lumi-nosity range to robustly determine all 4 parameters in eqn (6). Wefind that the characteristic luminosity for thez = 0 − 0.1 bin isL∗(250) = 1023.67h−2WHz−1, which corresponds to a total IRluminosityLIR = 1.0 × 10¹⁰h−2L⊙. Using eqn (3), this corre-sponds to a dust-obscured SFR= 1.1h−2M⊙yr
−1. Based on ourfits, L∗(250) increases rapidly with redshift, being about 3 timeslarger atz = 0.35 compared toz = 0.05. The characteristic den-sityφ∗ also changes rapidly with redshift, falling by a factor 7 overthe same redshift range.
3.2 Far-IR luminosity function in groups
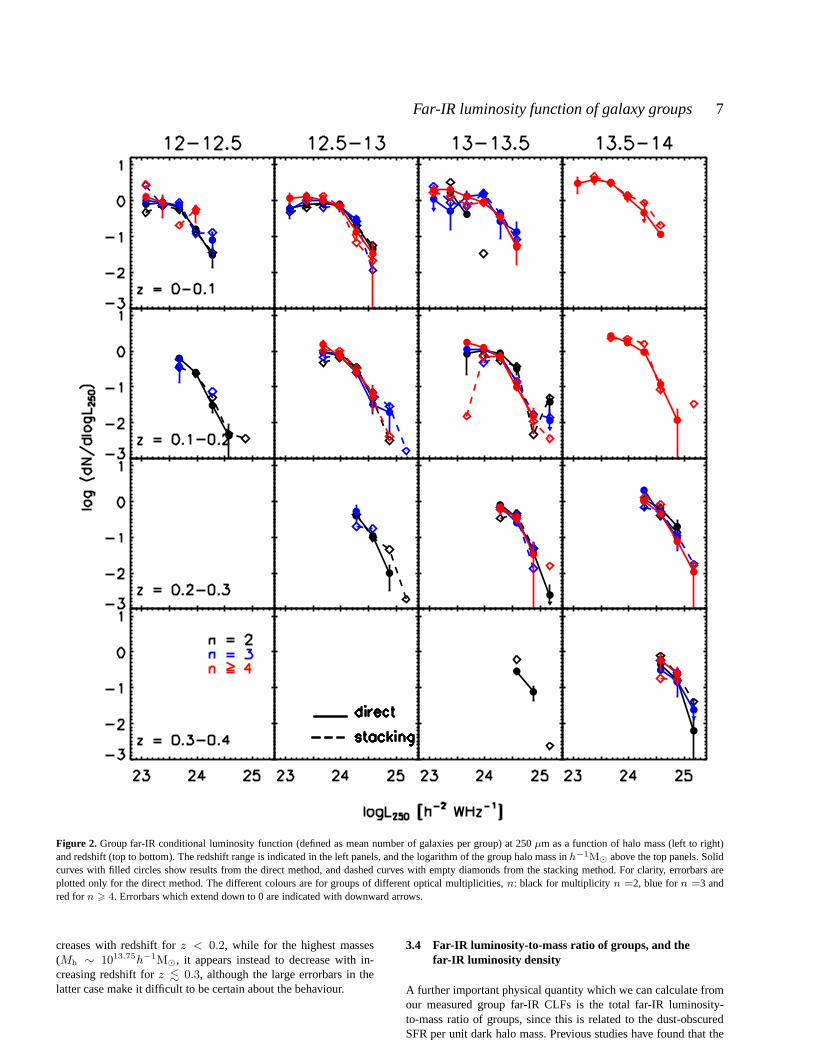
We begin our analysis of the far-IR conditional luminosity func-tion (CLF) in galaxy groups by comparing results obtained us-ing the two methods described in§2.3, thedirect methodand thestacking method. We split our sample according to group massand redshift, in order to separate environmental effects from red-shift evolution. The results are shown in Fig. 2, with the directmethod shown by solid lines and the stacking method by dashedlines. We have estimated errorbars using the jackknife method. Wehave also checked for any dependence of the CLFs on the groupoptical multiplicity n, defined as the number ofr-band selectedgalaxies with spectroscopic redshifts which define this group in theGAMA group catalogue. The multiplicityn is relevant both for theestimate of the group radius (which is important for the stackingmethod) and for the estimate of the group mass. We thus furthersplit our group samples according to their multiplicities.Resultsfor different multiplicities are shown by different colours (black:n = 2, blue: n = 3, and red:n > 4). For groups of a givenmass, redshift range, and multiplicity, Fig. 2 shows that the lumi-nosity functions estimated using the direct and stacking methodsare consistent. However, the results from the stacking method aremuch noisier, which appears to be due mostly to uncertainties in
6 Guo et al.
Table 1.Best fitting luminosity function parameters for the 250µm field LF at different redshifts, using eqn (6).α andσ are fixed using the fit atz = 0− 0.1.
redshift α σ logφ∗[h3Mpc−3dex−1 ] log L∗[h−2WHz−1]
0 - 0.1 1.06 0.30 -1.91±0.04 23.70±0.070.1 - 0.2 1.06 0.30 -1.94±0.06 23.83±0.040.2 - 0.3 1.06 0.30 -2.39±0.05 24.14±0.030.3 - 0.4 1.06 0.30 -2.72±0.04 24.30±0.03
Figure 1. The far-IR luminosity function of field galaxies at 250µm. Thedifferent colours indicate different redshifts, as shown in the key. Dia-monds with different colours are our results. The curves with correspondingcolours are the fits to our data using eqn (6). The stars show the results from(Dye et al. 2010), as dicussed in the text.
the background subtraction. We therefore use only results from thedirect method in the analysis that follows. We also find that forboth methods, the inferred group luminosity functions depend onlyweakly on the optical multiplicities. In the following analysis wetherefore use all groups (i.e. multiplicityn > 2) in order to havebetter statistics, unless indicated otherwise. We see thatconditionalluminosity functions can be measured over quite a wide rangeofgroup halo mass (1012 − 1014h−1M⊙) for z < 0.2, though thisrange shrinks with redshift, so that in the highest redshiftbin wecan measure luminosity functions only in the most massive groups.
3.3 Characteristic properties of the far-IR luminosityfunction in groups
In order to study the dependence of the far-IR luminosity functionon group mass and redshift, it is convenient to fit the measured con-ditional luminosity functions with an analytical function. We usethe same modified Schechter function as in eqn (6), except withΦ,the mean number of galaxies per group perlog10 L, replacingφ,the mean number of galaxies per unit volume perlog10 L, and cor-respondinglyΦ∗ replacingφ∗. Since our measured CLFs mostly donot cover a wide enough range in luminosity to reliably constrainall 4 parameters (α, σ, Φ∗ andL∗) in the fit, we fix the shape pa-rameters at the valuesα = 1.06 andσ = 0.30 which we measurefor the z = 0 − 0.1 field LF, and then fitΦ∗ andL∗ indepen-
dently for each bin in group mass and redshift. The resultingfitsare shown in Fig. 3, where the black curves with error bars showthe direct measurements, while the red curves show the fits. Themeasured CLF for the mass range of1013 − 1013.5 and redshiftrangez = 0.3 − 0.4 has only two data points, so we do not tryto fit this with our analytic function. It can be seen that the func-tional form of eqn (6) provides a good fit to our measured CLFs forall mass and redshift ranges for which we have data. To show thedependence of the CLF on group mass and redshift more clearly,we also repeat the fit from the top left panel (z = 0 − 0.1 andMh = 1012 − 1012.5h−1M⊙) as a grey line in the other panels.This shows that the CLF tends to increase with both group massand redshift. The far-IR multiplicity, measured by the number ofgalaxies withL250 > 1023.5h−2WHz−1 is around unity in theleast massive groups in our sample.
We show the dependence of the CLF parametersL∗ andΦ∗
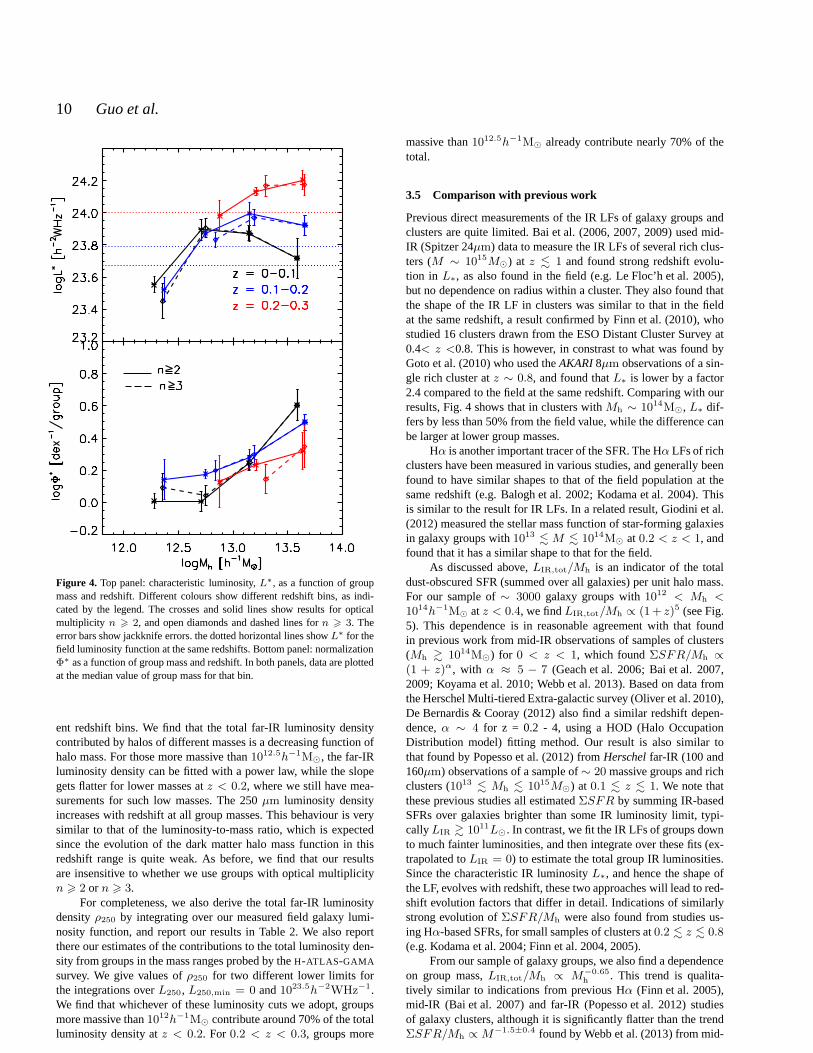
on group mass and redshift in the top and bottom panels of Fig.4.(We omit the results for the redshift binz = 0.3−0.4 from this andthe following plots, since we have only measured the CLF for twobins in group mass for this case.) The solid lines show results forgroup optical multiplicityn > 2 and the dashed lines forn > 3.We see that the results for different multiplicity cuts are generallyconsistent for bothL∗ andΦ∗.
Examining first the dependence ofL∗ on group mass, we seethat forz < 0.2, it increases steeply with group mass at low masses,but then appears to turn over to a gradual decline at high masses,although the large errorbars onL∗ for high masses make it difficultto be certain about the decline. Note that the estimated complete-ness of the group catalogue for the lowest mass range is rather low,∼ 45% and 20% at 0< z <0.1 and 0.1< z <0.2, respectively. Thismight lead to an overestimation of the dependence on group massat these masses. For0.2 < z < 0.3, only groups more massive than∼ 1012.5h−1M⊙ are detected inH-ATLAS-GAMA . For this redshiftrange, the measuredL∗ increases monotonically with group mass,though appearing to flatten at the highest masses.
The redshift evolution ofL∗ thus depends strongly onthe group mass. For the highest masses sampled,Mh ∼
1013.75h−1M⊙ (i.e. clusters),L∗ increases by a factor 2-3 overthe range0.05 < z < 0.35, while for more typical groups,with Mh ∼ 1012.75h−1M⊙, there is almost no evolution for0.05 < z < 0.25.
In the top panel of Fig. 4, we also overplot as horizontal dottedlines the values ofL∗ which we measure for the field LF at the sameredshifts. We see thatL∗ for field galaxies always lies between thevalues in the least and the most massive groups, consistent withthe finding in previous work that mostH-ATLAS galaxies residesin groups of mass comparable to the Milky Way halo (Guo et al.2011b).
In the bottom panel of Fig. 4 we show how the CLF normal-izationΦ∗ varies as a function of group mass at different redshifts.We again see that the redshift evolution depends on group mass.For lower mass groups (Mh ∼ 1012.25 − 1012.75h−1M⊙), Φ∗ in-
Far-IR luminosity function of galaxy groups 7
Figure 2. Group far-IR conditional luminosity function (defined as mean number of galaxies per group) at 250µm as a function of halo mass (left to right)and redshift (top to bottom). The redshift range is indicated in the left panels, and the logarithm of the group halo mass inh−1M⊙ above the top panels. Solidcurves with filled circles show results from the direct method, and dashed curves with empty diamonds from the stacking method. For clarity, errorbars areplotted only for the direct method. The different colours are for groups of different optical multiplicities,n: black for multiplicity n =2, blue forn =3 andred forn > 4. Errorbars which extend down to 0 are indicated with downward arrows.
creases with redshift forz < 0.2, while for the highest masses(Mh ∼ 1013.75h−1M⊙, it appears instead to decrease with in-creasing redshift forz . 0.3, although the large errorbars in thelatter case make it difficult to be certain about the behaviour.
3.4 Far-IR luminosity-to-mass ratio of groups, and thefar-IR luminosity density
A further important physical quantity which we can calculate fromour measured group far-IR CLFs is the total far-IR luminosity-to-mass ratio of groups, since this is related to the dust-obscuredSFR per unit dark halo mass. Previous studies have found thatthe

8 Guo et al.
Figure 3. Far-IR luminosity functions of galaxies in groups. Black curves with error-bars are the direct measurement for opticalmultiplicity n > 2, and redcurves are the analytic fits. The parametersα andσ in eqn (6) are fixed to 1.06 and 0.30 as measured for the field luminosity function atz = 0 − 0.1. Theother two parameters encoding the characteristic luminosity L∗ (in units ofh−2WHz−1) and the amplitude of the luminosity functionsΦ∗ are indicated inthe lower left corner of each panel. The redshift range is indicated in the left panels, and the logarithm of the group halomass inh−1M⊙ above the top panels.The fit in the top left panel is replicated as a grey curve in allthe other panels as a reference.
fraction of star-forming galaxies decreases with group mass (e.g.Dressler 1980; Kimm et al. 2009). However, direct measurementsof SFR per group mass are very rare because the determinationofthe SFR depends greatly on corrections for dust extinction whenusing UV and optical tracers, and also because it is not trivial tomeasure group masses for large samples.
Here we integrate our analytic fits to the group CLFs shown
in Fig. 3 over luminosity to estimate the average total 250µmluminosity L250,tot for groups in each mass and redshift range,and hence obtain the 250µm luminosity-to-mass ratios of groups.Since we have not directly measured the group CLFs atL250 <1023h−2WHz−1, but instead simply assumed the same faint-endslopeα as we measured for the field 250µm LF at z < 0.1, wecalculate the total group luminositiesL250,tot using two different
Far-IR luminosity function of galaxy groups 9
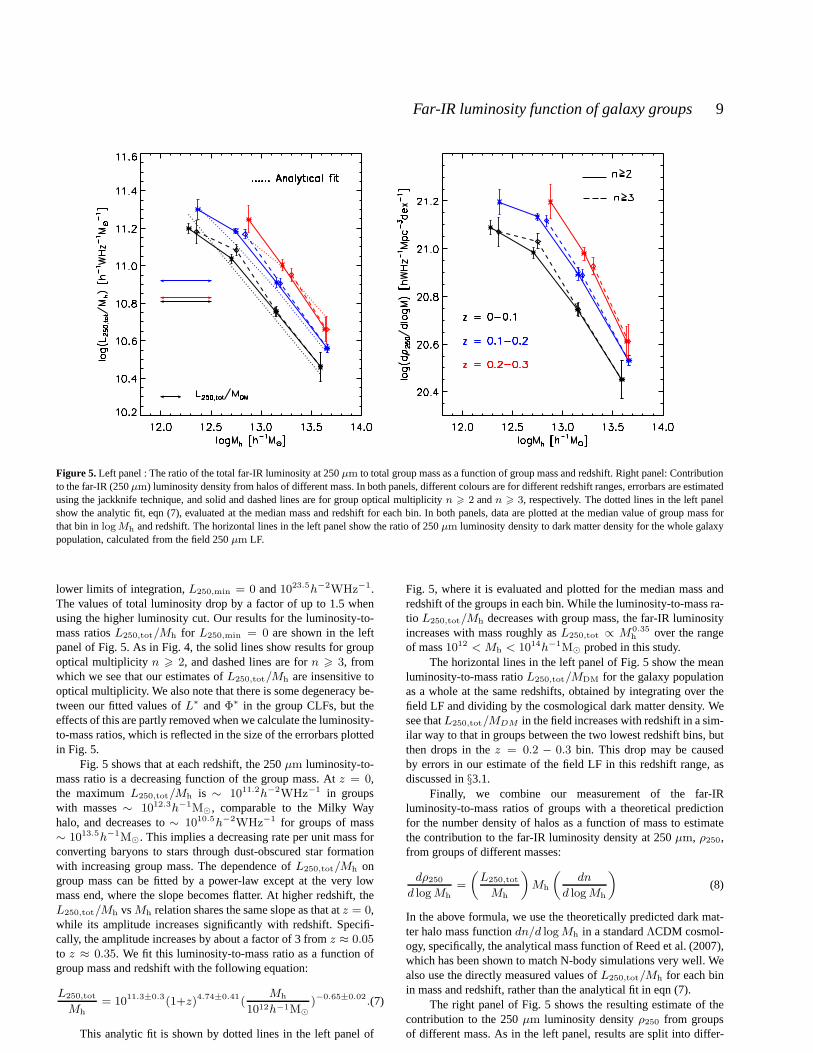
Figure 5.Left panel : The ratio of the total far-IR luminosity at 250µm to total group mass as a function of group mass and redshift. Right panel: Contributionto the far-IR (250µm) luminosity density from halos of different mass. In both panels, different colours are for different redshift ranges,errorbars are estimatedusing the jackknife technique, and solid and dashed lines are for group optical multiplicityn > 2 andn > 3, respectively. The dotted lines in the left panelshow the analytic fit, eqn (7), evaluated at the median mass and redshift for each bin. In both panels, data are plotted at the median value of group mass forthat bin inlogMh and redshift. The horizontal lines in the left panel show theratio of 250µm luminosity density to dark matter density for the whole galaxypopulation, calculated from the field 250µm LF.
lower limits of integration,L250,min = 0 and1023.5h−2WHz−1.The values of total luminosity drop by a factor of up to 1.5 whenusing the higher luminosity cut. Our results for the luminosity-to-mass ratiosL250,tot/Mh for L250,min = 0 are shown in the leftpanel of Fig. 5. As in Fig. 4, the solid lines show results for groupoptical multiplicity n > 2, and dashed lines are forn > 3, fromwhich we see that our estimates ofL250,tot/Mh are insensitive tooptical multiplicity. We also note that there is some degeneracy be-tween our fitted values ofL∗ andΦ∗ in the group CLFs, but theeffects of this are partly removed when we calculate the luminosity-to-mass ratios, which is reflected in the size of the errorbars plottedin Fig. 5.
Fig. 5 shows that at each redshift, the 250µm luminosity-to-mass ratio is a decreasing function of the group mass. Atz = 0,the maximumL250,tot/Mh is ∼ 1011.2h−2WHz−1 in groupswith masses∼ 1012.3h−1M⊙, comparable to the Milky Wayhalo, and decreases to∼ 1010.5h−2WHz−1 for groups of mass∼ 1013.5h−1M⊙. This implies a decreasing rate per unit mass forconverting baryons to stars through dust-obscured star formationwith increasing group mass. The dependence ofL250,tot/Mh ongroup mass can be fitted by a power-law except at the very lowmass end, where the slope becomes flatter. At higher redshift, theL250,tot/Mh vsMh relation shares the same slope as that atz = 0,while its amplitude increases significantly with redshift.Specifi-cally, the amplitude increases by about a factor of 3 fromz ≈ 0.05to z ≈ 0.35. We fit this luminosity-to-mass ratio as a function ofgroup mass and redshift with the following equation:
L250,tot
Mh
= 1011.3±0.3(1+z)4.74±0.41(Mh
1012h−1M⊙
)−0.65±0.02.(7)
This analytic fit is shown by dotted lines in the left panel of
Fig. 5, where it is evaluated and plotted for the median mass andredshift of the groups in each bin. While the luminosity-to-mass ra-tio L250,tot/Mh decreases with group mass, the far-IR luminosityincreases with mass roughly asL250,tot ∝ M0.35
h over the rangeof mass1012 < Mh < 1014h−1M⊙ probed in this study.
The horizontal lines in the left panel of Fig. 5 show the meanluminosity-to-mass ratioL250,tot/MDM for the galaxy populationas a whole at the same redshifts, obtained by integrating over thefield LF and dividing by the cosmological dark matter density. Wesee thatL250,tot/MDM in the field increases with redshift in a sim-ilar way to that in groups between the two lowest redshift bins, butthen drops in thez = 0.2 − 0.3 bin. This drop may be causedby errors in our estimate of the field LF in this redshift range, asdiscussed in§3.1.
Finally, we combine our measurement of the far-IRluminosity-to-mass ratios of groups with a theoretical predictionfor the number density of halos as a function of mass to estimatethe contribution to the far-IR luminosity density at 250µm, ρ250,from groups of different masses:
dρ250d logMh
=
(
L250,tot
Mh
)
Mh
(
dn
d logMh
)
(8)
In the above formula, we use the theoretically predicted dark mat-ter halo mass functiondn/d logMh in a standardΛCDM cosmol-ogy, specifically, the analytical mass function of Reed et al. (2007),which has been shown to match N-body simulations very well. Wealso use the directly measured values ofL250,tot/Mh for each binin mass and redshift, rather than the analytical fit in eqn (7).
The right panel of Fig. 5 shows the resulting estimate of thecontribution to the 250µm luminosity densityρ250 from groupsof different mass. As in the left panel, results are split into differ-
10 Guo et al.
Figure 4. Top panel: characteristic luminosity,L∗, as a function of groupmass and redshift. Different colours show different redshift bins, as indi-cated by the legend. The crosses and solid lines show resultsfor opticalmultiplicity n > 2, and open diamonds and dashed lines forn > 3. Theerror bars show jackknife errors. the dotted horizontal lines showL∗ for thefield luminosity function at the same redshifts. Bottom panel: normalizationΦ∗ as a function of group mass and redshift. In both panels, dataare plottedat the median value of group mass for that bin.
ent redshift bins. We find that the total far-IR luminosity densitycontributed by halos of different masses is a decreasing function ofhalo mass. For those more massive than1012.5h−1M⊙, the far-IRluminosity density can be fitted with a power law, while the slopegets flatter for lower masses atz < 0.2, where we still have mea-surements for such low masses. The 250µm luminosity densityincreases with redshift at all group masses. This behaviouris verysimilar to that of the luminosity-to-mass ratio, which is expectedsince the evolution of the dark matter halo mass function in thisredshift range is quite weak. As before, we find that our resultsare insensitive to whether we use groups with optical multiplicityn > 2 or n > 3.
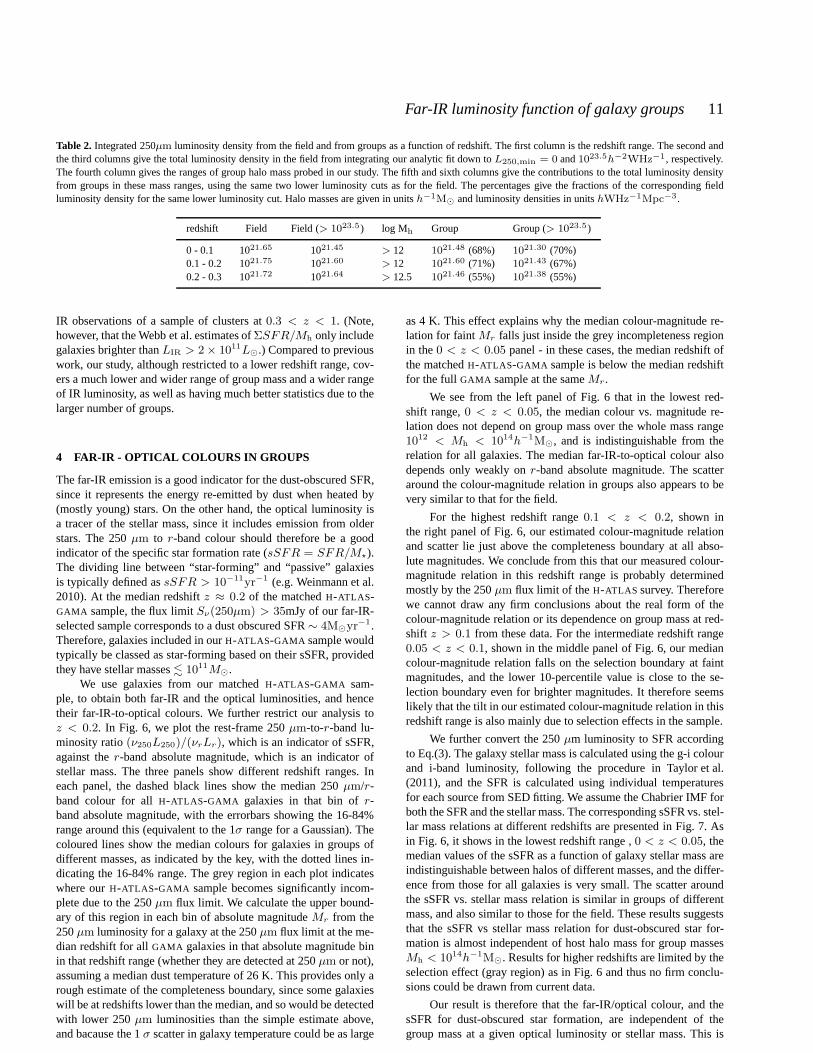
For completeness, we also derive the total far-IR luminositydensityρ250 by integrating over our measured field galaxy lumi-nosity function, and report our results in Table 2. We also reportthere our estimates of the contributions to the total luminosity den-sity from groups in the mass ranges probed by theH-ATLAS-GAMA
survey. We give values ofρ250 for two different lower limits forthe integrations overL250, L250,min = 0 and1023.5h−2WHz−1.We find that whichever of these luminosity cuts we adopt, groupsmore massive than1012h−1M⊙ contribute around 70% of the totalluminosity density atz < 0.2. For 0.2 < z < 0.3, groups more
massive than1012.5h−1M⊙ already contribute nearly 70% of thetotal.
3.5 Comparison with previous work
Previous direct measurements of the IR LFs of galaxy groups andclusters are quite limited. Bai et al. (2006, 2007, 2009) used mid-IR (Spitzer 24µm) data to measure the IR LFs of several rich clus-ters (M ∼ 1015M⊙) at z . 1 and found strong redshift evolu-tion in L∗, as also found in the field (e.g. Le Floc’h et al. 2005),but no dependence on radius within a cluster. They also foundthatthe shape of the IR LF in clusters was similar to that in the fieldat the same redshift, a result confirmed by Finn et al. (2010),whostudied 16 clusters drawn from the ESO Distant Cluster Survey at0.4< z <0.8. This is however, in constrast to what was found byGoto et al. (2010) who used theAKARI8µm observations of a sin-gle rich cluster atz ∼ 0.8, and found thatL∗ is lower by a factor2.4 compared to the field at the same redshift. Comparing withourresults, Fig. 4 shows that in clusters withMh ∼ 1014M⊙, L∗ dif-fers by less than 50% from the field value, while the difference canbe larger at lower group masses.
Hα is another important tracer of the SFR. The Hα LFs of richclusters have been measured in various studies, and generally beenfound to have similar shapes to that of the field population atthesame redshift (e.g. Balogh et al. 2002; Kodama et al. 2004). Thisis similar to the result for IR LFs. In a related result, Giodini et al.(2012) measured the stellar mass function of star-forming galaxiesin galaxy groups with1013 . M . 1014M⊙ at 0.2 < z < 1, andfound that it has a similar shape to that for the field.
As discussed above,LIR,tot/Mh is an indicator of the totaldust-obscured SFR (summed over all galaxies) per unit halo mass.For our sample of∼ 3000 galaxy groups with1012 < Mh <1014h−1M⊙ atz < 0.4, we findLIR,tot/Mh ∝ (1+ z)5 (see Fig.5). This dependence is in reasonable agreement with that foundin previous work from mid-IR observations of samples of clusters(Mh & 1014M⊙) for 0 < z < 1, which foundΣSFR/Mh ∝
(1 + z)α, with α ≈ 5 − 7 (Geach et al. 2006; Bai et al. 2007,2009; Koyama et al. 2010; Webb et al. 2013). Based on data fromthe Herschel Multi-tiered Extra-galactic survey (Oliver et al. 2010),De Bernardis & Cooray (2012) also find a similar redshift depen-dence,α ∼ 4 for z = 0.2 - 4, using a HOD (Halo OccupationDistribution model) fitting method. Our result is also similar tothat found by Popesso et al. (2012) fromHerschelfar-IR (100 and160µm) observations of a sample of∼ 20 massive groups and richclusters (1013 . Mh . 1015M⊙) at 0.1 . z . 1. We note thatthese previous studies all estimatedΣSFR by summing IR-basedSFRs over galaxies brighter than some IR luminosity limit, typi-callyLIR & 1011L⊙. In contrast, we fit the IR LFs of groups downto much fainter luminosities, and then integrate over thesefits (ex-trapolated toLIR = 0) to estimate the total group IR luminosities.Since the characteristic IR luminosityL∗, and hence the shape ofthe LF, evolves with redshift, these two approaches will lead to red-shift evolution factors that differ in detail. Indicationsof similarlystrong evolution ofΣSFR/Mh were also found from studies us-ing Hα-based SFRs, for small samples of clusters at0.2 . z . 0.8(e.g. Kodama et al. 2004; Finn et al. 2004, 2005).
From our sample of galaxy groups, we also find a dependenceon group mass,LIR,tot/Mh ∝ M−0.65
h . This trend is qualita-tively similar to indications from previous Hα (Finn et al. 2005),mid-IR (Bai et al. 2007) and far-IR (Popesso et al. 2012) studiesof galaxy clusters, although it is significantly flatter thanthe trendΣSFR/Mh ∝ M−1.5±0.4 found by Webb et al. (2013) from mid-
Far-IR luminosity function of galaxy groups 11
Table 2. Integrated 250µm luminosity density from the field and from groups as a function of redshift. The first column is the redshift range. The second andthe third columns give the total luminosity density in the field from integrating our analytic fit down toL250,min = 0 and1023.5h−2WHz−1, respectively.The fourth column gives the ranges of group halo mass probed in our study. The fifth and sixth columns give the contributions to the total luminosity densityfrom groups in these mass ranges, using the same two lower luminosity cuts as for the field. The percentages give the fractions of the corresponding fieldluminosity density for the same lower luminosity cut. Halo masses are given in unitsh−1M⊙ and luminosity densities in unitshWHz−1Mpc−3.
redshift Field Field (> 1023.5) log Mh Group Group (> 1023.5)
0 - 0.1 1021.65 1021.45 > 12 1021.48 (68%) 1021.30 (70%)0.1 - 0.2 1021.75 1021.60 > 12 1021.60 (71%) 1021.43 (67%)0.2 - 0.3 1021.72 1021.64 > 12.5 1021.46 (55%) 1021.38 (55%)
IR observations of a sample of clusters at0.3 < z < 1. (Note,however, that the Webb et al. estimates ofΣSFR/Mh only includegalaxies brighter thanLIR > 2× 10¹¹L⊙.) Compared to previouswork, our study, although restricted to a lower redshift range, cov-ers a much lower and wider range of group mass and a wider rangeof IR luminosity, as well as having much better statistics due to thelarger number of groups.
4 FAR-IR - OPTICAL COLOURS IN GROUPS
The far-IR emission is a good indicator for the dust-obscured SFR,since it represents the energy re-emitted by dust when heated by(mostly young) stars. On the other hand, the optical luminosity isa tracer of the stellar mass, since it includes emission fromolderstars. The 250µm to r-band colour should therefore be a goodindicator of the specific star formation rate (sSFR = SFR/M⋆).The dividing line between “star-forming” and “passive” galaxiesis typically defined assSFR > 10−11yr−1 (e.g. Weinmann et al.2010). At the median redshiftz ≈ 0.2 of the matchedH-ATLAS-GAMA sample, the flux limitSν(250µm) > 35mJy of our far-IR-selected sample corresponds to a dust obscured SFR∼ 4M⊙yr−1.Therefore, galaxies included in ourH-ATLAS-GAMA sample wouldtypically be classed as star-forming based on their sSFR, providedthey have stellar masses. 1011M⊙.
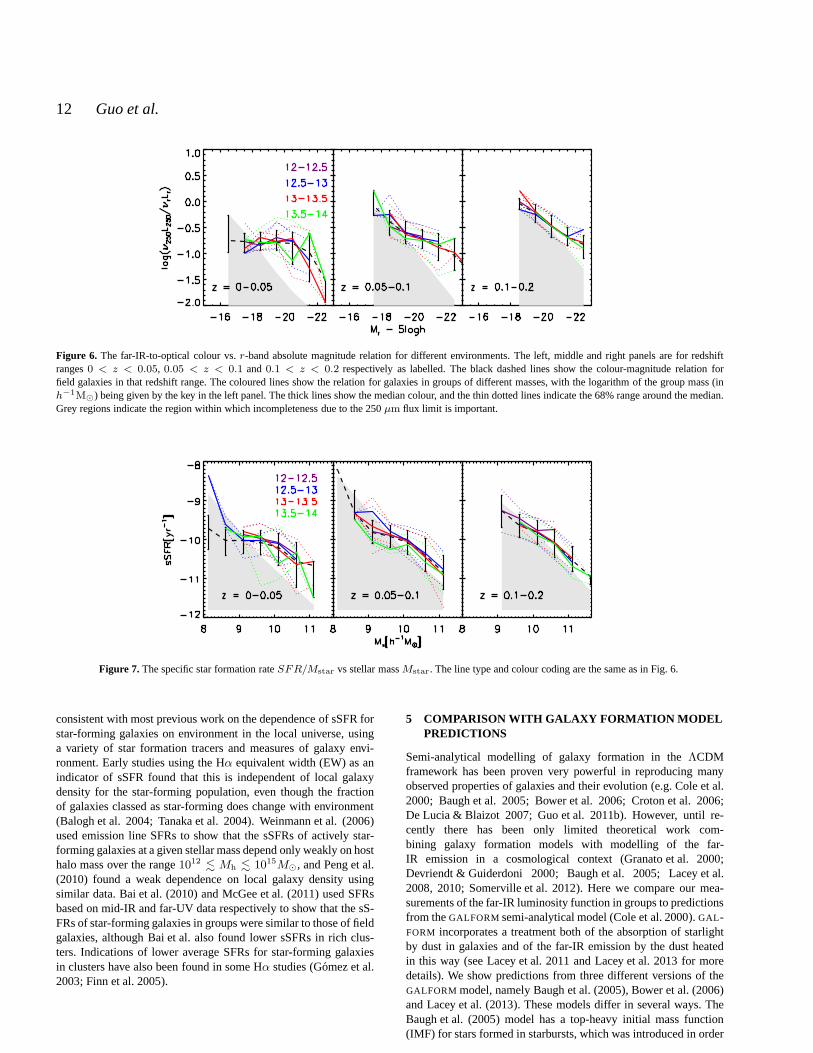
We use galaxies from our matchedH-ATLAS-GAMA sam-ple, to obtain both far-IR and the optical luminosities, andhencetheir far-IR-to-optical colours. We further restrict our analysis toz < 0.2. In Fig. 6, we plot the rest-frame 250µm-to-r-band lu-minosity ratio(ν250L250)/(νrLr), which is an indicator of sSFR,against ther-band absolute magnitude, which is an indicator ofstellar mass. The three panels show different redshift ranges. Ineach panel, the dashed black lines show the median 250µm/r-band colour for allH-ATLAS-GAMA galaxies in that bin ofr-band absolute magnitude, with the errorbars showing the 16-84%range around this (equivalent to the 1σ range for a Gaussian). Thecoloured lines show the median colours for galaxies in groups ofdifferent masses, as indicated by the key, with the dotted lines in-dicating the 16-84% range. The grey region in each plot indicateswhere ourH-ATLAS-GAMA sample becomes significantly incom-plete due to the 250µm flux limit. We calculate the upper bound-ary of this region in each bin of absolute magnitudeMr from the250µm luminosity for a galaxy at the 250µm flux limit at the me-dian redshift for allGAMA galaxies in that absolute magnitude binin that redshift range (whether they are detected at 250µm or not),assuming a median dust temperature of 26 K. This provides only arough estimate of the completeness boundary, since some galaxieswill be at redshifts lower than the median, and so would be detectedwith lower 250µm luminosities than the simple estimate above,and bacause the 1σ scatter in galaxy temperature could be as large
as 4 K. This effect explains why the median colour-magnitudere-lation for faintMr falls just inside the grey incompleteness regionin the0 < z < 0.05 panel - in these cases, the median redshift ofthe matchedH-ATLAS-GAMA sample is below the median redshiftfor the full GAMA sample at the sameMr.
We see from the left panel of Fig. 6 that in the lowest red-shift range,0 < z < 0.05, the median colour vs. magnitude re-lation does not depend on group mass over the whole mass range1012 < Mh < 1014h−1M⊙, and is indistinguishable from therelation for all galaxies. The median far-IR-to-optical colour alsodepends only weakly onr-band absolute magnitude. The scatteraround the colour-magnitude relation in groups also appears to bevery similar to that for the field.
For the highest redshift range0.1 < z < 0.2, shown inthe right panel of Fig. 6, our estimated colour-magnitude relationand scatter lie just above the completeness boundary at all abso-lute magnitudes. We conclude from this that our measured colour-magnitude relation in this redshift range is probably determinedmostly by the 250µm flux limit of the H-ATLAS survey. Thereforewe cannot draw any firm conclusions about the real form of thecolour-magnitude relation or its dependence on group mass at red-shift z > 0.1 from these data. For the intermediate redshift range0.05 < z < 0.1, shown in the middle panel of Fig. 6, our mediancolour-magnitude relation falls on the selection boundaryat faintmagnitudes, and the lower 10-percentile value is close to the se-lection boundary even for brighter magnitudes. It therefore seemslikely that the tilt in our estimated colour-magnitude relation in thisredshift range is also mainly due to selection effects in thesample.
We further convert the 250µm luminosity to SFR accordingto Eq.(3). The galaxy stellar mass is calculated using the g-i colourand i-band luminosity, following the procedure in Taylor etal.(2011), and the SFR is calculated using individual temperaturesfor each source from SED fitting. We assume the Chabrier IMF forboth the SFR and the stellar mass. The corresponding sSFR vs.stel-lar mass relations at different redshifts are presented in Fig. 7. Asin Fig. 6, it shows in the lowest redshift range ,0 < z < 0.05, themedian values of the sSFR as a function of galaxy stellar massareindistinguishable between halos of different masses, and the differ-ence from those for all galaxies is very small. The scatter aroundthe sSFR vs. stellar mass relation is similar in groups of differentmass, and also similar to those for the field. These results suggeststhat the sSFR vs stellar mass relation for dust-obscured star for-mation is almost independent of host halo mass for group massesMh < 1014h−1M⊙. Results for higher redshifts are limited by theselection effect (gray region) as in Fig. 6 and thus no firm conclu-sions could be drawn from current data.
Our result is therefore that the far-IR/optical colour, andthesSFR for dust-obscured star formation, are independent of thegroup mass at a given optical luminosity or stellar mass. This is
12 Guo et al.
Figure 6. The far-IR-to-optical colour vs.r-band absolute magnitude relation for different environments. The left, middle and right panels are for redshiftranges0 < z < 0.05, 0.05 < z < 0.1 and0.1 < z < 0.2 respectively as labelled. The black dashed lines show the colour-magnitude relation forfield galaxies in that redshift range. The coloured lines show the relation for galaxies in groups of different masses, with the logarithm of the group mass (inh−1M⊙) being given by the key in the left panel. The thick lines showthe median colour, and the thin dotted lines indicate the 68%range around the median.Grey regions indicate the region within which incompleteness due to the 250µm flux limit is important.
Figure 7. The specific star formation rateSFR/Mstar vs stellar massMstar. The line type and colour coding are the same as in Fig. 6.
consistent with most previous work on the dependence of sSFRforstar-forming galaxies on environment in the local universe, usinga variety of star formation tracers and measures of galaxy envi-ronment. Early studies using the Hα equivalent width (EW) as anindicator of sSFR found that this is independent of local galaxydensity for the star-forming population, even though the fractionof galaxies classed as star-forming does change with environment(Balogh et al. 2004; Tanaka et al. 2004). Weinmann et al. (2006)used emission line SFRs to show that the sSFRs of actively star-forming galaxies at a given stellar mass depend only weakly on hosthalo mass over the range1012 . Mh . 1015M⊙, and Peng et al.(2010) found a weak dependence on local galaxy density usingsimilar data. Bai et al. (2010) and McGee et al. (2011) used SFRsbased on mid-IR and far-UV data respectively to show that thesS-FRs of star-forming galaxies in groups were similar to thoseof fieldgalaxies, although Bai et al. also found lower sSFRs in rich clus-ters. Indications of lower average SFRs for star-forming galaxiesin clusters have also been found in some Hα studies (Gomez et al.2003; Finn et al. 2005).
5 COMPARISON WITH GALAXY FORMATION MODELPREDICTIONS
Semi-analytical modelling of galaxy formation in theΛCDMframework has been proven very powerful in reproducing manyobserved properties of galaxies and their evolution (e.g. Cole et al.2000; Baugh et al. 2005; Bower et al. 2006; Croton et al. 2006;De Lucia & Blaizot 2007; Guo et al. 2011b). However, until re-cently there has been only limited theoretical work com-bining galaxy formation models with modelling of the far-IR emission in a cosmological context (Granato et al. 2000;Devriendt & Guiderdoni 2000; Baugh et al. 2005; Lacey et al.2008, 2010; Somerville et al. 2012). Here we compare our mea-surements of the far-IR luminosity function in groups to predictionsfrom theGALFORM semi-analytical model (Cole et al. 2000).GAL -FORM incorporates a treatment both of the absorption of starlightby dust in galaxies and of the far-IR emission by the dust heatedin this way (see Lacey et al. 2011 and Lacey et al. 2013 for moredetails). We show predictions from three different versions of theGALFORM model, namely Baugh et al. (2005), Bower et al. (2006)and Lacey et al. (2013). These models differ in several ways.TheBaugh et al. (2005) model has a top-heavy initial mass function(IMF) for stars formed in starbursts, which was introduced in order
Far-IR luminosity function of galaxy groups 13
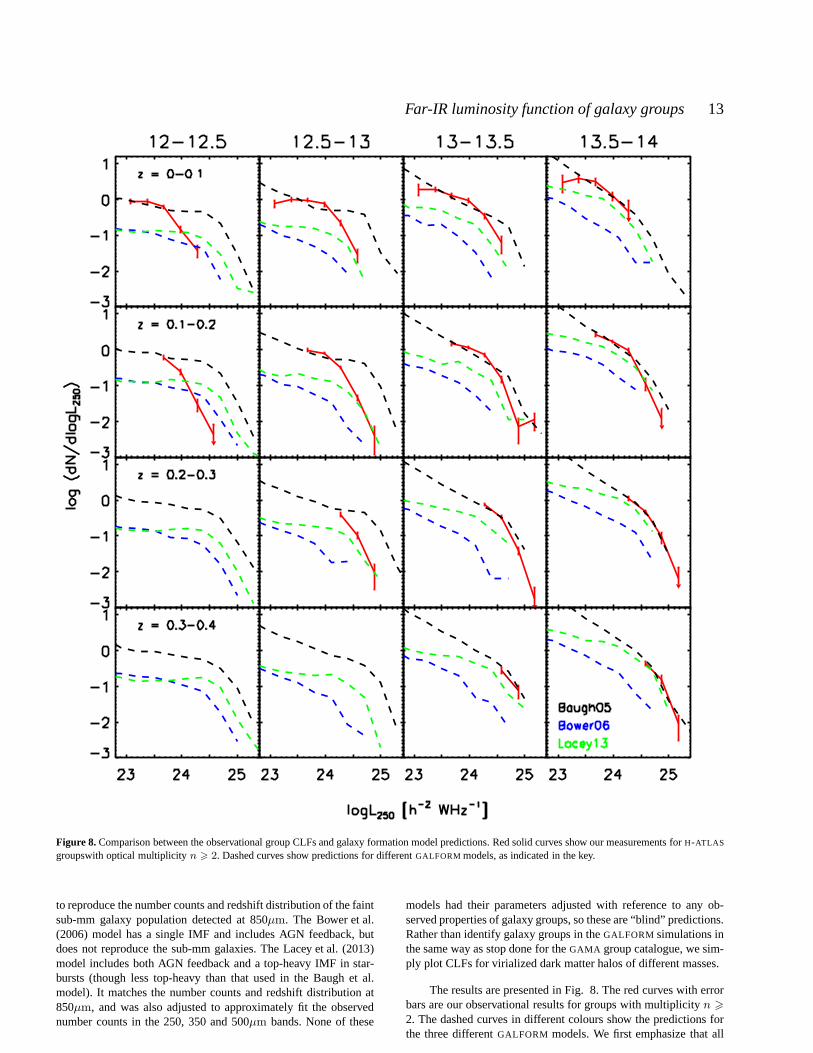
Figure 8. Comparison between the observational group CLFs and galaxyformation model predictions. Red solid curves show our measurements forH-ATLAS
groupswith optical multiplicityn > 2. Dashed curves show predictions for differentGALFORM models, as indicated in the key.
to reproduce the number counts and redshift distribution ofthe faintsub-mm galaxy population detected at 850µm. The Bower et al.(2006) model has a single IMF and includes AGN feedback, butdoes not reproduce the sub-mm galaxies. The Lacey et al. (2013)model includes both AGN feedback and a top-heavy IMF in star-bursts (though less top-heavy than that used in the Baugh et al.model). It matches the number counts and redshift distribution at850µm, and was also adjusted to approximately fit the observednumber counts in the 250, 350 and 500µm bands. None of these
models had their parameters adjusted with reference to any ob-served properties of galaxy groups, so these are “blind” predictions.Rather than identify galaxy groups in theGALFORM simulations inthe same way as stop done for theGAMA group catalogue, we sim-ply plot CLFs for virialized dark matter halos of different masses.
The results are presented in Fig. 8. The red curves with errorbars are our observational results for groups with multiplicity n >
2. The dashed curves in different colours show the predictions forthe three differentGALFORM models. We first emphasize that all
14 Guo et al.
the models predict that the amplitude of the CLF (i.e. the numberof galaxies per group) increases with group mass and with redshift,in qualitative agreement with our observational measurements. Ingeneral, the predictions from the Baugh et al. (2005) model are inbest agreement with our measured far-IR CLFs, though this modelstill predicts too many galaxies with high far-IR luminosities inlower-mass groups. The Bower et al. (2006) model underestimatesthe abundance of far-IR galaxies over the whole range of groupmass and redshift studied here, generally by a large factor.The pre-dictions of the Lacey et al. (2013) model lie between those oftheother two models. None of the models reproduces the trend of char-acteristic far-IR luminosity strongly increasing with halo mass thatwe see in the observations. We conclude that observations ofthefar-IR CLFs of groups can put stringent new constraints on galaxyformation models, which are complementary to the standard obser-vational constraints (such as from galaxy luminosity functions) thatare typically used. In particular, the far-IR CLFs of groupstightlyconstrain how star formation in galaxies depends on the hosthalomass, which in turn puts constraints on physical processes in galaxyformation models such as gas cooling, stripping and feedback fromsupernovae and AGN. We plan to explore these constraints in moredetail in a future paper.
6 DISCUSSION AND CONCLUSIONS
Observations at far-IR wavelengths are an essential complement tothe traditional UV and optical tracers of star formation. Wehavecombined far-IR data from theH-ATLAS survey with the galaxygroup catalogue from theGAMA optical spectroscopic survey tostudy the far-IR luminosity functions of galaxies in different groupenvironments and at different redshifts. We use a sample of 10.5kgalaxies from theH-ATLAS survey, flux limited at 250µm withS(250) > 32 mJy, and matched tor-band selected galaxies withr < 19.4 in the GAMA spectroscopic survey, together with a cat-alogue of 10.7kGAMA groups in the same region. We have usedtwo independent methods to estimate the conditional far-IRlumi-nosity functions of groups. One is to directly identify the groupmembership of each far-IR source by matching to its optical coun-terpart. The other is to count the average excess number of far-IR galaxies within the optically-estimated radius of each group.The measured far-IR luminosity functions as a function of groupmass and redshift are consistent between these two methods,butthe results from the direct method are less noisy, so we use thedirect method for most of our analysis. We find that the far-IRlu-minosity functions are insensitive to the group optical multiplic-ity for a given group mass and redshift. We have measured aver-age far-IR luminosity functions in bins of mass and redshiftovera range of1012 < Mh < 1014h−1M⊙ in group mass and arange of0 < z < 0.4 in redshift, probing galaxy IR luminositiesLIR > 2× 10⁹h−2L⊙.
We find that the far-IR luminosity functions of groups are wellfitted by a modified Schechter function, as previously found forthe field population. We find that the characteristic far-IR luminos-ity L∗ of galaxies in groups increases with the group mass below1013h−1M⊙, while at higher masses it flattens or turns over. Theredshift dependence ofL∗ is a strong function of group mass. Forvery massive systems,L∗ at z ∼ 0.3 is 2.5 times larger than atz ∼ 0, while this difference between high and low redshifts nearlyvanishes for group masses below1012.5h−1M⊙. By integratingover the far-IR luminosity function of galaxies in groups, we calcu-late the ratioLIR/Mh of total IR luminosity to group mass. We find
that this ratio is a decreasing function of group mass and an increas-ing function of redshift, being fit byLIR/Mh ∝ M−0.65
h (1 + z)5.We estimate that forz < 0.2, around 70% of the total far-IR lu-minosity density is contributed by galaxies in halos more massivethan1012h−1M⊙.
We also use ourH-ATLAS/GAMA galaxy sample to mea-sure the relation between far-IR/r-band colour andr-band abso-lute magnitude in the field and in groups of different mass. Forz < 0.05, we find that for far-IR detected galaxies this relation isindependent of group mass over the whole range1012 < Mh <1014h−1M⊙, and the same as that in the field. Similarly, we findthe average derived sSFR has only a weak dependence on galaxystellar mass, and the sSFR vs. stellar mass relation is indistinguish-able in different environments. Again, this result appliesto galaxiesin our sample with detectable far-IR emission. This result is con-sistent with most previous studies of the dependence of starforma-tion rates of actively star-forming galaxies on environment usingUV and optical tracers (e.g. Balogh et al. 2004; Tanaka et al.2004;Weinmann et al. 2006; Peng et al. 2010; McGee et al. 2011). Forz > 0.05 we find that no firm conclusions can be drawn about thefar-IR/optical colour-magnitude relation from this sample, due tothe far-IR flux limit.
We compared our results on the far-IR luminosity functionsof groups to three different semi-analytical galaxy formation mod-els which have already proven successful in producing many othergalaxy properties both at high and low redshifts. All these mod-els qualitatively reproduced the trend of the characteristic far-IRluminosityL∗ increasing with group mass and redshift. However,none of them were able to reproduce the observed conditionalfar-IR luminosity functions in detail. This impli es some deficiency inthe way physical processes such as gas cooling, star formation andfeedback are calculated in current galaxy formation models, butalso demonstrates the potential for using such observations to dis-tinguish between different models. Our comparison with themod-els assumed that the galaxy groups identified in theGAMA surveycorrespond closely in both galaxy membership and total masstothe dark matter halos in the theoretical galaxy formation models.In future work, we plan to test these assumptions by constructingmock galaxy catalogues from the models and applying the samealgorithms for identifying groups and measuring their far-IR lumi-nosity functions as for the observations.
The analysis in this paper is based entirely on far-IR lumi-nosities, which trace the dust-obscured component of galaxy SFRs,while the unobscured component of galaxy SFRs is traced by theirfar-UV luminosities. Most of the area covered byH-ATLAS Pha-seI andGAMA surveys also has far-UV imaging fromGALEX. In afuture paper, we plan to combine the far-IR and far-UV data fromH-ATLAS andGAMA to estimate total galaxy SFRs free from biasesdue to dust obscuration, and use these to study their dependence onenvironment and redshift, in a similar way as done here for the far-IR luminosities.
ACKNOWLEDGMENTS
The authors thank Michal Michalowski and Jochen Liske for usefulcomments. Qi Guo acknowledges support from a Newton Interna-tional Fellowship. Peder Norberg acknowledges support from a Eu-ropean Research Council Fellowship. CSF acknowledges a RoyalSociety Wolfson Research Grant Award. This work was supportedin part by the Science and Technology Facilities Council rollinggrant ST/I001166/1 to the ICC. Calculations were partly performed

Far-IR luminosity function of galaxy groups 15
on the ICC Cosmology Machine, which is part of the DiRAC Fa-cility jointly funded by STFC and Durham University.
The Herschel-ATLAS is a project with Herschel, which isan ESA space observatory with science instruments providedby European-led Principal Investigator consortia and withim-portant participation from NASA. The H-ATLAS website ishttp://www.h-atlas.org/
GAMA is a joint European-Australian project based arounda spectroscopic campaign using the Anglo- Australian Telescope.The GAMA input catalogue is based on data taken from theSloan Digital Sky Survey and the UKIRT Infrared Deep Sky Sur-vey. Complementary imaging of the GAMA regions is being ob-tained by a number of independent survey programs includingGALEX MIS, VST KiDS, VISTA VIKING, WISE, Herschel-ATLAS, GMRT and ASKAP providing UV to radio coverage.GAMA is funded by the STFC (UK), the ARC (Australia), theAAO, and the participating institutions. The GAMA website is:http://www.gama-survey.org/
The HATLAS-ATLAS and GAMA data will become public inthe future. Details can be found on their websites. For more infor-mation about the model galaxy catalogues please contact thecorre-sponding authors.
REFERENCES
Avni Y., Bahcall J. N., 1980, ApJ, 235, 694Bai L. et al., 2007, ApJ, 664, 181Bai L., Rasmussen J., Mulchaey J. S., Dariush A., Raychaudhury
S., Ponman T. J., 2010, ApJ, 713, 637Bai L., Rieke G. H., Rieke M. J., Christlein D., Zabludoff A. I.,
2009, ApJ, 693, 1840Bai L., Rieke G. H., Rieke M. J., Hinz J. L., Kelly D. M., Blaylock
M., 2006, ApJ, 639, 827Baldry I. K. et al., 2010, MNRAS, 404, 86Balogh M. et al., 2004, MNRAS, 348, 1355Balogh M. L., Couch W. J., Smail I., Bower R. G., Glazebrook K.,
2002, MNRAS, 335, 10Baugh C. M., Lacey C. G., Frenk C. S., Granato G. L., Silva L.,
Bressan A., Benson A. J., Cole S., 2005, MNRAS, 356, 1191Berlind A. A., Weinberg D. H., 2002, ApJ, 575, 587Biviano A., Fadda D., Durret F., Edwards L. O. V., Marleau F.,
2011, A&A, 532, A77Bower R. G., Benson A. J., Malbon R., Helly J. C., Frenk C. S.,
Baugh C. M., Cole S., Lacey C. G., 2006, MNRAS, 370, 645Brinchmann J., Charlot S., White S. D. M., Tremonti C., Kauff-
mann G., Heckman T., Brinkmann J., 2004, MNRAS, 351,1151
Buat V. et al., 2007, ApJS, 173, 404Butcher H., Oemler, Jr. A., 1978, ApJ, 219, 18Chabrier G., 2003, PASP, 115, 763Chung S. M., Gonzalez A. H., Clowe D., Markevitch M., Zaritsky
D., 2010, ApJ, 725, 1536Cole S., Lacey C. G., Baugh C. M., Frenk C. S., 2000, MNRAS,
319, 168Croton D. J. et al., 2006, MNRAS, 365, 11De Bernardis F., Cooray A., 2012, ApJ, 760, 14De Lucia G., Blaizot J., 2007, MNRAS, 375, 2Devriendt J. E. G., Guiderdoni B., 2000, A&A, 363, 851Dressler A., 1980, ApJ, 236, 351Driver S. P. et al., 2011, MNRAS, 413, 971Driver S. P. et al., 2009, Astronomy and Geophysics, 50, 050000
Dunne L., Eales S. A., 2001, MNRAS, 327, 697Dunne L. et al., 2011, MNRAS, 417, 1510Dye S. et al., 2010, A&A, 518, L10Eales S. et al., 2010a, PASP, 122, 499Eales S. A. et al., 2010b, A&A, 518, L23Elbaz D. et al., 2007, A&A, 468, 33Felten J. E., 1976, ApJ, 207, 700Finn R. A. et al., 2010, ApJ, 720, 87Finn R. A., Zaritsky D., McCarthy, Jr. D. W., 2004, ApJ, 604, 141Finn R. A. et al., 2005, ApJ, 630, 206Gallego J., Zamorano J., Aragon-Salamanca A., Rego M., 1995,
ApJ, 455, L1Geach J. E. et al., 2006, ApJ, 649, 661Giodini S. et al., 2012, A&A, 538, A104Gomez P. L. et al., 2003, ApJ, 584, 210Goto T. et al., 2010, A&A, 514, A7Granato G. L., Lacey C. G., Silva L., Bressan A., Baugh C. M.,
Cole S., Frenk C. S., 2000, ApJ, 542, 710Griffin M. J. et al., 2010, A&A, 518, L3Guo Q. et al., 2011a, MNRAS, 412, 2277Guo Q. et al., 2011b, MNRAS, 413, 101Guo Q., White S. D. M., 2008, MNRAS, 384, 2Han et al, 2013, in prepHauser M. G. et al., 1998, ApJ, 508, 25Hill D. T. et al., 2011, MNRAS, 412, 765Hopkins A. M., 2007, in Astronomical Society of the Pacific
Conference Series, Vol. 380, Deepest Astronomical Surveys,Afonso J., Ferguson H. C., Mobasher B., Norris R., eds., p.423
Ideue Y. et al., 2012, ApJ, 747, 42Jing Y. P., Mo H. J., Boerner G., 1998, ApJ, 494, 1Kelvin L. S. et al., 2012, MNRAS, 421, 1007Kennicutt, Jr. R. C., 1998, ARA&A, 36, 189Kimm T. et al., 2009, MNRAS, 394, 1131Kodama T., Balogh M. L., Smail I., Bower R. G., Nakata F., 2004,
MNRAS, 354, 1103Koyama Y., Kodama T., Shimasaku K., Hayashi M., Okamura S.,
Tanaka I., Tokoku C., 2010, MNRAS, 403, 1611Koyama Y. et al., 2008, MNRAS, 391, 1758Lacey C. G., Baugh C. M., Frenk C. S., Benson A. J., 2011, MN-
RAS, 412, 1828Lacey C. G., Baugh C. M., Frenk C. S., Benson A. J., Bower R. G.,
Cole S. M., 2013. In preparationLacey C. G., Baugh C. M., Frenk C. S., Benson A. J., Orsi A., Silva
L., Granato G. L., Bressan A., 2010, MNRAS, 405, 2Lacey C. G., Baugh C. M., Frenk C. S., Silva L., Granato G. L.,
Bressan A., 2008, MNRAS, 385, 1155Le Floc’h E. et al., 2005, ApJ, 632, 169Lewis I. et al., 2002, MNRAS, 334, 673Lilly S. J., Le Fevre O., Hammer F., Crampton D., 1996, ApJ, 460,
L1Loveday J. et al., 2012, MNRAS, 420, 1239Madau P., della Valle M., Panagia N., 1998, MNRAS, 297, L17McGee S. L., Balogh M. L., Wilman D. J., Bower R. G., Mulchaey
J. S., Parker L. C., Oemler A., 2011, MNRAS, 413, 996Merson A. I. et al., 2013, MNRAS, 429, 556Metcalfe L., Fadda D., Biviano A., 2005, Space Sci. Rev., 119, 425Oliver S. J. et al., 2010, A&A, 518, L21Parry O. H., Eke V. R., Frenk C. S., 2009, MNRAS, 396, 1972Peng Y.-j. et al., 2010, ApJ, 721, 193Pilbratt G. L. et al., 2010, A&A, 518, L1Poglitsch A. et al., 2010, A&A, 518, L2

16 Guo et al.
Popesso P. et al., 2012, A&A, 537, A58Puget J.-L., Abergel A., Bernard J.-P., Boulanger F., Burton W. B.,
Desert F.-X., Hartmann D., 1996, A&A, 308, L5Reed D. S., Bower R., Frenk C. S., Jenkins A., Theuns T., 2007,
MNRAS, 374, 2Rigby E. E. et al., 2011, MNRAS, 415, 2336Robotham A. et al., 2010, PASA, 27, 76Robotham A. S. G., Norberg P., Driver S. P., Baldry I. K., Bamford
S. P., Hopkins A. M., Liske J., et al., 2011, MNRAS, 416,2640
Salim S. et al., 2007, ApJS, 173, 267Saunders W., Rowan-Robinson M., Lawrence A., Efstathiou G.,
Kaiser N., Ellis R. S., Frenk C. S., 1990, MNRAS, 242, 318Smith D. J. B. et al., 2011, MNRAS, 416, 857Sobral D., Best P. N., Smail I., Geach J. E., Cirasuolo M., Garn T.,
Dalton G. B., 2011, MNRAS, 411, 675Somerville R. S., Gilmore R. C., Primack J. R., Domınguez A.,
2012, MNRAS, 423, 1992Springel V. et al., 2005, Nature, 435, 629Steidel C. C., Adelberger K. L., Giavalisco M., Dickinson M., Pet-
tini M., 1999, ApJ, 519, 1Tanaka M., Goto T., Okamura S., Shimasaku K., Brinkmann J.,
2004, AJ, 128, 2677Taylor E. N. et al., 2011, MNRAS, 418, 1587Tran K.-V. H., Saintonge A., Moustakas J., Bai L., Gonzalez A. H.,
Holden B. P., Zaritsky D., Kautsch S. J., 2009, ApJ, 705, 809Webb T. et al., 2013, ArXiv 1304.3335Weinmann S. M., Kauffmann G., von der Linden A., De Lucia G.,
2010, MNRAS, 406, 2249Weinmann S. M., van den Bosch F. C., Yang X., Mo H. J., 2006,
MNRAS, 366, 2Welikala N., Connolly A. J., Hopkins A. M., Scranton R., Conti A.,
2008, ApJ, 677, 970Yang X., Mo H. J., van den Bosch F. C., 2003, MNRAS, 339, 1057
APPENDIX A: GROUP CLFS WITH THE STACKINGMETHOD
In this Appendix we give a few more details about the stackingmethod and the results obtained using it.
Our stacking method for measuring the CLF in groups in-volves subtracting the estimated local background densityof galax-ies from the total projected counts, which means that our resultsmight be affected by how we measure this background. We estimatethe local background density within an annulus around each group.If we make the radius of this annulus too small, then our back-ground estimate may include galaxies associated with the groupdue to clustering, causing us to overestimate the background andso underestimate the CLF of group members. On the other hand,if we make the annulus too large, we may fail to properly subtractthe effect of foreground or background structures, again causing anerror in the measured CLF. Here we test the effect on the measuredCLFs of varying the inner and outer radii of the annuli, wheretheseare taken to be fixed multiples of the group radiusR100. The resultsare shown in Fig. A1, split by group mass and redshift, with radiusrange of the annulus in units of R100 for each coloured line shownby the key in the bottom left panel. This figure shows that our mea-sured CLFs are not very sensitive to the choice of annulus forthebackground subtraction.
In Fig. A2 we show the group CLFs measured using the stack-ing method (in black). These CLFs are noisier than those measured
using the direct method (shown in Fig. 3). We also show the an-alytic fits using eqn (6) to the measured CLFs from the stackingmethod (in red) and from the direct method (in blue). It can beseenthat the fits from the stacking method agree reasonably well withthose from the direct method in all group mass and redshift ranges.

Far-IR luminosity function of galaxy groups 17
Figure A1. Conditional far-IR luminosity functions of galaxy groups measured with the stacking method for different choices of local background subtraction.The background number density around each group is estimated in an annulus. The different choices for the outer inner radii of these annuli in units of thegroup radiusR100 are indicated in the bottom left panel (see text for details.)
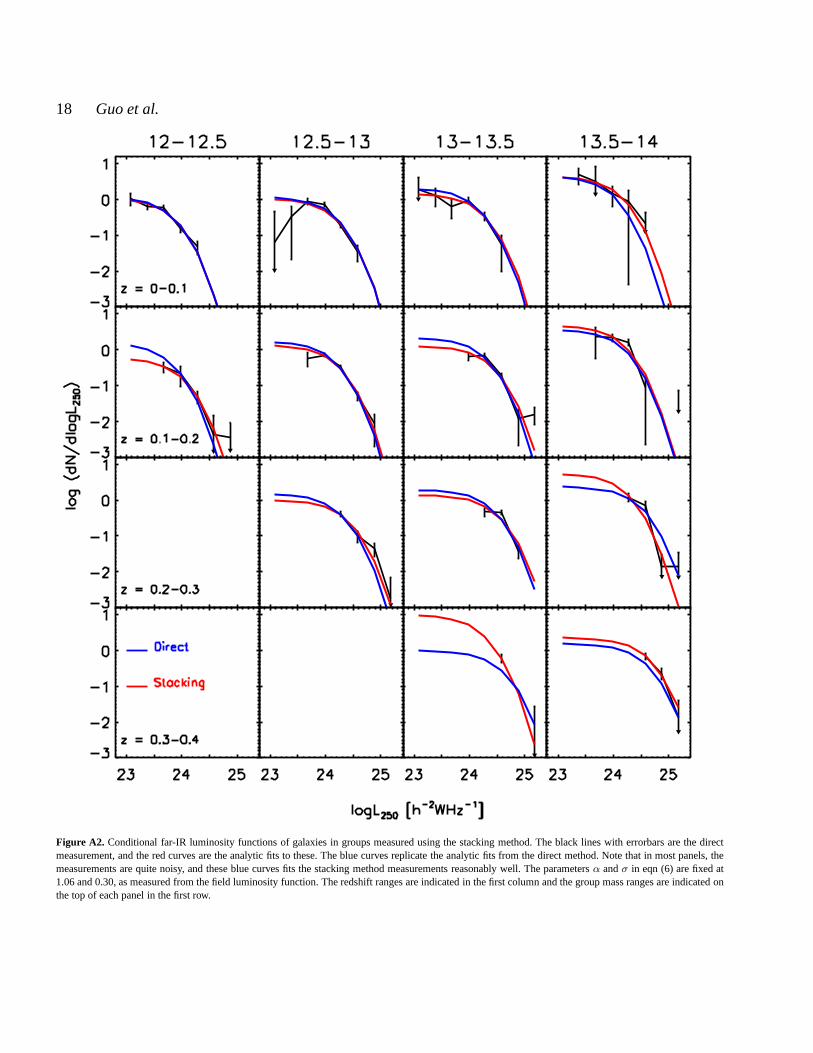
18 Guo et al.
Figure A2. Conditional far-IR luminosity functions of galaxies in groups measured using the stacking method. The black lines witherrorbars are the directmeasurement, and the red curves are the analytic fits to these. The blue curves replicate the analytic fits from the direct method. Note that in most panels, themeasurements are quite noisy, and these blue curves fits the stacking method measurements reasonably well. The parameters α andσ in eqn (6) are fixed at1.06 and 0.30, as measured from the field luminosity function. The redshift ranges are indicated in the first column and thegroup mass ranges are indicated onthe top of each panel in the first row.