A comparison of galaxy group luminosity functions from semi-analytic models
16
arXiv:1104.2447v2 [astro-ph.GA] 14 Apr 2011 Mon. Not. R. Astron. Soc. 000, ??–?? (2008) Printed 15 April 2011 (MN L A T E X style file v2.2) A Comparison of Galaxy Group Luminosity Functions from Semi-Analytic Models Owain N. Snaith 1 , Brad K. Gibson 1 , Chris B. Brook 1 , St´ ephanie Courty 1,2 , Patricia S´ anchez-Bl´azquez 1,3,5 , Daisuke Kawata 4 , Alexander Knebe 5 and Laura V. Sales 6 1 University of Central Lancashire, Jeremiah Horrocks Institute, Preston, PR1 2HE, United Kingdom 2 Centre de Recherche Astrophysique de Lyon, Ecole Normale Superieure de Lyon, Lyon, F-69007, France 3 Instituto de Astrofisica de Canarias, Via Lactea S/N. E-38205, La Laguna, Tenerife, Spain 4 Mullard Space Science Laboratory, University College London, Holmbury St. Mary, RH5 6NT, United Kingdom 5 Universidad Aut´ onoma de Madrid, Deptartamento de F´ ısica Te´orica, E-28049 Madrid, Spain 6 Kapteyn Astronomical Institute, P.O. Box 800, Groningen, The Netherlands 15 April 2011 ABSTRACT Semi-analytic models (SAMs) are currently one of the primary tools with which to model statistically significant ensembles of galaxies. The underlying physical prescrip- tions inherent to each SAM are, in many cases, different from one another. Several SAMs have been applied to the dark matter merger trees extracted from the Mil- lennium Run, including those associated with the well-known Munich and Durham lineages. We compare the predicted luminosity distributions of galaxy groups using four publicly available SAMs (De Lucia et al. 2006; Bower et al. 2006; Bertone et al. 2007; Font et al. 2008), in order to explore a galactic environment in which the models have not been explored to the same degree as they have in the field or in rich clusters. We identify a characteristic “wiggle” in the group galaxy luminosity function gener- ated using the De Lucia et al. (2006) SAM, that is not present in the Durham-based models, consistent to some degree with observations. However, a comparison between conditional luminosity functions of groups between the models and observations of Yang et al. (2007) suggest that neither model is a particularly good match. The lu- minosity function wiggle is interpreted as the result of the two-mode AGN feedback implementation used in the Munich models, which itself results in flattened magnitude gap distribution. An associated analysis of the magnitude gap distribution between first- and second-ranked group galaxies shows that while the Durham models yield distributions with approximately equal luminosity first- and second-ranked galaxies, in agreement with observations, the De Lucia et al. models favours the scenario in which the second-ranked galaxy is approximately one magnitude fainter than the pri- mary,especially when the dynamic range of the mock data is limited to 3 magnitudes. Key words: Galaxies: luminosity function – galaxies: clusters – galaxies: formation – methods: N-body simulations 1 INTRODUCTION In an ideal world, simulating and analysing the formation and evolution of galaxies within Gpc-scale cosmological vol- umes would be accomplished via the use of self-consistent gravitational N-body and hydrodynamical models. While such an approach is feasible in certain restricted situations, it remains impractical for most applications. Instead, the compromise most widely adopted is based upon the use of Semi-Analytic Models (SAMs). The merger and assembly histories of galaxies within SAMs are underpinned by high- resolution cosmological N-body simulations, at the “cost” of employing a posteriori “semi-analytical” treatments of the associated baryonic physics. In all the SAM models explored in this paper galaxy properties are derived using a range of gas infall, radiative cooling, re-ionisation, AGN and supernovae feedback, mor- phological transformation, dust and spectrophotometry pre- scriptions. In general, the inclusion of AGN feedback within the SAM reduces the luminosity and stellar mass of the brightest galaxies. Supernovae feedback is effective in low mass galaxies, where it becomes an important mechanism by which galactic winds are driven and star formation is quenched. Thus, supernova feedback leads to a reduction in
-
Upload
independent -
Category
Documents
-
view
5 -
download
0
Transcript of A comparison of galaxy group luminosity functions from semi-analytic models

arX
iv:1
104.
2447
v2 [
astr
o-ph
.GA
] 1
4 A
pr 2
011
Mon. Not. R. Astron. Soc. 000, ??–?? (2008) Printed 15 April 2011 (MN LATEX style file v2.2)
A Comparison of Galaxy Group Luminosity Functions
from Semi-Analytic Models
Owain N. Snaith1, Brad K. Gibson1, Chris B. Brook1, Stephanie Courty1,2,
Patricia Sanchez-Blazquez1,3,5, Daisuke Kawata4, Alexander Knebe5 and Laura V. Sales61University of Central Lancashire, Jeremiah Horrocks Institute, Preston, PR1 2HE, United Kingdom2Centre de Recherche Astrophysique de Lyon, Ecole Normale Superieure de Lyon, Lyon, F-69007, France3Instituto de Astrofisica de Canarias, Via Lactea S/N. E-38205, La Laguna, Tenerife, Spain4Mullard Space Science Laboratory, University College London, Holmbury St. Mary, RH5 6NT, United Kingdom5Universidad Autonoma de Madrid, Deptartamento de Fısica Teorica, E-28049 Madrid, Spain6Kapteyn Astronomical Institute, P.O. Box 800, Groningen, The Netherlands
15 April 2011
ABSTRACTSemi-analytic models (SAMs) are currently one of the primary tools with which tomodel statistically significant ensembles of galaxies. The underlying physical prescrip-tions inherent to each SAM are, in many cases, different from one another. SeveralSAMs have been applied to the dark matter merger trees extracted from the Mil-lennium Run, including those associated with the well-known Munich and Durhamlineages. We compare the predicted luminosity distributions of galaxy groups usingfour publicly available SAMs (De Lucia et al. 2006; Bower et al. 2006; Bertone et al.2007; Font et al. 2008), in order to explore a galactic environment in which the modelshave not been explored to the same degree as they have in the field or in rich clusters.We identify a characteristic “wiggle” in the group galaxy luminosity function gener-ated using the De Lucia et al. (2006) SAM, that is not present in the Durham-basedmodels, consistent to some degree with observations. However, a comparison betweenconditional luminosity functions of groups between the models and observations ofYang et al. (2007) suggest that neither model is a particularly good match. The lu-minosity function wiggle is interpreted as the result of the two-mode AGN feedbackimplementation used in the Munich models, which itself results in flattened magnitudegap distribution. An associated analysis of the magnitude gap distribution betweenfirst- and second-ranked group galaxies shows that while the Durham models yielddistributions with approximately equal luminosity first- and second-ranked galaxies,in agreement with observations, the De Lucia et al. models favours the scenario inwhich the second-ranked galaxy is approximately one magnitude fainter than the pri-mary,especially when the dynamic range of the mock data is limited to 3 magnitudes.
Key words: Galaxies: luminosity function – galaxies: clusters – galaxies: formation– methods: N-body simulations
1 INTRODUCTION
In an ideal world, simulating and analysing the formationand evolution of galaxies within Gpc-scale cosmological vol-umes would be accomplished via the use of self-consistentgravitational N-body and hydrodynamical models. Whilesuch an approach is feasible in certain restricted situations,it remains impractical for most applications. Instead, thecompromise most widely adopted is based upon the use ofSemi-Analytic Models (SAMs). The merger and assemblyhistories of galaxies within SAMs are underpinned by high-resolution cosmological N-body simulations, at the “cost” of
employing a posteriori “semi-analytical” treatments of theassociated baryonic physics.
In all the SAM models explored in this paper galaxyproperties are derived using a range of gas infall, radiativecooling, re-ionisation, AGN and supernovae feedback, mor-phological transformation, dust and spectrophotometry pre-scriptions. In general, the inclusion of AGN feedback withinthe SAM reduces the luminosity and stellar mass of thebrightest galaxies. Supernovae feedback is effective in lowmass galaxies, where it becomes an important mechanismby which galactic winds are driven and star formation isquenched. Thus, supernova feedback leads to a reduction in
2 O. N. Snaith et al.
the number of low luminosity galaxies. Upon merging, thestars and cold gas of a satellite galaxy (an accreting galaxy)are added to the reservoir of the central galaxy (called ‘Cen-trals’, henceforth) of the parent halo. SAMs have reproduceda range of galactic observables, including colours, luminosi-ties, and mass functions.
SAMs come in several flavours, and, although thecodes share many similar features as outlined above, theyalso differ in the way in which certain processes, relat-ing to baryonic physics, are implemented (e.g., treatmentof supernovae and AGN feedback). These lead differentSAMs to produce different solutions to the problem ofgalaxy formation. Some of these differences have beenexplored at length in the literature, via direct compari-son with both empirical field and cluster galaxy luminos-ity functions, which are the extrema of galaxy environ-ments (Hatton et al. 2003; Mo et al. 2004; Gonzalez et al.2005; Bower et al. 2006; Croton et al. 2006). For exam-ple, Mateus (2008) found that the Bower et al. (2006) andDe Lucia et al. (2006) models give different trends for thetemporal evolution of galaxy merger rates based on closepair counting. Dıaz-Gimenez & Mamon (2010) suggest thatthe Bower et al. (2006) and De Lucia et al. (2006) mod-els reach different conclusions regarding the rate of chancealignment in low velocity dispersion compact groups. Recentexamples of problems encountered by the SAM approach in-clude the excess of low-mass red galaxies, as identified byWeinmann et al. (2006), and Baldry et al. (2006). A com-prehensive review of the SAM approach can be found inBaugh (2006).
What has not been explored, thus far, at least in any for-mal sense, is the impact of these baryonic physics prescrip-tions upon the resulting luminosity and stellar mass func-tions for the most common of environments, that of galaxygroups. It is to this aim that our current study is focused.Galaxy groups are environments where galactic evolution ishappening at a high rate due to the low velocity dispersionof groups. This means means that galaxy-galaxy interactionsare more likely than in clusters. In this paper, we examinethe outputs of four widely-used SAMs applied to the Millen-nium Run,1 Springel et al. (2005), in order to quantify theimpact of baryonic physics prescriptions upon the resultingcompact and loose group luminosity functions. Two of themodels which we examine will be collectively referred to asthe “Durham models”, being those of Bower et al. (2006),(D B06), and Font et al. (2008) (D F08), which is an up-dated version of D B06, with a more sophisticated treat-ment of ram pressure stripping. We also analyse two “Mu-nich models”, being those of De Lucia et al. (2006) (M D06hereafter), and Bertone et al. (2007) (M B07), which differsfrom M D06 mainly in the supernova feedback recipes. Arelated model by Croton et al. (2006), of which M D06 is adirect descendant, is also referred to in our study.
After outlining our galaxy group cataloguing proce-dure, constructed using a classical friends-of-friends ap-proach (§ 2), we examine systematically the predicted dis-
1 The simulation was carried out by the Virgo Super-computing Consortium at the Computing Centre of theMax Planck Society in Garching and recovered fromhttp://galaxy-catalogue.dur.ac.uk:8080/Millennium/.
tributions of luminosity, and first-to-second rank magnitudegap for both compact and loose groups of galaxies, for eachof the SAMs under consideration (§ 3). We analyse the lumi-nosity distribution of galaxy groups in the different modelsso that the next generation of SAMs can improve the imple-mentation of galaxy formation physics.
2 MODELS
The SAMs used in our analysis employ the merger treesassociated with the Millennium Simulation (Springel et al.2005) a large N-body simulation corresponding to a sig-nificant volume of the visible Universe, and generated us-ing the WMAP Year 1 cosmology (Spergel et al. 2003).2
The simulation used 21603 particles in a periodic box ofside length 500h−1 Mpc, gravitational softening of 5h−1kpc,and individual particle masses of 8.6×10⁸ M⊙; 64 outputsexist within the Millennium database, ranging from red-shift z=127 to z=0. The simulation was post-processed us-ing a Friends-of-Friends (FoF) algorithm (Geller & Huchra1983), in order to identify density peaks, and then SUBFIND(Springel et al. 2001) was employed to identify substructureand split spuriously joined haloes. This information was thenused to build merger trees for the dark matter haloes, ontowhich the SAMs are “mapped”.
Before embarking on a discussion of the predicted lu-minosity functions resulting from the use of the aforemen-tioned SAMs applied to the Millennium merger trees, it isimportant to summarise briefly the defining characteristicsassociated with each of the primary SAMs employed here.We will highlight the different ways in which the codes createmerger trees, the way in which galaxy positions are defined,the implementation of satellite disruption and accretion, andthe way in which supernova and AGN feedback are imple-mented.
2.1 Durham models (Bower et al. 2006;Font et al. 2008)
In the Durham models, merger trees are produced in a man-ner which follows that of Helly et al. (2003), and the prop-erties of these trees are described in Harker et al. (2006).These models account for ostensibly separate haloes whichare joined by a bridge of dark matter and hence can be erro-neously put in a single halo by FoF algorithms, and also ac-count for haloes which are only temporarily joined. Account-ing for these effects results in a halo catalogue containingmore haloes than in the original FoF catalogue. The mergertrees are then constructed from these catalogues by follow-ing subhaloes from early times to late times. We note thatthe merger trees were constructed independently of those inSpringel et al. (2005).
The merging of galaxies, and lifetime of satellite galax-ies, are derived using the method presented in Benson et al.(2002), which is considerably more sophisticated than themethod used in Cole et al. (2000). When dark haloes merge,a new combined dark halo is formed, and the largest ofthe galaxies contained within is assumed to be the central
2 (Ωm,Ωb,ΩΛ,h,n,σ8)= (0.25,0.045,0.75,0.73,1,0.9)

Luminosity Functions of Galaxy Groups from Semi-Analytic Models 3
galaxy, whilst all other galaxies within the halo are satel-lites. Satellites are then evolved under the combined effectsof dynamical friction, and tidal stripping. These effects aremodelled analytically. The initial orbital energy, and angularmomentum, of the satellite upon merging are specified. Theorbital energy is set using a constant value of rc(E)/Rvir
= 0.5, representative of the median binding energy of satel-lites, while the orbital ellipticity, is chosen to be between 0.1and 1.0 at random. Given these parameters, the apocentricdistance is found, and the orbit equations are integrated atthat point. The host and satellite haloes are all assumed tohave NFW profiles, while galaxies are modelled as a discplus spheroid. The satellite galaxies plus halo are then ad-vanced by calculating the combined gravitation forces of thehost and satellite haloes, as well as the effects of dynami-cal friction, calculated using Chandrasekhar’s formula. Thecode keeps track of tidal stripping, to remove mass fromthe satellites. The new halo mass is then used for the nextiteration of the orbit equations.
This integration of the orbital equations continues untilone of three conditions are met: (i) the final redshift, (ii)the host merges with a new larger halo, in which case thesatellite becomes a part of the new halo and has new orbitalparameters assigned, or (iii) the satellite merges with thecentral galaxy. In this last case, merging takes place whenthe orbital radius falls below Rmerge which is the sum ofthe half mass radius of the central and satellite galaxies.The mass of the merged satellite is then added to the cen-tral galaxy. The merging times match largely match thoseof Cole et al. (2000), however some satellites have very longmerging times, as they loose a great deal of mass throughtidal stripping, meaning that dynamical friction forces be-come very weak.
The Durham models relate supernova reheating directlyto the circular velocity of the galaxy disk according toCole et al. (2000):
Mreheat ∝ V −2diskM∗, (1)
where Mreheat is the rate of change of mass of reheated gas,Vdisk is the disk circular velocity, M∗ is the time deriva-tive of stellar mass and Meject is the change in the mass ofejected gas. In haloes with a shallow potential, this has theeffect of reducing the amount of cold gas available to formstars, by heating the gas back into the hot gas reservoir.The hot gas is dominated by ejection for low mass haloes,and by reheating without ejection for large haloes. For lowmass galaxies, supernova feedback is an important mecha-nism by which galactic winds are driven and star formationis quenched.
The Durham models implement AGN feedback is such away as to regulate the cooling of hot gas. In large haloes withlarge Eddington Luminosity, the AGN feedback is assumedto balance heating and cooling, thus truncating star forma-tion. This prevents the formation of over-luminous galax-ies. While feedback is active, the black hole is assumed togrow proportionally to the cooling luminosity, and gas isaccreted due to disk instabilities. The model assumes quasi-hydrostatic cooling for AGN active galaxies, and has a stricttransition between AGN “active” and “inactive” phases.AGN feedback becomes efficient in galaxies of mass greaterthan ∼2×10¹¹h−1 M⊙.
The essential difference in the D B06 and D F08 models
is the implementation of ram-pressure stripping of the hotgas. In the D B06 model, along with both Munich models,the hot gas is instantaneously stripped when it enters a haloalready containing a central galaxy. In the D F08 model thisprocess happens gradually and depends on the orbit of thegalaxy. This has the effect of reducing the population of faintred galaxies.
2.2 Munich models (De Lucia et al. 2006;Bertone et al. 2007)
The Munich merger trees (Springel et al. 2005) used inM D06 and M B07 follow the positions of subhaloes for aslong as they can be identified. Identification is possible onlywhen the number of particles bound to a subhalo exceeds theminimum number of particles set by SUBFIND. The treesare constructed by following the most bound halo particlesand searching for the descendant halo in the next output.
One of the key differences between the Munich mod-els and those of Durham is that the Munich models explic-itly follow dark matter haloes even after they are accretedonto larger systems, allowing the dynamics of satellite galax-ies residing in the infalling haloes to be followed until thedark matter substructure is destroyed. The galaxy positionis calculated by assigning the galaxy to the most bound par-ticle of a (sub)halo at each time step. This is done until the(sub)halo is no longer identifiable, whereupon the galaxyis assigned to the most bound particle of the (sub)halo atthe last time the (sub)halo could be identified. An analyticcountdown to galaxy merging begins when the satellite sub-halo can no longer be identified, and resets if the parenthalo undergoes a major merger. Thus, in the Munich mod-els, the lifetime of galaxies in groups depends on the amountof time the (sub)halo finder can identify the subhalo, plusthe analytic countdown. The analytic merging follows thatof Croton et al. (2006):
τmrg = 1.17VHr2sat
Gmsat ln(
1 + MH
Msat
) , (2)
where ln(
1 + MH
Msat
)
is the coulomb logarithm, VH is the halocircular velocity, rsat is the distance of the subhalo from thehalo centre at the time it is last identified, msat is the massof the satellite dark halo at the time it was last identifiedand MH is the halo mass.
In M D06, the amount of reheated (by supernovae) coldgas is proportional to the stellar mass, and the mass ejectedfrom the halo is inversely proportional to the host halo’scircular velocity squared (Croton et al. 2006);
Mreheat ∝ V −2vir M∗, (3)
The important parameters, Vvir and M∗, have the same re-lationship in the Durham models. In the Munich models,the reheated mass is proportional to the mass of the halo,while in the Durham model it is proportional to the diskmass. M B07 adopts a more sophisticated treatment of su-pernova feedback. Rather than simply parametrising the ef-fect of supernovae feedback, the M B07 model follows thedynamical evolution of the wind as an adiabatic expansionfollowed by snowploughing. This implementation has the ef-fect of increasing the luminosity of the brightest galaxies. As

4 O. N. Snaith et al.
also occurs with the Durham models, some of the gas willbe ejected from low mass haloes in both Munich models.
In the Munich models, a two-mode formalism is adoptedfor AGN, wherein a high-energy, or “quasar” mode oc-curs subsequent to mergers, and a constant low-energy “ra-dio” mode suppresses cooling flows due to the interactionbetween the gas and the central black hole Croton et al.(2006). In the quasar model, accretion of gas onto the blackhole peaks at z ∼3, while the radio mode reaches a plateauat z ∼2. AGN feedback is assumed to be efficient only inmassive haloes, with supernova feedback being more domi-nant in lower-mass haloes.
The properties of groups in the Munich models, M D06and M B07, are similar to one another in many cases, asare the properties of the two Durham models, D B06 andD F08. Thus, in some analysis, we just discuss the M D06and D B06 models, as representatives of their model’s lin-eage. We only discuss the results based on their descendants,M B07 and D F08, when they show significantly differentbehaviour from M D06 and D B06.
3 GROUPS
In order to construct a statistically significant (and represen-tative) galaxy group catalogue, we have worked with a setof sub-samples of the Millennium Simulation, amounting to∼3% of the available volume, – specifically, 64 boxes of sidelength 125h−1 Mpc drawn from the database. Our resultsare robust to the arbitrary selection of the box, having beentested a posteriori on alternate boxes of equal size. A lumi-nosity limit of Mr=−17 in the SDSS r-band was imposed.At lower luminosity the effect of the limited mass resolu-tion of the N-body background effects the completeness ofthe sample. We identify galaxy groups as overdensties in thegalaxy population using an FoF algorithm (Geller & Huchra1983). No maximum number of members is set but we re-quire that at least four galaxies are linked in order to definea group. Although this removes groups such as the Localgroup, it follows the Hickson (1982) definition of compactgroups.
We first construct a “loose group” (LG) catalogue usinga linking length of 0.2 times the mean inter-particle sepa-ration,(or in this case, inter-galactic separation). We madethis choice by assuming that the galaxies follow the darkmatter. This corresponds to a co-moving linking length of∼500h−1 kpc. To examine the effects of density we alsodefine two “compact group” catalogues, – Compact (CG),and Very Compact (vCG), Groups – using co-moving link-ing lengths of 150h−1 kpc and 50h−1 kpc, respectively. TheCG linking length of 150h−1 kpc is similar to that advisedby McConnachie et al. (2008), based upon their 3D linkinglength analysis from mock catalogues of Hickson compactgroups based on M D06. The vCG linking length is compa-rable to the projected linking length used by Barton et al.(1996) and Allam & Tucker (2000) to identify groups, avalue arrived at by calibrating to the Hickson et al. (1992)catalogue using projected galaxy separations.
We note that the CG galaxies are, by necessity of thegroup finding algorithm, subsets of the LG catalogue, in thatevery galaxy assembled into a group at short linking length,must be part of a group with a larger linking length. Our
Table 1. The number density of field galaxies, and LG, CG andvCG for the D B06,M D06, M B07 and D F08 models .
D B06 D F08 M D06 M B07h3Mpc−3 h3Mpc−3 h3Mpc−3 h3Mpc−3
Field 6.5× 10² 6.6× 10² 6.3× 10² 5.0× 10²
LG 2.1× 10³ 2.2× 10³ 2.0× 10³ 1.6× 10³
CG 1.3× 10³ 1.4× 10³ 8.9× 10⁴ 8.7× 10⁴
vCG 5.4× 10⁴ 6.6× 10⁴ 1.2× 10⁴ 1.4× 10⁴
catalogues also contains clusters and cluster cores, a pointto which we return shortly. The physical interpretation ofthe linking length variation and its impact upon resultinggalaxy distribution is non-trivial. The FoF algorithm essen-tially probes deeper into the potential well at shorter linkinglengths, selecting only galaxies closer to the cluster/groupcore. These galaxies are generally old, and have sunk deeperinto the cluster potential, or they are galaxies near theirrespective orbital peri-centre.
The algorithm does not only extract the inner region ofgroups. Galaxies in the outskirts of clusters that happen tobe close to one another can also be linked together. This mayeither be due to a temporary alignment of galaxies that aresimply ‘passing through’ that region, or because the galax-ies were in close proximity before they entered the cluster,and have not yet been disbursed by tidal forces. These pe-ripheral groups are essentially cluster substructure, and area natural part of the analysis. Peripheral groups represent asmall fraction of LGs, but represent ∼20% of CGs and vCGs.Also worth noting, the linking length adopted for LGs caninclude galaxies in haloes beyond the limit of the dark mat-ter halo which the majority of the group members occupy.This means that our LG catalogue is not exactly equivalentto groups that are defined by the halo occupation of galaxies.
3.1 Merging Timescales
We compare the merging histories and timescales of haloesand galaxies within the models. Any differences will be im-portant in determining the origin of various group proper-ties. To compare the lifetime of satellites we look at a) thelifetimes of satellites that have merged, and thus contributeto the mass and Luminosity of the Central Galaxy, and b)the lifetime of satellites that have not yet merged, and arehence satellites at z = 0, and contribute to the Group cata-logues.
Figure 1 shows the distribution of merging times, de-fined as the time between a satellite first entering a haloand being totally merged with the central galaxy. We se-lect the same 19 millennium simulation clusters from eachmodel to make a fair comparison between the codes and donot put any limit on the luminosity of infalling satellites.The distribution of merging times shows little difference be-tween the models. The average M D06 satellite has lasted5.8 Gyr, while D B06 satellites last 6.2 Gyr, with standarddeviations of ∼ 1. We note, however, that twice as manysatellites have merged in the Munich model (317) than inthe Durham model (152).
This result seems a little contradictory, as similar merg-ing timescales should result in similar numbers of mergers.We look to the number of satellites which do not merge in
Luminosity Functions of Galaxy Groups from Semi-Analytic Models 5
Figure 1. Shows the distribution of galaxy merging times. They-axis is number of galaxies in each bin normalised by the totalnumber of galaxy mergers. The black line is the D B06 model andthe red dotted line is for the M D06 model. Errors are Poisson.The number of merging galaxies in each model is quoted in thepanel.
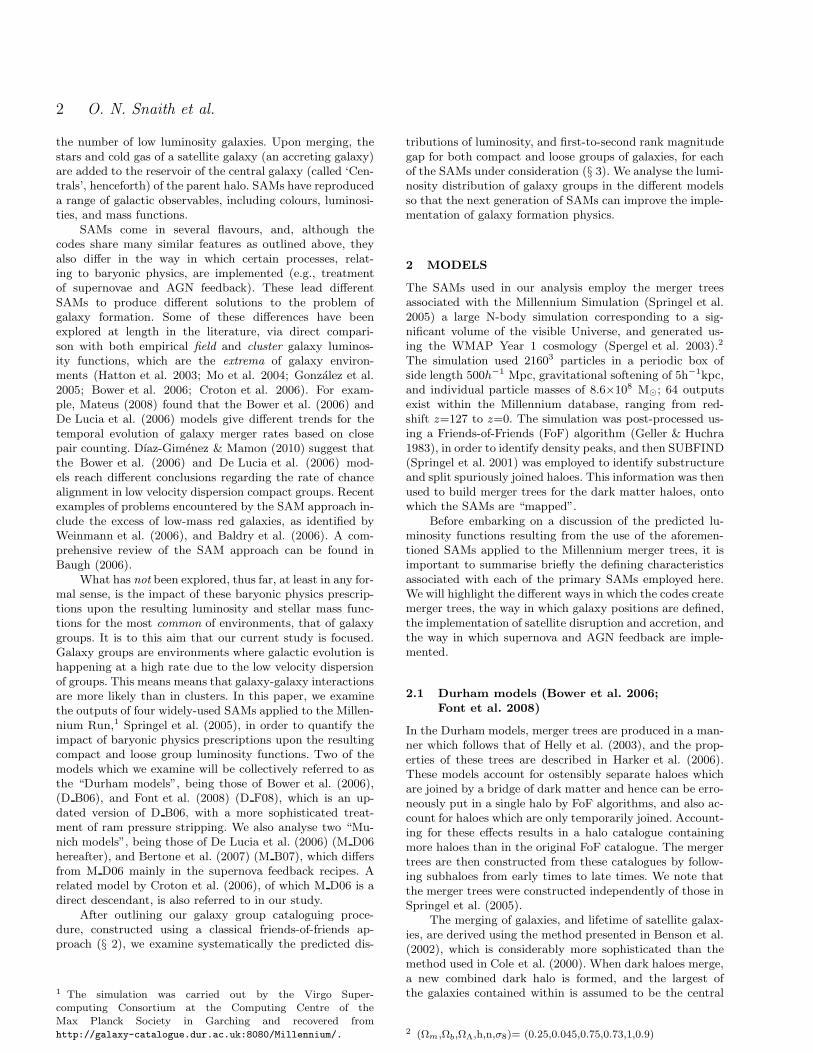
order to reconcile this. Figure 2 shows the time of infall forthe satellites into the host halo, for satellites that merge(Panel A), satellites that do not merge but rather remainas satellites at z=0 (Panel B), and all satellites (Panel C).Again, the fact that more satellites merge in M D06 com-pared with D B06, can be seen in panel A, but it can beseen that the difference is dominated by satellites which fallin to the host halo at early times. By contrast, the num-ber of satellites which do not merge at all is significantlylarger for D B06, compared with M D06. The difference isgreatest for satellites which accrete early. This significantpopulation of satellites which do not merge by z=0 can beexpected to affect the properties of groups which we presentin the remainder of this study, both because of the lowernumber of satellites “feeding” the central galaxy in D B06,and also the larger numbers of satellites which survive to beincluded in the group catalogues. Panel C shows the infalltime of all satellites from our sample of 19 clusters, regard-less of whether they merged, and shows that the differencesbetween the models being relatively minor.
There are more haloes falling into the Durham modelsand fewer galaxy mergers. The galaxies which merge havethe same lifetime in each model. If we look at the time ofinfall of galaxies which merge, and those that remain inthe cluster at z=0, (Fig. 2), there is a substantial popu-lation of galaxies which never merge. In the Durham mod-els more galaxies survive than in the Munich models (panel(B) of Fig.2). Further, we also see that more (of the earlyaccreted) galaxies merge with the central object in the Mu-nich model (panel (A) of Fig.2).At the earliest times in theM D06 model almost all the galaxies have merged, while inthe D B06 model they have not. Thus, the ‘maximum’ life-time of satellite galaxies is 10Gyr in M D06 but > 13Gyr inD B06.
Figure 2. Panel A: Shows the number of galaxies which mergewith the halo central galaxy during the simulation against thetime the galaxy entered the host halo. Panel B: Shows the infalltime of those galaxies which are still satellites at z=0. Panel C:
is the sum of the plots in Panel A and Panel B. The solid blackline shows the D B06 result and the red dashed line is for M D06.
While not shown, our examination of the merger treesalso found that in the D B06 model a greater number ofhaloes merge with the 19 clusters. This is because subhaloesare not followed when constructing the merger trees in theDurham models. In the Munich models there is a delay inthe halo merger time relative to the Durham models becameinfalling haloes are able to enter a subhalo stage before theyare considered merged. When the (sub)halo in each modelis no longer identifiable, the SAMs are used to calculate thelifetimes of galaxies. In the Durham models there appearsto be an extremally long lived population of satellites whichare not present in the Munich
4 OBSERVATIONS
We use the observational loose group catalogues ofTago et al. (2008), Yang et al. (2008), and Tucker et al.(2000), and the Allam & Tucker (2000) compact group cat-alogue. These group catalogues take large redshift surveysof galaxies and use a FoF algorithm to assemble them intogroups. Tago et al. (2008, SDSS5 T08) implemented a stan-dard FoF algorithm which scales according to the distance,and applied it to the SDSS DR5 (Adelman-McCarthy et al.2007). The initial linking length is 0.25h−1Mpc in projec-tion, and 250kms−1 along the line of sight. Tucker et al.(2000, LCRS T00 ) catalogue uses the Las Campanas Red-shift Survey (Shectman et al. 1996), and applies a fiduciallinking length of 0.715h−1Mpc and 500kms−1, scaled fromthis value at z = 0.1 and rising to 1.8 times this at z = 1.7.Allam & Tucker (2000, LCRS A00) uses the same catalogueas LCRS T00 but a shorter linking length of 0.05h−1Mpcand 500kms−1. Finally, Yang et al. (2008, SDSS4 Y08) usesa more complicated iterative approach, which, nevertheless,includes a FoF algorithm at its core (Yang et al. 2005). This

6 O. N. Snaith et al.
algorithm applied to SDSS DR4 (Adelman-McCarthy et al.2006).
Our synthetic group catalogues are compared directlywith these empirical datasets wherever such comparisons arepossible and meaningful within our analysis, bearing in mindlimitations in the models, and in the observations. Whereappropriate, “cuts” are made in the synthetic catalogues tomimic observations.
5 RESULTS
5.1 Density of Groups in the Models
The difference in the proportion of galaxies in groups shouldprovide a key diagnostic for comparing and discriminatingbetween the four SAMs, relative to empirical data. Withinthe Millennium Simulation volume at z=0, the four SAMsunder consideration yield differing numbers of galaxies, de-spite being built upon the same underlying dark matter dis-tribution. It is useful to review the respective galaxy num-bers and distributions for these models. Restricting the dis-cussion to the relevant sampling criteria (i.e., Mr<−17) theM D06 and M B07, and D B06 and D F08 models have agalaxy number density given in Table 1. The number den-sity of galaxies in the field for each model is quite similar,as well as in LGs. However, the Durham models have sig-nificantly denser galaxy populations within CGs and vCGs.The physics which the different models employ to accountfor group environments appear to have significantly alteredthe nature of compact groups.
The relative proportions galaxies that are classified asbeing members of groups, along with the average group rich-ness, are listed in Table 5.1. In this instance we define grouprichness as simply being the number of galaxies in a group.
The percentage of galaxies associated with LGs (andthe numbers of galaxies per loose group) is comparablebetween three of the four SAM variants, with the M D06model showing approximately 6 percent fewer groups thanthe D B06 model. The models diverge increasingly with de-creasing linking length, with the Munich models, M D06 andM B07, having 5 to 6 times fewer vCGs than in the Durhammodels. The M D06 model produces noticeably fewer richgroups at all linking lengths compared with the other Mu-nich model, M B07. This indicates that the implementationof supernovae has a significant effect on the richness of groupcatalogues. The Durham models, D B06 and D F08, haveslightly richer loose groups than the Munich models. This isassociated with the smaller populations of medium bright-ness red galaxies in the Munich models, which may be theresult of the differences in the creation of halo catalogues,the tracing of subhalo mergers, or due to radio mode AGNfeedback.
McConnachie et al. (2008, 2009) compared compactgroups in mock redshift catalogues to SDSS DR6 observa-tions, and concluded that the M D06 SAM overproducesCGs by ∼50%. By extension, Table 5.1 indicates that theD B06 and D F08 models result in an even more dramatic“overproduction” of CGs (by an order-of-magnitude). Thus,in this regime, none of the models are good fits to the em-pirical data, and the Durham models are particularly poor.
Figure 3 shows the galaxy distribution of galaxies with
Table 2. Top: Percentage of galaxies in FoF groups for LG, CGand vCG in each of the four SAMs; Bottom: Mean group richnessfor groups in the four models
LG CG vCG
Bower (D B06) 44 18 5.5Font (D F08) 44 19 6.0
De Lucia (M D06) 38 10 0.9Bertone (M B07) 43 14 1.3
Bower (D B06) 13.5 9.4 6.6Font (D F08) 13.1 9.2 6.6
De Lucia (M D06) 11.5 7.5 4.7Bertone (M B07) 13.6 8.0 5.0
Figure 3. Left Panel: The number of galaxies in LGs againstdistance from the centre, normalised by the total number of galax-ies. The solid line is for D B06 LGs and the dashed line is forM D06 LGs. Right Panel: The normalised number of galaxiesagainst the radius scaled by the virial radius of the host.The redline shows SDSS4 Y08 LGs for the 60 most massive clusters. Er-rors are Poisson. There are 2294, 2022 and 4688 in the D B06,M D06 and SDSS4 Y08 datasets respectively.
Figure 4. The distribution of nearest neighbour pair separationsfor galaxies in LGs for the three models, the solid line is D B06,the dashed line is M D06, and the dotted line is D B07. The plotshows that D B06 galaxies tend to be closer together on average.

Luminosity Functions of Galaxy Groups from Semi-Analytic Models 7
Figure 5. Derived SDSS r-band luminosity functions for galaxygroups constructed with the SAMs described herein: “All” refersto the global galaxy luminosity function; “LG” to loose groups;“CG” to compact groups; “vCG” to very compact groups. Thesolid/dashed/dotted lines refer to the D B06/M D06/M B07models, respectively.
radius for the LGs of M D06 and D B06 models. The leftpanel shows the number of satellites versus radius in Mpc.The right panel of Fig. 3 shows the same plot with the radiusscaled by the virial radius. Both panels show that there aremore satellites in the inner regions of the D B06 LGs, rela-tive to the outer regions, compared with the M D06 model.The red line in the right panel shows the 60 most massiveSDSS4 Y08 observed Loose Groups, making them similar inmass range to the population used in making the simulationplots. This indicates that both models have a radial distribu-tion of satellites which is more centrally concentrated thanthe observations, with the problem being particularly acutein the D B06 model.
This more concentrated distribution of satellites is alsoreflected in the distribution of nearest neighbour pair sepa-ration distances for LG members, seen in Fig. 4. It can beseen that the D B06 model the nearest neighbour separationis smaller than for the M D06 and M B07. We note that theD F08 model groups have very similar properties to D B06and is thus not included in these figures.
5.2 Luminosity Functions
We now plot the group luminosity functions. Figure 5 showshow the luminosity function changes in the different groupenvironments for the SAM models. It is unsurprising thatthe global luminosity functions of all the models are similar,because the semi-analytic models are designed to replicatethe same observational luminosity function of Blanton et al.(2003). At smaller linking lengths (moving from top to bot-tom in the figure) there is a decreasing number of galaxies inall SAMS, a fact which is more dramatic in the Munich vari-ants, as noted in § 5.1. This provides further evidence that
the Durham model galaxies are more centrally concentratedthan those of the Munich variants.
The second feature of Fig. 5 is the relative dearthof intermediate luminosity (−21∼<Mr∼<−18) galaxies in theM D06 catalogues (in relation to a simple Schechter (1976)function). This is manifest in the “wiggle” or “dip” seen inthe M D06 group luminosity function. This feature is notpresent in the other models. This wiggle becomes more ap-parent at shorter linking lengths, (i.e., CGs and vCGs). TheM B07 SAM, which employs the same AGN feedback pre-scription as M D06, shows no such feature in the luminosityfunction. Weinmann et al. (2006; fig 3) show a similar wigglein the luminosity function of groups in particular mass bins,i.e. the conditional luminosity function, using the Crotonet al. (2006) SAM, which is a close “cousin” to the M D06SAM employed here.
In order to better understand the origin of the shapeof these luminosity functions, we decompose the luminos-ity functions of the three primary SAMs (D B06, M D06,M B07) and the three primary linking lengths (LG, CG,vCG) under consideration here, into central galaxies andsatellites (Fig. 6). The global galaxy luminosity functionis also shown for reference. The M D06 (middle row), andM B07 (bottom row) centrals show a Gaussian distribution,while the D B06 model, (top row), centrals are better de-scribed by a Schechter function. There is an increase in thenumber of faint central galaxies in LGs compared with CGsand vCGs, which alters the shape of the central luminosityfunction as we move to larger linking lengths. All satellitesare distributed roughly according to Schechter functions.
The wiggle in the M D06 luminosity function is due tothe combined effect of (i) a general lack of satellites, and (ii)the ”peaked” nature of the central galaxy luminosity distri-bution. Relative to the D B06 SAM prediction, this distri-bution of centrals is very narrow, without the low-luminositytail associated with the D B06 model. This effect is partic-ularly apparent at the shortest linking lengths, i.e. in vCGs.The greater total number of vCGs in the Durham modelscompared to the Munich models is also clear in the vCGpanels, again reflecting their cental concentration.
The contrast between the M D06 and M B07 modelsis of particular interest because they use the same AGNfeedback implementation, but differ in their choice of super-novae feedback. The more sophisticated, and more effectiveSNe model of M B07 makes the luminosity distribution ofcentrals wider by making a tail towards fainter magnitudesthat is not present in M D06. The most luminous galax-ies are also more luminous in M B07 than in M D06. TheM B07 treatment leads to a more significant population ofintermediate luminosity satellites with a shallower luminos-ity function, thus smoothing the wiggle. A lower numberof low-luminosity satellite galaxies in such a shallow lumi-nosity function is accompanied by “over-luminous” massive(luminous) galaxies (Bertone et al. 2007). M B07 shows adecrease in the number of low luminosity satellites and anincrease in the number of intermediate luminosity galax-ies, reflecting a SN feedback in M B07 which is stronger indwarfs and weaker in large haloes. The increase in high lu-minosity galaxies and decrease in low luminosity galaxiesis noted in Bertone et al. (2007) which they suggest couldbe solved by increasing the supernova feedback time or in-creasing the effect of AGN feedback. It also produces a wider

8 O. N. Snaith et al.
Figure 6. Group luminosity functions for the three primary SAMs under consideration (D B06, M D06, M B07). In each panel, thedotted lines correspond to central galaxies and the dashed lines are for the satellites; the thick solid lines represent the group luminosityfunction and the thin solid line defines the global galaxy luminosity function for reference. The legend D B06, M D06, M B07 refers tothe model as defined above and the number in brackets refers to the linking length in h−1kpc, so the first column is for LGs, the centrecolumn is for CGs and the right column is for vCGs.
central galaxy distribution by not only increasing the num-ber of very bright galaxies but also the population of dimcentrals.
5.3 Brightest Group Galaxy
We define three types of identified groups. The first type,bright central groups, are those where the brightest galaxyis also the central. The second type, peripheral groups, arethose without a central galaxy and, therefore, the bright-est galaxy is a satellite. The third type of group, dim cen-trals, are those where the central galaxy is not the brightest.Except in the D F08 model, the central galaxy is the onlyone with hot gas and it acquires all the hot gas from in-falling satellites. The central galaxy is also the only galaxythat experiences mergers and grows hierarchically. Table3 shows the populations of these three types for LG, CGand vCG, the format being, groups with bright centralgroups/peripheral groups/dim central groups.
There is a difference between the three main models forLGs. The Durham models have a smaller fraction of BrightCentral Groups relative to dim centrals, compared with theMunich models. This discrepancy continues to smaller link-ing lengths. This likely driven by the greater number ofmergers in the Munich models, feeding the growth of thecentral galaxy. The more sophisticated supernova feedback
Table 3. Proportion of galaxy group types where the first numberis the proportion of bright central, peripheral and dim centralgroups.
Model LG CG vCG
D B06 79/00/21 63/12/25 64/15/21M D06 90/01/09 74/21/05 75/20/05M B07 82/02/16 70/22/08 71/23/06
of the M B07 model has decreased the fraction of BGGs.The Munich models also have more peripheral groups at alllinking lengths
In Fig. 7 the luminosity functions of the first rankedgalaxies (i.e. the brightest galaxy in each group) of ourgroups have been plotted. These have then been decomposedby group type, with distribution of first ranked galaxies inbright central groups, the first ranked galaxies in peripheralgroups and the first ranked galaxies in dim central groups.It can be seen that, in the Munich SAMs, for the densergroups, there is a large difference between the shape of theLF of the brightest galaxies in central and peripheral groups.The difference is most extreme for the M D06 model, wherethe low magnitude tail is due, almost entirely, to peripheralgroups. On the contrary, in the D B06 model the distribu-

Luminosity Functions of Galaxy Groups from Semi-Analytic Models 9
Figure 7. Luminosity function of all first ranked galaxies (the brightest galaxy in each group, thin solid line); distribution of first rankedgalaxies in bright central groups (thick solid line); the first ranked galaxies in peripheral groups (dotted line) and the first ranked galaxiesin dim central groups (dashed line).
tion of groups is not particularly different for the differentgroup types.
5.4 Halo-based Groups
In this section groups consist of galaxies which lie within thesame dark matter halo, whose extent is determined by usinga density contour defined bya dark matter particle separa-tion of 0.2 times the mean inter-particleseparation. This isnot to be confused with the linking length used todefinedgroups which acts on galaxies rather than dark matter par-ticles.Groups determined in this manner differ from thosedetermined by using FoFalgorithms. Even for LGs there isnot a one-to-one correspondence between halo groups andFoF groups. The limit on the minimum number of galaxiesused to define a group remains at four.
We examine the conditional luminosity functions inthree different group mass bins. These conditional luminos-ity functions are plotted in Fig. 8, for the D B06, M D06,and M B07 SAMs. The luminosity functions are furtherseparated into centrals (middle row) and satellites (bottomrow).
The 1013−14M⊙ and 1014−15M⊙ mass bins show littleevidence for the “wiggle” (for any of the SAMs). The “wig-gle” in the M D06 model, and to a lesser extent the M B07model, is particularly prominent in the lowest mass bin (topright panel), where a number of physical processes becomerelevant. Bower et al. (2006) points out that at ∼ 2×10¹¹M⊙
the cooling rate exceeds the free-fall rate and the halo is nolonger in hydrostatic equilibrium. This has repercussions forthe effectiveness of feedback from the central source (Binney2004) and is used in the Durham paper to explain the breakin the luminosity function. Our results indicate that in theMunich models the processes occurring in the mass rangemay have other repercussions.
For the highest mass bin we can see that the satelliteluminosity function is steepest for the M D06 SAM and shal-lowest for the D B06 model. The characteristic luminosityat the “knee” of the Schechter function (M∗) is lowest forthe D B06 model. However, this bin has only a small effecton the “wiggle” alluded to in Section 5.2, which occurs atlower luminosity than the wiggle seen in this particular massbin. In the 1012−13M⊙ bin, where the wiggle is prominentin the M D06 model, the satellite distribution is fairly steepand the central galaxy luminosity function relatively nar-row and bright. By contrast the D B06 model has a muchbroader central galaxy luminosity function, indicating a ten-dency to produce significantly more low-luminosity centralscompared to M D06. Again, the unmerged satellites in theDurham models mean less feeding of the central galaxy re-sulting in this tail to lower luminosities.
In order to compare this with observations we over plotthe results of M D06 and D B06 onto the conditional lumi-nosity functions provided by SDSS4 Y08. Weinmann et al.(2006) note that the method used by SDSS4 Y08, presentedin Yang et al. (2005), artificially narrows the central galaxy

10 O. N. Snaith et al.
Figure 8. The conditional luminosity functions in three mass bins which correspond roughly to clusters, large groups and small groups,for halo-based groups for the three primary SAMs employed here, at redshift z=0. The top row shows the distributions of all halomembers, the second row show central galaxies and the bottom row shows satellites. The solid, dashed and dotted lines are for theD B06, M D06 and M B07 models respectively.
(a) Satellite galaxies (b) Central Galaxies
Figure 9. The conditional luminosity function of the models, D B06 (solid black line) and M D06 (dashed line) plotted over the CLFsof SDSS4 Y08 (shown in red). The number quoted being the centre of each mass bin and the box width being ∼ 0.31 mag. In panel ‘a’the top pair of lines are the 1014.58M⊙ cut, the next is the 1013.94M⊙ cut etc, down to 1012.16M⊙

Luminosity Functions of Galaxy Groups from Semi-Analytic Models 11
luminosity function. This is because their iterative techniqueuses the brightest galaxy luminosity in the derivation of thegroup halo mass, while in the models there is no such directlinking of mass and luminosity. However, the difference isnot enough to affect our comparison. SDSS4 Y08 shows theCLFs for groups using SDSS DR4 galaxies, and are fit withmodified Schechter and Gaussian functions to the satelliteand central galaxy luminosity distributions respectively. Thefunctional forms of the fits are,
Φcen(L|M) =1√2πσc
exp
[
(logL− logLc)2
2σ2c
]
, (4)
Φsat(L|M) = φ∗
s
(
L
L∗s
)(α∗
s+1)
exp
[
−(
L
L∗s
)2]
, (5)
where, L is the luminosity, Lc is the mean position of theGaussian, σc is the width of the Gaussian, φ∗
s is the nor-malisation of the modified Schechter function, α∗
s is the lowmass slope and log(L∗
s) = log(L∗c)− 0.25 and is the position
of the knee of the modified Schechter function.SDSS4 Y08 provide the best fit parameters, which we
compare to the M D06 and D B06 models using the samemass bins as SDSS4 Y08 in Fig. 9(a) and Fig. 9(b), wherePanel ‘a’ shows the satellite galaxy distribution and Panel’b’ the central galaxy distribution. The highest mass bin inthe models corresponds most closely with the observations.
The shape of the conditional luminosity functions forthe satellites are considerably different for the CLFs. At allmasses, there are far fewer low luminosity satellites in themodels than than in the observations. The discrepancy isless severe for the M D06 model for high mass clusters. Thedifference between observations and models for the satelliteluminosity function is larger as we go to lower mass. As wego to 1012.75 M⊙ and below, it is the D B07 groups whichhave more low luminosity satellite galaxies.
The central galaxy conditional luminosity functions alsodiffer significantly between models and observations. TheM D06 model shows that the low mass (1012.16 M⊙) groupcentrals peak in the same place as the observations, whilethe mass bins are somewhat displaced, both toward lowerluminosities (1012.75 M⊙ and 1013.3 M⊙) and higher lumi-nosities (1013.94 M⊙ and 1014.58 M⊙). The M D06 model isalso broader than the observations. These discrepancies areeven greater for the D B06 groups, which even wider thanthe M D06 groups.
The median vCG has a mass of 1.7× 10¹³M⊙ for bothM D06 and D B06, but with considerable variation. Thismeans that the distributions closest to this value are moreimportant to the analysis of vCGs than further away. In Fig.9(a) and 9(b) we see that the models are reasonably similarat this point, although the peak in the central luminosityfunction is greater in the Munich variant. This suggests thatthe significant lack of vCGs in M D06 compared to D B06is due to the positions of galaxies in groups rather than theabsolute numbers, and we refer the reader back to Figure 3.
6 MAGNITUDE GAP
The magnitude “gap” between the first- and second-ranked (and, indeed, lower-ranked) galaxies within a groupcan be used as a predictor of group (or halo) age
(von Benda-Beckmann et al. 2008), as the central galaxytends to grow unceasingly with time via satellite accre-tion/stripping. This mechanism inevitably increases themagnitude gap. This process is controlled by feedback inthe central galaxy (§2) and by infalling galaxies. Takento its extreme, such an effect gives rise to the so-called“fossil groups”, which are groups with a magnitude gapgreater than two, most likely caused by a lack of re-cent galaxy infall onto the group (D’Onghia et al. 2005;Sommer-Larsen 2006; Dariush et al. 2007; Sales et al. 2007;van den Bosch et al. 2007; Dıaz-Gimenez & Mamon 2010;Mendes de Oliveira et al. 2006; Vikhlinin et al. 1999, how-ever, see Zibetti et al. 2009).
In Fig. 10, far right column, we compare the magni-tude gap distribution between first and second ranked groupgalaxies in the suite of SAMs employed here. We show thedistribution for all groups (top panel) as well as for theLGs, CGs and vCGs separately as we move downwards. TheM D06 model (and to a lesser extent, that of M B07) showsa preferred magnitude gap of ∼1 mag between the two most-luminous galaxies in the model groups, (particularly in theCGs and vCGs), while the D B06 SAM predicts far moreequal luminosity first- and second-ranked group galaxies.The difference in the distributions between the models isquite apparent, with a “turn over” in the two Munich mod-els, i.e. both are “flatter” and “broader” than the Durhammodels, for all group types and in all mass bins. Again, a sig-nificant difference in how the model’s galaxies evolve withindense environments has been highlighted by these observ-able characteristics.
Dariush et al. (2007; fig 4a) show a comparable rep-resentation of the top-left panel of our Fig. 10, employ-ing the Croton et al. (2006) SAM as applied to the Mil-lennium Simulation (in the R-band), and for a slightly dif-ferent mass range, but effectively similar to what we haveshown. Dariush et al. point out that the magnitude gap dis-tribution of LGs in the Croton et al. (2006) model is sim-ilar to the ln Λ=2 theoretical model of Milosavljevic et al.(2006), where ln Λ is the Coulomb logarithm that controlsthe merger rate. When the Croton et al. (2006) SAM is com-pared with the SDSS C4 catalogue (Miller et al. 2005), asis done in fig. 4c of Dariush et al,. the apparent mismatchat small first- and second-ranked magnitude differences be-tween the Munich SAM, and the data become apparent - i.e.,the SDSS C4 catalogue shows a magnitude difference distri-bution which prefers approximately equal luminosity first-and second-ranked galaxies in groups and clusters, more con-sistent with the Durham SAM predictions.
If we compare our result to the halo occupation distri-butions of van den Bosch et al. (2007), we find that we havefar fewer fossils groups in the two high mass bins for allthree models but more for M D06 groups in the lowest massbin. A halo occupation distribution is a statistical modelof the number and luminosity of galaxies occupying a darkmatter halo of a given mass. As such, it is strongly relatedto the conditional luminosity function previously discussed,and serve as a base of comparison for the SAMs.
In order to make a fair comparison of the model pre-dictions with the current observations, we take into ac-count the selection effects inherent within the data. Specifi-cally, the observational results (i) have a limited dynamicrange of ∼2 mag (Lin et al. 1996), driven by signal-to-

12 O. N. Snaith et al.
Figure 10. Conditional (mass-dependent) magnitude gaps between first- and second-ranked galaxies for the SAMs included in thisstudy. Solid, dashed and dotted lines are for D B06, M D06 and M B07 groups respectively. The top row is for halo-based groupsdivided by group mass and the far right column is for all FoF-groups regardless of mass, specifically, row 2 is for LGs, row 3 is forCGs and row 4 is for vCGs. The subsequent panels show the FoF based groups broken down by halo mass. The vertical line shows thecut-off for Fossil groups (Sales et al. 2007). The numbers in each panel give the percentage of groups which are fossil systems, and, inbrackets, the total number of groups in each mass bin. The first number is for D B06, the second for M D06 and the third for M B07.
noise constraints applied to the lowest luminosity galaxiesin the survey, and (ii) discard groups that contain fewerthan four galaxies within ∼2 mag of the first-ranked galaxy.Tago et al. (2008) groups were chosen for the comparison be-cause the absolute r-band magnitude data was readily avail-able. We have imposed comparable selection effects uponthe models, and the impact upon the luminosity functionsof the first- and second-ranked CG galaxies is shown in theright hand panels of Fig. 11. The left panels show that theturnover in the Munich models is no longer apparent, once adynamic range of two magnitudes is imposed upon the (the-oretically, infinite) magnitude gap between first- and fourth-ranked group galaxies. With these cuts, the models and datanow lie closer to one another. However, the models producea significant shortage of pairs with low magnitude gaps forLGs and a higher population of groups with a magnitude
gap of one. This effect is more extreme in the Munich mod-els but is still present in D B06.
What is perhaps more interesting is that the dynamicrange need only be increased to three magnitudes for themodels to diverge significantly, with the M D06 model both“broadening” and shifting to lower luminosity, relative tothe distributions based upon the M B07 and D B06 SAMs,(right-most column of Fig. 10). Table 4 shows the popula-tions of groups in the two extreme cases of small and largemagnitude gap for a dynamic range of 3 mag. The differ-ences are very large between the Durham and Munich mod-els. Certainly, observations with a higher dynamical rangewill provide a good test for differentiating the success ofthe SAMs within group environments. The relative successof the different manner that the SAMs implement physicalprocesses such as AGN and SN feedback, and how these be-

Luminosity Functions of Galaxy Groups from Semi-Analytic Models 13
Table 4. Percentage of groups with magnitude gap between firstand second ranked galaxies greater than 2 magnitudes (top) andless than 0.5 magnitudes (bottom)
gap D B06 M D06 M B07
LG > 2 10.8 20.6 15.2CG > 2 14.9 28.4 23.8vCG > 2 18.2 27.5 29.8
LG < 0.5 35.6 22.7 28.7CG < 0.5 30.4 16.4 19.7vCG < 0.5 27.5 17.8 18.7
come important within group environments where satelliteaccretion modelling is also crucial, can then be better deter-mined. One may also ask whether the assumption of sepa-rating Central and Satellite populations, whereby only thecentral galaxies experience mergers and no satellite galaxiesgrow while in the group environment, is appropriate whentwo galaxies of almost equal mass often exist within suchenvironments.
The proportion of first-ranked (by luminosity) galaxiesbeing centrals is sufficiently high to make the transition fromthe theoretical definitions of “central” and “satellite” galax-ies into the observational regime of “brightest” and “secondbrightest” group galaxies - i.e., we can associate the bright-est group galaxy with a central, and the second-brightestgalaxy to a satellite. This then allows us to plot the lumi-nosity function of first- (M1) and second-ranked (M2) groupgalaxies, as shown in the right hand panels of Fig.11, andassociate the distribution in M1 with model centrals, andthe distribution in M2 with model (brightest) satellites. Thefirst-ranked galaxy luminosity function of D B06 is broaderand flatter than those of the two Munich SAM variants; asexpected, the M B07 model galaxies are, on average moreluminous. For the distribution of second-ranked galaxies, theM D06 galaxies are on average ∼1 mag less luminous thanthe Durham model galaxies, and the distribution is broader.The right panels highlight that, although the global luminos-ity function of galaxies is well matched by observations, thedistributions for the first and second ranked galaxies shownin Fig. 11 tend to be dimmer and wider than observations.
In Figure 12, we demonstrate the impact of imposinga dynamic range of three magnitudes between first- andfourth-ranked group galaxies; having done so, we find thatthe observations of SDSS4 Y08 match the model predictionsof D B06 remarkably well for Loose Groups. This suggeststhat the Durham model, in this regime, provides a bettermatch to empirical data than that of the Munich models.
7 CONCLUSIONS
By constructing luminosity functions of galaxy groups (rang-ing from loose to very compact) using variants of severalleading SAMs, as applied to the Millennium Simulation, wehave explored an astrophysical regime in which the SAMshave not been inter-compared in great detail. Several ob-vious differences between the M D06 (De Lucia et al. 2006)and D B06 (Bower et al. 2006) (i.e., loosely speaking, theMunich and Durham variants, respectively), became ap-parent, including an intermediate luminosity “wiggle” in
the M D06 group luminosity functions not readily apparentwhen using the D B06 SAM. We trace the origin of this wig-gle to two competing effects resulting from the underlyingphysics within the M D06 SAM - a steeper faint-end slopeto the satellite luminosity function and a narrower distribu-tion to the central galaxies luminosity function, most likelydue to the lack of mass stripping in satellite galaxies with-out enveloping subhaloes, type 2 groups, and the particularformulation of AGN in the Munich models. A systematicexploration of parameter space in the respective SAM mayhowever, be required to further isolate the cause of the dif-ference.
Observations suggest that such a wiggle in the group lu-minosity function might exist (Weinmann et al. 2006), sim-ilar to that seen when applying the M D06 SAM. However,these same observations tend to show a steeper magnitudegap (between first- and second-ranked group members) dis-tribution profile than that seen with any of SAMs, and wealso see significant “flattening” in the M D06 gap distri-bution (i.e., a comparable likelihood for first- and second-ranked galaxies to be of equal luminosity, as to have a onemagnitude luminosity difference), a feature that is not con-sistent with the data sets described by Miller et al. (2005)or Dariush et al. (2007).
The models applied to the Millennium simulation pro-duce noticeably different galaxy group properties. The groupluminosity functions diverge with increasing galaxy densitymeaning that, for example, the cores of clusters in the var-ious models have different properties, while the propertiesof the entire cluster will be more similar. As the same darkmatter background was used in the three models there aresimilar numbers of groups and clusters in the models, butaccording to our definitions, the denser structures are sev-eral times more common in the D B06 model. The M D06model luminosity function shows a peak for the brightestgalaxies that does not appear in the Durham models and isless evident in M B07. The magnitude gap distributions ofthe models also differ with the Munich and Durham mod-els demonstrating a different distribution at the small gappart of the distribution. All models show a shallower, widermagnitude gap distribution than the observations. This sug-gests that improvement in how the central / bright satelliteluminosities are calculated is required. The designation of asingle central galaxy which is modelled different manner tothe other group members is a simplification which may needto be improved upon.
The existence of more, denser, CG and vCG groups inthe Durham models compared to the Munich sample sug-gests that the different merging time-scales and implemen-tations of satellite accretion can have noticeable effects onthe predictions of the models. Similarly the fact that theDurham models show a shorter mean galaxy-galaxy sep-aration, indicates that these groups are denser. This sug-gests that merging time-scales are longer in the Durhamgroups. This is backed up by the luminosity function ofgroups because the evident ’wiggle’ in the M D06 groupsappears to be due to a smaller population of satellites andbrighter centrals, which is a direct result of the rate at whichsatellite galaxies are accreted onto the central galaxy. How-ever, while observations show a similar ‘wiggle’ in group lu-minosity functions, suggesting the shorter merging time ismore physical, McConnachie et al. (2008) find fewer com-

14 O. N. Snaith et al.
Figure 11. Left column: Distribution of the magnitude gap between 1st and 2nd ranked galaxies, normalised by total number of groupsin each sample. The thick solid, dashed and dotted lines are for D B06, M D06, M B07 models. The coloured lines show observationaldata. The top left panel shows Tago et al. (2008) groups (red dashed line), SDSS4 Y08 (red solid line) and Tucker et al. 2000 LGs(blue dotted line), the middle panel shows the results for CGs and and the bottom left panel shows Allam et al. (2000) compact groups(blue dotted line) along with vCGs. Poisson counting uncertainties for each bin are reflected by the accompanying vertical bars. Right
column: The upper panel shows the luminosity function for second-ranked LG galaxies and the lower panel shows the distribution offirst-ranked galaxies, and the observational data is taken from Tago et al. (2008) groups (blue line) SDSS4 Y08 (red line). Data here hasbeen restricted to mimic a survey in which the magnitude gap between first- and fourth-ranked group galaxies is two.
pact groups in their field than in the SAMs, suggesting themerging time-scale should be even shorter. Contrastinglythe limited magnitude gap distribution indicates that thegap between central and satellite galaxies should be smaller,which may be due to additional physics that is not yet im-plemented in the models. Our analysis of the timescales ofmerging shows that this is not the case, as satellites in bothmodels last a similar amount of time. We emphasises, how-ever, that there are more galaxies near the centre of a givengroup/cluster in the Durham models, despite this. We sug-gest that this may be due to the additional time the M D06model identifies subhaloes, and reassigns the galaxy posi-tion of the central galaxy as the most bound particle in the(sub)halo for longer. This may have the effect of keepingthe galaxy out of the central region for longer. Although wedo not find a noticeable difference in the merging times ofgalaxies in the two models there is a substantial populationof groups which do not merge. We can see this because morehaloes merge in the Durham model but more galaxies mergein the Munich models. This serves to build up the numberof satellites in the cluster, which, fall into the cluster core,thus accounting for the observed difference in vCG popula-tion and galaxy density distribution. This can explain thedifference in the magnitude gap distribution because more
galaxies merge with the central in the Munich model, reduc-ing the number of satellites and making the central galaxybrighter.
ACKNOWLEDGEMENTS
ONS acknowledges the support of the STFC through itsPhD Studentship Programme. BKG and CBB acknowledgethe support of the UK’s Science & Technology FacilitiesCouncil (STFC Grant ST/F002432/1) and the Common-wealth Cosmology Initiative; visitor support (PSB, DK, AK,LVS) from the STFC (ST/G003025/1) is similarly acknowl-edged. PSB acknowledges the support of a Marie CurieIntra-European Fellowship within the 6th European Com-munity Framework Programme. AK and PSB are supportedby the Ministerio de Ciencia e Innovacion (MICINN) inSpain through the Ramon y Cajal programme. The Mil-lennium Simulation databases used in this paper and theweb application providing on-line access to them were con-structed as part of the activities of the German Astro-physical Virtual Observatory. Access to the University ofCentral Lancashire’s High Performance Computing Facilityis gratefully acknowledged. We acknowledge the computa-tional support provided by the UK’s National Cosmology

Luminosity Functions of Galaxy Groups from Semi-Analytic Models 15
Figure 12. Left column: Distribution of the magnitude gap between 1st and 2nd ranked galaxies, normalised by total number of groupsin each sample. The thick solid, dashed and dotted lines are for D B06, M D06, M B07 models. The coloured lines show observationaldata. The top left panel shows Tago et al. (2008) groups (red dashed line), SDSS4 Y08 (red solid line) and Tucker et al. 2000 LGs(blue dotted line), the middle panel shows the results for CGs and and the bottom left panel shows Allam et al. (2000) compact groups(blue dotted line) along with vCGs. Poisson counting uncertainties for each bin are reflected by the accompanying vertical bars. Right
column: The upper panel shows the luminosity function for second-ranked LG galaxies and the lower panel shows the distribution offirst-ranked galaxies, and the observational data is taken from Tago et al. (2008) groups (blue line) SDSS4 Y08 (red line). In contrastwith Fig. 11, data here has been restricted to mimic a survey in which the magnitude gap between first- and fourth-ranked group galaxiesis three.
Supercomputer, COSMOS. We thank the DEISA consor-tium, co-funded through EU FP6 project RI-031513 and theFP7 project RI-222919, for support within the DEISA Ex-treme Computing Initiative.
REFERENCES
Adelman-McCarthy J. K., Agueros M. A., Allam S. S.,et al., 2006, ApJS, 162, 38
—, 2007, ApJS, 172, 634Allam S. S., Tucker D. L., 2000, AstronomischeNachrichten, 321, 101
Baldry I. K., Balogh M. L., Bower R. G., Glazebrook K.,et al., 2006, MNRAS, 373, 469
Barton E., Geller M., Ramella M., et al., 1996, AJ, 112,871
Baugh C. M., 2006, Reports on Progress in Physics, 69,3101
Benson A. J., Lacey C. G., Baugh C. M., et al., 2002, MN-RAS, 333, 156
Bertone S., De Lucia G., Thomas P. A., 2007, MNRAS,379, 1143
Binney J., 2004, MNRAS, 347, 1093
Blanton M. R., Hogg D. W., Bahcall N. A., et al., 2003,ApJ, 592, 819
Bower R. G., Benson A. J., Malbon R., et al., 2006, MN-RAS, 370, 645
Cole S., Lacey C. G., Baugh C. M., Frenk C. S., 2000,MNRAS, 319, 168
Croton D. J., Springel V., White S. D. M., et al., 2006,MNRAS, 365, 11
Dariush A., Khosroshahi H. G., Ponman T. J., Pearce F.,Raychaudhury S., Hartley W., 2007, MNRAS, 382, 433
De Lucia G., Springel V., White S. D. M., Croton D., Kauff-mann G., 2006, MNRAS, 366, 499
Dıaz-Gimenez E., Mamon G. A., 2010, MNRAS, 409, 1227D’Onghia E., Sommer-Larsen J., Romeo A. D., et al., 2005,ApJL, 630, L109
Font A. S., Bower R. G., McCarthy I. G., et al., 2008,MNRAS, 389, 1619
Geller M. J., Huchra J. P., 1983, ApJS, 52, 61Gonzalez R. E., Padilla N. D., Galaz G., Infante L., 2005,MNRAS, 363, 1008
Harker G., Cole S., Helly J., Frenk C., Jenkins A., 2006,MNRAS, 367, 1039
Hatton S., Devriendt J. E. G., Ninin S., et al., 2003, MN-RAS, 343, 75
16 O. N. Snaith et al.
Helly J. C., Cole S., Frenk C. S., et al., 2003, MNRAS, 338,903
Hickson P., 1982, ApJ, 255, 382Hickson P., Mendes de Oliveira C., Huchra J. P., PalumboG. G., 1992, ApJ, 399, 353
Lin H., Kirshner R. P., Shectman S. A., et al., 1996, ApJ,471, 617
Mateus A., 2008, ApJ, 684, 61McConnachie A. W., Ellison S. L., Patton D. R., 2008,MNRAS, 387, 1281
McConnachie A. W., Patton D. R., Ellison S. L., SimardL., 2009, MNRAS, 395, 255
Mendes de Oliveira C. L., Cypriano E. S., Sodre Jr. L.,2006, AJ, 131, 158
Miller C. J., Nichol R. C., Reichart D., et al., 2005, AJ,130, 968
Milosavljevic M., Miller C. J., Furlanetto S. R., Cooray A.,2006, ApJL, 637, L9
Mo H. J., Yang X., van den Bosch F. C., Jing Y. P., 2004,MNRAS, 349, 205
Sales L. V., Navarro J. F., Lambas D. G., White S. D. M.,Croton D. J., 2007, MNRAS, 382, 1901
Shectman S. A., Landy S. D., Oemler A., et al., 1996, ApJ,470, 172
Sommer-Larsen J., 2006, MNRAS, 369, 958Spergel D. N., Verde L., Peiris H. V., et al., 2003, ApJS,148, 175
Springel V., White S. D. M., Jenkins A. e. a., 2005, NA-TURE, 435, 629
Springel V., White S. D. M., Tormen G., Kauffmann G.,2001, MNRAS, 328, 726
Tago E., Einasto J., Saar E., et al., 2008, A&A, 479, 927Tucker D. L., Oemler Jr. A., Hashimoto Y., et al., 2000,ApJS, 130, 237
van den Bosch F. C., Yang X., Mo H. J., et al., 2007, MN-RAS, 376, 841
Vikhlinin A., McNamara B. R., Hornstrup A., et al., 1999,ApJL, 520, L1
von Benda-Beckmann A. M., D’Onghia E., Gottlober S.,et al., 2008, MNRAS, 386, 2345
Weinmann S. M., van den Bosch F. C., Yang X., et al.,2006, MNRAS, 372, 1161
Yang X., Mo H. J., van den Bosch F. C., 2008, ApJ, 676,248
Yang X., Mo H. J., van den Bosch F. C., Jing Y. P., 2005,MNRAS, 356, 1293
Zibetti S., Pierini D., Pratt G. W., 2009, MNRAS, 392, 525