Social effects on foraging behavior and success depend on local environmental conditions
18
Social effects on foraging behavior and success depend on local environmental conditions Harry H. Marshall 1,2,3 , Alecia J. Carter 1,4 , Alexandra Ashford 1,2 , J. Marcus Rowcliffe 1 & Guy Cowlishaw 1 1 Institute of Zoology, Zoological Society of London, Regent’s Park, London, NW1 4RY, U.K. 2 Division of Ecology and Evolution, Department of Life Sciences, Imperial College London, Silwood Park, Ascot, Berkshire, SL5 7PY, U.K. 3 Centre for Ecology and Conservation, University of Exeter, Penryn Campus, Penryn, Cornwall, TR10 9EF, U.K. 4 The Fenner School of Environment and Society, The Australian National University, Acton, Canberra, ACT 0200, Australia Keywords Dominance rank, field experiment, Papio ursinus, Primate, social bonds, social tactics. Correspondence Harry H. Marshall, Centre for Ecology and Conservation, University of Exeter, Penryn Campus, Penryn, Cornwall, TR10 9EF, U.K. Tel: +44 1326 259274; Fax: +44 (0) 1326 371859; E-mail: [email protected] Present address Alecia J. Carter, Large Animal Research Group, Department of Zoology, University of Cambridge, Cambridge CB2 3EJ, U.K. Funding Information H.H.M. was supported by a NERC Open CASE studentship (NE/F013442/1) with the Zoological Society of London as CASE partner. A.J.C. was supported by a Fenner School of Environment and Society studentship and grants from the Leakey Foundation, the Animal Behavior Society (USA), the International Primatological Society, and the Explorers Club Exploration Fund. Received: 1 May 2014; Revised: 28 November 2014; Accepted: 1 December 2014 doi: 10.1002/ece3.1377 Abstract In social groups, individuals’ dominance rank, social bonds, and kinship with other group members have been shown to influence their foraging behavior. However, there is growing evidence that the particular effects of these social traits may also depend on local environmental conditions. We investigated this by comparing the foraging behavior of wild chacma baboons, Papio ursinus, under natural conditions and in a field experiment where food was spatially clumped. Data were collected from 55 animals across two troops over a 5-month period, including over 900 agonistic foraging interactions and over 600 food patch visits in each condition. In both conditions, low-ranked individ- uals received more agonism, but this only translated into reduced foraging per- formances for low-ranked individuals in the high-competition experimental conditions. Our results suggest one possible reason for this pattern may be low- ranked individuals strategically investing social effort to negotiate foraging tol- erance, but the rank-offsetting effect of this investment being overwhelmed in the higher-competition experimental environment. Our results also suggest that individuals may use imbalances in their social bonds to negotiate tolerance from others under a wider range of environmental conditions, but utilize the overall strength of their social bonds in more extreme environments where feeding competition is more intense. These findings highlight that behavioral tactics such as the strategic investment of social effort may allow foragers to mitigate the costs of low rank, but that the effectiveness of these tactics is likely to be limited in certain environments. Introduction In social groups, individuals vary in their dominance rank, social bonds, and kinship with other group mem- bers (Earley and Dugatkin 2010; East and Hofer 2010), all of which can have an important effect on foraging behavior and performance (Waite and Field 2007; Marshall et al. 2012a). High-ranking individuals tend to be less susceptible to interference competition and more able to initiate aggression in the defense or theft of food resources (birds: Smith et al. 2001; Liker and Barta 2002; primates: Di Bitetti and Janson 2001; Barrett et al. 2002), which in turn can facilitate access to the best patches (birds: Bautista et al. 1995; Holmgren 1999; primates: ª 2014 The Authors. Ecology and Evolution published by John Wiley & Sons Ltd. This is an open access article under the terms of the Creative Commons Attribution License, which permits use, distribution and reproduction in any medium, provided the original work is properly cited. 1
-
Upload
roehampton-online -
Category
Documents
-
view
1 -
download
0
Transcript of Social effects on foraging behavior and success depend on local environmental conditions
Social effects on foraging behavior and success depend onlocal environmental conditionsHarry H. Marshall1,2,3, Alecia J. Carter1,4, Alexandra Ashford1,2, J. Marcus Rowcliffe1 &Guy Cowlishaw1
1Institute of Zoology, Zoological Society of London, Regent’s Park, London, NW1 4RY, U.K.2Division of Ecology and Evolution, Department of Life Sciences, Imperial College London, Silwood Park, Ascot, Berkshire, SL5 7PY, U.K.3Centre for Ecology and Conservation, University of Exeter, Penryn Campus, Penryn, Cornwall, TR10 9EF, U.K.4The Fenner School of Environment and Society, The Australian National University, Acton, Canberra, ACT 0200, Australia
Keywords
Dominance rank, field experiment, Papio
ursinus, Primate, social bonds, social tactics.
Correspondence
Harry H. Marshall, Centre for Ecology and
Conservation, University of Exeter, Penryn
Campus, Penryn, Cornwall, TR10 9EF, U.K.
Tel: +44 1326 259274;
Fax: +44 (0) 1326 371859;
E-mail: [email protected]
Present address
Alecia J. Carter, Large Animal Research
Group, Department of Zoology, University of
Cambridge, Cambridge CB2 3EJ, U.K.
Funding Information
H.H.M. was supported by a NERC Open
CASE studentship (NE/F013442/1) with the
Zoological Society of London as CASE
partner. A.J.C. was supported by a Fenner
School of Environment and Society
studentship and grants from the Leakey
Foundation, the Animal Behavior Society
(USA), the International Primatological
Society, and the Explorers Club Exploration
Fund.
Received: 1 May 2014; Revised: 28
November 2014; Accepted: 1 December
2014
doi: 10.1002/ece3.1377
Abstract
In social groups, individuals’ dominance rank, social bonds, and kinship with
other group members have been shown to influence their foraging behavior.
However, there is growing evidence that the particular effects of these social
traits may also depend on local environmental conditions. We investigated this
by comparing the foraging behavior of wild chacma baboons, Papio ursinus,
under natural conditions and in a field experiment where food was spatially
clumped. Data were collected from 55 animals across two troops over a
5-month period, including over 900 agonistic foraging interactions and over
600 food patch visits in each condition. In both conditions, low-ranked individ-
uals received more agonism, but this only translated into reduced foraging per-
formances for low-ranked individuals in the high-competition experimental
conditions. Our results suggest one possible reason for this pattern may be low-
ranked individuals strategically investing social effort to negotiate foraging tol-
erance, but the rank-offsetting effect of this investment being overwhelmed in
the higher-competition experimental environment. Our results also suggest that
individuals may use imbalances in their social bonds to negotiate tolerance
from others under a wider range of environmental conditions, but utilize the
overall strength of their social bonds in more extreme environments where
feeding competition is more intense. These findings highlight that behavioral
tactics such as the strategic investment of social effort may allow foragers to
mitigate the costs of low rank, but that the effectiveness of these tactics is likely
to be limited in certain environments.
Introduction
In social groups, individuals vary in their dominance
rank, social bonds, and kinship with other group mem-
bers (Earley and Dugatkin 2010; East and Hofer 2010), all
of which can have an important effect on foraging
behavior and performance (Waite and Field 2007;
Marshall et al. 2012a). High-ranking individuals tend to
be less susceptible to interference competition and more
able to initiate aggression in the defense or theft of food
resources (birds: Smith et al. 2001; Liker and Barta 2002;
primates: Di Bitetti and Janson 2001; Barrett et al. 2002),
which in turn can facilitate access to the best patches
(birds: Bautista et al. 1995; Holmgren 1999; primates:
ª 2014 The Authors. Ecology and Evolution published by John Wiley & Sons Ltd.
This is an open access article under the terms of the Creative Commons Attribution License, which permits use,
distribution and reproduction in any medium, provided the original work is properly cited.
1
King et al. 2008). Social bonds and kinship ties with co-
foragers can ameliorate these effects, particularly for sub-
ordinate animals, by reducing the aggression and/or
increasing the tolerance they receive (birds: Ha et al.
2003; macropods: Carter et al. 2009; primates: King et al.
2009; Silk et al. 2010a) and allowing them to negotiate
access to better patches (birds: Mathot and Giraldeau
2010; primates: Barrett et al. 1999; Fruteau et al. 2009).
While empirical evidence for the influence of social
traits on foraging behavior is common, there have been
far fewer empirical studies investigating how these influ-
ences may be dependent on local environmental condi-
tions. Such dependencies are suggested by resource
defense theory (Brown 1964; Grant 1993) and models of
primate social evolution (reviewed by Isbell and Young
2002). In both cases, there is a general prediction that
greater spatial clumping of resources should lead to a
greater influence of social effects on foraging performance
due to the resources being more monopolisable. The rela-
tively small number of studies conducted to date provides
support for these theories. In the case of dominance rank,
for instance, Vahl et al. (2005) showed that high-ranking
ruddy turnstones (Arenaria interpres) only experienced
greater intake rates where food resources were spatially
clumped. Similarly, Stillman et al. (2002) found that in
common cranes (Grus grus) high-ranking individuals only
engaged in aggressive behavior in environments where
their intake fell below a certain threshold. Fewer studies
have investigated the environment-dependent effects of
social bonds and kinship on foraging behavior. Tanner
and colleagues showed that European shore crabs (Carci-
nus maenus) only formed aggregations, and stable social
networks, when food resources were clumped (Tanner
et al. 2011; Tanner and Jackson 2012), whilst Nystrand
(2006) found evidence that Siberian jays (Perisoreus infau-
stus) preference for foraging with their offspring (over
nonrelated immigrants) was greater during high-predation
risk winter months.
There is also conflicting evidence, particularly in pri-
mate systems, as to the mechanism through which
social bonds influence foraging behavior, despite the
general consensus that their influence can be important.
Many studies highlight the role of social bond
“strength”, usually indexed by the frequency or dura-
tion of bonding interactions (e.g., allogrooming), in
ameliorating aggression from others or allowing access
to better food patches (Frank and Silk 2009; King et al.
2009; Silk et al. 2010a). Other studies emphasize social
bond “balance”, usually indexed by the relative contri-
bution of each social partner to bonding interactions.
Here, social bond imbalances occur when one partner
contributes more to affiliative interactions in exchange
for reduced aggression and increased foraging tolerance
from the other (Barrett et al. 1999; Fruteau et al. 2009;
Tiddi et al. 2011; biological market theory: No€e and
Hammerstein 1995). For example, Fruteau et al. (2009)
were able to increase the proportion of grooming inter-
actions low-ranked vervet monkeys (Chlorocebus aethi-
ops) received from other group members by giving
them the ability to provide others with access to
resources by “opening” a box of food (which the
researchers remotely unlocked only when the low-
ranked individual approached it).
The environment-dependent influences of rank, social
bonds, and kinship on social foraging behavior are likely
to play a fundamental role in determining how fitness
varies between individual group members in different
environments. For example, there is growing evidence
that the effect of rank on reproductive success may be
particularly important when foraging competition is high,
such as during periods of low food availability (Altmann
and Alberts 2003; Nichols et al. 2012; Clutton-Brock and
Huchard 2013). Understanding these influences, and the
mechanisms through which they act, is required to assess
the individual costs and benefits of sociality across envi-
ronments, and thus how sociality evolves. Further, such
knowledge will also help us to predict how social animals
are likely to be influenced by future environmental
change.
We conducted this study on wild chacma baboons
(Papio ursinus). Baboons (Papio spp.) make ideal subjects
for this study as they live in stable groups with well-
defined dominance hierarchies and individuals vary con-
siderably in both the strength and balance of their social
bonds as well as their genetic relatedness to other group
members (Cheney and Seyfarth 2008). They also live in a
wide range of habitats across sub-Saharan Africa (Stone
et al. 2013), including in urban environments (e.g., Hoff-
man and O’Riain 2012), and have been shown to flexibly
adjust their social and foraging behavior in response to
differing environments (Barrett et al. 2002; Alberts et al.
2005; King et al. 2009). We recorded baboon foraging
behaviors in two different environments: a natural envi-
ronment, where food resources occurred in many discrete
patches that varied in both quality and distribution; and
in a field-experimental environment, where food
resources were available in a few concentrated patches.
An experimental approach was adopted to broaden the
range of environmental conditions explored, and in
response to the growing appreciation that environmental
extremes can have an important impact on animal popu-
lations (e.g., McFarland and Majolo 2013; reviewed in
Ameca y Ju�arez et al. 2012). Our experiment represents
conditions where food resources are highly spatially
clumped, stimulating high levels of competition, which
are often typical of periods of food scarcity.
2 ª 2014 The Authors. Ecology and Evolution published by John Wiley & Sons Ltd.
Environment-Dependent Social Foraging H. H. Marshall et al.
Our primary purpose in this study was to test whether
the effects of rank, social bonds, and kinship on foraging
behavior are dependent on the local environment. In gen-
eral, we predicted that individuals’ social traits, particu-
larly their dominance rank, would have a greater effect on
their foraging behavior in the experiment, where food
resources were more spatially clumped, than under natu-
ral conditions. At the same time, we also used this oppor-
tunity to assess the alternative hypotheses about the roles
of social bond strength versus balance in foraging behav-
ior (e.g., Fruteau et al. 2009; Silk et al. 2010a). Compar-
ing between the natural and experimental environments,
we explored how four social traits (rank, social bond
strength, social bond balance, and kinship) influenced
two measures of individuals’ foraging behavior: (1) feed-
ing-related agonism and (2) foraging performance. In the
first case, we explored how individuals differed in the rate
of agonism they experienced (both initiated and received)
and the proportion of this agonism that they received. In
the second case, we explored how individuals’ social traits
influenced three measures of foraging performance: (i)
initial intake rate, (ii) time spent in a food patch, and
(iii) the correlation between initial intake rate and patch
residency time, an estimate of an individual’s ability to
efficiently exploit the environment (see Methods for
details).
Methods
Study site
Fieldwork occurred at Tsaobis Leopard Park, Namibia
(22°230S, 15°450E), from May to September 2010. The
environment at Tsaobis predominantly consists of two
habitats: open desert and riparian woodland. The open
desert, hereafter “desert”, consists of alluvial plains and
steep-sided hills mainly containing small herbs and dwarf
shrubs such as Monechma cleomoides, Sesamum capense,
and Commiphora virgata. The riparian woodland, hereaf-
ter “woodland”, is associated with the ephemeral Swakop
River that bisects the site and mainly contains large trees
and bushes such as Faidherbia albida, Prosopis glandulosa,
and Salvadora persica (see Cowlishaw and Davies 1997 for
more details). Baboons are omnivorous but at Tsaobis
their diet predominantly consists of berries, pods, flowers,
and young leaves (Cowlishaw 1997). Tsaobis baboons
experience relatively low-predation risk as their main
predator, the leopard (Panthera pardus) occurs at low
densities (Cowlishaw 1994). At Tsaobis, two troops of
chacma baboons (total troop sizes = 41 and 33 in May
2010), hereafter the “large” and “small” troop, have been
habituated to the presence of human observers at close
proximity. We collected data from all adults and those
juveniles over 2 years old (n = 32 and 23), all of whom
were individually recognizable (see Huchard et al. 2010
for details). Younger animals were not individually recog-
nizable and so were not included in this study.
Data collection
Natural foraging behavior
We recorded baboon behavior under natural conditions
on handheld Motorola MC35 and Hewlett-Packard iPAQ
Personal Digital Assistants using a customized spreadsheet
in SpreadCE version 2.03 (Bye Design Ltd. 1999) and Cy-
bertracker v3.237 (http://cybertracker.org), respectively.
We selected focal animals in a stratified manner to ensure
even sampling from four three-hour time blocks (6–9 a.m., 9 a.m.–12 p.m., 12–3 p.m. and 3–6 p.m.) across
the field season. No animal was sampled more than once
per day. We conducted 30-min focal follows (Altmann
1974) and discarded any lasting <20 min. At all times, we
recorded the focal animal’s activity (mainly foraging, rest-
ing, traveling, or grooming) and the occurrence, partner
identity, and direction of any grooming or agonistic
interactions. We also recorded the duration of grooming
bouts and the context of agonistic interactions (e.g.,
access to food, water, or a preferred grooming partner).
The following five behaviors, with definitions, were
classed as agonistic behaviors. Supplant: animal A
approaches animal B, causing B to move off while A takes
B’s position at a resource. Displace: A moves near to B,
causing B to monitor A and/or show A subordinance
(e.g., baring teeth) and to immediately move position or
change direction of travel. Threat: A head-bobs and/or
paws the ground whilst looking at B. Chase: A runs after
B (but does not make physical contact with B). Attack: A
makes aggressive physical contact with B, often biting or
holding B to the ground.
During foraging, we recorded the focal animal’s patch
residency time as the time from entering to exiting a dis-
crete food patch. Entry was defined as the focal animal
moving into a patch and looking for food in it (to rule
out the possibility that they were simply passing by or
through the patch), and exit defined as the focal animal
moving out of the patch. Patches were defined as individ-
ual herbs, shrubs or trees, or groups of conspecific neigh-
boring plants within 1 m of each other and so within
reach of the forager without moving. At each patch entry,
we recorded the habitat (woodland or desert), the patch’s
type, size, and food-item handling time, the number of
other baboons already occupying the patch and, where
possible, the focal individual’s initial intake rate (bites in
the first ten seconds). Other data collection requirements
meant it was only possible to collect one intake rate per
ª 2014 The Authors. Ecology and Evolution published by John Wiley & Sons Ltd. 3
H. H. Marshall et al. Environment-Dependent Social Foraging
patch visit, recorded on patch entry. We recorded patch
type by species for large trees and bushes in the wood-
land, and otherwise as nonspecified “herb/shrub” for
smaller plants in both habitats. Patch size was scored on
a scale of 1–6 for large trees and bushes in the woodland
and 1–4 for herb/shrubs, and subsequently converted into
an estimate of surface area (m2) (for details of these con-
versions, see Marshall et al. 2012b). Food-item handling
time was classed as long (bark, pods, and roots) or short
(young leaves, berries, and flowers). We excluded from
our analyses those natural foraging data that were col-
lected on the same days as a feeding experiment was
being run on that focal animal’s troop (see below). Over-
all, we recorded 444 h of feeding behavior (8 � 3 h,
mean � SD, per individual). For our analyses, this sam-
ple contained 991 agonistic interactions over food
resources (18 � 9 per individual), 2106 intake rates
(39 � 30), and 1768 patch residency times (33 � 24)
(the difference in intake rate and patch residency time
sample sizes being due to the availability of the explana-
tory variables used in the analysis of each, see Table 1).
For each habitat in each month, we estimated both the
mean number of food items per patch, and the patch
density for each habitat, using monthly phenological sur-
veys. In these surveys, a pair of observers visited a ran-
dom subset of potential patches in each habitat, estimated
by eye the number of food items in the patch, and then
recorded the mean of their estimates. In the woodland,
these were a representative sample of 110 patches from an
earlier survey of 5693 woodland patches (G. Cowlishaw,
unpubl. data). In the desert, these were 73 food patches
that fell within eight 50 9 1 m transects randomly placed
around four localities within the study troops’ home
ranges. Patch density estimates were calculated as the
mean number of these potential patches which contained
food per km2.
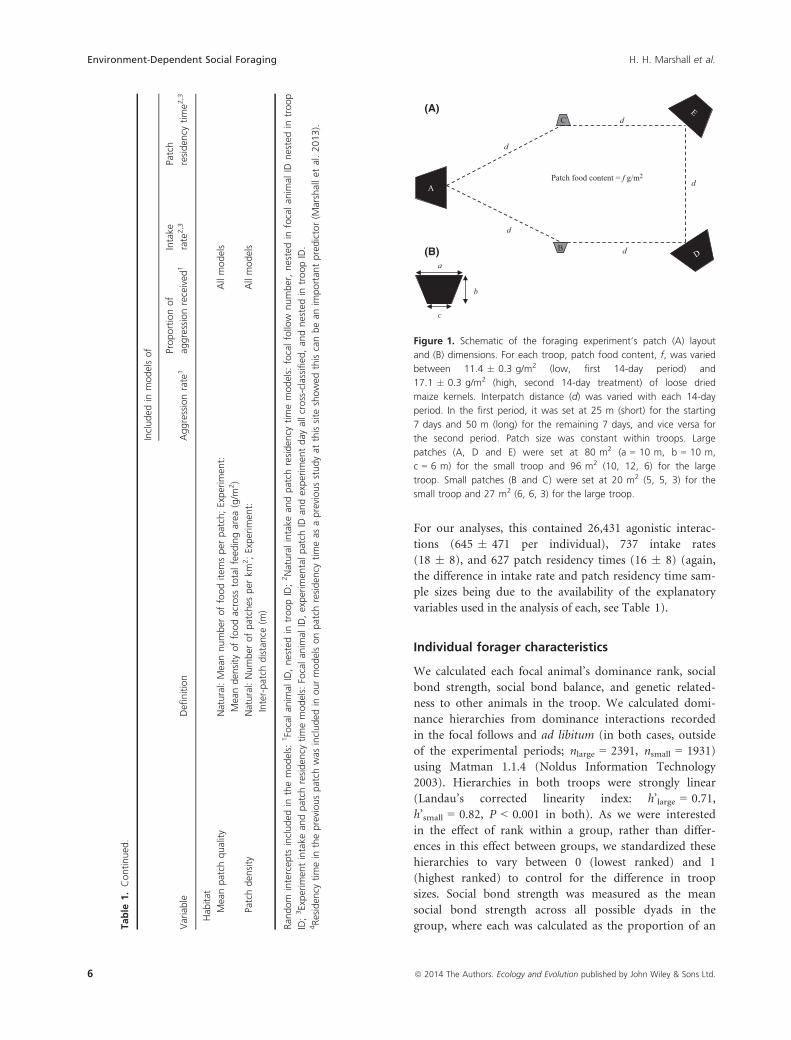
Large-scale foraging experiment
We conducted foraging experiments in an open, flat, and
sandy area in each troop’s home range. They involved a
configuration of five artificial food patches of loose maize
kernels arranged as shown in Figure 1. We selected maize
kernels as the experimental food as they are uniform and
small in size, and previous experience at the field site has
shown that baboons will usually completely consume ker-
nels individually (one kernel per bite) at the feeding arena
rather than carrying them elsewhere (King et al. 2008;
Marshall et al. 2013). We based the total feeding area (all
patches combined) on previous experience at the study
site of the per-animal feeding area required to allow all
troop members to access the foraging experiment (King
et al. 2008). We determined the largest individual patch
sizes by the maximum area that one camera could record
(and so the size one patch could be). The five patches
were a combination of sizes, two measuring 20 m2
(patches B and C in Fig. 1), and three measuring 80 m2
(patches A, D, and E) for the small troop, producing a
total per-animal feeding area of 8.5 m2 (280 m2 divided
by 33 animals). We kept the total per-animal feeding area
approximately constant by increasing these patch sizes to
27 and 96 m2 for the large troop, producing a total per-
animal feeding area of 8.3 m2 (342 m2 divided by 41 ani-
mals). We ran the experiment in two 14-day periods for
each troop (small troop: 6/6/10 to 19/6/10 and 12/8/10 to
25/8/10; large troop; 30/6/10 to 13/7/10 and 31/8/10 to
13/9/10). In the first period, patch food content (f in
Fig. 1) was “low” (11.4 � 0.3 g/m2, mean � SD) while
interpatch distance (d) was “short” (25 m) for the first
7 days and “long” (50 m) for the second 7 days. In the
second 14-day period, patch food content was increased
by 50% to “high” (17.1 � 0.4 g/m2) while interpatch dis-
tance was “long” for the first 7 days and “short” for the
second 7 days. The experiments were therefore run over
28 days in total, involving four different food content/in-
terpatch distance combinations, for each troop.
Experimental food patches were marked out with large
stones, painted white, and were evenly scattered with
maize kernels before dawn each morning. Panasonic
SDR-S15 video cameras (one per patch, started simulta-
neously when the first baboon was sighted and stopped
when the last baboon left the experimental patches) were
used to record all patch activity while trained observers
(one per patch) narrated the individual foragers’ identi-
ties. Patch entry and exit data were subsequently tran-
scribed from the videos to create a dataset in which each
row represented one patch visit and included the follow-
ing: the patch residency time (s), the initial food density
of the patch at the start of the experiment (g/m2), and
the number and identity of all other individuals in the
patch. Direct measures of patch depletion and the
baboons’ levels of satiation were not available. Therefore,
patch depletion was estimated as the cumulative number
of seconds any baboon had previously occupied the
patch, and level of satiation was estimated as the cumula-
tive number of seconds the focal baboon had foraged in
any patch that day (the baboons visited the experimental
patches at the start of the day before natural foraging). A
random selection of these patch visits was then selected
and, for comparability with the data recorded under nat-
ural conditions, the initial intake rate (bites in the first
ten seconds) recorded. We excluded data from day 11 of
the large troop’s experiment due an error with some
of the video cameras. Each experiment lasted a mean of
70 min per day (SD = 21, n = 56) and produced a mean of
9 � 7 h (mean � SD) of feeding behavior per individual.
4 ª 2014 The Authors. Ecology and Evolution published by John Wiley & Sons Ltd.
Environment-Dependent Social Foraging H. H. Marshall et al.
Table
1.Su
mmaryofallthevariab
lesweincluded
inouran
alyses
withdefi
nitionswherenecessary.Th
evariab
lesaredivided
into
those
variab
leswhichwereofinterest
tothisstudyan
dthose
that
wereincluded
inouran
alyses
ascontrols.Each
ofthefourmodelslistedwerefitted
separatelyto
naturalan
dexperim
entaldata.
Variable
Defi
nition
Included
inmodelsof
Aggressionrate
1
Proportionof
aggressionreceived
1
Intake
rate
2,3
Patch
residen
cytime2,3
Variablesofinterest
Ran
kPo
sitionwithin
troopdominan
cehierarchy.
SeeMethodstext
fordetailsofcalculation
Allmodels
Social
bondstrength
Meanproportionoffocalfollow
timean
individual
was
observed
ingroominginteractions
Allmodels
Social
bondbalan
ceMeanproportionoftimespen
tgroomingas
thegroomer
Allmodels
Related
ness
Meandyadic
relatednessto
allother
troopmem
bers
Allmodels
Ran
k9
Social
bondstrength
Allmodels
Ran
k9
Social
bondbalan
ceAllmodels
Ran
k9
Related
ness
Allmodels
Social
bondstrength
9Related
ness
Allmodels
Social
bondbalan
ce9
Related
ness
Allmodels
Social
bondstrength
9So
cial
bondbalan
ceAllmodels
Initialintake
rate
Number
ofbites
duringfirst10sofpatch
visit
No
No
No
Yes
Initialintake
rate
9Ran
kNo
No
No
Yes
Initialintake
rate
9So
cial
bondbalan
ceNo
No
No
Yes
Initialintake
rate
9So
cial
bondstrength
No
No
No
Experim
entonly
Controlvariab
les
Individual
Age
Ageat
thestartofthestudyperiod,estimated
bytooth
eruptionan
dwearpatterns.
SeeMethodstext.
Allmodels
Sex
Allmodels
Satiation
Cumulative
timetheindividual
had
spen
tonother
patches
priorto
visitingthecurren
tpatch
(s)
No
No
Experim
entonly
Experim
entonly
No
No
Patch
Quality
Natural:patch
surfacearea
(m2);Experim
ent:Initial
den
sity
offood(g/m
2)
No
No
Yes
Yes
Dep
letion
Cumulative
bab
oon-secondsthepatch
had
beenused
forpriorto
thecurren
tpatch
visit
No
No
Experim
entonly
Experim
entonly
Species
No
No
Naturalonly
Naturalonly
Foodhan
dlingtime
Binaryhigh/lo
w(0/1).SeeMethodstext
No
No
Naturalonly
Naturalonly
Number
ofoccupan
tsNo
No
Yes
Yes
Number
ofoccupan
ts2
No
No
Yes
Yes
Residen
cytimein
previouspatch
4No
No
No
Yes
ª 2014 The Authors. Ecology and Evolution published by John Wiley & Sons Ltd. 5
H. H. Marshall et al. Environment-Dependent Social Foraging
For our analyses, this contained 26,431 agonistic interac-
tions (645 � 471 per individual), 737 intake rates
(18 � 8), and 627 patch residency times (16 � 8) (again,
the difference in intake rate and patch residency time sam-
ple sizes being due to the availability of the explanatory
variables used in the analysis of each, see Table 1).
Individual forager characteristics
We calculated each focal animal’s dominance rank, social
bond strength, social bond balance, and genetic related-
ness to other animals in the troop. We calculated domi-
nance hierarchies from dominance interactions recorded
in the focal follows and ad libitum (in both cases, outside
of the experimental periods; nlarge = 2391, nsmall = 1931)
using Matman 1.1.4 (Noldus Information Technology
2003). Hierarchies in both troops were strongly linear
(Landau’s corrected linearity index: h’large = 0.71,
h’small = 0.82, P < 0.001 in both). As we were interested
in the effect of rank within a group, rather than differ-
ences in this effect between groups, we standardized these
hierarchies to vary between 0 (lowest ranked) and 1
(highest ranked) to control for the difference in troop
sizes. Social bond strength was measured as the mean
social bond strength across all possible dyads in the
group, where each was calculated as the proportion of anTable
1.Continued
.
Variable
Defi
nition
Included
inmodelsof
Aggressionrate
1
Proportionof
aggressionreceived
1
Intake
rate
2,3
Patch
residen
cytime2,3
Hab
itat
Meanpatch
quality
Natural:Meannumber
offooditem
sper
patch;Experim
ent:
Meanden
sity
offoodacross
totalfeed
ingarea
(g/m
2)
Allmodels
Patchden
sity
Natural:Number
ofpatches
per
km2;Experim
ent:
Inter-patch
distance
(m)
Allmodels
Ran
dom
intercep
tsincluded
inthemodels:
1Focalan
imal
ID,nestedin
troopID;2Naturalintake
andpatch
residen
cytimemodels:
focalfollow
number,nestedin
focalan
imal
IDnestedin
troop
ID;3Experim
entintake
andpatch
residen
cytimemodels:
Focalan
imal
ID,experim
entalpatch
IDan
dexperim
entday
allcross-classified
,an
dnestedin
troopID.
4Residen
cytimein
thepreviouspatch
was
included
inourmodelsonpatch
residen
cytimeas
apreviousstudyat
thissite
showed
thiscanbean
importan
tpredictor(M
arshallet
al.2013).
c
a
b
A
C
B
d
d
d
d
Patch food content = f g/m2
d
(A)
(B)
Figure 1. Schematic of the foraging experiment’s patch (A) layout
and (B) dimensions. For each troop, patch food content, f, was varied
between 11.4 � 0.3 g/m2 (low, first 14-day period) and
17.1 � 0.3 g/m2 (high, second 14-day treatment) of loose dried
maize kernels. Interpatch distance (d) was varied with each 14-day
period. In the first period, it was set at 25 m (short) for the starting
7 days and 50 m (long) for the remaining 7 days, and vice versa for
the second period. Patch size was constant within troops. Large
patches (A, D and E) were set at 80 m2 (a = 10 m, b = 10 m,
c = 6 m) for the small troop and 96 m2 (10, 12, 6) for the large
troop. Small patches (B and C) were set at 20 m2 (5, 5, 3) for the
small troop and 27 m2 (6, 6, 3) for the large troop.
6 ª 2014 The Authors. Ecology and Evolution published by John Wiley & Sons Ltd.
Environment-Dependent Social Foraging H. H. Marshall et al.
individual’s total focal time that it was observed groom-
ing in that dyad. Social bond balance was calculated as
the mean of the proportion of this grooming time with
each other group member that the individual was the
groomer minus 0.5 (to make balanced relationships equal
to 0) and so described an individual’s mean contribution
to its social relationships. A high balance score (above 0)
represented individuals who contributed a disproportion-
ate amount of grooming time which they might then be
able to exchange for reduced aggression or increased for-
aging tolerance (No€e and Hammerstein 1995; Fruteau
et al. 2009). Finally, relatedness was measured as individ-
uals’ mean relatedness coefficient (r) to all other individu-
als in the troop, which was estimated on the basis of 16
microsatellite loci using Wang’s triadic estimator (Wang
2007), see Huchard et al. (2010) for further details. Indi-
viduals’ ages were estimated from tooth eruption and
wear patterns (Kahumbu and Eley 1991; Huchard et al.
2009), except in two cases (one per troop) where the
actual birth dates were known.
Analysis
Prior to our full analysis, we verified that our experimen-
tal design had intensified feeding competition. To do this,
we compared the rates of food-related agonism individu-
als experienced in natural and experimental conditions
using a Wilcoxon signed-rank test.
We conducted our full analysis in two stages in which
we used generalized linear mixed models (GLMMs) to
compare how social traits predicted measures of individu-
als’ (1) feeding-related agonism and (2) foraging perfor-
mance, under the natural and experimental conditions.
Table 1 details the explanatory variables of interest that
we included in each model (e.g., rank, social bond
strength, social bond balance, and kinship), those that we
included as control variables (e.g., individual age, number
of patch occupants, patch species) and those that we
included as random effects (e.g., individual and group
ID). Correlations between the four social traits (rank,
social bond strength, social bond balance, and kinship)
were below the levels that Freckleton (2011) showed were
likely to lead to biased parameter estimates and inflated
variance estimates in linear model fitting (Spearman’s rho
range = �0.44 to 0.27, n = 55 individuals; within troop,
large troop: �0.44 to 0.41, n = 32, small troop: �0.48 to
0.27, n = 23). For each response variable, we fitted sepa-
rate models to data recorded under natural and experi-
mental conditions.
In the first stage of our analysis, we explored how social
traits predicted two measures of feeding-related agonism:
(i) the rate of feeding-related agonistic interactions in
which an individual was involved (calculated per month
and habitat in natural conditions and per patch configura-
tion in experimental conditions) and (ii) the proportion of
these interactions that they received. We fitted models pre-
dicting agonism rates using a compound Poisson error
structure with a log link as these data were overdispersed
and also continuous. We fitted models predicting the pro-
portion of agonism initiated using a binomial error struc-
ture and a logit link function.
In the second stage, we explored how social traits pre-
dicted individuals’ foraging performance as measured by:
(i) initial intake rate upon entering a patch and (ii) patch
residency time. We fitted models predicting initial intake
rate and patch residency time using an observation-level
random effect and a Poisson-lognormal error structure
with a log-link function (Elston et al. 2001) as both were
overdispersed.
We also explored how social traits predicted foragers’
ability to efficiently exploit the environment. To do this,
we included initial intake rate plus the interactions
between intake rate and the important variables identified
by our agonism models as fixed effects in the models of
patch residency time (see Table 1). The inclusion of ini-
tial intake rate was based on the assumption (derived
from foraging theory) that the optimal strategy for
exploiting an environment involves leaving patches once
their food content falls below a fixed threshold (Charnov
1976; Stephens and Krebs 1986). This intake rate maximi-
zation strategy should lead to a positive correlation
between initial intake rate and residency time (after con-
trolling for physical and social factors influencing differ-
ences in patch depletion rates). The inclusion of the
interaction between initial intake rate and the important
variables identified by our agonism models allows us to
consider the potential complication that using intake rate
maximization as a measure of optimality ignores other
important fitness-linked factors, such as foraging aggres-
sion. These factors are likely to vary between individuals
in social groups, influencing the maximum intake rate
they can achieve and so their ability to exploit their envi-
ronment (Nonacs 2001).
In both stages, all continuous explanatory variables
were standardized to have a mean of zero and standard
deviation of one to aid model fitting and allow the com-
parison of effect sizes (Schielzeth 2010). Model selection
for each analysis was carried out using an information-
theoretic (IT) approach which is increasingly recom-
mended over more conventional methods such as step-
wise regression or use of the full model in complex
behavioral analyses such as these (Whittingham et al.
2006; Burnham et al. 2011; Richards et al. 2011; but see
Hegyi and Garamszegi 2011; for discussion of issues in IT
model selection). For each of our models, the candidate
model set consisted of all possible combinations of the
ª 2014 The Authors. Ecology and Evolution published by John Wiley & Sons Ltd. 7
H. H. Marshall et al. Environment-Dependent Social Foraging
explanatory variables of interest detailed in Table 1. The
control variables listed in Table 1 were retained in all
candidate models. Following Burnham and Anderson
(2002), candidate models in the agonism analyses, the
first stage of our analyses, were evaluated using AICc
because n/k < 40 in all cases (where n is the number of
observations, and k is the number of parameters in the
maximal model) whereas candidate models in the forag-
ing analyses, the second stage of our analyses, were evalu-
ated using AIC because n/k > 40 in all cases. The
maximum Akaike’s model weight was relatively low in all
analyses (maximum weight = 0.24) meaning one model
from each analysis’ candidate set could not be selected
with certainty. We therefore used all-subset model averag-
ing, following Symonds and Moussalli (2011), to calculate
a final model for each analysis. We interpreted the influ-
ence of each variable on the basis of both their parameter
estimate (and associated confidence interval) and Akaike’s
variable importance.
All analyses were performed in R version 3.02 (R Core
Team 2013) using the cplm package version 0.7–2 to fit
compound Poisson models (Zhang 2014), the lme4 pack-
age version 1.1–7 to fit all other GLMMs (Bates et al.
2014) and the MuMIn package version 1.10.5 for model
averaging (Barton 2014).
Results
The rate of agonism experienced by baboons in natural
foraging conditions (median = 0.030 interactions/minute,
interquartile range = 0.021–0.041, n = 54 individuals) was
lower than in experimental conditions (1.37 interactions/
minute, 0.83–1.76, n = 41 individuals; paired Wilcoxon
signed-rank test W = 861, P < 0.0001, n = 41). The rate
of agonism under natural conditions were comparable to
rates of baboon foraging competition under natural con-
ditions reported elsewhere (e.g., Shopland 1987: 0.145
interactions per minute; Barton 1993: 0.002–0.023; Barrettet al. 2002: 0.012–0.037). The higher rate of agonism
under experimental conditions confirmed that we had
successfully manipulated the level of foraging competition
and bore comparison with rates of competition recorded
at artificially clumped food resources in baboons (Barton
1993: 0.048–0.89 interactions per minute).
Feeding-related agonism
The first stage of our analysis explored how social traits
predicted measures of feeding-related agonism in each
environment (Tables 2 and 3). The rate of agonism indi-
viduals experienced increased with dominance rank under
natural conditions (Fig. 2A) but rank only had a weak
(and negative) effect in the experiment (Table 2). Instead,
the rate of agonism experienced in the experiment was
most strongly predicted by an individual’s social bond
strength (Table 2): individuals who spent more time in
grooming bouts with social partners experienced lower
rates of agonism (Fig. 2B).
The proportion of agonistic interactions that individu-
als received ranged from 0 to 1 (median = 0.59, n = 54)
in natural conditions and from 0.04 to 0.99
(median = 0.53, n = 41) in experimental conditions.
Table 2. All-subset averaged models describing the predictors of the rate of agonism individuals experienced in natural and experimental foraging
conditions. Importance is measured by Akaike’s variable weight.
Fixed effects
Natural Experimental
Coefficient Upper C.I. Lower C.I. Importance Coefficient Upper C.I. Lower C.I. Importance
(Intercept) �3.34 �3.68 �3.01 0.70 0.27 1.13
Rank 0.20 0.06 0.33 0.97 �0.12 �0.26 0.02 0.65
Social bond strength �0.05 �0.23 0.14 0.44 �0.23 �0.44 �0.02 0.81
Social bond balance �0.04 �0.18 0.10 0.51 0.04 �0.19 0.27 0.38
Relatedness �0.06 �0.17 0.05 0.57 0.05 �0.07 0.18 0.43
Rank 9 Social bond strength �0.02 �0.16 0.12 0.11 0.00 �0.14 0.14 0.12
Rank 9 Social bond balance 0.09 �0.03 0.20 0.24 0.07 �0.08 0.22 0.07
Rank 9 Relatedness �0.07 �0.18 0.05 0.22 0.02 �0.10 0.14 0.06
Social Bond Strength 9 Relatedness �0.03 �0.15 0.09 0.08 �0.05 �0.17 0.07 0.10
Social Bond Balance 9 Relatedness 0.01 �0.11 0.14 0.08 0.03 �0.10 0.15 0.04
Social bond strength 9 Social
bond balance
�0.01 �0.16 0.14 0.06 �0.04 �0.20 0.13 0.08
Age �0.01 �0.04 0.03 �0.05 �0.09 0.00
Sex (male)1 0.24 �0.14 0.62 �0.22 �0.74 0.31
Mean patch quality �0.01 �0.12 0.11 �0.21 �0.30 �0.12
Patch density �0.15 �0.27 �0.04 �0.06 �0.14 0.02
1Reference category = female; Bold variables are those with an importance ≥0.80 and confidence intervals that do not cross zero.
8 ª 2014 The Authors. Ecology and Evolution published by John Wiley & Sons Ltd.
Environment-Dependent Social Foraging H. H. Marshall et al.
Higher-ranked animals were less likely to be the recipients
of agonistic interactions in both conditions, but in both
cases an individual’s social bonds mediated this relation-
ship (Table 3). In natural conditions, high social bond
balance reduced the probability of low-ranked animals
receiving agonism and increased it for high-ranked ani-
mals; however, the size and importance of this effect was
moderate (Table 3; Fig. 3A). The effect of social bond
balance was similar but stronger and more important in
the experiment (Table 3; Fig. 3B). Social bond strength
also mediated the effect of rank on the probability of
receiving agonism, but only in the experiment. In this
case, high social bond strength increased the probability
of low-ranked animals receiving agonism but reduced it
in high-ranked animals (Fig. 3C).
Foraging performance
The second stage of our analysis explored how social
traits predicted individual foraging performance in each
environment (Tables 4 and 5). The baboons experienced
median intake rates of 3 bites/10 s (interquartile
range = 2–6, n = 2106) in natural conditions and 4 bites/
10 s (1–9, n = 737) in experimental conditions. Social
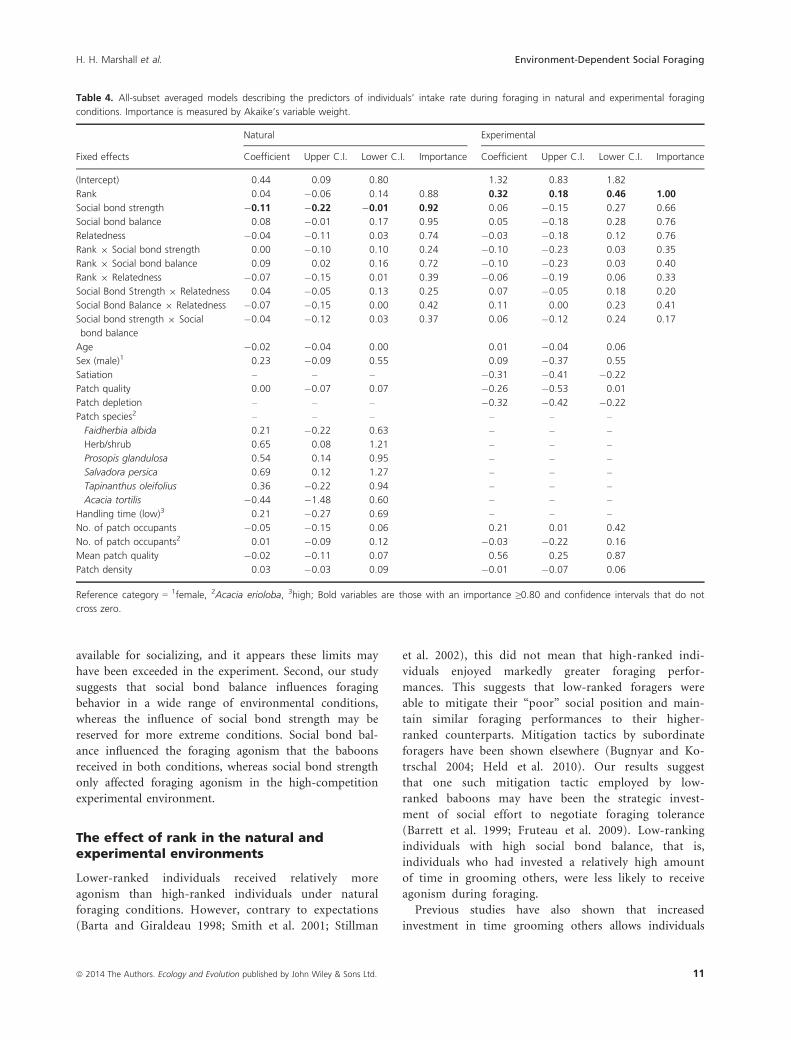
bond balance and strength were both important predic-
tors of intake rates in natural conditions (Table 4).
Table 3. All-subset averaged models describing the predictors of proportion of agonism during foraging that individuals received during foraging
in natural and experimental foraging conditions. Importance is measured by Akaike’s variable weight.
Fixed effects
Natural Experimental
Coefficient Upper C.I. Lower C.I. Importance Coefficient Upper C.I. Lower C.I. Importance
(Intercept) 0.48 �0.31 1.27 0.01 �0.91 0.93
Rank �1.32 �1.64 �0.99 1.00 �1.37 �1.66 �1.09 1.00
Social bond strength �0.07 �0.49 0.34 0.45 0.22 �0.18 0.62 0.97
Social bond balance 0.05 �0.30 0.39 0.87 �0.12 �0.58 0.33 1.00
Relatedness �0.07 �0.31 0.17 0.51 �0.21 �0.44 0.03 0.73
Rank 9 Social bond strength 0.02 �0.35 0.39 0.12 �0.53 �0.84 �0.22 0.95
Rank 9 Social bond balance 0.41 0.11 0.71 0.80 0.81 0.47 1.16 1.00
Rank 9 Relatedness 0.16 �0.13 0.45 0.19 �0.13 �0.40 0.13 0.25
Social Bond Strength 9 Relatedness 0.11 �0.16 0.37 0.08 0.10 �0.14 0.35 0.21
Social Bond Balance 9 Relatedness 0.07 �0.22 0.37 0.13 �0.08 �0.37 0.21 0.19
Social bond strength 9 Social
bond balance
0.10 �0.23 0.42 0.11 �0.04 �0.48 0.39 0.24
Age �0.02 �0.10 0.06 0.03 �0.06 0.12
Sex (male)1 0.19 �0.73 1.11 �0.09 �1.06 0.89
Mean patch quality �0.25 �0.44 �0.07 �0.20 �0.23 �0.16
Patch density �0.24 �0.43 �0.04 �0.04 �0.07 �0.01
1Reference category = female; Bold variables are those with an importance ≥0.80 and confidence intervals that do not cross zero.
Rank
Rat
e of
ago
nism
(int
erac
tions
/min
ute)
−1.5 −0.5 0.5 1.5
0.00
0.04
0.08
0.12
Natural
Social bond strength−1 0 1 2
1
2
3
Experiment(A) (B)
Figure 2. The effect of individuals’ rank in
natural conditions (A) and social bond strength
in experimental conditions (B) on the rate of
agonism they experienced. In all plots, the
points are median values for each individual
(calculated from the repeated measures in the
data for illustrative purposes) and the lines are
the predicted relationships from each model
(see Table 2). Values on the x-axes were
standardized to have a mean of zero and
standard deviation of one before model fitting.
ª 2014 The Authors. Ecology and Evolution published by John Wiley & Sons Ltd. 9
H. H. Marshall et al. Environment-Dependent Social Foraging
Individuals with high social bond balance experienced
higher intake rates (Fig. 4A), but individuals with high
social bond strength experienced lower intake rates
(Fig. 4B). Rank also weakly predicted intake rates in natu-
ral conditions (Table 4), with higher-ranked individuals
experiencing slightly higher intake rates (Fig. 4C). How-
ever, although important, the effect sizes of rank and
social bonds strength and social bond balance were small
and the confidence intervals associated with the effects of
rank and social bond balance crossed zero (Table 4). In
contrast, in the experiment rank was an important and
strong predictor of intake rates (Table 4), with higher-
ranked individuals experiencing considerably higher
intake rates here (Fig. 4D).
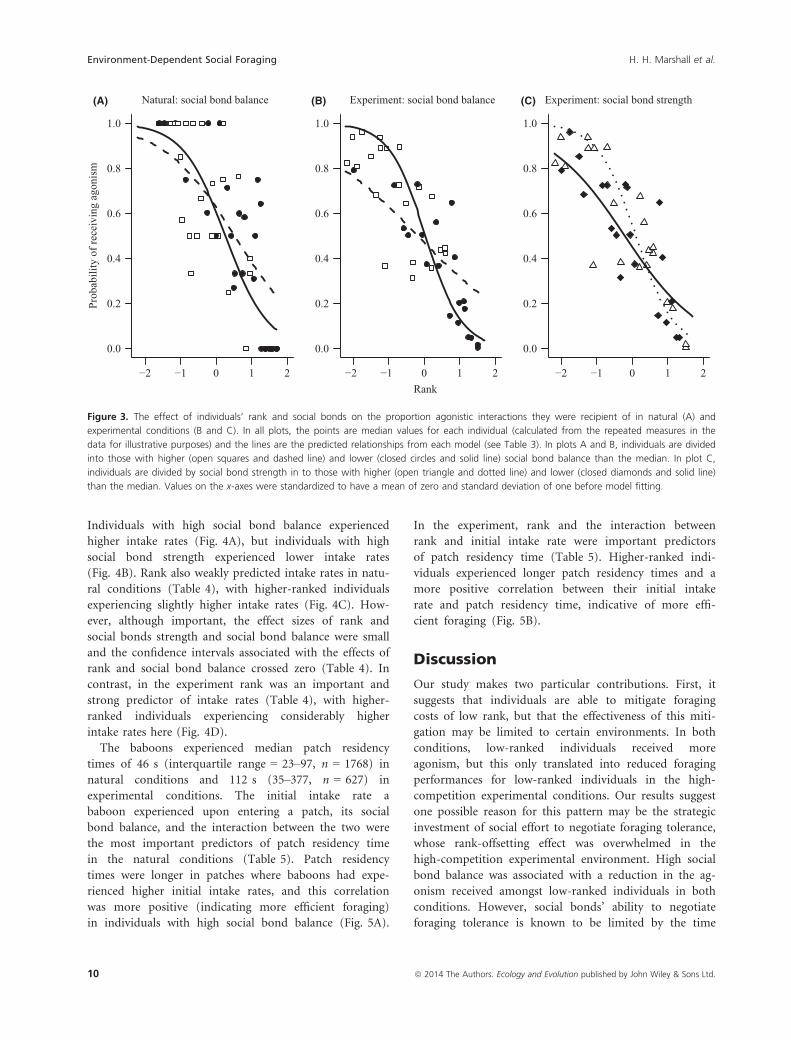
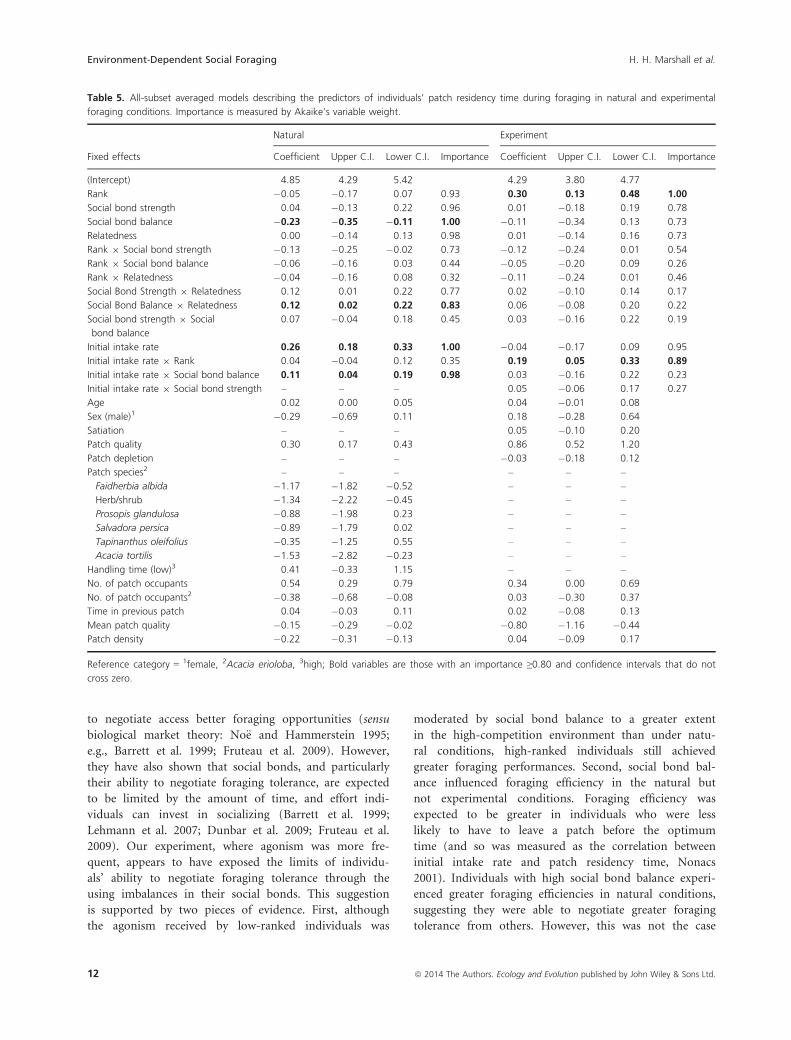
The baboons experienced median patch residency
times of 46 s (interquartile range = 23–97, n = 1768) in
natural conditions and 112 s (35–377, n = 627) in
experimental conditions. The initial intake rate a
baboon experienced upon entering a patch, its social
bond balance, and the interaction between the two were
the most important predictors of patch residency time
in the natural conditions (Table 5). Patch residency
times were longer in patches where baboons had expe-
rienced higher initial intake rates, and this correlation
was more positive (indicating more efficient foraging)
in individuals with high social bond balance (Fig. 5A).
In the experiment, rank and the interaction between
rank and initial intake rate were important predictors
of patch residency time (Table 5). Higher-ranked indi-
viduals experienced longer patch residency times and a
more positive correlation between their initial intake
rate and patch residency time, indicative of more effi-
cient foraging (Fig. 5B).
Discussion
Our study makes two particular contributions. First, it
suggests that individuals are able to mitigate foraging
costs of low rank, but that the effectiveness of this miti-
gation may be limited to certain environments. In both
conditions, low-ranked individuals received more
agonism, but this only translated into reduced foraging
performances for low-ranked individuals in the high-
competition experimental conditions. Our results suggest
one possible reason for this pattern may be the strategic
investment of social effort to negotiate foraging tolerance,
whose rank-offsetting effect was overwhelmed in the
high-competition experimental environment. High social
bond balance was associated with a reduction in the ag-
onism received amongst low-ranked individuals in both
conditions. However, social bonds’ ability to negotiate
foraging tolerance is known to be limited by the time
−2 −1 −2 −10 1 2
Prob
abili
ty o
f rec
eivi
ng a
goni
sm
0.0
0.2
0.4
0.6
0.8
1.0
Natural: social bond balance
0 1 2Rank
0.0
0.2
0.4
0.6
0.8
1.0
Experiment: social bond balance
−2 −1 0 1 2
0.0
0.2
0.4
0.6
0.8
1.0
Experiment: social bond strength(A) (B) (C)
Figure 3. The effect of individuals’ rank and social bonds on the proportion agonistic interactions they were recipient of in natural (A) and
experimental conditions (B and C). In all plots, the points are median values for each individual (calculated from the repeated measures in the
data for illustrative purposes) and the lines are the predicted relationships from each model (see Table 3). In plots A and B, individuals are divided
into those with higher (open squares and dashed line) and lower (closed circles and solid line) social bond balance than the median. In plot C,
individuals are divided by social bond strength in to those with higher (open triangle and dotted line) and lower (closed diamonds and solid line)
than the median. Values on the x-axes were standardized to have a mean of zero and standard deviation of one before model fitting.
10 ª 2014 The Authors. Ecology and Evolution published by John Wiley & Sons Ltd.
Environment-Dependent Social Foraging H. H. Marshall et al.
available for socializing, and it appears these limits may
have been exceeded in the experiment. Second, our study
suggests that social bond balance influences foraging
behavior in a wide range of environmental conditions,
whereas the influence of social bond strength may be
reserved for more extreme conditions. Social bond bal-
ance influenced the foraging agonism that the baboons
received in both conditions, whereas social bond strength
only affected foraging agonism in the high-competition
experimental environment.
The effect of rank in the natural andexperimental environments
Lower-ranked individuals received relatively more
agonism than high-ranked individuals under natural
foraging conditions. However, contrary to expectations
(Barta and Giraldeau 1998; Smith et al. 2001; Stillman
et al. 2002), this did not mean that high-ranked indi-
viduals enjoyed markedly greater foraging perfor-
mances. This suggests that low-ranked foragers were
able to mitigate their “poor” social position and main-
tain similar foraging performances to their higher-
ranked counterparts. Mitigation tactics by subordinate
foragers have been shown elsewhere (Bugnyar and Ko-
trschal 2004; Held et al. 2010). Our results suggest
that one such mitigation tactic employed by low-
ranked baboons may have been the strategic invest-
ment of social effort to negotiate foraging tolerance
(Barrett et al. 1999; Fruteau et al. 2009). Low-ranking
individuals with high social bond balance, that is,
individuals who had invested a relatively high amount
of time in grooming others, were less likely to receive
agonism during foraging.
Previous studies have also shown that increased
investment in time grooming others allows individuals
Table 4. All-subset averaged models describing the predictors of individuals’ intake rate during foraging in natural and experimental foraging
conditions. Importance is measured by Akaike’s variable weight.
Fixed effects
Natural Experimental
Coefficient Upper C.I. Lower C.I. Importance Coefficient Upper C.I. Lower C.I. Importance
(Intercept) 0.44 0.09 0.80 1.32 0.83 1.82
Rank 0.04 �0.06 0.14 0.88 0.32 0.18 0.46 1.00
Social bond strength �0.11 �0.22 �0.01 0.92 0.06 �0.15 0.27 0.66
Social bond balance 0.08 �0.01 0.17 0.95 0.05 �0.18 0.28 0.76
Relatedness �0.04 �0.11 0.03 0.74 �0.03 �0.18 0.12 0.76
Rank 9 Social bond strength 0.00 �0.10 0.10 0.24 �0.10 �0.23 0.03 0.35
Rank 9 Social bond balance 0.09 0.02 0.16 0.72 �0.10 �0.23 0.03 0.40
Rank 9 Relatedness �0.07 �0.15 0.01 0.39 �0.06 �0.19 0.06 0.33
Social Bond Strength 9 Relatedness 0.04 �0.05 0.13 0.25 0.07 �0.05 0.18 0.20
Social Bond Balance 9 Relatedness �0.07 �0.15 0.00 0.42 0.11 0.00 0.23 0.41
Social bond strength 9 Social
bond balance
�0.04 �0.12 0.03 0.37 0.06 �0.12 0.24 0.17
Age �0.02 �0.04 0.00 0.01 �0.04 0.06
Sex (male)1 0.23 �0.09 0.55 0.09 �0.37 0.55
Satiation – – – �0.31 �0.41 �0.22
Patch quality 0.00 �0.07 0.07 �0.26 �0.53 0.01
Patch depletion – – – �0.32 �0.42 �0.22
Patch species2 – – – – – –
Faidherbia albida 0.21 �0.22 0.63 – – –
Herb/shrub 0.65 0.08 1.21 – – –
Prosopis glandulosa 0.54 0.14 0.95 – – –
Salvadora persica 0.69 0.12 1.27 – – –
Tapinanthus oleifolius 0.36 �0.22 0.94 – – –
Acacia tortilis �0.44 �1.48 0.60 – – –
Handling time (low)3 0.21 �0.27 0.69 – – –
No. of patch occupants �0.05 �0.15 0.06 0.21 0.01 0.42
No. of patch occupants2 0.01 �0.09 0.12 �0.03 �0.22 0.16
Mean patch quality �0.02 �0.11 0.07 0.56 0.25 0.87
Patch density 0.03 �0.03 0.09 �0.01 �0.07 0.06
Reference category = 1female, 2Acacia erioloba, 3high; Bold variables are those with an importance ≥0.80 and confidence intervals that do not
cross zero.
ª 2014 The Authors. Ecology and Evolution published by John Wiley & Sons Ltd. 11
H. H. Marshall et al. Environment-Dependent Social Foraging
to negotiate access better foraging opportunities (sensu
biological market theory: No€e and Hammerstein 1995;
e.g., Barrett et al. 1999; Fruteau et al. 2009). However,
they have also shown that social bonds, and particularly
their ability to negotiate foraging tolerance, are expected
to be limited by the amount of time, and effort indi-
viduals can invest in socializing (Barrett et al. 1999;
Lehmann et al. 2007; Dunbar et al. 2009; Fruteau et al.
2009). Our experiment, where agonism was more fre-
quent, appears to have exposed the limits of individu-
als’ ability to negotiate foraging tolerance through the
using imbalances in their social bonds. This suggestion
is supported by two pieces of evidence. First, although
the agonism received by low-ranked individuals was
moderated by social bond balance to a greater extent
in the high-competition environment than under natu-
ral conditions, high-ranked individuals still achieved
greater foraging performances. Second, social bond bal-
ance influenced foraging efficiency in the natural but
not experimental conditions. Foraging efficiency was
expected to be greater in individuals who were less
likely to have to leave a patch before the optimum
time (and so was measured as the correlation between
initial intake rate and patch residency time, Nonacs
2001). Individuals with high social bond balance experi-
enced greater foraging efficiencies in natural conditions,
suggesting they were able to negotiate greater foraging
tolerance from others. However, this was not the case
Table 5. All-subset averaged models describing the predictors of individuals’ patch residency time during foraging in natural and experimental
foraging conditions. Importance is measured by Akaike’s variable weight.
Fixed effects
Natural Experiment
Coefficient Upper C.I. Lower C.I. Importance Coefficient Upper C.I. Lower C.I. Importance
(Intercept) 4.85 4.29 5.42 4.29 3.80 4.77
Rank �0.05 �0.17 0.07 0.93 0.30 0.13 0.48 1.00
Social bond strength 0.04 �0.13 0.22 0.96 0.01 �0.18 0.19 0.78
Social bond balance �0.23 �0.35 �0.11 1.00 �0.11 �0.34 0.13 0.73
Relatedness 0.00 �0.14 0.13 0.98 0.01 �0.14 0.16 0.73
Rank 9 Social bond strength �0.13 �0.25 �0.02 0.73 �0.12 �0.24 0.01 0.54
Rank 9 Social bond balance �0.06 �0.16 0.03 0.44 �0.05 �0.20 0.09 0.26
Rank 9 Relatedness �0.04 �0.16 0.08 0.32 �0.11 �0.24 0.01 0.46
Social Bond Strength 9 Relatedness 0.12 0.01 0.22 0.77 0.02 �0.10 0.14 0.17
Social Bond Balance 9 Relatedness 0.12 0.02 0.22 0.83 0.06 �0.08 0.20 0.22
Social bond strength 9 Social
bond balance
0.07 �0.04 0.18 0.45 0.03 �0.16 0.22 0.19
Initial intake rate 0.26 0.18 0.33 1.00 �0.04 �0.17 0.09 0.95
Initial intake rate 9 Rank 0.04 �0.04 0.12 0.35 0.19 0.05 0.33 0.89
Initial intake rate 9 Social bond balance 0.11 0.04 0.19 0.98 0.03 �0.16 0.22 0.23
Initial intake rate 9 Social bond strength – – – 0.05 �0.06 0.17 0.27
Age 0.02 0.00 0.05 0.04 �0.01 0.08
Sex (male)1 �0.29 �0.69 0.11 0.18 �0.28 0.64
Satiation – – – 0.05 �0.10 0.20
Patch quality 0.30 0.17 0.43 0.86 0.52 1.20
Patch depletion – – – �0.03 �0.18 0.12
Patch species2 – – – – – –
Faidherbia albida �1.17 �1.82 �0.52 – – –
Herb/shrub �1.34 �2.22 �0.45 – – –
Prosopis glandulosa �0.88 �1.98 0.23 – – –
Salvadora persica �0.89 �1.79 0.02 – – –
Tapinanthus oleifolius �0.35 �1.25 0.55 – – –
Acacia tortilis �1.53 �2.82 �0.23 – – –
Handling time (low)3 0.41 �0.33 1.15 – – –
No. of patch occupants 0.54 0.29 0.79 0.34 0.00 0.69
No. of patch occupants2 �0.38 �0.68 �0.08 0.03 �0.30 0.37
Time in previous patch 0.04 �0.03 0.11 0.02 �0.08 0.13
Mean patch quality �0.15 �0.29 �0.02 �0.80 �1.16 �0.44
Patch density �0.22 �0.31 �0.13 0.04 �0.09 0.17
Reference category = 1female, 2Acacia erioloba, 3high; Bold variables are those with an importance ≥0.80 and confidence intervals that do not
cross zero.
12 ª 2014 The Authors. Ecology and Evolution published by John Wiley & Sons Ltd.
Environment-Dependent Social Foraging H. H. Marshall et al.
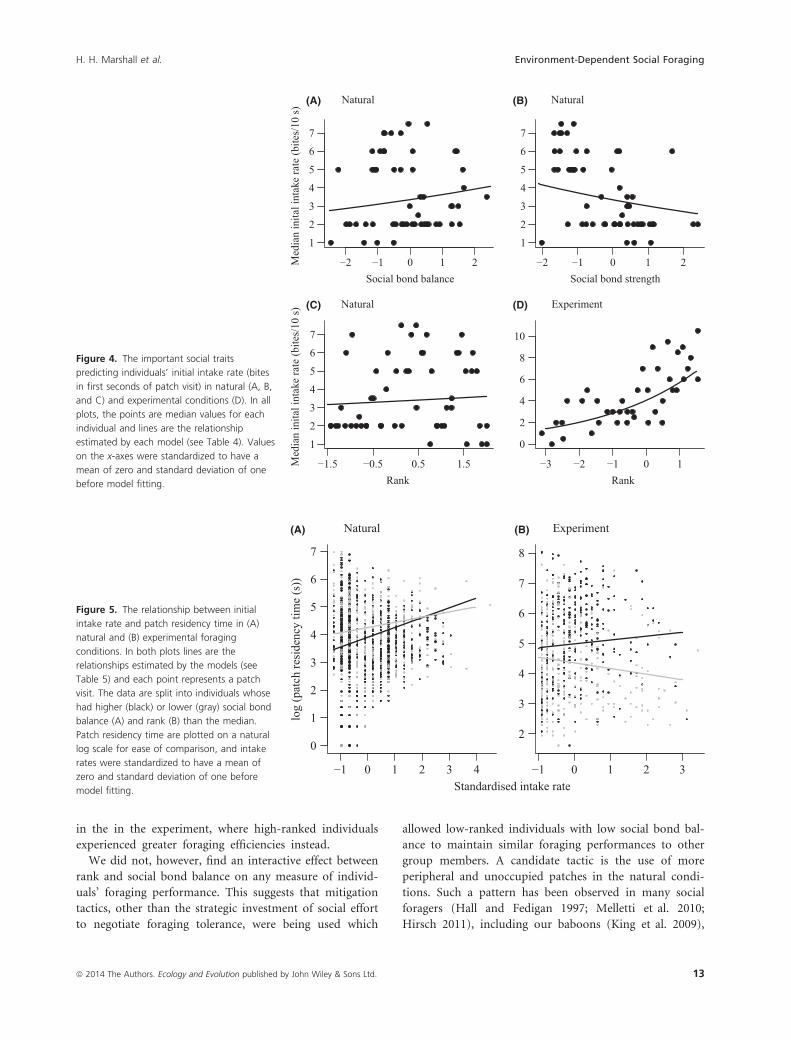
in the in the experiment, where high-ranked individuals
experienced greater foraging efficiencies instead.
We did not, however, find an interactive effect between
rank and social bond balance on any measure of individ-
uals’ foraging performance. This suggests that mitigation
tactics, other than the strategic investment of social effort
to negotiate foraging tolerance, were being used which
allowed low-ranked individuals with low social bond bal-
ance to maintain similar foraging performances to other
group members. A candidate tactic is the use of more
peripheral and unoccupied patches in the natural condi-
tions. Such a pattern has been observed in many social
foragers (Hall and Fedigan 1997; Melletti et al. 2010;
Hirsch 2011), including our baboons (King et al. 2009),
−2 −1 0 1 2Social bond balance
Med
ian
inita
l int
ake
rate
(bite
s/10
s)
1
2
3
4
5
6
7
Natural
−2 −1 0 1 2Social bond strength
1
2
3
4
5
6
7
Natural
−1.5 −0.5 0.5 1.5Rank Rank
Med
ian
inita
l int
ake
rate
(bite
s/10
s)
1
2
3
4
5
6
7
Natural
−3 −2 −1 0 1
0
2
4
6
8
10
Experiment
(A) (B)
(D)(C)
Figure 4. The important social traits
predicting individuals’ initial intake rate (bites
in first seconds of patch visit) in natural (A, B,
and C) and experimental conditions (D). In all
plots, the points are median values for each
individual and lines are the relationship
estimated by each model (see Table 4). Values
on the x-axes were standardized to have a
mean of zero and standard deviation of one
before model fitting.
−1 0 1 2 3 4
log
(pat
ch re
side
ncy
time
(s))
0
1
2
3
4
5
6
7
Natural
−1 0 1 2 3
2
3
4
5
6
7
8
Experiment
Standardised intake rate
(A) (B)
Figure 5. The relationship between initial
intake rate and patch residency time in (A)
natural and (B) experimental foraging
conditions. In both plots lines are the
relationships estimated by the models (see
Table 5) and each point represents a patch
visit. The data are split into individuals whose
had higher (black) or lower (gray) social bond
balance (A) and rank (B) than the median.
Patch residency time are plotted on a natural
log scale for ease of comparison, and intake
rates were standardized to have a mean of
zero and standard deviation of one before
model fitting.
ª 2014 The Authors. Ecology and Evolution published by John Wiley & Sons Ltd. 13
H. H. Marshall et al. Environment-Dependent Social Foraging
and would allow these individuals to reduce the foraging
competition they experienced but also comes with costs
such as increased predation risk and reduced access to
social information (Hirsch 2007; Morrell and Romey
2008; Rieucau and Giraldeau 2011). Resources in the
experimental environment were spatially clumped in only
five patches, and so there was no opportunity for individ-
uals to offset the foraging costs of low rank through the
use of more peripheral or unoccupied patches. Therefore,
similarly to the strategic investment of social effort by
low-ranked individuals, it would be expected that this
mitigation tactic would also have been overwhelmed in
the experiment.
An alternative explanation to the use of mitigation tac-
tics to offset the foraging costs of low rank may be that
in the natural environment foraging costs were low,
meaning there were few or no disadvantages of being
low-ranked for individuals to offset. However, we con-
sider this scenario unlikely as our results show there were
strong rank effects on the agonism individuals experi-
enced during foraging, the levels of agonism we recorded
are comparable to other baboon systems where foraging
costs of low rank have been demonstrated (e.g., Barrett
et al. 2002), and these costs have also been demonstrated
previously in our system (King et al. 2009; Marshall et al.
2012b).
Increased spatial clumping of resources (in this case,
from natural foraging to experimental foraging condi-
tions) can lead to increases in foraging competition, of
which low-ranked foragers disproportionately bear the
costs (birds: Stillman et al. 1996; Vahl et al. 2005; pri-
mates: Barrett et al. 2002; King et al. 2009). However, it
is worth noting that these foraging benefits of high rank
may be associated with other costs. For example, in our
study high-ranked individuals may have experienced a
greater risk of injury and higher energetic costs as a
result of the receiving proportionally less (and so initiat-
ing more) agonism in both conditions, and being
involved in higher overall rates of agonism in the natural
conditions. Nonetheless, rank has also been shown to
have a more pronounced positive effect on reproductive
success during periods of low resource availability, both
in baboons (Altmann and Alberts 2003) and other spe-
cies (e.g., Nichols et al. 2012; reviewed by Clutton-Brock
and Huchard 2013), and good quality social bonds can
offset the negative effects of low rank on an individual’s
longevity (Silk et al. 2010b). This growing body of evi-
dence suggests that tactics through which individuals can
offset the negative fitness effects of low rank, such as the
strategic investment of social effort or the inferred use
of unoccupied patches, do exist and are adaptive, but
that their offsetting ability is limited to certain environ-
mental conditions.
Such environment-dependent tactics may also help to
explain why seasonal variation in resource distribution
and foraging competition can lead to transient advantages
for high-ranked foragers (Barrett et al. 2002; Stillman
et al. 2002). Indeed, where natural environmental varia-
tion is lower, tactics that offset the foraging costs of low
rank may be difficult to detect as they are rarely over-
whelmed. However, our findings indicate that where food
distributions remain concentrated over longer periods,
low-ranked individuals may have to persistently bear the
costs of increased competition with implications for their
fitness and, ultimately, the profitability of remaining a
member of the social group. Where such resource distri-
butions occur in natural environments, these costs may
lead to low-ranked individuals needing to spend more
time foraging, restricting the time available for other
activities such as socializing below critical minimum lim-
its (Dunbar 1992; Dunbar et al. 2009). Changes in indi-
vidual time budgets are likely to have group-level
consequences (Marshall et al. 2012a) and are thought to
contribute to the existence of a maximum tolerable group
size an environment can support or, where this ecological
maximum is less than the minimum size needed for a
group to function, the absence of a species from that envi-
ronment (Dunbar 1992; Courchamp et al. 1999; Dunbar
et al. 2009). Consequently, where anthropogenic impacts
such as climate change-induced environmental extremes
or urbanization cause a similar consistent concentration
of resources, the persistently increased foraging costs on
low-ranked individuals that this produces are likely to
cause either a reduction in group size or a local extinction
of the species from that area.
The comparative effect of social bondbalance and strength in the natural andexperimental conditions
Our study found differences in the comparative effect
of social bond balance and social bond strength on for-
aging agonism between the natural and experimental
environments. Whilst social bond balance was associated
with the foraging agonism in both environments (as
discussed above), social bond strength only influenced
foraging agonism in the higher-competition experiment.
Here, strong social bonds were associated with (1)
reduced overall rates of agonism and (2) in low-ranked
individuals, the receipt of a greater proportion of these
agonistic interactions. This suggests (1) that the main
benefit of strong social bonds in the high-competition
experimental environment was in lowering the overall
level of agonism an individual was involved in. It also
perhaps suggests (2) that low-ranked individuals with
strong social bonds may have benefited by dispropor-
14 ª 2014 The Authors. Ecology and Evolution published by John Wiley & Sons Ltd.
Environment-Dependent Social Foraging H. H. Marshall et al.
tionately reducing the amount of agonism they initi-
ated, so leading to an increased proportion of agonism
received, albeit at a lower rate overall.
The adaptive role of social bonds has been the subject
of considerable research effort (Silk 2007; Henzi and For-
shaw 2013) and has resulted in two alternative perspec-
tives. Some studies suggest that short-term imbalances in
social bonds (in this study “social bond balance”) are
traded for commodities such as foraging tolerance in a
biological market (Barrett et al. 1999; Fruteau et al. 2009;
Tiddi et al. 2011). Other studies, however, suggest that
individuals preferentially exchange tolerance with group
members with whom they hold long-term social bonds
(in this study “social bond strength”) (Crockford et al.
2008; Frank and Silk 2009; Silk et al. 2010a). Our find-
ings may hint at a reconciliation between these two per-
spectives, supporting a previous study suggesting they
need not be mutually exclusive (Silk et al. 2010a). In
most conditions, such as our natural environment, short-
term imbalances in social bonds may provide enough
negotiating power to offset any foraging costs of low
rank. This could explain why, in the short term (within
years), an individuals’ relative contribution to its social
relationships often varies considerably, and the identity of
some social partners can be quite changeable between
years (Gomes et al. 2009; Henzi et al. 2009; Silk et al.
2012). The main function of these relationships may be
to negotiate access to resources, such as food in this
study. Indeed, a recent study at our site has found that
individuals’ grooming contributions can vary strategically
across a day (Sick et al. 2014). In contrast, the role of
maintaining long-term (across years) and balanced rela-
tionships with other individuals may be to provide social
support over longer time scales (Gomes et al. 2009; Silk
et al. 2010a, 2012), with these relationships only exploited
to provide short-term tolerance when the negotiating
power of short-term relationships is exhausted, such as
during periods of high foraging competition as in the
experimental conditions.
Our finding that individuals with strong social bonds
were associated with lower initial intake rates under natu-
ral conditions is surprising and contradicts previous stud-
ies which have generally found a positive effect of social
bonds on foraging behavior (e.g., Fruteau et al. 2009;
King et al. 2009). This effect may be because we were
only able to measure intake rates at the start of a patch
visit when foragers would be collecting social and per-
sonal information about the patch’s quality (Dall et al.
2005). The access and use of social information has been
linked to individuals’ social bonds (Voelkl and No€e 2008;
Aplin et al. 2012). Individuals with strong social bonds
may have been monitoring other patch occupants’ behav-
ior and so reducing their initial intake rate. Individuals
with weaker social bonds may have been relying more on
personal information about the patch quality, which they
would have collecting through directly sampling it. It may
be that social bond balance did not have a similar effect
on initial intake rates in natural conditions as its main
role is in negotiating foraging tolerance rather than gain-
ing access to social information (and so had a weakly
positive effect in initial intake rates).
Conclusion
This study highlights that the effect of social traits such as
rank and social bonds on individuals’ foraging behavior
can depend on environmental conditions. It suggests that
mitigation tactics may allow individuals to offset the for-
aging costs of low rank and that the strategic investment
of social effort to negotiate foraging tolerance and the
possible use of peripheral food patches may be ways indi-
viduals achieve this. However, it appears that where
resources are concentrated creating particularly intense
competition, perhaps due to high levels of seasonality,
extreme climatic events or anthropogenic environmental
change, the limits of these mitigation tactics can be
exceeded, resulting in reduced foraging performances for
low-ranked individuals.
Acknowledgments
Thanks to Alan Cowlishaw, Ailsa Henderson, Matt Holmes,
James McKenna, Katherine Moul, Yuan Pan, Gordon Pear-
son, and Jonathan Usherwood for assistance with data col-
lection, and Tim Coulson, E.J. Milner-Gulland, Hannah
Peck, Richard Stillman, and six anonymous reviewers for
comments on the manuscript. Permission to work at the
field site was kindly granted by the Ministry of Lands and
Resettlement (Tsaobis Leopard Park) and the Snyman and
Wittreich families (surrounding farms). We also thank the
Gobabeb Training and Research Centre for affiliation and
the Ministry of Environment and Tourism for research per-
mission in Namibia. This study adhered to the Guidelines
for the Use of Animal Behaviour for Research and Teaching
(Animal Behaviour 2012. 83:301–309), was approved by the
Ethics Committee of the Zoological Society of London, and
was carried out with the permission of the Namibian Min-
istry for Environment and Tourism (permit no. 1486/
2010). H.H.M. was supported by a NERC Open CASE Stu-
dentship (NE/F013442/1) with ZSL as CASE partner. A.J.C.
was supported by a Fenner School of Environment and
Society Studentship and grants from the Leakey Founda-
tion, the Animal Behavior Society (USA), the International
Primatological Society, and the Explorers Club Exploration
Fund. This manuscript is a publication of the ZSL Institute
of Zoology’s Tsaobis Baboon Project.
ª 2014 The Authors. Ecology and Evolution published by John Wiley & Sons Ltd. 15
H. H. Marshall et al. Environment-Dependent Social Foraging
Conflict of Interest
None declared.
References
Alberts, S. C., J. A. Hollister-Smith, R. S. Mututua, S. N.
Sayialel, P. M. Muruthi, J. K. Warutere, et al. 2005.
Seasonality and long-term change in a savannah
environment. Pp. 157–196 in D. K. Brockman and C. P. van
Schaik, eds. Seasonality in primates: studies of living and
extinct human and non-human primates. Cambridge
University Press, Cambridge.
Altmann, J. 1974. Observational study of behavior: sampling
methods. Behaviour 49:227–267.Altmann, J., and S. C. Alberts. 2003. Variability in
reproductive success viewed from a life-history perspective
in baboons. Am. J. Hum. Biol. 15:401–409.
Ameca y Ju�arez, E. I., G. M. Mace, G. Cowlishaw, and N.
Pettorelli. 2012. Natural population die-offs: causes and
consequences for terrestrial mammals. Trends Ecol. Evol.
27:272–277.
Aplin, L. M., D. R. Farine, J. Morand-Ferron, and B. C.
Sheldon. 2012. Social networks predict patch discovery in a
wild population of songbirds. Proc. Biol. Sci. 279:4199–4205.
Barrett, L., S. P. Henzi, T. Weingrill, J. E. Lycett, and R. A.
Hill. 1999. Market forces predict grooming reciprocity in
female baboons. Proc. Biol. Sci. 266:665–670.Barrett, L., D. Gaynor, and S. P. Henzi. 2002. A dynamic
interaction between aggression and grooming reciprocity
among female chacma baboons. Anim. Behav. 63:1047–1053.
Barta, Z., and L.-A. Giraldeau. 1998. The effect of dominance
hierarchy on the use of alternative foraging tactics: a
phenotype-limited producing-scrounging game. Behav. Ecol.
Sociobiol. 42:217–223.
Barton, R. 1993. Sociospatial mechanisms of feeding
competition in female olive baboons, Papio anubis. Anim.
Behav. 46:791–802.Barton, K. 2014. MuMIn: Multi-model inference. R package
version 1.10.5. Available from: http://cran.r-project.org/
package=MuMIn
Bates, D., M. Maechler, B. Bolker, and S. Walker. 2014. lme4:
Linear mixed-effects models using Eigen and S4. R package
verison 1.1-7. Available from: http://cran.r-project.org/
package=lme4
Bautista, L. M., J. C. Alonso, and J. A. Alonso. 1995. A field
test of ideal free distribution in flock-feeding common
cranes. J. Anim. Ecol. 64:747–757.Brown, J. 1964. The evolution of diversity in avian territorial
systems. Wilson Bull. 76:160–169.Bugnyar, T., and K. Kotrschal. 2004. Leading a conspecific away
from food in ravens (Corvus corax)? Anim. Cogn. 7:69–76.
Burnham, K. P., and D. R. Anderson. 2002. Model selection
and multimodel inference: a practical information-theoretic
approach, 2nd edn. Springer, New York.
Burnham, K. P., D. R. Anderson, and K. P. Huyvaert. 2011.
AIC model selection and multimodel inference in behavioral
ecology: some background, observations, and comparisons.
Behav. Ecol. Sociobiol. 65:23–35.
Bye Design Ltd. 1999. SpreadCE version 2.03. Available from:
www.byedesign.co.uk.
Carter, A. J., S. L. Macdonald, V. A. Thomson, and A. W.
Goldizen. 2009. Structured association patterns and their
energetic benefits in female eastern grey kangaroos,
Macropus giganteus. Anim. Behav., 77:839–846.
Charnov, E. L. 1976. Optimal foraging, the marginal value
theorem. Theor. Popul. Biol. 9:129–136.
Cheney, D. L., and R. M. Seyfarth. 2008. Baboon metaphysics:
the evolution of a social mind. University of Chicago Press,
Chicago.
Clutton-Brock, T., and E. Huchard. 2013. Social competition
and its consequences in female mammals. J. Zool. 289:151–171.
Courchamp, F., T. H. Clutton-Brock, and B. Grenfell. 1999.
Inverse density dependence and the Allee effect. Trends
Ecol. Evol. 14:405–410.Cowlishaw, G. 1994. Vulnerability to predation in baboon
populations. Behaviour 131:293–304.Cowlishaw, G. 1997. Trade-offs between foraging and
predation risk determine habitat use in a desert baboon
population. Anim. Behav. 53:667–686.
Cowlishaw, G., and J. Davies. 1997. Flora of the Pro-Namib
Desert Swakop River catchment, Namibia: community
classification and implications for desert vegetation
sampling. J. Arid Environ. 36:271–290.
Crockford, C., R. Wittig, P. L. Whitten, R. M. Seyfarth, and D.
L. Cheney. 2008. Social stressors and coping mechanisms in
wild female baboons (Papio hamadryas ursinus). Horm.
Behav. 53:254–265.
Dall, S. R. X., L. A. Giraldeau, O. Olsson, J. M. McNamara,
and D. W. Stephens. 2005. Information and its use by
animals in evolutionary ecology. Trends Ecol. Evol. 20:187–
193.
Di Bitetti, M., and C. Janson. 2001. Social foraging and the
finder’s share in capuchin monkeys. Anim. Behav. 62:47–56.
Dunbar, R. I. M. 1992. Time: a hidden constraint on the
behavioural ecology of baboons. Behav. Ecol. Sociobiol.
31:35–49.Dunbar, R. I. M., A. H. Korstjens, and J. Lehmann. 2009.
Time as an ecological constraint. Biol. Rev. 84:413–429.Earley, R. L., and L. A. Dugatkin. 2010. Behavior in groups.
Pp. 285–308 in D. F. Westneat and C. W. Fox, eds.
Evolutionary behavioral ecology. Oxford University Press,
Oxford.
16 ª 2014 The Authors. Ecology and Evolution published by John Wiley & Sons Ltd.
Environment-Dependent Social Foraging H. H. Marshall et al.
East, M. L., and H. Hofer. 2010. Social environments, social
tactics and their fitness consequences in complex
mammalian societies. Pp. 360–390 in T. Sz�ekely, A. J.
Moore and J. Komdeur, eds. Social behaviour: genes,
ecology and evolution, 1st edn. Cambridge University Press,
Cambridge.
Elston, D. A., R. Moss, T. Boulinier, C. Arrowsmith, and X.
Lambin. 2001. Analysis of aggregation, a worked example:
numbers of ticks on red grouse chicks. Parasitology
122:563–569.Frank, R. E., and J. B. Silk. 2009. Impatient traders or
contingent reciprocators? Evidence for the extended
time-course of grooming exchanges in baboons. Behaviour
146:1123–1135.Freckleton, R. P. 2011. Dealing with collinearity in behavioural
and ecological data: model averaging and the problems of
measurement error. Behav. Ecol. Sociobiol. 65:91–101.
Fruteau, C., B. Voelkl, E. van Damme, and R. No€e. 2009.
Supply and demand determine the market value of food
providers in wild vervet monkeys. Proc. Natl Acad. Sci. USA
106:12007–12012.
Gomes, C. M., R. Mundry, and C. Boesch. 2009. Long-term
reciprocation of grooming in wild West African
chimpanzees. Proc. Biol. Sci. 276:699–706.Grant, J. W. A. 1993. Whether or not to defend? The influence
of resource distribution. Mar. Behav. Physiol. 23:137–153.Ha, R. R., P. Bentzen, J. Marsh, and J. C. Ha. 2003. Kinship
and association in social foraging northwestern crows
(Corvus caurinus). Bird Behav. 15:65–75.
Hall, C. L., and L. M. Fedigan. 1997. Spatial benefits afforded
by high rank in white-faced capuchins. Anim. Behav.
53:1069–1082.Hegyi, G., and L. Z. Garamszegi. 2011. Using information
theory as a substitute for stepwise regression in ecology and
behavior. Behav. Ecol. Sociobiol. 65:69–76.
Held, S. D. E., R. W. Byrne, S. Jones, E. Murphy, M. Friel,
and M. T. Mendl. 2010. Domestic pigs, Sus scrofa, adjust
their foraging behaviour to whom they are foraging with.
Anim. Behav. 79:857–862.Henzi, S., and N. Forshaw. 2013. Scalar social dynamics in
female vervet monkey cohorts. Philos. Trans. R. Soc. Lond
B: Biol. Sci. 368:20120351.
Henzi, S. P., D. Lusseau, T. Weingrill, C. P. Schaik, and L.
Barrett. 2009. Cyclicity in the structure of female baboon
social networks. Behav. Ecol. Sociobiol. 63:1015–1021.Hirsch, B. 2007. Costs and benefits of within-group spatial
position: a feeding competition model. Q. Rev. Biol. 82:9–27.
Hirsch, B. T. 2011. Spatial position and feeding success in
ring-tailed coatis. Behav. Ecol. Sociobiol. 65:581–591.
Hoffman, T. S., and M. J. O’Riain. 2012. Landscape
requirements of a primate population in a
human-dominated environment. Front. Zool. 9:1.
Holmgren, N. 1999. Dominance and patch distribution of
great tits Parus major: a preliminary test of theoretical
predictions. Behaviour 136:79–98.Huchard, E., A. Courtiol, J. A. Benavides, L. A. Knapp, M.
Raymond, and G. Cowlishaw. 2009. Can fertility signals lead
to quality signals? Insights from the evolution of primate
sexual swellings. Proc. Biol. Sci. 276:1889–1897.
Huchard, E., A. Alvergne, D. F�ejan, L. A. Knapp, G.
Cowlishaw, and M. Raymond. 2010. More than friends?
Behavioural and genetic aspects of heterosexual
associations in wild chacma baboons. Behav. Ecol.
Sociobiol. 64:769–781.Isbell, L. A., and T. P. Young. 2002. Ecological models of
female social relationships in primates: similarities,
disparities, and some directions for future clarity. Behaviour
139:177–202.Kahumbu, P., and R. M. Eley. 1991. Teeth emergence in wild
olive baboons in Kenya and formulation of a dental
schedule for ageing wild baboon populations. Am. J.
Primatol. 23:1–9.King, A. J., C. M. S. Douglas, E. Huchard, N. J. B. Isaac, and
G. Cowlishaw. 2008. Dominance and affiliation mediate
despotism in a social primate. Curr. Biol. 18:1833–1838.
King, A. J., N. J. B. Isaac, and G. Cowlishaw. 2009. Ecological,
social, and reproductive factors shape producer-scrounger
dynamics in baboons. Behav. Ecol. 20:1039–1049.Lehmann, J., A. H. Korstjens, and R. I. M. Dunbar. 2007.
Group size, grooming and social cohesion in primates.
Anim. Behav. 74:1617–1629.
Liker, A., and Z. Barta. 2002. The effects of dominance on
social foraging tactic use in house sparrows. Behaviour
139:1061–1076.Marshall, H. H., A. J. Carter, J. M. Rowcliffe, and G.
Cowlishaw. 2012a. Linking social foraging behaviour with
individual time budgets and emergent group-level
phenomena. Anim. Behav., 84:1295–1305.Marshall, H. H., A. J. Carter, T. Coulson, J. M. Rowcliffe, and
G. Cowlishaw. 2012b. Exploring foraging decisions in a
social primate using discrete-choice models. Am. Nat.
180:481–495.
Marshall, H. H., A. J. Carter, A. Ashford, J. M. Rowcliffe,
and G. Cowlishaw. 2013. How do foragers decide when
to leave a patch? A test of alternative models under
natural and experimental conditions. J. Anim. Ecol.
82:892–902.Mathot, K. J., and L.-A. Giraldeau. 2010. Within-group
relatedness can lead to higher levels of exploitation: a model
and empirical test. Behav. Ecol. 21:843–850.
McFarland, R., and B. Majolo. 2013. Coping with the cold:
predictors of survival in wild Barbary macaques, Macaca
sylvanus. Biol. Lett. 9:20130428.
Melletti, M., M. M. Delgado, V. Penteriani, M. Mirabile, and
L. Boitani. 2010. Spatial properties of a forest buffalo herd
ª 2014 The Authors. Ecology and Evolution published by John Wiley & Sons Ltd. 17
H. H. Marshall et al. Environment-Dependent Social Foraging
and individual positioning as a response to environmental
cues and social behaviour. J. Ethol. 28:421–428.
Morrell, L. J., and W. L. Romey. 2008. Optimal individual
positions within animal groups. Behav. Ecol. 19:909–919.
Nichols, H. J., M. B. V. Bell, S. J. Hodge, and M. A. Cant.
2012. Resource limitation moderates the adaptive
suppression of subordinate breeding in a cooperatively
breeding mongoose. Behav. Ecol. 23:635–642.No€e, R., and P. Hammerstein. 1995. Biological markets.
Trends Ecol. Evol. 10:336–339.Noldus Information Technology. 2003. Matman. Noldus
Information Technology, Wageningen, Netherlands.
Nonacs, P. 2001. State dependent behavior and the Marginal
Value Theorem. Behav. Ecol. 12:71–83.Nystrand, M. 2006. Influence of age, kinship, and large-scale
habitat quality on local foraging choices of Siberian jays.
Behav. Ecol. 17:503–509.
R Core Team. 2013. R: a language and environment for
statistical computing. Version 3.0.2. R Statistical Foundation
for Computing, Vienna, Austria. Available from:
www.r-project.org.
Richards, S. A., M. J. Whittingham, and P. A. Stephens. 2011.
Model selection and model averaging in behavioural
ecology: the utility of the IT-AIC framework. Behav. Ecol.
Sociobiol. 65:77–89.
Rieucau, G., and L.-A. Giraldeau. 2011. Exploring the costs
and benefits of social information use: an appraisal of
current experimental evidence. Philos. Trans. R. Soc. Lond
B Biol. Sci. 366:949–957.
Schielzeth, H. 2010. Simple means to improve the
interpretability of regression coefficients. Methods Ecol.
Evol. 1:103–113.Shopland, J. 1987. Food quality, spatial deployment, and the
intensity of feeding interference in yellow baboons (Papio
cynocephalus). Behav. Ecol. Sociobiol. 21:149–156.
Sick, C., A. J. Carter, H. H. Marshall, L. A. Knapp, T.
Dabelsteen, and G. Cowlishaw. 2014. Evidence for varying
social strategies across the day in chacma baboons. Biol.
Lett. 10:20140249.
Silk, J. B. 2007. The adaptive value of sociality in mammalian
groups. Philos. Trans. R. Soc. Lond B Biol. Sci. 362:539–559.Silk, J. B., J. C. Beehner, T. J. Bergman, C. Crockford, A. L.
Engh, L. R. Moscovice, et al. 2010a. Female chacma baboons
form strong, equitable, and enduring social bonds. Behav.
Ecol. Sociobiol. 64:1733–1747.Silk, J. B., J. C. Beehner, T. J. Bergman, C. Crockford, A. L.
Engh, L. R. Moscovice, et al. 2010b. Strong and consistent
social bonds enhance the longevity of female baboons. Curr.
Biol. 20:1359–1361.Silk, J. B., S. C. Alberts, J. Altmann, D. L. Cheney, and R. M.
Seyfarth. 2012. Stability of partner choice among female
baboons. Anim. Behav. 83:1511–1518.
Smith, R., G. Ruxton, and W. Cresswell. 2001. Dominance and
feeding interference in small groups of blackbirds. Behav.
Ecol. 12:475–481.Stephens, D. W., and J. R. Krebs. 1986. Foraging theory.
Princeton University Press, Princeton, NJ.
Stillman, R., J. Goss-Custard, R. Clarke, and S. E. A. L. V. D.
Durell. 1996. Shape of the interference function in a
foraging vertebrate. J. Anim. Ecol. 65:813–824.Stillman, R. A., L. M. Bautista, J. C. Alonso, and J. A. Alonso.
2002. Modelling state-dependent interference in common
cranes. J. Anim. Ecol. 71:874–882.
Stone, O. M. L., S. W. Laffan, D. Curnoe, and A. I. R. Herries.
2013. The spatial distribution of chacma baboon (Papio
ursinus) habitat based on an environmental envelope model.
Int. J. Primatol. 34:407–422.
Symonds, M. R. E., and A. Moussalli. 2011. A brief guide to
model selection, multimodel inference and model averaging
in behavioural ecology using Akaike’s information criterion.
Behav. Ecol. Sociobiol. 65:13–21.
Tanner, C. J., and A. L. Jackson. 2012. Social structure
emerges via the interaction between local ecology and
individual behaviour. J. Anim. Ecol. 81:260–267.Tanner, C. J., G. D. Salalι, and A. L. Jackson. 2011. Feeding
and non-feeding aggression can be induced in invasive shore
crabs by altering food distribution. Behav. Ecol. Sociobiol.
65:249–256.Tiddi, B., F. Aureli, E. Polizzi di Sorrentino, C. H. Janson, and
G. Schino. 2011. Grooming for tolerance? Two mechanisms
of exchange in wild tufted capuchin monkeys. Behav. Ecol.,
22:663–669.Vahl, W. K., T. Lok, J. van der Meer, T. Piersma, and F. J.
Weissing. 2005. Spatial clumping of food and social
dominance affect interference competition among ruddy
turnstones. Behav. Ecol. 16:834–844.Voelkl, B., and R. No€e. 2008. The influence of social structure
on the propagation of social information in artificial
primate groups: a graph-based simulation approach. J.
Theor. Biol. 252:77–86.Waite, T. A., and K. L. Field. 2007. Foraging with others:
games social foragers play. Pp. 331–362 in D. W. Stephens,
J. S. Brown and R. C. Ydenberg, eds. Foraging: behavior and
ecology. University of Chicago Press, Chicago.
Wang, J. 2007. Triadic IBD coefficients and applications
to estimating pairwise relatedness. Genet. Res. 89:135–
153.
Whittingham, M. J., P. A. Stephens, R. B. Bradbury, and R. P.
Freckleton. 2006. Why do we still use stepwise modelling in
ecology and behaviour? J. Anim. Ecol. 75:1182–1189.
Zhang, W. 2014. cplm: Tweedie compound Poisson linear
models. R package version 0.7-2. Available from: http://
cran.r-project.org/package=cplm.
18 ª 2014 The Authors. Ecology and Evolution published by John Wiley & Sons Ltd.
Environment-Dependent Social Foraging H. H. Marshall et al.