The Herschel Reference Survey
26
arXiv:1001.5136v1 [astro-ph.CO] 28 Jan 2010 Draft version January 28, 2010 Preprint typeset using L A T E X style emulateapj v. 11/10/09 THE HERSCHEL REFERENCE SURVEY A. Boselli 1 , S. Eales 2 , L. Cortese 2 , G. Bendo 3 , P. Chanial 3 , V. Buat 1 , J. Davies 2 , R. Auld 2 , E. Rigby 4 , M. Baes 5 , M. Barlow 6 , J. Bock 7 , M. Bradford 7 , N. Castro-Rodriguez 8 , S. Charlot 9 , D. Clements 3 , D. Cormier 11 , E. Dwek 10 , D. Elbaz 11 , M. Galametz 11 , F. Galliano 12 , W. Gear 2 , J. Glenn 13 , H. Gomez 2 , M. Griffin 2 , S. Hony 11 , K. Isaak 2 , L. Levenson 7 , N. Lu 7 , S. Madden 11 , B. O’Halloran 3 , K. Okumura 11 , S. Oliver 14 , M. Page 15 , P. Panuzzo 11 , A. Papageorgiou 2 , T. Parkin 20 , I. Perez-Fournon 8 , M. Pohlen 2 , N. Rangwala 13 , H. Roussel 9 , A. Rykala 2 , N. Sacchi 17 , M. Sauvage 11 , B. Schulz 16 , M. Schirm 20 , M.W.L. Smith 2 , L. Spinoglio 17 , J. Stevens 18 , M. Symeonidis 18 , M. Vaccari 19 , L. Vigroux 9 , C. Wilson 20 , H. Wozniak 21 , G. Wright 18 , W. Zeilinger 22 Draft version January 28, 2010 ABSTRACT The Herschel Reference Survey is a guaranteed time Herschel key project and will be a benchmark study of dust in the nearby universe. The survey will complement a number of other Herschel key projects including large cosmological surveys that trace dust in the distant universe. We will use Herschel to produce images of a statistically-complete sample of 323 galaxies at 250, 350 and 500 μm. The sample is volume-limited, containing sources with distances between 15 and 25 Mpc and flux limits in the K-band to minimize the selection effects associated with dust and with young high-mass stars and to introduce a selection in stellar mass. The sample spans the whole range of morphological types (ellipticals to late-type spirals) and environments (from the field to the centre of the Virgo Cluster) and as such will be useful for other purposes than our own. We plan to use the survey to investigate (i) the dust content of galaxies as a function of Hubble type, stellar mass and environment, (ii) the connection between the dust content and composition and the other phases of the interstellar medium and (iii) the origin and evolution of dust in galaxies. In this paper, we describe the goals of the survey, the details of the sample and some of the auxiliary observing programs that we have started to collect complementary data. We also use the available multi-frequency data to carry out an analysis of the statistical properties of the sample. Subject headings: Galaxies: general, ISM; Infrared: galaxies; Submillimeter; Catalogs; Surveys 1 Laboratoire d’Astrophysique de Marseille, UMR6110 CNRS, 38 rue F. Joliot-Curie, F-13388 Marseille France 2 School of Physics and Astronomy, Cardiff University, Queens Buildings The Parade, Cardiff CF24 3AA, UK 3 Astrophysics Group, Imperial College, Blackett Laboratory, Prince Consort Road, London SW7 2AZ, UK 4 School of Physics & Astronomy, University of Nottingham, University Park, Nottingham NG7 2RD, UK 5 Sterrenkundig Observatorium, Universiteit Gent, Krijgslaan 281 S9, B-9000 Gent, Belgium 6 Department of Physics and Astronomy, University College Lon- don, Gower Street, London WC1E 6BT, UK 7 Jet Propulsion Laboratory, Pasadena, CA 91109, United States; Department of Astronomy, California Institute of Technol- ogy, Pasadena, CA 91125, USA 8 Instituto de Astrofsica de Canarias, C/Va Lctea s/n, E-38200 La Laguna, Spain 9 Institut d’Astrophysique de Paris, UMR7095 CNRS, Univer- sit´ e Pierre & Marie Curie, 98 bis Boulevard Arago, F-75014 Paris, France 10 Observational Cosmology Lab, Code 665, NASA Goddard Space Flight Center Greenbelt, MD 20771, USA 11 Laboratoire AIM, CEA/DSM - CNRS - Universit´ e Paris Diderot, Irfu/Service d’Astrophysique, 91191 Gif sur Yvette, France 12 Department of Astronomy, University of Maryland, College Park, MD20742, USA 13 Department of Astrophysical and Planetary Sciences, CASA CB-389, University of Colorado, Boulder, CO 80309, USA 14 Astronomy Centre, Department of Physics and Astronomy, University of Sussex, UK 15 Mullard Space Science Laboratory, University College Lon- don, Holmbury St Mary, Dorking, Surrey RH5 6NT, UK 16 Infrared Processing and Analysis Center, California Institute of Technology, Mail Code 100-22, 770 South Wilson Av, Pasadena, CA 91125, USA 17 Istituto di Fisica dello Spazio Interplanetario, INAF, Via del Fosso del Cavaliere 100, I-00133 Roma, Italy 18 Centre for Astrophysics Research, Science and Technology Re- search Centre, University of Hertfordshire, College Lane, Herts AL10 9AB, UK 19 University of Padova, Department of Astronomy, Vicolo Os- servatorio 3, I-35122 Padova, Italy 20 Dept. of Physics & Astronomy, McMaster University, Hamil- ton, Ontario, L8S 4M1, Canada 21 Observatoire Astronomique de Strasbourg, UMR 7550 Univer- sit de Strasbourg - CNRS, 11, rue de l’Universit´ e, F-67000 Stras- bourg 22 Institut fr Astronomie, Universitt Wien, Trkenschanzstr. 17, A-1180 Wien, Austria
-
Upload
univ-montpellier -
Category
Documents
-
view
0 -
download
0
Transcript of The Herschel Reference Survey

arX
iv:1
001.
5136
v1 [
astr
o-ph
.CO
] 2
8 Ja
n 20
10Draft version January 28, 2010Preprint typeset using LATEX style emulateapj v. 11/10/09
THE HERSCHEL REFERENCE SURVEY
A. Boselli1 , S. Eales2 , L. Cortese2 , G. Bendo3 , P. Chanial3 , V. Buat1 , J. Davies2 , R. Auld2 , E. Rigby4 , M.Baes5 , M. Barlow6 , J. Bock7 , M. Bradford7 , N. Castro-Rodriguez8 , S. Charlot9 , D. Clements3 , D.
Cormier11 , E. Dwek10 , D. Elbaz11 , M. Galametz11 , F. Galliano12 , W. Gear2 , J. Glenn13 , H. Gomez2 , M.Griffin2 , S. Hony11 , K. Isaak2 , L. Levenson7 , N. Lu7 , S. Madden11 , B. O’Halloran3 , K. Okumura11 , S.Oliver14 , M. Page15 , P. Panuzzo11 , A. Papageorgiou2 , T. Parkin20 , I. Perez-Fournon8 , M. Pohlen2 , N.
Rangwala13 , H. Roussel9 , A. Rykala2 , N. Sacchi17 , M. Sauvage11 , B. Schulz16 , M. Schirm20 , M.W.L. Smith2 ,L. Spinoglio17 , J. Stevens18 , M. Symeonidis18 , M. Vaccari19 , L. Vigroux9 , C. Wilson20 , H. Wozniak21 , G.
Wright18 , W. Zeilinger22
Draft version January 28, 2010
ABSTRACT
The Herschel Reference Survey is a guaranteed time Herschel key project and will be a benchmarkstudy of dust in the nearby universe. The survey will complement a number of other Herschel keyprojects including large cosmological surveys that trace dust in the distant universe. We will useHerschel to produce images of a statistically-complete sample of 323 galaxies at 250, 350 and 500 µm.The sample is volume-limited, containing sources with distances between 15 and 25 Mpc and fluxlimits in the K-band to minimize the selection effects associated with dust and with young high-massstars and to introduce a selection in stellar mass. The sample spans the whole range of morphologicaltypes (ellipticals to late-type spirals) and environments (from the field to the centre of the VirgoCluster) and as such will be useful for other purposes than our own. We plan to use the survey toinvestigate (i) the dust content of galaxies as a function of Hubble type, stellar mass and environment,(ii) the connection between the dust content and composition and the other phases of the interstellarmedium and (iii) the origin and evolution of dust in galaxies. In this paper, we describe the goalsof the survey, the details of the sample and some of the auxiliary observing programs that we havestarted to collect complementary data. We also use the available multi-frequency data to carry outan analysis of the statistical properties of the sample.Subject headings: Galaxies: general, ISM; Infrared: galaxies; Submillimeter; Catalogs; Surveys
1 Laboratoire d’Astrophysique de Marseille, UMR6110 CNRS,38 rue F. Joliot-Curie, F-13388 Marseille France
2 School of Physics and Astronomy, Cardiff University, QueensBuildings The Parade, Cardiff CF24 3AA, UK
3 Astrophysics Group, Imperial College, Blackett Laboratory,Prince Consort Road, London SW7 2AZ, UK
4 School of Physics & Astronomy, University of Nottingham,University Park, Nottingham NG7 2RD, UK
5 Sterrenkundig Observatorium, Universiteit Gent, Krijgslaan281 S9, B-9000 Gent, Belgium
6 Department of Physics and Astronomy, University College Lon-don, Gower Street, London WC1E 6BT, UK
7 Jet Propulsion Laboratory, Pasadena, CA 91109, UnitedStates; Department of Astronomy, California Institute of Technol-ogy, Pasadena, CA 91125, USA
8 Instituto de Astrofsica de Canarias, C/Va Lctea s/n, E-38200La Laguna, Spain
9 Institut d’Astrophysique de Paris, UMR7095 CNRS, Univer-site Pierre & Marie Curie, 98 bis Boulevard Arago, F-75014 Paris,France
10 Observational Cosmology Lab, Code 665, NASA GoddardSpace Flight Center Greenbelt, MD 20771, USA
11 Laboratoire AIM, CEA/DSM - CNRS - Universite ParisDiderot, Irfu/Service d’Astrophysique, 91191 Gif sur Yvette,France
12 Department of Astronomy, University of Maryland, CollegePark, MD20742, USA
13 Department of Astrophysical and Planetary Sciences, CASACB-389, University of Colorado, Boulder, CO 80309, USA
14 Astronomy Centre, Department of Physics and Astronomy,University of Sussex, UK
15 Mullard Space Science Laboratory, University College Lon-don, Holmbury St Mary, Dorking, Surrey RH5 6NT, UK
16 Infrared Processing and Analysis Center, California Instituteof Technology, Mail Code 100-22, 770 South Wilson Av, Pasadena,CA 91125, USA
17 Istituto di Fisica dello Spazio Interplanetario, INAF, Via del
Fosso del Cavaliere 100, I-00133 Roma, Italy18 Centre for Astrophysics Research, Science and Technology Re-
search Centre, University of Hertfordshire, College Lane, HertsAL10 9AB, UK
19 University of Padova, Department of Astronomy, Vicolo Os-servatorio 3, I-35122 Padova, Italy
20 Dept. of Physics & Astronomy, McMaster University, Hamil-ton, Ontario, L8S 4M1, Canada
21 Observatoire Astronomique de Strasbourg, UMR 7550 Univer-sit de Strasbourg - CNRS, 11, rue de l’Universite, F-67000 Stras-bourg
22 Institut fr Astronomie, Universitt Wien, Trkenschanzstr. 17,A-1180 Wien, Austria

2
1. INTRODUCTION
Understanding the processes that govern the formationand evolution of galaxies is one of the major challengesof modern astronomy. Ideally this work can be done byanalyzing and comparing the physical, structural andkinematical properties of different objects at variousepochs to model predictions. How primordial galaxiestransform their huge gas reservoir into stars and becomethe objects that we now observe in the local universe isa key question. A wide coverage of the electromagneticspectrum to probe the atomic (21 cm line) and molecular(generally through the 2.6 mm CO line) gas components,the different stellar populations (UV to near-IR spectralrange), the dust (mid- and far-IR) and the electronsin magnetic fields (radio continuum) is necessary toaddress this important question.
The importance of dust resides in the fact that it isformed from the aggregation of the metals producedin the latest phases of stellar evolution, and containsapproximately half the metals in the interstellar medium(Whittet 1992). Injected into the interstellar medium(ISM) by stellar winds and supernovae explosions, dustacts as a catalyst in the process of transformation ofthe atomic to molecular hydrogen necessary to feedstar formation (Hollenbach & Salpeter 1971; Duley &Williams 1986). Dust also contributes to the shieldingof the UV radiation field, preventing the dissociationof molecular clouds, and thus playing a major role inthe energetic equilibrium of the ISM (Hollenbach &Tielens 1997). Dust contributes to the cooling andheating of the ISM in photodissociation regions throughphotoelectric heating. Furthermore, by absorbing thestellar light, dust modifies our view of the differentstellar components (e.g. Buat & Xu 1996): because dustobscuration is so important in star-forming regions, theemission from dust is one of the most powerful tracers ofthe star formation activity in galaxies (Kennicutt 1998;Hirashita et al. 2003). Dust emission can therefore beused to study the relationship between the gas surfacedensity and the star formation activity, generally knownas the Schmidt law.
The importance of dust in the study of the formationand evolution of galaxies became evident after theIRAS space mission which provided us with a wholesky coverage in four infrared bands. Despite its lowsensitivity and poor angular resolution, IRAS detectedtens thousands of extragalactic sources (Soifer et al.1987). The IRAS survey showed that the stellar light insome galaxies is so heavily obscured that the only wayto determine their star formation activity is throughthe dust emission itself. Among these highly obscuredgalaxies, the Ultraluminous Infrared Galaxies (ULIRGs)are the most actively star-forming objects in the localuniverse. With their improved sensitivity, spectral andangular resolution, other space missions such as ISOand Spitzer have brought a better understanding of thechemical and physical properties of interstellar dustin a wide range of different galactic and extragalacticsources. IRAS, ISO, Spitzer and the recently launchedAKARI satellite, however, are sensitive to dust emittingin the mid- (∼ 5 µm) to far- (≤ 200 µm) infrared
domain. The 5-70 µm spectral range corresponds to theemission of the hot dust generally associated to starformation, while at longer wavelengths, up to 1 mm,the contribution of cold dust becomes more and moreimportant (Draine et al. 2007). The emission of the ISMin the range 3 µm . λ . 15 µm is generally dominatedby Polycyclic Aromatic Hydrocarbons (PAHs). Between10 µm and . 70 µm the dust emission is usually due tovery small grains, while that at longer wavelengths (70µm . λ . 1000 µm) is probably produced by big grainsof graphite and silicate in thermal equilibrium with theUV and optical photons of the interstellar radiation field(Desert et al. 1991; Dwek et al. 1997; Zubko et al. 2004;Draine & Li 2007).
There is, however, strong empirical evidence tosuggest that much of the dust in normal galaxies hasbeen missed by previous space missions because it is toocold to radiate in the mid- and far-infrared. Devereux& Young (1990), for example, showed that when thedust masses of galaxies were estimated from IRAS data,the gas-to-dust ratios were ≃10 times higher than theGalactic value, implying that 90% of the dust in galaxiesis too cold to radiate significantly in the IRAS bands.ISO 200 µm images of nearby galaxies revealed thepresence of cold (∼20 K) dust in the external parts ofgalaxies (Alton et al. 1998). Even Spitzer, with itslonger wavelength coverage, is only sensitive to dust thatis warmer than ≃15 K (Bendo et al. 2003; Draine & Li2007; Draine et al. 2007). Simple estimates show thatthe temperature of a dust grain in thermal equilibriumin the average interstellar radiation field is ∼ 20 K,which would produce a modified black body spectrumwith a peak at ∼ 200 µm with a flux rapidly decreasingat longer wavelengths (Boselli et al. 2003; Dale et al.2005, 2007; Draine & Li 2007; Draine et al. 2007). It isimportant to remember, however, that most of the dustin a galaxy is likely to be at a much lower temperaturethan 20 K because it is self-shielded, and so unaffectedfrom the interstellar radiation field. For example, inmolecular clouds the temperature of the dust is usuallywell below the canonical 20 K value once the averagedust extinction (AV ) is greater than one, unless it isclose to a newly formed star (Ward-Thompson et al.2002).
The submillimetre waveband (200-1000 µm) is crucialfor detecting this missing cold dust component and thusfor making accurate estimates of the total dust mass.Mass estimates made from far-infrared measurements arehighly uncertain because of the strong dependence of fluxon dust temperature which is difficult to determine usingdata on the Wien side of the black body peak. At longwavelengths (Rayleigh-Jeans domain) the emissivity de-pends only on the first power of the dust temperature,making it possible to use a submillimetre flux to make anaccurate estimate of the mass of dust (Eales et al. 1989;Galliano et al. 2003; 2005).Submillimetre continuum observations of galaxies have
been made previously, in particular with the ground-based submillimetre cameras, such as SCUBA on theJames Clerk Maxwell Telescope. These have confirmedthat galaxies do indeed contain a large amount of colddust (Dunne & Eales 2001; Galliano et al. 2003). Until

3
now, the largest submillimetre survey has been theSCUBA Local Universe and Galaxy Survey (SLUGS),a survey of ≃200 galaxies in two samples, one selectedfrom the IRAS survey and one selected at opticalwavelengths. The survey produced the first estimates ofthe submillimetre luminosity and dust-mass (the spacedensity of galaxies as a function of dust mass) functions(Dunne et al. 2000; Vlahakis et al. 2005), and alsoindicated that some ellipticals are surprisingly strongsubmillimetre sources. Its limitation, and the limitationof all ground-based submillimetre observations, is thatof sensitivity: SLUGS struggled to detect galaxies notalready detected by IRAS.
The solution is to go into space and the Herschel spacetelescope is finally making this possible. In particularthe relatively large field of view, high sensitivity, andcoverage of a waveband (250-500 µm) in which galaxiesare intrinsically bright, make SPIRE on Herschel theideal instrument for a study of all extragalactic sources(Griffin et al. 2006, 2007; Wasket et al. 2007). SPIREhas the sensitivity to map large areas of the sky downto the confusion limit in quite modest integrationtimes, providing submillimetre data for large samples ofgalaxies at different redshifs, and is thus well adapted forpointed observations for all kind of nearby extragalacticsources.
The SPIRE consortium has defined a number ofcoordinated guaranteed time programs to get the bestpossible benefit of the unique Herschel facilities for thestudy of galaxy evolution. These include deep cosmo-logical surveys, pointed observations of local galaxiesand surveys of representative regions in the Milky Way.To better characterize the dust properties in the localuniverse the SPIRE extragalactic group has selected avolume-limited sample of 323 galaxies to be observedin guaranteed time in the three SPIRE bands at 250,350 and 500 µm. The importance of the local universeresides in the fact that it represents the endpointof galaxy evolution, providing important boundaryconditions to models and simulations. Furthermore, at≤ 30 Mpc the angular resolution of SPIRE (a couple ofkpc) allow us to resolve the different galaxy componentssuch as nuclei, bulges, discs and spiral arms. Moreover,dwarf galaxies, by far the most common (yet still verypoorly understood) galaxies in the universe, can only beobserved locally.
A volume-limited sample was chosen as a way tolimit distance dependent selection biases. To limit anypossible contamination due to the cosmic variance, thevolume should be much larger than the typical dimen-sion of large-scale structures (∼ 30 Mpc). At the sametime it should be representative of the whole galaxypopulation inhabiting the local universe. A near-infraredK-band selection was adopted for two major reasons:(i) unlike optical surveys, which have strong selectioneffects due to the presence of dust, near-IR data areonly marginally affected by dust extinction; (ii) whereasthe optical flux is highly dependent on the numberof relatively young stars and thus sensitive to recentepisodes of star formation, the near-IR luminosity is agood measure of the overall stellar mass (e.g. Gavazzi
et al. 1996), which recent studies suggest as the mostimportant parameter in characterizing the statisticaland evolutionary properties of galaxies. Indeed galaxyproperties that appear to be tightly correlated with thegalaxy’s stellar mass include the following: physicalproperties, such as the star formation activity, the gascontent and the metallicity (Boselli et al. 2001; 2002;Zaritsky et al. 1994; Gavazzi et al. 2004; Tremonti et al.2004); structural properties, such as the concentrationindex and the galaxy’s light profile (Boselli et al. 1997;Gavazzi et al. 2000; Scodeggio et al. 2002); the amountand distribution of dark matter, as indicated by theTully-Fisher relation and the shape of the rotationcurve for spirals (Tully & Fisher 1977; Catinella etal. 2006) and the fundamental plane for ellipticals(Dressler et al. 1987; Djorgovski & Davis 1987); thestellar population, shown through the colour-magnituderelations for early-type (Visvanathan & Sandage 1977,Bower et al. 1992) and late-type galaxies (Tully etal. 1982, Gavazzi et al. 1996) and the galaxy spectralenergy distributions (Gavazzi et al. 2002, Kauffmann etal. 2003). These correlations all indicate a down-sizingeffect (e.g. Gavazzi et al. 1996; Cowie et al. 1996;Heavens et al. 2004), in which galaxies with highstellar masses formed most of their stars at a muchearlier cosmic epoch than those with low stellar masses.This underline the dominant role of mass, rather thanmorphology, in shaping galaxies.
The final sample includes galaxies with a large rangein luminosity (mass) and includes all Hubble types. Be-cause of its definition, the selected sample also includesgalaxies belonging to different density regions such asthe core of the Virgo cluster, groups and pairs andisolated objects. Given its completeness, the HerschelReference Sample (HRS) will be a suitable reference forany statistical study. Combined with KINGFISH (theHerschel extension of SINGS, Kennicutt et al. 2003) andVNGS (see below), two samples optimized for the studyof the different phases of the ISM in individual galaxies,these samples will provide the community with a uniquedataset for studying the ISM properties of galaxies inthe local universe.
The paper is organized as follows. Section 2 describesthe scientific goals of the survey. Section 3 gives a de-scription of the selection criteria used to define the sam-ple. Section 4 gives details of the SPIRE observationswe will carry out and Section 5 gives an overview ofthe multi-frequency data that is available for the sample.Section 6 gives a brief description of the data processingand products. The multifrequency statistical propertiesof the sample will be described in Section 7.
2. SCIENTIFIC OBJECTIVES
The overall goal of this Herschel survey is to improveour knowledge of the cold dust properties of the mostcommon extragalactic sources populating the localuniverse. Combined with multifrequency ancillary datacovering the whole electromagnetic spectrum (see Sect.5), the new Herschel data will provide us with a uniquedataset with which to:
1) Trace, for the first time, the variation of
4
the properties of the cold dust component (dustmass and temperature, dust to gas ratio...) ofnormal galaxies along the Hubble sequence,and as a function of luminosity. Given the largedispersion in galaxy properties (Morton & Haynes1994), it is important the sample to be large enoughto contain representatives of all galaxy types andinclude both early- and late-type galaxies spanning thelargest possible range in luminosity. Where galaxies areresolved, we can analyze the distribution of the colddust in the different galaxy components, e.g. the nuclei,bulges, spiral arms and diffuse discs. This will provideimportant constraints on dust formation and evolutionin galaxies (Galliano et al. 2008).
2) Study the role of dust in the physics of theISM. As discussed in the introduction, dust plays a ma-jor role in the energetic equilibrium of the ISM. It actsas catalyst for the formation of the molecular hydrogen(Hollenbach & Salpeter 1971; Duley & Williams 1986)and shields the molecular gas component preventingdissociation from the diffuse interstellar radiation field(Hollenbach & Tielens 1997). To understand the natureof the ISM we thus need to know how the cold dustproperties (temperature, composition, geometrical dis-tribution...) relate to other physical properties such asmetallicity and interstellar radiation field (Boselli et al.2004; Galliano et al. 2008). By combining dust surfacebrightnesses with metallicity dependent gas to dustratios and HI column densities, sub-mm measurementscan be used to determine H2 column densities (Guelinet al. 1993; 1995; Neininger et al. 1996; Boselli etal. 2002). SPIRE data will therefore provide us withan independent measure of the molecular hydrogencomponent, and can be use for an accurate calibrationof the still highly uncertain CO to H2 conversion factor.
3) Study the relationship between dust emissionand star formation. Dust participates in the coolingof the gas through the shielding of the interstellarradiation field, in particular of the UV light, and thusplays a major role in the process of star formation(Draine 1978; Dwek 1986; Hollenbach & Tielens 1997).The energy absorbed by dust is then radiated in theinfrared domain. For the same reason dust emissionhas often been used as a tracer of star formation. Westill do not know, however, what is the relationshipbetween the cold dust emission and star formation. Thestudy of resolved galaxies will allow us to analyze therelationship between the infrared surface brightness andthe dust temperature (Chanial et al. 2007) and to tracethe connections between the star formation and thedust and gas properties at galactic scales, extending therecent results of Spitzer to all phases of the ISM (Gordonet al. 2004, Calzetti et al. 2005, 2007; Perez-Gonzalezet al. 2006; Kennicutt et al. 2007, Prescott et al. 2007;Thilker et al. 2007).
4) Study the dust extinction properties ingalaxies. Astronomers have tackled with the problemof dust opacity in galaxies for over 40 years (e.g.Holmberg 1958; Disney et al. 1989; Calzetti 2001), buthave reached no consensus. The key problem is thatoptical catalogs contain huge selection effects because of
the existence of dust. We will be able to address thisissue in two ways. First, the submillimetre images will,for the first time, allow us to determine the distributionof the dust column density in a very large number ofgalaxies. Second, we will be able to determine the globaldust opacity in each galaxy by using the energy balancebetween the absorbed stellar light and the dust emittedradiation (Buat & Xu 1996, Witt & Gordon 2000, Buatet al. 2002, Cortese et al. 2006; 2008a). This requiresan accurate determination of the UV to near-IR (stellarlight) and mid-IR to sub-mm (dust emission) spectralenergy distribution (Boselli et al. 2003). By comparingthe dust attenuation properties of different classes ofobjects this analysis will allow us to define standardrecipes for correcting UV and optical data, a useful toolfor the interpretation of all modern surveys.
5) Determine whether there is an intergalacticdust cycle. Apart from the obvious possibility thatdust is ejected from galaxies by the same methods thatgas is ejected, such as through interactions with the sur-rounding environment (see point 9) and starburst-driven’superwinds’ as indeed observed in M82 (Engelbrachtet al. 2006), there is also the possibility that dust isejected from galaxies by radiation pressure (Davies etal. 1998, Meiksin 2009, Oppenheimer & Dave 2008).The ejection of dust from galaxies might explain thehuge reservoir of metals found in the intergalacticmedium (Rayan-Weber et al. 2006). There is clearevidence for dust in superwinds (Alton et al. 1999) andthere is tantalizing evidence from ISO observations forextended distributions of dust around galaxies (Altonet al. 1998; Davies et al. 1999). Observations so farhave been limited by either sensitivity (SCUBA) orresolution (ISO and Spitzer). The Herschel ReferenceSurvey will be able to determine whether dust ejectionis important because (i) we will be observing severalhundred galaxies, so even if these phenomena are rareour sample should contain some examples, and (ii) ourobservations will have the sensitivity to detect dust welloutside the optical disc of each galaxy.
6) Determine the amount of interstellar dustin ellipticals. Very little is known about dust inellipticals. Despite the stereotype that ellipticals do notcontain any dust, the structures seen in optical imagesimply that at least 50% of ellipticals contain some dust(Ferrarese et al. 2006). The amount of interstellar dustis too small, however, to be easily detected throughits far infrared emission; IRAS, for example, detectedonly about 15% of ellipticals (Bregman et al. 1998).Although Spitzer has now detected many ellipticals,these studies have mostly been of sources known apriori to contain some dust (Kaneda et al. 2007; Temiet al. 2007; Panuzzo et al. 2007) or molecular gas(Young et al. 2008). The SLUGS did contain a smallstatistically-complete sample of 11 ellipticals, althoughsome of the six 850-µm detections may well have been ofsynchrotron rather than dust emission (Vlahakis et al.2005). Other ellipticals have been detected at 350 µmby Leeuw et al. (2008). The HRS contains 65 early-type(E, S0 and S0a) galaxies and our observations will havesufficient sensitivity to detect dust masses down to∼ 104 M⊙. The Herschel Reference Survey will therefore
5
provide an unambiguous answer to the question of howmuch dust is in ellipticals.
7) Determine the origin of dust in ellipticals.The three possible origins of the dust in ellipticals arethat (i) it has been produced in the atmospheres of theold evolved stars that dominate the light of ellipticalstoday, (ii) its origin is external to the elliptical andis the result of a merger, (iii) it is the relic of dustformed during the active star-forming phase early inthe history of the galaxy. The distribution of dust isan important clue to understand its true origin. Thepresence of the first mechanism is suggested by Spitzermid-infrared spectra of Virgo ellipticals (Bressan et al.2006) which show the silicate emission produced by dustin circumstellar envelopes of evolved stars. The originof this feature (predicted by Bressan et al. 1998) issupported by the finding that the mid-infrared emissionhas the same profile as optical light (Xilouris et al. 2004)in many early-type galaxies. It is unclear, however,whether this is the predominant mechanism producingthe interstellar dust in these galaxies. For example, asubmillimetre map of the nearby elliptical CentaurusA, has revealed a dusty disc, implying that the dust(and the galaxy itself) has been formed as the result ofa merger (Leeuw et al. 2002). Temi et al. (2007) alsofound little correlation between the Spitzer 70 and 160µm emission and optical starlight, which also suggeststhe dust has an external origin.
We will use the Herschel Reference Survey results toinvestigate the origin of the dust by, first, investigatingthe detailed morphology of the dust, in particular howit compares with the stellar distribution, and, second,by investigating whether the mass of dust is correlatedwith other global properties of the galaxy such as stellarmass. It has often been argued that sputtering by theubiquitous, hot X-ray emitting gas in early galaxiesshould destroy any dust formed more than 108 years inthe past (Tielens et al. 1994). However, the fact thatdust is seen visually in 50% of ellipticals (Ferrarese etal. 2006) and the recent discovery of small grains, whichare preferentially destroyed by sputtering, in ellipticals(Kaneda et al. 2007) suggests that dust is protectedin some way. We will investigate whether sputteringfrom the hot gas destroys the dust grains and willtest the internal origin hypothesis by investigating anypossible correlation between X-ray excess and dust mass.
8) Measure the local luminosity and dust-massdistributions. These distributions are importantbenchmarks for the deep Herschel surveys. These havealready been estimated as part of SLUGS (Dunne et al.2000; Vlahakis et al. 2005): the much greater sensitivityof the Herschel Reference Survey will push these limitsdown by a factor of ∼ 50.
9) Understand the role of the environment onthe evolution of galaxies. The well-known phe-nomenon that spiral galaxies in clusters are HI-deficientand have truncated HI discs (eg. Cayatte et al. 1990)demonstrates that the environment of a galaxy can havea strong effect on its interstellar medium. Indeed thereis clear evidence for tidally-stripped dust in interacting
galaxies (Thomas et al. 2002) and indications forram-pressure stripped dust in cluster objects (Boselli& Gavazzi 2006). At the same time the presence ofmetals (Sarazin 1986) and possibly of dust (Stickel etal. 2002; Montier & Giard 2005) in the diffuse intra-cluster medium has been shown by X-ray and far-IRobservations. The comparison of the submillimetreemission of cluster and isolated galaxies within the HRSwill allow us to make a detailed study on the effectsof the environment on the dust properties of galaxies,and thus understand whether the hot and dense clusterintergalactic medium can be polluted through the gasstripping process of late-type galaxies (Boselli & Gavazzi2006).
10) Provide a multi-frequency reference samplesuitable for any statistical study. Our aim isthat the HRS will be the first large sample of galaxieswith observations of all phases of the ISM, as well asmeasurements over the entire wavelength range of thespectral energy distribution (SED) for each galaxy. Thesample will then serve for many purposes e.g. the UVto radio continuum SEDs could, for example, be usedto determine the nature of unresolved sources or astemplates for estimating photometric redshifts.
3. THE SAMPLE
The Herschel Reference Sample (HRS) has beenselected according to the following criteria:
1) Volume-limited: A volume limit was imposedto reduce distance uncertainties due to local peculiarmotions and ensure the presence of low-luminosity,dwarf galaxies, not accessible at high redshift. Byapplying a lower distance (D) limit we exclude the veryextended sources, the observing of which would be tootime consuming 23. We have selected all galaxies withan optical recessional velocity (vel, taken from NED) inbetween 1050 km s−1 and 1750 km s−1 that, for H0 = 70km s−1 Mpc−1 and in the absence of peculiar motions,corresponds to 15 ≤ D ≤ 25 Mpc 24. In the Virgocluster region (12h< R.A.(2000) < 13h; 0◦< dec < 18◦),where peculiar motions are dominant, we have includedall galaxies with vel < 3000 km s−1 and belonging tocluster A, the North (N) and East (E) clouds and theSouthern extension (S) (17 Mpc) and Virgo B (23 Mpc),where the subgroup membership has been taken fromGavazzi et al. (1999a). W and M clouds objects, at adistance of 32 Mpc, have been excluded 25.
2) K band selection: Given the expected low dust
23 A small sample of very nearby and extended galaxies willbe observed in detail as part of another guaranteed time project:Physical Processes in the Interstellar Medium of Very NearbyGalaxies.
24 Given the possible discrepancy between optical and HI reces-sional velocity measurements, heliocentric velocities given in Table1 can be outside this range.
25 The sample was selected before distances were available onNED. According to these new NED estimates, the distance of theHRS galaxies outside the Virgo cluster are generally included in the15 ≤ D ≤ 25 Mpc range. In the Virgo region, however, our dis-tances are determined according to subgroup membership criteria,and are thus generally different than those given by NED
6
content of quiescent galaxies, whose emission would behardly detectable within reasonable integration times,a more stringent limit has been adopted for early-typesthan for star forming galaxies. Among those galaxies inthe required recessional velocity range, we thus selectedall late-type spirals and irregulars (Sa-Sd-Im-BCD) witha 2MASS K band total magnitude KStot ≤ 12 and allellipticals and lenticulars (E, S0, S0a) with KStot ≤ 8.7.
3) High galactic latitude: To minimize galacticcirrus contamination, galaxies have been selected athigh galactic latitude (b > + 55◦) and in low galacticextinction regions (AB < 0.2; Schlegel et al. 1998).
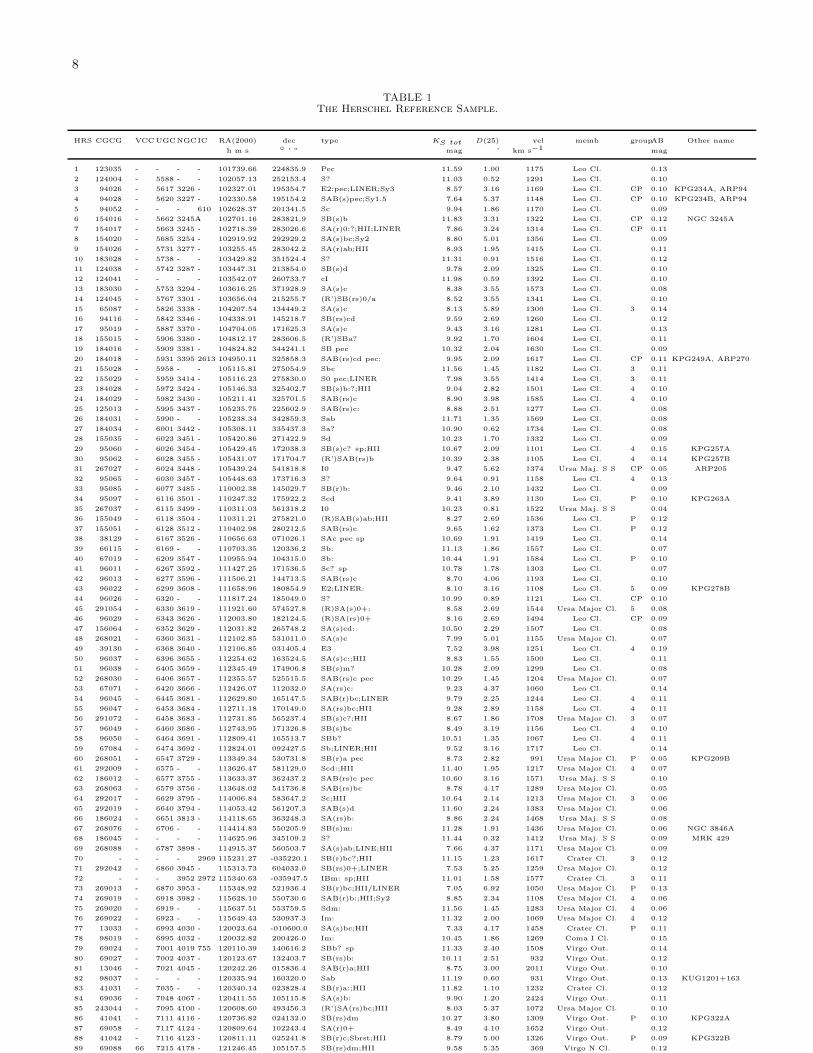
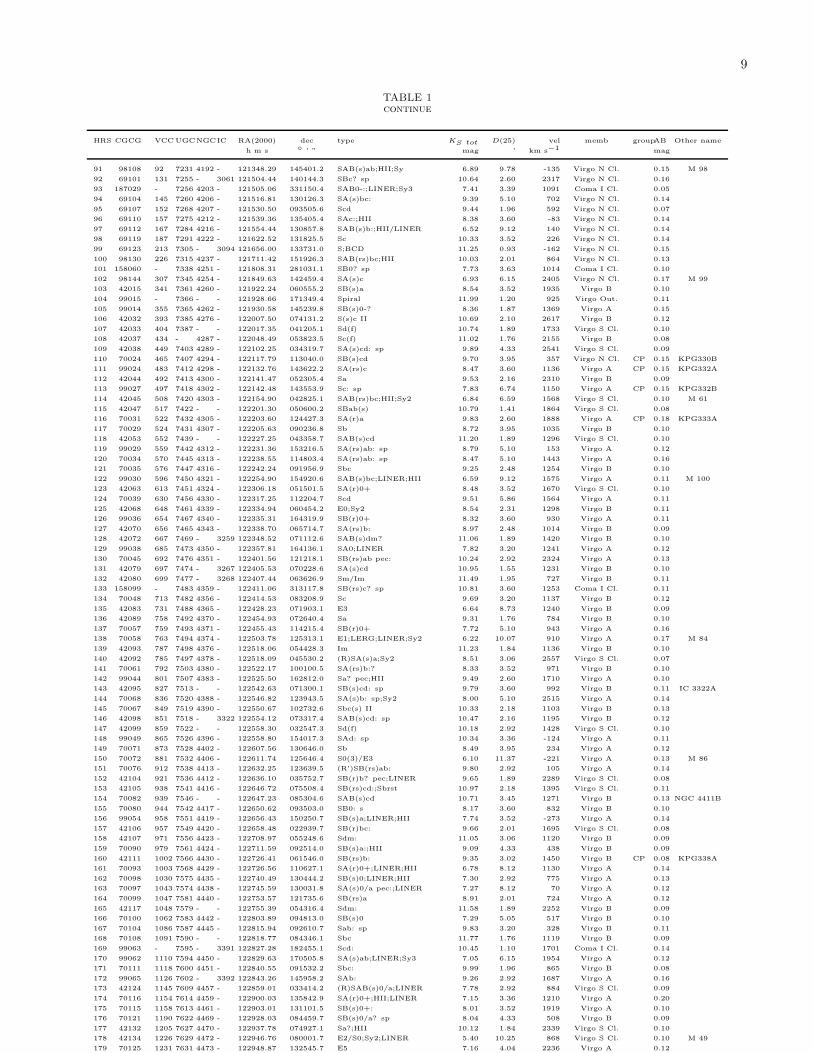
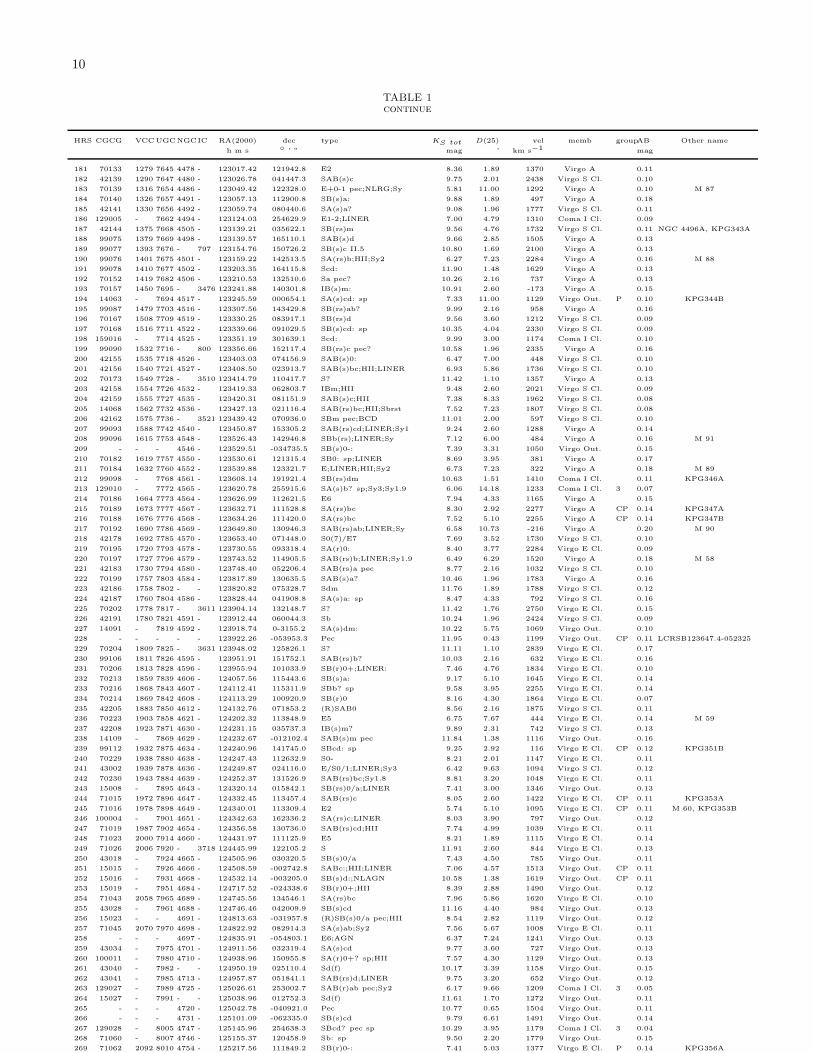
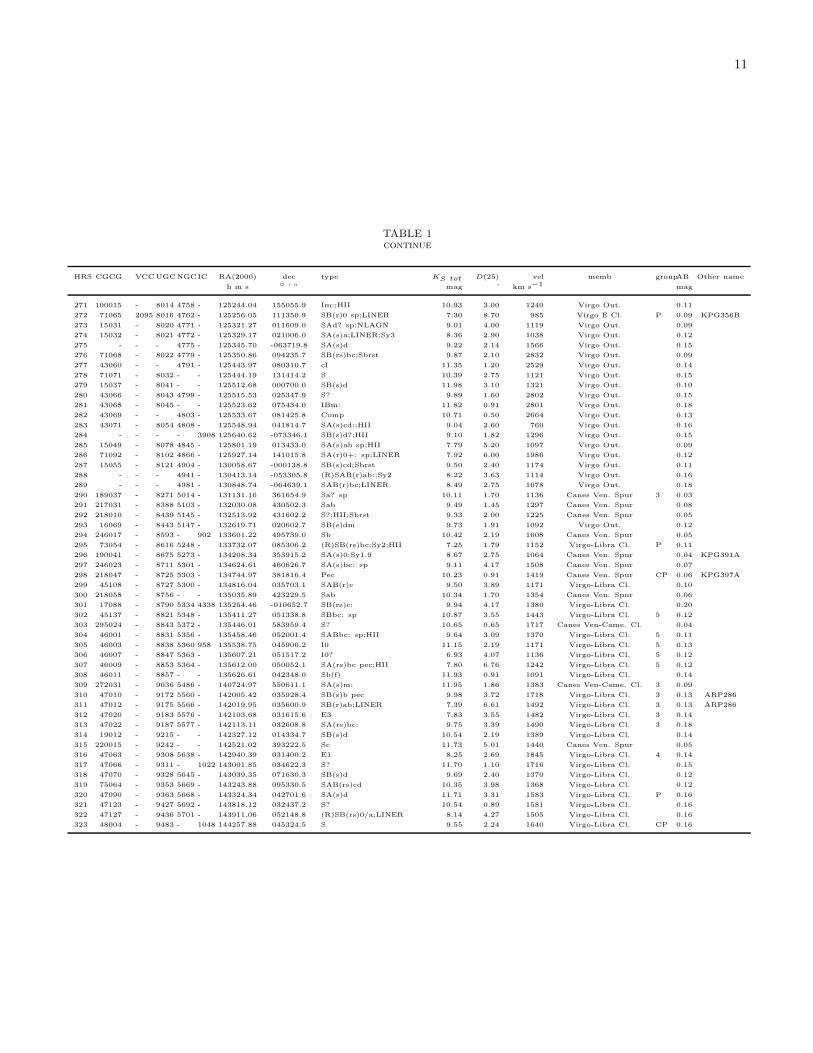
The resulting sample is composed of 323 galaxieslocated in the sky region between 10h17m < R.A.(2000)< 14h43m and -6◦ < dec < 60◦ (see Fig. 1), of which65 are early-type (E, S0 and S0a) and 258 are late-type(Sa-Sd-Im-BCD) (see Fig. 2). Figure 2 shows thatthe only galaxies which are clearly undersampled areblue compact galaxies and dwarf irregulars, the mostnumerous galaxies in the nearby universe. They willbe the targets of another SPIRE key program 26. Asselected, the sample spans a large range in environmentsince it includes the Virgo cluster, many galaxy groupsand pairs as well as relatively isolated objects (Fig. 1).Using the Virgo cluster membership criteria defined inGavazzi et al. (1999a), the HRS includes 82 membersof cluster A and B (Fig. 2) The other galaxies aremembers of nearby clouds such as Leo, Ursa Majorand Ursa Major Southern Spur, Crater, Coma I, CanesVenatici Spur and Canes Venatici - Camelopardalisand Virgo-Libra Clouds (Tully 1988). As defined, thesample is thus ideal for environmental studies (Cortese& Hughes 2009; Hughes & Cortese 2009). The wholesample is given in Table 1 with columns arranged asfollow:
Column 1: Herschel Reference Sample (HRS) name.This is the position of the galaxy in the sample list whensorted by increasing right ascension.Column 2: Zwicky name, from the Catalogue of Galax-ies and of Cluster of Galaxies (CGCG; Zwicky et al.1961-1968).Column 3: Virgo Cluster Catalogue (VCC) name, fromBinggeli et al. (1985).Column 4: Uppsala General Catalog (UGC) name(Nilson 1973).Column 5: New General Catalogue (NGC) name.Column 6: Index Catalogue (IC) name.Columns 7 and 8: J2000 right ascension and declina-tions, taken from NED.Column 9: Morphological type, taken from NED, orfrom our own classification if not available.Column 10: Total K band magnitude (KStot), from2MASS (Skrutskie et al. 2006).Column 11: Optical isophotal diameter (25 magarcsec−2), from NED.Column 12: Heliocentric radial velocity (in km s−1),from HI data when available, otherwise from NED.Column 13: Cluster or cloud membership, from Gavazzi
26 The ISM in Low Metallicity Environments: Bridging the GapBetween Local Universe and Primordial Galaxies
et al. (1999a) for Virgo and Tully (1988) or Nolthenius(1993) whenever available, or from our own estimateotherwise.Column 14: Pair/group membership, from Karachentsevet al. (1972) or from NED whenever available, or fromour own estimate elsewhere. Pair/group membershiphas been assigned according to the following criteria:close pairs (CP) are those with a nearby companion ata distance less than 50 kpc and a difference in redshift< 600 km s−1, as in Gavazzi et al. (1999b), whilepairs (P) up to 150 kpc. The number indicates whetherthe galaxy belongs to a triplet (3), quadruplet (4) andquintuplet (5). Groups outside Virgo and its immediatesurroundings have been determined by counting thenumber of bright galaxies27 within 25 arcmin (which,at a median distance of 20 Mpc, corresponds to ∼ 150kpc) and 600 km s−1. Pairs in the Virgo region are onlythose cataloged by Karachentsev et al. (1972).Column 15: Galactic extinction AB (Schlegel et al.1998).Column 16: Alternative names.
27 For bright galaxies we intend those included in major catalogssuch as NGC, UGC, IC or CGCG.

7
8
TABLE 1The Herschel Reference Sample.
HRS CGCG VCCUGCNGCIC RA(2000) dec type KS tot D(25) vel memb groupAB Other name
h m s ◦ ’ ” mag ’ km s−1 mag
1 123035 - - - - 101739.66 224835.9 Pec 11.59 1.00 1175 Leo Cl. 0.13
2 124004 - 5588 - - 102057.13 252153.4 S? 11.03 0.52 1291 Leo Cl. 0.10
3 94026 - 5617 3226 - 102327.01 195354.7 E2:pec;LINER;Sy3 8.57 3.16 1169 Leo Cl. CP 0.10 KPG234A, ARP94
4 94028 - 5620 3227 - 102330.58 195154.2 SAB(s)pec;Sy1.5 7.64 5.37 1148 Leo Cl. CP 0.10 KPG234B, ARP94
5 94052 - - - 610 102628.37 201341.5 Sc 9.94 1.86 1170 Leo Cl. 0.09
6 154016 - 5662 3245A- 102701.16 283821.9 SB(s)b 11.83 3.31 1322 Leo Cl. CP 0.12 NGC 3245A
7 154017 - 5663 3245 - 102718.39 283026.6 SA(r)0:?;HII;LINER 7.86 3.24 1314 Leo Cl. CP 0.11
8 154020 - 5685 3254 - 102919.92 292929.2 SA(s)bc;Sy2 8.80 5.01 1356 Leo Cl. 0.09
9 154026 - 5731 3277 - 103255.45 283042.2 SA(r)ab;HII 8.93 1.95 1415 Leo Cl. 0.11
10 183028 - 5738 - - 103429.82 351524.4 S? 11.31 0.91 1516 Leo Cl. 0.12
11 124038 - 5742 3287 - 103447.31 213854.0 SB(s)d 9.78 2.09 1325 Leo Cl. 0.10
12 124041 - - - - 103542.07 260733.7 cI 11.98 0.59 1392 Leo Cl. 0.10
13 183030 - 5753 3294 - 103616.25 371928.9 SA(s)c 8.38 3.55 1573 Leo Cl. 0.08
14 124045 - 5767 3301 - 103656.04 215255.7 (R’)SB(rs)0/a 8.52 3.55 1341 Leo Cl. 0.10
15 65087 - 5826 3338 - 104207.54 134449.2 SA(s)c 8.13 5.89 1300 Leo Cl. 3 0.14
16 94116 - 5842 3346 - 104338.91 145218.7 SB(rs)cd 9.59 2.69 1260 Leo Cl. 0.12
17 95019 - 5887 3370 - 104704.05 171625.3 SA(s)c 9.43 3.16 1281 Leo Cl. 0.13
18 155015 - 5906 3380 - 104812.17 283606.5 (R’)SBa? 9.92 1.70 1604 Leo Cl. 0.11
19 184016 - 5909 3381 - 104824.82 344241.1 SB pec 10.32 2.04 1630 Leo Cl. 0.09
20 184018 - 5931 3395 2613 104950.11 325858.3 SAB(rs)cd pec: 9.95 2.09 1617 Leo Cl. CP 0.11 KPG249A, ARP270
21 155028 - 5958 - - 105115.81 275054.9 Sbc 11.56 1.45 1182 Leo Cl. 3 0.11
22 155029 - 5959 3414 - 105116.23 275830.0 S0 pec;LINER 7.98 3.55 1414 Leo Cl. 3 0.11
23 184028 - 5972 3424 - 105146.33 325402.7 SB(s)b:?;HII 9.04 2.82 1501 Leo Cl. 4 0.10
24 184029 - 5982 3430 - 105211.41 325701.5 SAB(rs)c 8.90 3.98 1585 Leo Cl. 4 0.10
25 125013 - 5995 3437 - 105235.75 225602.9 SAB(rs)c: 8.88 2.51 1277 Leo Cl. 0.08
26 184031 - 5990 - - 105238.34 342859.3 Sab 11.71 1.35 1569 Leo Cl. 0.08
27 184034 - 6001 3442 - 105308.11 335437.3 Sa? 10.90 0.62 1734 Leo Cl. 0.08
28 155035 - 6023 3451 - 105420.86 271422.9 Sd 10.23 1.70 1332 Leo Cl. 0.09
29 95060 - 6026 3454 - 105429.45 172038.3 SB(s)c? sp;HII 10.67 2.09 1101 Leo Cl. 4 0.15 KPG257A
30 95062 - 6028 3455 - 105431.07 171704.7 (R’)SAB(rs)b 10.39 2.38 1105 Leo Cl. 4 0.14 KPG257B
31 267027 - 6024 3448 - 105439.24 541818.8 I0 9.47 5.62 1374 Ursa Maj. S S CP 0.05 ARP205
32 95065 - 6030 3457 - 105448.63 173716.3 S? 9.64 0.91 1158 Leo Cl. 4 0.13
33 95085 - 6077 3485 - 110002.38 145029.7 SB(r)b: 9.46 2.10 1432 Leo Cl. 0.09
34 95097 - 6116 3501 - 110247.32 175922.2 Scd 9.41 3.89 1130 Leo Cl. P 0.10 KPG263A
35 267037 - 6115 3499 - 110311.03 561318.2 I0 10.23 0.81 1522 Ursa Maj. S S 0.04
36 155049 - 6118 3504 - 110311.21 275821.0 (R)SAB(s)ab;HII 8.27 2.69 1536 Leo Cl. P 0.12
37 155051 - 6128 3512 - 110402.98 280212.5 SAB(rs)c 9.65 1.62 1373 Leo Cl. P 0.12
38 38129 - 6167 3526 - 110656.63 071026.1 SAc pec sp 10.69 1.91 1419 Leo Cl. 0.14
39 66115 - 6169 - - 110703.35 120336.2 Sb: 11.13 1.86 1557 Leo Cl. 0.07
40 67019 - 6209 3547 - 110955.94 104315.0 Sb: 10.44 1.91 1584 Leo Cl. P 0.10
41 96011 - 6267 3592 - 111427.25 171536.5 Sc? sp 10.78 1.78 1303 Leo Cl. 0.07
42 96013 - 6277 3596 - 111506.21 144713.5 SAB(rs)c 8.70 4.06 1193 Leo Cl. 0.10
43 96022 - 6299 3608 - 111658.96 180854.9 E2;LINER: 8.10 3.16 1108 Leo Cl. 5 0.09 KPG278B
44 96026 - 6320 - - 111817.24 185049.0 S? 10.99 0.89 1121 Leo Cl. CP 0.10
45 291054 - 6330 3619 - 111921.60 574527.8 (R)SA(s)0+: 8.58 2.69 1544 Ursa Major Cl. 5 0.08
46 96029 - 6343 3626 - 112003.80 182124.5 (R)SA(rs)0+ 8.16 2.69 1494 Leo Cl. CP 0.09
47 156064 - 6352 3629 - 112031.82 265748.2 SA(s)cd: 10.50 2.29 1507 Leo Cl. 0.08
48 268021 - 6360 3631 - 112102.85 531011.0 SA(s)c 7.99 5.01 1155 Ursa Major Cl. 0.07
49 39130 - 6368 3640 - 112106.85 031405.4 E3 7.52 3.98 1251 Leo Cl. 4 0.19
50 96037 - 6396 3655 - 112254.62 163524.5 SA(s)c:;HII 8.83 1.55 1500 Leo Cl. 0.11
51 96038 - 6405 3659 - 112345.49 174906.8 SB(s)m? 10.28 2.09 1299 Leo Cl. 0.08
52 268030 - 6406 3657 - 112355.57 525515.5 SAB(rs)c pec 10.29 1.45 1204 Ursa Major Cl. 0.07
53 67071 - 6420 3666 - 112426.07 112032.0 SA(rs)c: 9.23 4.37 1060 Leo Cl. 0.14
54 96045 - 6445 3681 - 112629.80 165147.5 SAB(r)bc;LINER 9.79 2.25 1244 Leo Cl. 4 0.11
55 96047 - 6453 3684 - 112711.18 170149.0 SA(rs)bc;HII 9.28 2.89 1158 Leo Cl. 4 0.11
56 291072 - 6458 3683 - 112731.85 565237.4 SB(s)c?;HII 8.67 1.86 1708 Ursa Major Cl. 3 0.07
57 96049 - 6460 3686 - 112743.95 171326.8 SB(s)bc 8.49 3.19 1156 Leo Cl. 4 0.10
58 96050 - 6464 3691 - 112809.41 165513.7 SBb? 10.51 1.35 1067 Leo Cl. 4 0.11
59 67084 - 6474 3692 - 112824.01 092427.5 Sb;LINER;HII 9.52 3.16 1717 Leo Cl. 0.14
60 268051 - 6547 3729 - 113349.34 530731.8 SB(r)a pec 8.73 2.82 991 Ursa Major Cl. P 0.05 KPG209B
61 292009 - 6575 - - 113626.47 581129.0 Scd:;HII 11.40 1.95 1217 Ursa Major Cl. 4 0.07
62 186012 - 6577 3755 - 113633.37 362437.2 SAB(rs)c pec 10.60 3.16 1571 Ursa Maj. S S 0.10
63 268063 - 6579 3756 - 113648.02 541736.8 SAB(rs)bc 8.78 4.17 1289 Ursa Major Cl. 0.05
64 292017 - 6629 3795 - 114006.84 583647.2 Sc;HII 10.64 2.14 1213 Ursa Major Cl. 3 0.06
65 292019 - 6640 3794 - 114053.42 561207.3 SAB(s)d 11.60 2.24 1383 Ursa Major Cl. 0.06
66 186024 - 6651 3813 - 114118.65 363248.3 SA(rs)b: 8.86 2.24 1468 Ursa Maj. S S 0.08
67 268076 - 6706 - - 114414.83 550205.9 SB(s)m: 11.28 1.91 1436 Ursa Major Cl. 0.06 NGC 3846A
68 186045 - - - - 114625.96 345109.2 S? 11.44 0.32 1412 Ursa Maj. S S 0.09 MRK 429
69 268088 - 6787 3898 - 114915.37 560503.7 SA(s)ab;LINE;HII 7.66 4.37 1171 Ursa Major Cl. 0.09
70 - - - - 2969 115231.27 -035220.1 SB(r)bc?;HII 11.15 1.23 1617 Crater Cl. 3 0.12
71 292042 - 6860 3945 - 115313.73 604032.0 SB(rs)0+;LINER 7.53 5.25 1259 Ursa Major Cl. 0.12
72 - - - 3952 2972 115340.63 -035947.5 IBm: sp;HII 11.01 1.58 1577 Crater Cl. 3 0.11
73 269013 - 6870 3953 - 115348.92 521936.4 SB(r)bc;HII/LINER 7.05 6.92 1050 Ursa Major Cl. P 0.13
74 269019 - 6918 3982 - 115628.10 550730.6 SAB(r)b:;HII;Sy2 8.85 2.34 1108 Ursa Major Cl. 4 0.06
75 269020 - 6919 - - 115637.51 553759.5 Sdm: 11.56 1.45 1283 Ursa Major Cl. 4 0.06
76 269022 - 6923 - - 115649.43 530937.3 Im: 11.32 2.00 1069 Ursa Major Cl. 4 0.12
77 13033 - 6993 4030 - 120023.64 -010600.0 SA(s)bc;HII 7.33 4.17 1458 Crater Cl. P 0.11
78 98019 - 6995 4032 - 120032.82 200426.0 Im: 10.45 1.86 1269 Coma I Cl. 0.15
79 69024 - 7001 4019 755 120110.39 140616.2 SBb? sp 11.33 2.40 1508 Virgo Out. 0.14
80 69027 - 7002 4037 - 120123.67 132403.7 SB(rs)b: 10.11 2.51 932 Virgo Out. 0.12
81 13046 - 7021 4045 - 120242.26 015836.4 SAB(r)a;HII 8.75 3.00 2011 Virgo Out. 0.10
82 98037 - - - - 120335.94 160320.0 Sab 11.19 0.60 931 Virgo Out. 0.13 KUG1201+163
83 41031 - 7035 - - 120340.14 023828.4 SB(r)a:;HII 11.82 1.10 1232 Crater Cl. 0.12
84 69036 - 7048 4067 - 120411.55 105115.8 SA(s)b: 9.90 1.20 2424 Virgo Out. 0.11
85 243044 - 7095 4100 - 120608.60 493456.3 (R’)SA(rs)bc;HII 8.03 5.37 1072 Ursa Major Cl. 0.10
86 41041 - 7111 4116 - 120736.82 024132.0 SB(rs)dm 10.27 3.80 1309 Virgo Out. P 0.10 KPG322A
87 69058 - 7117 4124 - 120809.64 102243.4 SA(r)0+ 8.49 4.10 1652 Virgo Out. 0.12
88 41042 - 7116 4123 - 120811.11 025241.8 SB(r)c;Sbrst;HII 8.79 5.00 1326 Virgo Out. P 0.09 KPG322B
89 69088 66 7215 4178 - 121246.45 105157.5 SB(rs)dm;HII 9.58 5.35 369 Virgo N Cl. 0.12
9
TABLE 1continue
HRS CGCG VCCUGCNGCIC RA(2000) dec type KS tot D(25) vel memb groupAB Other name
h m s ◦ ’ ” mag ’ km s−1 mag
91 98108 92 7231 4192 - 121348.29 145401.2 SAB(s)ab;HII;Sy 6.89 9.78 -135 Virgo N Cl. 0.15 M 98
92 69101 131 7255 - 3061 121504.44 140144.3 SBc? sp 10.64 2.60 2317 Virgo N Cl. 0.16
93 187029 - 7256 4203 - 121505.06 331150.4 SAB0-:;LINER;Sy3 7.41 3.39 1091 Coma I Cl. 0.05
94 69104 145 7260 4206 - 121516.81 130126.3 SA(s)bc: 9.39 5.10 702 Virgo N Cl. 0.14
95 69107 152 7268 4207 - 121530.50 093505.6 Scd 9.44 1.96 592 Virgo N Cl. 0.07
96 69110 157 7275 4212 - 121539.36 135405.4 SAc:;HII 8.38 3.60 -83 Virgo N Cl. 0.14
97 69112 167 7284 4216 - 121554.44 130857.8 SAB(s)b:;HII/LINER 6.52 9.12 140 Virgo N Cl. 0.14
98 69119 187 7291 4222 - 121622.52 131825.5 Sc 10.33 3.52 226 Virgo N Cl. 0.14
99 69123 213 7305 - 3094 121656.00 133731.0 S;BCD 11.25 0.93 -162 Virgo N Cl. 0.15
100 98130 226 7315 4237 - 121711.42 151926.3 SAB(rs)bc;HII 10.03 2.01 864 Virgo N Cl. 0.13
101 158060 - 7338 4251 - 121808.31 281031.1 SB0? sp 7.73 3.63 1014 Coma I Cl. 0.10
102 98144 307 7345 4254 - 121849.63 142459.4 SA(s)c 6.93 6.15 2405 Virgo N Cl. 0.17 M 99
103 42015 341 7361 4260 - 121922.24 060555.2 SB(s)a 8.54 3.52 1935 Virgo B 0.10
104 99015 - 7366 - - 121928.66 171349.4 Spiral 11.99 1.20 925 Virgo Out. 0.11
105 99014 355 7365 4262 - 121930.58 145239.8 SB(s)0-? 8.36 1.87 1369 Virgo A 0.15
106 42032 393 7385 4276 - 122007.50 074131.2 S(s)c II 10.69 2.10 2617 Virgo B 0.12
107 42033 404 7387 - - 122017.35 041205.1 Sd(f) 10.74 1.89 1733 Virgo S Cl. 0.10
108 42037 434 - 4287 - 122048.49 053823.5 Sc(f) 11.02 1.76 2155 Virgo B 0.08
109 42038 449 7403 4289 - 122102.25 034319.7 SA(s)cd: sp 9.89 4.33 2541 Virgo S Cl. 0.09
110 70024 465 7407 4294 - 122117.79 113040.0 SB(s)cd 9.70 3.95 357 Virgo N Cl. CP 0.15 KPG330B
111 99024 483 7412 4298 - 122132.76 143622.2 SA(rs)c 8.47 3.60 1136 Virgo A CP 0.15 KPG332A
112 42044 492 7413 4300 - 122141.47 052305.4 Sa 9.53 2.16 2310 Virgo B 0.09
113 99027 497 7418 4302 - 122142.48 143553.9 Sc: sp 7.83 6.74 1150 Virgo A CP 0.15 KPG332B
114 42045 508 7420 4303 - 122154.90 042825.1 SAB(rs)bc;HII;Sy2 6.84 6.59 1568 Virgo S Cl. 0.10 M 61
115 42047 517 7422 - - 122201.30 050600.2 SBab(s) 10.79 1.41 1864 Virgo S Cl. 0.08
116 70031 522 7432 4305 - 122203.60 124427.3 SA(r)a 9.83 2.60 1888 Virgo A CP 0.18 KPG333A
117 70029 524 7431 4307 - 122205.63 090236.8 Sb 8.72 3.95 1035 Virgo B 0.10
118 42053 552 7439 - - 122227.25 043358.7 SAB(s)cd 11.20 1.89 1296 Virgo S Cl. 0.10
119 99029 559 7442 4312 - 122231.36 153216.5 SA(rs)ab: sp 8.79 5.10 153 Virgo A 0.12
120 70034 570 7445 4313 - 122238.55 114803.4 SA(rs)ab: sp 8.47 5.10 1443 Virgo A 0.16
121 70035 576 7447 4316 - 122242.24 091956.9 Sbc 9.25 2.48 1254 Virgo B 0.10
122 99030 596 7450 4321 - 122254.90 154920.6 SAB(s)bc;LINER;HII 6.59 9.12 1575 Virgo A 0.11 M 100
123 42063 613 7451 4324 - 122306.18 051501.5 SA(r)0+ 8.48 3.52 1670 Virgo S Cl. 0.10
124 70039 630 7456 4330 - 122317.25 112204.7 Scd 9.51 5.86 1564 Virgo A 0.11
125 42068 648 7461 4339 - 122334.94 060454.2 E0;Sy2 8.54 2.31 1298 Virgo B 0.11
126 99036 654 7467 4340 - 122335.31 164319.9 SB(r)0+ 8.32 3.60 930 Virgo A 0.11
127 42070 656 7465 4343 - 122338.70 065714.7 SA(rs)b: 8.97 2.48 1014 Virgo B 0.09
128 42072 667 7469 - 3259 122348.52 071112.6 SAB(s)dm? 11.06 1.89 1420 Virgo B 0.10
129 99038 685 7473 4350 - 122357.81 164136.1 SA0;LINER 7.82 3.20 1241 Virgo A 0.12
130 70045 692 7476 4351 - 122401.56 121218.1 SB(rs)ab pec: 10.24 2.92 2324 Virgo A 0.13
131 42079 697 7474 - 3267 122405.53 070228.6 SA(s)cd 10.95 1.55 1231 Virgo B 0.10
132 42080 699 7477 - 3268 122407.44 063626.9 Sm/Im 11.49 1.95 727 Virgo B 0.11
133 158099 - 7483 4359 - 122411.06 313117.8 SB(rs)c? sp 10.81 3.60 1253 Coma I Cl. 0.11
134 70048 713 7482 4356 - 122414.53 083208.9 Sc 9.69 3.20 1137 Virgo B 0.12
135 42083 731 7488 4365 - 122428.23 071903.1 E3 6.64 8.73 1240 Virgo B 0.09
136 42089 758 7492 4370 - 122454.93 072640.4 Sa 9.31 1.76 784 Virgo B 0.10
137 70057 759 7493 4371 - 122455.43 114215.4 SB(r)0+ 7.72 5.10 943 Virgo A 0.16
138 70058 763 7494 4374 - 122503.78 125313.1 E1;LERG;LINER;Sy2 6.22 10.07 910 Virgo A 0.17 M 84
139 42093 787 7498 4376 - 122518.06 054428.3 Im 11.23 1.84 1136 Virgo B 0.10
140 42092 785 7497 4378 - 122518.09 045530.2 (R)SA(s)a;Sy2 8.51 3.06 2557 Virgo S Cl. 0.07
141 70061 792 7503 4380 - 122522.17 100100.5 SA(rs)b:? 8.33 3.52 971 Virgo B 0.10
142 99044 801 7507 4383 - 122525.50 162812.0 Sa? pec;HII 9.49 2.60 1710 Virgo A 0.10
143 42095 827 7513 - - 122542.63 071300.1 SB(s)cd: sp 9.79 3.60 992 Virgo B 0.11 IC 3322A
144 70068 836 7520 4388 - 122546.82 123943.5 SA(s)b: sp;Sy2 8.00 5.10 2515 Virgo A 0.14
145 70067 849 7519 4390 - 122550.67 102732.6 Sbc(s) II 10.33 2.18 1103 Virgo B 0.13
146 42098 851 7518 - 3322 122554.12 073317.4 SAB(s)cd: sp 10.47 2.16 1195 Virgo B 0.12
147 42099 859 7522 - - 122558.30 032547.3 Sd(f) 10.18 2.92 1428 Virgo S Cl. 0.10
148 99049 865 7526 4396 - 122558.80 154017.3 SAd: sp 10.34 3.36 -124 Virgo A 0.11
149 70071 873 7528 4402 - 122607.56 130646.0 Sb 8.49 3.95 234 Virgo A 0.12
150 70072 881 7532 4406 - 122611.74 125646.4 S0(3)/E3 6.10 11.37 -221 Virgo A 0.13 M 86
151 70076 912 7538 4413 - 122632.25 123639.5 (R’)SB(rs)ab: 9.80 2.92 105 Virgo A 0.14
152 42104 921 7536 4412 - 122636.10 035752.7 SB(r)b? pec;LINER 9.65 1.89 2289 Virgo S Cl. 0.08
153 42105 938 7541 4416 - 122646.72 075508.4 SB(rs)cd:;Sbrst 10.97 2.18 1395 Virgo S Cl. 0.11
154 70082 939 7546 - - 122647.23 085304.6 SAB(s)cd 10.71 3.45 1271 Virgo B 0.13 NGC 4411B
155 70080 944 7542 4417 - 122650.62 093503.0 SB0: s 8.17 3.60 832 Virgo B 0.10
156 99054 958 7551 4419 - 122656.43 150250.7 SB(s)a;LINER;HII 7.74 3.52 -273 Virgo A 0.14
157 42106 957 7549 4420 - 122658.48 022939.7 SB(r)bc: 9.66 2.01 1695 Virgo S Cl. 0.08
158 42107 971 7556 4423 - 122708.97 055248.6 Sdm: 11.05 3.06 1120 Virgo B 0.09
159 70090 979 7561 4424 - 122711.59 092514.0 SB(s)a:;HII 9.09 4.33 438 Virgo B 0.09
160 42111 1002 7566 4430 - 122726.41 061546.0 SB(rs)b: 9.35 3.02 1450 Virgo B CP 0.08 KPG338A
161 70093 1003 7568 4429 - 122726.56 110627.1 SA(r)0+;LINER;HII 6.78 8.12 1130 Virgo A 0.14
162 70098 1030 7575 4435 - 122740.49 130444.2 SB(s)0;LINER;HII 7.30 2.92 775 Virgo A 0.13
163 70097 1043 7574 4438 - 122745.59 130031.8 SA(s)0/a pec:;LINER 7.27 8.12 70 Virgo A 0.12
164 70099 1047 7581 4440 - 122753.57 121735.6 SB(rs)a 8.91 2.01 724 Virgo A 0.12
165 42117 1048 7579 - - 122755.39 054316.4 Sdm: 11.58 1.89 2252 Virgo B 0.09
166 70100 1062 7583 4442 - 122803.89 094813.0 SB(s)0 7.29 5.05 517 Virgo B 0.10
167 70104 1086 7587 4445 - 122815.94 092610.7 Sab: sp 9.83 3.20 328 Virgo B 0.11
168 70108 1091 7590 - - 122818.77 084346.1 Sbc 11.77 1.76 1119 Virgo B 0.09
169 99063 - 7595 - 3391 122827.28 182455.1 Scd: 10.45 1.10 1701 Coma I Cl. 0.14
170 99062 1110 7594 4450 - 122829.63 170505.8 SA(s)ab;LINER;Sy3 7.05 6.15 1954 Virgo A 0.12
171 70111 1118 7600 4451 - 122840.55 091532.2 Sbc: 9.99 1.96 865 Virgo B 0.08
172 99065 1126 7602 - 3392 122843.26 145958.2 SAb: 9.26 2.92 1687 Virgo A 0.16
173 42124 1145 7609 4457 - 122859.01 033414.2 (R)SAB(s)0/a;LINER 7.78 2.92 884 Virgo S Cl. 0.09
174 70116 1154 7614 4459 - 122900.03 135842.9 SA(r)0+;HII;LINER 7.15 3.36 1210 Virgo A 0.20
175 70115 1158 7613 4461 - 122903.01 131101.5 SB(s)0+: 8.01 3.52 1919 Virgo A 0.10
176 70121 1190 7622 4469 - 122928.03 084459.7 SB(s)0/a? sp 8.04 4.33 508 Virgo B 0.09
177 42132 1205 7627 4470 - 122937.78 074927.1 Sa?;HII 10.12 1.84 2339 Virgo S Cl. 0.10
178 42134 1226 7629 4472 - 122946.76 080001.7 E2/S0;Sy2;LINER 5.40 10.25 868 Virgo S Cl. 0.10 M 49
179 70125 1231 7631 4473 - 122948.87 132545.7 E5 7.16 4.04 2236 Virgo A 0.12
10
TABLE 1continue
HRS CGCG VCCUGCNGCIC RA(2000) dec type KS tot D(25) vel memb groupAB Other name
h m s ◦ ’ ” mag ’ km s−1 mag
181 70133 1279 7645 4478 - 123017.42 121942.8 E2 8.36 1.89 1370 Virgo A 0.11
182 42139 1290 7647 4480 - 123026.78 041447.3 SAB(s)c 9.75 2.01 2438 Virgo S Cl. 0.10
183 70139 1316 7654 4486 - 123049.42 122328.0 E+0-1 pec;NLRG;Sy 5.81 11.00 1292 Virgo A 0.10 M 87
184 70140 1326 7657 4491 - 123057.13 112900.8 SB(s)a: 9.88 1.89 497 Virgo A 0.18
185 42141 1330 7656 4492 - 123059.74 080440.6 SA(s)a? 9.08 1.96 1777 Virgo S Cl. 0.11
186 129005 - 7662 4494 - 123124.03 254629.9 E1-2;LINER 7.00 4.79 1310 Coma I Cl. 0.09
187 42144 1375 7668 4505 - 123139.21 035622.1 SB(rs)m 9.56 4.76 1732 Virgo S Cl. 0.11 NGC 4496A, KPG343A
188 99075 1379 7669 4498 - 123139.57 165110.1 SAB(s)d 9.66 2.85 1505 Virgo A 0.13
189 99077 1393 7676 - 797 123154.76 150726.2 SB(s)c II.5 10.80 1.69 2100 Virgo A 0.13
190 99076 1401 7675 4501 - 123159.22 142513.5 SA(rs)b;HII;Sy2 6.27 7.23 2284 Virgo A 0.16 M 88
191 99078 1410 7677 4502 - 123203.35 164115.8 Scd: 11.90 1.48 1629 Virgo A 0.13
192 70152 1419 7682 4506 - 123210.53 132510.6 Sa pec? 10.26 2.16 737 Virgo A 0.13
193 70157 1450 7695 - 3476 123241.88 140301.8 IB(s)m: 10.91 2.60 -173 Virgo A 0.15
194 14063 - 7694 4517 - 123245.59 000654.1 SA(s)cd: sp 7.33 11.00 1129 Virgo Out. P 0.10 KPG344B
195 99087 1479 7703 4516 - 123307.56 143429.8 SB(rs)ab? 9.99 2.16 958 Virgo A 0.16
196 70167 1508 7709 4519 - 123330.25 083917.1 SB(rs)d 9.56 3.60 1212 Virgo S Cl. 0.09
197 70168 1516 7711 4522 - 123339.66 091029.5 SB(s)cd: sp 10.35 4.04 2330 Virgo S Cl. 0.09
198 159016 - 7714 4525 - 123351.19 301639.1 Scd: 9.99 3.00 1174 Coma I Cl. 0.10
199 99090 1532 7716 - 800 123356.66 152117.4 SB(rs)c pec? 10.58 1.96 2335 Virgo A 0.16
200 42155 1535 7718 4526 - 123403.03 074156.9 SAB(s)0: 6.47 7.00 448 Virgo S Cl. 0.10
201 42156 1540 7721 4527 - 123408.50 023913.7 SAB(s)bc;HII;LINER 6.93 5.86 1736 Virgo S Cl. 0.10
202 70173 1549 7728 - 3510 123414.79 110417.7 S? 11.42 1.10 1357 Virgo A 0.13
203 42158 1554 7726 4532 - 123419.33 062803.7 IBm;HII 9.48 2.60 2021 Virgo S Cl. 0.09
204 42159 1555 7727 4535 - 123420.31 081151.9 SAB(s)c;HII 7.38 8.33 1962 Virgo S Cl. 0.08
205 14068 1562 7732 4536 - 123427.13 021116.4 SAB(rs)bc;HII;Sbrst 7.52 7.23 1807 Virgo S Cl. 0.08
206 42162 1575 7736 - 3521 123439.42 070936.0 SBm pec;BCD 11.01 2.00 597 Virgo S Cl. 0.10
207 99093 1588 7742 4540 - 123450.87 153305.2 SAB(rs)cd;LINER;Sy1 9.24 2.60 1288 Virgo A 0.14
208 99096 1615 7753 4548 - 123526.43 142946.8 SBb(rs);LINER;Sy 7.12 6.00 484 Virgo A 0.16 M 91
209 - - - 4546 - 123529.51 -034735.5 SB(s)0-: 7.39 3.31 1050 Virgo Out. 0.15
210 70182 1619 7757 4550 - 123530.61 121315.4 SB0: sp;LINER 8.69 3.95 381 Virgo A 0.17
211 70184 1632 7760 4552 - 123539.88 123321.7 E;LINER;HII;Sy2 6.73 7.23 322 Virgo A 0.18 M 89
212 99098 - 7768 4561 - 123608.14 191921.4 SB(rs)dm 10.63 1.51 1410 Coma I Cl. 0.11 KPG346A
213 129010 - 7772 4565 - 123620.78 255915.6 SA(s)b? sp;Sy3;Sy1.9 6.06 14.18 1233 Coma I Cl. 3 0.07
214 70186 1664 7773 4564 - 123626.99 112621.5 E6 7.94 4.33 1165 Virgo A 0.15
215 70189 1673 7777 4567 - 123632.71 111528.8 SA(rs)bc 8.30 2.92 2277 Virgo A CP 0.14 KPG347A
216 70188 1676 7776 4568 - 123634.26 111420.0 SA(rs)bc 7.52 5.10 2255 Virgo A CP 0.14 KPG347B
217 70192 1690 7786 4569 - 123649.80 130946.3 SAB(rs)ab;LINER;Sy 6.58 10.73 -216 Virgo A 0.20 M 90
218 42178 1692 7785 4570 - 123653.40 071448.0 S0(7)/E7 7.69 3.52 1730 Virgo S Cl. 0.10
219 70195 1720 7793 4578 - 123730.55 093318.4 SA(r)0: 8.40 3.77 2284 Virgo E Cl. 0.09
220 70197 1727 7796 4579 - 123743.52 114905.5 SAB(rs)b;LINER;Sy1.9 6.49 6.29 1520 Virgo A 0.18 M 58
221 42183 1730 7794 4580 - 123748.40 052206.4 SAB(rs)a pec 8.77 2.16 1032 Virgo S Cl. 0.10
222 70199 1757 7803 4584 - 123817.89 130635.5 SAB(s)a? 10.46 1.96 1783 Virgo A 0.16
223 42186 1758 7802 - - 123820.82 075328.7 Sdm 11.76 1.89 1788 Virgo S Cl. 0.12
224 42187 1760 7804 4586 - 123828.44 041908.8 SA(s)a: sp 8.47 4.33 792 Virgo S Cl. 0.16
225 70202 1778 7817 - 3611 123904.14 132148.7 S? 11.42 1.76 2750 Virgo E Cl. 0.15
226 42191 1780 7821 4591 - 123912.44 060044.3 Sb 10.24 1.96 2424 Virgo S Cl. 0.09
227 14091 - 7819 4592 - 123918.74 0-3155.2 SA(s)dm: 10.22 5.75 1069 Virgo Out. 0.10
228 - - - - - 123922.26 -053953.3 Pec 11.95 0.43 1199 Virgo Out. CP 0.11 LCRSB123647.4-052325
229 70204 1809 7825 - 3631 123948.02 125826.1 S? 11.11 1.10 2839 Virgo E Cl. 0.17
230 99106 1811 7826 4595 - 123951.91 151752.1 SAB(rs)b? 10.03 2.16 632 Virgo E Cl. 0.16
231 70206 1813 7828 4596 - 123955.94 101033.9 SB(r)0+;LINER: 7.46 4.76 1834 Virgo E Cl. 0.10
232 70213 1859 7839 4606 - 124057.56 115443.6 SB(s)a: 9.17 5.10 1645 Virgo E Cl. 0.14
233 70216 1868 7843 4607 - 124112.41 115311.9 SBb? sp 9.58 3.95 2255 Virgo E Cl. 0.14
234 70214 1869 7842 4608 - 124113.29 100920.9 SB(r)0 8.16 4.30 1864 Virgo E Cl. 0.07
235 42205 1883 7850 4612 - 124132.76 071853.2 (R)SAB0 8.56 2.16 1875 Virgo S Cl. 0.11
236 70223 1903 7858 4621 - 124202.32 113848.9 E5 6.75 7.67 444 Virgo E Cl. 0.14 M 59
237 42208 1923 7871 4630 - 124231.15 035737.3 IB(s)m? 9.89 2.31 742 Virgo S Cl. 0.13
238 14109 - 7869 4629 - 124232.67 -012102.4 SAB(s)m pec 11.84 1.38 1116 Virgo Out. 0.16
239 99112 1932 7875 4634 - 124240.96 141745.0 SBcd: sp 9.25 2.92 116 Virgo E Cl. CP 0.12 KPG351B
240 70229 1938 7880 4638 - 124247.43 112632.9 S0- 8.21 2.01 1147 Virgo E Cl. 0.11
241 43002 1939 7878 4636 - 124249.87 024116.0 E/S0/1;LINER;Sy3 6.42 9.63 1094 Virgo S Cl. 0.12
242 70230 1943 7884 4639 - 124252.37 131526.9 SAB(rs)bc;Sy1.8 8.81 3.20 1048 Virgo E Cl. 0.11
243 15008 - 7895 4643 - 124320.14 015842.1 SB(rs)0/a;LINER 7.41 3.00 1346 Virgo Out. 0.13
244 71015 1972 7896 4647 - 124332.45 113457.4 SAB(rs)c 8.05 2.60 1422 Virgo E Cl. CP 0.11 KPG353A
245 71016 1978 7898 4649 - 124340.01 113309.4 E2 5.74 5.10 1095 Virgo E Cl. CP 0.11 M 60, KPG353B
246 100004 - 7901 4651 - 124342.63 162336.2 SA(rs)c;LINER 8.03 3.90 797 Virgo Out. 0.12
247 71019 1987 7902 4654 - 124356.58 130736.0 SAB(rs)cd;HII 7.74 4.99 1039 Virgo E Cl. 0.11
248 71023 2000 7914 4660 - 124431.97 111125.9 E5 8.21 1.89 1115 Virgo E Cl. 0.14
249 71026 2006 7920 - 3718 124445.99 122105.2 S 11.91 2.60 844 Virgo E Cl. 0.13
250 43018 - 7924 4665 - 124505.96 030320.5 SB(s)0/a 7.43 4.50 785 Virgo Out. 0.11
251 15015 - 7926 4666 - 124508.59 -002742.8 SABc:;HII;LINER 7.06 4.57 1513 Virgo Out. CP 0.11
252 15016 - 7931 4668 - 124532.14 -003205.0 SB(s)d:;NLAGN 10.58 1.38 1619 Virgo Out. CP 0.11
253 15019 - 7951 4684 - 124717.52 -024338.6 SB(r)0+;HII 8.39 2.88 1490 Virgo Out. 0.12
254 71043 2058 7965 4689 - 124745.56 134546.1 SA(rs)bc 7.96 5.86 1620 Virgo E Cl. 0.10
255 43028 - 7961 4688 - 124746.46 042009.9 SB(s)cd 11.16 4.40 984 Virgo Out. 0.13
256 15023 - - 4691 - 124813.63 -031957.8 (R)SB(s)0/a pec;HII 8.54 2.82 1119 Virgo Out. 0.12
257 71045 2070 7970 4698 - 124822.92 082914.3 SA(s)ab;Sy2 7.56 5.67 1008 Virgo E Cl. 0.11
258 - - - 4697 - 124835.91 -054803.1 E6;AGN 6.37 7.24 1241 Virgo Out. 0.13
259 43034 - 7975 4701 - 124911.56 032319.4 SA(s)cd 9.77 3.60 727 Virgo Out. 0.13
260 100011 - 7980 4710 - 124938.96 150955.8 SA(r)0+? sp;HII 7.57 4.30 1129 Virgo Out. 0.13
261 43040 - 7982 - - 124950.19 025110.4 Sd(f) 10.17 3.39 1158 Virgo Out. 0.15
262 43041 - 7985 4713 - 124957.87 051841.1 SAB(rs)d;LINER 9.75 3.20 652 Virgo Out. 0.12
263 129027 - 7989 4725 - 125026.61 253002.7 SAB(r)ab pec;Sy2 6.17 9.66 1209 Coma I Cl. 3 0.05
264 15027 - 7991 - - 125038.96 012752.3 Sd(f) 11.61 1.70 1272 Virgo Out. 0.11
265 - - - 4720 - 125042.78 -040921.0 Pec 10.77 0.65 1504 Virgo Out. 0.11
266 - - - 4731 - 125101.09 -062335.0 SB(s)cd 9.79 6.61 1491 Virgo Out. 0.14
267 129028 - 8005 4747 - 125145.96 254638.3 SBcd? pec sp 10.29 3.95 1179 Coma I Cl. 3 0.04
268 71060 - 8007 4746 - 125155.37 120458.9 Sb: sp 9.50 2.20 1779 Virgo Out. 0.15
269 71062 2092 8010 4754 - 125217.56 111849.2 SB(r)0-: 7.41 5.03 1377 Virgo E Cl. P 0.14 KPG356A
11
TABLE 1continue
HRS CGCG VCCUGCNGCIC RA(2000) dec type KS tot D(25) vel memb groupAB Other name
h m s ◦ ’ ” mag ’ km s−1 mag
271 100015 - 8014 4758 - 125244.04 155055.9 Im:;HII 10.93 3.00 1240 Virgo Out. 0.11
272 71065 2095 8016 4762 - 125256.05 111350.9 SB(r)0 sp;LINER 7.30 8.70 985 Virgo E Cl. P 0.09 KPG356B
273 15031 - 8020 4771 - 125321.27 011609.0 SAd? sp;NLAGN 9.01 4.00 1119 Virgo Out. 0.09
274 15032 - 8021 4772 - 125329.17 021006.0 SA(s)a;LINER;Sy3 8.36 2.90 1038 Virgo Out. 0.12
275 - - - 4775 - 125345.70 -063719.8 SA(s)d 9.22 2.14 1566 Virgo Out. 0.15
276 71068 - 8022 4779 - 125350.86 094235.7 SB(rs)bc;Sbrst 9.87 2.10 2832 Virgo Out. 0.09
277 43060 - - 4791 - 125443.97 080310.7 cI 11.35 1.20 2529 Virgo Out. 0.14
278 71071 - 8032 - - 125444.19 131414.2 S 10.39 2.75 1121 Virgo Out. 0.15
279 15037 - 8041 - - 125512.68 000700.0 SB(s)d 11.98 3.10 1321 Virgo Out. 0.10
280 43066 - 8043 4799 - 125515.53 025347.9 S? 9.89 1.60 2802 Virgo Out. 0.15
281 43068 - 8045 - - 125523.62 075434.0 IBm: 11.82 0.91 2801 Virgo Out. 0.18
282 43069 - - 4803 - 125533.67 081425.8 Comp 10.71 0.50 2664 Virgo Out. 0.13
283 43071 - 8054 4808 - 125548.94 041814.7 SA(s)cd:;HII 9.04 2.60 760 Virgo Out. 0.16
284 - - - - 3908 125640.62 -073346.1 SB(s)d?;HII 9.10 1.82 1296 Virgo Out. 0.15
285 15049 - 8078 4845 - 125801.19 013433.0 SA(s)ab sp;HII 7.79 5.20 1097 Virgo Out. 0.09
286 71092 - 8102 4866 - 125927.14 141015.8 SA(r)0+: sp;LINER 7.92 6.00 1986 Virgo Out. 0.12
287 15055 - 8121 4904 - 130058.67 -000138.8 SB(s)cd;Sbrst 9.50 2.40 1174 Virgo Out. 0.11
288 - - - 4941 - 130413.14 -053305.8 (R)SAB(r)ab:;Sy2 8.22 3.63 1114 Virgo Out. 0.16
289 - - - 4981 - 130848.74 -064639.1 SAB(r)bc;LINER 8.49 2.75 1678 Virgo Out. 0.18
290 189037 - 8271 5014 - 131131.16 361654.9 Sa? sp 10.11 1.70 1136 Canes Ven. Spur 3 0.03
291 217031 - 8388 5103 - 132030.08 430502.3 Sab 9.49 1.45 1297 Canes Ven. Spur 0.08
292 218010 - 8439 5145 - 132513.92 431602.2 S?;HII;Sbrst 9.33 2.00 1225 Canes Ven. Spur 0.05
293 16069 - 8443 5147 - 132619.71 020602.7 SB(s)dm 9.73 1.91 1092 Virgo Out. 0.12
294 246017 - 8593 - 902 133601.22 495739.0 Sb 10.42 2.19 1608 Canes Ven. Spur 0.05
295 73054 - 8616 5248 - 133732.07 085306.2 (R)SB(rs)bc;Sy2;HII 7.25 1.79 1152 Virgo-Libra Cl. P 0.11
296 190041 - 8675 5273 - 134208.34 353915.2 SA(s)0;Sy1.9 8.67 2.75 1064 Canes Ven. Spur 0.04 KPG391A
297 246023 - 8711 5301 - 134624.61 460626.7 SA(s)bc: sp 9.11 4.17 1508 Canes Ven. Spur 0.07
298 218047 - 8725 5303 - 134744.97 381816.4 Pec 10.23 0.91 1419 Canes Ven. Spur CP 0.06 KPG397A
299 45108 - 8727 5300 - 134816.04 035703.1 SAB(r)c 9.50 3.89 1171 Virgo-Libra Cl. 0.10
300 218058 - 8756 - - 135035.89 423229.5 Sab 10.34 1.70 1354 Canes Ven. Spur 0.06
301 17088 - 8790 5334 4338 135254.46 -010652.7 SB(rs)c: 9.94 4.17 1380 Virgo-Libra Cl. 0.20
302 45137 - 8821 5348 - 135411.27 051338.8 SBbc: sp 10.87 3.55 1443 Virgo-Libra Cl. 5 0.12
303 295024 - 8843 5372 - 135446.01 583959.4 S? 10.65 0.65 1717 Canes Ven-Came. Cl. 0.04
304 46001 - 8831 5356 - 135458.46 052001.4 SABbc: sp;HII 9.64 3.09 1370 Virgo-Libra Cl. 5 0.11
305 46003 - 8838 5360 958 135538.75 045906.2 I0 11.15 2.19 1171 Virgo-Libra Cl. 5 0.13
306 46007 - 8847 5363 - 135607.21 051517.2 I0? 6.93 4.07 1136 Virgo-Libra Cl. 5 0.12
307 46009 - 8853 5364 - 135612.00 050052.1 SA(rs)bc pec;HII 7.80 6.76 1242 Virgo-Libra Cl. 5 0.12
308 46011 - 8857 - - 135626.61 042348.0 Sb(f) 11.93 0.91 1091 Virgo-Libra Cl. 0.14
309 272031 - 9036 5486 - 140724.97 550611.1 SA(s)m: 11.95 1.86 1383 Canes Ven-Came. Cl. 3 0.09
310 47010 - 9172 5560 - 142005.42 035928.4 SB(s)b pec 9.98 3.72 1718 Virgo-Libra Cl. 3 0.13 ARP286
311 47012 - 9175 5566 - 142019.95 035600.9 SB(r)ab;LINER 7.39 6.61 1492 Virgo-Libra Cl. 3 0.13 ARP286
312 47020 - 9183 5576 - 142103.68 031615.6 E3 7.83 3.55 1482 Virgo-Libra Cl. 3 0.14
313 47022 - 9187 5577 - 142113.11 032608.8 SA(rs)bc: 9.75 3.39 1490 Virgo-Libra Cl. 3 0.18
314 19012 - 9215 - - 142327.12 014334.7 SB(s)d 10.54 2.19 1389 Virgo-Libra Cl. 0.14
315 220015 - 9242 - - 142521.02 393222.5 Sc 11.73 5.01 1440 Canes Ven. Spur 0.05
316 47063 - 9308 5638 - 142940.39 031400.2 E1 8.25 2.69 1845 Virgo-Libra Cl. 4 0.14
317 47066 - 9311 - 1022 143001.85 034622.3 S? 11.70 1.10 1716 Virgo-Libra Cl. 0.15
318 47070 - 9328 5645 - 143039.35 071630.3 SB(s)d 9.69 2.40 1370 Virgo-Libra Cl. 0.12
319 75064 - 9353 5669 - 143243.88 095330.5 SAB(rs)cd 10.35 3.98 1368 Virgo-Libra Cl. 0.12
320 47090 - 9363 5668 - 143324.34 042701.6 SA(s)d 11.71 3.31 1583 Virgo-Libra Cl. P 0.16
321 47123 - 9427 5692 - 143818.12 032437.2 S? 10.54 0.89 1581 Virgo-Libra Cl. 0.16
322 47127 - 9436 5701 - 143911.06 052148.8 (R)SB(rs)0/a;LINER 8.14 4.27 1505 Virgo-Libra Cl. 0.16
323 48004 - 9483 - 1048 144257.88 045324.5 S 9.55 2.24 1640 Virgo-Libra Cl. CP 0.16
12
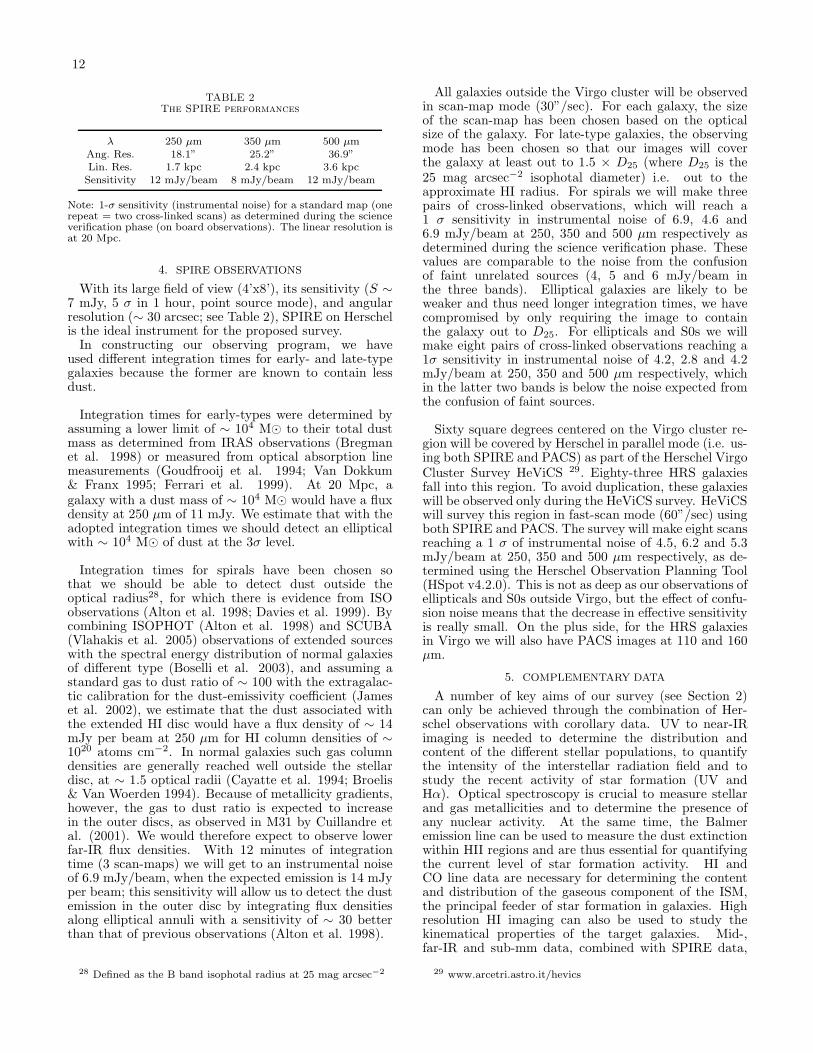
TABLE 2The SPIRE performances
λ 250 µm 350 µm 500 µmAng. Res. 18.1” 25.2” 36.9”Lin. Res. 1.7 kpc 2.4 kpc 3.6 kpcSensitivity 12 mJy/beam 8 mJy/beam 12 mJy/beam
Note: 1-σ sensitivity (instrumental noise) for a standard map (onerepeat = two cross-linked scans) as determined during the scienceverification phase (on board observations). The linear resolution isat 20 Mpc.
4. SPIRE OBSERVATIONS
With its large field of view (4’x8’), its sensitivity (S ∼
7 mJy, 5 σ in 1 hour, point source mode), and angularresolution (∼ 30 arcsec; see Table 2), SPIRE on Herschelis the ideal instrument for the proposed survey.In constructing our observing program, we have
used different integration times for early- and late-typegalaxies because the former are known to contain lessdust.
Integration times for early-types were determined byassuming a lower limit of ∼ 104 M⊙ to their total dustmass as determined from IRAS observations (Bregmanet al. 1998) or measured from optical absorption linemeasurements (Goudfrooij et al. 1994; Van Dokkum& Franx 1995; Ferrari et al. 1999). At 20 Mpc, agalaxy with a dust mass of ∼ 104 M⊙ would have a fluxdensity at 250 µm of 11 mJy. We estimate that with theadopted integration times we should detect an ellipticalwith ∼ 104 M⊙ of dust at the 3σ level.
Integration times for spirals have been chosen sothat we should be able to detect dust outside theoptical radius28, for which there is evidence from ISOobservations (Alton et al. 1998; Davies et al. 1999). Bycombining ISOPHOT (Alton et al. 1998) and SCUBA(Vlahakis et al. 2005) observations of extended sourceswith the spectral energy distribution of normal galaxiesof different type (Boselli et al. 2003), and assuming astandard gas to dust ratio of ∼ 100 with the extragalac-tic calibration for the dust-emissivity coefficient (Jameset al. 2002), we estimate that the dust associated withthe extended HI disc would have a flux density of ∼ 14mJy per beam at 250 µm for HI column densities of ∼1020 atoms cm−2. In normal galaxies such gas columndensities are generally reached well outside the stellardisc, at ∼ 1.5 optical radii (Cayatte et al. 1994; Broelis& Van Woerden 1994). Because of metallicity gradients,however, the gas to dust ratio is expected to increasein the outer discs, as observed in M31 by Cuillandre etal. (2001). We would therefore expect to observe lowerfar-IR flux densities. With 12 minutes of integrationtime (3 scan-maps) we will get to an instrumental noiseof 6.9 mJy/beam, when the expected emission is 14 mJyper beam; this sensitivity will allow us to detect the dustemission in the outer disc by integrating flux densitiesalong elliptical annuli with a sensitivity of ∼ 30 betterthan that of previous observations (Alton et al. 1998).
28 Defined as the B band isophotal radius at 25 mag arcsec−2
All galaxies outside the Virgo cluster will be observedin scan-map mode (30”/sec). For each galaxy, the sizeof the scan-map has been chosen based on the opticalsize of the galaxy. For late-type galaxies, the observingmode has been chosen so that our images will coverthe galaxy at least out to 1.5 × D25 (where D25 is the25 mag arcsec−2 isophotal diameter) i.e. out to theapproximate HI radius. For spirals we will make threepairs of cross-linked observations, which will reach a1 σ sensitivity in instrumental noise of 6.9, 4.6 and6.9 mJy/beam at 250, 350 and 500 µm respectively asdetermined during the science verification phase. Thesevalues are comparable to the noise from the confusionof faint unrelated sources (4, 5 and 6 mJy/beam inthe three bands). Elliptical galaxies are likely to beweaker and thus need longer integration times, we havecompromised by only requiring the image to containthe galaxy out to D25. For ellipticals and S0s we willmake eight pairs of cross-linked observations reaching a1σ sensitivity in instrumental noise of 4.2, 2.8 and 4.2mJy/beam at 250, 350 and 500 µm respectively, whichin the latter two bands is below the noise expected fromthe confusion of faint sources.
Sixty square degrees centered on the Virgo cluster re-gion will be covered by Herschel in parallel mode (i.e. us-ing both SPIRE and PACS) as part of the Herschel VirgoCluster Survey HeViCS 29. Eighty-three HRS galaxiesfall into this region. To avoid duplication, these galaxieswill be observed only during the HeViCS survey. HeViCSwill survey this region in fast-scan mode (60”/sec) usingboth SPIRE and PACS. The survey will make eight scansreaching a 1 σ of instrumental noise of 4.5, 6.2 and 5.3mJy/beam at 250, 350 and 500 µm respectively, as de-termined using the Herschel Observation Planning Tool(HSpot v4.2.0). This is not as deep as our observations ofellipticals and S0s outside Virgo, but the effect of confu-sion noise means that the decrease in effective sensitivityis really small. On the plus side, for the HRS galaxiesin Virgo we will also have PACS images at 110 and 160µm.
5. COMPLEMENTARY DATA
A number of key aims of our survey (see Section 2)can only be achieved through the combination of Her-schel observations with corollary data. UV to near-IRimaging is needed to determine the distribution andcontent of the different stellar populations, to quantifythe intensity of the interstellar radiation field and tostudy the recent activity of star formation (UV andHα). Optical spectroscopy is crucial to measure stellarand gas metallicities and to determine the presence ofany nuclear activity. At the same time, the Balmeremission line can be used to measure the dust extinctionwithin HII regions and are thus essential for quantifyingthe current level of star formation activity. HI andCO line data are necessary for determining the contentand distribution of the gaseous component of the ISM,the principal feeder of star formation in galaxies. Highresolution HI imaging can also be used to study thekinematical properties of the target galaxies. Mid-,far-IR and sub-mm data, combined with SPIRE data,
29 www.arcetri.astro.it/hevics
13
will be used to study the physical properties of thedifferent dust components (PAHs, very small grains andbig grains), and radio continuum data for measuring thethermal and synchrotron emission.
Given its definition, the HRS is easily accessible forground based and space facilities: the selected galaxiesare in fact relatively bright (mB < 15 mag) and extended(∼ 2-3 arcmin). Listed below are the most importantreferences for ancillary data.
5.1. UV, optical, near-IR and Hα imaging
Of the 323 galaxies in the HRS, 280 have beenobserved by the Galaxy Evolution Explorer (GALEX)in the two UV bands FUV (λeff = 1539A,∆λ = 442A)and NUV (λeff = 2316A,∆λ = 1069A). Observationshave been taken as part of the Nearby Galaxy Survey(NGS; Gil de Paz et al. 2007), the Virgo cluster survey(Boselli et al. 2005), the All Imaging Survey (AIS)or as pointed observations in open time proposals. AGALEX legacy survey has been recently accepted tocomplete the UV observation of the HRS galaxies at adeepness of the Medium Imaging Survey (1500 sec/field).
SDSS (DR7 release, Adelman-McCarthy et al. 2008)images in the ugriz filters are available for 313 objects.All galaxies have been observed in the JHK filters by2MASS (Jarrett et al. 2003). Deep B,V, H and Kband images for all Virgo cluster galaxies and for someComa I Cloud galaxies are available on the GOLDMinedatabase (http://goldmine.mib.infn.it/; Gavazzi et al.2003). These have been taken with pointed observationsduring the near infrared and optical extensive surveysof the Virgo cluster carried out by Boselli et al. (1997,2000; 2003) and Gavazzi et al. (2000).
An Hα+[NII] imaging survey of the star forming HRSgalaxies found outside the Virgo cluster under way atthe 2.1m San Pedro Martir telescope is almost complete.Combined with images taken in the Virgo cluster region(Boselli & Gavazzi 2002, Boselli et al. 2002 and Gavazziet al. 1998; 2002; 2006) Hα+[NII] data are now availablefor 221 of the 258 late-type objects and 26 of the 65 early-types.
5.2. Integrated spectroscopy
A low resolution (R ∼ 1000), integrated spectroscopicsurvey in the wavelength range 3500-7200 A is underway at the 1.93m OHP telescope. In order to samplethe spectral properties of the whole galaxy, and not justthose of the nuclear regions (these last provided by theSDSS for 106 galaxies in the DR6), observations havebeen executed using the drifting technique described inKennicutt (1992). Exposures are taken while constantlyand uniformly drifting the spectrograph slit over thefull extent of the galaxy. A resolution R ∼ 1000is mandatory for resolving [NII] from Hα and mea-suring the stellar underling Balmer absorption under Hβ.
Data for 64 Virgo cluster galaxies in the HRS have al-ready been published in Gavazzi et al. (2004) along witha few other galaxies in Moustakas & Kennicutt (2006),Jansen et al. (2000) and Kennicutt (1992b). We have
data from the literature or from our own observations for256/258 of the late-types and 33/65 of the early-types,making the whole sample complete at 89 %. The re-maining objects will be included in the future observingruns.
5.3. HI and CO lines
Single beam HI observations are available from alarge variety of sources. Most of the galaxies haveHI data in Springob et al. (2005) and Gavazzi et al.(2005), this last reference limited to the Virgo clusterregion. Out of the 8 late-type galaxies, 249 have anHI measurements, as do 55/65 of the early-types. Allgalaxies in the 0◦ < dec < 30◦ range (80 %) will beobserved during the ALFALFA survey under way at the305m Arecibo radio telescope (Giovanelli et al. 2005).Data will be gathered with an homogeneous sensitivity(rms=2.5 mJy) and spectral resolution (5.5 km s−1): atthe average distance of the HRS the ALFALFA surveywill detect all sources with MHI ≥ 107.5 M⊙. VLA andWSRT HI maps are available for 236 HRS galaxies, fromthe WHISP (van der Hulst 2002) and VIVA (Chung etal. 2009) survey, this last limited to the Virgo region,from VLA archives or from our own WSRT observations.
A 12CO(1-0) line (2.6 mm, 115 GHz) survey of theHRS galaxies is under way at the 12m Kitt Peak tele-scope. Fifty-eight spiral galaxies have been observed todate, with an average rms of 3 mK in T∗
R scale. Thanksto these new observations and to data in the literatureCO measurements are now available for 161/258 late-type and 22/65 early-type galaxies with a detection rateof 83% and 55% respectively. Data have been takenfrom different sources, mostly from the FCRAO surveyof Young et al. (1995), or Kenney & Young (1988) andBoselli et al. (1995; 2002) for the Virgo cluster region.We obtained time at the James Clerk Maxwell Telescope(JCMT) on the 345 GHz HARP array receiver to searchfor CO(3-2) emission from the central 3’ x 3’ region (with15 arcsec resolution) of a subsample of late type galaxieswith KStot < 8.7. As of the beginning of January 2010,42 of a total of 56 galaxies in the subsample have beenobserved to completion.
5.4. Mid-IR, far-IR and sub-mm
Infrared data for the HRS galaxies are already avail-able from different sources. 208/258 late-type and 32/65of the early-type galaxies have been detected by IRASat 60 and 100 µm, only 103 (Sa-Sd-Im-BCD) and 17(E-S0-S0a) at 12 and 25 µm. Virgo galaxies have beenobserved with CAM (45), PHOT (26) and LWS (21) onISO (Leech et al. 1999; Malhotra et al. 2001; Rousselet al. 2001; Boselli et al. 2002, 2003; Tuffs et al. 2002).Spitzer observations have been completed for 157 HRSgalaxies with IRAC and 181 galaxies with MIPS. Thedata for all of these galaxies will eventually be availablefrom the Spitzer archives. The pipeline-processed IRACdata is sufficient for science analysis, but MIPS data hasbeen reprocessed using the MIPS Data Analysis Tools(Gordon et al. 2005) along with additional processingsoftware.
All HRS galaxies have been observed during the re-cently completed AKARI all sky survey in the 9, 20,
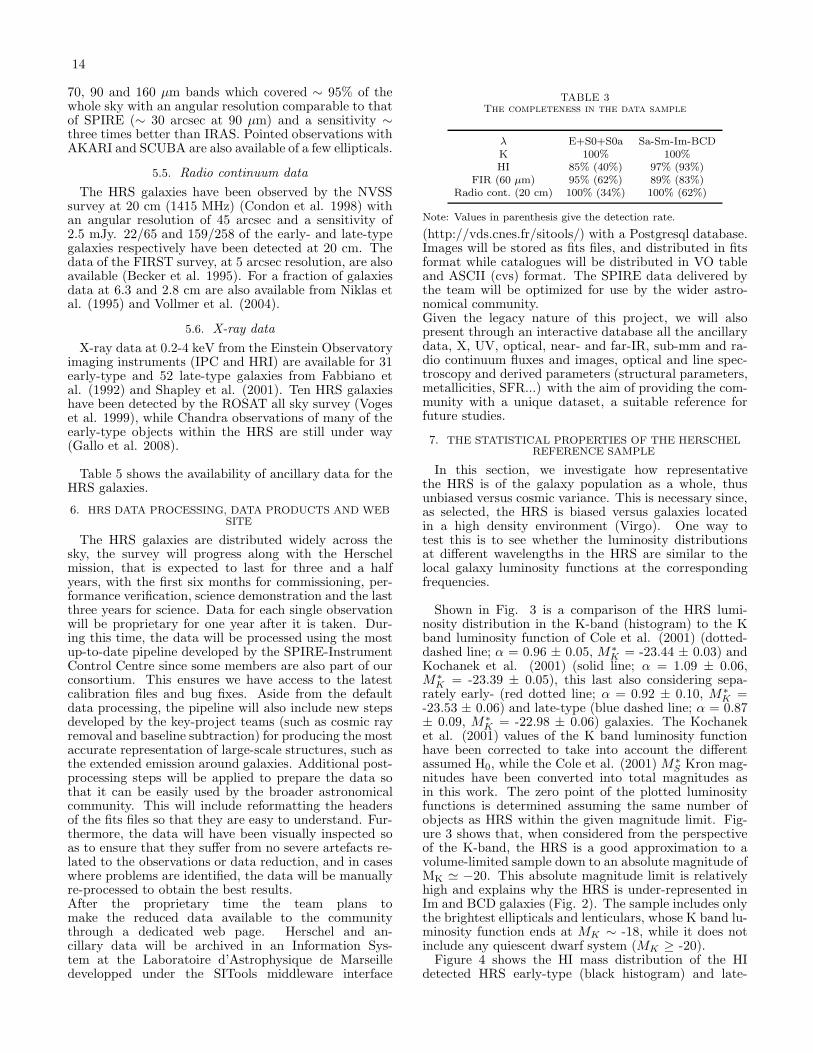
14
70, 90 and 160 µm bands which covered ∼ 95% of thewhole sky with an angular resolution comparable to thatof SPIRE (∼ 30 arcsec at 90 µm) and a sensitivity ∼
three times better than IRAS. Pointed observations withAKARI and SCUBA are also available of a few ellipticals.
5.5. Radio continuum data
The HRS galaxies have been observed by the NVSSsurvey at 20 cm (1415 MHz) (Condon et al. 1998) withan angular resolution of 45 arcsec and a sensitivity of2.5 mJy. 22/65 and 159/258 of the early- and late-typegalaxies respectively have been detected at 20 cm. Thedata of the FIRST survey, at 5 arcsec resolution, are alsoavailable (Becker et al. 1995). For a fraction of galaxiesdata at 6.3 and 2.8 cm are also available from Niklas etal. (1995) and Vollmer et al. (2004).
5.6. X-ray data
X-ray data at 0.2-4 keV from the Einstein Observatoryimaging instruments (IPC and HRI) are available for 31early-type and 52 late-type galaxies from Fabbiano etal. (1992) and Shapley et al. (2001). Ten HRS galaxieshave been detected by the ROSAT all sky survey (Vogeset al. 1999), while Chandra observations of many of theearly-type objects within the HRS are still under way(Gallo et al. 2008).
Table 5 shows the availability of ancillary data for theHRS galaxies.
6. HRS DATA PROCESSING, DATA PRODUCTS AND WEBSITE
The HRS galaxies are distributed widely across thesky, the survey will progress along with the Herschelmission, that is expected to last for three and a halfyears, with the first six months for commissioning, per-formance verification, science demonstration and the lastthree years for science. Data for each single observationwill be proprietary for one year after it is taken. Dur-ing this time, the data will be processed using the mostup-to-date pipeline developed by the SPIRE-InstrumentControl Centre since some members are also part of ourconsortium. This ensures we have access to the latestcalibration files and bug fixes. Aside from the defaultdata processing, the pipeline will also include new stepsdeveloped by the key-project teams (such as cosmic rayremoval and baseline subtraction) for producing the mostaccurate representation of large-scale structures, such asthe extended emission around galaxies. Additional post-processing steps will be applied to prepare the data sothat it can be easily used by the broader astronomicalcommunity. This will include reformatting the headersof the fits files so that they are easy to understand. Fur-thermore, the data will have been visually inspected soas to ensure that they suffer from no severe artefacts re-lated to the observations or data reduction, and in caseswhere problems are identified, the data will be manuallyre-processed to obtain the best results.After the proprietary time the team plans tomake the reduced data available to the communitythrough a dedicated web page. Herschel and an-cillary data will be archived in an Information Sys-tem at the Laboratoire d’Astrophysique de Marseilledevelopped under the SITools middleware interface
TABLE 3The completeness in the data sample
λ E+S0+S0a Sa-Sm-Im-BCDK 100% 100%HI 85% (40%) 97% (93%)
FIR (60 µm) 95% (62%) 89% (83%)Radio cont. (20 cm) 100% (34%) 100% (62%)
Note: Values in parenthesis give the detection rate.
(http://vds.cnes.fr/sitools/) with a Postgresql database.Images will be stored as fits files, and distributed in fitsformat while catalogues will be distributed in VO tableand ASCII (cvs) format. The SPIRE data delivered bythe team will be optimized for use by the wider astro-nomical community.Given the legacy nature of this project, we will alsopresent through an interactive database all the ancillarydata, X, UV, optical, near- and far-IR, sub-mm and ra-dio continuum fluxes and images, optical and line spec-troscopy and derived parameters (structural parameters,metallicities, SFR...) with the aim of providing the com-munity with a unique dataset, a suitable reference forfuture studies.
7. THE STATISTICAL PROPERTIES OF THE HERSCHELREFERENCE SAMPLE
In this section, we investigate how representativethe HRS is of the galaxy population as a whole, thusunbiased versus cosmic variance. This is necessary since,as selected, the HRS is biased versus galaxies locatedin a high density environment (Virgo). One way totest this is to see whether the luminosity distributionsat different wavelengths in the HRS are similar to thelocal galaxy luminosity functions at the correspondingfrequencies.
Shown in Fig. 3 is a comparison of the HRS lumi-nosity distribution in the K-band (histogram) to the Kband luminosity function of Cole et al. (2001) (dotted-dashed line; α = 0.96 ± 0.05, M∗
K = -23.44 ± 0.03) andKochanek et al. (2001) (solid line; α = 1.09 ± 0.06,M∗
K = -23.39 ± 0.05), this last also considering sepa-rately early- (red dotted line; α = 0.92 ± 0.10, M∗
K =-23.53 ± 0.06) and late-type (blue dashed line; α = 0.87± 0.09, M∗
K = -22.98 ± 0.06) galaxies. The Kochaneket al. (2001) values of the K band luminosity functionhave been corrected to take into account the differentassumed H0, while the Cole et al. (2001) M∗
S Kron mag-nitudes have been converted into total magnitudes asin this work. The zero point of the plotted luminosityfunctions is determined assuming the same number ofobjects as HRS within the given magnitude limit. Fig-ure 3 shows that, when considered from the perspectiveof the K-band, the HRS is a good approximation to avolume-limited sample down to an absolute magnitude ofMK ≃ −20. This absolute magnitude limit is relativelyhigh and explains why the HRS is under-represented inIm and BCD galaxies (Fig. 2). The sample includes onlythe brightest ellipticals and lenticulars, whose K band lu-minosity function ends at MK ∼ -18, while it does notinclude any quiescent dwarf system (MK ≥ -20).Figure 4 shows the HI mass distribution of the HI
detected HRS early-type (black histogram) and late-
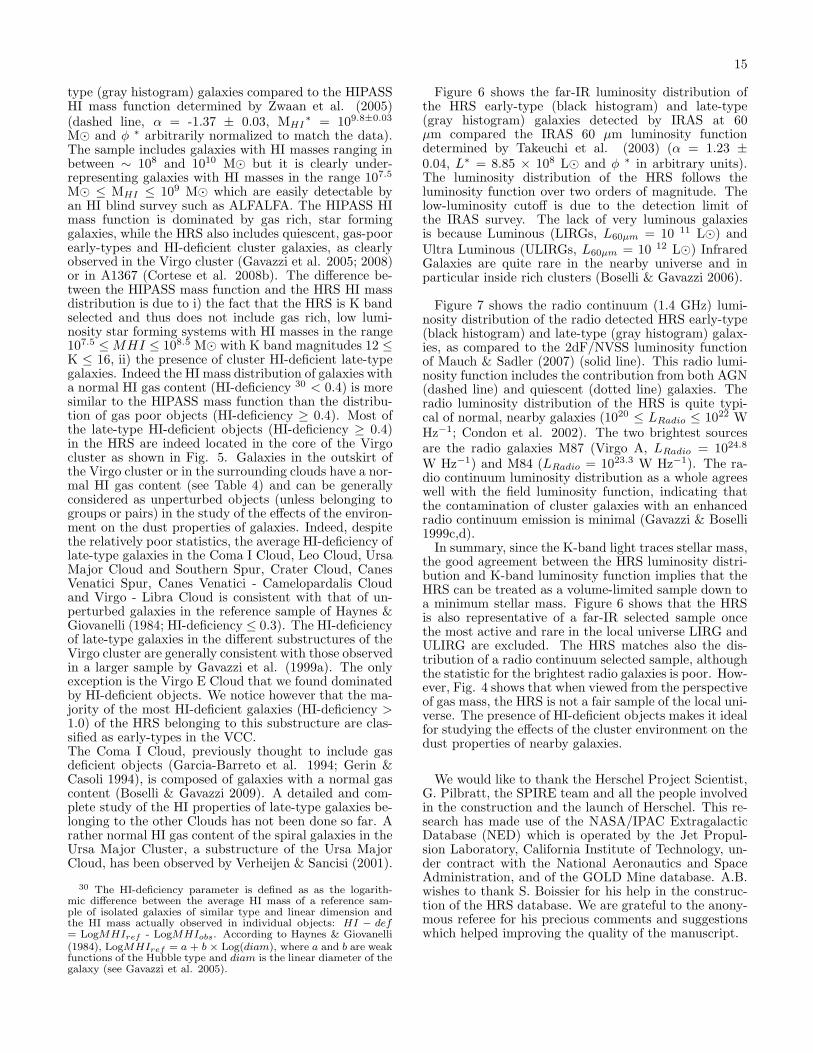
15
type (gray histogram) galaxies compared to the HIPASSHI mass function determined by Zwaan et al. (2005)(dashed line, α = -1.37 ± 0.03, MHI
∗ = 109.8±0.03
M⊙ and φ ∗ arbitrarily normalized to match the data).The sample includes galaxies with HI masses ranging inbetween ∼ 108 and 1010 M⊙ but it is clearly under-representing galaxies with HI masses in the range 107.5
M⊙ ≤ MHI ≤ 109 M⊙ which are easily detectable byan HI blind survey such as ALFALFA. The HIPASS HImass function is dominated by gas rich, star forminggalaxies, while the HRS also includes quiescent, gas-poorearly-types and HI-deficient cluster galaxies, as clearlyobserved in the Virgo cluster (Gavazzi et al. 2005; 2008)or in A1367 (Cortese et al. 2008b). The difference be-tween the HIPASS mass function and the HRS HI massdistribution is due to i) the fact that the HRS is K bandselected and thus does not include gas rich, low lumi-nosity star forming systems with HI masses in the range107.5 ≤ MHI ≤ 108.5 M⊙ with K band magnitudes 12 ≤
K ≤ 16, ii) the presence of cluster HI-deficient late-typegalaxies. Indeed the HI mass distribution of galaxies witha normal HI gas content (HI-deficiency 30 < 0.4) is moresimilar to the HIPASS mass function than the distribu-tion of gas poor objects (HI-deficiency ≥ 0.4). Most ofthe late-type HI-deficient objects (HI-deficiency ≥ 0.4)in the HRS are indeed located in the core of the Virgocluster as shown in Fig. 5. Galaxies in the outskirt ofthe Virgo cluster or in the surrounding clouds have a nor-mal HI gas content (see Table 4) and can be generallyconsidered as unperturbed objects (unless belonging togroups or pairs) in the study of the effects of the environ-ment on the dust properties of galaxies. Indeed, despitethe relatively poor statistics, the average HI-deficiency oflate-type galaxies in the Coma I Cloud, Leo Cloud, UrsaMajor Cloud and Southern Spur, Crater Cloud, CanesVenatici Spur, Canes Venatici - Camelopardalis Cloudand Virgo - Libra Cloud is consistent with that of un-perturbed galaxies in the reference sample of Haynes &Giovanelli (1984; HI-deficiency ≤ 0.3). The HI-deficiencyof late-type galaxies in the different substructures of theVirgo cluster are generally consistent with those observedin a larger sample by Gavazzi et al. (1999a). The onlyexception is the Virgo E Cloud that we found dominatedby HI-deficient objects. We notice however that the ma-jority of the most HI-deficient galaxies (HI-deficiency >1.0) of the HRS belonging to this substructure are clas-sified as early-types in the VCC.The Coma I Cloud, previously thought to include gasdeficient objects (Garcia-Barreto et al. 1994; Gerin &Casoli 1994), is composed of galaxies with a normal gascontent (Boselli & Gavazzi 2009). A detailed and com-plete study of the HI properties of late-type galaxies be-longing to the other Clouds has not been done so far. Arather normal HI gas content of the spiral galaxies in theUrsa Major Cluster, a substructure of the Ursa MajorCloud, has been observed by Verheijen & Sancisi (2001).
30 The HI-deficiency parameter is defined as as the logarith-mic difference between the average HI mass of a reference sam-ple of isolated galaxies of similar type and linear dimension andthe HI mass actually observed in individual objects: HI − def= LogMHIref - LogMHIobs. According to Haynes & Giovanelli(1984), LogMHIref = a + b × Log(diam), where a and b are weakfunctions of the Hubble type and diam is the linear diameter of thegalaxy (see Gavazzi et al. 2005).
Figure 6 shows the far-IR luminosity distribution ofthe HRS early-type (black histogram) and late-type(gray histogram) galaxies detected by IRAS at 60µm compared the IRAS 60 µm luminosity functiondetermined by Takeuchi et al. (2003) (α = 1.23 ±
0.04, L∗ = 8.85 × 10⁸ L⊙ and φ ∗ in arbitrary units).The luminosity distribution of the HRS follows theluminosity function over two orders of magnitude. Thelow-luminosity cutoff is due to the detection limit ofthe IRAS survey. The lack of very luminous galaxiesis because Luminous (LIRGs, L60µm = 10 11 L⊙) andUltra Luminous (ULIRGs, L60µm = 10 12 L⊙) InfraredGalaxies are quite rare in the nearby universe and inparticular inside rich clusters (Boselli & Gavazzi 2006).
Figure 7 shows the radio continuum (1.4 GHz) lumi-nosity distribution of the radio detected HRS early-type(black histogram) and late-type (gray histogram) galax-ies, as compared to the 2dF/NVSS luminosity functionof Mauch & Sadler (2007) (solid line). This radio lumi-nosity function includes the contribution from both AGN(dashed line) and quiescent (dotted line) galaxies. Theradio luminosity distribution of the HRS is quite typi-cal of normal, nearby galaxies (1020 ≤ LRadio ≤ 1022 WHz−1; Condon et al. 2002). The two brightest sourcesare the radio galaxies M87 (Virgo A, LRadio = 1024.8
W Hz−1) and M84 (LRadio = 1023.3 W Hz−1). The ra-dio continuum luminosity distribution as a whole agreeswell with the field luminosity function, indicating thatthe contamination of cluster galaxies with an enhancedradio continuum emission is minimal (Gavazzi & Boselli1999c,d).In summary, since the K-band light traces stellar mass,
the good agreement between the HRS luminosity distri-bution and K-band luminosity function implies that theHRS can be treated as a volume-limited sample down toa minimum stellar mass. Figure 6 shows that the HRSis also representative of a far-IR selected sample oncethe most active and rare in the local universe LIRG andULIRG are excluded. The HRS matches also the dis-tribution of a radio continuum selected sample, althoughthe statistic for the brightest radio galaxies is poor. How-ever, Fig. 4 shows that when viewed from the perspectiveof gas mass, the HRS is not a fair sample of the local uni-verse. The presence of HI-deficient objects makes it idealfor studying the effects of the cluster environment on thedust properties of nearby galaxies.
We would like to thank the Herschel Project Scientist,G. Pilbratt, the SPIRE team and all the people involvedin the construction and the launch of Herschel. This re-search has made use of the NASA/IPAC ExtragalacticDatabase (NED) which is operated by the Jet Propul-sion Laboratory, California Institute of Technology, un-der contract with the National Aeronautics and SpaceAdministration, and of the GOLD Mine database. A.B.wishes to thank S. Boissier for his help in the construc-tion of the HRS database. We are grateful to the anony-mous referee for his precious comments and suggestionswhich helped improving the quality of the manuscript.

16
TABLE 4The average HI-deficiency of late-type galaxies in the different substructures
Substructure average standard deviation N. of objectsVirgo A 0.91 ± 0.47 33Virgo B 0.71 ± 0.46 25
Virgo N Cloud 0.39 ± 0.24 12Virgo E Cloud 0.83 ± 0.53 12Virgo S Cloud 0.47 ± 0.47 26Virgo Outskirts 0.26 ± 0.60 38Coma I Cloud 0.07 ± 0.35 8Leo Cloud 0.11 ± 0.31 45
Ursa Major Cloud 0.05 ± 0.34 15Ursa Major Southern Spur -0.02 ± 0.20 4
Crater Cloud 0.13 ± 0.40 4Canes Ven. Spur & Camelopardalis 0.19 ± 0.03 9
Virgo - Libra Cloud 0.31 ± 0.35 18
Note: Upper limits are considered as detections
REFERENCES
Adelman-McCarthy J., et al., 2008, ApJS, 175, 297Alton, P., Trewhella, M., Davies, J., et al., 1998, A&A, 335, 807Alton, P., Trewhella, M., Davies, J., Bianchi, S., 1999, A&A, 343,
51Beker, R., White, R., Helfand, D., 1995, ApJ, 450, 559Bendo, G., Joseph, R., Wells, M., et al., 2003, AJ, 125, 2361Binggeli B., Sandage A., Tammann G., 1985, AJ, 90, 1681Bohringer, H., Briel, U. G., Schwarz, R. A., Voges, W., Hartner,
G., Trumper, J., 1994, Nature, 368, 828Boselli, A. & Gavazzi, G., 2002, A&A, 386, 124Boselli, A. & Gavazzi, G., 2006, PASP, 118, 517Boselli, A. & Gavazzi, G., 2009, A&A, 508, 201Boselli A., Casoli F., Lequeux J., 1995, A&AS, 110, 521Boselli A., Tuffs R., Gavazzi G., Hippelein H., Pierini D., 1997,
A&A 121, 507Boselli, A., Gavazzi, G., Franzetti, P., Pierini, D., Scodeggio, M.,
2000, A&AS, 142, 73Boselli, A., Gavazzi, G., Donas, J., Scodeggio, M., 2001, AJ, 121,
753Boselli A., Lequeux J., Gavazzi G., 2002, A&A, 384, 33Boselli, A., Iglesias-Paramo, J., Vilchez, J.M., Gavazzi, G., 2002,
A&A, 386, 134Boselli A., Gavazzi G., Sanvito G., 2003, A&A, 402, 37Boselli A., Sauvage M., Lequeux J., Donati A., Gavazzi G., 2003,
A&A, 406, 867Boselli A., Lequeux J., Gavazzi G., 2004, A&A, 428, 409Boselli, A., Cortese, L., Deharveng, JM., et al., 2005a, ApJ, 629,
L29Bower, R.G., Lucey, J.R., Ellis, R.S., 1992, MNRAS, 254, 601Bregman, J., Snider, B., Grego, L., Cox, C., 1998, ApJ, 499, 670Bressan, A., Granato, GL., Silva, L., 1998, A&A, 332, 135Bressan, A., Panuzzo, P., Buson, L., et al., 2006, ApJ, 639, L55Broelis, A.H., & Van Woerden, H., 1994, A&AS, 107, 129Buat, V., & Xu, K., 1996, A&A, 306, 61Buat, V., Boselli, A., Gavazzi, G., Bonfanti, C., 2002, A&A, 383,
801Calzetti, D., Kennicutt, R., Bianchi, L., et al., 2005, ApJ, 633, 871Calzetti, D., Kennicutt, R., Engelbracht, C., et al., 2007, ApJ, 666,
870Catinella, B., Giovanelli, R., Haynes, M., 2006, ApJ, 640, 751Cayatte, V., Kotanyi, C., Balkowski, C., & van Gorkom, J., 1994,
AJ, 107, 1003Cayatte, V., van Gorkom, J., Balkowski, C., & Kotanyi, C., 1990,
AJ, 100, 604Chanial, P., Flores, H., Guiderdoni, B., Elbaz, D., Hammer, F.,
Vigroux, L., 2007, A&A, 462, 81Chung, A., van Gorkom, J., Kenney, J., Crowl, H., Vollmer, B.,
2009, AJ, 138, 1741Cole, S., Norberg, P., Baugh,, C., et al., 2001, MNRAS, 326, 255Condon, J. J., Cotton, W. D., Broderick, J. J., 2002, AJ, 124, 675Condon, J. J., Cotton, W. D., Greisen, E. W., Yin, Q. F., Perley,
R. A., Taylor, G. B., Broderick, J. J. 1998, AJ, 115, 1693Cortese, L., Boselli, A., Buat, V., et al., 2006, ApJ, 637, 242
Cortese, L., Boselli, A., Franzetti, P., Decarli, R., Gavazzi, G.,Boissier, S., Buat, V., 2008a, MNRAS, 386, 1157
Cortese, L., Minchin, R., Auld, R., et al., 2008b, MNRAS, 383,1519
Cortese, L., Hughes, T., 2009, MNRAS, 400, 1225Cuillandre, J.C., Lequeux, J., Allen, R., Mellier, Y., Bertin, E.,
2001, ApJ, 554, 190Dale, D., Bendo, G., Engelbracht, C., et al., 2005, ApJ, 633, 857Dale, D., Gil de Paz, A., Gordon, K., et al., 2007, ApJ, 655, 863Davies, J., Alton, P., Bianchi, S., Trewhella, M., 1998, MNRAS,
300, 1006Davies, J., Alton, P., Trewhella, M., Evans, R., Bianchi, S., 1999,
MNRAS, 304, 495Desert F.–X., Boulanger F., Puget J.–L. 1990, A&A 237, 215De Vaucouleurs, G., De Vaucouleurs, A., Corwin, H., Buta, R.,
Paturel, G., Fouque, P., 1991, Third Reference Catalogue ofBright Galaxies
Devereux, N., & Young, J., 1990, ApJ, 359, 42Djorgovski, S., Davis, M., 1987, ApJ, 313, 59Draine, B., 1978, ApJS, 36, 596Draine, B., & Li, A., 2007, ApJ, 657, 810Draine, B., Dale, D., Bendo, G., et al., 2007, ApJ, 663, 866Dressler, A., Lynden-Bell, D., Burstein, D., Davies, R., Faber, S.,
Terlevich, R., Wegner, G., 1987, ApJ, 313, 42Duley, W., Williams, D., 1986, MNRAS, 223, 177Dunne, L., Eales, S., 2001, MNRAS, 327, 697Dunne, L., Eales, S., Edmunds, M., Ivison, R., Alexander, P.,
Clements, D., 2000, MNRAS, 315, 115Dwek E., 1986, ApJ, 302, 363Dwek E., Arendt R., Fixsen D., et al., 1997, ApJ, 475, 565Eales, S., Wynn-Williams, C., Duncan, W., 1989, ApJ, 339, 859Engelbracht, C., Kundurthy, P., Gordon, K., et al., 2006, ApJ, 642,
L127Fabbiano, G., Kim, D., Trinchieri, G., 1992, ApJS,80, 531Ferrarese, L., Cote, P., Jordan, A., et al., 2006, ApJS, 164, 334Ferrari, F., Pastoriza, M.G., Macchetto, F., Caon, N., 1999, A&AS,
136, 269Galliano, F., Madden, S., Jones, A., Wilson, C., Bernard, J-P., Le
Peintre, F., 2003, A&A, 407, 159Galliano, F., Madden, S., Jones, A., Wilson, C., Bernard, J-P.,
2005, A&A, 434, 867Galliano, F., Dwek, E., Chanial, P. 2008, ApJ, 672, 214Gallo, E., Treu, T., Jacob, J., Woo, JH, Marshall, P., Antonucci,
R., 2008, ApJ, 680, 154Garcia-Barreto, J., Dowens, D., Huchtmeier, W., 1994, A&A, 288,
705Gavazzi, G., Pierini, D. & Boselli, A., 1996, A&A, 312, 397Gavazzi, G., Catinella, B., Carrasco, L., Boselli, A., Contursi, A.,
1998, AJ, 115, 1745Gavazzi, G., Boselli, A., Scodeggio, M., Pierini, D., Belsole, E.,
1999a, MNRAS, 304, 595Gavazzi, G.,Carrasco, L., Galli, R., 1999b, A&AS, 136, 227Gavazzi, G., Boselli, A., 1999c, A&A, 343, 86
17
Gavazzi, G., Boselli, A., 1999d, A&A, 343, 93Gavazzi, G., Franzetti, P., Scodeggio, M., Boselli, A., Pierini, D.,
2000, A&A, 361, 863Gavazzi, G., Franzetti, P., Scodeggio, M., Boselli, A., Pierini, D.,
Baffa, C., Lisi, F., Hunt, L., 2000, A&AS, 142, 65Gavazzi, G., Boselli, A., Pedotti, P., Gallazzi, A., Carrasco, L.,
2002, A&A, 396, 449Gavazzi, G., Bonfanti, C., Sanvito, G., Boselli, A., & Scodeggio,
M., 2002b, ApJ, 576, 135Gavazzi, G., Boselli, A., Donati, A., Franzetti, P. & Scodeggio, M.,
2003, A&A, 400, 451Gavazzi, G., Zaccardo, A., Sanvito, G., Boselli, A. & Bonfanti, C.,
2004, A&A, 417, 499Gavazzi, G., Boselli, A., van Driel, W., O’Neil, K., 2005, A&A, 429,
439Gavazzi, G., Boselli, A., Cortese, L., Arosio, I, Gallazzi, A., Pedotti,
P., 2006, A&A, 446, 839Gavazzi, G., Giovanelli, R., Haynes, M., et al., 2008, A&A, 482, 43Gerin, M., Casoli, F., 1994, A&A, 290, 49Giovanelli, R., Haynes, M., Kent, B., et al., 2005, AJ, 130, 25, 98Gil de Paz, A., Boissier, S., Madore, B., et al., 2007, ApJS, 173,
185Gordon, K., Perez-Gonzalez, P., Misselt, K., et al., 2004, ApJS,
154, 215Gordon, K., Rieke, G. H., Engelbracht, C. W., et al., 2005, PASP,
117, 831Goudfrooij, P., Hansen, L., Jorgensen, H.E., Norgaard-Nielsen,
H.U., 1994, A&AS, 105, 341Griffin, M., Abergel, A., Ade, P., Andre, P., Baluteau, J-P., Bock,
J., Franceschini, A., Gear, W., et al., 2007, Advances in SpaceResearch, Vol 40, Issue 5, p.612-619
Griffin, M., Abergel, A., Ade, P., Andre, P., Baluteau, J-P., Bock,J., Franceschini, A., Gear, W., et al., 2006, SPIE, 6265, 7
Guelin M., Zylka R., Mezger P.G. et al., 1993, A&A 279, L37Guelin M., Zylka R., Mezger P.G., Haslam C.G.T., Kreysa, E.,
1995, A&A, 298, L29James, A., Dunne, L., Eales, S., Edmunds, M., 2002, MNRAS, 335,
753Jansen, R., Fabricant, D., Franx, M., Caldwell, N., 2000, ApJS,
126, 331Jarrett, T., Chester, T., Cutri, R., Schneider, S. & Huchra, J., 2003,
AJ, 125, 525Haynes, M., & Giovanelli, R., 1984, AJ, 89, 758Heavens, A., Panter, B., Jimenez, R., Dunlop, J., 2004, Nat, 428,
625Hirashita, H., Buat, V., Inoue, A., 2003, A&A, 410, 83Hollenbach, D., Salpeter, E., 1971, ApJ, 163, 155Hollenbach, D., Tielens, A., 1997, ARA&A, 35, 179Holmberg, E., 1958, Lund Medd. Astron. Obs. Ser. II, 136, 1Hughes, T., Cortese, L., 2009, MNRAS, 396, L41Kaneda, H., Onaka, T., Kitayama, T., Okada, Y., Sakon, I., 2007,
PASJ, 59, 107Karachentsev, I., Lebedev, V., Shcherbanovskij, A., 1972, Publ.
Special Astrophys. Obs. of USSR 7Kauffmann, G., Heckman, T., White, S., et al., 2003, MNRAS, 341,
54Kenney J.,Young J., 1988, ApJS 66, 261Kennicutt, R., 1992a, ApJ, 388, 310Kennicutt, R., 1992b, ApJS, 79, 255Kennicutt, R., 1998, ARA&A, 36, 189Kennicutt, R., Armus, L., Bendo, G., et al., 2003, PASP, 115, 928Kennicutt, R., Calzetti, D., Walter, F., et al., 2007, ApJ, 671, 333Kochanek, C., Pahre, M., Falco, E., Huchra, J., Mader, J., Jarrett,
T., Chester, T., Cutri, R., Schneider, S., 2001, ApJ, 560, 566Leech K, Volk H., Heinrichsen I., et al., 1999, MNRAS, 310, 317Leeuw, L., Hawarden, T., Matthews, H., Robson, I., Eckart, A.,
2002, ApJ, 565, L131Leeuw, L., Davidson, J., Dowell, K., Matthews, H., 2008, ApJ, 677,
L249Malhotra, S., Kaufman, M., Hollenbach, D., et al., 2001, ApJ, 561,
766Mauch, T, & Sadler, E., 2007, MNRAS, 375, 931Meiksin, A., 2009, Rev. Mod. Phys., 81, 1405Montier, L., Giard, M., 2005, A&A, 439, 35Morton, R., & Haynes, M., 1994, ARA&A, 32, 115Moustakas, J., & Kennicutt, R., 2006, ApJS, 164, 81Neininger N., Guelin M., Garcia-Burillo S., Zylka R., Wielebinski
R., 1996, A&A 310, 725
Niklas, S., Klein, U., Wielebinski, R., 1995, A&A, 293, 56Nilson, P., 1973, The Uppsala General Catalogue of Galaxies, 1973,
Uppsala University PressNolthenius, R., 1993, ApJS, 85, 1Oppenheimer, B., Dave, R., 2008, MNRAS, 387, 577Panuzzo, P., Vega, O., Bressan, A., et al., 2007, ApJ, 656, 206Perez-Gonzalez, P., Kennicutt, R., Gordon, K., et al., 2006, ApJ,
648, 987Prescott, M., Kennicutt, R., Bendo, G., et al., 2007, ApJ, 668, 182Rayan-Weber, E., Pettini, M., Madau, P., 2006, MNRAS, 371, L78Roussel H., Vigroux L., Bosma A., et al., 2001b, A&A, 369, 473Sarazin, C., 1986, Rev Mod Phys, 58, 1Schlegel, F., Finkbeiner, D., Davis M., 1998, ApJ, 500, 525Scodeggio, M., Gavazzi, G., Franzetti, P., Boselli, A., Zibetti, S.,
Pierini, D., 2002, A&A, 384, 812Shapley, A., Fabbiano, G., Eskridge, P., 2001, ApJS, 137, 139Skrutskie, M., Cutri, R., Stiening, R., et al., 2006, AJ, 131, 1163Soifer, B., Neugebauer, G., Houck, J., 1987, ARA&A, 25, 187Springob, C., Haynes, M., Giovanelli, R., Kent, B., 2005, ApJS,
160, 149Stickel, M., Klaas, U., Lemke, D., Mattila, D., 2002, A&A, 383,
367Takeuchi, T., Yoshikawa, K., Ishii, T., 2003, ApJ, 587, L89Temi, P., Brighenti, F., Mathews, W., 2007, ApJ, 660, 1215Tielens, A. McKee, C., Seab, C., Hollenbach, D., 1994, ApJ, 431,
321Thilker, D., Boissier, S., Bianchi, L., et al., 2007, ApJS, 173, 572Thomas, H., Dunne, L., Clemens, M., Alexander, P., Eales, S.,
Green, D., James, A., 2002, MNRAS, 331, 853Tremonti, C., Heckman, T., Kauffmann, G., et al., 2004, ApJ, 613,
898Tuffs R., Popescu C., Pierini D., et al., 2002, ApJS, 139, 37Tully, B., Fisher, J., 1977, A&A, 54, 661Tully, B., Mould, J., Aaronson, M., 1982, ApJ, 257, 527Tully, B., 1988, ”Nearby Galaxy Catalog”, Cambridge University
Pressvan der Hulst, J., 2002, in Seeing Through the Dust: The Detection
of HI and the Exploration of the ISM in Galaxies, ASPConference Proceedings, Vol. 276. Edited by A. R. Taylor,T. L. Landecker, and A. G. Willis. ISBN: 1-58381-118-4. SanFrancisco: Astronomical Society of the Pacific, 2002., p.84
Van Dokkum, P.G., & Franx, M., 1995, ApJ, 110, 2027Verheijen, M., Sancisi, R., 2001, A&A, 370, 765Visvanathan, N., Sandage, A., 1977, ApJ, 216, 214Vlahakis, C., Dunne, L., Eales, S., 2005, MNRAS, 364, 1253Vollmer, B., Thierbach, M., Wielebinski, R., 2004, A&A, 418, 1Ward-Thompson, D., Andre, P., Kirk, J., 2002, MNRAS, 329, 257Waskett, T., Sibthorpe, B., Griffin J., Chanial, P.F., 2007, MNRAS,
381, 1583Whittet, D., in ”Dust in the galactic environment”, The Graduate
Series in Astronomy, Bristol: Institute of Physics (IOP)Publishing, 1992
Witt, A., & Gordon, K., 2000, ApJ, 528, 799Xilouris, E., Madden, S., Galliano, F., Virgoux, L., Sauvage, M.,
2004, A&A, 416, 41Young, J., Xie, S., Tacconi, L., et al., 1995, ApJS 98, 219Young, L., Bendo, G., Lucero, D., 2008, in ”The Evolving ISM in
the Milky Way and Nearby Galaxies,” the 4th Spitzer ScienceCenter Conference (Pasadena, December 2007
Zaritsky, D., Kennicutt, R., Huchra, J., 1994, ApJ, 420, 87Zubko, V., Dwek, E., Arendt, R., 2004, ApJS, 152, 211Zwaan, M., Meyer, M., Staveley-Smith, L., Webster, R., 2005,
MNRAS, 359, L30Zwicky F., Herzog E., Karpowicz M., Kowal C., Wild P., 1961-1968,
”Catalogue of Galaxies and of Cluster of Galaxies” (Pasadena,California Institute of Technology; CGCG)
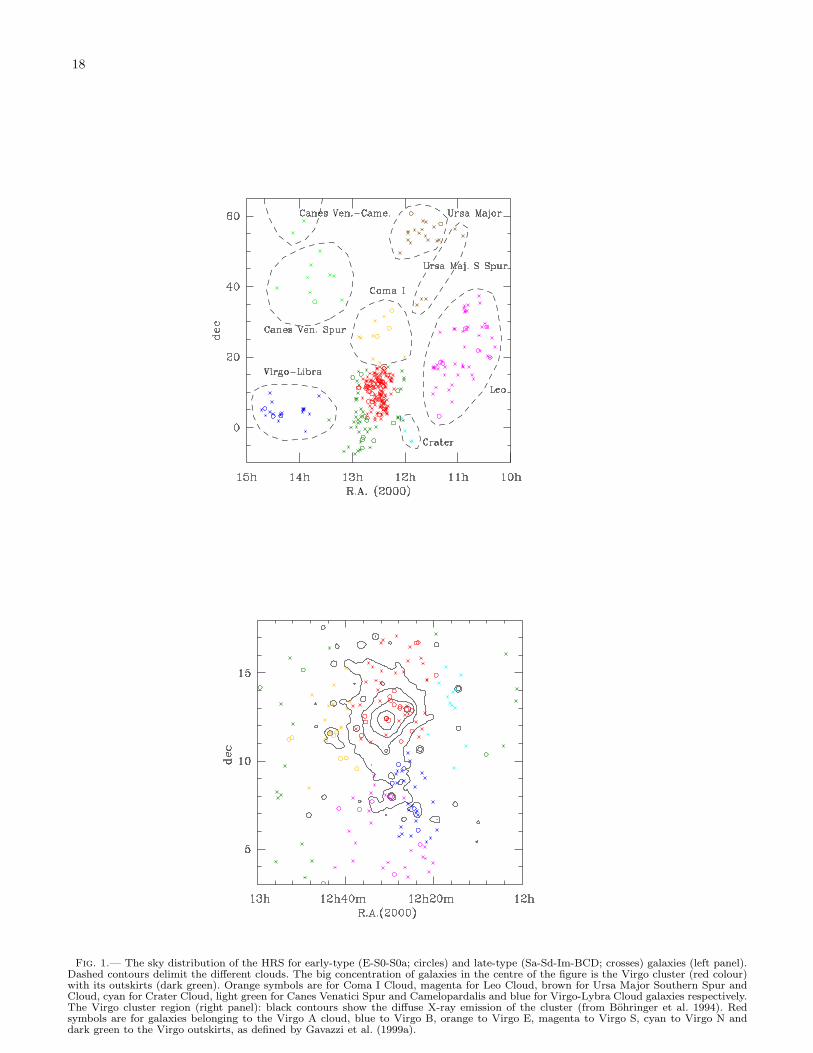
18
Fig. 1.— The sky distribution of the HRS for early-type (E-S0-S0a; circles) and late-type (Sa-Sd-Im-BCD; crosses) galaxies (left panel).Dashed contours delimit the different clouds. The big concentration of galaxies in the centre of the figure is the Virgo cluster (red colour)with its outskirts (dark green). Orange symbols are for Coma I Cloud, magenta for Leo Cloud, brown for Ursa Major Southern Spur andCloud, cyan for Crater Cloud, light green for Canes Venatici Spur and Camelopardalis and blue for Virgo-Lybra Cloud galaxies respectively.The Virgo cluster region (right panel): black contours show the diffuse X-ray emission of the cluster (from Bohringer et al. 1994). Redsymbols are for galaxies belonging to the Virgo A cloud, blue to Virgo B, orange to Virgo E, magenta to Virgo S, cyan to Virgo N anddark green to the Virgo outskirts, as defined by Gavazzi et al. (1999a).
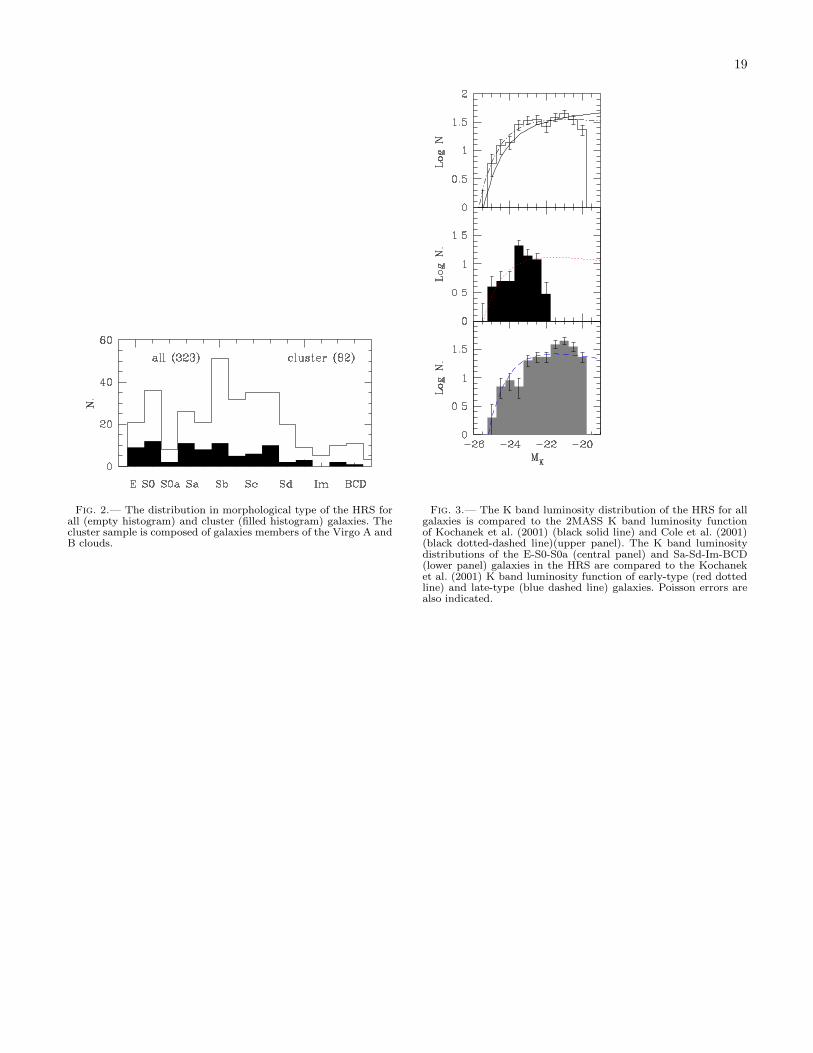
19
Fig. 2.— The distribution in morphological type of the HRS forall (empty histogram) and cluster (filled histogram) galaxies. Thecluster sample is composed of galaxies members of the Virgo A andB clouds.
Fig. 3.— The K band luminosity distribution of the HRS for allgalaxies is compared to the 2MASS K band luminosity functionof Kochanek et al. (2001) (black solid line) and Cole et al. (2001)(black dotted-dashed line)(upper panel). The K band luminositydistributions of the E-S0-S0a (central panel) and Sa-Sd-Im-BCD(lower panel) galaxies in the HRS are compared to the Kochaneket al. (2001) K band luminosity function of early-type (red dottedline) and late-type (blue dashed line) galaxies. Poisson errors arealso indicated.
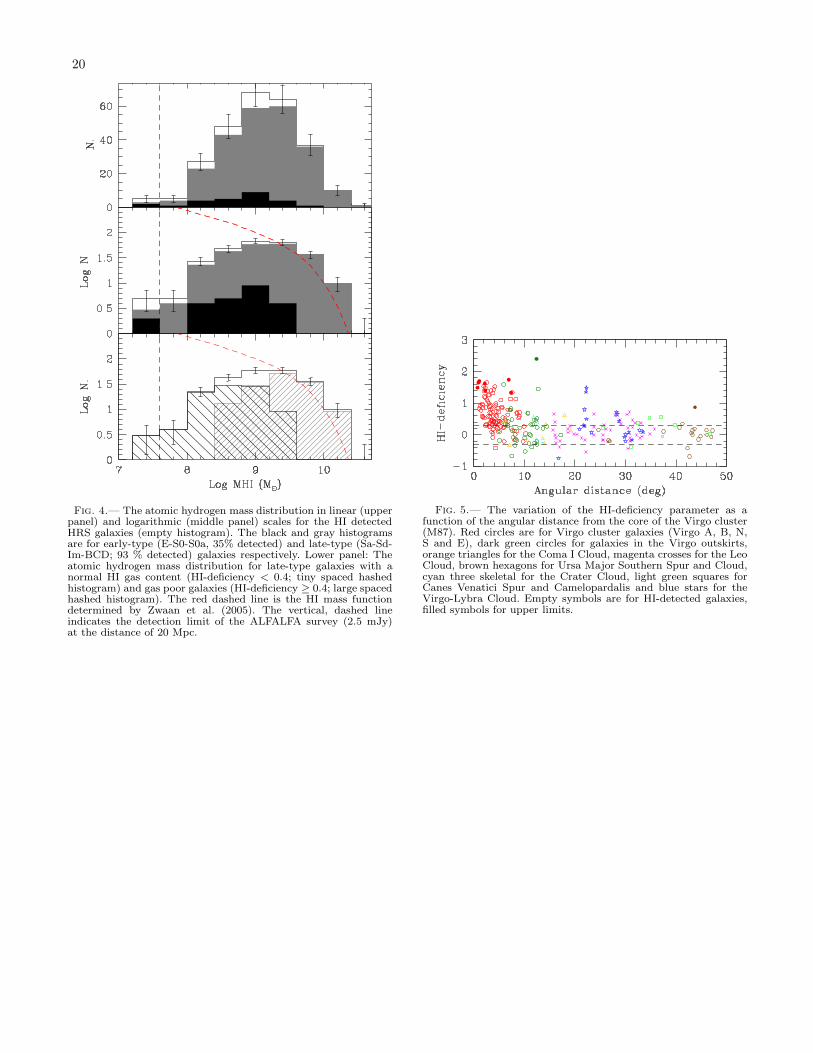
20
Fig. 4.— The atomic hydrogen mass distribution in linear (upperpanel) and logarithmic (middle panel) scales for the HI detectedHRS galaxies (empty histogram). The black and gray histogramsare for early-type (E-S0-S0a, 35% detected) and late-type (Sa-Sd-Im-BCD; 93 % detected) galaxies respectively. Lower panel: Theatomic hydrogen mass distribution for late-type galaxies with anormal HI gas content (HI-deficiency < 0.4; tiny spaced hashedhistogram) and gas poor galaxies (HI-deficiency ≥ 0.4; large spacedhashed histogram). The red dashed line is the HI mass functiondetermined by Zwaan et al. (2005). The vertical, dashed lineindicates the detection limit of the ALFALFA survey (2.5 mJy)at the distance of 20 Mpc.
Fig. 5.— The variation of the HI-deficiency parameter as afunction of the angular distance from the core of the Virgo cluster(M87). Red circles are for Virgo cluster galaxies (Virgo A, B, N,S and E), dark green circles for galaxies in the Virgo outskirts,orange triangles for the Coma I Cloud, magenta crosses for the LeoCloud, brown hexagons for Ursa Major Southern Spur and Cloud,cyan three skeletal for the Crater Cloud, light green squares forCanes Venatici Spur and Camelopardalis and blue stars for theVirgo-Lybra Cloud. Empty symbols are for HI-detected galaxies,filled symbols for upper limits.
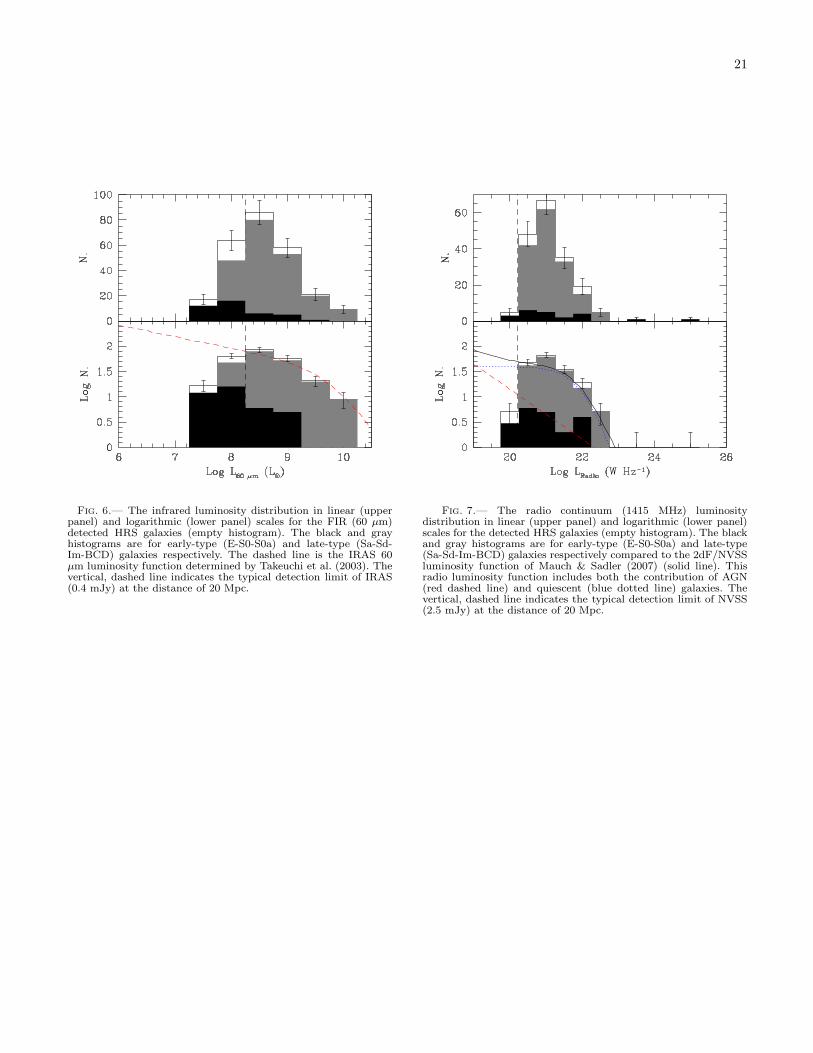
21
Fig. 6.— The infrared luminosity distribution in linear (upperpanel) and logarithmic (lower panel) scales for the FIR (60 µm)detected HRS galaxies (empty histogram). The black and grayhistograms are for early-type (E-S0-S0a) and late-type (Sa-Sd-Im-BCD) galaxies respectively. The dashed line is the IRAS 60µm luminosity function determined by Takeuchi et al. (2003). Thevertical, dashed line indicates the typical detection limit of IRAS(0.4 mJy) at the distance of 20 Mpc.
Fig. 7.— The radio continuum (1415 MHz) luminositydistribution in linear (upper panel) and logarithmic (lower panel)scales for the detected HRS galaxies (empty histogram). The blackand gray histograms are for early-type (E-S0-S0a) and late-type(Sa-Sd-Im-BCD) galaxies respectively compared to the 2dF/NVSSluminosity function of Mauch & Sadler (2007) (solid line). Thisradio luminosity function includes both the contribution of AGN(red dashed line) and quiescent (blue dotted line) galaxies. Thevertical, dashed line indicates the typical detection limit of NVSS(2.5 mJy) at the distance of 20 Mpc.

22
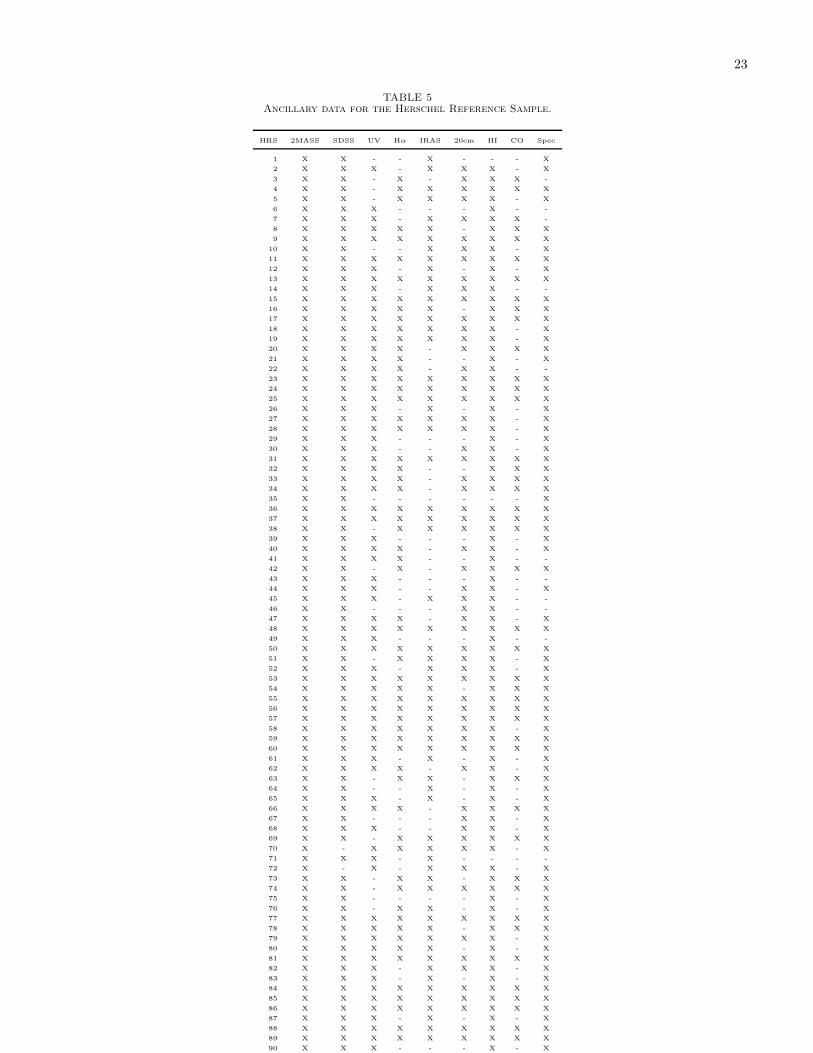
23
TABLE 5Ancillary data for the Herschel Reference Sample.
HRS 2MASS SDSS UV Hα IRAS 20cm HI CO Spec
1 X X - - X - - - X
2 X X X - X X X - X
3 X X - X - X X X -
4 X X - X X X X X X
5 X X - X X X X - X
6 X X X - - - X - -
7 X X X - X X X X -
8 X X X X X - X X X
9 X X X X X X X X X
10 X X - - X X X - X
11 X X X X X X X X X
12 X X X - X - X - X
13 X X X X X X X X X
14 X X X - X X X - -
15 X X X X X X X X X
16 X X X X X - X X X
17 X X X X X X X X X
18 X X X X X X X - X
19 X X X X X X X - X
20 X X X X - X X X X
21 X X X X - - X - X
22 X X X X - X X - -
23 X X X X X X X X X
24 X X X X X X X X X
25 X X X X X X X X X
26 X X X - X - X - X
27 X X X X X X X - X
28 X X X X X X X - X
29 X X X - - - X - X
30 X X X - - X X - X
31 X X X X X X X X X
32 X X X X - - X X X
33 X X X X - X X X X
34 X X X X - X X X X
35 X X - - - - - - X
36 X X X X X X X X X
37 X X X X X X X X X
38 X X - X X X X X X
39 X X X - - - X - X
40 X X X X - X X - X
41 X X X X - - X - -
42 X X - X - X X X X
43 X X X - - - X - -
44 X X X - - X X - X
45 X X X - X X X - -
46 X X - - - X X - -
47 X X X X - X X - X
48 X X X X X X X X X
49 X X X - - - X - -
50 X X X X X X X X X
51 X X - X X X X - X
52 X X X - X X X - X
53 X X X X X X X X X
54 X X X X X - X X X
55 X X X X X X X X X
56 X X X X X X X X X
57 X X X X X X X X X
58 X X X X X X X - X
59 X X X X X X X X X
60 X X X X X X X X X
61 X X X - X - X - X
62 X X X X - X X - X
63 X X - X X - X X X
64 X X - - X - X - X
65 X X X - X - X - X
66 X X X X - X X X X
67 X X - - - X X - X
68 X X X - - X X - X
69 X X - X X X X X X
70 X - X X X X X - X
71 X X X - X - - - -
72 X - X - X X X - X
73 X X - X X - X X X
74 X X - X X X X X X
75 X X - - - - X - X
76 X X - X X - X - X
77 X X X X X X X X X
78 X X X X X - X X X
79 X X X X X X X - X
80 X X X X X - X - X
81 X X X X X X X X X
82 X X X - X X X - X
83 X X X - X - X - X
84 X X X X X X X X X
85 X X X X X X X X X
86 X X X X X X X X X
87 X X X - X - X - X
88 X X X X X X X X X
89 X X X X X X X X X
90 X X X - - - X - X
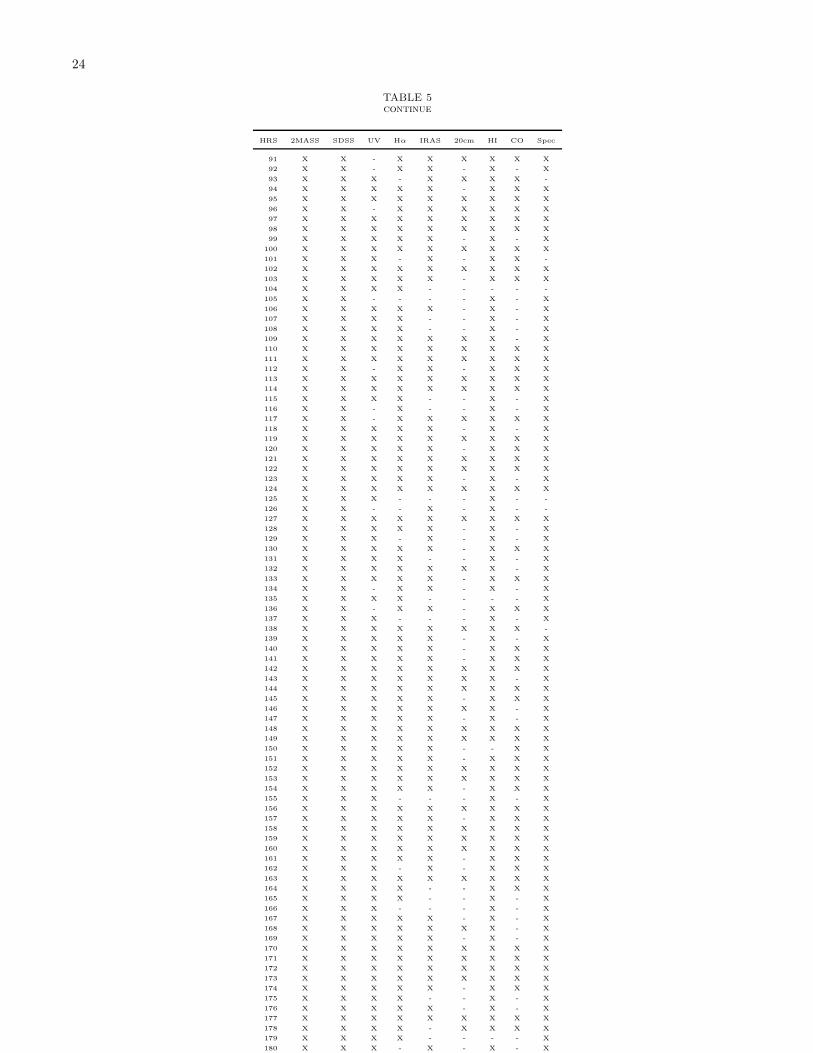
24
TABLE 5continue
HRS 2MASS SDSS UV Hα IRAS 20cm HI CO Spec
91 X X - X X X X X X
92 X X - X X - X - X
93 X X X - X X X X -
94 X X X X X - X X X
95 X X X X X X X X X
96 X X - X X X X X X
97 X X X X X X X X X
98 X X X X X X X X X
99 X X X X X - X - X
100 X X X X X X X X X
101 X X X - X - X X -
102 X X X X X X X X X
103 X X X X X - X X X
104 X X X X - - - - -
105 X X - - - - X - X
106 X X X X X - X - X
107 X X X X - - X - X
108 X X X X - - X - X
109 X X X X X X X - X
110 X X X X X X X X X
111 X X X X X X X X X
112 X X - X X - X X X
113 X X X X X X X X X
114 X X X X X X X X X
115 X X X X - - X - X
116 X X - X - - X - X
117 X X - X X X X X X
118 X X X X X - X - X
119 X X X X X X X X X
120 X X X X X - X X X
121 X X X X X X X X X
122 X X X X X X X X X
123 X X X X X - X - X
124 X X X X X X X X X
125 X X X - - - X - -
126 X X - - X - X - -
127 X X X X X X X X X
128 X X X X X - X - X
129 X X X - X - X - X
130 X X X X X - X X X
131 X X X X - - X - X
132 X X X X X X X - X
133 X X X X X - X X X
134 X X - X X - X - X
135 X X X X - - - - X
136 X X - X X - X X X
137 X X X - - - X - X
138 X X X X X X X X -
139 X X X X X - X - X
140 X X X X X - X X X
141 X X X X X - X X X
142 X X X X X X X X X
143 X X X X X X X - X
144 X X X X X X X X X
145 X X X X X - X X X
146 X X X X X X X - X
147 X X X X X - X - X
148 X X X X X X X X X
149 X X X X X X X X X
150 X X X X X - - X X
151 X X X X X - X X X
152 X X X X X X X X X
153 X X X X X X X X X
154 X X X X X - X X X
155 X X X - - - X - X
156 X X X X X X X X X
157 X X X X X - X X X
158 X X X X X X X X X
159 X X X X X X X X X
160 X X X X X X X X X
161 X X X X X - X X X
162 X X X - X - X X X
163 X X X X X X X X X
164 X X X X - - X X X
165 X X X X - - X - X
166 X X X - - - X - X
167 X X X X X - X - X
168 X X X X X X X - X
169 X X X X X - X - X
170 X X X X X X X X X
171 X X X X X X X X X
172 X X X X X X X X X
173 X X X X X X X X X
174 X X X X X - X X X
175 X X X X - - X - X
176 X X X X X - X - X
177 X X X X X X X X X
178 X X X X - X X X X
179 X X X X - - - - X
180 X X X - X - X - X
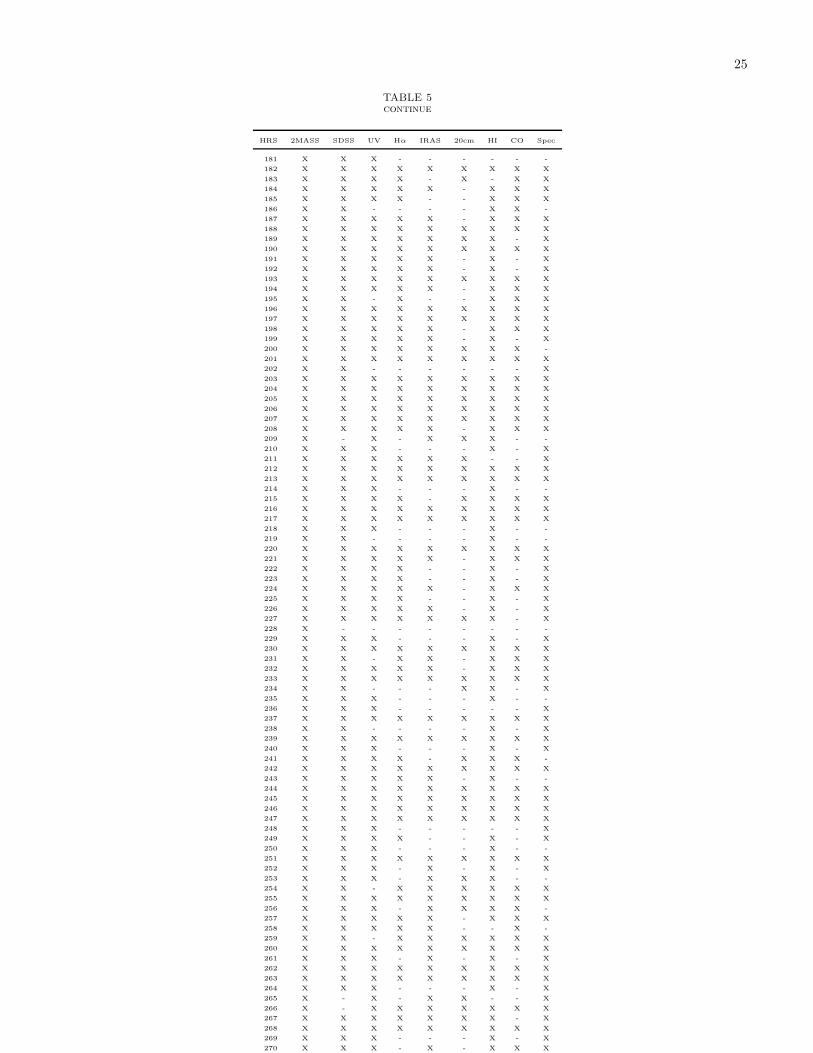
25
TABLE 5continue
HRS 2MASS SDSS UV Hα IRAS 20cm HI CO Spec
181 X X X - - - - - -
182 X X X X X X X X X
183 X X X X - X - X X
184 X X X X X - X X X
185 X X X X - - X X X
186 X X - - - - X X -
187 X X X X X - X X X
188 X X X X X X X X X
189 X X X X X X X - X
190 X X X X X X X X X
191 X X X X X - X - X
192 X X X X X - X - X
193 X X X X X X X X X
194 X X X X X - X X X
195 X X - X - - X X X
196 X X X X X X X X X
197 X X X X X X X X X
198 X X X X X - X X X
199 X X X X X - X - X
200 X X X X X X X X -
201 X X X X X X X X X
202 X X - - - - - - X
203 X X X X X X X X X
204 X X X X X X X X X
205 X X X X X X X X X
206 X X X X X X X X X
207 X X X X X X X X X
208 X X X X X - X X X
209 X - X - X X X - -
210 X X X - - - X - X
211 X X X X X X - - X
212 X X X X X X X X X
213 X X X X X X X X X
214 X X X - - - X - -
215 X X X X - X X X X
216 X X X X X X X X X
217 X X X X X X X X X
218 X X X - - - X - -
219 X X - - - - X - -
220 X X X X X X X X X
221 X X X X X - X X X
222 X X X X - - X - X
223 X X X X - - X - X
224 X X X X X - X X X
225 X X X X - - X - X
226 X X X X X - X - X
227 X X X X X X X - X
228 X - - - - - - - -
229 X X X - - - X - X
230 X X X X X X X X X
231 X X - X X - X X X
232 X X X X X - X X X
233 X X X X X X X X X
234 X X - - - X X - X
235 X X X - - - X - -
236 X X X - - - - - X
237 X X X X X X X X X
238 X X - - - - X - X
239 X X X X X X X X X
240 X X X - - - X - X
241 X X X X - X X X -
242 X X X X X X X X X
243 X X X X X - X - -
244 X X X X X X X X X
245 X X X X X X X X X
246 X X X X X X X X X
247 X X X X X X X X X
248 X X X - - - - - X
249 X X X X - - X - X
250 X X X - - - X - -
251 X X X X X X X X X
252 X X X - X - X - X
253 X X X - X X X - -
254 X X - X X X X X X
255 X X X X X X X X X
256 X X X - X X X X -
257 X X X X X - X X X
258 X X X X X - - X -
259 X X - X X X X X X
260 X X X X X X X X X
261 X X X - X - X - X
262 X X X X X X X X X
263 X X X X X X X X X
264 X X X - - - X - X
265 X - X - X X - - X
266 X - X X X X X X X
267 X X X X X X X - X
268 X X X X X X X X X
269 X X X - - - X - X
270 X X X - X - X X X
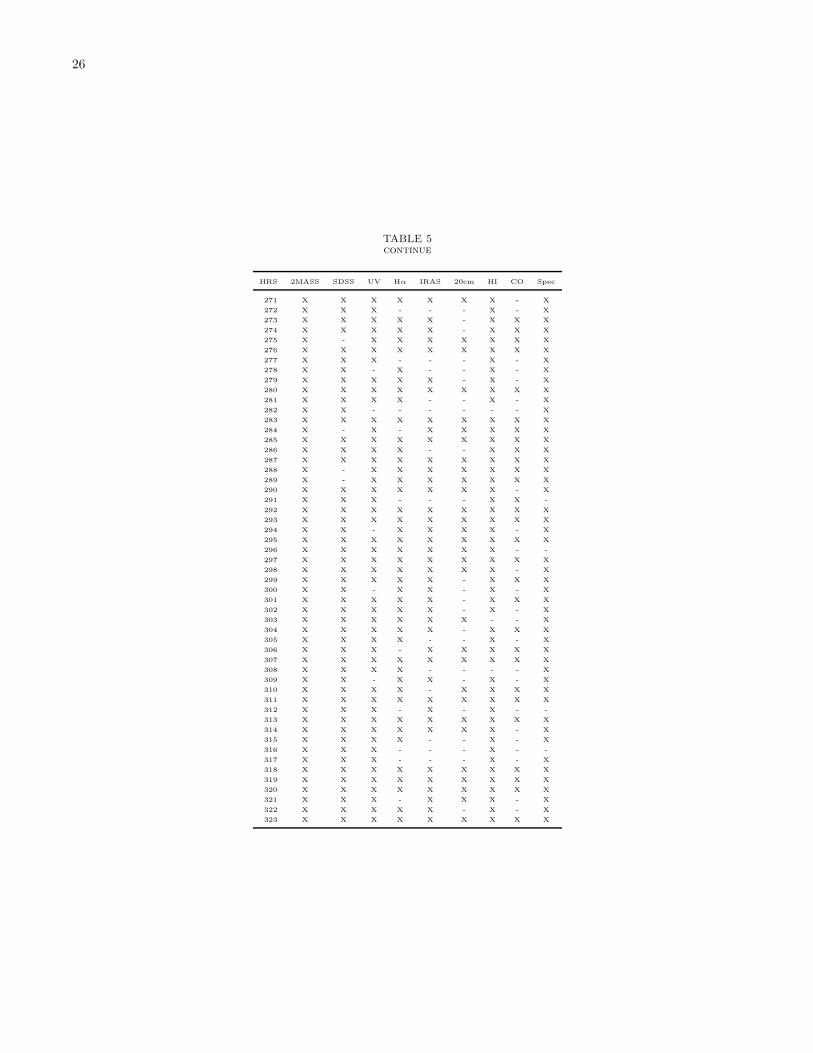
26
TABLE 5continue
HRS 2MASS SDSS UV Hα IRAS 20cm HI CO Spec
271 X X X X X X X - X
272 X X X - - - X - X
273 X X X X X - X X X
274 X X X X X - X X X
275 X - X X X X X X X
276 X X X X X X X X X
277 X X X - - - X - X
278 X X - X - - X - X
279 X X X X X - X - X
280 X X X X X X X X X
281 X X X X - - X - X
282 X X - - - - - - X
283 X X X X X X X X X
284 X - X - X X X X X
285 X X X X X X X X X
286 X X X X - - X X X
287 X X X X X X X X X
288 X - X X X X X X X
289 X - X X X X X X X
290 X X X X X X X - X
291 X X X - - - X X -
292 X X X X X X X X X
293 X X X X X X X X X
294 X X - X X X X - X
295 X X X X X X X X X
296 X X X X X X X - -
297 X X X X X X X X X
298 X X X X X X X - X
299 X X X X X - X X X
300 X X - X X - X - X
301 X X X X X - X X X
302 X X X X X - X - X
303 X X X X X X - - X
304 X X X X X - X X X
305 X X X X - - X - X
306 X X X - X X X X X
307 X X X X X X X X X
308 X X X X - - - - X
309 X X - X X - X - X
310 X X X X - X X X X
311 X X X X X X X X X
312 X X X - X - X - -
313 X X X X X X X X X
314 X X X X X X X - X
315 X X X X - - X - X
316 X X X - - - X - -
317 X X X - - - X - X
318 X X X X X X X X X
319 X X X X X X X X X
320 X X X X X X X X X
321 X X X - X X X - X
322 X X X X X - X - X
323 X X X X X X X X X