
Methanol maps of low-mass protostellar systems. I. The Serpens molecular core
17
arXiv:1004.2217v1 [astro-ph.SR] 13 Apr 2010 Astronomy & Astrophysics manuscript no. 14182 c ESO 2014 January 5, 2014 Methanol maps of low-mass protostellar systems I. The Serpens Molecular Core L.E. Kristensen 1 , E.F. van Dishoeck 1,2 , T.A. van Kempen 3 , H.M. Cuppen 1 , C. Brinch 1 , J.K. Jørgensen 4 , and M.R. Hogerheijde 1 1 Leiden Observatory, Leiden University, PO Box 9513, 2300 RA Leiden, The Netherlands e-mail: [email protected] 2 Max Planck Institut f¨ ur Extraterrestrische Physik (MPE), Giessenbachstrasse 1, 85748 Garching, Germany 3 Harvard-Smithsonian Center for Astrophysics, 60 Garden Street, MS 78, Cambridge, MA 02138, USA 4 Centre for Star and Planet Formation, Natural History Museum of Denmark, Øster Voldgade 5-7, DK-1350 Copenhagen K., Denmark January 5, 2014 Abstract Context. Methanol has a rich rotational spectrum providing a large number of transitions at sub-millimetre wavelengths from a range of energy levels in one single telescope setting, thus making it a good tracer of physical conditions in star-forming regions. Furthermore, it is formed exclusively on grain surfaces and is therefore a clean tracer of surface chemistry. Aims. Determining the physical and chemical structure of low-mass, young stellar objects, in particular the abundance structure of CH 3 OH, to investigate where and how CH 3 OH forms and how it is eventually released back to the gas phase. Methods. Observations of the Serpens Molecular Core have been performed at the James Clerk Maxwell Telescope using the array receiver, Harp-B. Maps over a 4. ′ 5×5. ′ 4 region were made in a frequency window around 338 GHz, covering the 7 K –6 K transitions of methanol. Data are compared with physical models of each source based on existing sub-millimetre continuum data. Results. Methanol emission is extended over each source, following the column density of H 2 but showing up also particularly strongly around outflows. The rotational temperature is low, 15–20 K, and does not vary with position within each source. None of the Serpens Class 0 sources show the high-K lines seen in several other Class 0 sources. The abundance is typically 10 −9 – 10 −8 with respect to H 2 in the outer envelope, whereas “jumps” by factors of up to 10 2 –10 3 inside the region where the dust temperature exceeds 100 K are not excluded. A factor of up to ∼ 10 3 enhancement is seen in outflow gas, consistent with previous studies. In one object, SMM4, the ice abundance has been measured to be ∼ 3 × 10 −5 with respect to H 2 in the outer envelope, i.e., a factor of 10 3 larger than the gas-phase abundance. Comparison with C 18 O J =3–2 emission shows that strong CO depletion leads to a high gas-phase abundance of CH 3 OH not just for the Serpens sources, but also for a larger sample of deeply embedded protostars. Conclusions. The observations illustrate the large-scale, low-level desorption of CH 3 OH from dust grains, extending out to and beyond 7500 AU from each source, a scenario which is consistent with non-thermal (photo-)desorption from the ice. The observations also illustrate the usefulness of CH 3 OH as a tracer of energetic input in the form of outflows, where methanol is sputtered from the grain surfaces. Finally, the observations provide further evidence of CH 3 OH formation through CO hydrogenation proceeding on grain surfaces in low-mass envelopes. Key words. ISM: abundances — ISM: molecules — Stars: formation — ISM: individual objects, Serpens 1. Introduction A long-standing goal of astrochemistry has been to determine the physical and chemical conditions prevailing in star-forming regions (e.g., van Dishoeck & Blake 1998). In this respect, dif- ferent molecules act as tracers of different physical components, all depending on their formation history, their abundances, their chemical properties, etc. To effectively trace physical conditions such as density and temperature over the large range of val- ues found in star-forming regions over the time-scale of star- formation, it is of great importance to have as many independent tracers as possible. Methanol (CH 3 OH), with its rich rotational spectrum, is an excellent candidate tracing both temperature, density, grain surface formation and energy injection simulta- neously during all phases of the early stages of stellar evolution. CH 3 OH is a slightly asymmetric top molecule with numer- ous rotational transitions observable at millimetre- and sub- millimetre wavelengths. Because of the large number of tran- sitions observable in a single frequency window it is possible to obtain a coherent data set very efficiently, making methanol a very suitable tracer of physical conditions, in particular in low-mass star forming regions where the emission is optically thin. Moreover, since the molecule is a slightly asymmetric top molecule, it traces very efficiently both density and temperature (e.g., Maret et al. 2005; Jørgensen et al. 2005b; Leurini et al. 2007). Methanol forms exclusively on ice-covered dust grain surfaces primarily through hydrogenation of CO (Watanabe & Kouchi 2002; Fuchs et al. 2009). Observations of interstellar ices show that methanol is indeed a prominent ice component, with abundances of up to almost 30% with respect to solid-state H 2 O or a few × 10 −5 with respect to gas-phase H 2 (e.g., Dartois et al. 1999; Gibb et al. 2004; Pontoppidan et al. 2004). In contrast, pure gas phase reactions produce negligible CH 3 OH abundances of less than 10 −10 (Garrod et al. 2006). The question that naturally arises is how methanol desorbs from
Transcript of Methanol maps of low-mass protostellar systems. I. The Serpens molecular core

arX
iv:1
004.
2217
v1 [
astr
o-ph
.SR
] 13
Apr
201
0Astronomy & Astrophysicsmanuscript no. 14182 c© ESO 2014January 5, 2014
Methanol maps of low-mass protostellar systemsI. The Serpens Molecular Core
L.E. Kristensen1, E.F. van Dishoeck1,2, T.A. van Kempen3, H.M. Cuppen1, C. Brinch1, J.K. Jørgensen4, and M.R.Hogerheijde1
1 Leiden Observatory, Leiden University, PO Box 9513, 2300 RALeiden, The Netherlandse-mail:[email protected]
2 Max Planck Institut fur Extraterrestrische Physik (MPE),Giessenbachstrasse 1, 85748 Garching, Germany3 Harvard-Smithsonian Center for Astrophysics, 60 Garden Street, MS 78, Cambridge, MA 02138, USA4 Centre for Star and Planet Formation, Natural History Museum of Denmark, Øster Voldgade 5-7, DK-1350 Copenhagen K.,
Denmark
January 5, 2014
Abstract
Context. Methanol has a rich rotational spectrum providing a large number of transitions at sub-millimetre wavelengths from arange of energy levels in one single telescope setting, thusmaking it a good tracer of physical conditions in star-forming regions.Furthermore, it is formed exclusively on grain surfaces andis therefore a clean tracer of surface chemistry.Aims. Determining the physical and chemical structure of low-mass, young stellar objects, in particular the abundance structure ofCH3OH, to investigate where and how CH3OH forms and how it is eventually released back to the gas phase.Methods. Observations of the Serpens Molecular Core have been performed at the James Clerk Maxwell Telescope using the arrayreceiver, Harp-B. Maps over a 4.′5×5.′4 region were made in a frequency window around 338 GHz, covering the 7K–6K transitions ofmethanol. Data are compared with physical models of each source based on existing sub-millimetre continuum data.Results. Methanol emission is extended over each source, following the column density of H2 but showing up also particularlystrongly around outflows. The rotational temperature is low, 15–20 K, and does not vary with position within each source.None ofthe Serpens Class 0 sources show the high-K lines seen in several other Class 0 sources. The abundance istypically 10−9 – 10−8 withrespect to H2 in the outer envelope, whereas “jumps” by factors of up to 102–103 inside the region where the dust temperature exceeds100 K are not excluded. A factor of up to∼ 103 enhancement is seen in outflow gas, consistent with previousstudies. In one object,SMM4, the ice abundance has been measured to be∼ 3 × 10⁻⁵ with respect to H2 in the outer envelope, i.e., a factor of 103 largerthan the gas-phase abundance. Comparison with C18O J=3–2 emission shows that strong CO depletion leads to a high gas-phaseabundance of CH3OH not just for the Serpens sources, but also for a larger sample of deeply embedded protostars.Conclusions. The observations illustrate the large-scale, low-level desorption of CH3OH from dust grains, extending out to andbeyond 7500 AU from each source, a scenario which is consistent with non-thermal (photo-)desorption from the ice. The observationsalso illustrate the usefulness of CH3OH as a tracer of energetic input in the form of outflows, wheremethanol is sputtered from thegrain surfaces. Finally, the observations provide furtherevidence of CH3OH formation through CO hydrogenation proceeding ongrain surfaces in low-mass envelopes.
Key words. ISM: abundances — ISM: molecules — Stars: formation — ISM: individual objects, Serpens
1. Introduction
A long-standing goal of astrochemistry has been to determinethe physical and chemical conditions prevailing in star-formingregions (e.g., van Dishoeck & Blake 1998). In this respect, dif-ferent molecules act as tracers of different physical components,all depending on their formation history, their abundances, theirchemical properties, etc. To effectively trace physical conditionssuch as density and temperature over the large range of val-ues found in star-forming regions over the time-scale of star-formation, it is of great importance to have as many independenttracers as possible. Methanol (CH3OH), with its rich rotationalspectrum, is an excellent candidate tracing both temperature,density, grain surface formation and energy injection simulta-neously during all phases of the early stages of stellar evolution.
CH3OH is a slightly asymmetric top molecule with numer-ous rotational transitions observable at millimetre- and sub-millimetre wavelengths. Because of the large number of tran-
sitions observable in a single frequency window it is possibleto obtain a coherent data set very efficiently, making methanola very suitable tracer of physical conditions, in particular inlow-mass star forming regions where the emission is opticallythin. Moreover, since the molecule is a slightly asymmetrictopmolecule, it traces very efficiently both density and temperature(e.g., Maret et al. 2005; Jørgensen et al. 2005b; Leurini et al.2007).
Methanol forms exclusively on ice-covered dustgrain surfaces primarily through hydrogenation of CO(Watanabe & Kouchi 2002; Fuchs et al. 2009). Observations ofinterstellar ices show that methanol is indeed a prominent icecomponent, with abundances of up to almost 30% with respectto solid-state H2O or a few× 10−5 with respect to gas-phase H2(e.g., Dartois et al. 1999; Gibb et al. 2004; Pontoppidan et al.2004). In contrast, pure gas phase reactions produce negligibleCH3OH abundances of less than 10−10 (Garrod et al. 2006). Thequestion that naturally arises is how methanol desorbs from

2 L.E. Kristensen et al.: Methanol maps of low-mass protostellar systems
the surface of a dust grain to be observed in the gas phase. Isit through thermal heating of the entire grain, or is it throughnon-thermal desorption, where cosmic rays, UV-photons orexothermic reactions provide local heating of the grain? Theformer mechanism is at play close to young stellar objects(YSOs), in the inner-most part of the molecular envelope wherethe gas temperature exceeds 100 K (van Dishoeck et al. 1995;Ceccarelli et al. 2000; van der Tak et al. 2000; Schoier et al.2002; Maret et al. 2005; Jørgensen et al. 2005b) and in outflowswhere hot gas sputters the icy mantles (e.g. Bachiller et al.1995; Bachiller & Perez Gutierrez 1997). This mechanismallows for an effective methanol enrichment of the environmentand abundances are typically in the range of 10−7 to 10−6. Thenon-thermal mechanism dominates in cold, dark clouds andthe outer parts of molecular envelopes (Hasegawa & Herbst1993; Herbst & Cuppen 2006; Garrod et al. 2007;Oberg et al.2009a). Here, reported abundances typically have values of10−10 to 10−8. Hence, methanol also acts as a tracer of energeticprocesses in star-forming regions.
So far most studies have concentrated on spectra at a sin-gle position or at most a few around them. Recently, large-scalemapping of weak molecular lines has become very efficient withthe advent of array receivers such as the 16 pixel Harp-B re-ceiver on the James Clerk Maxwell Telescope (JCMT). Thisallows for a direct study of the entire protostellar system (pri-marily envelope and outflow) on scales of several arcminutesat15′′ resolution and for determination of density, temperature andenergy input into the system. These observations will eventu-ally be compared directly to observations of another importantgrain surface product, H2O, to be done with the Herschel SpaceObservatory. By mapping the entire region, comparison withthedifferent Herschel-beams (9′′–40′′) will be straight-forward.
The Serpens molecular core (also known as cluster A)is located at a distance of 230±20 pc, following the discus-sion in Eiroa et al. (2008). The Serpens molecular core con-sists of several deeply embedded sources, of which at least fourare identified as containing protostars (Wolf-Chase et al. 1998;Hogerheijde et al. 1999), SMM1, SMM3, SMM4 and S68N.Large-scale continuum-emission studies have been performedto quantify the spectral energy distribution of all sourcesinorder to classify their evolutionary stage as well as the dustproperties of the molecular envelopes surrounding each source(e.g., Casali et al. 1993; Hurt & Barsony 1996; Testi & Sargent1998; Davis et al. 1999; Larsson et al. 2000; Williams & Myers2000), most recently with the Spitzer Space Telescope as partof the Cores to Disks legacy program (c2d; Harvey et al. 2007;Evans et al. 2009). These studies show that three of the sources(SMM3, SMM4 and S68N) have relatively low bolometric lumi-nosities of∼ 5 L⊙ each, whereas SMM1 has a higher luminosityof ∼ 30 L⊙ (e.g., Hogerheijde et al. 1999; Larsson et al. 2000).The mass of each system (envelope and star) is in all cases lessthan 10M⊙. Recent interferometer observations by Choi (2009)show that SMM1 is a binary system with a projected separa-tion of ∼ 500 AU. The binary SMM1b appears less embeddedthan the primary (SMM1a). This discovery has been refuted byEnoch et al. (2009) and van Kempen et al. (2009) who both re-solve the disk around SMM1. Through detailed SED modelling,Enoch et al. (2009) finds a very high disk mass of∼ 1 M⊙ andthat the inner parts of the envelope have been cleared out to dis-tances of 500 AU.
The region has been studied extensively at millime-tre (mm) and sub-millimetre (sub-mm) wavelengths in nu-merous molecular transitions (e.g., McMullin et al. 1994;White et al. 1995; Wolf-Chase et al. 1998; Hogerheijde et al.
1999; McMullin et al. 2000), however it was not included in themolecular surveys of isolated Class 0 and I objects in Perseusand Ophiucus (Jørgensen et al. 2004, 2005b; Maret et al. 2005).The previous molecular studies conclude that SMM1, SMM3,SMM4 and S68N are all very similar to other young, low-massstars with similar luminosities, such as IRAS16293-2422 andNGC1333 IRAS4A and 4B in terms of abundances of sim-ple molecules that may be formed directly in the gas phase,e.g., HCO+, CS, HCN (McMullin et al. 1994; Hogerheijde et al.1999; McMullin et al. 2000). In Serpens, little has been doneto quantify excitation and gas-phase abundances of moleculespredominantly formed on dust grain surfaces, like CH3OH,even though several lines have been detected by McMullin et al.(1994, 2000) and Hogerheijde et al. (1999).
More direct observations of grain surface products have beenmade by Pontoppidan et al. (2004), who mapped infrared ab-sorption by molecules in the ice over a region extending 40′′
south of SMM4, but still located well within the molecular en-velope. The primary ice constituents were found to be H2O, CO(0.4–0.9 with respect to H2O), CH3OH (0.28 with respect toH2O) and CO2 (0.3–0.5 with respect to H2O; Pontoppidan et al.2008). The solid-state CH3OH abundance is one of the high-est reported to date, both when compared to H2O but also withrespect to gas-phase H2 (3×10⁻⁵). At distances greater than12 000 AU the CH3OH-ice abundance drops beneath the detec-tion limit, corresponding to 3×10⁻⁶ with respect to H2.
Besides the protostellar objects themselves, the region ispermeated by large-scale outflows extending several arcmin-utes from the different sources with COJ=2–1 velocities rang-ing from ±10–15 km s−1 with respect to3LSR = 8 − 8.5km s−1
(Davis et al. 1999, Graves et al. subm.). Garay et al. (2002) ob-served the outflows from SMM4 and S68N in CH3OH 3K–2K emission and inferred CH3OH column densities of 1–2×1015 cm−2, corresponding to molecular abundance enhance-ments of∼ 50–330, depending on outflow position, consistentwith studies of other outflows (e.g., Bachiller et al. 1995, 1998).
Here, the first map of rotationally excited methanol in theSerpens Molecular Core is presented of transitions which coverthe energy range ofEup ∼ 65−115 K. The paper is structured asfollows. In Sect. 2 the observations are presented, and in Sect. 3the observational results are provided along with radiative trans-fer modelling. Section 4 presents a discussion of the results, witha particular focus on the formation, desorption and excitationprocesses. Section 5 concludes the paper.
2. Observations
Observations of the Serpens molecular core were performedon June 20-22 2008 with the James Clerk Maxwell Telescope1
(JCMT) on Mauna Kea, Hawaii. Observations were made of the7K-6K rotational band of methanol (Eup ∼ 65–115 K) at fre-quencies ranging from 338 to 339 GHz using the Harp-B ar-ray receiver consisting of 4×4 individual receivers (Smith et al.2003). The telescope was pointed at two different locations nearSerpens SMM1 and two different locations near SMM4, seeFig. 1, covering a total extent of 4.′5×5.′4. Observations werealso made of C18O, J=3–2 at 329.330 GHz in a similar fash-ion, so as to be able to compare methanol and CO emission.Observations were made in jiggle-mode to achieve full spatial
1 The James Clerk Maxwell Telescope is operated by the JointAstronomy Centre on behalf of the Science and Technology FacilitiesCouncil of the United Kingdom, the Netherlands Organisation forScientific Research and the National Research Council of Canada.

L.E. Kristensen et al.: Methanol maps of low-mass protostellar systems 3
Figure 1. Integrated emission,∫
TMB d3, of the strong 70–60 A+ line at 338.41 GHz. Objects Serpens SMM1, 3, 4 and S68N arelabelled. Offsets are in arcsec with respect to SMM1. Contours are at 3σ, 6σ, 9σ, etc. The units for colour are K km s−1. Thepixel size is 7.′′5×7.′′5. The lines indicate outflow directions, with dashed representing blue-shifted outflow emission, and dottedlines representing red-shifted emission. The full white line extending south of SMM4 depicts the location of the four stars used byPontoppidan et al. (2004) to measure the CH3OH-ice abundance. Shown are also sample spectra at different positions, illustrated bytriangles, from a single spatial pixel and provided in each inset in units of arcsec. The abscissa is for frequency in units of GHz andthe ordinate is for main beam temperature in units of K. All spectra have the same scale to ease intercomparison.
Nyquist-sampling using the Harp4 jiggle-pattern over a 2′×2′
region. The beam-size of the JCMT at 338.5 GHz is∼ 15′′ anddata were subsequently put on a map with a pixel-size of 7.′′5,i.e., one half beam-size to fulfill the Nyquist sampling criterion.The methanol observations were done using beam-switch witha throw of 180′′ in azimuth while the C18O observations weredone using position switch to a clean position 1◦ off. The weatherat the time of the observations was good withτ(225 GHz)≤ 0.1.Pointing and calibration were checked at regular intervals, andthe calibration error is estimated to be. 20% based on a compar-ison with standard calibration sources. Data were brought fromthe antenna temperature scale,T ∗A, to the main beam tempera-
ture scale,TMB, by dividing with the main beam efficiency,ηMB ,which is 0.60 for the JCMT at these frequencies. The spectralresolution of the CH3OH spectra is 0.43 km s−1, and the C18Ospectra were rebinned to the same value.
The mean rms in the methanol spectra is 20 mK in0.43 km s−1 velocity bins over the entire map. The 1σnoise level on integrated emission has been determined as1.2σrms
√FWZI × δ3 where the factor 1.2 accounts for the 20%
telescope calibration uncertainty,σrms is the rms noise,FWZIthe estimated full width at zero intensity (taken to be 5 km s−1)andδ3 the velocity bin (0.43 km s−1). The 3σ uncertainty is typ-

4 L.E. Kristensen et al.: Methanol maps of low-mass protostellar systems
ically ∼ 0.1 K km s−1 per spatial pixel, but increases near theedges of the map by a factor of 2–3.
Initial data reduction was done using the Starlink package.This consisted of putting the spectra on to a regular grid withpixel-size 7.′′5, subtracting linear baselines and co-adding alldata-cubes. The Gildas package CLASS was used for subse-quent analysis. Standard data reduction revealed emissionin theoff-position for a subset of the methanol observations, but itwas possible to remove this emission due to two facts: (1) Theoff-emission never coincided with on-emission, i.e., no double-peaked or “self-absorbed” line profiles were observed. In generalthe velocity offset between emission and absorption lines was ofthe order of∼ 5 km s−1 compared to typical line-widths of 3–4 km s−1 in the region where the off-emission was seen. (2) Datawere recorded with a shared off-position, that is, even thoughthe telescope jiggled on the on-position, no jiggling was doneon the off-position. Therefore it was possible to recreate the off-emission in the strongest emission line at 338.409 GHz in thefollowing way: first the strongest “absorption” line was fittedwith a Gaussian profile, then an artificial spectrum was createdassuming a rotational temperature of 15 K, which was added toeach spectrum. The spectra were then analysed and no absorp-tion features remained within the noise limit.
3. Results
In all spectra emission lines from the 7K–6K rotational bandof methanol are detected both on and off sources. In the cen-tral parts of each of the four YSOs up to eight emission linesare detected originating from ten transitions. The strongest line,the 70–60 A+ line at 338.409 GHz, has a peak brightness tem-perature of up to 0.5 K. All line profiles are Gaussian, no lineasymmetries due to outflow activity or infall are observed. TheFWHM of the emission lines are∼ 4–6.5 km s−1, consistentwith other observations of methanol line widths (e.g. Maretet al.2005; Jørgensen et al. 2005b). Line widths change between ob-jects, but remain constant within each object, i.e., line widthsdo not change with position within an envelope. In Fig. 1 anoverview is provided of the integrated emission in the strong70–60 A+ line over the Serpens molecular core. The integrationis numeric and has been done over the velocity interval –25 to+25 km s−1 with respect to3lsr = 8.0 km s−1. The four Class 0objects, Serpens SMM1, SMM3, SMM4 and S68N (labelled inFig. 1) are clearly seen. Representative spectra obtained at differ-ent positions sampling both YSOs, molecular envelopes and out-flows are shown. Besides the four Class 0 objects, three distinctoutflow knots are identified, SMM1-S, SMM4-W and SMM4-S. All of these bright knots coincide with outflow positions asseen through CO observations (e.g., Davis et al. 1999). Weakerstructure is also seen in the map, for example an elongation ofSMM1 in the east-west direction. This corresponds to the direc-tion of a weaker CO-outflow (Davis et al. 1999). The structurearound S68N is more complex with the source itself being elon-gated in the NW-SE direction. Around this source a compact CSoutflow has been discovered at the same position angle as theelongation (Wolf-Chase et al. 1998). Weak emission is also seenaround S68N in the north-south and east-west directions.
Representative spectra of the central parts of the four en-velopes are shown in Fig. 2 where emission is averaged over 3×3pixels (corresponding to 22.′′5×22.′′5 or 5600 AU×5600 AU).In the following, results will be presented first for the centralparts of each envelope followed by results for the extended emis-sion in each envelope. Finally results will be presented forthree
Figure 2. Spectra of Serpens SMM1, 3, 4 and S68N.The NGC1333-IRAS2A spectrum is shown for comparison(Maret et al. 2005). Spectra at the three outflow positions,SMM1-S, SMM4-W and SMM4-S, are also shown. Lines iden-tified in the CH3OH 7K–6K band are marked. Spectra were ob-tained by averaging emission from the peak pixel with its eightneighbouring pixels, i.e., in a box of 22.′′5×22.′′5. The SMM1, 3,4 and S68N spectra are shifted by+0.25, 0.5, 0.7 and 1.1 K, re-spectively, while SMM1-S, SMM4-W and SMM4-S are shiftedby 2.4, 2.0 and 1.7 K.
strong outflow knots in the map, named SMM1-S, SMM4-Wand SMM4-S.
3.1. Emission from the central part of the envelopes
The emission lines arising from the central part of each enve-lope are fitted with Gaussian line profiles to obtain the integratedemission at higher accuracy. Results are tabulated in Table1along with the upper level energy,Eup, and line frequency. Inthe spectra presented in Fig. 2 the 3σ level is a factor of threelower, since they are each the average of nine spectra. Low-Klines up toK = 3 are clearly detected, but high-K lines are notseen. This is in contrast to other low-mass YSOs with similarluminosities and/or distances and evolutionary stages, such asIRAS16293-2422 (e.g. van Dishoeck et al. 1995) and NGC1333IRAS2A (Maret et al. 2005).
The integrated intensities are used to make rotational dia-grams for each of the four objects. These are shown in Fig.3. Within the uncertainty, the logarithm of the derived upperlevel column densities,N, divided by the statistical weights,g,

L.E. Kristensen et al.: Methanol maps of low-mass protostellar systems 5
Table 1. Integrated line intensities,∫
TMB d3 (K km s−1) over the central 22.′′5 ×22.′′5 of each sourcea and emission-weighted,average line-widths.
Transition ν (GHz)b Eup (K)b SMM1 SMM3 SMM4 S68N SMM1-S SMM4-W SMM4-S+0E 338.1245 78.1 0.25 0.22 0.30 0.85 . . . 0.09 0.41-1E 338.3446 70.5 0.58 0.45 1.09 2.90 0.52 0.90 1.38+0A 338.4087 65.0 0.71 0.62 1.35 3.66 1.06 1.26 2.21-2A 338.5129 102.7 0.06 0.01 . . . 0.24 0.08 0.20 . . .±3Ac 338.5420 114.8 0.11 0.16 0.15 0.40 . . . . . . . . .+1E 338.6150 86.1 0.16 0.08 0.18 0.45 . . . 0.34 . . .+2A 338.6399 102.7 0.09 0.07 . . . 0.26 . . . . . . . . .±2Ec 338.7223 89.1 0.21 0.16 0.28 1.05 . . . 0.13 0.11∆3 (km s−1) 3.4±0.9 4.4±2.5 4.0±0.7 7.2±1.3 4.3±0.9 4.0±0.3 4.1±0.3
a Non-detections are marked by “. . . ”, for which an upper limitof 0.03 K km s−1 applies.b Frequencies and upper level energies are from the Cologne Database for Molecular Spectroscopy (CDMS; Muller et al. 2001).c Lines are blended. The frequencies and upper level energiesare average values.
Figure 3. Rotational diagrams with data obtained from the fourspectra shown in Fig. 2. The best-fit straight line is shown ineach case as a dotted line. Error bars are for 1σ uncertainties.
fall on a straight line when plotted versus the upper level en-ergy divided by the Boltzmann constant,kB. No difference be-tween A- and E-type methanol is found, thus the abundances are
equal, x(E-CH3OH)= x(A-CH3OH). In the cold-temperaturelimit (T ∼ 10 K) the abundance ratio is expected to beE/A =0.69 whereas it is 1 at higher temperatures, and thus little or nodifference in abundance is expected (e.g., Friberg et al. 1988).The derived rotational temperature for each of the four envelopesis low, 15–20 K, significantly lower than the rotational temper-ature of∼ 80 K inferred for IRAS16293-2422 and NGC1333IRAS2A (van Dishoeck et al. 1995; Maret et al. 2005). The esti-mated column densities are all of the order of∼ 1014–1015 cm−2.Results are tabulated in Table 2. Rotational temperatures andcolumn densities are similar to those found by Maret et al.(2005) and Jørgensen et al. (2005b) for a larger sample of low-mass, Class 0 objects, with the exception of the two sources men-tioned above.
3.2. Extended emission from the envelopes
To quantify the spatial distribution of methanol in each molec-ular envelope, the radial distribution of emission from thefivestrongest lines is plotted in Fig. 6. Methanol emission is ex-tended in all envelopes, and theFWHM of emission is around2–3 times the 15′′ beam. Extended methanol has previouslybeen reported in the envelope of the isolated Class 0 objectL483 (Tafalla et al. 2000) in the 20–10 A+ and 2−1–1−1 E lines(Eup = 12–20 K), where it was found that the methanol emissiontraces total gas column density. To verify whether this is true forthe Serpens envelopes, it is necessary to quantify the physicalstructure of the envelopes. This is done through a combinationof dust continuum emission at 850µm as observed with SCUBAon the JCMT and modelling of the physical structure.
To obtain the absolute abundances, three different methodsare used. First, the CH3OH column density obtained from ro-tational diagrams is compared to the column density obtainedfrom dust emission at 850µm in the same beam. Second, theCH3OH column density from rotational diagrams is comparedto the column density predicted from a physical model of eachsource. Third, a radiative transfer model is compared directly tothe observed spectrum to constrain the abundance. Results arelisted in Table 4.
3.2.1. Dust continuum emission
It is possible to directly estimate the average column density overthe central area of each envelope by assuming that the dust emis-sion is optically thin, thermal emission at a single dust tempera-

6 L.E. Kristensen et al.: Methanol maps of low-mass protostellar systems
Table 2. Rotational diagram results for the observed methanolemission.
Source Trot (K) N (1014 cm−2)a
SMM1 18.9±0.9 4.1±0.7SMM3 19.5±1.1 3.4±0.7SMM4 15.1±0.4 12±1.4S68N 14.4±0.2 34±1.7SMM1-S 12.6±2.4 5.7+5.8
−5.7SMM4-W 16.5±1.3 4.4±1.4SMM4-S 9.3±1.0 34±27
a Column density is the sum of A- and E-type methanol columndensities.
ture,Td:
N =S νd2
κνBν(Td)A
= 4.90× 1016 cm−2 S ν(Jy)d(pc)2[
exp
(
16.9 KTd
)
− 1
]
. (1)
Here S ν is the continuum flux integrated over 22.′′5×22.′′5 at850 µm, d the distance to the object,κν the dust opacity at850µm taken from Ossenkopf & Henning (1994),Bν the Planckfunction at a dust temperatureTd andA the total surface area,in this case 7.1×1033 cm2. Finally a gas/dust ratio of 100 is as-sumed.
Reduced data from the SCUBA Legacy archive have beenused (Di Francesco et al. 2008) to estimate the integrated con-tinuum flux at 850µm. An average dust temperature of 20 K wasused following global estimates of the dust temperature over theentire Serpens molecular core of 20 K from Schnee et al. (2005).If the temperature changes to 10 K, the column density estimateis increased by a factor of 3.3, while if it is 30 K, the columndensity is decreased by a factor of 1.8.
By using a dust temperature of 20 K, the average columndensity over a 22.′′5 × 22.′′5 region is in the range of 1–4×1023 cm−2. This leads to CH3OH fractional abundances in therange of 1–20× 10−9 with respect to H2, see below.
3.2.2. Dusty modelling of envelope properties
Since the dust (and gas) temperatures change near the YSOs, theCH3OH emission can be further quantified through modelling ofthe physical parameters of the envelopes. This is done followingSchoier et al. (2002) and Jørgensen et al. (2002), where thedustcontinuum emission is modelled with a spherically symmetricenvelope with a power-law density structure heated from thein-side by the protostar, using the 1D code Dusty (Ivezic & Elitzur1997). Dust opacities tabulated by Ossenkopf & Henning (1994)are used for densities of 106 cm−3 and thin ice mantles (corre-sponding to the values in their Table 1, column 5). The centralheating source is taken to be a black-body radiating at a temper-ature of 5000 K, but model results are not very sensitive to thisparameter. The output from Dusty is dimensionless, so to makean absolute calibration it is necessary to do so against the abso-lute luminosity and a given distance of the source. The outputcan be in the form of a spectral energy distribution (SED) anda radial profile of continuum emission at a user-specified wave-length.
Only dust heating at temperatures below 250 K is considered(corresponding to a peak wavelength of∼ 12µm). Thus there is
a “hole” in the inner part of the envelope extending out to a ra-dius,rin, where no attempt is made to model the dust emission.The physical extent of the envelope is defined by the parameterY = rin/rout. The density profile of the envelope is described by apower-law such thatn(r) ∝ r−p. Three observational constraintsare used following Jørgensen et al. (2002) to identify the best-fitting dust model: the SED and the spatial distribution of con-tinuum emission as recorded by SCUBA on the JCMT at 450µmand 850µm, both available through the SCUBA legacy archive(Di Francesco et al. 2008).
SEDs were assembled from the literature, using datapoints from MIPS on the Spitzer Space Telescope, ISO-LWS and IRAS along with ground-based single-dish con-tinuum measurements at sub-mm, mm and cm wave-lengths. For this work, the SED database available athttp://astro.kent.ac.uk/protostars/ proved invalu-able (Froebrich 2005). A full table of SED points is includedin Appendix A.
The reduced SCUBA continuum emission maps from theSCUBA legacy archive have been smoothed to equivalentbeam sizes of 11′′ and 19.′′5 at 450 and 850µm, respectively(Di Francesco et al. 2008). Along with emission maps, mapscontaining the error on each pixel are also provided, facilitat-ing error analysis. The radial profile of each object was com-piled by considering the emission in annuli extending from thepixel containing the maximum value of emission. The mapswere carefully checked, and directions containing contaminationfrom other objects were avoided.
Three Dusty input values were varied: the physical size ofthe envelope,Y, the opacity at 100µm,τ(100µm) and the power-law slope of the radial density profile,p. A small grid of simu-lations was calculated and the best-fit model for each envelopewas found using aχ2 method, following Jørgensen et al. (2002).The best-fit model parameters are listed in Table 3 along withphysical parameters such as the extent of the envelope, the localdensity at the inner radius, the column density and the totalen-velope mass. The best-fit model predictions are overplottedonactual data in Fig. 4.
In general agreement between the modelled and observedproperties are good, except in the case of the modelled 850µmradial profile of S68N. The model prediction is consistentlyafactor of 2–3 lower than observed values. Part of the reason isthat since several sub-mm sources are present close to S68N,only emission from the NW direction is modelled here, imply-ing that the uncertainty on individual data points is higherthanin the case of SMM1, SMM3 and SMM4. In this particular di-rection there may still be contamination, and thus emphasisisplaced primarily on modelling of the SED. Moreover, the ra-dial emission profile at 450µm is much steeper than the 850µmprofile, indicating that there may be more cold, ambient cloudmaterial toward S68N. The radial profile obtained at 450µm iswell reproduced by the best-fit Dusty model.
From the Dusty model it is possible to estimate the averagecolumn density over a region of 22.′′5 × 22.′′5 and compare thisto the CH3OH column density. The average column density isfound to be∼ (1.0± 0.2)× 1023 cm−2. This leads to an abun-dance of∼ 3× 10⁻⁹ with respect to H2 for SMM1 and SMM3 to∼ 30× 10−9 for S68N (see Table 4 for details).
3.2.3. Ratran simulation
In the following the abundance is constrained through direct ra-diative transfer modelling. This has been done using the code,Ratran (Hogerheijde & van der Tak 2000) in conjunction with
L.E. Kristensen et al.: Methanol maps of low-mass protostellar systems 7
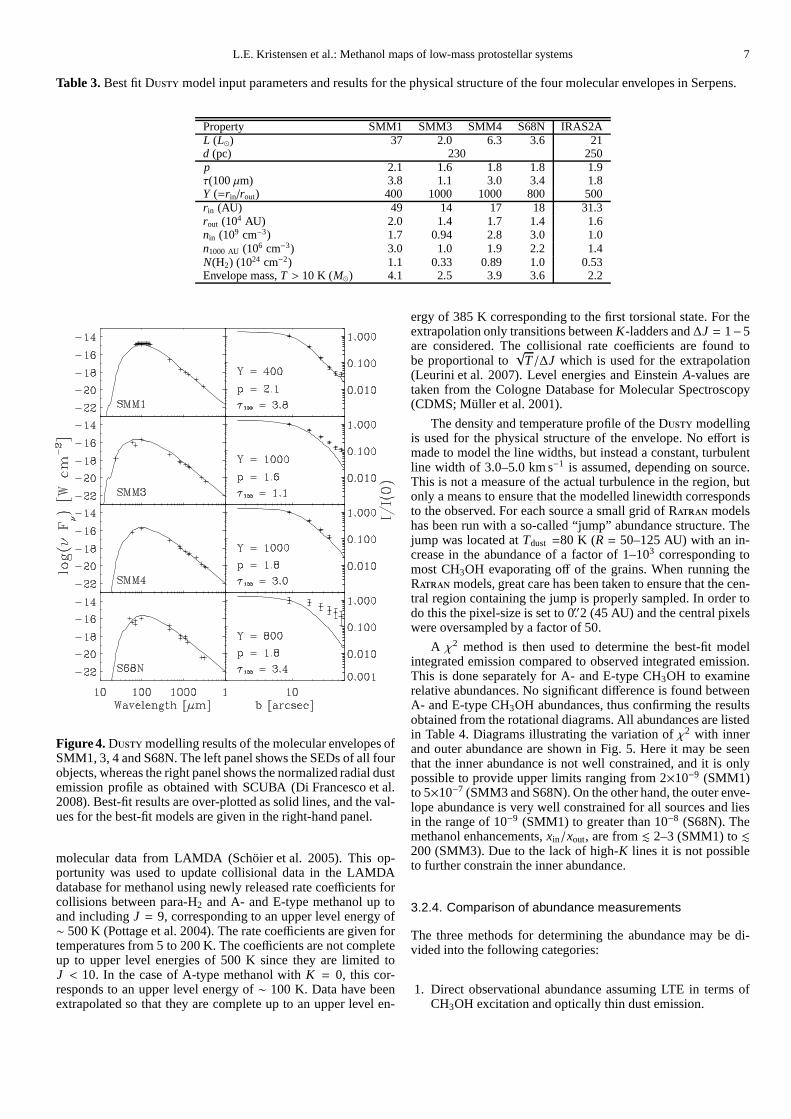
Table 3. Best fit Dusty model input parameters and results for the physical structure of the four molecular envelopes in Serpens.
Property SMM1 SMM3 SMM4 S68N IRAS2AL (L⊙) 37 2.0 6.3 3.6 21d (pc) 230 250p 2.1 1.6 1.8 1.8 1.9τ(100µm) 3.8 1.1 3.0 3.4 1.8Y (=rin/rout) 400 1000 1000 800 500rin (AU) 49 14 17 18 31.3rout (104 AU) 2.0 1.4 1.7 1.4 1.6nin (109 cm−3) 1.7 0.94 2.8 3.0 1.0n1000 AU (106 cm−3) 3.0 1.0 1.9 2.2 1.4N(H2) (1024 cm−2) 1.1 0.33 0.89 1.0 0.53Envelope mass,T > 10 K (M⊙) 4.1 2.5 3.9 3.6 2.2
Figure 4. Dustymodelling results of the molecular envelopes ofSMM1, 3, 4 and S68N. The left panel shows the SEDs of all fourobjects, whereas the right panel shows the normalized radial dustemission profile as obtained with SCUBA (Di Francesco et al.2008). Best-fit results are over-plotted as solid lines, andthe val-ues for the best-fit models are given in the right-hand panel.
molecular data from LAMDA (Schoier et al. 2005). This op-portunity was used to update collisional data in the LAMDAdatabase for methanol using newly released rate coefficients forcollisions between para-H2 and A- and E-type methanol up toand includingJ = 9, corresponding to an upper level energy of∼ 500 K (Pottage et al. 2004). The rate coefficients are given fortemperatures from 5 to 200 K. The coefficients are not completeup to upper level energies of 500 K since they are limited toJ < 10. In the case of A-type methanol withK = 0, this cor-responds to an upper level energy of∼ 100 K. Data have beenextrapolated so that they are complete up to an upper level en-
ergy of 385 K corresponding to the first torsional state. For theextrapolation only transitions betweenK-ladders and∆J = 1−5are considered. The collisional rate coefficients are found tobe proportional to
√T/∆J which is used for the extrapolation
(Leurini et al. 2007). Level energies and EinsteinA-values aretaken from the Cologne Database for Molecular Spectroscopy(CDMS; Muller et al. 2001).
The density and temperature profile of the Dusty modellingis used for the physical structure of the envelope. No effort ismade to model the line widths, but instead a constant, turbulentline width of 3.0–5.0 km s−1 is assumed, depending on source.This is not a measure of the actual turbulence in the region, butonly a means to ensure that the modelled linewidth correspondsto the observed. For each source a small grid of Ratran modelshas been run with a so-called “jump” abundance structure. Thejump was located atTdust =80 K (R = 50–125 AU) with an in-crease in the abundance of a factor of 1–103 corresponding tomost CH3OH evaporating off of the grains. When running theRatranmodels, great care has been taken to ensure that the cen-tral region containing the jump is properly sampled. In order todo this the pixel-size is set to 0.′′2 (45 AU) and the central pixelswere oversampled by a factor of 50.
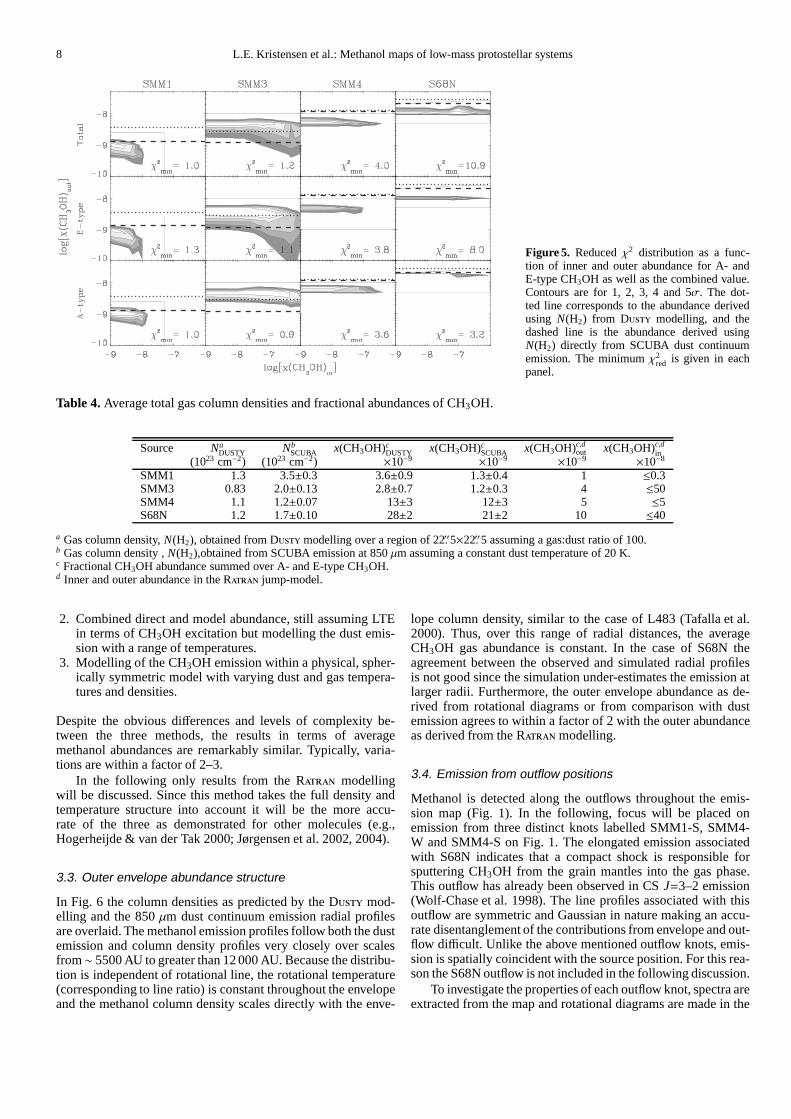
A χ2 method is then used to determine the best-fit modelintegrated emission compared to observed integrated emission.This is done separately for A- and E-type CH3OH to examinerelative abundances. No significant difference is found betweenA- and E-type CH3OH abundances, thus confirming the resultsobtained from the rotational diagrams. All abundances are listedin Table 4. Diagrams illustrating the variation ofχ2 with innerand outer abundance are shown in Fig. 5. Here it may be seenthat the inner abundance is not well constrained, and it is onlypossible to provide upper limits ranging from 2×10⁻⁹ (SMM1)to 5×10⁻⁷ (SMM3 and S68N). On the other hand, the outer enve-lope abundance is very well constrained for all sources and liesin the range of 10−9 (SMM1) to greater than 10−8 (S68N). Themethanol enhancements,xin/xout, are from. 2–3 (SMM1) to.200 (SMM3). Due to the lack of high-K lines it is not possibleto further constrain the inner abundance.
3.2.4. Comparison of abundance measurements
The three methods for determining the abundance may be di-vided into the following categories:
1. Direct observational abundance assuming LTE in terms ofCH3OH excitation and optically thin dust emission.
8 L.E. Kristensen et al.: Methanol maps of low-mass protostellar systems
Figure 5. Reducedχ2 distribution as a func-tion of inner and outer abundance for A- andE-type CH3OH as well as the combined value.Contours are for 1, 2, 3, 4 and 5σ. The dot-ted line corresponds to the abundance derivedusing N(H2) from Dusty modelling, and thedashed line is the abundance derived usingN(H2) directly from SCUBA dust continuumemission. The minimumχ2
red is given in eachpanel.
Table 4. Average total gas column densities and fractional abundances of CH3OH.
Source NaDUSTY Nb
SCUBA x(CH3OH)cDUSTY x(CH3OH)c
SCUBA x(CH3OH)c,dout x(CH3OH)c,d
in(1023 cm−2) (1023 cm−2) ×10−9 ×10−9 ×10−9 ×10⁻⁸
SMM1 1.3 3.5±0.3 3.6±0.9 1.3±0.4 1 ≤0.3SMM3 0.83 2.0±0.13 2.8±0.7 1.2±0.3 4 ≤50SMM4 1.1 1.2±0.07 13±3 12±3 5 ≤5S68N 1.2 1.7±0.10 28±2 21±2 10 ≤40
a Gas column density,N(H2), obtained from Dusty modelling over a region of 22.′′5×22.′′5 assuming a gas:dust ratio of 100.b Gas column density ,N(H2),obtained from SCUBA emission at 850µm assuming a constant dust temperature of 20 K.c Fractional CH3OH abundance summed over A- and E-type CH3OH.d Inner and outer abundance in the Ratran jump-model.
2. Combined direct and model abundance, still assuming LTEin terms of CH3OH excitation but modelling the dust emis-sion with a range of temperatures.
3. Modelling of the CH3OH emission within a physical, spher-ically symmetric model with varying dust and gas tempera-tures and densities.
Despite the obvious differences and levels of complexity be-tween the three methods, the results in terms of averagemethanol abundances are remarkably similar. Typically, varia-tions are within a factor of 2–3.
In the following only results from the Ratran modellingwill be discussed. Since this method takes the full density andtemperature structure into account it will be the more accu-rate of the three as demonstrated for other molecules (e.g.,Hogerheijde & van der Tak 2000; Jørgensen et al. 2002, 2004).
3.3. Outer envelope abundance structure
In Fig. 6 the column densities as predicted by the Dusty mod-elling and the 850µm dust continuum emission radial profilesare overlaid. The methanol emission profiles follow both thedustemission and column density profiles very closely over scalesfrom∼ 5500 AU to greater than 12 000 AU. Because the distribu-tion is independent of rotational line, the rotational temperature(corresponding to line ratio) is constant throughout the envelopeand the methanol column density scales directly with the enve-
lope column density, similar to the case of L483 (Tafalla et al.2000). Thus, over this range of radial distances, the averageCH3OH gas abundance is constant. In the case of S68N theagreement between the observed and simulated radial profilesis not good since the simulation under-estimates the emission atlarger radii. Furthermore, the outer envelope abundance asde-rived from rotational diagrams or from comparison with dustemission agrees to within a factor of 2 with the outer abundanceas derived from the Ratranmodelling.
3.4. Emission from outflow positions
Methanol is detected along the outflows throughout the emis-sion map (Fig. 1). In the following, focus will be placed onemission from three distinct knots labelled SMM1-S, SMM4-W and SMM4-S on Fig. 1. The elongated emission associatedwith S68N indicates that a compact shock is responsible forsputtering CH3OH from the grain mantles into the gas phase.This outflow has already been observed in CSJ=3–2 emission(Wolf-Chase et al. 1998). The line profiles associated with thisoutflow are symmetric and Gaussian in nature making an accu-rate disentanglement of the contributions from envelope and out-flow difficult. Unlike the above mentioned outflow knots, emis-sion is spatially coincident with the source position. For this rea-son the S68N outflow is not included in the following discussion.
To investigate the properties of each outflow knot, spectra areextracted from the map and rotational diagrams are made in the

L.E. Kristensen et al.: Methanol maps of low-mass protostellar systems 9
Figure 6. Spatial distribution of methanol emission in the four objects, Serpens SMM1, 3, 4 and S68N. The integrated emissionof the five lines 7–6+0E, –1E,+0A, +1E and±2E is shown (black). The error-bars are for 1σ uncertainties. Overlaid is the dustcontinuum emission as obtained from SCUBA (red) and the Dusty dust continuum modeling column density (blue). All profileshave been normalized to 1. The normalization factor for the peak emission is shown in each diagram. The 3σ noise level is shownas a dashed line, and the grey, dashed line shows the beam profile.
10 L.E. Kristensen et al.: Methanol maps of low-mass protostellar systems
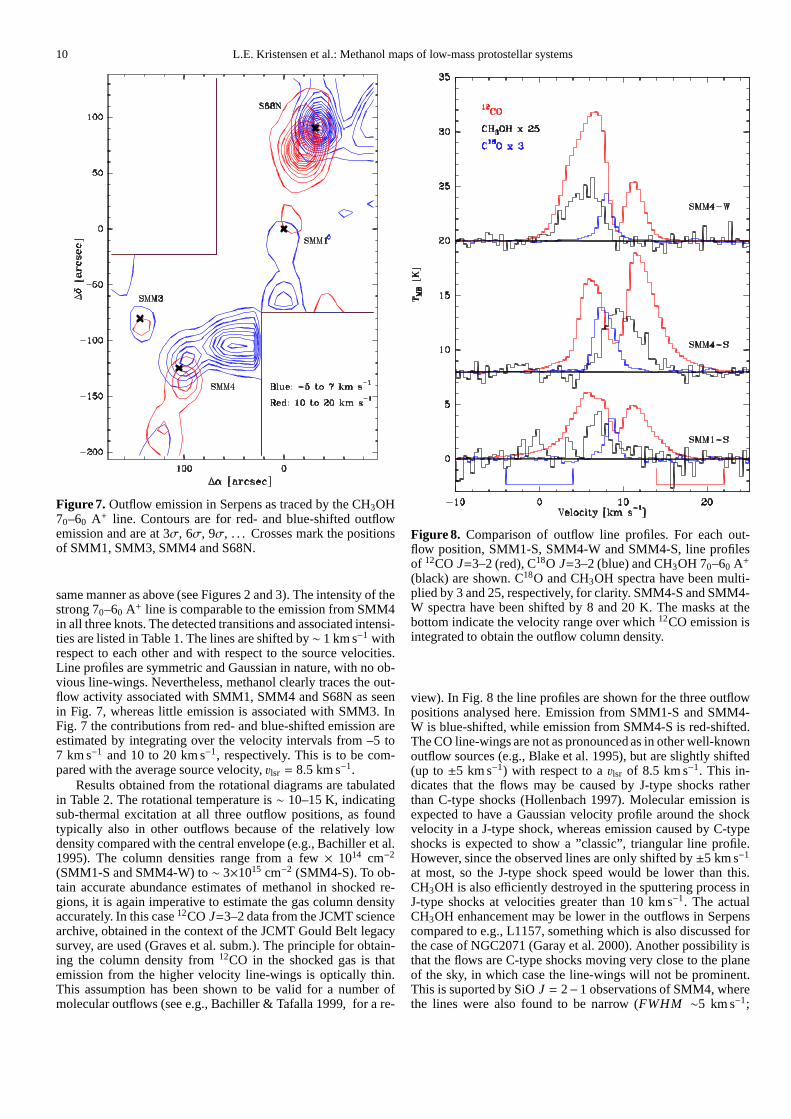
Figure 7. Outflow emission in Serpens as traced by the CH3OH70–60 A+ line. Contours are for red- and blue-shifted outflowemission and are at 3σ, 6σ, 9σ, . . . Crosses mark the positionsof SMM1, SMM3, SMM4 and S68N.
same manner as above (see Figures 2 and 3). The intensity of thestrong 70–60 A+ line is comparable to the emission from SMM4in all three knots. The detected transitions and associatedintensi-ties are listed in Table 1. The lines are shifted by∼ 1 km s−1 withrespect to each other and with respect to the source velocities.Line profiles are symmetric and Gaussian in nature, with no ob-vious line-wings. Nevertheless, methanol clearly traces the out-flow activity associated with SMM1, SMM4 and S68N as seenin Fig. 7, whereas little emission is associated with SMM3. InFig. 7 the contributions from red- and blue-shifted emission areestimated by integrating over the velocity intervals from –5 to7 km s−1 and 10 to 20 km s−1, respectively. This is to be com-pared with the average source velocity,3lsr = 8.5 km s−1.
Results obtained from the rotational diagrams are tabulatedin Table 2. The rotational temperature is∼ 10–15 K, indicatingsub-thermal excitation at all three outflow positions, as foundtypically also in other outflows because of the relatively lowdensity compared with the central envelope (e.g., Bachiller et al.1995). The column densities range from a few× 1014 cm−2
(SMM1-S and SMM4-W) to∼ 3×1015 cm−2 (SMM4-S). To ob-tain accurate abundance estimates of methanol in shocked re-gions, it is again imperative to estimate the gas column densityaccurately. In this case12CO J=3–2 data from the JCMT sciencearchive, obtained in the context of the JCMT Gould Belt legacysurvey, are used (Graves et al. subm.). The principle for obtain-ing the column density from12CO in the shocked gas is thatemission from the higher velocity line-wings is optically thin.This assumption has been shown to be valid for a number ofmolecular outflows (see e.g., Bachiller & Tafalla 1999, for are-
Figure 8. Comparison of outflow line profiles. For each out-flow position, SMM1-S, SMM4-W and SMM4-S, line profilesof 12CO J=3–2 (red), C18O J=3–2 (blue) and CH3OH 70–60 A+
(black) are shown. C18O and CH3OH spectra have been multi-plied by 3 and 25, respectively, for clarity. SMM4-S and SMM4-W spectra have been shifted by 8 and 20 K. The masks at thebottom indicate the velocity range over which12CO emission isintegrated to obtain the outflow column density.
view). In Fig. 8 the line profiles are shown for the three outflowpositions analysed here. Emission from SMM1-S and SMM4-W is blue-shifted, while emission from SMM4-S is red-shifted.The CO line-wings are not as pronounced as in other well-knownoutflow sources (e.g., Blake et al. 1995), but are slightly shifted(up to±5 km s−1) with respect to a3lsr of 8.5 km s−1. This in-dicates that the flows may be caused by J-type shocks ratherthan C-type shocks (Hollenbach 1997). Molecular emission isexpected to have a Gaussian velocity profile around the shockvelocity in a J-type shock, whereas emission caused by C-typeshocks is expected to show a ”classic”, triangular line profile.However, since the observed lines are only shifted by±5 km s−1
at most, so the J-type shock speed would be lower than this.CH3OH is also efficiently destroyed in the sputtering process inJ-type shocks at velocities greater than 10 km s−1. The actualCH3OH enhancement may be lower in the outflows in Serpenscompared to e.g., L1157, something which is also discussed forthe case of NGC2071 (Garay et al. 2000). Another possibilityisthat the flows are C-type shocks moving very close to the planeof the sky, in which case the line-wings will not be prominent.This is suported by SiOJ = 2−1 observations of SMM4, wherethe lines were also found to be narrow (FWHM ∼5 km s−1;
L.E. Kristensen et al.: Methanol maps of low-mass protostellar systems 11
Garay et al. 2002). With the present data-set it is not possibleto differentiate the two scenarios.
Emission was integrated over the velocity intervals given inDavis et al. (1999). From this the CO column density is calcu-lated under the assumption that emission is optically thin andthat the gas temperature is 100 K. The calculation of the col-umn density is insensitive to the choice of temperature, as longas it is in the interval of∼ 50–150 K. The calculation is moresensitive to the choice of velocity interval over which CO emis-sion is integrated, as this may vary by up to a factor of 2, whenchanging the velocity interval with 1 km s−1. The column densityis then converted to total gas column density using a standardabundance ratio of CO:H2 of 10−4:1 and results are comparedto CH3OH column densities to obtain an abundance. The inte-grated CO intensities, column densities and CH3OH abundancesare all tabulated in Table 5. The gas column density in all threeoutflow positions is∼ 1020 cm−2 resulting in abundances of∼1–10×10−6 with respect to H2. Due to the uncertainties on thederived CH3OH column densities and on the gas column density,the abundances should be seen as order of magnitude estimates.Compared to the envelope abundances of SMM1 and SMM4,this translates to methanol enhancements in the outflows of&
103. This is similar to what is found in other outflows; for exam-ple, the enhancement for the L1157 blue lobe is of the order of∼ 400 (Bachiller et al. 1995; Bachiller & Perez Gutierrez 1997).It should be noted, however, that the methanol line profiles arehighly asymemtric in the L1157 outflow as are the CO line pro-files.
C18O is often used as a tracer of quiescent gas column den-sity. If C18O J=3–2 emission is used rather than12CO emissionas above, the gas column density is increased by∼ two orders ofmagnitude to∼ 1022 cm−2. This leads to a decrease in CH3OHabundance and therefore also a decrease in the enhancement.Representing the other extreme, typical enhancements are of theorder of 5–50 (see Table 5). Ideally, emission should be inte-grated over the same velocity interval for comparison, but in thiscase, part of the CH3OH line overlaps with the12CO profile,part of it overlaps with the C18O profile, which is why these twoabundance measurements should be seen as extreme values.
4. Discussion
The inferred abundances are all larger than what can be producedby pure gas-phase reactions (e.g. Garrod et al. 2006). Thus theobserved CH3OH gas must be formed on grains and subse-quently have desorbed. In the following, possible scenarios formethanol desorption and excitation are discussed. Finallyspec-ulations on the nature of the individual young stellar objects inSerpens are made.
4.1. CH3OH grain surface formation
Methanol is formed on the surfaces of interstellar dust grainsthrough hydrogenation of CO, a mechanism which has beenstudied in detail in the laboratory and in theoretical modelsof surface chemistry (Hiraoka et al. 2002; Watanabe & Kouchi2002; Fuchs et al. 2009). To form large amounts of CH3OH, it isimperative that CO freezes effectively out onto (water-ice cov-ered) dust grains. Toward several pre-stellar cores (e.g.,B68,Bergin et al. 2002) and Class 0 objects (e.g., Jørgensen et al.2005c) CO has been observed to freeze out very efficiently attemperatures lower than∼ 20 K and densities greater than∼ 105
cm−3. This “catastrophic” CO freeze-out has been observed di-rectly through observations of CO ice abundances which show
an increase in the amount of solid CO with respect to H2O ice inthe densest regions (Pontoppidan 2006). Through use of Dusty
modelling discussed above it is possible to estimate the extentof the CO freeze-out zone in each of the Serpens Class 0 objectsquantitatively, which is illustrated in Fig. 9. Here the predicteddensity and temperature profiles are shown as a function of dis-tance from the protostar itself. The density profiles of all fourenvelopes are very similar, however SMM1 stands out in termsof temperature profile. Due to the higher luminosity (30L⊙) ofSMM1 with respect to the other source luminosities (∼ 5 L⊙),the envelope temperature is also higher throughout.
The zone over which CO freezes out in SMM1 is signifi-cantly smaller than that of the other sources, SMM3, SMM4 andS68N. In the case of SMM1, the present freeze-out zone extendsfrom∼ 1000–5000 AU whereas the other envelopes have freeze-out zones starting at a few hundred AU and extend out to thesame distance as for SMM1 (see Fig. 9). This indicates that atpresent CO is not freezing out efficiently in the SMM1 enve-lope, so any efficient methanol formation has probably ceasedat this point in time. The colder envelopes surrounding SMM3,SMM4 and S68N could still be forming CH3OH.
In terms of observing methanol directly in the ice itself,Pontoppidan et al. (2004) studied a small region extending southof SMM4 from 4000 AU to 12 000 AU by observing the 3.54µmCH3OH features in absorption against background and embed-ded stars. The extent is illustrated by the white line in Fig.1.In this region the CH3OH-ice abundance is constant at 28%with respect to water ice or 3×10⁻⁵ with respect to gas-phaseH2. This corroborates the interpretation presented here, that thegas phase abundance of CH3OH is low and constant out to12 000 AU in the SMM4 envelope. Beyond this line the CH3OH-ice abundance drops by at least an order of magnitude andPontoppidan et al. could only determine upper limits. It is in-teresting to note that the location where the ice abundance dropsis where one of the outflow knots starts (SMM4-S; see Fig. 1).Thus the reason for the drop is a combination of the envelope be-ing more tenuous (nH < 104 cm−3) far from the protostar, so thatCO does not freeze out very efficiently, while at the same timewhatever methanol is in the ice is sputtered into the gas phase bythe outflow.
Cuppen et al. (2009) have recently studied the formation ofCH3OH on ice surfaces using a Monte Carlo method, in whichthe gas-grain chemistry based on laboratory data is simulatedmicroscopically over long time-scales. The limiting factors inproducing methanol is the availability of both CO and H on thegrain surfaces, and so results show that CO hydrogenates effi-ciently to form CH3OH, especially at temperatures lower than 12K where atomic hydrogen can be retained efficiently. After 105
years CH3OH may form up to 100 individual mono-layers onthe grain, comparable to that of water ice. Hence, the ice abun-dance of methanol in the outer parts of the envelope will dependstrongly on the temperature. Because the envelopes of SMM3,SMM4 and S68N are significantly colder than that of SMM1,they would still be actively producing methanol, which couldexplain the higher gas phase abundances (see Table 4).
Observations show a different behaviour of C18O at thecenter position of S68N compared with the center position ofSMM1. Figure 10 presents C18O J=3–2 emission in colour andmethanol emission from the 70–60 A+ line overlaid as contours.The morphology of the C18O emission shows a peak towardSMM1, as expected for a warm envelope, and a ring of emis-sion toward S68N. The C18O abundances towards the two cen-tral positions are measured to be 3 and 1×10⁻⁸ respectively,based on integrated C18O intensities of 4.3 and 2.4 K km s−1 and

12 L.E. Kristensen et al.: Methanol maps of low-mass protostellar systems
Table 5. Gas column density,N(H2) and CH3OH abundance in outflow knots as determined from12CO J=3–2 and C18O J=3–2emission.
12CO C18O∫
TMB d3 NofCO x(CH3OH) xof/xenv
∫
TMB d3 NCO x(CH3OH) xof/xenv
Source (K km s−1) (1016 cm−2) ×10−6 (K km s−1) (1018 cm−2) ×10−8
SMM1-S 27.5 1.2 5.1 5000 3.6 1.1 5.2 50SMM4-W 40.7 0.9 5.0 1000 4.6 1.4 3.1 6SMM4-S 44.7 1.7 19.6 3900 9.8 2.9 12 25
Figure 9. Density and temperature profiles of the SMM1 and SMM4 envelopes as obtained from Dusty modelling. The radialdensity profile is displayed in blue (left axis) and kinetic dust temperature in red (right axis). The profiles are shown for the SMM1envelope (full line) and the SMM4 envelope (dashed line). The CO freeze-out zone, characterised by temperatures lower than 25 Kand densities greater than 105 cm−3, is shown in dark gray, whereas the methanol evaporation zone (T > 80 K) is shown in lightgray. To the right is a cartoon illustrating the differences between the envelopes surrounding SMM1 and SMM4. Both illustrationsare to scale and the dark blue regions correspond to the CO freeze-out zones while red indicates CH3OH evaporation zones. Notethe much smaller CO freeze-out zone for SMM1.
the gas column densities derived from dust continuum emission(Table 4). This is to be compared to a standard C18O abundanceof 1.8×10⁻⁷ for a normal abundance of CO/H2 = 10−4 and an16O/18O ratio of 550 (Wilson & Rood 1994). Thus, CO is de-pleted by a factor of∼ 6 and 18 for the two sources as averagedover the entire envelope. For these two sources there is a clearanti-correlation between CO and CH3OH gas phase abundances.
To examine whether this anti-correlation is unique toSerpens or a general feature of embedded sources, the outer-envelope CH3OH abundances of the sample of Maret et al.(2005) and Jørgensen et al. (2005b) was coupled with CO abun-dances for the same sources from Jørgensen et al. (2002) (seeFig. 11). The CO gas phase abundance averaged over the extentof the envelope is taken as a tracer of CO depletion in the sensethat the total gas and ice CO abundance is assumed to be con-stant. For sources where the presence of a jump zone can repro-duce the observed CH3OH emission, only the outer abundanceis plotted here. A typical uncertainty of 30% is assumed bothfor the CO and CH3OH abundances. Except for three sources(L1157, L1448-I2 and L483) there is a correlation between the
two abundances as illustrated by the value of the Pearson corre-lation coefficient ofr = 0.70. The Serpens sources are character-ized by the combination of low CO-abundance and high CH3OHabundance. This result implies that the CH3OH gas phase abun-dance is directly related to the current production of CH3OHin the outer, cold parts of the envelope, and that any differencefrom source to source is due to a difference in the amount of COfrozen out onto the grains. Thus, not all solid CH3OH is formedduring the cold pre-stellar core phase, consistent with thelack ofdetected CH3OH ice toward background stars behind quiescentdense clouds. This also implies that the lack of CH3OH emis-sion at normal cloud positions between the sources is becausethe density is lower, and hence the timescale for CO to freezeoutis much higher, i.e., the absolute CH3OH abundance will drop.
4.2. CH3OH desorption mechanism
Once methanol has formed on a grain surface it can desorb ac-cording to two different mechanisms, thermal and non-thermaldesorption. In the first mechanism the entire grain is heatedther-

L.E. Kristensen et al.: Methanol maps of low-mass protostellar systems 13
Figure 10. Integrated C18O, J=3–2 emission (∫
Tmbd3) is shownin colour, with integrated CH3OH 70–60 A+ emission overlaid ascontours. The image is centered on Serpens SMM1 with S68Nlocated to the north. Outflow directions are indicated by dashed(red-shifted) and dotted (blue-shifted) lines.
mally (macroscopic grain heating), and the icy mantle evapo-rates entirely, releasing all adsorbed species into the gasphase.The ice mantles typically evaporate at grain temperatures of30–100 K, depending on species. The other mechanism is non-thermal desorption, in which the ice mantle is “heated” on amicroscopic (local) scale, either due to absorption of a singleUV-photon (Oberg et al. 2009c), impact of a cosmic ray particle(Leger et al. 1985; Hasegawa & Herbst 1993; Herbst & Cuppen2006), or the binding energy being released from the formationof a new molecule (Garrod et al. 2007) or sputtering in outflows(Jimenez-Serra et al. 2008).
4.2.1. Thermal desorption
In the case of methanol, the thermal evaporation temperature hasbeen determined experimentally to 80–100 K (Brown & Bolina2007; Green et al. 2009) as is also indicated in Fig. 9. The lowertemperature corresponds to evaporation of a pure CH3OH iceand the higher to a mix of CH3OH and H2O. Because CO freezesout on top of a water ice, CH3OH is expected to be present in thesame layer. Thus the desorption temperature should be closetothat of a pure CH3OH ice (∼ 85 K), which is slightly lower, butnot much, than that of CH3OH mixed with H2O. This is alsofound to be the case experimentally (Bisschop 2007). Thus, forthe thermal-desorption mechanism to be active, it is necessarythat all grains are heated to greater than 80 K, i.e., close totheprotostar itself. From the physical structure models aboveit ispredicted that the radius at whichTdust > 80 K is of the orderof 50–100 AU or 0.′′2–0.′′4 for d=230 pc, depending on source,
Figure 11. CH3OH gas abundance versus CO gas abundance fora selection of Class 0 and I sources based on data and analysisfrom Schoier et al. (2002); Maret et al. (2005); Jørgensen et al.(2005b) and this work. The Serpens sources are in red andIRAS16293-2422 and NGC1333-IRAS2A are in blue. Sourcesfor which only upper methanol limits exist are marked by ar-rows. The two dashed lines indicate the 1σ confidence limits ofthe power-law fit.
leading to a beam-dilution factor of 1500–5000. Methanol emis-sion originating from very close to the protostar itself haspre-viously been observed for two low-mass sources, IRAS16293-2422 (d=125 pc; van Dishoeck et al. 1995; Schoier et al. 2002)and NGC1333 IRAS2A (d=250 pc; Maret et al. 2005). Eventhough the regions have not been spatially resolved with single-dish data, it has been possible to infer the existence of “hotcores” based on observations of high-K lines (K > 3) and mea-sured rotational temperatures of> 80 K. This indicates thatthe emission arises in a compact, warm and dense region, con-sistent with it originating close to the protostar itself and alsoconsistent with high-spatial resolution interferometer data (e.g.,Jørgensen et al. 2005a, 2007). For the sources presented here, ithas only been possible to provide an upper limit on the innerabundance, which in most cases is a few×10−7 with respect toH2. One notable exception is SMM1, where the upper limit onthe inner abundance is close to the outer abundance, a resultthatwill be discussed further below (Sect. 4.3).
4.2.2. Non-thermal desorption
Since the temperature in the outer envelope is significantlylowerthan 100 K, the primary desorption mechanism must be non-thermal. This is supported by the fact that the abundance onlyfollows the column density, and does not appear to depend ontemperature. No attempt is made to distinguish between theabove mentioned mechanisms here. If desorption is inducedby secondary UV photons from cosmic ray ionization of H2the gas phase abundance is expected to be 10−4–10−3 timesthe ice abundance (Oberg et al. 2009a,b). In the case of SMM4where the CH3OH-ice abundance is∼ 3×10⁻⁵ with respect to H2(Pontoppidan et al. 2004) the UV-induced desorption alone canaccount for a gas phase abundance of 10−9–10−8. This is remark-ably close to the observed gas phase abundance of∼ 2×10⁻⁸.
Garrod et al. (2007) modelled the release of CH3OH fromthe grain surface into the gas phase by examining whether therelease of binding energy would be enough to evaporate the
14 L.E. Kristensen et al.: Methanol maps of low-mass protostellar systems
molecule into the gas phase. They found that the fraction wasprobably in the range of 1–10%, but could not pin it down anyfurther. In the case of SMM4, results presented here combinedwith ice observations indicate that much less than 1–10% isdesorbed, since the gas/ice abundance is∼ 10−4. Results pre-sented in Hasegawa & Herbst (1993) show that direct cosmic raydesorption is not an efficient desorption mechanism for tightlybound species like H2O and CH3OH when compared to theaccretion timescale. In fact, they find that the difference be-tween the two rates is of the order of 104. Previous studies showthat direct cosmic ray induced desorption is most efficient forvolatile species (see, e.g., Shen et al. 2004; Roberts et al.2007)and for species adsorbed on very small grains (r ≤ 0.05 µm;Herbst & Cuppen 2006).
4.2.3. Shock-induced desorption
In outflows the main desorption mechanism is sputtering of thegrain mantle, i.e., impacts of high-temperature gas moleculesand atoms, primarily H2 and He. This can in principle be com-pared to the direct cosmic ray desorption mechanism, exceptthat the flux of H2 and He is orders of magnitude higher andthe impact energy is much lower. The efficiency of this desorp-tion mechanism is clearly seen from the fifth column of Table5, where the CH3OH abundance in the outflow positions iscompared to the ambient envelope abundance. In particular,theSMM4-S methanol outflow abundance is∼ 10−5 with respect toH2, i.e., only a factor of 3 lower than the measured CH3OH-iceabundance in a region located∼ 15′′ (4000 AU) to the north(see Fig. 1 and Pontoppidan et al. 2004). If the envelope ice-abundance in this region were also 3×10⁻⁵ prior to the impactof the shock, this would indicate that one third or more of theCH3OH ice is sputtered from the grain mantle. However, themeasured gas-phase abundance as determined from12CO emis-sion is an upper limit as briefly discussed above. The true valueof the abundance probably lies in the range of 10−8 to 10−6 wherethe lower limit is obtained from C18O emission.
4.3. The nature of the embedded YSOs in Serpens
Two low-mass YSOs have been confirmed observationally tohave the same chemical characteristics as high-mass hot cores,IRAS16293-2422 and NGC1333-IRAS2A. These two sourcesare at the same evolutionary stage as SMM1 based on classi-cal indicators, e.g.,Tbol. The characteristics are (1) a large num-ber of detected, saturated, complex organic molecules and (2) ahigh rotational temperature for methanol (> 80 K). At the sametime, neither of these two envelopes show signs of extendedmethanol emission (van Dishoeck et al. 1995, Kristensen et al.in prep.). IRAS16293-2422 is a close binary system surroundedby a circum-binary envelope. The inner parts of this envelopeare passively heated to temperatures> 80 K, which, along withsmall-scale shocks impinging on the inner wall of the envelope(Chandler et al. 2005), give rise to the observed hot-core signa-ture. NGC1333-IRAS2 is also a binary (possibly triple) system,but the projected separation is greater (∼ 30′′). It is believed thatthe same mechanisms are at play in NGC1333-IRAS2A caus-ing the hot-core signatures (Maret et al. 2005; Jørgensen etal.2005b). In the following the Serpens sources, and in particularSMM1, will be compared to these two low-mass hot cores, anddifferences will be discussed.
There are several possible explanations for the lack of “hotcore” characteristics in the Serpens sources which may be cate-gorized in the following manner:
1. Physical: No gas is present close to the source, or no hot gasis present.
2. Chemical: Hot gas is present, but the methanol abundance isvery low.
3. Observational: Warm methanol is present close to the source,but either the extent is very small, or emission is opticallythick.
Choi (2009) recently reported that SMM1 is a close binarywith a projected separation of∼ 500 AU. The primary would bethe sub-mm source associated with SMM1 (SMM1a), while thebinary (SMM1b) would be less embedded. SMM1b can be asso-ciated with a source observed bySpitzer at wavelengths shorterthan 24µm, where SMM1a is not detected. If the projected dis-tance is similar to the actual separation between the two sources,then this could have cleared the inner part of the envelope ofgas,explaining the absence of hot gas close to the (sub-mm) source.However, both IRAS16293-2422 and NGC1333-IRAS2A havebeen shown to have inner holes or cavities similar in size to thatof SMM1 (Schoier et al. 2002; Jørgensen et al. 2005c), thereforethis cannot be the entire explanation.
Recent millimeter interferometry of SMM1 indicates thatthe region close to the protostar has been cleared of gas. BothEnoch et al. (2009) and van Kempen et al. (2009) report the de-tection of a resolved disk surrounding SMM1. The disk is unusu-ally massive (∼ 1 M⊙) and has a modelled radius of up to 300AU (Enoch et al. 2009), while the inner 500 AU of the envelopehave been cleared of gas. In such a dense disk, only the upper-most layers will be warm or hot, depending on the distance to theprotostar, as the dust extinction grows rapidly towards themid-plane of the disk. Thus, the column density of hot methanol willbe very low. Through SED modeling of the disk, Enoch et al.(2009) estimate that the inclination is 15◦, i.e., nearly face-on.This is in conflict with observations of the 3.6-cm radio jet,which indicate that the outflow is moving very close to theplane of the sky (Rodriguez et al. 1989; Moscadelli et al. 2006).Moreover, the12CO line profiles are very symmetric along thelarge-scale outflow, i.e., the molecular outflows are also movingclose to the plane of the sky. This would indicate that the diskis seen close to edge-on. If so, then the beam-dilution will bevery high implying that any hot part will not be detectable inoursingle-dish beam. The disk surrounding NGC1333-IRAS2A isless massive compared to SMM1 (∼ 0.056M⊙; Jørgensen et al.2009) and is viewed closer to face-on resulting in less extinctionand lower beam dilution. This implies that the high-K emissionobserved in IRAS16293-2422 and NGC1333-IRAS2A is origi-nating in the disk close to the protostar. The actual heatingmech-anism (passive heating or small-scale shocks) cannot be distin-guished with the current observations.
If the inner part of the envelope has not been cleared outof warm gas or if the disk is seen face-on, then it is possiblethat the abundance of methanol is low. As has been shown bycurrent observations, the CH3OH gas-phase abundance is com-paratively high in the outer parts of the envelopes, so to de-crease the abundance in the inner part of the system, destruc-tion of CH3OH must be present. This destruction mechanismmust be very efficient if it is to destroy all CH3OH in the hot-core parts of the envelope, where the abundance is expected torise to> 10−6 w.r.t. H2. CH3OH can be destroyed in the gasphase through direct reactions with other species, howevertherate coefficients are typically low. An alternative mechanism of
L.E. Kristensen et al.: Methanol maps of low-mass protostellar systems 15
both the gas and the ice destruction is UV-dissociation. However,this destruction mechanism must also be at play in IRAS16293-2422 and NGC1333-IRAS2A and there is currently no reasonwhy UV-photodissociation would be more efficient in Serpenssources than in the other two nor that the UV-field is enhancedin SMM1.
Finally, a low-mass hot core may be present in all of theSerpens sources, but not observable. This can be due to beamdilution or due to optical depth effects. The region over whichmethanol desorbs from the grain surface is expected to be∼100 AU at most, and so beam dilution would be of the orderof 103. However, the same beam dilution would apply to at leastNGC1333-IRAS2A, which is located at a similar distance of 250pc, and can thus not be used as an argument. The line opticaldepth has been calculated in the Ratran simulations, and is typi-cally of the order of 0.1 or less for the transitions observedhere,even for lines arising in the inner-most part of the envelope. Thedust opacity at 338 GHz is less than 0.08 at all times, as esti-mated from the Dustymodelling.
Of the three explanations presented above the first is themore plausible if the distance is indeed 230 pc as assumed.Recent VLBA observations indicate that the distance may becloser to 415 pc (Dzib et al. 2010), in which case the third expla-nation is more plausible. The other two reasons can be disprovedthrough comparison with IRAS16293-2422 and NGC1333-IRAS2A. However, only SMM1 has been suggested to have amassive disk, and it is also the source that resembles the twolow-mass hot cores the most in terms of luminosity. The other sources(SMM3, SMM4 and S68N) have considerably lower luminosi-ties by factors 4–10. Thus it may be that the hot-core regionsaround these sources are indeed much smaller and beam-diluted(∼ 5× 10³), comparable to several of the low-mass sources inthe sample of Maret et al. (2005) and Jørgensen et al. (2005b).With the current observations only upper limits have been deter-mined of the molecular abundance in the inner envelope of thelower-luminosity sources.
5. Summary
Maps of rotationally excited methanol in the Serpens MolecularCore have been presented. Emission arises from the molecularenvelopes of four deeply embedded sources and their associ-ated outflows. In particular, three outflow knots have been iden-tified based on their strong methanol emission. Mapping showsmethanol emission in all of the four envelopes to be extendedout to ranges of∼ 10 000 AU. The abundance is constant inthe outer parts of the envelope with a value of 10−9–10−8, de-pending on source. The methanol abundance at outflow positionsis enhanced by up to 2–3 orders of magnitude with respect tothe ambient abundance. The measured envelope abundances areconsistent with non-thermal desorption of solid-state methanol,through, for example, UV-photodesorption. At outflow positionsthe enhanced abundance may be explained by sputtering of thegrain mantles. The symmetric, slightly shifted line profiles pointto the outflows being either caused by J-type shocks or movingalong the plane of the sky.
The CO gas abundance is found to be anti-correlated withthe methanol gas abundance in the Serpens maps. This result hasbeen extended to literature data of a large sample of other, simi-larly deeply embedded sources. The reason is that the more COis frozen out from the gas phase, the higher the CO ice abun-dance, and this adsorbed CO is then converted to CH3OH iceon the grain surface from where it desorbs non-thermally. Thenon-thermal desorption mechanism implies that the gas-phase
abundance follows the solid-state abundance closely, somethingwhich has directly shown to be the case here. Thus, the differ-ences in abundance between the four sources can be directly re-lated to the current production of CH3OH and reflects how muchCO is frozen out now rather than in some possible colder past.
The Serpens sources do not contain the chemical signaturesof low-mass hot cores such as IRAS16293-2422 and NGC1333-IRAS2A. In the case of SMM1, the more luminous of theSerpens sources and resembling most closely the two low-masshot cores, the most likely explanation is that it harbours a mas-sive disk which is seen close to edge-on. The other three Serpenssources are all lower in mass and luminosity, and here the ab-sence of a hot-core signature could be ascribed to beam dilution,as also holds for the majority of the deeply embedded sources.
In conclusion, the CH3OH emission is found to trace the fol-lowing: (1) energetic input into cold gas, primarily through out-flow interaction; (2) column density of cold gas in the outer en-velope; (3) reactions and subsequent desorption of grain surfaceproducts.
Because water closely resembles methanol in the sense thatit is exclusively formed on grains and it desorbs from grain sur-faces atT > 100 K, it is expected that the abundance structurewill resemble that of methanol. This is to be tested with upcom-ing water-observations of these sources as part of the HerschelGuaranteed Time Key Project “Water in Star-forming Regionswith Herschel” (WISH).
Acknowledgements. Astrochemistry at Leiden Observatory is supported by aSpinoza prize and by NWO grant 614.041.004. The authors would like to thankthe staff at the JCMT for technical help. Floris van der Tak is thanked for helpwith updating the LAMDA database and KarinOberg for very stimulating dis-ucssions. TvK is grateful to the SMA for supporting his research at the CfA.
ReferencesBachiller, R., Codella, C., Colomer, F., Liechti, S., & Walmsley, C. M. 1998,
A&A, 335, 266Bachiller, R., Liechti, S., Walmsley, C. M., & Colomer, F. 1995, A&A, 295, 51Bachiller, R. & Perez Gutierrez, M. 1997, ApJ, 487, 93Bachiller, R. & Tafalla, M. 1999, in NATO ASIC Proc. 540: The Origin of Stars
and Planetary Systems, ed. C. J. Lada & N. D. Kylafis, 227–+
Bergin, E. A., Alves, J., Huard, T., & Lada, C. J. 2002, ApJ, 570, L101Bisschop, S. E. 2007, PhD thesis, Leiden Observatory, Leiden University,
P.O. Box 9513, 2300 RA Leiden, The NetherlandsBlake, G. A., Sandell, G., van Dishoeck, E. F., et al. 1995, ApJ, 441, 689Brown, W. A. & Bolina, A. S. 2007, MNRAS, 374, 1006Casali, M. M., Eiroa, C., & Duncan, W. D. 1993, A&A, 275, 195Ceccarelli, C., Loinard, L., Castets, A., Tielens, A. G. G. M., & Caux, E. 2000,
A&A, 357, L9Chandler, C. J., Brogan, C. L., Shirley, Y. L., & Loinard, L. 2005, ApJ, 632, 371Choi, M. 2009, ApJ, 705, 1730Cuppen, H. M., van Dishoeck, E. F., Herbst, E., & Tielens, A. G. G. M. 2009,
A&A, 508, 275Dartois, E., Schutte, W., Geballe, T. R., et al. 1999, A&A, 342, L32Davis, C. J., Matthews, H. E., Ray, T. P., Dent, W. R. F., & Richer, J. S. 1999,
MNRAS, 309, 141Di Francesco, J., Johnstone, D., Kirk, H., MacKenzie, T., & Ledwosinska, E.
2008, ApJS, 175, 277Dzib, S., Loinard, L., Mioduszewski, A. J., et al. 2010, ArXiv e-printsEiroa, C., Djupvik, A. A., & Casali, M. M. 2008, in Handbook ofStar Forming
Regions, Volume II: The Southern Sky ASP Monograph Publications, Vol. 5.,ed. B. Reipurth, 693
Enoch, M. L., Corder, S., Dunham, M. M., & Duchene, G. 2009, ApJ, 707, 103Enoch, M. L., Glenn, J., Evans, II, N. J., et al. 2007, ApJ, 666, 982Evans, N. J., Dunham, M. M., Jørgensen, J. K., et al. 2009, ApJS, 181, 321Friberg, P., Hjalmarson, A., Madden, S. C., & Irvine, W. M. 1988, A&A, 195,
281Froebrich, D. 2005, ApJS, 156, 169Fuchs, G. W., Cuppen, H. M., Ioppolo, S., et al. 2009, A&A, 505, 629Garay, G., Mardones, D., & Rodrıguez, L. F. 2000, ApJ, 545, 861Garay, G., Mardones, D., Rodrıguez, L. F., Caselli, P., & Bourke, T. L. 2002,
ApJ, 567, 980
16 L.E. Kristensen et al.: Methanol maps of low-mass protostellar systems
Garrod, R., Park, I. H., Caselli, P., & Herbst, E. 2006, in Faraday Discussions133, 51
Garrod, R. T., Wakelam, V., & Herbst, E. 2007, A&A, 467, 1103Gibb, E. L., Whittet, D. C. B., Boogert, A. C. A., & Tielens, A.G. G. M. 2004,
ApJS, 151, 35Green, S. D., Bolina, A. S., Chen, R., et al. 2009, MNRAS, 398,357Harvey, P., Merın, B., Huard, T. L., et al. 2007, ApJ, 663, 1149Hasegawa, T. I. & Herbst, E. 1993, MNRAS, 261, 83Herbst, E. & Cuppen, H. M. 2006, Proceedings of the National Academy of
Science, 103, 12257Hiraoka, K., Sato, T., Sato, S., et al. 2002, ApJ, 577, 265Hogerheijde, M. R. & van der Tak, F. F. S. 2000, A&A, 362, 697Hogerheijde, M. R., van Dishoeck, E. F., Salverda, J. M., & Blake, G. A. 1999,
ApJ, 513, 350Hollenbach, D. 1997, in IAU Symposium, Vol. 182, Herbig-Haro Flows and the
Birth of Stars, ed. B. Reipurth & C. Bertout, 181–198Hurt, R. L. & Barsony, M. 1996, ApJ, 460, L45+Ivezic, Z. & Elitzur, M. 1997, MNRAS, 287, 799Jimenez-Serra, I., Caselli, P., Martın-Pintado, J., & Hartquist, T. W. 2008, A&A,
482, 549Jørgensen, J. K., Bourke, T. L., Myers, P. C., et al. 2007, ApJ, 659, 479Jørgensen, J. K., Bourke, T. L., Myers, P. C., et al. 2005a, ApJ, 632, 973Jørgensen, J. K., Schoier, F. L., & van Dishoeck, E. F. 2002,A&A, 389, 908Jørgensen, J. K., Schoier, F. L., & van Dishoeck, E. F. 2004,A&A, 416, 603Jørgensen, J. K., Schoier, F. L., & van Dishoeck, E. F. 2005b, A&A, 437, 501Jørgensen, J. K., Schoier, F. L., & van Dishoeck, E. F. 2005c, A&A, 435, 177Jørgensen, J. K., van Dishoeck, E. F., Visser, R., et al. 2009, A&A, 507, 861Larsson, B., Liseau, R., Men’shchikov, A. B., et al. 2000, A&A, 363, 253Leger, A., Jura, M., & Omont, A. 1985, A&A, 144, 147Leurini, S., Schilke, P., Wyrowski, F., & Menten, K. M. 2007,A&A, 466, 215Maret, S., Ceccarelli, C., Tielens, A. G. G. M., et al. 2005, A&A, 442, 527McMullin, J. P., Mundy, L. G., Blake, G. A., et al. 2000, ApJ, 536, 845McMullin, J. P., Mundy, L. G., Wilking, B. A., Hezel, T., & Blake, G. A. 1994,
ApJ, 424, 222Moscadelli, L., Testi, L., Furuya, R. S., et al. 2006, A&A, 446, 985Muller, H. S. P., Thorwirth, S., Roth, D. A., & Winnewisser,G. 2001, A&A, 370,
L49Oberg, K. I., Bottinelli, S., & van Dishoeck, E. F. 2009a, A&A, 494, L13Oberg, K. I., Garrod, R. T., van Dishoeck, E. F., & Linnartz, H. 2009b, A&A,
504, 891Oberg, K. I., van Dishoeck, E. F., & Linnartz, H. 2009c, A&A, 496, 281Ossenkopf, V. & Henning, T. 1994, A&A, 291, 943Pontoppidan, K. M. 2006, A&A, 453, L47Pontoppidan, K. M., Boogert, A. C. A., Fraser, H. J., et al. 2008, ApJ, 678, 1005Pontoppidan, K. M., van Dishoeck, E. F., & Dartois, E. 2004, A&A, 426, 925Pottage, J. T., Flower, D. R., & Davis, S. L. 2004, MNRAS, 352,39Roberts, J. F., Rawlings, J. M. C., Viti, S., & Williams, D. A.2007, MNRAS,
382, 733Rodriguez, L. F., Curiel, S., Moran, J. M., et al. 1989, ApJ, 346, L85Schnee, S. L., Ridge, N. A., Goodman, A. A., & Li, J. G. 2005, ApJ, 634, 442Schoier, F. L., Jørgensen, J. K., van Dishoeck, E. F., & Blake, G. A. 2002, A&A,
390, 1001Schoier, F. L., van der Tak, F. F. S., van Dishoeck, E. F., & Black, J. H. 2005,
A&A, 432, 369Shen, C. J., Greenberg, J. M., Schutte, W. A., & van Dishoeck,E. F. 2004, A&A,
415, 203Smith, H., Hills, R. E., Withington, S., et al. 2003, in Society of Photo-Optical
Instrumentation Engineers (SPIE) Conference, Vol. 4855, ., ed. T. G. Phillips& J. Zmuidzinas, 338–348
Tafalla, M., Myers, P. C., Mardones, D., & Bachiller, R. 2000, A&A, 359, 967Testi, L. & Sargent, A. I. 1998, ApJ, 508, L91van der Tak, F. F. S., van Dishoeck, E. F., & Caselli, P. 2000, A&A, 361, 327van Dishoeck, E. F. & Blake, G. A. 1998, ARA&A, 36, 317van Dishoeck, E. F., Blake, G. A., Jansen, D. J., & Groesbeck,T. D. 1995, ApJ,
447, 760van Kempen, T. A., Wilner, D., & Gurwell, M. 2009, ApJ, 706, L22Watanabe, N. & Kouchi, A. 2002, ApJ, 571, L173White, G. J., Casali, M. M., & Eiroa, C. 1995, A&A, 298, 594Williams, J. P. & Myers, P. C. 2000, ApJ, 537, 891Wilson, T. L. & Rood, R. 1994, ARA&A, 32, 191Wolf-Chase, G. A., Barsony, M., Wootten, H. A., et al. 1998, ApJ, 501, L193+
Appendix A: SED data points

L.E. Kristensen et al.: Methanol maps of low-mass protostellar systems 17
Table A.1. SED points used for Dustymodelling.
SMM1 SMM3 SMM4 S68Nλ F Beam Ref. λ F Beam Ref. λ F Beam Ref. λ F Beam Ref.
(µm) (Jy) (′′) (µm) (Jy) (′′) (µm) (Jy) (′′) (µm) (Jy) (′′)70.1 313 90 1 24 0.109 6 60 12 60 2 50 16 32 873.6 353 90 1 60 22 60 2 100 60 60 2 60 8 60 277.3 402 90 1 70 12.2 6 450 10.8 8 3 70 14.9 681.2 445 90 1 100 70 100 2 800 4.13 14 4 70 5.664 985.2 489 90 1 450 7.1 8 3 850 2.9 14 3 100 37 100 289.5 536 90 1 800 2.01 14 4 1100 1.47 19 4 450 25 8 1094.0 573 90 1 850 1.5 14 3 1300 0.92 22 4 450 9.1 8 398.7 612 90 1 1100 1.11 19 4 1400 1.108 1 7 850 1.6 14 3
103.6 638 90 1 1300 0.92 22 4 2000 0.6 35 4 850 3.3 20 10108.8 661 90 1 1400 0.651 2 7 2700 0.143 2 7 1100 2.32 40 9114.2 685 90 1 2700 0.09 4 7 3200 0.097 4 7 1100 3.78 40 9119.9 698 90 1 3400 0.043 5 7 3400 0.075 5 7 1250 0.9 32 8125.9 713 90 1 2727 0.0361 7 11132.2 733 90 1 3100 0.036 32 8138.8 760 90 1145.8 770 90 1153.1 785 90 1160.7 785 90 1
100 435 100 2450 35.7 8 3850 6.1 14 3
1100 3.47 19 41300 2.52 22 42000 0.91 35 43000 0.233 5 5
References: (1) Larsson et al. (2000), Larsson, priv. comm.(2) Hurt & Barsony (1996) (3) Davis et al. (1999) (4) Casali etal. (1993)(5) Testi & Sargent (1998) (6) Harvey et al. (2007) (8) Hogerheijde et al. (1999) (8) McMullin et al. (1994) (9) Enoch et al.(2007) (10)Wolf-Chase et al. (1998) (11) Williams & Myers (2000)