Physical characterization of the methanol solvate of urapidil
7
Physical Characterization of the Methanol Solvate of Urapidil s. A. BOTHA* ', M. R. CAIRA*, J. K. GUiLLORY5, AND A. P. LOTTER* Received December 15, 1987, from the *Research Institute for Industrial Pharmacy, Potchefstroom University for C.H.E., Potchefsfroom 2520, South Africa, the *Crystallography Group, Department of Physical Chemistry, University of Port Elizabeth, Port Elizabeth 6000, South Africa, and the §Collegeof Pharmacy, University of Iowa, lowa City, /A 52242. Accepted for publication August 3, 1988. Abstract 0 The methanol solvate of urapidil was prepared and charac- terized by means of differential scanning calorimetry, thermogravimetric analysis, infrared spectroscopy, X-ray powder diffraction, intrinsic disso- lution rate, and solution calorimetry. The stoichiometry of the urapidil: methanol solvate was found to be 1:l. The crystal and molecular structures were determined from three-dimensional X-ray data. The stability of the solvate under different storage conditions was also determined. Urapidil, 6-~[3-[4-(o-methoxyphenyl)-1-piperazinyllpropyl] amino]-1,3-dimethyluracil, is a new antihypertensive drug, the efficacy of which has been demonstrated in animals1 as well as in humans.2 Since the bioavailability of pharmacologically active com- pounds is frequently dependent on their crystalline forms? detection of polymorphism and/or pseudopolymorphism is important for the effective clinical use of a drug. The physico- chemical properties of three nonsolvated forms of urapidil (referred to as Forms I, 11, and I11 below), as well as three hydrates, have already been rep~rted.~.~ Following synthesis of an organic medicinal agent, the most common method of purification for the bulk chemical is recrystallization from an appropriate solvent. For those com- pounds which are insoluble in water, or which undergo hydrolytic decomposition, it is common practice to recrystal- lize the solid from an organic solvent. This paper deals with the physicochemical properties and single crystal X-ray analysis of the methanol solvate of urapidil. This solvate was characterized from its thermal behavior, thermogravimetric analysis, X-ray diffraction, IR spectra, intrinsic dissolution rate, solution calorimetry, and scanning electron microscopy. Experimental Section Methanol Solvate-Commercial urapidil (Byk-Gulden) was used in the preparation of the solvate. Purity determinations were per- formed using differential scanning calorimetry (DSC) utilizing the Partial Areas program (Perkin-Elmer), and a purity of 99.73 & 0.06% was found. The solvate was crystallized from 1, 2, 3, and 4% solutions of urapidil in boiling analytical reagent grade anhydrous methanol, as well as from a 3% solution of urapidil in either 4:l or 1:l methano1:water. The solutions were permitted to stand at room temperature until crystallization was complete. The crystals were collected by filtration through a sintered glass Buchner filter. The crystals were permitted to remain on the glass filter bed under a stream of air for about an hour to remove residual solvent. Differential Scanning Calorimetry (DSC)-The thermograms of the solvate were recorded on a Perkin-Elmer differential scanning calorimeter (DSC-2) equipped with a model 3600 data station. The temperature axis was calibrated with pure indium (99.999%),with a melting point of 156.60 "C. This calibration was checked using a lead standard (purity 99.999%), with a melting point of 327.27 "C. Sam- ples, varying in mass between 2.0 and 3.0 mg, were measured into aluminum pans and the lids were crimped onto the pans with the aid of a Du Pont model 70033 crimper (suitable for volatile samples). An empty pan, sealed in the same way as the sample, was used as reference. The thermal behavior of the methanol solvate was studied under a nitrogen purge at heating rates of 10 and 1 "C min-l. Thermogravimetric Analysis (TGAhAnalyses were performed using the Perkin-Elmer TGS-2 thermogravimetric system and the thermal analysis model 3600 data station. The temperature axis was calibrated using the ferromagnetic materials furnished by Perkin- Elmer. Analyses were performed on samples in platinum pans at a heating rate of 10 "C min-' under nitrogen purge. X-ray Powder Diffraction-A sample of the solvate was ground in an agate mortar. The possibility that the crystal character of the sample could change due to grinding6 was considered; however, such a change could not be detected using DSC. The sample was first ground, then screened through 75 j~ mesh and packed in an A1 holder to minimize preferred orientation. The powder pattern was recorded on an automated diffractometer (Philips PW1050/70) using FeKa radiation (A = 1.937 A) at a scan rate of l"20 min-l. Single Crystal X-ray Diffraction-Single crystal quality was assessed by microscopic examination and from extinction behavior in polarized light. The crystal density was determined by flotation in aq. KI solution. A suitable prismatic specimen was chosen and the crystal system was determined as triclinic from Weissenberg and precession photographs. Intensity data were collected from a crystal measuring 0.425 x 0.25 x 0.25 mm on a Philips PWllOO four-circle diffractometer operating in the 0-28 mode (scan speed 0.052"0 s-', scan width 1.3") and using graphite-monochromated MoKa radiation (A = 0.7107 A). Cell constants were obtained by least squares refinement of angular data for 25 reflections. Three standard reflection intensities, moni- tored after every 65 reflections, showed only random variation (+4%), indicating crystal stability during data collection. Of the 2934 unique reflections measured, 2289 with F, > 3 a(FJ were considered observed and were used in the final refinement. Lorentz and polarization corrections were applied, but absorption was ne- glected. Intensity statistics favored space group P1; the structure was solved by direct methods and refined by full-matrix least squared methods using the program SHELX76.' The amount SwF0 - FCl2 was minimized with w = 1/v2(F,), where u(Fo) was based on counting statistics. The final model had all non-hydrogen atoms thermally anisotropic and all H atoms isotropic. The positions of the methyl H atoms of C(1), atom H(7), and all H atoms of the MeOH molecule were allowed to refine freely, while the remaining H atoms were included at idealized positions with the C-H = 1.08 A. At convergence, residual factors were R = 0.053 and R, = 0.047, and the average A/rr was The final difference map showed a maximum peak density of 0.23 e 8-l. Scattering factors were taken from Znterna- tional Tables for X-ray Crystallography.8 Figure 6 was drawn with the program CRISTEP? and the program PARSTlO was used for geometrical calculations. Infrared Spectroscopy-Nujol mulls of the powdered crystals were prepared and the spectra determined over a wave-number range of 4600 to 800 cm-' using a Nicolet FDX Fourier transform infrared spectrophotometer connected to a Nicolet 5DX data proces- 28 / Journal of Pharmaceutical Sciences Vol. 78, No. 1, January 1989 0022-3549/89/0100-0028$01 .OO/O 0 1989, American Pharmaceutical Association
Transcript of Physical characterization of the methanol solvate of urapidil

Physical Characterization of the Methanol Solvate of Urapidil
s. A. BOTHA* ', M. R. CAIRA*, J. K. GUiLLORY5, AND A. P. LOTTER*
Received December 15, 1987, from the *Research Institute for Industrial Pharmacy, Potchefstroom University for C.H.E., Potchefsfroom 2520, South Africa, the *Crystallography Group, Department of Physical Chemistry, University of Port Elizabeth, Port Elizabeth 6000, South Africa, and the §College of Pharmacy, University of Iowa, lowa City, /A 52242. Accepted for publication August 3, 1988.
Abstract 0 The methanol solvate of urapidil was prepared and charac- terized by means of differential scanning calorimetry, thermogravimetric analysis, infrared spectroscopy, X-ray powder diffraction, intrinsic disso- lution rate, and solution calorimetry. The stoichiometry of the urapidil: methanol solvate was found to be 1:l. The crystal and molecular structures were determined from three-dimensional X-ray data. The stability of the solvate under different storage conditions was also determined.
Urapidil, 6-~[3-[4-(o-methoxyphenyl)-1-piperazinyllpropyl] amino]-1,3-dimethyluracil, is a new antihypertensive drug, the efficacy of which has been demonstrated in animals1 as well as in humans.2
Since the bioavailability of pharmacologically active com- pounds is frequently dependent o n the i r crystalline forms? detection of polymorphism and/or pseudopolymorphism is important for the effective clinical use of a drug. The physico- chemical properties of three nonsolvated forms of urapidil (referred t o as Forms I, 11, and I11 below), as well as three hydrates, have already been r e p ~ r t e d . ~ . ~
Following synthesis of an organic medicinal agent, the most common method of purification for the bulk chemical is recrystallization from an appropriate solvent. F o r those com- pounds which are insoluble in water, or which undergo hydrolytic decomposition, it is common practice to recrystal- lize the solid from an organic solvent.
This paper deals with the physicochemical properties and single crystal X-ray analysis of the methanol solvate of urapidil. This solvate was characterized from its thermal behavior, thermogravimetric analysis, X-ray diffraction, IR spectra, intrinsic dissolution rate, solution calorimetry, and scanning electron microscopy.
Experimental Section Methanol Solvate-Commercial urapidil (Byk-Gulden) was used
in the preparation of the solvate. Purity determinations were per- formed using differential scanning calorimetry (DSC) utilizing the Partial Areas program (Perkin-Elmer), and a purity of 99.73 & 0.06% was found. The solvate was crystallized from 1, 2, 3, and 4% solutions of urapidil in boiling analytical reagent grade anhydrous methanol, as well as from a 3% solution of urapidil in either 4:l or 1:l methano1:water. The solutions were permitted to stand at room temperature until crystallization was complete. The crystals were collected by filtration through a sintered glass Buchner filter. The crystals were permitted to remain on the glass filter bed under a stream of air for about an hour to remove residual solvent.
Differential Scanning Calorimetry (DSC)-The thermograms of the solvate were recorded on a Perkin-Elmer differential scanning calorimeter (DSC-2) equipped with a model 3600 data station. The temperature axis was calibrated with pure indium (99.999%), with a melting point of 156.60 "C. This calibration was checked using a lead standard (purity 99.999%), with a melting point of 327.27 "C. Sam-
ples, varying in mass between 2.0 and 3.0 mg, were measured into aluminum pans and the lids were crimped onto the pans with the aid of a Du Pont model 70033 crimper (suitable for volatile samples). An empty pan, sealed in the same way as the sample, was used as reference. The thermal behavior of the methanol solvate was studied under a nitrogen purge a t heating rates of 10 and 1 "C min-l.
Thermogravimetric Analysis (TGAhAnalyses were performed using the Perkin-Elmer TGS-2 thermogravimetric system and the thermal analysis model 3600 data station. The temperature axis was calibrated using the ferromagnetic materials furnished by Perkin- Elmer. Analyses were performed on samples in platinum pans at a heating rate of 10 "C min-' under nitrogen purge.
X-ray Powder Diffraction-A sample of the solvate was ground in an agate mortar. The possibility that the crystal character of the sample could change due to grinding6 was considered; however, such a change could not be detected using DSC. The sample was first ground, then screened through 75 j~ mesh and packed in an A1 holder to minimize preferred orientation. The powder pattern was recorded on an automated diffractometer (Philips PW1050/70) using FeKa radiation (A = 1.937 A) at a scan rate of l"20 min-l.
Single Crystal X-ray Diffraction-Single crystal quality was assessed by microscopic examination and from extinction behavior in polarized light. The crystal density was determined by flotation in aq. KI solution. A suitable prismatic specimen was chosen and the crystal system was determined as triclinic from Weissenberg and precession photographs.
Intensity data were collected from a crystal measuring 0.425 x 0.25 x 0.25 mm on a Philips PWllOO four-circle diffractometer operating in the 0-28 mode (scan speed 0.052"0 s-', scan width 1.3") and using graphite-monochromated MoKa radiation (A = 0.7107 A). Cell constants were obtained by least squares refinement of angular data for 25 reflections. Three standard reflection intensities, moni- tored after every 65 reflections, showed only random variation (+4%), indicating crystal stability during data collection. Of the 2934 unique reflections measured, 2289 with F, > 3 a(FJ were considered observed and were used in the final refinement. Lorentz and polarization corrections were applied, but absorption was ne- glected.
Intensity statistics favored space group P1; the structure was solved by direct methods and refined by full-matrix least squared methods using the program SHELX76.' The amount SwF0 - FCl2 was minimized with w = 1/v2(F,), where u(Fo) was based on counting statistics.
The final model had all non-hydrogen atoms thermally anisotropic and all H atoms isotropic. The positions of the methyl H atoms of C(1), atom H(7), and all H atoms of the MeOH molecule were allowed to refine freely, while the remaining H atoms were included a t idealized positions with the C-H = 1.08 A. At convergence, residual factors were R = 0.053 and R, = 0.047, and the average A/rr was The final difference map showed a maximum peak density of 0.23 e 8-l. Scattering factors were taken from Znterna- tional Tables for X-ray Crystallography.8 Figure 6 was drawn with the program CRISTEP? and the program PARSTlO was used for geometrical calculations.
Infrared Spectroscopy-Nujol mulls of the powdered crystals were prepared and the spectra determined over a wave-number range of 4600 to 800 cm-' using a Nicolet FDX Fourier transform infrared spectrophotometer connected to a Nicolet 5DX data proces-
28 / Journal of Pharmaceutical Sciences Vol. 78, No. 1, January 1989
0022-3549/89/0100-0028$01 .OO/O 0 1989, American Pharmaceutical Association
sor (resolution = 2 cm-l). A gain setting of 1 was used. Intrinsic Dissolution Rates-The intrinsic dissolution rate (disso-
lution rate utilizing a constant sample surface area) of the methanol solvate was determined by the use of a propeller-driven stirrer apparatus.4Jl The crystals were compressed into 13-mm pellets a t 5000 psi using a Perkin-Elmer potassium bromide pellet punch and die set and a Carver press (Pasadena Hydraulic). The tablets were mounted into a Plexiglass holder so that the tablet surface was flush with the holder. This holder was mounted into a water-jacketed breaker containing 500 mL of deionized glass distilled water main- tained at 37 +- 0.1"C. Stirring was achieved by a Teflon-coated stirrer attached to a Hurst model CA synchronous motor mounted on the beaker cover. The position of the stirrer was such that the closest proximity of the blade to the tablet surface was 6 mm. The stirring rate was 60 rpm. The amount of urapidil dissolved per time unit was followed spectrophotometrically at 268 nm with a Hewlett-Packard model 8450A diode ray spectrophotometer equipped with a dual disk drive and attached to a Hewlett-Packard model 85 personal comput- er. The dissolution medium was continuously pumped through a Beckmann flow-through cell at a flow rate of 15 mL min-' by means of a Cole Palmer Instrument Masterflex pump. The flow-through cell was enclosed in Hewlett-Packard 89100A temperature controller maintained at 37 "C.
Solution Calorimetry-A Tronac model 450 isoperibol calorime- ter was employed. The calorimeter was equipped with a 55-L constant temperature water bath controlled a t 30 2 0.002 "C. Sam- ples of 10-110 -+ 0.1 mg were weighed (Mettler AE 163 balance) directly into the ampules, and the ampules were sealed and placed into the ampule-breaking device. A 40-g quantity of ethanol was measured into the Dewar reaction flask. Ethanol was the solvent of choice since urapidil does not form a solvate with ethanol.5 The heat of solution was determined using the method described in an earlier p~bl icat ion.~
Scanning Electron Photomicrographs-Photomicrographs were obtained using the Cambridge Stereoscan 250 scanning electron microscope. Solid samples were coated under reduced pressure with carbon (Emscope TB 500 Sputter Coater) before being coated with a thin gold-platinum film (Eiko Engineering Ion Coater IB-2).
Stability of the Methanol Solvate-Samples (50 mg) of the methanol solvate, crystallized from 2 and 3% solutions of urapidil in methanol, were stored in amber, loosely stoppered containers. The samples were stored under the following conditions, viz. for three months at room temperature, in an oven controlled at 37 2 1 "C, and in a constant temperaturehumidity chamber (Hotpack Incubator model No. 317520). The temperature control is 20.1 "C and humidity control is 52%. Samples were also stored at 45 2 1 "C for both one and three months, respectively.
Results and Discussion The crystals obtained by recrystallization from methanol
and from methano1:water mixtures were identified using data from TGA, thermal analysis, X-ray powder diffraction, IR, intrinsic dissolution rates, solution calorimetry determi- nations, and scanning microscopy. Complete structural eluci- dation was effected by single crystal X-ray methods.
Thermogravimetric Analysis (TGA)-A methanol solvate is formed when urapidil is recrystallized from anhydrous methanol or methano1:water combinations of either 4:l or
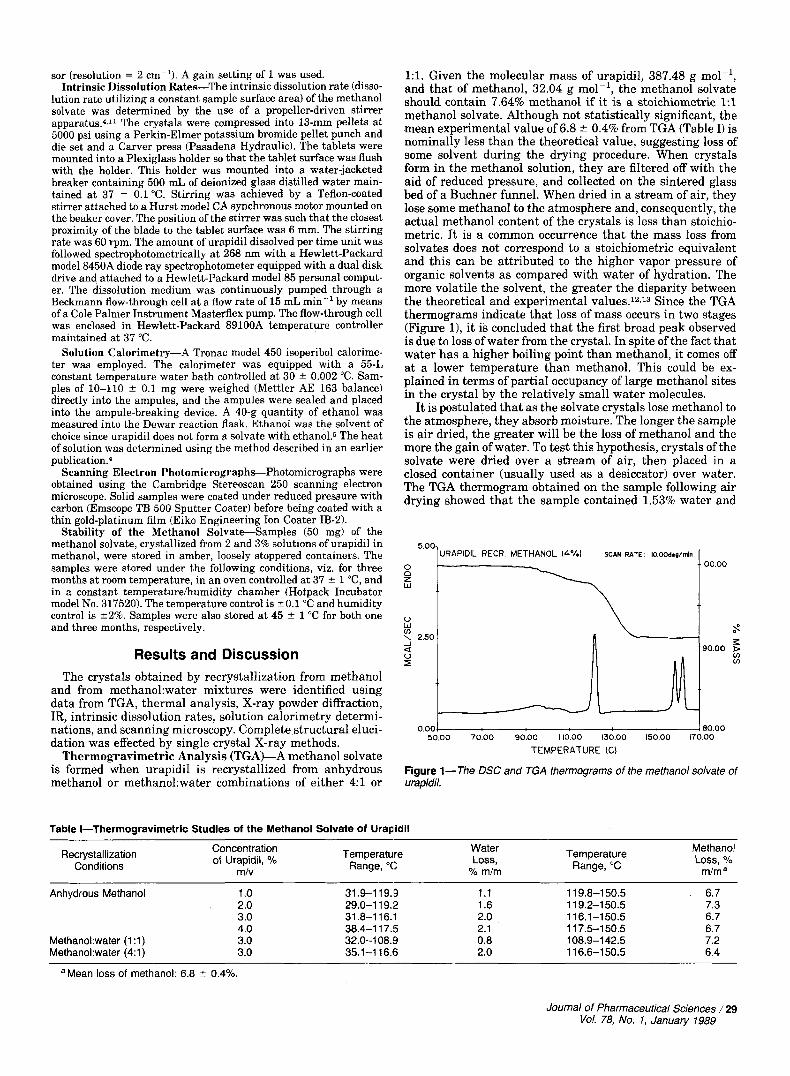
1:l. Given the molecular mass of urapidil, 387.48 g mol-', and that of methanol, 32.04 g mol-l, the methanol solvate should contain 7.64% methanol if it is a stoichiometric 1:l methanol solvate. Although not statistically significant, the mean experimental value of 6.8 0.4% from TGA (Table I) is nominally less than the theoretical value, suggesting loss of some solvent during the drying procedure. When crystals form in the methanol solution, they are filtered off with the aid of reduced pressure, and collected on the sintered glass bed of a Buchner funnel. When dried in a stream of air, they lose some methanol to the atmosphere and, consequently, the actual methanol content of the crystals is less than stoichio- metric. It is a common occurrence that the mass loss from solvates does not correspond to a stoichiometric equivalent and this can be attributed to the higher vapor pressure of organic solvents as compared with water of hydration. The more volatile the solvent, the greater the disparity between the theoretical and experimental values.12J3 Since the TGA thermograms indicate that loss of mass occurs in two stages (Figure 11, it is concluded that the first broad peak observed is due to loss of water from the crystal. In spite of the fact that water has a higher boiling point than methanol, it comes off at a lower temperature than methanol. This could be ex- plained in terms of partial occupancy of large methanol sites in the crystal by the relatively small water molecules.
It is postulated that as the solvate crystals lose methanol to the atmosphere, they absorb moisture. The longer the sample is air dried, the greater will be the loss of methanol and the more the gain of water. To test this hypothesis, crystals of the solvate were dried over a stream of air, then placed in a closed container (usually used as a desiccator) over water. The TGA thermogram obtained on the sample following air drying showed that the sample contained 1.53% water and
URAPIDIL RECR METHANOL (4%) SCAN RATE. IO.OOd.g/mln
W
0.001 50.00 70.00 30.00 I10.00 130.00 150.00 17
TEMPERATURE (C)
100.00
I 90.00 D
v) In
eo.00 00
Figure 1-The DSC and TGA thermograms of the methanol solvate of urapidil.
Table I-Thermogravimetric Studies of the Methanol Solvate of Uraplldll
Recrystallization Conditions
Concentration of Urapidil, %
mlv
Temperature Range, "C
Water Loss,
% mim
Temperature Range, "C
Methanol Loss, %
m/m a
Anhydrous Methanol
Methanokwater (1 :1) Methano1:water (4:l)
1 .o 2.0 3.0 4.0 3.0 3.0
31.9-119.9 1.1 1 19.8-1 50.5 6.7 29.0-1 19.2 1.6 1 1 9.2-150.5 7.3 31.8-1 16.1 2.0 116.1-150.5 6.7 38.4-1 17.5 2.1 1 1 7.5-1 50.5 6.7 32.0-108.9 0.8 108.9-1 42.5 7.2 35.1-1 16.6 2.0 1 16.6-1 50.5 6.4
a Mean loss of methanol: 6.8 5 0.4%.
Journal of Pharmaceutical Sciences / 29 Vol. 78, No. 1, January 1989

7.15% methanol. Following 6 d of exposure to high humidity, the crystals had a total mass loss on heating of 15.51%. Mass loss with heating up to 97.12 "C amounted to 12.84%, while the mass loss above 97 "C amounted to only 2.67%. Thus, it appears that loss of methanol from the crystals continues to occur when they are stored over water.
Differential Scanning Calorimetry (DSC)-DSC thermo- grams of the methanol solvate exhibited a broad peak at -95°C and sharp peaks at 120.2 * 0.6, 158.2 * 0.6, and 161.9 * 0.5 "C (Table 11, Figure 1).
The boiling point of methanol is 64.7 "C; it is clear that methanol must be strongly bound in the crystal since no endothermic peak is observed until a temperature considera- bly higher than the boiling point is reached. This type of behavior is explained by the magnitude of the forces holding the solvate together.
Since all of the solvate crystals, even those obtained from anhydrous methanol, exhibit peaks a t -95"C, as well as 120°C, and since the TGA thermograms also indicate the loss of mass occurs in two stages (Figure 11, it is concluded that the first broad peak observed is due to loss of water from the crystal.
The DSC thermograms of the methanol solvates are re- markably similar in spite of variations in the crystallization procedures. Different crystalline forms have been obtained depending on the amount of solute present,14 but in this case, changing the concentration of urapidil in the solution from which crystallization occurred appeared to have little effect. In addition, the same type of solvate formed regardless of whether crystallization occurred from anhydrous methanol or from 1:l or 4:l methano1:water solutions (Table 11). The rate of cooling of the solution also had no effect on the type of solvate.
Upon desolvation, polymorphic crystal Forms I1 and I are obtained (Table 11, Figure 1).
Infrared Spectroscopy-Only slight differences could be detected between the three nonsolvated forms of urapidiL4 However, the IR spectrum of the methanol solvate is substan- tially different from those of the nonsolvated forms, with a broad methanol peak ranging from 3150 to 3350 cm-'. The IR spectra of the nonsolvated Form I1 of urapidil and the solvate over the wavenumber range of 1731.7 to 524.9 cm-' can be seen in Figure 2; the main differences are indicated by arrows.
X-ray Powder Diffraction-The powder pattern (Figure 3) was recorded in order to distinguish the methanol solvate from nonsolvated urapidil samples prior to single-crystal analysis. It is reproduced here for identification purposes. For the five principal peaks whose d-spacings are indicated, the relative integrated intensities (I/&) are, from left to right, 27, 64, 100, 27, and 32.
Intrinsic Dissolution Rates-Prior to mounting the com-
17317 15976 14635 I3294 11953 10612 92717 76308 65899 52490
WAVENUMBERS (CM-I)
Figure 2-IR spectra of nonsolvated urapidil Form I1 and the methanol solvate of urapidil (wavenumber range i731.7-524.9 cm- I).
I I I I I I 10 15 20 25 30 35 40
Deg r e e s . 2 8
Figure 3-X-ray powder pattern of the methanol solvate of urapidil (on the intensity scale of 1.0 z lo4 cps).
pressed disk in the holder for the dissolution study, a scrap- ing was obtained from the protected side of the pellet. Then, DSC thermograms at both 10 and 1 "C min-' were obtained from this scraping in order to determine what changes occurred in the sample during the compression process. No change could be observed in the DSC pattern on compression of the methanol solvate. At the conclusion of the dissolution experiment, the surface of the pellet exposed to the dissolu- tion medium was sampled and DSC thermograms were obtained to determine what changes took place in the tablet
Table II-Differential Scanning Calorimetry Studies of the Methanol Solvate of Urapldila
Reclystallizat,on Concentration Temperature Range Fusion Heat of Fusion Heat Of % Methanol of Urapidil, YO for Loss of Temperature of Fusion, Temperature of Fusion, J g-' Form I , "C g-l (TGA), mim miv Methanol, "C Form 11, "C Conditions
Anhydrous Methanol 1 .o 121.3-1 22.3 159.1-159.9 5.9 162.7-1 64.0 74.5 6 7
2.0 120.1-121.0 157.6-1 58.5 10.9 161.7-1 62.6 82.0 7.3 3.0 1 20.1-1 20.8 157.8-1 58.4 22.6 161.8-1 62.6 71.5 6.7 4.0 120 1-121.0 157.9-1 58.5 24.3 161.5-1 62.5 73.2 7.5
(1 :1) 3.0 120.0-1 21 .o 158.5-1 59.2 24.3 162.3-1 63.2 73.6 7.2
(1:l) 3.0 1 19.7-1 20.4 157.8-1 58.4 31 .O 161.5-162.4 71.1 6.4
Methanokwater
Methano1:water
aPerformed at a heating rate of 10°C min-'.
30 / Journal of Pharmaceutical Sciences Vol. 78, No. 1, January 1989

during the dissolution run. For a dissolving disk under sink conditions with an essen-
tially constant surface area, the dissolution process can be described by:
w = KC,t
where W is the amount dissolved, C, is the solubility of the substance a t time t, and the constant k includes the surface area of the dissolving disk, the diffusion coefficient, and the diffusion layer thickness.I5 Thus, a plot of amount dissolved as a function of time should be linear for the initial dissolu- tion stages and the intrinsic dissolution rate (kC,lsurface area of the dissolving disk) can be calculated from the slopes of the straight lines.
Before the start of the dissolution study, urapidil, following the removal of the methanol (brought about by the DSC run), behaved like a mixture of Forms I and 11. After the dissolu- tion study, the endothermic eak corresponding to Form I1 was absent in the 1 "C min-'thermogram. The dissolution data also suggested that Form I1 was initially dissolving, but subsequently, when the plot changed to a less steep slope, Form I, or a mixture of Form I and 11, was dissolving (Figure 4).
Another possibility is that the initial dissolution rate corresponded to the dissolution rate of the solvate and that the change in slope was an indication of the desolvation of the methanol solvate to urapidil Form I, since the endother- mic peak corresponding to methanol seemed to decrease in the DSC thermogram obtained after the dissolution run. Also, it was found that after a storage period, the methanol solvate obtained by the recrystallization from a methanol solution containing 3% of solute desolvated more readily than the solvate obtained from a 2% solution. The initial curvature in the dissolution rate plot of this solvate (Figure 4) could thus be an indication of desolvation.
The intrinsic dissolution rates of the solvate prepared by different recrystallization techniques, as well as a compari- son with the intrinsic dissolution rates of the three nonsol- vated forms of urapidi14 are given in Table 111.
Solution Calor imet ry4ix samples of the solvate, rang- ing in mass from 30 to 80 mg, were used to determine the heat effect in 95% ethanol. A plot of heat of solution versus sample mass was linear with a correlation coefficient of 0.9999.
A plot of heat of solution versus sample mass was con- structed since, in the case of some compounds and in some solvents, association can occur between solute molecules at
22.5
0 30 60 90 120 150 180 210 240 270 TIME [minutes)
Figure 4-Amount dissolved-time plot for evaluation of the intrinsic dissolution rate of the mefhanol solvate of urapidil in wafer at 37°C.
Table Ill-Intrinsic Dissolution Rates of the Methanol Solvate of Urapidll Compared with the Nonsolvated Form of Urapidile
Crystalline Form Initial Dissolution
Rate, mg L-' cm-* min-'
Final Dissolution Rate,
mg L-' cm-* min-'
Methanol solvate obtained from: Methano1:water
2% Solution in methanol
3% Solution in methanol
(1:l)
Form I Form II Form II Form 111
3.65 x 10⁻⁴ 4.42 x 10⁻⁴
2.06 x Curvature Curvature
3.87 X
- 4.16 x 1 0 - ~ 3.04 x 3.34 x 1 0 - ~
0.56 x 10⁻⁴ 1.02 x 1 0 - ~ 0.62 x 10⁻⁴ 0.57 x 1 0 - ~
0.79 x 10⁻⁴ 0.80 x
0.68 x 0.68 x 0.65 x
a Mainly Form 111, some conversion to Form II on compression (ref 4).
higher concentration. This can lead to nonlinearity. The plot confirms the fact that over the range of concentrations studied there was no measurable change in the extent of interaction occurring between solute molecules.
The heat absorbed on dissolution in 95% ethanol at 30 "C, calculated from the slope of eq 1 and correcting for the effect of ampule breaking and other instrumental factors, was 48.39 kJ mol-' (11.57 kcal mol-l). When the heat effect was individually calculated for the different sample sizes taken, with no correction for instrumental factors, the mean heat absorbed on dissolution was 47.8 2 0.3 k J mol-I (11.43 k 0.06 kcal mol-'1.
The heat of solution for a compound provides a measure of the crystal lattice energy. For urapidil, the methanol solvate has the highest heat of solution in ethanol at 30 "C, as can be seen from comparing the heats of solution for the methanol solvate (Table IV).
Scanning Electron Microscopy-The crystals were plate- like, with undefined edges which appeared to be laminated (Figure 5).
Stability of the Methanol Solvate-A methanol solvate formed by the recrystallization of a 2% solution of urapidil kept its integrity under the different storage conditions. On the other hand, a solvate prepared by the addition of 3% urapidil to methanol desolvated rather easily, even when at room temperature (Table V). A change in the DSC thermo- gram patterns was also obvious from the solvated to the desolvated form. Desolvation due to DSC conditions resulted in Form I, but when desolvation was due to the storage conditions, urapidil Form I1 (possibly via form 14), was the result (Table VI). The relationship between Forms I and I1 is enantiotropic, with Form I1 the more stable form at room temperature, although it transforms to Form I at elevated te rnpera t~re .~
Table IV-Comparison of the Heat of Solution for the Nonsolvated Forms of Urapidil and the Methanol Solvate of Urapidil in the Mass Range of 30 to 80 mg of Solvate
Crystalline Form of U r a p i d i I
Heat of Solution, kJ mol-'
I II
111 Methanol solvate
21.96 24.26 22.98 (estimated) 48.39
Journal of Pharmaceutical Sciences / 31 Vol. 78, No. I, January 1989

A C
Figure 5-SEM photomicrographs of the methanol solvate of urapidil.
Table V-Thermogravimetric Analysis Studies of the Behavior of the Methanol Solvate Under Storage
Storage Time, Conditions of Temperature YO Loss of Water, Temperature Yo Loss of months Storage Range, "C m/m Range, "C Methanol, m/m
Solvent: Methanol (2% solute) 0 3 room temp. 3 37 "C 3 37 "C; 80% RH 1 45 "C 3 45 "C
Solvent: Methanol (3% solute)
-
- 0 3 room temp. 3 37 "C 3 37 "C; 80% RH 1 45 "C 3 45 "C
29.0-1 19.2 33.9-1 19.2 - - - -
32.0-1 12.2 84.9- 94.3
88.2- 98.4
82.6- 95.5
-
-
1.6 1 .a - - - -
0.9 1.6
1.3
1.1
-
-
1 19.2-1 59.5 1 19.2-1 55.6 97.2-1 44.5 79.3-141.1 88.0-134.5 90.1-1 42.2
1 12.2-1 45.6 94.3-1 10.5 81.7-1 16.9 98.4-106.1 77.0-107.5 95.5-1 10.6
7.3 6.9 7.6 6.8 7.9 7.2
7.8 1.1 1.3 0.5 1 .a 0.5
Table VI-Differential Scanning Calorimetry Studies of the Behavior of the Methanol Solvate Under Storage"
Conditions of Form 111, Form 11, Form I , Storage J g-' J g-' J g-' Time,
months
Solvent: Methanol (2% solute) 0 3 room temp. 3 37 "C 3 37 "C; 80% RH 1 45 "C 3 45 "C
-
Solvent: Methanol (3% solute) - 0
3 room temp. 3 37 "C 3 37 "C; 80% RH 1 45 "C 3 45 "C
13.5 26.8 19.2 15.1 29.7 36.0
26.8 b
b - - 2.1
3.3 b -
- - - - - -
- 98.7 97.9 96.2
101.7 99.6
83.3 70.3 78.2 80.8 51.5 64.9
75.3 - - 1.7 - -
a Heating rate of 1 "C min-'. Endothermic peak visible, but too small to measure.
Single Crystal X-ray Analysis-Several factors indicated that the crystal chosen for analysis could be unambiguously identified as a stable urapidi1:methanol solvate with 1:l stoichiometry: ( i ) the stability of check reflection intensities; ( i i ) the measured crystal density (Table VII); ( i i i ) straightfor- ward location of the solvent atoms in difference maps and successful refinement of their parameters; (iv) no evidence of
Table VlCCrystal Data
Molecular formula C20H29N503CH30H a(A) 8.706(4) 7.854(4)
16.358(8) Molecular mass 41 9.52 b(A) Crystal system Triclinic c(& Space group PT a(") 104.47(2)
z 2 P(") 97.05(2)
y'% 85J37(2) D,, g cm-3 1.286(5) D,, g cm-3 1.297 V( 3, 1073.9(9)
F(OO0) 452.0 p(MoKa), cm-' 0.85 - -
- -
disorder, confirmed also by the low background density in the final difference Fourier synthesis; and (u) the reasonable hydrogen bonding scheme found in the crystal. Refined atom parameters are listed in Table VIII, selected bond distances and angles appear in Table IX, and Figure 6 shows the molecular conformation of urapidil and the atomic number- ing.
The piperazine ring adopts a chair conformation with atoms N(11) and N(14) deviating by 0.676(3) and -0.690(2) A, respectively, from the plane through the four carbon atoms (plane I). The relative orientations of the three ring moieties are described by the following interplanar dihedral angles (I1 = uracil, I11 = phenyl):I/II 29.3; ID11 36.7; II/III 65.7 (e.s.d. values 0.1'). Torsion angle data (Table X) show that the chain from atom C(6) of the 1,3-dimethyluracil ring to N(11) of the piperazine ring is almost fully extended; the greatest deviation from the least squares plane through these six atoms is 0.052(4) A, for C(8). The torsion angle
32 /Journal of Pharmaceutical Sciences Vol. 78, No. 1, January 7989

Table VIII-Fractional Atomic Coordinates ( x 1 04, x 1 O3 for H) and Equivalent Isotropic Thermal Parameters (U,,, for H) (A2 x lo3) with e.s.d. Values in Parentheses'
Fractional Atomic Coordinates
X Y Z Atom 4
3489 (3) 181 8(4) 4215(4) 3486(3) 5787(3) 6552(4) 6684(4) 8107(3) 5884(4) 431 8(4) 3509(3) 431 8(4) 3226(4) 421 9(3)
2558(4) 1760(3) 2896(3) 3651 (4) 4438(4) 231 7(3) 181 l(3) 1925(2) 1240(4) 121 O(4) 1740(4) 2283(4) 1628(4)
156(3) 128(5) 160(4) 146(4) 250(4)
3335(3)
- 152(6)
-99(7) 79(7)
-33(8) -63(5)
1 1275(3) 11 587(5) 12404(4) 13577(3)
13309(4) 10854(4) 10758(3) 9774(4) 9971 (4) 8963(3) 7581 (4) 6638(4) 5326(4) 4202(3) 5263(4) 41 05(4) 2883(3) 1787(4) 2952(4) 2000(4) 2967(4) 4769(3) 2126(4) 304(5)
169(4) 5769(4) 6706(7) 8285(3) 1061 (5)
1262(5) 895(4) 678(8) 609(8) 588(8) 925(6)
121 37(3)
- 677( 5)
11 77(5)
1 184(2) 1239(3) 835(2) 573(2) 808(2) 422(2)
1 134(2) 1089(2) 1492(2) 151 O(2) 1847(2) 2214(2) 2595(2) 301 3(2) 3361 (2) 4076(2) 4496(2) 4817(1) 4105(2) 3682(2) 5369(2) 6142(2) 6328( 1 ) 6686(2) 6485(2) 5750(2) 5191 (2) 7149(2) 91 3(3)
1525(2) 8W')
184(3) 108(2) 176(2) 49(4) 77(4)
1 15(4) 141 (3)
a 4, = '/3X,Z,U,,a2$g,.
Table IX-Selected Bond Distances and Bond Angles"
Table X-Selected Torsion Angles
Angle, O a
N( 1 ) - C(6) - N (7) - C(8) C(6)-N(7)-C(8)-C(9) N(7)-C(8)-C(9)-C(10) C(S)-C(g)-C( 10)-N(11) C(9)-C(10)-N(1l)-C(12) C(9)-C(1O)-N(11)-C(16) N( 1 1 )-C( 12)-C( 13) - N( 1 4) C( 1 2) - C( 1 3) - N( 1 4) - C( 1 5) C( 1 3) - N (1 4) - C( 1 5) - C( 1 6) N(14)-C(15)-C(16)-NN(ll) C(15)-C( 16)-N(11 )-C(12) C(16)-N(1 l)-C(l2)-C(13) C( 1 3) - N( 1 4) - C( 1 7) -C( 22) C( 1 5) - N( 1 4) - C( 1 7) -C( 1 8) C( 19) -C( 18)-O( 1 8) -C(23)
- 179.0(3)
- 176.0(3)
- 66.2(4)
177.6(3)
- 175.7(3)
176.2(3) 60.0(4)
58.9(4)
57.6(4)
120.5(4) 169.4(3)
8.0(5)
-59.7(4)
-59.5(4)
-57.2(4)
a Estimated standard deviation in parentheses.
Figure 6- The conformation of the urapidil molecule in the methanol solvate.
about the bond N(14)-C(17) appears to be partly influenced by an attractive intermolecular interaction indicated by the short contact O(18) . . . H(13B) of 2.19(1) A, with O(18) . . . C(13) equal to 2.898(4) wand C(13)-H(13B). . . O(18) equal to 121(3)".
Essential features of the packing and hydrogen bonding in the solvate are shown in projection in Figure 7. The methanol molecules are concentrated in layers associated with the crystal (100) planes; the urapidil molecules lie between these
N(1 )--C(1) N(3) - C(3) N(l)-C(2) C(2)- N(3) N(3) - C(4) C(2)--0(2) C(4)-0(4) C(4)--C(5) C(5)-C(6) N(l)--C(6) C(6) - N(7) N(7)-C(8) C(8)--C(9) C(9) - C( 1 0)
C(6)-N(l)-C(2) N(l)-CC(2)-N(3) C(2) - N(3) - C(4) N(3)-C(4)-C(5) C(4)-C(5)-C(6) C(5)-C(6)-N(l) C(6) - N(7)-C(8) C(6)-N(7)-H(7) C(8) - N( 7) - H (7) N( 7) - C( 8) - C( 9) C(8)-C(9)-C(lO) C(9)-C(lO)-N(ll)
1.468(4)
1.391 (5)
1.401 (4)
1.246(4) 1.408(5) 1.364(5) 1.388(4)
1.465(4) 1.523(5)
1.474(5)
1.374(4)
1.21 7(5)
1.349(5)
1.535(5)
121.6(3) 1 16.8(3) 124.0(3) 1 16.4(3) 121.2(3) 119.9(3) 1 19.8(3)
177(2)
107.2(3) 1 14.6(3)
122(2)
112.1(3)
Bond Length, A C(io)-N(ll) N(ll)-C(12) N(ll)-C(16) C( 13) - N( 14) C( 15) - N( 14)
C( 15) -C( 1 6) N( 14) -C( 1 7) C(18)-O(18) 0(18)-C(23)
C(12)-C(13)
N(7)-H(7)
C(24)-O(24) 0(24)-H(24)
C( 13)- N( 1 4)-C( 17) C( 13)- N( 1 4)-C( 15) N(l l)-C(l2)-C(13) C( 12) -C( 1 3)- N( 14) N(14)-C(15)-C(16) C(15)-C(16)-N(ll) C( 18) -0( 18) -C(23) C(24) -0(24) - H(24)
1.467(5) 1.465(4) 1.470(4) 1.471 (4) 1.461 (4) 1.51 7(5) 1.519(5) 1.423(4) 1.380(4) 1.420(4) 0.88(3)
1.405(5) 1.03(4)
1 10.3(3) 107.8(3) 108.0(3) 1 16.9(3) 114.2(3) 108.8(3) 1 1 1.0(3) 110.0(3) 109.5(3) 112.1(3) 1 18.4(3) 109(2)
a Estimated standard deviation in parentheses.
Journal of Pharmaceutical Sciences / 33 Vol. 78, No. 1, January 1989

Figure 7-The (001) projection showing essential features of the hydrogen bonding (dotted lines}. The asymmetric unit is drawn with bold lines. For clarity, the only H atoms shown are H(7) of the host and those of the solvent; only the unique hydrogen bonds are shown at each cell corner.
Table XI-Hydrogen Bond Data
N(7) . . . O(24) 2.965(4) 8, N(7)-H(7) . . . O(24) 166(3)" H(7) . . . O(24) 2.1 l(3)
O(24) . . . O(4') 2.710(4) O(4') . . . H(24)-O(24) 173(4)' H(24) . . . O(4')
Symmetry code: (i) -1 +x,y,z
1.69(4)
layers, with the long molecular axes roughly parallel to them. Each solvent molecule bridges two host molecules which are related by translation along the x-direction. Meth- anolic oxygen atom O(24) acts as acceptor in the hydrogen bond O(24) , , , H(7)-N(7) (all atoms in the same asymmet- ric unit); methanolic hydrogen atom H(24) participates in an almost linear hydrogen bond to acceptor keto-oxygen atom O(4') of a translated urapidil molecule. These strong cohesive interactions between the host and solvent molecules explain the observation from the DSC thermograms of a relatively high threshold temperature for desolvation. Geometrical data for the hydrogen bonds are listed in Table XI. The arrangement resulting from the bridging role of the solvent is one of infinite chains of alternating host and solvent molecules linked by hydrogen bonds along the x-direction.
Conclusions The physicochemical properties of three nonsolvated and
three solvated hydrates of urapidil, as well as the methanol
solvate were studied. Although the methanol solvate has the best solubility profile in water, as determined by intrinsic dissolution rate studies, the use of the methanol solvate should be avoided due to toxicity of methanol. Moreover, the tendency to desolvate to urapidil Form 11, even on mild storage conditions, could provide problems with bioavailabil- ity of the product.
Recrystallization from butanol is thus recommended in order to obtain urapidil Form 11, which undergoes not only the least transformation at room temperature, but which is also not prone to transformations on application of compres- sion force.
1.
2.
3. 4.
5.
6.
7.
8.
9. 10. 11.
12. 13. 14.
15.
References and Notes Schoetensack, W.; Bischler, P.; Dittman, E. Ch.; Steinijans, V. Anneim.-Forsch. 1977,27, 1908-1909. Barnakay, A.; Gijb, E.; Richter, J. A. Anneim.-Forsch. 1981,31,
Haleblian, J. K. J . Pharm. Sci. 1975, 64, 1269-1288. Botha, S. A.; Guillory, J. K.; Lotter, A. P. J . Pharm. Biomed. Anal. 1986,4, 573487 . Botha, S. A.; Caira, M. R.; Guillory, J. K.; Lotter, A. P. J . Pharm. Sci. 1988, 77, 444-45. Kaneniwa, N.; Otsuka, M. Chem. Pharm. Bull. 1985,33, 1660- 1668. Sheldrick, G. M. SHELX76. Program for crystal structure deter- mination, University of Cambridge, England, 1976. International Tables for X-ray Crystallo raphy Vol. IV; Ibers, J. A.; Hamilton, W. C., Eds.; Kynoch: %irmingham, Present Distributor D. Reidel: Dordrecht, 1974; pp 99, 149. De Wet, J. F. J . Appl. Crystullogr. 1980, 13, 625-629. Nardelli. M. Comnut. Chem. 1983. 7r3). 95-98.
849-852.
Singh, P.; Desai, 5. J.; Flanagan, D . R.; Simonelli, A. P.; Higu- chi, W. K. J. Pharm. Sci. 1968. 57,959-965. Muller, B. W. Pharm. Acta Heiu. 1978, 53, 333-340. Yang, S. S.; Guillory, J. K. J . Pharm. Sci. 1972, 61, 26-39. Guillory, J. K.; Lin, H. 0. Chem. Pharm. Bull. 1976,24, 1675- 1678. Stagner, W. C.; Guillory, J. K. J. Pharm. Sci. 1979, 68, 1005- 1009.
Acknowledgments Urapidil was generously provided by Dr. M. H. Durr, Byk Gulden
Pharmaceuticals, Randburg, South Africa. The authors thank Dr. V. E. Hamilton-Attwell, Department of Zoology, and Dr. A. M. Viljoen, Department of Chemistry, University of Potchefstroom for C.H.E. in whose laboratories the SEM hotomicro aphs and IR spectra were recorded. One of us (MRC) tKanks the &IR (Pretoria) for financial assistance and the NPRL for providing the intensity data-collection service. This study was initiated at the College of Pharmacy, University of Iowa, and com leted at the Faculty of Pharmacy, University of Potchefstroom C.H.E., South Africa. The work was supported in part by a rant from Marion Labora- tories, U.S.A. This study was abstractefin part from a dissertation submitted by S. A. Botha to the Faculty of Pharmacy, University of Potchefstroom for C.H.E., in partial fulfillment of the Doctor of Scientiae degree requirement.
34 /Journal of Pharmaceutical Sciences Vol, 78, No. I , January 1989