Physical Geography
132
Physical Geography
-
Upload
khangminh22 -
Category
Documents
-
view
0 -
download
0
Transcript of Physical Geography

Physical Geography
?

Subject: PHYSICAL GEOGRAPHY Credits: 4
SYLLABUS Geomorphology - I Origin of the Earth, Geological Time Scale, Isostasy, Concept, Implication of Isostasy Balance Interior of Earth Rocks Geomorphology - II Volcanism, Earthquakes, Weathering, Running Water and Fluvial Landforms, Wind and Aeolian Landform Glacial landform Climatology Structure and Composition of Atmosphere, Temperature, Pressure Belts and Wind System, Clouds and Rainfall Types, Cyclones and Anti-Cyclones, Major Climatic Types Oceanography Relief of the Ocean Basins, Temperature of the Ocean Water, Salinity, Ocean Deposits, Ocean Currents ElNino and LaNino Suggested Reading
1. Arthur Strahler, Introducing Physical Geography, John Wiley & Sons
2. Tom L. McKnight, Physical Geography: A Landscape Appreciation, Prentice Hall
3. Robert E. Gabler, James F. Petersen, L. Michael Trapasso, Physical Geography, Thomson Brooks/Cole
4. Alan H. Strahler, Arthur Newell Strahler, Modern Physical Geography, John Wiley & Sons
5. Cuchlaine A.M. King, Physical Geography, Blackwell Publishers
Chapter-1 Geomorphology
Learning Objectives
To define the Earth.
To explain the Geological Time Scale.
To explain the Rocks.
To explain the Earthquakes.
1.1 Introduction
Geomorphology is the scientific study of the surface of a planet and those processes responsible for forming it. Scientists involved in this field often study historical changes, through events such as erosion, in order to understand how a particular geographical region came into existence. They may also study current data to better predict how landforms might change in the future and to understand how people can help maintain current features. This allows scientists to anticipate changes in the general structure of the earth.
Landforms on any world, including earth, are not static; they are part of a dynamically changing system. There are various geomorphic processes that can alter the surface of a world, including plate tectonics, changes in climate, and human activities. Wind can shape landscapes, as can water — both liquid and ice, in the form of glaciers. Volcanic activity, including violent eruptions and the steady flow of lava from some sites, can create new islands or devastate a landscape. Plants and animals can also alter landforms, whether a beaver damming a river or a grove of trees that anchor the soil in a particular location.
Slow movements of the earth's tectonic plates contribute to the uplift and elevation of landforms. There are two common types of tectonic uplift: organic and isostatic. Orogenic tectonic uplift is caused when tectonic plates crash together, which raises the land where they meet to create forms such as mountains. Isostatic uplift, on the other hand, refers to how landforms can become higher after the weight on the land is reduced; as land is eroded or glaciers melt, it is believed that the land that was being weighed down can rise.
The geomorphic effect of water bodies is studied in fluvial geomorphology, which examines how bodies of water alter the landscape. As waterways such as rivers flow, they often carry sediment, which reduces the land around the river itself but increases areas where this sediment is released. Water from rain and flash floods can also be responsible for erosion, which physically alters rocks and other land areas.
Glaciers also change the landscape. As these heavy sheets of ice advanced across the landscape during the last ice age, they scoured the softer land areas in their way; they also picked up some of this material and moved it. When the ice melted, valleys and fjords — coastal valleys that are filled with water — were left behind, as were the rocks and soil, called "till," that the glacier picked up.

On the opposite side, volcanoes can both create and destroy landforms. Often found at the edges of tectonic plates, underwater volcanoes have shaped the islands like Hawaii, the Philippine Islands, and New Zealand. On land, they can form large volcanic mountains. The violent blast of a volcano can radically change the landscape, and wipe out plants and animals in the area.
Although it often works much more slowly, wind can also alter the land. Called eolian geomorphology, wind can erode landforms, breaking them down, and build others up, as material is moved from one place to another. The Nebraska Sand Hills, for example, is an area where ancient winds created huge sand dunes that have since stabilized and became a regular part of the landscape.
Plants and animals can have a big impact on the landscape as well. Animals dig tunnels and dens, move rocks and soil, and block rivers, among other things. Plant roots can grow through the cracks in rocks, breaking them apart, or help to hold the soil in an area together, decreasing erosion caused by water and wind. Living things can also combine with other forces to cause changes; a volcanic eruption may destroy a stand of trees, for example, leaving the land in the area exposed to the weathering caused by wind and rain.
Human interventions can also contribute to changes on the earth. With the expansion of civilization, humans began to enact direct changes to their surroundings. The most radical changes to landforms are possible due to technological and organizational advances; the building of the Panama or Suez canals, for example, were significant alterations to the earth's natural form. People have straightened rivers or prevented them from naturally changing their course, created lakes and other bodies of water, and prevented beaches from expanding or eroding in some cases. The long-term effects of many of the changes that human beings have made is not fully known, and it may take centuries for the side effects — good and bad — to become fully clear.
1.2 Origin of the Earth
The most prominent scientific hypothesis about the origin of the Earth involves a spinning cloud of dust called a solar nebula. This nebula is a product of the Big Bang. Philosophers, religious scholars and scientists have lots of ideas about where the universe came from, but the most widely-held scientific hypothesis is the Big Bang Hypothesis . According to this hypothesis , the universe originated in an enormous blast .
Before the Big Bang, all of the matter and energy now in the universe was contained in a singularity. A singularity is a point with an extremely high temperature and unlimited density. It's also what's found at the center of a black hole. This singularity floated in a complete vacuum until it exploded, flinging gas and energy in all directions. Imagine a bomb going off inside an egg -- matter moved in all directions at high speeds.
As the gas from the blast cooled, various physical forces caused particles to stick together. As they continued to cool, they slowed down and became more organized, eventually growing into stars. This process took about a billion years.
About five billion years ago, some of this gas and matter became our sun. At first, it was a hot, spinning cloud of gas that also included heavier elements. As the cloud spun, it collected into a disc called a solar nebula. Our planet and others probably formed inside this disc. The center of the cloud continued to condense, eventually igniting and becoming a sun.

There's no concrete evidence for exactly how the Earth formed within this nebula. Scientists have two main theories. Both involve accretion, or the sticking together of molecules and particles. They have the same basic idea -- about 4.6 billion years ago, the Earth formed as particles collected within a giant disc of gas orbiting what would become our sun. Once the sun ignited, it blew all of the extra particles away, leaving the solar system as we know it.
At first, the Earth was very hot and volcanic. A solid crust formed as the planet cooled, and impacts from asteroids and other debris caused lots of craters. As the planet continued to cool, water filled the basins that had formed in the surface, creating oceans.
Through earthquakes, volcanic eruptions and other factors, the Earth's surface eventually reached the shape that we know today. Its mass provides the gravity that holds everything together and its surface provides a place for us to live. But the whole process would not have started without the sun.
1.3 Geologic time scale
The geologic time scale (GTS ) is a system of chronological measurement that relates stratigraphy to time, and is used by geologists, paleontologists, and other earth scientists explain the timing and relationships between events that have occurred throughout Earth's history.
Evidence from radiometric dating indicates that the Earth is about 4.54 billion years old. The geology or deep time of Earth's past has been organized into various units according to events which took place in each phase. Different spans of time on the Geologic time scale are usually delimited by changes in the composition of the strata which correspond to them, indicating major geological or paleontological events, such as mass extinctions. For example, the boundary between the Cretaceous phase and the Paleogene phase is defined by the Cretaceous–Paleogene extinction event, which marked the demise of the dinosaurs and many other groups of life. Old time spans which predate the reliable fossil record (before the Proterozoic Eon) are defined by the absolute age.
1.3.1 Terminology
Units in geochronology and stratigraphy
Segments of rock (strata) in
chronostratigraphy
Time spans in geochronology
Notes to geochronological
units
Eonothem Eon 4 total, half a billion years or more
Erathem Era 10 total, several hundred million years
System Phase

Series Epoch tens of millions of years
Stage Age millions of years
Chronozone Chron subdivision of an age, not used by the ICS timescale
The largest defined unit of time is the supereon, composed of eons. Eons are divided into eras, which are in turn divided into phases, epochs and ages. The terms eonothem, erathem, system, series, and stage are used to refer to the layers of rock that correspond to these phases of geologic time in earth's history.
Geologists qualify these units as Early, Mid, and Late when referring to time, and Lower, Middle, and Upper when referring to the corresponding rocks. For example, the Lower Jurassic Series in chronostratigraphy corresponds to the Early Jurassic Epoch in geochronology. The adjectives are capitalized when the subdivision is formally recognized, and lower case when not; thus "early Miocene" but "Early Jurassic."
Geologic units from the same time but different parts of the world often look different and contain different fossils, so the same phase was historically given different names in different locales. For example, in North America the Lower Cambrian has called the Waucoban series that is then subdivided into zones based on a succession of trilobites. In East Asia and Siberia, the same unit is split into Alexian, Atdabanian, and Botomian stages. A key aspect of the work of the International Commission on Stratigraphy is to reconcile this conflicting terminology and define universal horizons that can be used around the world.
1.3.2 History and nomenclature of the time scale
In Ancient Greece, Aristotle saw that fossil seashells from rocks were alike to those found on the beach and inferred that the fossils were once part of living animals. He reasoned that the positions of land and sea had changed over long phases of time. Leonardo da Vinci concurred with Aristotle's view that fossils were the remains of ancient life.
The 11th-century Persian geologist Avicenna (Ibn Sina) and the 13th century Dominican bishop Albertus Magnus (Albert of Saxony) extended Aristotle's justification into a hypothesis of a petrifying fluid. Avicenna also first proposed one of the principles underlying geologic time scales, the law of superposition of the strata, while discussing the origins of mountains in The Book of Healing in 1027. The Chinese naturalist Shen Kuo (1031–1095) also recognized the concept of 'deep time'.
Nicholas Steno later laid down the principles underlying geologic (geological) time scales in the late 17th century. Steno argued that rock layers (or strata) are laid down in succession, and that each represents a "slice" of time. He also formulated the law of superposition, which states that any given stratum is probably older than those above it and younger than those below it. While the Steno's principles were simple, applying them to real rocks proved complex. Over the course of the 18th century geologists realized that:
1. Sequences of strata were often eroded, distorted, tilted, or even inverted after deposition;

2. Strata laid down at the same time in different areas could have entirely different appearances; 3. The strata of any given area represented only part of the Earth's long history.
The first serious attempts to formulate a geological time scale that could be applied anywhere on Earth were made in the late 18th century. The most influential of those early attempts (championed by Abraham Werner, among others) divided the rocks of the Earth's crust into four types: Primary, Secondary, Tertiary, and Quaternary. Each type of rock, according to the hypothesis , formed during a specific phase in Earth history. It was thus possible to speak of a "Tertiary Phase" as well as of "Tertiary Rocks." Indeed, "Tertiary" (now Paleocene - Pliocene) and "Quaternary" (now Pleistocene and Holocene) remained in use as names of geological phases well into the 20th century.
The Neptunist theories popular at this time (expounded by Werner) proposed that all rocks had precipitated out of a single enormous flood. A major shift in thinking came when James Hutton presented his Hypothesis of the Earth; or, an Investigation of the Laws Observable in the Composition, Dissolution, and Restoration of Land Upon the Globe before the Royal Society of Edinburgh in March and April 1785. It has been said that "as things appear from the perspective of the 20th century, James Hutton in those reading became the founder of modern geology" Hutton proposed that the interior of the Earth was hot, and that this heat was the engine which drove the creation of new rock: land was eroded by air and water and deposited as layers in the sea; heat then consolidated the sediment into stone, and uplifted it into new lands. This hypothesis were dubbed "Plutonist" in contrast to the "Neptunist" flood-oriented hypothesis .
The identification of strata by the fossils they contained, pioneered by William Smith, Georges Cuvier, Jean d'Omalius d'Halloy, and Alexandre Brogniart in the early 19th century, enabled geologists to divide Earth history more precisely. It also enabled them to correlate strata across national (or even continental) boundaries. If two strata (however distant in space or different in composition) contained the same fossils, chances were good that they had been laid down at the same time. Detailed studies between 1820 and 1850 of the strata and fossils of Europe produced the sequence of geological phases still used today.
The process was dominated by British geologists, and the names of the phases reflect that dominance. The "Cambrian", (the classical name for Wales) and the "Ordovician", and "Silurian", named after ancient Welsh tribes, were phases defined using stratigraphic sequences from Wales. The "Devonian" was named for the English county of Devon, and the name "Carboniferous" was simply an adaptation of "the Coal Measures", the old British geologists' term for the same set of strata. The "Permian" was named after Perm, Russia, because it was defined using strata in that region by Scottish geologist Roderick Murchison. However, some phases were defined by geologists from other countries. The "Triassic" was named in 1834 by a German geologist Friedrich Von Alberti from the three distinct layers (Latin Trias meaning triad) —red beds, capped by chalk, followed by black shales— that are found throughout Germany and Northwest Europe, called the 'Trias'. The "Jurassic" was named by a French geologist Alexandre Brogniart for the extensive marine limestone exposures of the Jura Mountains. The "Cretaceous" (from Latin creta meaning 'chalk') as a separate phase was first defined by Belgian geologist Jean d'Omalius d'Halloy in 1822, using strata in the Paris basin and named for the extensive beds of chalk (calcium carbonate deposited by the shells of marine invertebrates).
British geologists were also responsible for the grouping of phases into Eras and the subdivision of the Tertiary and Quaternary phases into epochs. In 1841 John Phillips published the first global geological time scale based on the types of fossils found in each era. Phillips' scale helped standardize the use of terms like the Paleozoic ("old life") which he extended to cover a larger phase than it had in previous usage, and Mesozoic ("middle life") which he invented.
When William Smith and Sir Charles Lyell first recognized that rock strata represented successive time phases, time scales could be estimated only very imprecisely since various kinds of rates of change used in estimation were highly variable. While creationists had been proposing dates of around six or seven thousand years for the age of the Earth based on the Bible, early geologists were suggesting millions of years for geologic phases with some even suggesting a virtually unlimited age for the Earth. Geologists and paleontologists constructed the geologic table based on the relative positions of different strata and fossils, and estimated the time scales based on studying rates of various kinds of weathering, erosion, sedimentation, and lithification. Until the discovery of radioactivity in 1896 and the development of its geological applications through radiometric dating during the first half of the 20th century (pioneered by such geologists as Arthur Holmes) which allowed for more precise absolute dating of rocks, the ages of various rock strata and the age of the Earth were the subject of considerable debate.
The first geologic time scale that included absolute dates was published in 1913 by the British geologist Arthur Holmes. He greatly furthered the newly created discipline of geochronology and published the world renowned book The Age of the Earth in which he estimated the Earth's age to be at least 1.6 billion years.
In 1977, the Global Commission on Stratigraphy (now the International Commission on Stratigraphy) started an effort to define global references known as GSSP (Global Boundary Stratotype Sections and Point) for geologic phases and final stages. The commission's most recent work is explained in the 2004 geologic time scale of Gradstein et al. A UML model for how the time scale is structured, relating it to the GSSP, is also available.
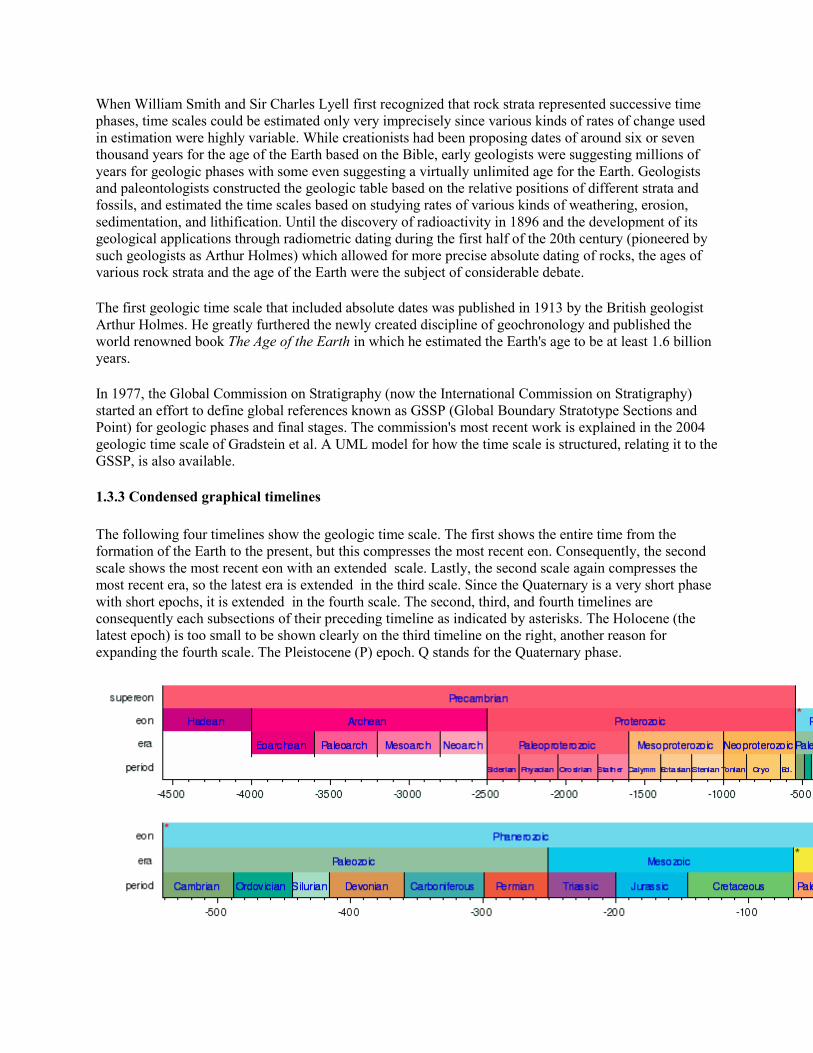
1.3.3 Condensed graphical timelines
The following four timelines show the geologic time scale. The first shows the entire time from the formation of the Earth to the present, but this compresses the most recent eon. Consequently, the second scale shows the most recent eon with an extended scale. Lastly, the second scale again compresses the most recent era, so the latest era is extended in the third scale. Since the Quaternary is a very short phase with short epochs, it is extended in the fourth scale. The second, third, and fourth timelines are consequently each subsections of their preceding timeline as indicated by asterisks. The Holocene (the latest epoch) is too small to be shown clearly on the third timeline on the right, another reason for expanding the fourth scale. The Pleistocene (P) epoch. Q stands for the Quaternary phase.

Millions of Years
1.4 Isostasy
1.4.1 Concept
Isostasy, ideal theoretical balance of all large portions of Earth’s lithosphere as though they were floating on the denser underlying layer, the asthenosphere, a section of the upper mantle composed of weak, plastic rock that is about 110 km (70 miles) below the surface. Isostasy controls the regional elevations of continents and sea floors in accordance with the densities of their underlying rocks. Imaginary columns of equal cross-sectional area that rise from the asthenosphere to the surface are assumed to have equal weights everywhere on Earth, even though their constituents and the elevations of their upper surfaces are significantly different. This means that an excess of mass seen as material above sea level, as in a mountain system, is due to a deficit of mass, or low-density roots, below sea level. Consequently, high mountains have low-density roots that extend deep into the underlying mantle. The concept of isostasy played an important role in the development of the hypothesis of plate tectonics.
In 1735, expeditions over the Andes led by Pierre Bouguer, a French photometrist and the first to measure the horizontal gravitational pull of the mountains, noted that the Andes could not represent a protuberance of rock sitting on a solid platform. If it did, then a plumb-line should be deflected from the true vertical by an amount proportional to the gravitational attraction of the mountain range. The deflection was less than that which was anticipated. About a century later, alike discrepancies was observed by Sir George Everest, surveyor general of India, in surveys south of the Himalayas, indicating a lack of compensating mass beneath the visible mountain ranges.
In the hypothesis of isostasy, a mass above sea level is supported below sea level, and there is thus a certain depth at which the total weight per unit area is equal all around the Earth; this is known as the depth of compensation. The depth of compensation was taken to be 113 km (70 miles) according to the Hayford-Bowie concept, named for American geodesists John Fillmore Hayford and William Bowie. Owing to changing tectonic environments, however, perfect isostasy is approached but rarely attained, and some regions, such as oceanic trenches and high plateaus, are not isostatically compensated.

The Airy hypothesis says that Earth’s crust is a more rigid shell floating on a more liquid substratum of greater density. Sir George Biddell Airy, an English mathematician and astronomer, assumed that the crust has a uniform density throughout. The thickness of the crustal layer is not uniform, however, and so this hypothesis supposes that the thicker parts of the crust sink deeper into the substratum, while the thinner parts are buoyed up by it. According to this hypothesis, mountains have roots below the surface that are much larger than their surface expression. This is analogous to an iceberg floating on water, in which the greater part of the iceberg is underwater.
The Pratt hypothesis, developed by John Henry Pratt, English mathematician and Anglican missionary, supposes that Earth’s crust has a uniform thickness below sea level with its base everywhere supporting an equal weight per unit area at a depth of compensation. In essence, this says that areas of the Earth of lesser density, such as mountain ranges, project higher above sea level than do those of greater density. The justification for this was that the mountains resulted from the upward expansion of locally heated crustal material, which had a larger volume but a lower density after it had cooled.
The Heiskanen hypothesis, developed by Finnish geodesist Weikko Aleksanteri Heiskanen, is an intermediate, or compromise, hypothesis between Airy’s and Pratt’s. This hypothesis says that approximately two-thirds of the topography are compensated by the root formation (the Airy model) and one-third by Earth’s crust above the boundary between the crust and the substratum (the Pratt model).
1.4.2 Implication of Isostasy Balance
1.4.2.1 Isostatic effects of deposition and erosion
When large amounts of sediment are deposited on a particular region, the immense weight of the new sediment may cause the crust below to sink. Alikely, when large amounts of material are eroded away from a region, the land may rise to compensate. Consequently, as a mountain range is eroded down, the (reduced) range rebounds upwards (to a certain extent) to be eroded further. Some of the rock strata now visible at the ground surface may have spent much of their history at great depths below the surface buried under other strata, to be eventually exposed as those other strata are eroded away and the lower layers rebound upwards again.
An analogy may be made with an iceberg - it always floats with a certain proportion of its mass below the surface of the water. If more ice is added to the top of the iceberg, the iceberg will sink lower in the water. If a layer of ice is somehow sliced off the top of the iceberg, the remaining iceberg will rise. Alikely, the Earth's lithosphere "floats" in the asthenosphere.
1.4.2.2 Isostatic effects of plate tectonics
When continents collide, the continental crust may thicken at their edges in the collision. If this happens, much of the thickened crust may move downwards rather than up as with the iceberg analogy. The idea of continental collisions building mountains "up" is consequently rather a simplification. Instead, the crust thickens and the upper part of the thickened crust may become a mountain range.
However, some continental collisions are far more complex than this, and the region may not be in isostatic equilibrium, so this subject has to be treated with caution.
1.4.2.3 Post-glacial rebound Post-glacial rebound (sometimes called continental rebound, glacial isostasy, glacial isostatic adjustment) is the rise of land masses that were depressed by the huge weight of ice sheets during the last glacial phase, through a process known as isostasy. It affects northern Europe (especially Scotland, Estonia, Fennoscandia, and northern Denmark), Siberia, Canada, the Great Lakes of Canada and the United States, the coastal region of the US state of Maine, parts of Patagonia, and Antarctica.
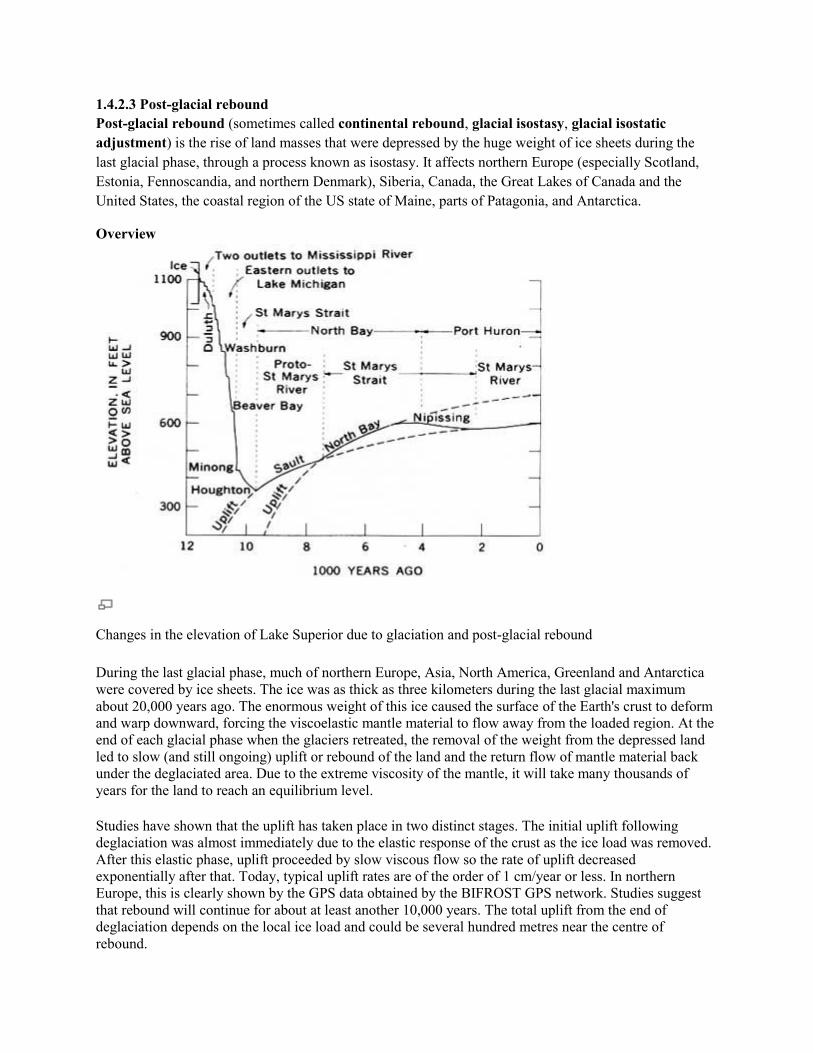
Overview
Changes in the elevation of Lake Superior due to glaciation and post-glacial rebound
During the last glacial phase, much of northern Europe, Asia, North America, Greenland and Antarctica were covered by ice sheets. The ice was as thick as three kilometers during the last glacial maximum about 20,000 years ago. The enormous weight of this ice caused the surface of the Earth's crust to deform and warp downward, forcing the viscoelastic mantle material to flow away from the loaded region. At the end of each glacial phase when the glaciers retreated, the removal of the weight from the depressed land led to slow (and still ongoing) uplift or rebound of the land and the return flow of mantle material back under the deglaciated area. Due to the extreme viscosity of the mantle, it will take many thousands of years for the land to reach an equilibrium level.
Studies have shown that the uplift has taken place in two distinct stages. The initial uplift following deglaciation was almost immediately due to the elastic response of the crust as the ice load was removed. After this elastic phase, uplift proceeded by slow viscous flow so the rate of uplift decreased exponentially after that. Today, typical uplift rates are of the order of 1 cm/year or less. In northern Europe, this is clearly shown by the GPS data obtained by the BIFROST GPS network. Studies suggest that rebound will continue for about at least another 10,000 years. The total uplift from the end of deglaciation depends on the local ice load and could be several hundred metres near the centre of rebound.
Recently, the term post-glacial rebound is gradually being replaced by the term glacial isostatic adjustment. This is in recognition that the response of the Earth to glacial loading and unloading is not limited to the upward rebound movement, but also involves downward land movement, horizontal crustal motion, changes in global sea levels, the Earth's gravity field, induced earthquakes and changes in the rotational motion. An alternate term that is sometimes used is glacial isostasy, because the uplift near the center of rebound is due to the tendency towards the restoration of isostatic equilibrium (as in the case of isostasy of mountains). Unfortunately, that term gives the wrong impression that isostatic equilibrium is somehow reached, so by appending "adjustment" at the end, the motion of restoration is emphasized.
1.4.2.4 Effects
Post-glacial rebound (or glacial isostatic adjustment) produces measurable effects on vertical crustal motion, global sea levels, horizontal crustal motion, gravity field, Earth's rotational motion and a state of stress and earthquakes. Studies of glacial rebound give us information about the flow law of mantle rocks and also past ice sheet history. The former is important to the study of mantle convection, plate tectonics and the thermal evolution of the Earth. The latter is important to glaciology, paleoclimate and changes in global sea level. Understanding postglacial rebound is also important to our ability to monitor recent global change.
1.4.2.5 Vertical crustal motion
Erratic boulders, U-shaped valleys, drumlins, eskers, kettle lakes, bedrock striations are among the common signatures of the Ice Age. In addition, post-glacial rebound has caused numerous significant changes to coastlines and landscapes over the last several thousand years, and the effects continue to be significant.
In Sweden, Lake Mälaren was formerly an arm of the Baltic Sea, but uplift eventually cut it off and led to its becoming a freshwater lake in about the 12th century, at the time when Stockholm was founded at its outlet. Marine seashells found in Lake Ontario sediments imply a alike event in prehistoric times. Other pronounced effects can be seen on the island of Öland, Sweden, which has little topographic relief due to the presence of the very level Stora Alvaret. The rising land has caused the Iron Age settlement area to recede from the Baltic Sea, making the present day villages on the west coast set back unexpectedly far from the shore. These effects are quite dramatic at the village of Alby, for example, where the Iron Age inhabitants were known to subsist on substantial coastal fishing.
As a result of post-glacial rebound, the Gulf of Bothnia is predicted to eventually close up at Kvarken. The Kvarken is a UNESCO World Natural Heritage Site, selected as a "type area" illustrating the effects of post-glacial rebound and the Holocene glacial retreat.
In several other Nordic ports, like Tornio and Pori (formerly at Ulvila), the harbor has had to be relocated several times. Place names in the coastal regions also illustrate the rising land: there are inland places named 'island', 'Skerry', 'rock', 'point' and 'sound'. For example, Oulunsalo "island of Oulujoki" is a peninsula, with inland names such as Koivukari "Birch Rock", Santaniemi "Sandy Cape", and Salmioja "the ditch of the Sound".
In Great Britain, glaciation affected Scotland but not southern England, and the post-glacial rebound of northern Great Britain (up to 10 cm per century) is causing a corresponding downward movement of the southern half of the island (up to 5 cm per century). This will eventually lead to an increased risk of floods in southern England and south-western Ireland.

Since the glacial isostatic adjustment process causes the land to move relative to the sea, ancient shorelines are found to lie above present day sea level in areas that were once glaciated. On the other hand, places in the peripheral bulge area which was uplifted during glaciation now begin to subside. Consequently ancient beaches are found below present day sea level in the bulge area. The "relative sea level data", which consists of height and age measurements of the ancient beaches around the world, tells us that glacial isostatic adjustment proceeded at a higher rate near the end of deglaciation than today.
The present-day uplift motion in northern Europe is also monitored by a GPS network called BIFROST. Results of GPS data show a peak rate of about 11 mm/year in the north part of the Gulf of Bothnia, but this uplift rate decreases away and becomes negative outside the former ice margin.
In the near field outside the former ice margin, the land sinks relative to the sea. This is the case along the east coast of the United States, where ancient beaches are found submerged below present day sea level and Florida is expected to be submerged in the future. GPS data in North America also confirms that land uplift becomes subsidence outside the former ice margin.
1.4.2.6 Global sea levels
To form the ice sheets of the last Ice Age, water from the oceans evaporated, condensed as snow and was deposited as ice in high latitudes. Thus global sea level fell during glaciation.
The ice sheets at the last glacial maximum were so massive that global sea level fell by about 120 meters. Thus continental shelves were exposed and many islands became connected with the continents through dry land. This was the case between the British Isles and Europe, or between Taiwan, the Indonesian islands and Asia. A sub-continent also existed between Siberia and Alaska that allowed the migration of people and animals during the last glacial maximum.
The fall in sea level also affects the circulation of sea currents and thus has important impact on climate during the Ice Age.
During deglaciation, the melted ice water returns to the oceans, thus sea level in the sea increases again. However, geological records of sea level changes show that the redistribution of the melted ice water is not the same everywhere in the oceans. In other words, depending upon the location, the rise in sea level at a certain site may be more than that at another site. This is due to the gravitational attraction between the mass of the melted water and the other masses, such as remaining ice sheets, glaciers, water masses and mantle rocks and the changes in centrifugal potential due to Earth's variable rotation.
1.4.2.7 Horizontal crustal motion
Accompanying the vertical motion is the horizontal motion of the crust. The BIFROST GPS network shows that the motion diverges from the center of rebound. However, the largest horizontal velocity is found near the former ice margin.
The situation in North America is less certain; this is due to the sparse distribution of GPS stations in northern Canada, which is rather inaccessible.

1.4.2.8 Tilt
The combination of horizontal and vertical motion changes the tilt of the surface. That is, locations farther north rise faster, an effect that becomes apparent in lakes. The bottoms of the lakes gradually tilt away from the direction of the former ice maximum, such that lake shores on the side of the maximum (typically north) recede and the opposite (southern) shores sink. This causes the formation of new rapids and rivers. The effects are alike to that concerning seashores, but occur above sea level. Tilting of land will also affect the flow of water in lakes and rivers in the future, and thus important for water resource management planning.
1.4.2.9 Gravity field
Ice, water and mantle rocks have mass, and as they move around, they exert a gravitational pull on other masses towards them. Thus, the gravity field, which is sensitive to all Masses on the surface and within the Earth, is affected by the redistribution of ice/melted water on the surface of the Earth and the flow of mantle rocks within.
Today, more than 6000 years after the last deglaciation terminated, the flow of mantle material back to the glaciated area causes the overall shape of the Earth to become less oblate. This change in the topography of Earth's surface affects the long-wavelength components of the gravity field.
The changing gravity field can be detected by repeated land measurements with absolute gravimeters and recently by the GRACE satellite mission. The change in long-wavelength components of Earth's gravity field also perturbs the orbital motion of satellites and has been detected by LAGEOS satellite motion.
1.4.2.10 Vertical datum
The vertical datum is a theoretical reference surface for altitude measurement and plays vital roles in many human activities, including land surveying and construction of buildings and bridges. Since postglacial rebound continuously deforms the crustal surface and the gravitational field, the vertical datum needs to be redefined repeatedly through time.
1.4.2.11 State of stress, intraplate earthquakes and volcanism
According to the hypothesis of plate tectonics, plate-plate interaction results in earthquakes near plate boundaries. However, large earthquakes are found in intraplate environment like eastern Canada (up to M7) and northern Europe (up to M5) which are far away from present-day plate boundaries. An important intraplate earthquake was the magnitude 8 New Madrid earthquake that occurred in mid-continental USA in the year 1811.
Glacial loads have provided more than 30 MPa of vertical stress in northern Canada and more than 20 MPa in northern Europe during the glacial maximum. This vertical stress is supported by the mantle and the flexure of the lithosphere. Since the mantle and the lithosphere continuously respond to the changing ice and water loads, the state of stress at any location continuously changes in time. The changes in the orientation of the state of stress are recorded in the postglacial faults in southeastern Canada. When the postglacial faults formed at the end of deglaciation 9000 years ago, the horizontal principal stress orientation was almost perpendicular to the former ice margin, but today the orientation is in the northeast-southwest, along the direction of seafloor spreading at the Mid-Atlantic Ridge. This shows that

the stress due to postglacial rebound had played an important role at deglacial time, but has gradually relaxed so that tectonic stress has become more dominant today.
According to the Mohr–Coulomb hypothesis of rock failure, large glacial loads generally suppress earthquakes, but rapid deglaciation promotes earthquakes. According to Wu & Hasagawa, the rebound stress that is available to trigger earthquakes today is of the order of 1 MPa. This stress level is not large enough to rupture intact rocks but is large enough to reactivate pre-existing faults that are close to failure. Thus, both postglacial rebound and past tectonics play important roles in today's intraplate earthquakes in eastern Canada and southeast USA. Generally postglacial rebound stress could have triggered the intraplate earthquakes in eastern Canada and may have played some role in triggering earthquakes in eastern USA including the New Madrid earthquakes of 1811. The situation in northern Europe today is complicated by the current tectonic activities nearby and by coastal loading and weakening.
Increasing pressure due to the weight of the ice during glaciation may have suppressed melt generation and volcanic activities below Iceland and Greenland. On the other hand, decreasing pressure due to deglaciation can increase the melt production and volcanic activities by 20-30 times.
1.4.2.12 Recent global warming
Recent global warming has caused mountain glaciers and the ice sheets in Greenland and Antarctica to melt and global sea level to rise. Consequently, monitoring sea level rise and the mass balance of ice sheets and glaciers allows us to understand more about global warming.
The recent rise in sea levels has been monitored by tide gauges and Satellite Altimetry (e.g. TOPEX/Poseidon). In addition to the addition of melted ice water from glaciers and ice sheets, recent sea level changes are also affected by the thermal expansion of sea water due to global warming, sea level change due to deglaciation of the last Ice Age (postglacial sea level change), deformation of the land and sea floor and other factors. Thus, to understand global warming from sea level change, one must be able to separate all these factors, especially postglacial rebound, since it is one of the leading factors.
Mass changes of ice sheets can be monitored by measuring changes in the ice surface height, the deformation of the ground below and the changes in the gravity field over the ice sheet. Thus ICESat, GPS and GRACE satellite mission are useful for such purpose. However, glacial isostatic adjustment of the ice sheets affect ground deformation and the gravity field today. Thus the understanding glacial isostatic adjustment is important in monitoring recent global warming.
One of the possible impacts of global warming-triggered a rebound may be most volcanic activity in previously ice-capped areas such as Iceland and Greenland. It may also trigger intraplate earthquakes near the ice margins of Greenland and Antarctica.
1.4.2.13 Applications
The speed and amount of postglacial rebound is determined by two factors: the viscosity or rheology (i.e., the flow) of the mantle, and the ice loading and unloading histories on the surface of Earth.
The viscosity of the mantle is important in understanding mantle convection, plate tectonics, dynamical processes in Earth, the thermal state and thermal evolution of Earth. However viscosity is difficult to observe because creep experiments of mantle rocks to take thousands of years to observe and the ambient temperature and pressure conditions are not easy to attain for a long enough time. Thus, the observations

of postglacial rebound provide a natural experiment to measure mantle rheology. Modelling of glacial isostatic adjustment addresses the question of how viscosity changes in the radial and lateral directions and whether the flow law is linear, nonlinear, or composite rheology.
Ice thickness histories are useful in the study of paleoclimatology, Glaciology and Paleo-oceanography. Ice thickness histories are traditionally deduced from the three types of information: First, the sea level data at stable sites far away from the centers of deglaciation give an estimate of how much water entered the oceans or equivalently how much ice was locked up at glacial maximum. Secondly, the location and dates of terminal moraines tell us the areal extent and retreat of past ice sheets. Physics of glaciers gives us the theoretical profile of ice sheets at equilibrium, it also says that the thickness and horizontal extent of equilibrium ice sheets are closely related to the basal condition of the ice sheets. Thus the volume of ice locked up is proportional to their instantaneous area. Lastly, the heights of ancient beaches in the sea level data and observed land uplift rates (e.g. from GPS or VLBI) can be used to constrain local ice thickness. A popular ice model deduced this way is the ICE5G model. Because the response of the Earth to changes in ice height is slow, it cannot record rapid fluctuation or surges of ice sheets, thus the ice sheet profiles deduced this way only gives the "average height" over a thousand years or so.
Glacial isostatic adjustment also plays an important role in understanding recent global warming and climate change.
1.4.2.14 Discovery
Before the 18th century, it was thought in Sweden that sea levels were falling. On the initiative of Anders Celsius a number of marks were made in rock on different locations along the Swedish coast. In 1765 it was possible to conclude that it was not a lowering of sea levels but an uneven rise of land. In 1865 Thomas Jamieson came up with a hypothesis that the rise of land was connected with the ice age that had been first discovered in 1837. The hypothesis were accepted after investigations by Gerard De Geer of old shorelines in Scandinavia published in 1890.
1.4.2.15 Legal status
In areas where the rising of land is seen, it is necessary to define the exact limits of the property. In Finland, the "new land" is legally the property of the owner of the water area, not any land owners on the shore. Consequently, if the owner of the land wishes to build a pier over the "new land", he needs the permission of the owner of the (former) water area. The landowner of the shore may redeem the new land at market price. Usually the owner of the water area is the partition unit of the landowners of the shores, a collective holding corporation.
1.4.3 Eustasy and relative sea level change
Eustasy is another cause of relative sea level change quite different from isostatic causes. The term eustasy or eustatic refers to changes in the amount of water in the oceans, usually due to global climate change. When the Earth's climate cools, a greater proportion of water is stored on land masses in the form of glaciers, snow, etc. This results in falling global sea levels (relative to a stable land mass). The refilling of sea basins by glacial meltwater at the end of ice ages is an example of eustatic sea level rise.
A second significant cause of eustatic sea level rise is thermal expansion of sea water when the Earth's mean temperature increases. Current estimates of the global eustatic rise from tide gauge records and satellite altimetry is about +3 mm/a. The global sea level is also affected by vertical crustal movements,

changes in the rotational rate of the Earth, large scale changes in continental margins and changes in the spreading rate of the sea floor.
When the term relative is used in context with sea level change, the implication is that both eustasy and isostasy are at work, or that the author does not know which cause to invoke.
Post-glacial rebound can also be a cause of rising sea levels. When the sea floor rises, which it continues to do in parts of the northern hemisphere, water is displaced and has to go elsewhere.
1.5 Interior of Earth
The interior structure of the Earth is layered in spherical shells, like an onion. These layers can be defined by either their chemical or their rheological properties. The earth has an outer silicate solid crust, a highly viscous mantle, a liquid outer core that is much less viscous than the mantle, and a solid inner core. Scientific understanding of Earth's internal structure is based on observations of topography and bathymetry, observations of rock in outcrop, samples brought to the surface from greater depths by volcanic activity, analysis of the seismic waves that pass through the Earth, measurements of the gravity field of Earth, and experiments with crystalline solids at pressures and temperatures characteristic of Earth's deep interior.
1.5.1 Assumptions
The force exerted by Earth's gravity can be used to calculate its mass, and by estimating the volume of the Earth, its average density can be calculated. Astronomers can also calculate Earth's mass from its orbit and effects on nearby planetary bodies.
1.5.2 Structure
The structure of the Earth can be defined in two ways: by mechanical properties such as theology, or chemically. Mechanically, it can be divided into lithosphere, asthenosphere, mesospheric mantle, outer core, and the inner core. The interior of the Earth is divided into 5 important layers. Chemically, Earth can be divided into the crust, upper mantle, lower mantle, outer core, and inner core. The geologic component layers of the Earth are in the following depths below the surface:
Depth Layer Kilometres Miles
0–60 0–37 Lithosphere (locally varies between 5 and 200 km) 0–35 0–22 … Crust (locally varies between 5 and 70 km) 35–60 22–37 … Uppermost part of mantle
35–2,890 22–1,790 Mantle 100–200 62–125 … Asthenosphere 35–660 22–410 … Upper mesosphere (upper mantle)
660–2,890 410–1,790 … Lower mesosphere (lower mantle) 2,890–5,150 1,790–3,160 Outer core 5,150–6,360 3,160–3,954 Inner core
The layering of Earth has been inferred indirectly using the time of travel of refracted and reflected seismic waves created by earthquakes. The core does not allow shear waves to pass through it, while the speed of travel (seismic velocity) is different in other layers. The changes in seismic velocity between different layers causes refraction owing to Snell's law, like light bending as it passes through a prism. Likewise, reflections are caused by a large increase in seismic velocity and are alike to light reflecting from a mirror.
1.5.3 Core
1.5.3.1 Inner core
The inner core of the Earth, its innermost part, is a primarily solid ball with a radius of about 1,220 km (760 mi), according to seismological studies. (This is about 70% of the length of the Moon's radius.) It is believed to consist primarily of an iron–nickel alloy, and to be about the same temperature as the surface of the Sun: approximately 5700 K (5430 °C).
The Earth was discovered to have a solid inner core distinct from its liquid outer core in 1936, by the seismologist Inge Lehmann, who deduced its presence from observations of earthquake-generated seismic waves that reflect off the boundary of the inner core and can be detected by sensitive seismographs on the Earth's surface. This boundary is known as the Bullen discontinuity, or sometimes as the Lehmann discontinuity. A few years later, in 1940, it was hypothesized that this inner core was made of solid iron; its rigidity was confirmed in 1971.
The outer core was determined to be liquid from observations showing that compressional waves pass through it, but elastic shear waves do not – or do so only very weakly. The solidity of the inner core had been difficult to establish because the elastic shear waves that are expected to pass through a solid mass are very weak and difficult for seismographs on the Earth's surface to detect, since they become so attenuated on their way from the inner core to the surface by their passage through the liquid outer core. Dziewonski and Gilbert established that measurement of normal modes of vibration of Earth caused by large earthquakes were consistent with a liquid outer core. Recent claims that shear waves have been detected passing through the inner core were initially controversial, but are now gaining acceptance.
1.5.3.1.1 Composition
Based on the relative prevalence of various chemical elements in our solar system, the hypothesis of planetary formation, and constraints imposed or implied by the chemistry of the rest of the Earth's volume, the inner core is believed to consist primarily of a nickel-iron alloy known as NiFe: 'Ni' for a nickel, and 'Fe' for Ferrum or iron. Because the inner core is denser (12.8 ~ 13.1) g⁄cm³ than pure iron or nickel, even under heavy pressures, it is believed that the core also contains enough gold, platinum and other siderophile elements that if extracted and poured onto the Earth's surface it would cover the entire Earth with a coating 0.45 m (1.5 feet) deep. The fact that precious metals and other heavy elements are so much more abundant in the Earth's inner core than in its crust is explained by the hypothesis of the so-called iron catastrophe, an event that occurred before the first eon during the accretion phase of the early Earth.

1.5.3.1.2 Temperature and pressure
The temperature of the inner core can be estimated by considering both the theoretical and the experimentally demonstrated constraints on the melting temperature of impure iron at the pressure which iron is under at the boundary of the inner core (about 330 GPa). These considerations suggest that its temperature is about 5,700 K (5,430 °C; 9,800 °F). The pressure in the Earth's inner core is slightly higher than it is at the boundary between the outer and inner cores: it ranges from about 330 to 360 gigapascals (3,300,000 to 3,600,000 atm). Iron can be solid at such high temperatures only because its melting temperature increases dramatically at pressures of that magnitude.
A report published in Science concludes that the melting temperature of iron at the inner core boundary is 6230 ± 500 Kelvin, roughly 1000 degrees Kelvin higher than previous estimates.
1.5.3.1.3 Dynamics
The Earth's inner core is slowly growing as the liquid outer core at the boundary with the inner core cools and solidifies due to the gradual cooling of the Earth's interior (about 100 degrees Celsius per billion years). Many scientists had initially expected that, because the solid inner core was originally formed by a gradual cooling of molten material, and continues to grow as a result of that same process, the inner core would be found to be homogeneous. It was even suggested that Earth's inner core might be a single crystal of iron. However, this prediction was disproved by observations indicating that in fact there is a degree of disorder within the inner core. Seismologists have found that the inner core is not completely uniform, but instead contains large-scale structures such that seismic waves pass more rapidly through some parts of the inner core than through others. In addition, the properties of the inner core's surface vary from place to place across distances as small as 1 km. This variation is surprising, since lateral temperature variations along the inner-core boundary are known to be extremely small (this conclusion is confidently constrained by magnetic field observations). Recent discoveries suggest that the solid inner core itself is composed of layers, separated by a transition zone about 250 to 400 km thick. If the inner core grows by small frozen sediments falling onto its surface, then some liquid can also be trapped in the pore spaces and some of this residual fluid may still persist to some small degree in much of its interior.
Because the inner core is not rigidly connected to the Earth's solid mantle, the possibility that it rotates slightly faster or slower than the rest of Earth has long been entertained. In the 1990s, seismologists made various claims about detecting this kind of super-rotation by observing changes in the characteristics of seismic waves passing through the inner core over several decades, using the aforementioned property that it transmits waves faster in some directions. Estimates of this super-rotation are around one degree of an extra rotation per year.
Growth of the inner core is thought to play an important role in the generation of Earth's magnetic field by dynamo action in the liquid outer core. This occurs mostly because it cannot dissolve the same amount of light elements as the outer core and consequently freezing at the inner core boundary produces a residual liquid that contains more light elements than the overlying liquid. This causes it to become buoyant and helps drive convection of the outer core. The existence of the inner core also changes the dynamic motions of the liquid in the outer core as it grows and may help fix the magnetic field since it is expected to be a great deal more resistant to flow than the outer core liquid (which is expected to be turbulent).
Speculation also continues that the inner core might have exhibited a variety of internal deformation patterns. This may be necessary to explain why the seismic waves pass more rapidly in some directions than in others. Because thermal convection alone appears to be improbable, any buoyant convection
motions will have to be driven by variations in composition or abundance of liquid in its interior. S. Yoshida and colleagues proposed a novel mechanism whereby deformation of the inner core can be caused by a higher rate of freezing at the equator than at polar latitudes, and S. Karato proposed that changes in the magnetic field might also deform the inner core slowly over time.
There is an East–West asymmetry in the inner core seismological data. There is a model which explains this by differences at the surface of the inner core – melting in one hemisphere and crystallization in the other.
1.5.3.1.4 History
Extrapolating from observations of the cooling of the inner core, it is estimated that the current solid inner core formed approximately 2 to 4 billion years ago from what was originally an entirely molten core. If true, this would mean that the Earth's solid inner core is not a primordial feature that was present during the planet's formation, but a feature younger than the age of the Earth (about 4.5 billion years).
1.5.3.2 Outer core The outer core of the Earth is a liquid layer about 2,266 km (1,408 mi) thick composed of iron and nickel which lies above the Earth's solid inner core and below its mantle. Its outer boundary lies 2,890 km (1,800 mi) beneath the Earth's surface. The transition between the inner core and outer core is located approximately 5,150 km (3,200 mi) beneath the Earth's surface.
1.5.3.2.1 Properties
The temperature of the outer core ranges from 4400 °C (8000 °F) in the outer regions to 6100 °C (11000 °F) near the inner core. Because of its high temperature, modeling work has shown that the outer core is a low viscosity fluid (about ten times the viscosity of liquid metals at the surface) that convects turbulently. Eddy currents in the nickel iron fluid of the outer core are believed to influence the Earth's magnetic field. The average magnetic field strength in the Earth's outer core was measured to be 25 gauss, 50 times stronger than the magnetic field at the surface. The outer core is not under enough pressure to be solid, so it is liquid even though it has a composition alike to that of the inner core. Sulfur and oxygen could also be present in the outer core.
As heat is transferred outward toward the mantle, the net trend is for the inner boundary of the liquid region to freeze, causing the solid inner core to grow. This growth rate is estimated to be 1 mm per year.
1.5.3.2.2 Effect on life
Without the outer core, life on Earth would be very different. Convection of liquid metals in the outer core creates the Earth's magnetic field. This magnetic field extends outward from the Earth for several thousand kilometers, and creates a protective bubble around the Earth that deflects the solar wind. Without this field, a larger proportion of the solar wind would directly strike the Earth's atmosphere. The presumed effect would be to strip the Earth's atmosphere away slowly. This is hypothesized to have happened to the Martian atmosphere, rendering the planet incapable of supporting life.
1.5.4 Mantle
The mantle is a part of a terrestrial planet or other rocky body large enough to have differentiation by density. The interior of the Earth, alike to the other terrestrial planets, is chemically divided into layers. The mantle is a layer between the crust and the outer core. The earth's mantle is a silicate rocky shell about 2,900 km (1,800 mi) thick that constitutes about 84% of Earth's volume. It is predominantly solid but in geological time it behaves like very viscous liquid. The mantle encloses the hot core rich in iron and nickel, which occupies about 15% of Earth's volume. Past episodes of melting and volcanism at the shallower levels of the mantle have produced a thin crust of crystallized melts products near the surface, upon which we live. Information about the structure and composition of the mantle either result from the geophysical investigation or from direct geoscientific analyses on Earth's mantle derived xenoliths.
Two main zones are distinguished in the upper mantle: the inner asthenosphere composed of plastic flowing rock about 200 km thick, and the lowermost part of the lithosphere composed of rigid rock about 50 to 120 km thick. A thin crust, the upper part of the lithosphere, surrounds the mantle and is about 5 to 75 km thick.
In some places under the sea the mantle is actually exposed on the surface of the Earth. There are also a few places on land where mantle rock has been pushed to the surface by tectonic activity, most notably the Tablelands region of Gros Morne National Park in the Canadian province of Newfoundland and Labrador.
1.5.4.1 Structure
The mantle is divided into sections which are based upon results from seismology. These layers (and their thicknesses/depths) are the following: the upper mantle (starting at the Moho, or base of the crust around 7 to 35 km downward to 410 km), the transition zone (410–660 km), the lower mantle (660–2891 km), and anomalous core–mantle boundary with a variable thickness (on average ~200 km thick).
The top of the mantle is defined by a sudden increase in seismic velocity, which was first noted by Andrija Mohorovičić in 1909; this boundary is now referred to as the "Mohorovičić discontinuity" or "Moho". The uppermost mantle plus overlying crust is relatively rigid and form the lithosphere, an irregular layer with a maximum thickness of perhaps 200 km. Below the lithosphere the upper mantle becomes notably more plastic. In some regions below the lithosphere, the seismic velocity is reduced; this so-called low-velocity zone (LVZ) extends down to a depth of several hundred km. Inge Lehmann discovered a seismic discontinuity at about 220 km depth; although this discontinuity has been found in other studies, it is not known whether the discontinuity is ubiquitous. The transition zone is an area of great complexity; it physically separates the upper and lower mantle. Very little is known about the lower mantle apart from that it appears to be relatively seismically homogeneous. The D" layer at the core–mantle boundary separates the mantle from the core.
1.5.4.2 Characteristics
The mantle differs substantially from the crust in its mechanical properties which is the direct consequence of chemical composition change (expressed as different mineralogy). The distinction between crust and mantle is based on chemistry, rock types, rheology and seismic characteristics. The crust is a solid product of mantle derived melts, expressed as various degrees of partial melting products during geologic time. Partial melting of mantle material is believed to cause incompatible elements to separate from the mantle, with a less dense material floating upward through the pore spaces, cracks, or

fissures, that would subsequently cool and solidify on the surface. Typical mantle rocks have a higher magnesium to iron ratio and a smaller proportion of silicon and aluminium than the crust. This behavior is also predicted by experiments that partly melt rocks thought to be representative of Earth's mantle.
Mantle rocks shallower than about 410 km depth consist mostly of olivine, pyroxenes, spinel-structure minerals, and garnet; typical rock types are thought to be peridotite, dunite (olivine-rich peridotite), and eclogite. Between about 400 km and 650 km depth, olivine is not stable and is replaced by high pressure polymorphs with approximately the same composition: one polymorph is wadsleyite (also called beta-spinel type), and the other is ringwoodite (a mineral with the gamma-spinel structure). Below about 650 km, all of the minerals of the upper mantle begin to become unstable. The most abundant minerals present, the silicate perovskites, have structures (but not compositions) like that of the mineral perovskite followed by the magnesium/iron oxide ferropericlase. The changes in mineralogy at about 400 and 650 km yield distinctive signatures in seismic records of the Earth's interior, and like the moho, are readily detected using seismic waves. These changes in mineralogy may influence mantle convection, as they result in density changes and they may absorb or release latent heat as well as depressed or elevate the depth of the polymorphic phase transitions for regions of different temperatures. The changes in mineralogy with depth have been investigated by laboratory experiments that duplicate high mantle pressures, such as those using the diamond anvil.
Composition of Earth's mantle in weight percent
Element Amount
Compound Amount
O 44.8
Si 21.5 SiO2 46
Mg 22.8 MgO 37.8
Fe 5.8 FeO 7.5
Al 2.2 Al2O3 4.2
Ca 2.3 CaO 3.2
Na 0.3 Na2O 0.4
K 0.03 K2O 0.04
Sum 99.7 Sum 99.1
The inner core is solid, the outer core is liquid, and the mantle solid/plastic. This is because of the relative melting points of the different layers (nickel-iron core, silicate crust and mantle) and the increase in temperature and pressure as depth increases. At the surface both nickel-iron alloys and silicates are sufficiently cool to be solid. In the upper mantle, the silicates are generally solid (localized regions with small amounts of melt exist); however, as the upper mantle is both hot and under relatively little pressure, the rock in the upper mantle has a relatively low viscosity. In contrast, the lower mantle is under tremendous pressure and consequently has a higher viscosity than the upper mantle. The metallic nickel-iron outer core is liquid because of the high pressure and temperature. As the pressure exponentially increases, the nickel-iron inner core becomes solid because the melting point of iron increases dramatically at these high pressures.
1.5.4.3 Temperature
In the mantle, temperatures range between 500 to 900 °C (932 to 1,652 °F) at the upper boundary with the crust; to over 4,000 °C (7,230 °F) at the boundary with the core. Although the higher temperatures far exceed the melting point of the mantle rocks at the surface (about 1200 °C for representative peridotite), the mantle is almost exclusively solid. The enormous lithostatic pressure exerted on the mantle prevents melting, because the temperature at which melting begins (the solidus) increases with pressure.
1.5.4.4 Movement
Because of the temperature difference between the Earth's surface and outer core and the ability of the crystalline rocks at high pressure and temperature to undergo slow, creeping, viscous-like deformation over millions of years, there is a convective material circulation in the mantle. Hot material upwells, while cooler (and heavier) material sinks downward. The downward motion of material occurs at convergent plate boundaries called subduction zones. Locations on the surface that lie over plumes are predicted to have high elevation (because of the buoyancy of the hot, less-dense plume beneath) and to exhibit hot spot volcanism. The volcanism often attributed to deep mantle plumes is alternatively explained by passive extension of the crust, permitting magma to leak to the surface (the "Plate" hypothesis).
The convection of the Earth's mantle is a chaotic process (in the sense of fluid dynamics), which is thought to be an integral part of the motion of the plates. Plate motion should not be confused with continental drift which applies purely to the movement of the crustal components of the continents. The movements of the lithosphere and the underlying mantle are coupled since descending lithosphere is an essential component of convection in the mantle. The observed continental drift is a complicated relationship between the forces causing oceanic lithosphere to sink and the movements within Earth's mantle.
Although there is a tendency to larger viscosity at greater depth, this relation is far from linear and shows layers with dramatically decreased viscosity, in particular in the upper mantle and at the boundary with the core. The mantle within about 200 km above the core-mantle boundary appears to have distinctly different seismic properties than the mantle at slightly shallower depths; this unusual mantle region just above the core is called D″ ("D double-prime"), a nomenclature introduced over 50 years ago by the geophysicist Keith Bullen. D″ may consist of material from subducted slabs that descended and came to rest at the core-mantle boundary and/or from a new mineral polymorph discovered in perovskite called post-perovskite.
Earthquakes at shallow depths are a result of stick-slip faulting; however, below about 50 km the hot, high pressure conditions ought to inhibit further seismicity. The mantle is considered to be viscous and incapable of brittle faulting. However, in subduction zones, earthquakes are observed down to 670 km. A number of mechanisms have been proposed to explain this phenomenon, including dehydration, thermal runaway, and phase change. The geothermal gradient can be lowered where cool material from the surface sinks downward, increasing the strength of the surrounding mantle, and allowing earthquakes to occur down to a depth of 400 km and 670 km.
The pressure at the bottom of the mantle is ~136 GPa (1.4 million atm). Pressure increases as depth increases, since the material beneath has to support the weight of all the material above it. The entire mantle, however, is thought to deform like a fluid on long time scales, with permanent plastic deformation accommodated by the movement of point, line, and/or planar defects through the solid

crystals comprising the mantle. Estimates for the viscosity of the upper mantle range between 10 and 10 Pa·s, depending on depth, temperature, composition, state of stress, and numerous other factors. Thus, the upper mantle can only flow very slowly. However, when large forces are applied to the uppermost mantle it can become weaker, and this effect is thought to be important in allowing the formation of tectonic plate boundaries.
1.5.4.5 Exploration
Exploration of the mantle is generally conducted at the seabed rather than on land because of the relative thinness of the oceanic crust as compared to the significantly thicker continental crust.
The first attempt at mantle exploration, known as Project Mohole, was abandoned in 1966 after repeated failures and cost over-runs. The deepest penetration was approximately 180 m (590 ft). In 2005 an oceanic borehole reached 1,416 meters (4,646 ft) below the sea floor from the ocean drilling vessel JOIDES Resolution.
On 5 March 2007, a team of scientists on board the RRS James Cook embarked on a voyage to an area of the Atlantic seafloor where the mantle lies exposed without any crust covering, midway between the Cape Verde Islands and the Caribbean Sea. The exposed site lies approximately three kilometers beneath the sea surface and covers thousands of square kilometers. A relatively difficult attempt to retrieve samples from the Earth's mantle was scheduled for later in 2007. The Chikyu Hakken mission attempted to use the Japanese vessel 'Chikyu' to drill up to 7,000 m (23,000 ft) below the seabed. This is nearly three times as deep as preceding oceanic drillings.
A novel method of exploring the uppermost few hundred kilometers of the Earth was recently proposed, consisting of a small, dense, heat-generating probe which melts its way down through the crust and mantle while its position and progress are tracked by acoustic signals generated in the rocks. The probe consists of an outer sphere of tungsten about one meter in diameter with a cobalt-60 interior acting as a radioactive heat source. It was calculated that such a probe will reach the oceanic Moho in less than 6 months and attain minimum depths of well over 100 km in a few decades beneath both oceanic and continental lithosphere.
Exploration can also be aided through computer simulations of the evolution of the mantle. In 2009, a supercomputer application provided new insight into the distribution of mineral deposits, especially isotopes of iron, from when the mantle developed 4.5 billion years ago.
1.5.5 Crust In geology, the crust is the outermost solid shell of a rocky planet or natural satellite, which is chemically distinct from the underlying mantle. The crusts of the Earth, our Moon, Mercury, Venus, Mars, Io, and other planetary bodies have been generated largely by igneous processes, and these crusts are richer in incompatible elements than their respective mantles.
1.5.5.1 Earth's crust and mantle
The crust of the Earth is composed of a great variety of igneous, metamorphic, and sedimentary rocks. The crust is underlain by the mantle. The upper part of the mantle is composed mostly of peridotite, a rock denser than rocks common in the overlying crust. The boundary between the crust and mantle is
conventionally placed at the Mohorovičić discontinuity, a boundary defined by a contrast in seismic velocity. The crust occupies less than 1% of Earth's volume.
The oceanic crust of the sheet is different from its continental crust. The oceanic crust is 5 km (3 mi) to 10 km (6 mi) thick and is composed primarily of basalt, diabase, and gabbro. The continental crust is typically from 30 km (20 mi) to 50 km (30 mi) thick and is mostly composed of slightly less dense rocks than those of the oceanic crust. Some of these less dense rocks, such as granite, are common in the continental crust but rare to absent in the oceanic crust. Both the continental and oceanic crust "float" on the mantle. Because the continental crust is thicker, it extends both above and below the oceanic crust. The slightly lighter density of felsic continental rock compared to basaltic sea rock contributes to the higher relative elevation of the top of the continental crust. Because the top of the continental crust is above that of the oceanic, water runs off the continents and collects above the oceanic crust. The continental crust and the oceanic crust are sometimes called sial and sima respectively. Because of the change in velocity of seismic waves it is believed that on continents at a certain depth sial becomes close in its physical properties to sima, and the dividing line is called the Conrad discontinuity.
The temperature of the crust increases with depth, reaching values typically in the range from about 200 °C (392 °F) to 400 °C (752 °F) at the boundary with the underlying mantle. The crust and underlying relatively rigid uppermost mantle make up the lithosphere. Because of convection in the underlying plastic (although non-molten) upper mantle and asthenosphere, the lithosphere is broken into tectonic plates that move. The temperature increases by as much as 30 °C (about 50 °F) for every kilometer locally in the upper part of the crust, but the geothermal gradient is smaller in deeper crust.
Partly by analogy to what is known about our Moon, Earth is considered to have differentiated from an aggregate of planetesimals into its core, mantle and crust within about 100 million years of the formation of the planet, 4.6 billion years ago. The primordial crust was very thin and was probably recycled by much more vigorous plate tectonics and destroyed by significant asteroid impacts, which were much more common in the early stages of the solar system.
The Earth has probably always had some form of basaltic crust, but the age of the oldest oceanic crust today is only about 200 million years. In contrast, the bulk of the continental crust is much older. The oldest continental crustal rocks on Earth have ages in the range from about 3.7 to 4.28 billion years and have been found in the Narryer Gneiss Terrane in Western Australia, in the Acasta Gneiss in the Northwest Territories on the Canadian Shield, and on other cratonic regions such as those on the Fennoscandian Shield. Some zircon with age as great as 4.3 billion years has been found in the Narryer Gneiss Terrane.
The average age of the current Earth's continental crust has been estimated to be about 2.0 billion years. Most crustal rocks formed before 2.5 billion years ago are located in cartons. Such old continental crust and the underlying mantle asthenosphere are less dense than elsewhere in the earth and so are not readily destroyed by subduction. Formation of new continental crust is linked to phases of intense orogeny; these phases coincide with the formation of the supercontinents such as Rodinia, Pangaea and Gondwana. The crust forms in part by aggregation of island arcs including granite and metamorphic fold belts, and it is preserved in part by depletion of the underlying mantle to form buoyant lithospheric mantle.
1.5.5.2 Composition
The continental crust has an average composition alike to that of andesite. Continental crust is enriched in incompatible elements compared to the basaltic sea crust and much enriched compared to the underlying

mantle. Although the continental crust comprises only about 0.6 weight percent of the silicate on Earth, it contains 20% to 70% of the incompatible elements.
Oxide Percent
SiO2 60.6
Al2O3 15.9
CaO 6.4
MgO 4.7
Na2O 3.1
Fe as FeO 6.7
K2O 1.8
TiO2 0.7
P2O5 0.1
All the other constituents except water occur only in very small quantities and total less than 1%. Estimates of average density for the upper crust range between 2.69 and 2.74 g/cm3 and for lower crust between 3.0 and 3.25 g/cm3.
1.5.6 Hollow Earth
The Hollow Earth hypothesis proposes that the planet Earth is either entirely hollow or otherwise contains a substantial interior space. The hypothesis has been shown to be wrong by observational evidence, as well as by the modern understanding of planet formation; the scientific community has dismissed the notion since at least the late 18th century.
The concept of a hollow Earth still recurs in folklore and as the premise for subterranean fiction, a subgenre of adventure fiction. It is also featured in some present-day pseudoscientific and conspiracy theories.
1.5.6.1 Hypotheses
1.5.6.1.1 Ancient history
In ancient times, the concept of a subterranean land inside the earth appeared in mythology, folklore and legends. The idea of subterranean realms seemed arguable, and became intertwined with the concept of "places" of origin or the afterlife, such as the Greek underworld, the Nordic Svartálfaheimr, the Christian Hell, and the Jewish Sheol (with details describing inner Earth in Kabalistic literature, such as the Zohar

and Hesed L'Avraham). The idea of a subterranean realm is also mentioned in Tibetan Buddhism belief, according to one story there is an ancient city called Shamballa which is located inside the earth.
According to the Ancient Greeks there were caverns under the surface which were entrances leading to the underworld, some of which were the caverns at Tainaron in Lakonia, at Trozien in Argolis, at Ephya in Thesprotia, at Herakleia in Pontos, and in Ermioni. In Thracians and Dacians legend it is said that there are underground chambers occupied by an ancient God called Zalmoxis. In Mesopotamian religion there is a story of a man who, after traveling through the darkness of a tunnel in the mountain of "Mashu", entered a subterranean garden.
In Celtic mythology there is a legend of a cave called "Cruachan," also known as "Ireland's gate to Hell," a legendary and ancient cave from which according to legend strange creatures would emerge in ancient times and be seen on the surface of the earth. There are also stories of medieval knights and saints who went on pilgrimages to a cave located in Station Island, County Donegal in Ireland, where they made journeys inside the earth into a place of purgatory. There is an Irish myth which says tunnels in County Down, Northern Ireland lead to the land of the subterranean Tuatha de Danaan, a group of people who are believed to have introduced Druidism to Ireland, and then went back underground.
An ancient legend of the Angami Naga tribes of India claims that their ancestors emerged in ancient times from a subterranean land inside the earth. There are legends of the Taíno people that their ancestors emerged in ancient times from two caves in a mountain underground.
It is the belief of the natives of the Malinowski's Trobriand Islands that their ancestors had come from a subterranean land through a cavern hole called "Obukula". There is an ancient legend held in Mexican folklore that a cave in a mountain five miles south of Ojinaga, Mexico is possessed by devilish creatures who came from inside the earth.
There was an ancient myth held in the middle ages that some mountains located between Eisenach and Gotha in Germany hold a portal to the inner earth. There is an old Russian legend that says the Samoyeds, an ancient Siberian tribe, traveled to an underground cavern city to live inside the earth.
In Native American mythology, it is said that the ancestors of the Mandan people in ancient times emerged from a subterranean land through a cave at the north side of the Missouri River. There is also a tale about a tunnel in the San Carlos Apache Indian Reservation in Arizona near Cedar Creek which is said to lead inside the earth to a land inhabited by a mysterious tribe. It is also the belief of the tribes of the Iroquois that their ancient ancestors emerged from a subterranean world inside the earth. The elders of the Hopi people believe that a Sipapu entrance in the Grand Canyon exists which leads to the underworld.
According to South American mythology the belief of the Brazilian Indians, who live alongside the Parima River in Brazil, claim that their forefathers emerged in ancient times from an underground land, and that many of their ancestors still remained inside the earth. There are also legends that say the ancestors of the Inca Empire came from underground caves which are located east of Cuzco, Peru.
1.5.6.1.2 17th and 18th centuries
Edmond Halley in 1692 put forth the idea of Earth consists of a hollow shell about 800 km (500 mi) thick, two inner concentric shells and an innermost core, about the diameters of the planets Venus, Mars, and Mercury. Atmospheres separate these shells, and each shell has its own magnetic poles. The spheres rotate at different speeds. Halley proposed this scheme in order to explain anomalous compass readings.
He envisaged the atmosphere inside as luminous (and possibly inhabited) and speculated that escaping gas caused the Aurora Borealis.
De Camp and Ley have claimed (in their Lands Beyond) that Leonhard Euler also proposed a hollow-Earth idea, getting rid of multiple shells and postulating an interior sun 1,000 km (620 mi) across to provide light to advanced inner-Earth civilization but they provide no references; indeed, Euler did not propose a hollow-Earth, but there is a slightly related thought experiment.
De Camp and Ley also claim that Sir John Leslie extended on Euler's idea, suggesting two central suns named Pluto and Proserpine (this was unrelated to the dwarf planet Pluto, which was discovered and named some time later). Leslie did propose a hollow Earth in his 1829 Elements of Natural Philosophy (pp. 449–453), but does not mention interior suns.
Le Clerc Milfort in 1781 led a journey with hundreds of Creek Indians to a series of caverns near the Red River above the junction of the Mississippi river, according to Milfort the original Creek Indian ancestors are believed to have emerged out to the surface of the earth in ancient times from the caverns. Milfort also claimed the caverns they saw "could easily contain 15,000 – 20,000 families."
1.5.6.1.3 19th century
In 1818, John Cleves Symmes, Jr. suggested that the Earth consisted of a hollow shell about 1,300 km (810 mi) thick, with openings about 2,300 km (1,400 mi) across at both poles with 4 inner shells each open at the poles. Symmes became the most famous of the early Hollow Earth proponents. He proposed making an expedition to the North Pole hole, thanks to the efforts of one of his followers, James McBride. United States president John Quincy Adams indicated he would approve of this but he left office before this could occur. The new President of the United States, Andrew Jackson, halted the attempt. It is possible this is the source of the (untrue) legend that Jackson believed in a Flat Earth, and was consequently the only United States president to do so.
Jeremiah Reynolds also delivered lectures on the "Hollow Earth" and argued for an expedition. Reynolds went on an expedition to Antarctica himself but missed joining the Great U.S. Exploring Expedition of 1838–1842, even though that venture was a result of his agitation.
Though Symmes himself never wrote a book about his ideas, several authors published works discussing his ideas. McBride wrote Symmes' Hypothesis of Concentric Spheres in 1826. It appears that Reynolds has an article that appeared as a separate booklet in 1827: Remarks of Symmes' Hypothesis Which Appeared in the American Quarterly Review. In 1868, a professor W.F. Lyons published The Hollow Globe which put forth a Symmes-like Hollow Earth hypothesis, but failed to mention Symmes himself. Symmes's son Americus then published The Symmes' Hypothesis of Concentric Spheres in 1878 to set the record straight.
1.5.6.1.4 20th century
An early twentieth-century proponent of a hollow Earth, William Reed, wrote Phantom of the Poles in 1906. He supported the idea of a hollow Earth, but without interior shells or inner sun.
The spiritualist writer Walburga, Lady Paget in her book Colloquies with an unseen friend (1907) was an early writer to mention the hollow earth hypothesis . She claimed that cities exist beneath a desert, which
is where the people of Atlantis moved. She said an entrance to the subterranean kingdom will be discovered in the 21st century.
William Fairfield Warren, in his book, Paradise Found: The Cradle of the Human Race at the North Pole presented his belief that humanity originated on a continent in the Arctic called Hyperborea. This influenced some early hollow earth theorists. According to Marshall Gardner, both the Eskimo and Mongolian peoples had come from the interior of the earth by an entrance at the North pole.
Marshall Gardner wrote A Journey to the Earth's Interior in 1913 and published an extended edition in 1920. He placed an interior sun in the Earth and built a working model of the hollow Earth which patented (U.S. Patent 1,096,102). Gardner made no mention of Reed, but did criticize Symmes for his ideas. About the same time Vladimir Obruchev wrote a novel Plutonia, in which the hollow Earth possessed an inner sun and was inhabited by prehistoric species. The interior was connected with the surface by an opening in the Arctic.
Explorer Ferdynand Ossendowski wrote a book in 1922 titled Beasts, Men and Gods. Ossendowski said he was told about a subterranean kingdom exists inside the earth. It was known to Buddhists as Agharti.
George Papashvily in his Anything Can Happen (1940) claimed the discovery in the Caucasus mountains of a cavern containing human skeletons "with heads as big as bushel baskets" and an ancient tunnel leading to the center of the earth. One man entered the tunnel and never returned.
Novelist Lobsang Rampa in his book The Cave of the Ancients said an underground chamber system exists beneath the Himalayas of Tibet, filled with ancient machinery, records and treasure. Michael Grumley a cryptozoologist has linked Bigfoot and other hominid cryptids to ancient tunnel systems underground.
Douglas Baker wrote in one of his books that he had an astral journey to the inner earth where he observed a subterranean civilization. Other occult writers such as Guy Ballard and Alice Bailey have written that they have had out of body experiences and met mysterious beings inside of the earth.
According to the ancient astronaut writer Peter Kolosimo a robot was seen entering a subterranean tunnel below a monastery in Mongolia, he also claimed a light was seen from underground in Azerbaijan. Kolosimo and other ancient astronaut writers such as Robert Charroux linked these activities to UFOs.
A book allegedly by a "Dr. Raymond Bernard" which appeared in 1964, The Hollow Earth, exemplifies the idea of UFOs coming from inside the earth. The book rehashes Reed and Gardner's ideas and ignores Symmes. Bernard also adds his own ideas: the Ring Nebula proves the existence of hollow worlds, as well as speculation on the fate of Atlantis and the origin of flying saucers. Bernard argued that the inhabitants of Atlantis took refuge in the Earth's interior before the city was destroyed in great calamity. It was Atlanteans who piloted the flying machines known in ancient India as vimanas and in the modern world as flying saucers. After the US bombings of Hiroshima and Nagasaki, Bernard claimed, the Atlanteans became concerned that radioactive air might flow into the world's interior, and so some emerged in their flying saucers in an act of self-defense. An article by Martin Gardner revealed that Dr. Walter Siegmeister used the pseudonym `Bernard', but not until the publishing of Walter Kafton-Minkel's Subterranean Worlds: 100,000 years of dragons, dwarves, the dead, lost races & UFOs from inside the Earth, in 1989, did the full story of Bernard/Siegmeister become well known.
The pages of the science fiction pulp magazine Amazing Stories promoted one such idea from 1945 to 1949 as "the Shaver Mystery". The magazine's editor, Ray Palmer, ran a series of stories by Richard
Sharpe Shaver supposedly claimed as fact, though presented in the context of fiction. Shaver claimed that a superior pre-historic race had built a honeycomb of caves in the Earth, and that their degenerate descendants, known as "Dero", live there still, using the fantastic machines abandoned by the ancient races to torment those of us living on the surface. As one characteristic of this torment, Shaver explained "voices" that purportedly came from no explainable source. Thousands of readers wrote to affirm that they, too, had heard the fiendish voices from inside the Earth. The writer David Hatcher Childress authored Lost Continents and the Hollow Earth (1998) in which he reprinted the stories of Palmer and defended the hollow earth idea based on alleged tunnel systems beneath South America and central Asia.
Hollow earth theorists have claimed a number of different locations for the entrances which lead inside the earth. Other than the North and South poles, entrances in locations which have been cited include: Paris in France, Staffordshire in England, Montreal in Canada, Hangchow in China, and the Amazon Rainforest.
Fantastic stories (supposedly believed as factual within fringe circles) have also circulated that Adolf Hitler and some of his followers escaped to hollow lands within the Earth after World War II via an entrance in Antarctica.
1.5.6.1.5 21st century
In 2011, Horatio Valens and Paul Veneti presented a two-hour "Lazeria Map Collection" video on centuries-old maps of the Arctic region and the North Pole, making a case for a 100-mile wide canyon in the center of the physical North Pole, in which north-flowing rivers drain into a hollow Earth. The maps were collected by Harry Hubbard.
1.5.6.2 Concave hollow Earths
Instead of saying that humans live on the outside surface of a hollow planet — sometimes called a "convex" hollow-Earth hypothesis — some have claimed humans live on the inside surface of a hollow spherical world, so that our universe itself lies in that world's interior. This has been called the "concave" hollow-Earth hypothesis.
Cyrus Teed, a doctor from upstate New York, proposed such a concave hollow Earth in 1869, calling his scheme "Cellular Cosmogony". Teed founded a group called the Koreshan Unity based on this notion, which he called Koreshanity. The main colony survives as a preserved Florida state historic site, at Estero, Florida, but all of Teed's followers have now died. Teed's followers claimed to have experimentally verified the concavity of the Earth's curvature, through surveys of the Florida coastline making use of "rectilinear" equipment.
Several twentieth-century German writers, including Peter Bender, Johannes Lang, Karl Neupert, and Fritz Braun, published works advocating the hollow Earth hypothesis, or Hohlweltlehre. It has even been reported, although apparently without historical documentation, that Adolf Hitler was influenced by concave hollow-Earth ideas and sent an expedition in an unsuccessful attempt to spy on the British fleet by pointing infrared cameras up at the sky.
The Egyptian mathematician Mostafa Abdelkader wrote several scholarly papers working out a detailed mapping of the concave Earth model.

In one chapter of his book On the Wild Side (1992), Martin Gardner discusses the hollow Earth model articulated by Abdelkader. According to Gardner, this hypothesis posits that light rays travel in circular paths, and slow as they approach the center of the spherical star-filled cavern. No energy can reach the center of the cavern, which corresponds to no point a finite distance away from Earth in the widely accepted scientific cosmology. A drill, Gardner says, would lengthen as it traveled away from the cavern and eventually pass through the "point at infinity" corresponding to the center of the Earth in the widely accepted scientific cosmology. Supposedly no experiment can distinguish between the two cosmologies.
Gardner notes that "most mathematicians believe that an inside-out universe, with properly adjusted physical laws, is empirically irrefutable". Gardner rejects the concave hollow Earth hypothesis on the basis of Occam's Razor.
Purportedly verifiable hypotheses of a "concave hollow Earth" need to be distinguished from a thought experiment which defines a coordinate transformation such that the interior of the Earth becomes "exterior" and the exterior becomes "interior". (For example, in spherical coordinates, let radius r go to R²/r where R is the Earth's radius.) The transformation entails corresponding changes to the forms of physical laws. This is not a hypothesis but an illustration of the fact that any description of the physical world can be equivalently expressed in more than one way.
1.5.6.3 Contrary evidence
1.5.6.3.1 Seismic
The picture of the structure of the earth that has been arrived at through the study of seismic waves is quite different from the hollow earth hypothesis . The Earth's interior is made up of layers of molten rock and various elements, in the mantle and core.
1.5.6.3.2 Gravity
Another set of scientific arguments against a hollow Earth or any hollow planet comes from gravity. Massive objects tend to clump together gravitationally, creating non-hollow spherical objects we call stars and planets. The solid sphere is the best way in which to minimize the gravitational potential energy of a physical object; having hollowness is unfavorable in the energetic sense. In addition, ordinary matter is not strong enough to support a hollow shape of planetary size against the force of gravity; a planet-sized hollow shell with the known, observed thickness of the Earth's crust, would not be able to achieve hydrostatic equilibrium with its own mass and would collapse.
Someone on the inside of a hollow Earth would not experience a significant outward pull and could not easily stand on the inner surface; rather, the hypothesis of gravity implies that a person on the inside would be nearly weightless. This was first shown by Newton, whose shell theorem mathematically predicts a gravitational force (from the shell) of zero everywhere inside a spherical symmetric hollow shell of matter, regardless of the shell's thickness. A tiny gravitational force would arise from the fact that the Earth does not have a perfectly symmetrical spherical shape, as well as forces from other bodies such as the Moon. The centrifugal force from the Earth's rotation would pull a person (on the inner surface) outwards if the person was traveling at the same velocity as the Earth's interior and was in contact with the ground on the interior, but even the maximum centrifugal force at the equator is only 1/300 of ordinary Earth gravity.

The mass of the planet also indicates that the hollow Earth hypothesis is unfeasible. Should the Earth be largely hollow, its mass would be much lower and thus its gravity on the outer surface would be much lower than it is.
1.5.6.3.3 Direct observation
The deepest hole drilled to date is the SG-3 borehole which is 12.3 km (7.6 mi) deep, part of the Soviet Kola Superdeep Borehole project; thus, visual knowledge of the Earth's structure extends that far.
1.6 Rock
In geology, a rock is a naturally occurring solid aggregate of one or more minerals or mineraloids. For example, the common rock granite is a combination of the quartz, feldspar and biotite minerals. The Earth's outer solid layer, the lithosphere, is made of rock.
Rocks have been used by mankind throughout history. From the Stone Age rocks have been used for tools. The minerals and metals we find in rocks have been essential to human civilization.
Three major groups of rocks are defined: igneous, sedimentary, and metamorphic. The scientific study of rocks is called petrology, which is an essential component of geology. At a granular level, rocks are composed of grains of minerals, which, in turn, are homogeneous solids formed from a chemical compound that is arranged in an orderly manner. The aggregate minerals forming the rock are held together by chemical bonds. The types and abundance of minerals in a rock are determined by the manner in which the rock was formed. Many rocks contain silica (SiO2); a compound of silicon and oxygen that forms 74.3% of the Earth's crust. This material forms crystals with other compounds in the rock. The proportion of silica in rocks and minerals is a major factor in determining their name and properties.
Rocks are geologically classified according to characteristics such as mineral and chemical composition, permeability, the texture of the constituent particles, and particle size. These physical properties are the end result of the processes that formed the rocks. Over the course of time, rocks can transform from one type into another, as explaind by the geological model called the rock cycle. These events produce three general classes of rock: igneous, sedimentary, and metamorphic.
The three classes of rocks are subdivided into many groups. However, there are no hard and fast boundaries between allied rocks. By increase or decrease in the proportions of their constituent minerals they pass by every gradation into one another, the distinctive structures also of one kind of rock may often be traced gradually merging into those of another. Hence the definitions adopted in establishing rock nomenclature merely correspond to more or less arbitrary selected points in a continuously graduated series.
1.6.1 Igneous Rock
Igneous refers to one of the three major types of rock, with metamorphic and sedimentary being the other two. Although it can form either above or below ground, it is always created when molten material from the inner layers of the Earth cool and harden. In fact, the label comes from the word ―ignis,‖ meaning ―of fire.‖ Broadly grouped by whether this process happens above or below the Earth’s surface or both, these types of rocks also can be classified by composition. They have significant scientific and everyday uses.
1.6.1.1 Formation
The Earth has three major layers, including the crust, mantle and core. Scientists divide these into smaller subsections, such as the lithosphere — the outer crust and upper mantle — and asthenosphere — the lower, fluid part of the mantle. The inner layers are under incredibly intense pressure and are extremely hot.
When minerals are close enough to the center of the Earth, they get heated to between 1,100 – 2,400° Fahrenheit (590 – 1,300° Celsius) and change from a solid to a liquid. The resulting material is called magma. Sometimes, it gets trapped in pockets, where it cools and becomes solid again. In other cases, forces such as convection currents bring magma to the surface, and it escapes through volcanic eruptions as lava before losing heat and stiffening. In either instance, the hardened substance is igneous rock.
1.6.1.2 Intrusive Rock
The melted magma that hardens underneath the surface of the Earth is known as intrusive, internal or plutonic igneous rock, because it forms in hollow spots underground. The term ―plutonic‖ has its history in mythology, with the Roman god Pluto — known in Greece as Hades — ruling the underworld where the spirits of all the dead supposedly dwell. It generally is easy to identify this type of rock because magma cools very slowly under the Earth’s surface, allowing crystals to grow big enough to view with the naked eye. Some intrusive rocks are granite, diorite, rhyolite and gabbro.
1.6.1.3 Extrusive Rock
When magma escapes as lava and hardens, experts refer to it as an extrusive igneous rock, which simply means it flowed or was thrust out of the deeper layers of the planet. This type usually cools much more quickly, so larger lumps of mineral or crystals typically don’t have time to form. In fact, many volcanic rocks are primarily silica, a kind of glassy sand. It often contains air bubbles, as well. A good example in this category is pumice, which has so many spaces from where air was trapped that it can float. Other kinds in the extrusive group are basalt, andesite, scoria and obsidian.
1.6.1.4 Porphyry
Porphyry is an igneous rock that cools in two different stages instead of just one. The process starts in the mantle with the formation of large crystals. The material then moves closer to the Earth’s surface, where it loses heat very quickly in the upper crust or comes out of a volcano. During the second stage, the rapid loss of heat usually keeps the crystals that form much smaller. It is a mixture of the intrusive and extrusive types overall as a result.
1.6.1.5 Compositional Classification
Although scientists group these rocks by their texture or grain size, they also consider composition. They use three major groups for this system: mafic, felsic and intermediate. Those in the mafic category are made of the minerals pyroxene, olivine and feldspar. Like flaked obsidian, they have dark colors like green and black. Combinations of feldspar and quartz create felsic rocks in much lighter colors, such as white or pink, that sparkle in the light. Intermediate types lie somewhere in the middle, with medium shades of grey and green made of amphibole, feldspar and biotite.
1.6.1.6 Scientific Importance

Geologists and other professionals who study the Earth are interested in all types of igneous rocks because they provide some clues about what it is like deep in the planet, including temperature and pressure conditions. The chemical makeup of each rock tells scientists what elements are present and what reactions are happening underground. Through a method called radiometric dating, those who study these materials often can figure out the age of the rocks, which then can be used to create a timeline of the Earth’s geological history.
By studying the formation of these rocks and other physical processes, people have learned that the Earth is constantly changing. Even though it might take thousands of years for igneous material to form and make its way to the surface, the process is always ongoing. This puts a much different perspective on the world, teaching individuals to see development and metamorphoses as natural.
1.6.1.7 Everyday Uses
People generally use various types of these rocks in architecture, furniture or decorations. Granite countertops, for example, are popular in contemporary homes because of their attractive, natural appearance and durability. Many artists who sculpt choose forms of igneous material as a medium, and some people like to collect different kinds for their beauty and uniqueness. Individuals also have used them in jewelry, handbags, shoes and other accessories, although the weight of the material often is a concern in these cases. Some even find their way into beauty care, such as using pumice stones to get rid of calluses.
1.6.2 Sedimentary rock
Sedimentary rocks are types of rock that are formed by the deposition of material at the Earth's surface and within bodies of water. Sedimentation is the collective name for processes that cause mineral and/or organic particles (detritus) to settle and accumulate or minerals to precipitate from a solution. Particles that form a sedimentary rock by accumulating are called sediment. Before being deposited, sediment was formed by weathering and erosion in a source area, and then transported to the place of deposition by water, wind, ice, mass movement or glaciers which are called agents of denudation.
The sedimentary rock cover of the continents of the Earth's crust is extensive, but the total contribution of sedimentary rocks is estimated to be only 8% of the total volume of the crust. Sedimentary rocks are only a thin veneer over a crust consisting mainly of igneous and metamorphic rocks. Sedimentary rocks are deposited in layers as strata, forming a structure called bedding. The study of sedimentary rocks and rock strata provides information about the subsurface that is useful for civil engineering, for example in the construction of roads, houses, tunnels, canals or other constructions. Sedimentary rocks are also important sources of natural resources like coal, fossil fuels, drinking water or ores.
The study of the sequence of sedimentary rock strata is the main source for scientific knowledge about the Earth's history, including paleogeography, paleoclimatology and the history of life. The scientific discipline that studies the properties and origin of sedimentary rocks is called sedimentology. Sedimentology is both part of geology and physical geography and overlaps partly with other disciplines in the Earth sciences, such as pedology, geomorphology, geochemistry or structural geology.
1.6.2.1 Genetic classification
Based on the processes responsible for their formation, sedimentary rocks can be subdivided into four groups: clastic sedimentary rocks, biochemical (or biogenic) sedimentary rocks, chemical sedimentary

rocks and a fourth category for "other" sedimentary rocks formed by impacts, volcanism, and other minor processes.
1.6.2.2 Clastic sedimentary rocks
Clastic sedimentary rocks are composed of silicate minerals and rock fragments that were transported by moving fluids (as bed load, suspended load, or by sediment gravity flows) and were deposited when these fluids came to rest. Clastic rocks are composed largely of quartz, feldspar, rock (lithic) fragments, clay minerals, and mica; numerous other minerals may be present as accessories and may be important locally.
Clastic sediment, and thus clastic sedimentary rocks, are subdivided according to the dominant particle size (diameter). Most geologists use the Udden-Wentworth grain size scale and divide unconsolidated sediment into three fractions: gravel (>2 mm diameter), sand (1/16 to 2 mm diameter), and mud (clay is <1/256 mm and silt is between 1/16 and 1/256 mm). The classification of clastic sedimentary rocks parallels this scheme; conglomerates and breccias are made mostly of gravel, sandstones are made mostly of sand, and mudrocks are made mostly of mud. This tripartite subdivision is mirrored by the broad categories of rudites, arenites, and lutites, respectively, in older literature.
Subdivision of these three broad categories is based on differences in clast shape (conglomerates and breccias), composition (sandstones), grain size and/or texture (mudrocks).
1.6.2.3 Conglomerates and breccias
Conglomerates are dominantly composed of rounded gravel and breccias are composed of dominantly angular gravel.
1.6.2.4 Sandstones
Sandstone classification schemes vary widely, but most geologists have adopted the Dott scheme, which uses the relative abundance of quartz, feldspar, and lithic framework grains and the abundance of muddy matrix between these larger grains.
Composition of framework grains The relative abundance of sand-sized framework grains determines the first word in a sandstone name. For naming purposes, the abundance of framework grains is normalized to quartz, feldspar, and lithic fragments formed from other rocks. These are the three most abundant components of sandstones; all other minerals are considered accessories and not used in the naming of the rock, regardless of abundance.
Quartz sandstones have >90% quartz grains Feldspathic sandstones have <90% quartz grains and more feldspar grains than lithic
grains Lithic sandstones have <90% quartz grains and more lithic grains than feldspar grains
Abundance of muddy matrix between sand grains When sand-sized particles are deposited, the space between the sand grains either remains open or is filled with mud (silt and/or clay sized particle).

"Clean" sandstones with open pore space (that may later be filled with cement) are called arenites
Muddy sandstones with abundant (>10%) muddy matrix are called wax.
Six sandstone names are possible using descriptors for grain composition (quartz-, feldspathic-, and lithic-) and amount of matrix (wacke or arenite). For example, a quartz arenite would be composed of mostly (>90%) quartz grains and have little/no clayey matrix between the grains, a lithic wacke would have abundant lithic grains (<90% quartz, remainder would have more lithics than feldspar) and abundant muddy matrix, etc.
Although the Dott classification scheme is widely used by sedimentologists, common names like greywacke, arkose, and quartz sandstone are still widely used by nonspecialists and in popular literature.
1.6.2.5 Mudrocks
Mudrocks are sedimentary rocks composed of at least 50% silt- and clay-sized particles. These relatively fine-grained particles are commonly transported as suspended particles by turbulent flow in water or air, and deposited as the flow calms and the particles settle out of suspension.
Most authors presently use the term "mudrock" to refer to all rocks composed dominantly of mud. Mudrocks can be divided into siltstones (composed dominantly of silt-sized particles), mudstones (subequal mixture of silt- and clay-sized particles), and claystones (composed mostly of clay-sized particles). Most authors use "shale" as a term for a fissile mudrock (regardless of grain size), although some older literature uses the term "shale" as a synonym for mudrock.
1.6.2.6 Biochemical sedimentary rocks
Biochemical sedimentary rocks are created when organisms use materials dissolved in air or water to build their tissue. Examples include:
Most types of limestone are formed from the calcareous skeletons of organisms such as corals, mollusks, and foraminifera.
Coal which forms as plants remove carbon from the atmosphere and combine with other elements to build their tissue.
Deposits of chert formed from the accumulation of siliceous skeletons from microscopic organisms such as radiolaria and diatoms.
1.6.2.7 Chemical sedimentary rocks
Chemical sedimentary rock forms when mineral constituents in solution become supersaturated and inorganically precipitate. Common chemical sedimentary rocks include Oolitic limestone and rocks composed of evaporite minerals such as halite (rock salt), sylvite, barite and gypsum.
1.6.2.8 "Other" sedimentary rocks
This fourth miscellaneous category includes rocks formed by Pyroclastic flows, impact breccias, volcanic breccias, and other relatively uncommon processes.
1.6.2.9 Compositional classification schemes
Alternatively, sedimentary rocks can be subdivided into compositional groups based on their mineralogy:
Siliciclastic sedimentary rocks, as explained above, are dominantly composed of silicate minerals. The sediment that makes up these rocks was transported as bed load, suspended load, or by sediment gravity flows. Siliciclastic sedimentary rocks are subdivided into conglomerates and breccias, sandstone, and mudrocks.
Carbonate sedimentary rocks are composed of calcite (rhombohedral CaCO 3), aragonite (orthorhombic CaCO3), dolomite (CaMg(CO3) 2), and other carbonate minerals based on the CO2−3ion. Common examples include limestone and dolostone.
Evaporite sedimentary rocks are composed of minerals formed from the evaporation of water. The most common evaporite minerals are carbonates (calcite and others based on CO2− 3), chlorides (halite and others built on Cl−), and sulfates (gypsum and others built on SO2− 4). Evaporite rocks commonly include abundant halite (rock salt), gypsum, and anhydrite.
Organic-rich sedimentary rocks have significant amounts of organic material, generally in excess of 3% total organic carbon. Common examples include coal, oil shale as well as source rocks for oil and natural gas .
Siliceous sedimentary rocks are almost entirely composed of silica (SiO 2), typically as chert, opal, chalcedony or other microcrystalline forms.
Iron-rich sedimentary rocks are composed of >15% iron; the most common forms are banded iron formations and ironstones
Phosphatic sedimentary rocks are composed of phosphate minerals and contain more than 6.5% phosphorus; examples include deposits of phosphate nodules, bone beds, and phosphatic mudrocks
1.6.2.10 Deposition and diagenesis
1.6.2.10.1 Sediment transport and deposition
Sedimentary rocks are formed when sediment is deposited out of air, ice, wind, gravity, or water flows carrying the particles in suspension. This sediment is often formed when weathering and erosion break down a rock into loose material in a source area. The material is then transported from the source area to the deposition area. The type of sediment transported depends on the geology of the hinterland (the source area of the sediment). However, some sedimentary rocks, like evaporites, are composed of material that formed at the place of deposition. The nature of a sedimentary rock consequently not only depends on sediment supply, but also on the sedimentary depositional environment in which it formed.
1.6.2.10.2 Diagenesis
The term diagenesis is used to explain all the chemical, physical, and biological changes, including cementation, undergone by a sediment after its initial deposition, exclusive of surface weathering. Some of these processes cause the sediment to consolidate: a compact, solid substance forms out of loose material. Younger sedimentary rocks, especially those of Quaternary age (the most recent phase of the geologic time scale) are often still unconsolidated. As sediment deposition builds up, the overburden (or lithostatic) pressure rises and a process known as lithification takes place.
Sedimentary rocks are often saturated with seawater or groundwater, in which minerals can dissolve or from which minerals can precipitate. Precipitating minerals reduce the pore space in a rock, a process
called cementation. Due to the decrease in pore space, the original connate fluids are expelled. The precipitated minerals form a cement and make the rock more compact and competent. In this way, loose clasts in a sedimentary rock can become "glued" together.
When sedimentation continues, an older rock layer becomes buried deeper as a result. The lithostatic pressure in the rock increases due to the weight of the overlying sediment. This causes compaction, a process in which grains mechanically reorganize. Compaction is, for example, an important diagenetic process in clay, which can initially consist of 60% water. During compaction, this interstitial water is pressed out of pore spaces. Compacation can also be the result of dissolution of grains by pressure solution. The dissolved material precipitates again in open pore spaces, which means there is a net flow of material into the pores. However, in some cases a certain mineral dissolves and not precipitate again. This process is called leaching and increases pore space in the rock.
Some biochemical processes, like the activity of bacteria, can affect minerals in a rock and are consequently seen as part of diagenesis. Fungi and plants (by their roots) and various other organisms that live beneath the surface can also influence diagenesis.
Burial of rocks due to ongoing sedimentation leads to increased pressure and temperature, which stimulates certain chemical reactions. An example is the reactions by which organic material becomes lignite or coal. When the temperature and pressure increase still further, the realm of diagenesis makes way for metamorphism, the process that forms metamorphic rock.
1.6.2.11 Properties
1.6.2.11.1 Color
The color of a sedimentary rock is often mostly determined by the iron, an element with two major oxides: iron (II) oxide and iron (III) oxide. Iron (II) oxide only forms under anoxic circumstances and gives the rock a grey or greenish color. Iron (III) oxide is often in the form of the mineral hematite and gives the rock a reddish to brownish color. In arid continental climates rocks are in direct contact with the atmosphere, and oxidation is an important process, giving the rock a red or orange colour. Thick sequences of red sedimentary rocks formed in arid climates are called red beds. However, a red colour does not necessarily mean the rock formed in a continental environment or arid climate.
The presence of organic material can colour a rock black or grey. Organic material is in nature formed from dead organisms, mostly plants. Normally, such material eventually decays by oxidation or bacterial activity. Under anoxic circumstances, however, organic material cannot decay and becomes a dark sediment, rich in organic material. This, can for example, occur at the bottom of deep seas and lakes. There is little water current in such environments, so oxygen from surface water is not brought down, and the deposited sediment is normally a fine dark clay. Dark rocks rich in organic material are consequently often shales.
1.6.2.11.2 Texture
The size, form and orientation of clasts or minerals in a rock is called its texture. The texture is a small-scale property of a rock, but determined many of its large-scale properties, such as the density, porosity or permeability.

Clastic rocks have a 'clastic texture', which means they consist of class. The 3D orientation of these clasts is called the fabric of the rock. Between the clasts the rock can be composed of a matrix or a cement (the latter can consist of crystals of one or more precipitated minerals). The size and form of clasts can be used to determine the velocity and direction of current in the sedimentary environment where the rock was formed; fine, calcareous mud only settles in quiet water, while gravel and larger clasts are only deposited by rapidly moving water. The grain size of a rock is usually expressed with the Wentworth scale, though alternative scales are used sometimes. The grain size can be expressed as a diameter or a volume, and is always an average value - a rock is composed of clasts with different sizes. The statistical distribution of grain sizes is different for different rock types and is explained in a property called the sorting of the rock. When all clasts are more or less of the same size, the rock is called 'well-sorted', when there is a large spread in grain size, the rock is called 'poorly sorted'.
The form of clasts can reflect the origin of the rock.
Coquina, a rock composed of clasts of broken shells, can only form in energetic water. The form of a clast can be explained by using four parameters:
Surface texture explains the amount of small-scale relief of the surface of a grain that is too small to influence the general shape.
Rounding explains the general smoothness of the shape of a grain. 'Sphericity' explains the degree to which the grain approaches a sphere. 'Grain form' explains the three dimensional shape of the grain.
Chemical sedimentary rocks have a non-clastic texture, consisting entirely of crystals. To explain such a texture only the average size of the crystals and the fabric are necessary.
1.6.2.12 Mineralogy
Most sedimentary rocks contain either quartz (especially siliciclastic rocks) or calcite (especially carbonate rocks). In contrast with igneous and metamorphic rocks, a sedimentary rock usually contains very few different major minerals. However, the origin of the minerals in a sedimentary rock has been often more complex than those in an igneous rock. Minerals in a sedimentary rock can have formed by precipitation during sedimentation or diagenesis. In the second case, the mineral precipitate can have grown over an older generation of cement. A complex diagenetic history can be studied by optical mineralogy, using a petrographic microscope.
Carbonate rocks dominantly consist of carbonate minerals like calcite, aragonite or dolomite. Both cement and clasts (including fossils and ooids) of a carbonate rock can consist of carbonate minerals. The mineralogy of a clastic rock is determined by the supplied material from the source area, the manner of transport to the place of deposition and the stability of a particular mineral. The stability of the major rock forming minerals (their resistance to weathering) is expressed by Bowen's reaction series. In this series, quartz is most stable, followed by feldspar, micas, and other less stable minerals that are only present when little weathering has occurred. The amount of watering depends mainly on the distance to the source area, the local climate and the time it took for the sediment to be transported there. In most sedimentary rocks, mica, feldspar and less stable minerals have reacted to clay minerals like kaolinite, illite or smectite.
1.6.2.13 Fossils
Among the three major types of rock, fossils are most commonly found in sedimentary rock. Unlike most igneous and metamorphic rocks, sedimentary rocks form at temperatures and pressures that do not destroy fossil remnants. Often these fossils may only be visible when studied under a microscope (microfossils) or with a loupe.
Dead organisms in nature are usually quickly removed by scavengers, bacteria, rotting and erosion, but sedimentation can contribute to exceptional circumstances where these natural processes are unable to work, causing fossilization. The chance of fossilization is higher when the sedimentation rate is high (so that a carcass is quickly buried), in anoxic environments (where little bacterial activity occurs) or when the organism had a particularly hard skeleton. Larger, well-preserved fossils are relatively rare.
Fossils can both be the direct remains or imprints of organisms and their skeletons. Most commonly preserved are the hardest parts of organisms such as bones, shells, woody tissue of plants. Soft tissue has a much smaller chance of being preserved and fossilized and soft tissue of animals older than 40 million years is very rare. Imprints of organisms made while still alive are called trace fossils. Examples are burrows, footprints, etc.
Being part of a sedimentary or metamorphic rock, fossils undergo the same diagenetic processes as that rock. A shell consisting of calcite can for example dissolve, while a cement of silica then fills the cavity. In the same way, precipitating minerals can fill cavities formerly occupied by blood vessels, vascular tissue or other soft tissues. This preserves the form of the organism but changes the chemical composition, a process called permineralization. The most common minerals in permineralization cements are carbonates (especially calcite), forms of amorphous silica (chalcedony, flint, chert) and pyrite. In the case of silica cements, the process is called lithification.
At high pressure and temperature, the organic material of a dead organism undergoes chemical reactions in which volatiles like water and carbon dioxide are expulsed. The fossil, in the end, consists of a thin layer of pure carbon or its mineralized form, graphite. This form of fossilization is called carbonisation. It is particularly important for plant fossils. The same process is responsible for the formation of fossil fuels like lignite or coal.
1.6.2.14 Primary sedimentary structures
Structures in sedimentary rocks can be divided into 'primary' structures (formed during deposition) and 'secondary' structures (formed after deposition). Unlike textures, structures are always large-scale features that can easily be studied in the field. Sedimentary structures can tell something about the sedimentary environment or can serve to tell which side originally faced up where tectonics have tilted or overturned sedimentary layers.
Sedimentary rocks are laid down in layers called beds or strata. A bed is defined as a layer of rock that has a uniform lithology and texture. Beds form by the deposition of layers of sediment on top of each other. The sequence of beds that characterizes sedimentary rocks is called bedding. Single beds can be a couple of centimeters to several meters thick. Finer, less pronounced layers are called laminae and the structure it forms in a rock is called lamination. The laminae are usually less than a few centimeters thick. Though bedding and lamination are often originally horizontal in nature, this is not always the case. In some environments, beds are deposited at a (usually small) angle. Sometimes multiple sets of layers with different orientations exist in the same rock, a structure called cross-bedding. Cross-bedding forms when
small-scale erosion occurs during deposition, cutting off part of the bed. Newer beds then form at an angle to older ones.
The opposite of cross-bedding is parallel lamination, where all sedimentary layering is parallel. With laminations, the differences are generally caused by cyclic changes in the sediment supply, caused for example by seasonal changes in rainfall, temperature or biochemical activity. Laminae that represent seasonal changes (alike to tree rings) are called varves. Any sedimentary rock composed of millimeter or finer scale layers can be named with the general term laminite. Some rocks have no lamination at all, their structural character is called massive bedding.
Graded bedding is a structure where beds with a smaller grain size occur on top of beds with larger grains. This structure forms when fast flowing water stops flowing. Larger, heavier clasts in suspension settle first, then smaller clasts. Though graded bedding can form in many different environments, it is characteristic for turbidity currents.
The bedform (the surface of a particular bed) can be indicative of a particular sedimentary environment too. Examples of bed forms include dunes and ripple marks. Sole markings, such as tool marks and flute casts, are groves dug into a sedimentary layer that are preserved. These are often elongated structures and can be used to establish the direction of the flow during deposition.
Ripple marks also form in flowing water. There are two types: asymmetric wave ripples and symmetric current ripples. Environments where the current is in one direction, such as rivers, produce asymmetric ripples. The longer flank of such ripples is oriented opposite to the direction of the current. Wave ripples occur in environments where currents occur in all directions, such as tidal flats.
Another type of bed form are mudcracks, caused by the dehydration of sediment that occasionally comes above the water surface. Such structures are commonly found in tidal flats or point bars along rivers.
1.6.2.15 Secondary sedimentary structures
Secondary sedimentary structures are structures in sedimentary rocks which formed after deposition. Such structures form by chemical, physical and biological processes inside the sediment. They can be indicators for circumstances after deposition. Some can be used as a way up criteria.
Organic presence in a sediment can leave more traces than just fossils. Preserved tracks and burrows are examples of trace fossils (also called ichnofossils). Some trace fossils such as paw prints of dinosaurs or early humans can capture human imagination, but such traces are relatively rare. Most trace fossils are burrows of molluscs or arthropods. This burrowing is called bioturbation by sedimentologists. It can be a valuable indicator of the biological and ecological environment after the sediment was deposited. On the other hand, the burrowing activity of organisms can destroy other (primary) structures in the sediment, making a reconstruction more difficult.
Secondary structures can also have been formed by diagenesis or the formation of a soil (pedogenesis) when a sediment is exposed above the water level. An example of a diagenetic structure common in carbonate rocks is a stylolite. Stylolites are irregular planes were material was dissolved into the pore fluids in the rock. The result of precipitation of a certain chemical species can be colouring and staining of the rock, or the formation of concretions. Concretions are roughly concentric bodies with a different composition from the host rock. Their formation can be the result of localized precipitation due to small differences in composition or porosity of the host rock, such as around fossils, inside burrows or around plant roots. In carbonate rocks such as limestone or chalk, chert or flint concretions are common, while

terrestrial sandstones can have iron concretions. Calcite concretions in clay are called septarian concretions.
After deposition, physical processes can deform the sediment, forming a third class of secondary structures. Density contrasts between different sedimentary layers, such as between sand and clay, can result in flame structures or load casts, formed by inverted diapirism. The diapirism causes the denser upper layer to sink into the other layer. Sometimes, density contrast can result or grow when one of the lithologies dehydrates. Clay can be easily compressed as a result of dehydration, while sand retains the same volume and becomes relatively less dense. On the other hand, when the pore fluid pressure in a sand layer surpasses a critical point the sand can flow through overlying clay layers, forming discordant bodies of sedimentary rock called sedimentary dykes (the same process can form mud volcanoes on the surface).
A sedimentary dyke can also be formed in a cold climate where the soil is permanently frozen during a large part of the year. Frost weathering can form cracks in the soil that fill with rubble from above. Such structures can be used as climate indicators as well as a way up structures.
Density contrasts can also cause small-scale faulting, even while sedimentation goes on (syn-sedimentary faulting). Such faulting can also occur when large masses of non-lithified sediment are deposited on a slope, such as at the front side of a delta or the continental slope. Instabilities in such sediments can result in slumping. The resulting structures in the rock are syn-sedimentary folds and faults, which can be difficult to distinguish from folds and faults formed by tectonic forces in lithified rocks.
1.6.2.16 Sedimentary environments
The setting in which a sedimentary rock form is called the sedimentary environment. Every environment has a characteristic combination of geologic processes and circumstances. The type of sediment that is deposited is not only dependent on the sediment that is transported to a place, but also on the environment itself.
A marine environment means the rock was formed in a sea or sea . Often, a distinction is made between deep and shallow marine environments. Deep marine usually refers to environments more than 200 m below the water surface. Shallow marine environments exist adjacent to coastlines and can extend out to the boundaries of the continental shelf. The water in such environments has a generally higher energy than that in deep environments, because of wave activity. This means coarser sediment particles can be transported and the deposited sediment can be coarser than in deep environments. When the available sediment is transported from the continent, an alternation of sand, clay and silt are deposited. When the continent is far away, the amount of such sediment brought in may be small, and biochemical processes dominate the type of rock that forms. Especially in warm climates, shallow marine environments far offshore mainly see the deposition of carbonate rocks. The shallow, warm water is an ideal habitat for many small organisms that build carbonate skeletons. When these organisms die their skeletons sink to the bottom, forming a thick layer of calcareous mud that may lithify into limestone. Warm shallow marine environments also are ideal environments for coral reefs, where the sediment consists mainly of the calcareous skeletons of larger organisms.
In deep marine environments, the water current over the sea bottom is small. Only fine particles can be transported to such places. Typically sediments depositing on the sea floor are fine clay or small skeletons of micro-organisms. At 4 km depth, the solubility of carbonates increases dramatically (the depth zone where this happens is called the lysocline). Calcareous sediment that sinks below the lysocline dissolve, so no limestone can be formed below this depth. Skeletons of micro-organisms formed of silica (such as radiolarians) still deposit though. An example of a rock formed out of silica skeletons is
radiolarite. When the bottom of the sea has a small inclination, for example at the continental slopes, the sedimentary cover can become unstable, causing turbidity currents. Turbidity currents are sudden disturbances of the normally quite deep marine environment and can cause the geologically speaking instantaneous deposition of large amounts of sediment, such as sand and silt. The rock sequence formed by a turbidity current is called a turbidite.
The coast is an environment dominated by wave action. At the beach, dominantly coarse sediment like sand or gravel is deposited, often mingled with shell fragments. Tidal flats and shoals are places that sometimes dry out because of the tide. They are often cross-cut by gullies, where the current is strong and the grain size of the deposited sediment is larger. Where along a coast (either the coast of a sea or a lake) rivers enter the body of water, deltas can form. These are large accumulations of sediment transported from the continent to places in front of the mouth of the river. Deltas are dominantly composed of clastic sediment.
A sedimentary rock formed on the land has a continental sedimentary environment. Examples of continental environments are lagoons, lakes, swamps, floodplains and alluvial fans. In the quiet water of swamps, lakes and lagoons, fine sediment is deposited, mingled with organic material from dead plants and animals. In rivers, the energy of the water is much higher and the transported material consists of clastic sediment. Besides transport by water, sediment can in continental environments also be transported by wind or glaciers. Sediment transported by wind is called Aeolian and is always very well sorted, while sediment transported by a glacier is called glacial and is characterized by very poor sorting.
1.6.2.17 Sedimentary facies
Sedimentary environments usually exist alongside each other in certain natural successions. A beach, where sand and gravel is deposited, is usually bounded by a deeper marine environment a little offshore, where finer sediments are deposited at the same time. Behind the beach, there can be dunes (where the dominant deposition is well sorted sand) or a lagoon (where fine clay and organic material is deposited). Every sedimentary environment has its own characteristic deposits. The typical rock formed in a certain environment is called its sedimentary facies. When sedimentary strata accumulate through time, the environment can shift, forming a change in facies in the subsurface at one location. On the other hand, when a rock layer with a certain age is followed laterally, the lithology (the type of rock) and facies eventually change.
Facies can be distinguished in a number of ways: the most common ways are by the lithology (for example: limestone, siltstone or sandstone) or by fossil content. Coral for example only lives in warm and shallow marine environments and fossils of coral are thus typical for shallow marine facies. Facies determined by lithology are called lithofacies; facies determined by fossils are biofacies.
Sedimentary environments can shift their geographical positions through time. Coastlines can shift in the direction of the sea when the sea level drops, when the surface rises due to tectonic forces in the Earth's crust or when a river forms a large delta. In the subsurface, such geographic shifts of sedimentary environments of the past are recorded in shifts in sedimentary facies. This means that sedimentary facies can change either parallel or perpendicular to an imaginary layer of rock with a fixed age, a phenomenon explained by Walther's Law.
The situation in which coastlines move in the direction of the continent is called transgression. In the case of transgression, deeper marine facies are deposited over shallower facies, a succession called on ap. Regression is the situation in which a coastline moves in the direction of the sea. With regression, shallower facies are deposited on top of deeper facies, a situation called offlap.

The facies of all rocks of a certain age can be plotted on a map to give an overview of the palaeogeography.
1.6.2.18 Sedimentary basins
Places where large-scale sedimentation takes place is called sedimentary basins. The amount of sediment that can be deposited in a basin depends on the depth of the basin, the so-called accommodation space. Depth, shape and size of a basin depend on tectonics, movements within the Earth's lithosphere. Where the lithosphere moves upward (tectonic uplift), the land eventually rises above sea level, so that and erosion removes material, and the area becomes a source of new sediment. Where the lithosphere moves downward (tectonic subsidence), a basin form and sedimentation can take place. When the lithosphere keeps subsiding, new accommodation space keeps being created.
A type of basin formed by the moving apart of two pieces of a continent is called a rift basin. Rift basins are elongated, narrow and deep basins. Due to divergent movement, the lithosphere is stretched and thinned, so that the hot asthenosphere rises and heats the overlying rift basin. Apart from continental sediments, rift basins normally also have part of their infill consisting of volcanic deposits. When the basin grows due to continued stretching of the lithosphere, the rift grows and the sea can enter, forming marine deposits.
When a piece of lithosphere that was heated and stretched cools again, its density rises, causing isostatic subsidence. If this subsidence continues long enough the basin is called a sag basin. Examples of sag basins are the regions along passive continental margins, but sag basins can also be found in the interior of continents. In sag basins, the extra weight of the newly deposited sediments is enough to keep the subsidence going in a vicious circle. The total thickness of the sedimentary infill in a sag basin can thus exceed 10 km.
A third type of basin exists along convergent plate boundaries - places where one tectonic plate moves under another into the asthenosphere. The subducting plate bends and forms a fore-arc basin in front of the overriding plate—an elongated, deep asymmetric basin. Fore-arc basins are filled with deep marine deposits and thick sequences of turbidites. Such infill is called flysch. When the convergent movement of the two plates results in continental collision, the basin becomes shallower and develops into a Foreland basin. At the same time, tectonic uplift forms a mountain belt in the overriding plate, from which large amounts of material are eroded and transported to the basin. Such erosional material of a growing mountain chain is called molasse and has either a shallow marine or a continental facies.
At the same time, the growing weight of the mountain belt can cause isostatic subsidence in the area of the overriding plate on the other side to the mountain belt. The basin type resulting from this subsidence is called a back-arc basin and is usually filled by shallow marine deposits and molasse.
1.6.2.19 Influence of astronomical cycles
In many cases facies changes and other lithological features in sequences of sedimentary rock have a cyclic nature. This cyclic nature was caused by cyclic changes in sediment supply and the sedimentary environment. Most of these cyclic changes are caused by astronomic cycles. Short astronomic cycles can be the difference between the tides or the spring tide every two weeks. On a larger time-scale, cyclic changes in climate and sea level are caused by Milankovitch cycles: cyclic changes in the orientation and/or position of the Earth's rotational axis and orbit around the Sun. There are a number of Milankovitch cycles known, lasting between 10,000 and 200,000 years.

Relatively small changes in the orientation of the Earth's axis or length of the seasons can be a major influence on the Earth's climate. An example is the ice ages of the past 2.6 million years (the Quaternary phase), which are assumed to have been caused by astronomic cycles. Climate change can influence the global sea level (and thus the amount of accommodation space in sedimentary basins) and sediment supply from a certain region. Eventually, small changes in astronomic parameters can cause large changes in sedimentary environment and sedimentation.
1.6.3 Metamorphic rock
Metamorphic rocks arise from the transformation of existing rock types, in a process called metamorphism, which means "change in form". The original rock (protolith) is subjected to heat (temperatures greater than 150 to 200 °C) and pressure (1500 bars), causing profound physical and/or chemical change. The protolith may be sedimentary rock, igneous rock or other older metamorphic rock.
Metamorphic rocks make up a large part of the Earth's crust and are classified by texture and by chemical and mineral assemblage (metamorphic facies). They may be formed simply by being deep beneath the Earth's surface, subjected to high temperatures and the great pressure of the rock layers above it. They can form from tectonic processes such as continental collisions, which cause horizontal pressure, friction and distortion. They are also formed when the rock is heated up by the intrusion of hot molten rock called magma from the Earth's interior. The study of metamorphic rocks (now exposed at the Earth's surface following erosion and uplift) provides information about the temperatures and pressures that occur at great depths within the Earth's crust. Some examples of metamorphic rocks are gneiss, slate, marble, schist, and quartzite.
1.6.3.1 Metamorphic minerals
Metamorphic minerals are those that form only at higher temperatures and pressures associated with the process of metamorphism. These minerals, known as index minerals, include sillimanite, kyanite, staurolite, andalusite, and some garnet.
Other minerals, such as olivines, pyroxenes, amphiboles, micas, feldspars, and quartz, may be found in metamorphic rocks, but are not necessarily the result of the process of metamorphism. These minerals formed during the crystallization of igneous rocks. They are stable at high temperatures and pressures and may remain chemically unchanged during the metamorphic process. However, all minerals are stable only within certain limits, and the presence of some minerals in metamorphic rocks indicates the approximate temperatures and pressures at which they formed.
The change in the particle size of the rock during the process of metamorphism is called recrystallization. For instance, the small calcite crystals in the sedimentary rock limestone and chalk change into larger crystals in the metamorphic rock marble, or in metamorphosed sandstone, recrystallization of the original quartz sand grains results in very compact quartzite, also known as metaquartzite, in which the often larger quartz crystals are interlocked. Both high temperatures and pressures contribute to recrystallization. High temperatures allow the atoms and ions in solid crystals to migrate, thus reorganizing the crystals, while high pressures cause solution of the crystals within the rock at their point of contact.
1.6.3.2 Foliation
The layering within metamorphic rocks is called foliation (derived from the Latin word folia, meaning "leaves"), and it occurs when a rock is being shortened along one axis during recrystallization. This

causes the platy or elongated crystals of minerals, such as mica and chlorite, to become rotated such that their long axes are perpendicular to the orientation of shortening. This results in a banded, or foliated rock, with the bands showing the colors of the minerals that formed them.
Textures are separated into foliated and non-foliated categories. Foliated rock is a product of differential stress that deforms the rock in one plane, sometimes creating a plane of cleavage. For example, slate is a foliated metamorphic rock, originating from shale. Non-foliated rock does not have planar patterns of strain.
Rocks that were subjected to uniform pressure from all sides, or those that lack the minerals with distinctive growth habits, will not be foliated. Slate is an example of a very fine-grained, foliated metamorphic rock, while phyllite is medium, schist coarse, and gneiss very coarse-grained. Marble is generally not foliated, which allows its use as a material for sculpture and architecture.
Another important mechanism of metamorphism is that of chemical reactions that occur between minerals without them melting. In the process atoms are exchanged between the minerals, and thus new minerals are formed. Many complex high-temperature reactions may take place, and each mineral assemblage produced provides us with a clue as to the temperatures and pressures at the time of metamorphism.
Metasomatism is the drastic change in the bulk chemical composition of a rock that often occurs during the processes of metamorphism. It is due to the introduction of chemicals from other surrounding rocks. Water may transport these chemicals rapidly over great distances. Because of the role played by water, metamorphic rocks generally contain many elements absent from the original rock, and lack some that originally were present. Still, the introduction of new chemicals is not necessary for recrystallization to occur.
1.6.3.3 Types of metamorphism
1.6.3.3.1 Contact metamorphism
Contact metamorphism is the name given to the changes that take place when magma is injected into the surrounding solid rock (country rock). The changes that occur are greatest wherever the magma comes into contact with the rock because the temperatures are highest at this boundary and decrease with distance from it. Around the igneous rock that forms from the cooling magma is a metamorphosed zone called a contact metamorphism aureole. Aureoles may show all degrees of metamorphism from the contact area to unmetamorphosed (unchanged) country rock some distance away. The formation of important ore minerals may occur by the process of metasomatism at or near the contact zone.
When a rock is contact altered by an igneous intrusion it very frequently becomes more indurated, and more coarsely crystalline. Many altered rocks of this type were formerly called hornstones, and the term hornfels is often used by geologists to signify those fine grained, compact, non-foliated products of contact metamorphism. A shale may become a dark argillaceous hornfels, full of tiny plates of brownish biotite; a male or impure limestone may change to a grey, yellow or greenish lime-silicate-hornfels or siliceous marble, tough and splintery, with abundant augite, garnet, wollastonite and other minerals in which calcite is an important component. A diabase or andesite may become a debased hornfels or endorsed hornfels with the development of new hornblende and biotite and a partial recrystallization of the original feldspar. Chert or flint may become a finely crystalline quartz rock; sandstones lose their clastic structure and are converted into a mosaic of small close-fitting grains of quartz in a metamorphic rock called quartzite.
If the rock was originally banded or foliated (as, for example, a laminated sandstone or a foliated Calc-schist) this character may not be obliterated, and a banded hornfels is the product; fossils even may have their shapes preserved, though entirely recrystallized, and in many contact-altered lavas the vesicles are still visible, though their contents have usually entered into new combinations to form minerals that were not originally present. The minute structures, however, disappear, often completely, if the thermal alteration is very profound. Thus small grains of quartz in a shale are lost or blend with the surrounding particles of clay, and the fine ground-mass of lavas is entirely reconstructed.
By recrystallization in this manner peculiar rocks of very distinct types are often produced. Thus shales may pass into cordierite rocks, or may show large crystals of andalusite (and chiastolite), staurolite, garnet, kyanite and sillimanite, all derived from the aluminous content of the original shale. A considerable amount of mica (both muscovite and biotite) is often simultaneously formed, and the resulting product has a close resemblance to many kinds of schist. Limestones, if pure, are often turned into coarsely crystalline marbles; but if there was an admixture of clay or sand in the original rock such minerals as garnet, epidote, idocrase, wollastonite, will be present. Sandstones when greatly heated may change into coarse quartzites composed of large clear grains of quartz. These more intense stages of alteration are not so commonly seen in igneous rocks, because their minerals, being formed at high temperatures, are not so easily transformed or recrystallized.
In a few cases rocks are fused and in the dark glassy product minute crystals of spinel, sillimanite and cordierite may separate out. Shales are occasionally thus altered by basalt dikes, and feldspathic sandstones may be completely vitrified. Alike changes may be induced in shales by the burning of coal seams or even by an ordinary furnace.
There is also a tendency for metasomatism between the igneous magma and sedimentary country rock, whereby the chemicals in each are exchanged or introduced into the other. Granites may absorb fragments of shale or pieces of basalt. In that case, hybrid rocks called skank arise, which don't have the characteristics of normal igneous or sedimentary rocks. Sometimes an invading granite magma permeates the rocks around, filling their joints and planes of bedding, etc., with threads of quartz and feldspar. This is very exceptional but instances of it are known and it may take place on a large scale.
1.6.3.3.2 Regional metamorphism
Regional metamorphism, also known as dynamic metamorphism, is the name given to changes in great masses of rock over a wide area. Rocks can be metamorphosed simply by being at great depths below the Earth's surface, subjected to high temperatures and the great pressure caused by the immense weight of the rock layers above. Much of the lower continental crust is metamorphic, except for recent igneous intrusions. Horizontal tectonic movements such as the collision of continents create orogenic belts, and cause high temperatures, pressures and deformation in the rocks along these belts. If the metamorphosed rocks are later uplifted and exposed by erosion, they may occur in long belts or other large areas at the surface. The process of metamorphism may have destroyed the original features that could have revealed the rock's previous history. Recrystallization of the rock will destroy the textures and fossils present in sedimentary rocks. Metasomatism will change the original composition.
Regional metamorphism tends to make the rock more indurated and at the same time to give it a foliated, shistose or gneissic texture, consisting of a planar arrangement of the minerals, so that platy or prismatic minerals like mica and hornblende have their longest axes arranged parallel to one another. For that reason many of these rocks splits readily in one direction along mica-bearing zones (schists). In gneisses, minerals also tend to be segregated into bands; thus there are seams of quartz and of mica in a mica schist, very thin, but consisting essentially of one mineral. Along the mineral layers composed of soft or fissile

minerals the rocks will split most readily, and the freshly split specimens will appear to be faced or coated with this mineral; for example, a piece of mica schist looked at facewise might be supposed to consist entirely of shining scales of mica. On the edge of the specimens, however, the white Folia of granular quartz will be visible. In gneisses these alternating Folia are sometimes thicker and less regular than in schists, but more importantly less micaceous; they may be lenticular, dying out rapidly. Gneisses also, as a rule, contain more feldspar than schists do, and are tougher and less fissile. Contortion or crumbling of the foliation is by no means uncommon; splitting faces are undulose or puckered. Schistosity and gneissic banding (the two main types of foliation) are formed by directed pressure at elevated temperature, and to interstitial movement, or internal flow arranging the mineral particles while they are crystallizing in that directed pressure field.
Rocks that were originally sedimentary and rocks that were undoubtedly igneous may be metamorphosed into schists and gneisses. If originality of alike composition they may be very difficult to distinguish from one another if the metamorphism has been great. A quartz-porphyry, for example, and a fine feldspathic sandstone, may both be metamorphosed into a grey or pink mica-schist.
1.6.3.3.3 Metamorphic rock textures
The five basic metamorphic textures with typical rock types are slaty (includes slate and phyllite; the foliation is called "slaty cleavage"), schistose (includes schist; the foliation is called "schistosity"), gneissose (gneiss; the foliation is called "gneissosity"), granoblastic (includes granulite, some marbles and quartzite), and hornfelsic (includes hornfels and skarn).
1.7 Volcanism
Volcanism is the eruption of material from deep in the Earth. In many cases, eruptions build up a pile of material, a mountain that is called a volcano. But here I'll discuss volcanism, because most eruptions don't build volcanoes. This is a highly simplified treatment of an intricate subject.
1.7.1 Four Types of Magmatic Volcanism
The majority of Earth's volcanism happens underwater at the mid-sea ridges, or, in plate-tectonic language, at divergent margins. The crust is pulled apart, and the hot rock in the mantle beneath begins to melt as the pressure upon it is released. The part that melts—the magma—rises while the rest of the mantle rock stays behind. The two parts have different compositions: the magma is basalt and what remains is peridotite, a heavier rock that is largely olivine.
This kind of volcanism is mostly a quiet oozing of basalt lava out of long cracks in the seafloor. Seafloor fissure eruptions have been filmed from research submarines, forming pillow lava. There are a few divergent margins on land, and volcanism there is very different from the oceanic case (including Oldoinyo Lengai, the world's weirdest volcano).
The second type of volcanism happens in association with subduction zones (that is, convergent margins), places where oceanic plates laden with water and sediment plunge into the hot mantle. It is responsible for building most of the world's volcanoes. Fluids that are driven off the descending plates rise into the upper, overriding plate where they promote the formation of magma. Notice that in this case magma is created by adding water to mantle rock, not by releasing pressure on it.

Subduction-created magma rises into the lower crust, where it collects and occasionally erupts vigorously, even explosively. The geometry of subduction means that volcanoes tend to appear in long arcs.
The third type of volcanism covers the small fraction of volcanoes, about 10 percent, in places that aren't related to divergent or convergent margins. These are lumped together as hotspot volcanoes. There are two schools of thought about hot spots. The majority of geologists considers hotspots to arise from very deep in the mantle, in rising plumes of hot material. A minority has a newer hypothesis involving fracturing of the lithospheric plates, in which magmas form much as they do with divergent settings.
The fourth type is not occurring today, but has happened in recent geologic history. It is flood volcanism, in which enormous amounts of basalt lava pour out of fissures and cover areas of thousands of square kilometers. Flood basalts appear both on land (for example the Columbia River Basalts and the Deccan Traps) and under the sea (the Ontong Java Plateau, Kerguelen Plateau, and more). These are under intense study but remain a major unsolved problem in geology.
1.7.2 Products of Volcanism
Volcanism recycles the material that goes through plate tectonics. To a first approximation, everything that is subducted returns to the surface in magma. When magma is erupted—that is, when magma becomes lava—it returns solids, fluids and gases to the Earth's crust and surface.
The solids are igneous rocks, ready to enter the rock cycle. They may be flows of lava that cool into thick layers of hard rock, or shattered fragments of volcanic ash. Either way, the minerals of igneous rocks become available to turn into sedimentary and metamorphic rocks (learn more about the three great rock classes).
The fluids act underground. As they rise magmas release water, which incorporates with it dissolved silica, metals and other elements in a chemically active mix. These magmatic fluids can alter the rocks around them and deposit bodies of ore and sulfate minerals.
The gases are what cause lava to erupt. Just as bubbles form in an opened can of soft drink, so do sulfur gases, carbon dioxide, and water vapor in rising magma. The result is that rising magma expands, and this in turn makes it rise faster. The volcanic gases enter the atmosphere, where they influence its composition and affect the global climate in various ways.
1.7.3 Nonmagmatic Volcanism
There are less well-known types of volcanism that don't involve magma: mud volcanism is one. Mud volcanoes come in two types. On land, hundreds of them occur in areas where hydrocarbons are abundant, like Trinidad or Azerbaijan. Under the sea, thousands of them occur near subduction trenches, where serpentinite mud is abundant (about serpentinization).
Another newly discovered form of volcanism involves asphalt. Asphalt flows were first documented on the floor of the Gulf of Mexico in 2003. No one knows how many of these tar volcanoes there are.
1.8 Earthquakes
An earthquake is the result of a sudden release of energy in the Earth's crust that creates seismic waves. The seismicity, seismism or seismic activity of an area refers to the frequency, type and size of tremors experienced over a phase of time.
Tremors are measured using observations from seismometers. The moment magnitude is the most common scale on which tremors larger than approximately 5 are reported for the entire globe. The more numerous tremors smaller than magnitude 5 reported by national seismological observatories are measured mostly on the local magnitude scale, also referred to as the Richter scale. These two scales are numerically alike over their range of validity. Magnitude 3 or lower tremors are mostly almost imperceptible or weak and magnitude 7 and over potentially cause serious damage over larger areas, depending on their depth. The largest tremors in historic times have been of magnitude slightly over 9, although there is no limit to the possible magnitude. The most recent large tremor of magnitude 9.0 or larger was a 9.0 magnitude tremor in Japan in 2011 (as of October 2012), and it was the largest Japanese tremor since records began. Intensity of shaking is measured on the modified Mercalli scale. The shallower an tremor, the more damage to structures it causes, all else being equal.
At the Earth's surface, tremors manifest themselves by shaking and sometimes displacement of the ground. When the epicenter of a large tremor is located offshore, the seabed may be displaced sufficiently to cause a tsunami. Tremors can also trigger landslides, and occasionally volcanic activity.
In its most general sense, the word earthquake is used to explain any seismic event — whether natural or caused by humans — that generates seismic waves. Tremors are caused mostly by rupture of geological faults, but also by other events such as volcanic activity, landslides, mine blasts, and nuclear tests. An earthquake's point of initial rupture is called its focus or hypocenter. The epicenter is the point at ground level directly above the hypocenter.
1.8 .1 Naturally occurring earthquakes
Tectonic tremors occur anywhere in the earth where there is sufficient stored elastic strain energy to drive fracture propagation along a fault plane. The sides of a fault move past each other smoothly and aseismically only if there are no irregularities or asperities along the fault surface that increase the frictional resistance. Most fault surfaces do have such asperities and this leads to a form of stick-slip behavior. Once the fault has locked, continued relative motion between the plates leads to increasing stress and consequently, stored strain energy in the volume around the fault surface. This continues until the stress has risen sufficiently to break through the asperity, suddenly allowing sliding over the locked portion of the fault, releasing the stored energy. This energy is released as a combination of radiated elastic strain seismic waves, frictional heating of the fault surface, and cracking of the rock, thus causing a tremor. This process of gradual build-up of strain and stress punctuated by occasional sudden tremor failure is referred to as the elastic-rebound hypothesis . It is estimated that only 10 percent or less of a tremor's total energy is radiated as seismic energy. Most of the tremor's energy is used to power the tremor fracture growth or is converted into heat generated by friction. Consequently, tremors lower the Earth's available elastic potential energy and raise its temperature, though these changes are negligible compared to the conductive and convective flow of heat out from the Earth's deep interior.
1.8 .2 Earthquake fault types
There are three main types of fault, all of which may cause a tremor: normal, reverse (thrust) and strike-slip. Normal and reverse faulting are examples of dip-slip, where the displacement along the fault is in the direction of dip and movement on them involves a vertical component. Normal faults occur mainly in areas where the crust is being extended such as a divergent boundary. Reverse faults occur in areas where

the crust is being shortened, such as at a convergent boundary. Strike-slip faults are steep structures where the two sides of the fault slip horizontally past each other; transform boundaries are a particular type of strike-slip fault. Many tremors are caused by movement on faults that have components of both dip-slip and strike-slip; this is known as oblique slip.
Reverse faults, particularly those along convergent plate boundaries are associated with the most powerful tremors, including almost all of those of magnitude 8 or more. Strike-slip faults, particularly continental transforms can produce major tremors up to about magnitude 8. Tremors associated with normal faults are generally less than magnitude 7.
This is so because the energy released in a tremor, and thus its magnitude, is proportional to the area of the fault that ruptures and the stress drop. Consequently, the longer the length and the wider the width of the faulted area, the larger the resulting magnitude. The topmost, brittle part of the Earth's crust, and the cool slabs of the tectonic plates that are descending down into the hot mantle, are the only parts of our planet which can store elastic energy and release it in fault ruptures. Rocks hotter than about 300 degrees Celsius flow in response to stress; they do not rupture in tremors. The maximum observed lengths of ruptures and mapped faults, which may break in one go are approximately 1000 km. Examples are the tremors in Chile, 1960; Alaska, 1957; Sumatra, 2004, all in subduction zones. The longest tremor ruptures on strike-slip faults, like the San Andreas Fault (1857, 1906), the North Anatolian Fault in Turkey (1939) and the Denali Fault in Alaska (2002), are about half to one third as long as the lengths along subducting plate margins, and those along normal faults are even shorter.
The most important parameter controlling the maximum tremor magnitude on a fault is however not the maximum available length, but the available width because the latter varies by a factor of 20. Along converging plate margins, the dip angle of the rupture plane is very shallow, typically about 10 degrees. Thus the width of the plane within the top brittle crust of the Earth can become 50 to 100 km (Japan, 2011; Alaska, 1964), making the most powerful tremors possible.
Strike-slip faults tend to be oriented near vertically, resulting in an approximate width of 10 km within the brittle crust, thus tremors with magnitudes much larger than 8 are not possible. Maximum magnitudes along many normal faults are even more limited because many of them are located along spreading centers, as in Iceland, where the thickness of the brittle layer is only about 6 km.
In addition, there exists a hierarchy of stress level in the three fault types. Thrust faults are generated by the highest, strike slip by intermediate, and normal faults by lower stress levels. This can easily be understood by considering the direction of the greatest principal stress, the direction of the force that 'pushes' the rock mass during the faulting. In the case of normal faults, the rock mass is pushed down in a vertical direction, thus the pushing force (greatest principal stress) equals the weight of the rock mass itself. In the case of thrusting, the rock mass 'escapes' in the direction of the least principal stress, namely upward, lifting the rock mass up, thus the overburden equals the least principal stress. Strike-slip faulting is intermediate between the other two types explaind above. This difference in stress regime in the three faulting environments can contribute to differences in stress drop during faulting, which contributes to differences in the radiated energy, regardless of fault dimensions.
1.8 .3 Earthquakes away from plate boundaries
Where plate boundaries occur within continental lithosphere, deformation is spread out over a much larger area than the plate boundary itself. In the case of the San Andreas fault continental transform, many tremors occur away from the plate boundary and are related to strains developed within the broader zone of deformation caused by major irregularities in the fault trace (e.g., the "Big bends" region). The

Northridge tremor was associated with movement on a blind thrust within such a zone. Another example is the strongly oblique convergent plate boundary between the Arabian and Eurasian plates where it runs through the northwestern part of the Zagros mountains. The deformation associated with this plate boundary is partitioned into nearly pure thrust sense movements perpendicular to the boundary over a wide zone to the southwest and nearly pure strike-slip motion along the Main Recent Fault close to the actual plate boundary itself. This is demonstrated by tremor focal mechanisms.
All tectonic plates have internal stress fields caused by their interactions with neighbouring plates and sedimentary loading or unloading (e.g. deglaciation). These stresses may be sufficient to cause failure along existing fault planes, giving rise to intraplate tremors.
1.8 .4 Shallow-focus and deep-focus earthquakes
The majority of tectonic tremors originate at the ring of fire in depths not exceeding tens of kilometers. Tremors occurring at a depth of less than 70 km are classified as 'shallow-focus' tremors, while those with a focal-depth between 70 and 300 km are commonly termed 'mid-focus' or 'intermediate-depth' tremors. In subduction zones, where older and colder oceanic crust descends beneath another tectonic plate, deep-focus tremors may occur at much greater depths (ranging from 300 up to 700 kilometers). These seismically active areas of subduction are known as Wadati-Benioff zones. Deep-focus tremors occur at a depth where the subducted lithosphere should no longer be brittle, due to the high temperature and pressure. A possible mechanism for the generation of deep-focus tremors is faulting caused by olivine undergoing a phase transition into a spinel structure.
1.8 .5 Earthquakes and volcanic activity
Earthquakes often occur in volcanic regions and are caused there, both by tectonic faults and the movement of magma in volcanoes. Such tremors can serve as an early warning of volcanic eruptions, as during the Mount St. Helens eruption of 1980. Tremor swarms can serve as markers for the location of the flowing magma throughout the volcanoes. These swarms can be recorded by seismometers and tiltmeters (a device that measures ground slope) and used as sensors to predict imminent or upcoming eruptions.
1.8 .6 Rupture dynamics
A tectonic tremor begins by an initial rupture at a point on the fault surface, a process known as nucleation. The scale of the nucleation zone is uncertain, with some evidence, such as the rupture dimensions of the smallest tremors, suggesting that it is smaller than 100 m while other evidence, such as a slow component revealed by low-frequency spectra of some tremors, suggest that it is larger. The possibility that the nucleation involves some sort of preparation process is supported by the observation that about 40% of tremors are preceded by foreshocks. Once the rupture has initiated it begins to propagate along the fault surface. The mechanics of this process are poorly understood, partly because it is difficult to recreate the high sliding velocities in a laboratory. Also the effects of strong ground motion make it very difficult to record information close to a nucleation zone.
Rupture propagation is generally modeled using a fracture mechanics approach, likening the rupture to a propagating mixed mode shear crack. The rupture velocity is a function of the fracture energy in the volume around the crack tip, increasing with decreasing fracture energy. The velocity of rupture propagation is orders of magnitude faster than the displacement velocity across the fault. Tremor ruptures typically propagate at velocities that are in the range 70–90% of the S-wave velocity and this is independent of tremor size. A small subset of tremor ruptures appears to have propagated at speeds

greater than the S-wave velocity. These supershear tremors have all been observed during large strike-slip events. The unusually wide zone of coseismic damage caused by the 2001 Kunlun tremor has been attributed to the effects of the sonic boom developed in such tremors. Some tremor ruptures travel at unusually low velocities and are referred to as slow tremors. A particularly dangerous form of slow tremor is the tsunami tremor, observed where the relatively low felt intensities, caused by the slow propagation speed of some great tremors, fail to alert the population of the neighbouring coast, as in the 1896 Meiji-Sanriku tremor.
1.8 .7 Tidal forces
Research work has shown a robust correlation between small tidally induced forces and non-volcanic tremor activity.
1.8 .8 Earthquake clusters
Most tremors form part of a sequence, related to each other in terms of location and time. Most tremor clusters consist of small tremors that cause little to no damage, but there is a hypothesis that tremors can recur in a regular pattern.
1.8 .9 Aftershocks
An aftershock is a tremor that occurs after a previous tremor, the mainshock. An aftershock is in the same region of the main shock but always of a smaller magnitude. If an aftershock is larger than the main shock, the aftershock is redesignated as the main shock and the original main shock is redesignated as a foreshock. Aftershocks are formed as the crust around the displaced fault plane adjusts to the effects of the main shock.
1.8 .10 Earthquake swarms
Earthquake swarms are sequences of tremors striking in a specific area within a short phase of time. They are different from tremors followed by a series of aftershocks by the fact that no single tremor in the sequence is obviously the main shock, consequently none have notable higher magnitudes than the other. An example of a tremor swarm is the 2004 activity at Yellowstone National Park. In August 2012, a swarm of tremors shook Southern California's Imperial Valley, showing the most recorded activity in the area since the 1970s.
1.8 .11 Earthquake storms
Sometimes a series of tremors occurs in a sort of tremor storm, where the tremors strike a fault in clusters, each triggered by the shaking or stress redistribution of the previous tremors. Alike to aftershocks but on adjacent segments of fault, these storms occur over the course of years, and with some of the later tremors as damaging as the early ones. Such a pattern was observed in the sequence of about a dozen tremors that struck the North Anatolian Fault in Turkey in the 20th century and has been inferred for older anomalous clusters of large tremors in the Middle East.
1.8 .12 Size and frequency of occurrence

It is estimated that around 500,000 tremors occur each year, detectable with current instrumentation. About 100,000 of these can be felt. Minor tremors occur nearly constantly around the world in places like California and Alaska in the U.S., as well as in Mexico, Guatemala, Chile, Peru, Indonesia, Iran, Pakistan, the Azores in Portugal, Turkey, New Zealand, Greece, Italy, India and Japan, but tremors can occur almost anywhere, including New York City, London, and Australia. Larger tremors occur less frequently, the relationship being exponential; for example, roughly ten times as many tremors larger than magnitude 4 occur in a particular time phase than tremors larger than magnitude 5. In the (low seismicity) United Kingdom, for example, it has been calculated that the average recurrences are: a tremor of 3.7–4.6 every year, a tremor of 4.7–5.5 every 10 years, and an earthquake of 5.6 or larger every 100 years. This is an example of the Gutenberg–Richter law.
The number of seismic stations has increased from about 350 in 1931 to many thousands today. As a result, many more tremors are reported than in the past, but this is because of the vast improvement in instrumentation, rather than an increase in the number of tremors. The United States Geological Survey estimates that, since 1900, there have been an average of 18 major tremors (magnitude 7.0–7.9) and one great tremor (magnitude 8.0 or greater) per year, and that this average has been relatively stable. In recent years, the number of major tremors per year has decreased, though this is probably a statistical fluctuation rather than a systematic trend. More detailed statistics on the size and frequency of tremors is available from the United States Geological Survey (USGS). A recent increase in the number of major tremors has been noted, which could be explained by a cyclical pattern of phases of intense tectonic activity, interspersed with longer phases of low-intensity. However, accurate recordings of tremors only began in the early 1900s, so it is too early to categorically state that this is the case.
Most of the world's tremors (90%, and 81% of the largest) take place in the 40,000 km long, horseshoe-shaped zone called the circum-Pacific seismic belt, known as the Pacific Ring of Fire, which for the most part bounds the Pacific Plate. Massive tremors tend to occur along other plate boundaries, too, such as along the Himalayan Mountains.
With the rapid growth of mega-cities such as Mexico City, Tokyo and Tehran, in areas of high seismic risk, some seismologists are warning that a single quake may claim the lives of up to 3 million people.
1.8 .13 Induced seismicity
While most tremors are caused by movement of the Earth's tectonic plates, human activity can also produce tremors. Four main activities contribute to this phenomenon: storing large amounts of water behind a dam (and possibly building an extremely heavy building), drilling and injecting liquid into wells, and by coal mining and oil drilling. Perhaps the best known example is the 2008 Sichuan tremor in China's Sichuan Province in May; this tremor resulted in 69,227 fatalities and is the 19th deadliest tremor of all time. The Zipingpu Dam is believed to have fluctuated the pressure of the fault 1,650 feet (503 m) away; this pressure probably increased the power of the tremor and accelerated the rate of movement for the fault. The greatest tremor in Australia's history is also claimed to be induced by humanity, through coal mining. The city of Newcastle was built over a large sector of coal mining areas. The tremor has been reported to be spawned from a fault that reactivated due to the millions of tonnes of rock removed in the mining process.

1.8 .14 Measuring and locating earthquakes
Earthquakes can be recorded by seismometers up to great distances, because seismic waves travel through the whole Earth's interior. The absolute magnitude of a quake is conventionally reported by numbers on the Moment magnitude scale (formerly Richter scale, a magnitude 7 causing serious damage over large areas), whereas the felt magnitude is reported using the modified Mercalli intensity scale (intensity II–XII).
Every tremor produces different types of seismic waves, which travel through rock with different velocities:
Longitudinal P-waves (shock- or pressure waves) Transverse S-waves (both body waves) Surface waves — (Rayleigh and Love waves)
The propagation velocity of the seismic waves ranges from approx. 3 km/s up to 13 km/s, depending on the density and elasticity of the medium. In the Earth's interior the shock- or P waves travel much faster than the S waves (approx. relation 1.7 : 1). The differences in travel time from the epicenter to the observatory are a measure of the distance and can be used to image both sources of quakes and structures within the Earth. Also the depth of the epicenter can be computed roughly.
In solid rock P-waves travel at about 6 to 7 km per second; the velocity increases within the deep mantle to ~13 km/s. The velocity of S-waves range from 2–3 km/s in light sediments and 4–5 km/s in the Earth's crust up to 7 km/s in the deep mantle. As a consequence, the first waves of a distant tremor arrive at an observatory via the Earth's mantle.
On average, the kilometer distance to the tremor is the number of seconds between the P and S wave times 8. Slight deviations are caused by inhomogeneities of subsurface structure. By such analyses of seismograms the Earth's core was located in 1913 by Beno Gutenberg.
Tremors are not only categorized by their magnitude but also by the place where they occur. The world is divided into 754 Flinn-Engdahl regions (F-E regions), which are based on political and geographical boundaries as well as seismic activity. More active zones are divided into smaller F-E regions whereas less active zones belong to larger F-E regions.
Standard reporting of tremors includes its magnitude, date and time of occurrence, geographic coordinates of its epicenter, depth of the epicenter, geographical region, distances to population centers, location uncertainty, a number of parameters that are included in USGS tremor reports (number of stations reporting, number of observations, etc.), and a unique event ID.
1.8 .15 Effects of earthquakes
The effects of earthquakes include, but are not limited to, the following:
1.8 .15.1 Shaking and ground rupture
Shaking and ground rupture are the main effects created by tremors, principally resulting in more or less severe damage to buildings and other rigid structures. The severity of the local effects depends on the complex combination of the tremor magnitude, the distance from the epicenter, and the local geological
and geomorphological conditions, which may amplify or reduce wave propagation. The ground-shaking is measured by ground acceleration.
Specific local geological, geomorphological, and geostructural features can induce high levels of shaking on the ground surface even from low-intensity tremors. This effect is called site or local amplification. It is principally due to the transfer of the seismic motion from hard deep soils to soft superficial soils and to effects of seismic energy focalization owing to typical geometrical setting of the deposits.
Ground rupture is a visible breaking and displacement of the Earth's surface along the trace of the fault, which may be of the order of several meters in the case of major tremors. Ground rupture is a major risk for large engineering structures such as dams, bridges and nuclear power stations and requires careful mapping of existing faults to identify any which are likely to break the ground surface within the life of the structure.
1.8 .15.2 Landslides and avalanches
Tremors, along with severe storms, volcanic activity, coastal wave attack, and wildfires, can produce slope instability leading to landslides, a major geological hazard. Landslide danger may persist while emergency personnel are attempting rescue.
1.8 .15.3 Fires
Tremors can cause fires by damaging electrical power or gas lines. In the event of water mains rupturing and a loss of pressure, it may also become difficult to stop the spread of a fire once it has started. For example, more deaths in the 1906 San Francisco tremor were caused by fire than by the tremor itself.
1.8 .15.4 Soil liquefaction
Soil liquefaction occurs when, because of the shaking, water-saturated granular material (such as sand) temporarily loses its strength and transforms from a solid to a liquid. Soil liquefaction may cause rigid structures, like buildings and bridges, to tilt or sink into the liquefied deposits. For example, in the 1964 Alaska tremor, soil liquefaction caused many buildings to sink into the ground, eventually collapsing upon themselves.
Tsunamis are long-wavelength, long-phase sea waves produced by the sudden or abrupt movement of large volumes of water. In the open sea the distance between wave crests can surpass 100 kilometers (62 mi), and the wave phases can vary from five minutes to one hour. Such tsunamis travel 600-800 kilometers per hour (373–497 miles per hour), depending on water depth. Large waves produced by an tremor or a submarine landslide can overrun nearby coastal areas in a matter of minutes. Tsunamis can also travel thousands of kilometers across open sea and wreak destruction on far shores hours after the tremor that generated them.
Ordinarily, subduction tremors under magnitude 7.5 on the Richter scale do not cause tsunamis, although some instances of this have been recorded. Most destructive tsunamis are caused by tremors of magnitude 7.5 or more.

1.8 .15.5 Floods
A flood is an overflow of any amount of water that reaches land. Floods occur usually when the volume of water within a body of water, such as a river or lake, exceeds the total capacity of the formation, and as a result some of the water flows or sits outside of the normal perimeter of the body. However, floods may be secondary effects of tremors, if dams are damaged. Tremors may cause landslips to dam rivers, which collapse and cause floods.
The terrain below the Sarez Lake in Tajikistan is in danger of catastrophic flood if the landslide dam formed by the tremor, known as the Usoi Dam, were to fail during a future tremor. Impact projections suggest the flood could affect roughly 5 million people.
1.8 .16 Human impacts
An tremor may cause injury and loss of life, road and bridge damage, general property damage (which may or may not be covered by tremor insurance), and collapse or destabilization (potentially leading to future collapse) of buildings. The aftermath may bring disease, lack of basic necessities, and higher insurance premiums.
1.9 Weathering
Weathering causes the disintegration of rock near the surface of the earth. Plant and animal life, atmosphere and water are the major causes of weathering. Weathering breaks down and loosens the surface minerals of rocks so they can be transported away by agents of erosion such as water, wind and ice. There are two types of weathering: mechanical and chemical.
1.9.1 Mechanical Weathering Mechanical weathering is the disintegration of rock into smaller and smaller fragments. Frost action is an effective form of mechanical weathering. When water trickles down into the fractures and pores of rock, then freezes, its volume increases by almost 10 percent. This causes the outward pressure of about 30,000 pounds per square inch at -7.6 Fahrenheit. Frost action causes rocks to be broken apart into angular fragments. Idaho's extreme temperature range in the high country causes frost action to be a very important form of weathering.
Exfoliation is a form of mechanical weathering in which curved plates of rock are stripped from rock below. This results in exfoliation domes or dome-like hills and rounded boulders. Exfoliation domes occur along planes of parting calls joints, which are curved more or less parallel to the surface. These joints are several inches apart near the surface but increase in distance to several feet apart with depth. One after another these layers are spelled off resulting in rounded or dome-shaped rock forms. Most people believe exfoliation is caused by instability as a result of drastically reduced pressure at the earth's surface allowing the rock to expand.
Exfoliation domes are best developed in granitic rock. Yosemite National Park has exceptional examples of exfoliation domes. Idaho has good examples in the Quiet City of Rocks near Oakley as well as in many parts of the granitic Idaho Batholith. In fact, these characteristic rounded forms make rock exposure of the granitic Idaho Batholith easy to identify.
Another type of exfoliation occurs where boulders are spheroidally weathered. These boulders are rounded by concentric shells of rock spalling off, alike to the way shells may be removed from an onion.

The outer shells are formed by chemical weathering of certain minerals to a product with a greater volume than the original material. For example, feldspar in granite is converted to clay which occupies a larger volume. Igneous rocks are very susceptible to mechanical weathering.
1.9.2 Chemical Weathering Chemical weathering transforms the original material into a substance with a different composition and different physical characteristics. The new substance is typically much softer and more susceptible to agents of erosion than the original material. The rate of chemical weathering is greatly accelerated by the presence of warm temperatures and moisture. Also, some minerals are more vulnerable to chemical weathering than others. For example, feldspar is far more reactive than quartz.
Differential weathering occurs when some parts of a rock weather at different rates than others. Excellent examples of differential weathering occur in the Idavada silicic volcanic rocks in the Snake River Plains. Balanced Rock and the Gooding City of Rocks are outstanding examples of differential weathering.
1.10 Running Water and Fluvial Landforms
1.10.1 Running water
Running water is the most powerful agent of erosion. Continents are eroded primarily by running water at an average rate of 1 inch every 750 years. The velocity of a stream increases as its gradient increases but velocity is also influenced by factors such as degree of turbulence, position within the river, the course of the stream, the shape of the channel and the stream load.
1.10.1.1 River Cycles Stages in the cycle of river erosion are labeled as youth, maturity and old age. Each stage has certain characteristics that are not necessarily related to age in years - only phases in development. Typically, rivers tend to have old-age-type development at their initial mouths and youthful development at their upper reaches. So the three stages may grade imperceptibly from one to another and also from one end of the stream to the other.
The youthful stage is characterized by rapid downcutting, high stream gradient, steep-sided valleys with narrow bottoms and waterfalls. The mature stage is characterized by a longer, smoother profile and no waterfalls or rapids.
The gradient is normally expressed as the number of feet a stream descends each mile of flow. In general, a stream's gradient decreases from its headwaters toward its mouth, resulting in a longitudinal profile concave towards the sky.
1.10.1.2 Base Level The base level of a stream is defined as the lowest level to which a stream can erode its channel. An obstacle such as a resistant rock across a stream can create a temporary base level. For example, if a stream passes into a lake, it cannot erode below the level of the lake until the lake is destroyed. Consequently different stretches of a river may be influenced by several temporary base levels. Of course the erosive power of a stream is always influenced by the sea which is the ultimate base level below which no stream can erode. Many streams in Idaho eventually reach the sea through the Columbia River.
If the base level is raised in some manner such as by a landslide blocking a stream, the stream's velocity is reduced and it can no longer carry as much material. Sedimentary material will then be deposited in the
lake formed by the landslide. Conversely, if the base level is lowered, the stream will begin to erode its channel downward.
1.10.1.3 Transportation of Material Running water transports material in 3 ways: solution, suspension and by rolling and bouncing on the stream bottom. Dissolved material is carried in suspension. About 270 million tons of dissolved material are delivered yearly to the oceans from streams in the United States. Particles of clay, silt and sand are generally carried along in the turbulent current of a stream. Some particles are too large and heavy to be picked up by water currents, but may be pushed and shoved along the stream bed.
1.10.1.4 Waterfalls Waterfalls are a fascinating and relatively rare occurrence. Waterfalls may be caused in several ways. For example, where a relatively resistant bed of rock overlies less resistant rock, undermining of the less resistant rocks can cause a fall. Waterfalls are short-lived features in the history of a stream as they are created by a temporary base level. As time passes, falls may slowly retreat upstream, perhaps as rapidly as several feet per year. There are many spectacular waterfalls in Idaho, including the 212-foot-high Shoshone Falls in the Snake River Canyon just north of Twin Falls.
1.10.2 Fluvial Landforms
Fluvial is a term used in geography and Earth science to refer to the processes associated with rivers and streams and the deposits and landforms created by them. When the stream or rivers are associated with glaciers, ice sheets, or ice caps, the term glaciofluvial or fluvioglacial is used.
1.10.2.1 Fluvial processes
Fluvial processes include the motion of sediment and erosion or deposition on the river bed.
Erosion by moving water can happen in two ways. Firstly, the movement of water across the bed exerts a shear stress directly onto the bed. If the cohesive strength of the substrate is lower than the shear exerted, or the bed is composed of loose sediment which can be mobilized by such stresses, then the bed will be lowered purely by clear water flow. However, if the river carries significant quantities of sediment, this material can act as tools to enhance wear of the bed (abrasion). At the same time the fragments themselves are ground down, becoming smaller and more rounded (attrition).
Sediment in rivers is transported as either bedload (the coarser fragments which move close to the bed) or suspended load (finer fragments carried in the water). There is also a component carried as dissolved material.
For each grain size there is a specific velocity at which the grains start to move, called entrainment velocity. However the grains will continue to be transported even if the velocity falls below the entrainment velocity due to the reduced (or removed) friction between the grains and the river bed. Eventually the velocity will fall low enough for the grains to be deposited. This is shown by the Hjulstrøm curve.
A river is continually picking up and dropping solid particles of rock and soil from its bed throughout its length. Where the river flow is fast, more particles are picked up then dropped. Where the river flow is slow, more particles are dropped than picking up. Areas where more particles are dropped are called alluvial or flood plains, and the dropped particles are called alluvium.
Even small streams make alluvial deposits, but it is in the flood plains and deltas of large rivers that large, geologically-significant alluvial deposits are found.
The amount of matter carried by a large river is enormous. The names of many rivers derive from the color that the transported matter gives the water. For example, the Huang He in China is literally translated "Yellow River", and the Mississippi River in the United States is also called "the Big Muddy." It has been estimated that the Mississippi River annually carries 406 million tons of sediment to the sea, the Huang He 796 million tons, and the Po River in Italy 67 million tons.
1.11 Wind and Aeolian Landform
Aeolian landforms are features of the Earth's surface produced by either the erosive or constructive action of the wind. This process is not unique to earth, and it has been observed and studied on other planets, including Mars.
1.11.1 Terminology
The word derives from Æolus, the Greek god of the winds, and the son of Hellen and the nymph Orseis, and a brother of Dorus, Xuthus and Amphictyon.
1.11.2 Mechanism
In Aeolian processes, wind transports and deposits particles of sediment. Aeolian features form in areas where wind is the primary source of erosion. The particles deposited are of sand, silt and clay size. The particles are entrained in by one of four processes. Creep occurs when a particle rolls or slides across the surface. Lift occurs when a particle rises off the surface due to the Bernoulli effect. If the airflow is turbulent, larger particles are transported by a process known as saltation. Lastly, impact transport occurs which one particle strikes another causing the second particle to move.
1.11.3 Erosional landforms
Wind eroded landforms are rarely preserved on the surface of the Earth except in arid regions. Elsewhere, moving water erases the Aeolian landforms. There are several types of landforms associated with erosion: lag deposits, ventifacts, yardangs and pans. Large basins are complex and there is often one or more non-Aeolian process at work, including tectonics, glacial and alluvial forces.
1.12 Glacial landform
Glacial landforms are landforms created by the action of glaciers. Most of today's glacial landforms were created by the movement of large ice sheets during the Quaternary glaciations. Some areas, like Fennoscandia and the southern Andes, have extensive occurrences of glacial landforms; other areas, such as the Sahara, display very old fossil glacial landforms.
1.12.1 Erosional landforms
As the glaciers extended , due to their accumulating weight of snow and ice, they crush and abrade scoured surface rocks and bedrock. The resulting erosional landforms include striations, cirques, glacial horns, arêtes, trim lines, U-shaped valleys, roaches moutonnées, overdeepenings and hanging valleys.
Cirque: Starting location for mountain glaciers U-shaped valley: U-shaped valleys are created by mountain glaciers. When filled with sea water
so as to create an inlet, these valleys are called fjords. Arête: spiky high land between two glaciers, if the glacial action erodes through, a spillway (or
col) is formed
1.12.2 Depositional landforms
Later, when the glaciers retreated leaving behind their freight of crushed rock and sand (glacial drift), they created characteristic depositional landforms. Examples include glacial moraines, eskers, and Kames. Drumlins and ribbed moraines are also landforms left behind by retreating glaciers. The stone walls of New England contain many glacial erratics, rocks that were dragged by a glacier many miles from their bedrock origin.
Esker: Built up bed of a sub-glacial stream. Kame: Irregularly shaped mound. Moraine: Feature can be terminal (at the end of a glacier), lateral (along the sides of a glacier), or
medial (formed by the emerger of lateral moraines from contributary glaciers). Outwash fan: Braided stream flowing from the front end of a glacier.
1.12.3 Glacial lakes and ponds
Lakes and ponds may also be caused by glacial movement. Kettle lakes form when a retreating glacier leaves behind an underground or surface chunk of ice that later melts to form a depression containing water. Moraine-dammed lakes occur when a stream (or snow runoff) is dammed by glacial debris. Jackson Lake and Jenny Lake in Grand Teton National Park are examples of moraine-dammed lakes, although Jackson Lake is also enhanced by a man-made dam.
Kettle lake: Depression, formed by a block of ice separated from the main glacier, in which the lake forms.
Glacial Lake: A lake that formed between the front of a glacier and the last terminal moraine. Usually it is no longer in existence.
1.12.4 Ice Features
Apart from the landforms left behind by glaciers, glaciers themselves may be striking features of the terrain, particularly in the polar regions of the earth. Notable examples include valley glaciers where glacial flow is restricted by the valley walls, crevasses in the upper section of glacial ice, and icefalls, the ice equivalent of waterfalls.
Review Questions
1. Define the Earth?
2. Explain the Geological Time Scale?
3. Explain the Rocks?
4. Explain the Earthquakes?

Discussion Questions
Discuss the Interior of Earth and its parts?
Chapter 2- Climatology
Learning Objectives
To define the Structure and Composition of Atmosphere.
To explain the Temperature.

To explain the Pressure Belts and Wind System.
To describe the Clouds and Rainfall.
2.1 Introduction
Climatology is the scientific study of climates, which is defined as the mean weather conditions over a phase of time. A branch of study within atmospheric sciences, it also takes into account the variables and averages of short-term and long-term weather conditions. Climatology is different than meteorology and can be divided into different areas of study.
Various approaches to this field can be taken, including paleoclimatology, which focuses on studying the climate over the course of the Earth’s existence by examining records of tree rings, rocks and sediment, and ice cores. Historical climatology focuses primarily on climate changes throughout history and the effects of the climate on people and events over time.
Though both climatology and meteorology are areas of study that are considered branches of alike areas of study, climatology differs from meteorology because its focus is on averages of weather and climatic conditions over a long phase of time. Meteorology focuses more on current weather conditions such as humidity, air pressure, and temperatures and forecasting the short-term weather conditions to come.
Climatology and meteorology may be used in conjunction with one another, especially at weather centers that create base models to watch larger, developing and changing weather patterns such as hurricanes and tropical storms. Climatology however, focuses also on how the changes in climate occur and how those changes may affect future conditions. It and other branches of atmospheric or environmental science are studied at numerous four-year universities. A climatologist is the name given to a person who has extensively studied this subject.
Climatologists work in various locations for various organizations. In most cases, it is considered a research field and people in this field may work also in biology, zoology, or environmental fields. Climatology is important in all these fields because long-term changes in climate can affect the future of crop production, energy, animals, and even humans.
2.2 Structure and Composition of Atmosphere
An atmosphere is a layer of gases surrounding a material body of sufficient mass that is held in place by the gravity of the body. An atmosphere is more likely to be retained if the gravity is high and the atmosphere's temperature is low.
The earth's atmosphere, which contains oxygen used by most organisms for respiration and carbon dioxide used by plants, algae and cyanobacteria for photosynthesis, also protects living organisms from genetic damage from solar ultraviolet radiation. Its current composition is the product of billions of years of biochemical modification of the paleoatmosphere by living organisms.
The term stellar atmosphere explains the outer region of a star, and typically includes the portion starting from the opaque photosphere outwards. Stars with sufficiently low temperatures may form compound molecules in their outer atmosphere.

2.2.1 Atmospheric escape
Atmospheric escape is the loss of planetary atmospheric gases to outer space.
2.2.1.1 Thermal escape mechanisms
One classical thermal escape mechanism is Jeans escape. In a quantity of gas, the average velocity of a molecule is determined by temperature, but the velocity of individual molecules varies continuously as they collide with one another, gaining and losing kinetic energy. The variation in kinetic energy among the molecules is explaind by the Maxwell distribution. The kinetic energy and mass of a molecule
determine its velocity by .
Individual molecules in the high tail of the distribution may reach escape velocity, at a level in the atmosphere where the mean free path is comparable to the scale height, and leave the atmosphere.
The more massive the molecule of a gas is, the lower the average velocity of molecules of that gas at a given temperature, and the less likely it is that any of them reach escape velocity.
This is why hydrogen escapes from an atmosphere more easily than does carbon dioxide. Also, if the planet has a higher mass, the escape velocity is greater, and fewer particles will escape. This is why the gas giant planets still retain significant amounts of hydrogen and helium, which have largely escaped from Earth's atmosphere. The distance a planet orbits from a star also plays a part; a close planet has a hotter atmosphere, with a range of velocities shifted into the higher end of the distribution, hence, a greater likelihood of escape. A distant body has a cool atmosphere, with a range of lower velocities, and less chance of escape. This helps Titan, which is small compared to Earth but further from the Sun, retain its atmosphere.
While it has not been observed, it is theorized that an atmosphere with a high enough pressure and temperature can undergo a "hydrodynamic escape." In this situation atmosphere simply flows off into space, driven by thermal energy. Here it is possible to lose heavier molecules that would not normally be lost.
2.2.1.2 Significance of solar winds
The relative importance of each loss process is a function of planet mass, its atmosphere composition, and its distance from its sun. A common erroneous belief is that the primary non-thermal escape mechanism is atmospheric stripping by a solar wind in the absence of a magnetosphere. Excess kinetic energy from solar winds can impart sufficient energy to the atmospheric particles to allow them to reach escape velocity, causing atmospheric escape. The solar wind, composed of ions, is deflected by magnetic fields because the charged particles within the wind flow along magnetic field lines. The presence of a magnetic field thus deflects solar winds, preventing the loss of atmosphere. On Earth, for instance, the interaction between the solar wind and earth's magnetic field deflects the solar wind about the planet, with near total deflection at a distance of 10 Earth radii. This region of deflection is called a bow shock.
Depending on planet size and atmospheric composition, however, a lack of magnetic field does not determine the fate of a planet's atmosphere. Venus, for instance, has no powerful magnetic field. Its close proximity to the Sun also increases the speed and the number of particles, and would presumably cause

the atmosphere to be stripped almost entirely, much like that of Mars. Despite this, the atmosphere of Venus is two orders of magnitude denser than Earth's. Recent models indicate that stripping by solar wind accounts for less than 1/3 of total non-thermal loss processes.
While Venus and Mars have no magnetosphere to protect the atmosphere from solar winds, photoionizing radiation (sunlight) and the interaction of the solar wind with the atmosphere of the planets causes ionization of the uppermost part of the atmosphere. This ionized region, in turn induces magnetic moments that deflect solar winds much like a magnetic field. This limit solar-wind effects to the uppermost altitudes of the atmosphere, roughly 1.2–1.5 planetary radii away from the planet, or an order of magnitude closer to the surface than Earth's magnetic field creates. Beyond this region, called a bow shock, the solar wind is slowed to subsonic velocities. Nearer to the surface, solar-wind dynamic pressure achieves a balance with the pressure from the ionosphere, in a region called the ionopause. This interaction typically prevents solar wind stripping from being the dominant loss process of the atmosphere.
2.2.1.3 Comparison of non-thermal loss processes based on the planet and particle mass
The dominant non-thermal loss processes depend on the planetary body. The relative significance of each process depends on planetary mass, atmospheric composition, and distance from the sun. The dominant non-thermal loss processes for Venus and Mars, two terrestrial planets neither with magnetic fields, are disliked. The dominant non-thermal loss process on Mars is from solar winds, as the atmosphere is not dense enough to shield itself from the winds during peak solar activity. Venus is somewhat shielded from solar winds because of its dense atmosphere and as a result, solar pick-up is not its dominant non-thermal loss process. Smaller bodies without magnetic fields are more likely to suffer from solar winds, as the planet is too small to have sufficient gravity to produce a dense enough atmosphere and stop solar wind pick-up.
The dominant loss process for Venus' atmosphere is through electric force field acceleration. As electrons are less massive than other particles, they are more likely to escape from the top of Venus's ionosphere. As a result, a minor net positive charge develops. That net positive charge, in turn, creates an electric field that can accelerate other positive charges out of the atmosphere. As a result, H+ ions are accelerated beyond escape velocity. Other important loss processes on Venus are photochemical reactions driven by Venus's proximity to the Sun. Photochemical reactions rely on the splitting of molecules into constituent atoms, often with a significant portion of the kinetic energy carried off in the less massive particle with sufficiently high kinetic energy to escape. Oxygen, relative to hydrogen, is not of sufficiently low mass to escape through this mechanism.
2.2.1.4 Phenomena of non-thermal loss processes on moons with atmospheres
Several moons within the Solar System have atmospheres and are subject to atmospheric loss processes. They typically have no magnetic fields of their own, but orbit planets with powerful magnetic fields. Many of these moons lie within the magnetic fields generated by the planets and are less likely to undergo sputtering and pick-up. The shape of the bow shock, however, allows for some moons, such as Titan, to pass through the bow shock when their orbits take them between the Sun and their primary. Titan spends roughly half of its transit time outside of the bow-shock and being subjected to unimpeded solar winds. The kinetic energy gained from pick-up and sputtering associated with the solar winds increases thermal escape throughout the transit of Titan, causing the neutral hydrogen to escape from the moon. The escaped hydrogen maintains an orbit following in the wake of Titan, creating a neutral hydrogen torus around Saturn. Io, in its transit around Jupiter, encounters a plasma cloud. Interaction with the plasma
cloud induces sputtering, kicking off sodium particles. The interaction produces a stationary banana-shaped charged sodium cloud along a part of the orbit of Io.
2.2.1.5 Impact erosion
The impact of a large meteoroid can lead to the loss of atmosphere. If a collision is energetic enough, it is possible for ejecta, including atmospheric molecules, to reach escape velocity. Just one impact such as the Chicxulub event does not lead to a significant loss, but the terrestrial planets went through enough impacts when they were forming for this to matter.
2.2.1.6 Sequestration
This is a loss, not an escape; it is when molecules solidify out of the atmosphere onto the surface. This happens on Earth, when water vapor forms glacial ice or when carbon dioxide is sequestered in sediments. The dry ice caps on Mars are also an example of this process.
One mechanism for sequestration is chemical; for example, most of the carbon dioxide of the Earth's original atmosphere has been chemically sequestered into carbonate rock. Very likely a alike process has occurred on Mars. Oxygen can be sequestered by oxidation of rocks; for example, by increasing the oxidation states of ferric rocks from Fe2+ to Fe3+. Gases can also be sequestered by adsorption, where fine particles in the regolith capture gas which adheres to the surface particles.
2.2.1.7 Dominant atmospheric escape and loss processes on Earth
The earth is too large to lose a significant proportion of its atmosphere through Jeans escape. The current rate of loss is about three kilograms (3 kg) of hydrogen and 50 grams (50 g) of helium per second. The exosphere is the high-altitude region where the atmospheric density is sparse and Jeans escape occurs. Jeans escape calculations assuming an exosphere temperature of 1,800degrees show that to deplete O+ ions by a factor of e (2.718...) would take nearly a billion years. 1,800degrees is higher than the actual observed exosphere temperature; at the actual average exosphere temperature, depletion of O+ ions would not occur even after a trillion years. Furthermore, most oxygen on Earth is bound as O2, which is too massive to escape Earth by Jeans escape.
Earth's magnetic field protects it from solar winds and prevents escape of ions, except along open field lines at the magnetic poles. The gravitational attraction of Earth's mass prevents other non-thermal loss processes from appreciably depleting the atmosphere. Yet Earth's atmosphere is two orders of magnitude less dense than that of Venus at the surface. Because of the temperature regime of Earth, CO2 and H2O are sequestered in the hydrosphere and lithosphere. H2O vapor is sequestered as liquid H2O in oceans, greatly decreasing the atmospheric density. With liquid water running over the surface of Earth, CO2 can be drawn down from the atmosphere and sequestered in sedimentary rocks. Some estimates indicate that nearly all carbon on Earth is contained in sedimentary rocks, with the atmospheric portion being approximately 1/250,000 of the Earth's CO2 reservoir. If both of the reservoirs were released to the atmosphere, the Earth's atmosphere would be even denser than Venus's atmosphere. Consequently, the dominant ―loss‖ mechanism of Earth's atmosphere does not escape to space, but sequestration..

2.2.1.8 Atmospheric pressure
One standard is standard pressure used for pneumatic fluid power (ISO R554), and in the aerospace (ISO 2533) and petroleum (ISO 5024) industries.
In 1971, the International Union of Pure and Applied Chemistry (IUPAC) said that for the purposes of specifying the properties of substances, "the standard pressure" should be defined as precisely 100 kPa (≈750.01 torr) or 29.53 inHg rather than the 101.325 kPa value of "one standard atmosphere". This value is used as the standard pressure for the compressor and the pneumatic tool industries (ISO 2787).
In the United States, compressed air flow is often measured in "standard cubic feet" per unit of time, where the "standard" means the equivalent quantity of air at standard temperature and pressure.
For every 300 meters (≈1,000 feet) one ascends, the atmospheric pressure decreases by about 4%. However, this standard atmosphere is defined slightly differently: temperature = 20 °C (68 °F), air density = 1.225 kg/m³ (0.0765 lb/cu ft), altitude = sea level, and relative humidity = 20%.
In the air conditioner industry, the standard is often temperature = 0 °C (32 °F) instead. For natural gas, the Gas Processors Association (GPA) specifies a standard temperature of 60 °F (15.6 °C), but allows a variety of "base" pressures, including 14.65 psi (101.0 kPa), 14.656 psi (101.05 kPa), 14.73 psi (101.6 kPa) and 15.025 psi (103.59 kPa). For a given "base" pressure, the higher the air pressure, the colder it is; the lower the air pressure, the warmer it is.
2.2.1.9 Mean sea level pressure
The mean sea level pressure (MSLP) is the atmospheric pressure at sea level or (when measured at a given elevation on land) the station pressure reduced to sea level assuming that the temperature falls at a lapse rate of 6.5 K per km in the fictive layer of air between the station and sea level.
This is the atmospheric pressure normally given in weather reports on radio, television, and newspapers or on the Internet. When barometers in the home are set to match the local weather reports, they measure pressure reduced to sea level, not the actual local atmospheric pressure.
The reduction to sea level means that the normal range of fluctuations in atmospheric pressure is the same for everyone. The pressures that are considered high pressure or low pressure do not depend on geographical location. This makes isobars on a weather map meaningful and useful tools.
The altimeter setting in aviation, set either QNH or QFE, is another atmospheric pressure reduced to sea level, but the method of making this reduction differs slightly.
QNH
The barometric altimeter setting that will cause the altimeter to read airfield elevation when on the airfield. In ISA temperature conditions the altimeter will read altitude above mean sea level in the vicinity of the airfield
QFE
The barometric altimeter setting that will cause an altimeter to read zero when at the reference datum of a particular airfield (in general, a runway threshold). In ISA temperature conditions the altimeter will read height above the datum in the vicinity of the airfield.
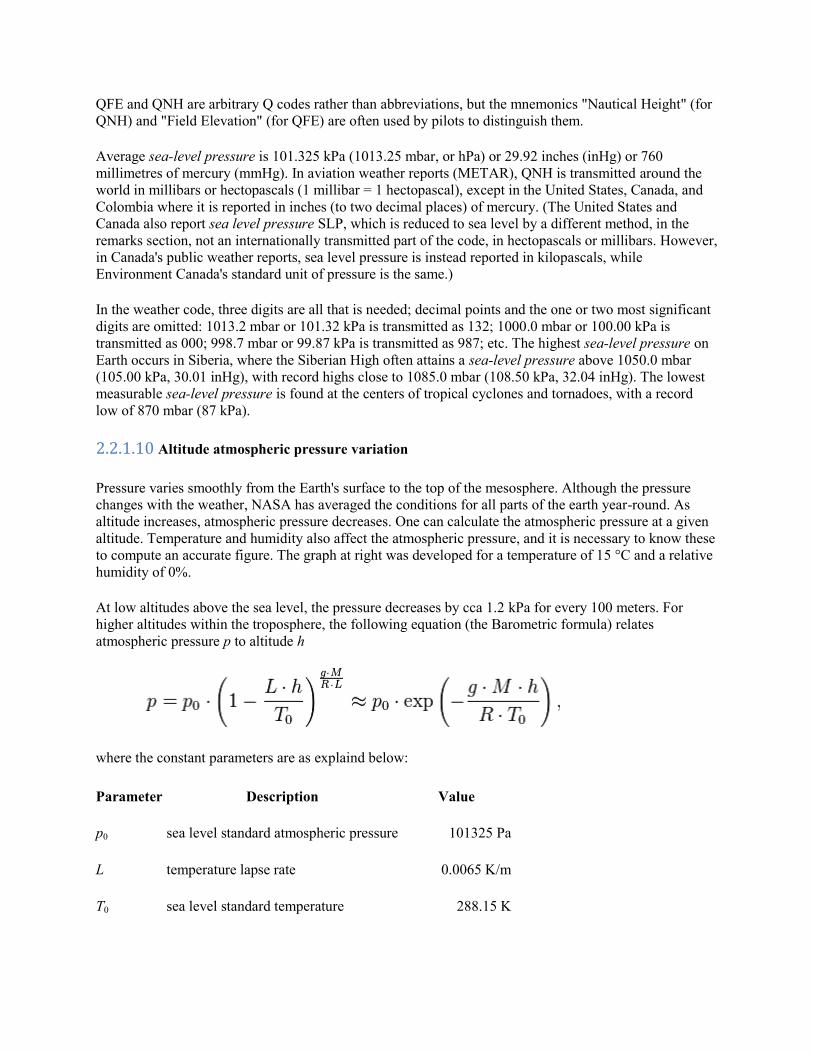
QFE and QNH are arbitrary Q codes rather than abbreviations, but the mnemonics "Nautical Height" (for QNH) and "Field Elevation" (for QFE) are often used by pilots to distinguish them.
Average sea-level pressure is 101.325 kPa (1013.25 mbar, or hPa) or 29.92 inches (inHg) or 760 millimetres of mercury (mmHg). In aviation weather reports (METAR), QNH is transmitted around the world in millibars or hectopascals (1 millibar = 1 hectopascal), except in the United States, Canada, and Colombia where it is reported in inches (to two decimal places) of mercury. (The United States and Canada also report sea level pressure SLP, which is reduced to sea level by a different method, in the remarks section, not an internationally transmitted part of the code, in hectopascals or millibars. However, in Canada's public weather reports, sea level pressure is instead reported in kilopascals, while Environment Canada's standard unit of pressure is the same.)
In the weather code, three digits are all that is needed; decimal points and the one or two most significant digits are omitted: 1013.2 mbar or 101.32 kPa is transmitted as 132; 1000.0 mbar or 100.00 kPa is transmitted as 000; 998.7 mbar or 99.87 kPa is transmitted as 987; etc. The highest sea-level pressure on Earth occurs in Siberia, where the Siberian High often attains a sea-level pressure above 1050.0 mbar (105.00 kPa, 30.01 inHg), with record highs close to 1085.0 mbar (108.50 kPa, 32.04 inHg). The lowest measurable sea-level pressure is found at the centers of tropical cyclones and tornadoes, with a record low of 870 mbar (87 kPa).
2.2.1.10 Altitude atmospheric pressure variation
Pressure varies smoothly from the Earth's surface to the top of the mesosphere. Although the pressure changes with the weather, NASA has averaged the conditions for all parts of the earth year-round. As altitude increases, atmospheric pressure decreases. One can calculate the atmospheric pressure at a given altitude. Temperature and humidity also affect the atmospheric pressure, and it is necessary to know these to compute an accurate figure. The graph at right was developed for a temperature of 15 °C and a relative humidity of 0%.
At low altitudes above the sea level, the pressure decreases by cca 1.2 kPa for every 100 meters. For higher altitudes within the troposphere, the following equation (the Barometric formula) relates atmospheric pressure p to altitude h
where the constant parameters are as explaind below:
Parameter Description Value
p0 sea level standard atmospheric pressure 101325 Pa
L temperature lapse rate 0.0065 K/m
T0 sea level standard temperature 288.15 K

g Earth-surface gravitational acceleration 9.80665 m/s2
M molar mass of dry air 0.0289644 kg/mol
R universal gas constant 8.31447 J/(mol•K)
2.2.1.11 Local atmospheric pressure variation
Atmospheric pressure varies widely on Earth, and these changes are important in studying weather and climate.
Atmospheric pressure shows a diurnal or semidiurnal (twice-daily) cycle caused by global atmospheric tides. This effect is strongest in tropical zones, with the amplitude of a few millibars, and almost zero in polar areas. These variations have two superimposed cycles, a circadian (24 h) cycle and semi-circadian (12 h) cycle.
2.2.1.12 Atmospheric pressure records
The highest adjusted-to-sea level barometric pressure ever recorded on Earth (above 750 meters) was 1,085.7 hectopascals (32.06 inHg) measured in Tosontsengel, Mongolia on 19 December 2001. The highest adjusted-to-sea level barometric pressure ever recorded (below 750 meters) was at Agata, Evenhiyskiy, Russia [66°53’N, 93°28’E, elevation: 261 m (856.3 ft)] on 31 December 1968 of 1,083.3 hectopascals (31.99 inHg). The discrimination is due to the problematic assumptions (assuming a standard lapse rate) associated with reduction of sea level from high elevations. The lowest non-tornadic atmospheric pressure ever measured was 870 hPa (25.69 inHg), set on 12 October 1979, during Typhoon Tip in the western Pacific Sea . The measurement was based on an instrumental observation made from a reconnaissance aircraft.
2.2.1.13 Atmospheric pressure based on depth of water
Atmospheric pressure is often measured with a mercury barometer, and a height of approximately 760 millimeters (30 in) of mercury is often used to illustrate (and measure) atmospheric pressure. However, since mercury is not a familiar substance to most people, water may provide a more intuitive way to visualize the pressure of one atmosphere.
One atmosphere (101 kPa or 14.7 psi) is the pressure caused by the weight of a column of fresh water of approximately 10.3 m (34 ft). Thus, a diver 10.3 m underwater experiences a pressure of about 2 atmospheres (1 atm of air plus 1 atm of water). This is the maximum height to which a column of water can be drawn up by suction at atmospheric pressure.
Low pressures such as natural gas lines are sometimes specified in inches of water, typically written as w.c. (water column) or W.G. (inches water gauge). A typical gas-using residential appliance is rated for a maximum of 14 w.c., which is approximately 35 hPa.
In general, non-professional barometers are aneroid barometers or strain gauge based.

2.2.1.14 Boiling point of water
Clean fresh water boils at about 100 °C (212 °F) at standard atmospheric pressure. The boiling point is the temperature at which the vapor pressure is equal to the atmospheric pressure around the water. Because of this, the boiling point of water is lower at lower pressure and higher at higher pressure. This is why cooking at elevations more than 1,100 m (3,600 ft) above sea level requires adjustments to the recipes. A rough approximation of elevation can be obtained by measuring the temperature at which water boils; in the mid-19th century, this method was used by explorers.
2.2.1.15 Composition
Initial atmospheric makeup is generally related to the chemistry and temperature of the local solar nebula during planetary formation and the subsequent escape of interior gases. The original atmospheres started with the radially local rotating gases that collapsed to the spaced rings that formed the planets. They were then modified over time by various complex factors, resulting in quite different outcomes.
The atmospheres of the planets Venus and Mars are primarily composed of carbon dioxide, with small quantities of nitrogen, argon, oxygen and traces of other gases.
The atmospheric composition on Earth is largely governed by the by-products of the very life that it sustains. Dry air from Earth's atmosphere contains 78.08% nitrogen, 20.95% oxygen, 0.93% argon, 0.038% carbon dioxide, and traces of hydrogen, helium, and other "noble" gases (by volume), but generally a variable amount of water vapor is also present, on average about 1%.
The low temperatures and higher gravity of the gas giants — Jupiter, Saturn, Uranus and Neptune — allows them more readily to retain gases with low molecular masses. These planets have hydrogen-helium atmospheres, with trace amounts of more complex compounds.
Two satellites of the outer planets possess non-negligible atmospheres: Titan, a moon of Saturn, and Triton, a moon of Neptune, which are mainly nitrogen. Pluto, in the nearer part of its orbit, has an atmosphere of nitrogen and methane alike to Triton's, but these gases are frozen when farther from the Sun.
Other bodies within the Solar System have extremely thin atmospheres not in equilibrium. These include the Moon (sodium gas), Mercury (sodium gas), Europa (oxygen), Io (sulfur), and Enceladus (water vapor).
The atmospheric composition of an extra-solar planet was first determined using the Hubble Space Telescope. Planet HD 209458b is a gas giant with a close orbit around a star in the constellation Pegasus. Its atmosphere is heated to temperatures over 1,000 K, and is steadily escaping into space. Hydrogen, oxygen, carbon and sulfur have been detected in the planet's inflated atmosphere.
2.2.2 Atmosphere of Earth
The atmosphere of Earth is a layer of gases surrounding the planet Earth that is retained by Earth's gravity. The atmosphere protects life on Earth by absorbing ultraviolet solar radiation, warming the surface through heat retention (greenhouse effect), and reducing temperature extremes between day and night (the diurnal temperature variation).

The common name given to the atmospheric gases used in breathing and photosynthesis is air. By volume, dry air contains 78.09% nitrogen, 20.95% oxygen, 0.93% argon, 0.039% carbon dioxide, and small amounts of other gases. Air also contains a variable amount of water vapor, on average around 1%. While air content and atmospheric pressure vary at different layers, air suitable for the survival of terrestrial plants and terrestrial animals currently is only known to be found in Earth's troposphere and artificial atmospheres.
The atmosphere has a mass of about 5×10¹⁸ kg, three quarters of which is within about 11 km (6.8 mi; 36,000 ft) of the surface. The atmosphere becomes thinner and thinner with increasing altitude, with no definite boundary between the atmosphere and outer space. The Kármán line, at 100 km (62 mi), or 1.57% of the Earth's radius, is often used as the border between the atmosphere and outer space. Atmospheric effects become noticeable during atmospheric reentry of spacecraft at an altitude of around 120 km (75 mi). Several layers can be distinguished in the atmosphere, based on characteristics such as temperature and composition.
The study of Earth's atmosphere and its processes is called atmospheric science or aerology. Early pioneers in the field include Léon Teisserenc de Bort and Richard Assmann.
2.2.2.1 Composition
Air is mainly composed of nitrogen, oxygen, and argon, which together constitute the major gases of the atmosphere. Water vapor accounts for roughly 0.25% of the atmosphere by mass. The concentration of water vapor (a greenhouse gas) varies significantly from around 10 ppmv in the coldest portions of the atmosphere to as much as 5% by volume in hot, humid air masses, and concentrations of other atmospheric gases are typically provided for dry air without any water vapor. The remaining gases are often referred to as trace gases, among which are the greenhouse gases such as carbon dioxide, methane, nitrous oxide, and ozone. Filtered air includes trace amounts of many other chemical compounds. Many substances of natural origin may be present in locally and seasonally variable small amounts as aerosol in an unfiltered air sample, including dust of mineral and organic composition, pollen and spores, sea spray, and volcanic ash. Various industrial pollutants also may be present as gases or aerosol, such as chlorine (elemental or in compounds), fluorine compounds and elemental mercury vapor. Sulfur compounds such as hydrogen sulfide and sulfur dioxide (SO2) may be derived from natural sources or from industrial air pollution.
Composition of dry atmosphere, by volume
Gas Volume
Nitrogen (N2) 780,840 ppmv (78.084%)
Oxygen (O2) 209,460 ppmv (20.946%)
Argon (Ar) 9,340 ppmv (0.9340%)
Carbon dioxide (CO2) 397 ppmv (0.0397%)
Neon (Ne) 18.18 ppmv (0.001818%)
Helium (He) 5.24 ppmv (0.000524%)
Methane (CH4) 1.79 ppmv (0.000179%)
Krypton (Kr) 1.14 ppmv (0.000114%)
Hydrogen (H2) 0.55 ppmv (0.000055%)
Nitrous oxide (N2O) 0.325 ppmv (0.0000325%)
Carbon monoxide (CO) 0.1 ppmv (0.00001%)
Xenon (Xe) 0.09 ppmv (9×10⁻⁶%) (0.000009%)
Ozone (O3) 0.0 to 0.07 ppmv (0 to 7×10⁻⁶%)
Nitrogen dioxide (NO2) 0.02 ppmv (2×10⁻⁶%) (0.000002%)
Iodine (I2) 0.01 ppmv (1×10⁻⁶%) (0.000001%)
Ammonia (NH3) trace
Not included in above dry atmosphere:
Water vapor (H2O) ~0.25% by mass over full atmosphere, locally 0.001%–5% [3]
2.2.2.2 Structure of the atmosphere
2.2.2.2.1 Principal layers
In general, air pressure and density decrease with altitude in the atmosphere. However, the temperature has a more complicated profile with altitude, and may remain relatively constant or even increase with altitude in some regions. Because the general pattern of the temperature/altitude profile is constant and recognizable through means such as balloon soundings, the temperature behavior provides a useful metric to distinguish between atmospheric layers. In this way, Earth's atmosphere can be divided (called atmospheric stratification) into five main layers. From highest to lowest, these layers are:
2.2.2.2.1.1 Exosphere
The exosphere is the outermost layer of Earth's atmosphere, extending beyond the exobase at an altitude of about 600 km. It is mainly composed of hydrogen, helium and some heavier molecules such as nitrogen, oxygen and carbon dioxide closer to the exobase. The atoms and molecules are so far apart that they can travel hundreds of kilometers without colliding with one another, so the atmosphere no longer behaves like a gas. These free-moving particles follow ballistic trajectories and may migrate in and out of the magnetosphere or the solar wind.
2.2.2.2.1.2 Thermosphere
Temperature increases with height in the thermosphere from the mesopause up to the thermopause, then is constant with height. Unlike in the stratosphere, where a temperature inversion is caused by absorption of radiation by ozone, in the thermosphere the inversion is a result of the extremely low density of molecules. The temperature of this layer can rise to 1,500 °C (2,700 °F), though the gas molecules are so far apart that the temperature in the usual sense is not well defined. The air is so rarefied that an individual molecule (of oxygen, for example) travels an average of 1 kilometer between collisions with other molecules. The International Space Station orbits in this layer, between 320 and 380 km (200 and 240 mi). The aurora borealis and aurora australis are occasionally seen in the thermosphere and the lower part of the exosphere. The top of this layer is also the bottom of the exosphere, and is called the exobase. Its height varies with solar activity and ranges from about 350–800 km (220–500 mi; 1,100,000 – 2,600,000 ft).
2.2.2.2.1.2 Mesosphere
The mesosphere extends from the stratopause at about 50 km (31 mi; 160,000 ft) to 80–85 km (50–53 mi; 260,000–280,000 ft). It is the layer where most meteors burn up upon entering the atmosphere. Temperature decreases with height in the mesosphere. The mesopause, the temperature minimum that marks the top of the mesosphere, is the coldest place on Earth and has an average temperature around −85 °C (−120 °F; 190 K). At this altitude, temperatures may drop to −100 °C (−150 °F; 170 K). Due to the cold temperature of this layer, water vapor is frozen, occasionally forming polar-mesospheric noctilucent clouds which are the higher water-based aerosols in the atmosphere. A type of lightning referred to as either sprites or ELVES, occasionally form far above tropospheric thunderclouds.
2.2.2.2.1.3 Stratosphere
The stratosphere extends from the tropopause at about 12 km (7.5 mi; 39,000 ft) to about 51 km (32 mi; 170,000 ft). Temperature increases with height due to increased absorption of ultraviolet radiation by the ozone layer, which restricts turbulence and mixing. While the temperature may be −60 °C (−76 °F; 210 K) at the tropopause, the top of the stratosphere is much warmer, and may be near freezing. Polar stratospheric or nacreous clouds are occasionally seen in this layer of the atmosphere. The stratopause, which is the boundary between the stratosphere and mesosphere, typically is at 50 to 55 km (31 to 34 mi; 160,000 to 180,000 ft). The pressure here is 1/1000 sea level.
2.2.2.2.1.4 Troposphere
The troposphere begins at the surface and extends to between 9 km (30,000 ft) at the poles and 17 km (56,000 ft) at the equator, with some variation due to weather. The troposphere is mostly heated by transfer of energy from the surface, so on average the lowest part of the troposphere is warmest and temperature decreases with altitude. This promotes vertical mixing (hence the origin of its name in the Greek word τρόπος, tropos, meaning "turn"). The troposphere contains roughly 80% of the mass of the atmosphere and basically all the weather-associated cloud genus types (very tall cumulonimbus thunder clouds can penetrate the stratosphere from below). The tropopause is the boundary between the troposphere and stratosphere.
2.2.2.2.1.5 Other layers
Within the five principal layers which are largely determined by temperature, several secondary layers may be distinguished by other properties:

The ozone layer is contained within the stratosphere. In this layer ozone concentrations are about 2 to 8 parts per million, which is much higher than in the lower atmosphere but still very small compared to the main components of the atmosphere. It is mainly located in the lower portion of the stratosphere from about 15–35 km (9.3–22 mi; 49,000–110,000 ft), though the thickness varies seasonally and geographically. About 90% of the ozone in our atmosphere is contained in the stratosphere.
The ionosphere is a region of the atmosphere that is ionized by solar radiation. It is responsible for auroras. During daytime hours, it stretches from 50 to 1,000 km (31 to 620 mi; 160,000 to 3,300,000 ft) and includes the mesosphere, thermosphere, and parts of the exosphere. However, ionization in the mesosphere largely ceases during the night, so auroras are normally seen only in the themosphere and lower exosphere. The ionosphere forms the inner edge of the magnetosphere. It has practical importance because it influences, for example, radio propagation on Earth.
The homosphere and heterosphere are defined by whether the atmospheric gases are well mixed. The surfaced-based homosphere includes the troposphere, stratosphere, mesosphere, and the lowest part of the thermosphere, where the chemical composition of the atmosphere does not depend on molecular weight because the gases are mixed by turbulence. This relatively homogeneous layer ends at the turbopause which is found at about 100 km (62 mi; 330,000 ft), which places it about 20 km (12 mi; 66,000 ft) above the mesopause.
Above this altitude lies the heterosphere which includes the exosphere and most of the themosphere. Here the chemical composition varies with altitude. This is because the distance that particles can move without colliding with one another is large compared with the size of motions that cause mixing. This allows the gases to stratify by molecular weight, with the heavier ones such as oxygen and nitrogen present only near the bottom of the heterosphere. The upper part of the heterosphere is composed almost completely of hydrogen, the lightest element.
The planetary boundary layer is the part of the troposphere that is closest to Earth's surface and is directly affected by it, mainly through turbulent diffusion. During the day the planetary boundary layer usually is well-mixed, whereas at night it becomes stably stratified with weak or intermittent mixing. The depth of the planetary boundary layer ranges from as little as about 100 meters on clear, calm nights to 3000 m or more during the afternoon in dry regions.
The average temperature of the atmosphere at the surface of Earth is 14 °C (57 °F; 287 K) or 15 °C (59 °F; 288 K), depending on the reference.
2.2.2.3 Physical properties
2.2.2.3.1 Pressure and thickness
The average atmospheric pressure at sea level is 1 standard atmosphere (atm)=101.3 kPa (kilopascals)=14.7 psi (pounds per square inch)=760 torr=29.92 inches of mercury (symbol Hg). The total atmospheric mass is 5.1480×10¹⁸ kg (1.135×10¹⁹ lb), about 2.5% less than would be inferred from the average sea level pressure and the Earth's area of 51007.2 megahectares, this portion being displaced by the Earth's mountainous terrain. Atmospheric pressure is the total weight of the air above the unit area at the point where the pressure is measured. Thus the air pressure varies with location and weather.
If the atmosphere had a uniform density, it would terminate abruptly at an altitude of 8.50 km (27,900 ft). It actually decreases exponentially with altitude, dropping by half every 5.6 km (18,000 ft) or by a factor

of 1/e every 7.64 km (25,100 ft), the average scale height of the atmosphere below 70 km (43 mi; 230,000 ft). However, the atmosphere is more accurately modeled with a customized equation for each layer that takes gradients of temperature, molecular composition, solar radiation and gravity into account.
In summary, the mass of Earth's atmosphere is distributed approximately as follows:
50% is below 5.6 km (18,000 ft). 90% is below 16 km (52,000 ft). 99.99997% is below 100 km (62 mi; 330,000 ft), the Kármán line. By international convention,
this marks the beginning of space where human travelers are considered astronauts.
By comparison, the summit of Mt. Everest is at 8,848 m (29,029 ft); commercial airliners typically cruise between 10 km (33,000 ft) and 13 km (43,000 ft) where the thinner air improves fuel economy; weather balloons reach 30.4 km (100,000 ft) and above; and the highest X-15 flight in 1963 reached 108.0 km (354,300 ft).
Even above the Kármán line, significant atmospheric effects such as auroras still occur. Meteors begin to glow in this region though the larger ones may not burn up until they penetrate more deeply. The various layers of Earth's ionosphere, important to HF radio propagation, begin below 100 km and extend beyond 500 km. By comparison, the International Space Station and Space Shuttle typically orbit in 350–400 km, within the F-layer of the ionosphere where they encounter enough atmospheric drag to require reboosts every few months. Depending on solar activity, satellites can experience noticeable atmospheric drag at altitudes as high as 700–800 km.
2.2.2.3.2 Temperature and speed of sound
The division of the atmosphere into layers mostly by reference to temperature is discussed above. Temperature decreases with altitude starting at sea level, but variations in this trend begin above 11 km, where the temperature stabilizes through a large vertical distance through the rest of the troposphere. In the stratosphere, starting above about 20 km, the temperature increases with height, due to heating within the ozone layer caused by the capture of significant ultraviolet radiation from the Sun by the decision and ozone gas in this region. Still another region of increasing temperature with altitude occurs at very high altitudes, in the aptly-named thermosphere above 90 km.
Because in an ideal gas of constant composition the speed of sound depends only on temperature and not on the gas pressure or density, the speed of sound in the atmosphere with altitude takes on the form of the complicated temperature profile, and does not mirror attitudinal changes in density or pressure.
2.2.2.3.3 Density and mass
The density of air at sea level is about 1.2 kg/m3 (1.2 g/L). Density is not measured directly but is calculated from measurements of temperature, pressure and humidity using the equation of state for air (a form of the ideal gas law). Atmospheric density decreases as the altitude increases. This variation can be approximately modeled using the barometric formula. More sophisticated models are used to predict the orbital decay of satellites.
The average mass of the atmosphere is about 5 quadrillion (5×10¹⁵) tonnes or 1/1,200,000 the mass of Earth. According to the American National Center for Atmospheric Research, "The total mean mass of the atmosphere is 5.1480×10¹⁸ kg with an annual range due to water vapor of 1.2 or 1.5×10¹⁵ kg

depending on whether surface pressure or water vapor data are used; somewhat smaller than the previous estimate. The mean mass of water vapor is estimated as 1.27×10¹⁶ kg and the dry air mass as 5.1352 ±0. 0003×1018 kg."
2.2.2.4 Optical properties
Solar radiation (or sunlight) is the energy the Earth receives from the Sun. The Earth also emits radiation back into space, but at longer wavelengths that we cannot see. Part of the incoming and emitted radiation is absorbed or reflected by the atmosphere.
2.2.2.4.1 Scattering
When light passes through our atmosphere, photons interact with it through scattering. If the light does not interact with the atmosphere, it is called direct radiation and is what you see if you were to look directly at the Sun. Indirect radiation is light that has been scattered in the atmosphere. For example, on an overcast day when you cannot see your shadow there is no direct radiation reaching you, it has all been scattered. As another example, due to a phenomenon called Rayleigh scattering, shorter (blue) wavelengths scatter more easily than longer (red) wavelengths. This is why the sky looks blue; you are seeing scattered blue light. This is also why sunsets are red. Because the Sun is close to the horizon, the Sun's rays pass through more atmosphere than normal to reach your eye. Much of the blue light has been scattered out, leaving the red light in a sunset.
2.2.2.4.2 Absorption
Different molecules absorb different wavelengths of radiation. For example, O2 and O3 absorb almost all wavelengths shorter than 300 nanometers. Water (H2O) absorbs many wavelengths above 700 nm. When a molecule absorbs a photon, it increases the energy of the molecule. We can think of this as heating the atmosphere, but the atmosphere also cools by emitting radiation, as discussed below.
The combined absorption spectra of the gases in the atmosphere leave "windows" of low opacity, allowing the transmission of only certain bands of light. The optical window runs from around 300 nm (ultraviolet-C) up into the range humans can see, the visible spectrum (commonly called light), at roughly 400–700 nm and continues to the infrared to around 1100 nm. There are also infrared and radio windows that transmit some infrared and radio waves at longer wavelengths. For example, the radio window runs from about one centimeter to about eleven-meter waves.
2.2.2.4.3 Emission
Emission is the opposite of absorption, it is when an object emits radiation. Objects tend to emit amounts and wavelengths of radiation depending on their "black body" emission curves, consequently hotter objects tend to emit more radiation, with shorter wavelengths. Colder objects emit less radiation, with longer wavelengths. For example, the Sun is approximately 6,000 K (5,730 °C; 10,340 °F), its radiation peaks near 500 nm, and is visible to the human eye. The Earth is approximately 290 K (17 °C; 62 °F), so its radiation peaks near 10,000 nm, and is much too long to be visible to humans.
Because of its temperature, the atmosphere emits infrared radiation. For example, on clear nights the Earth's surface cools down faster than on cloudy nights. This is because clouds (H2O) are strong absorbers and emitters of infrared radiation. This is also why it becomes colder at night at higher elevations.

The greenhouse effect is directly related to this absorption and emission effect. Some gases in the atmosphere absorb and emit infrared radiation, but do not interact with sunlight in the visible spectrum. Common examples of these are CO2 and H2O.
2.2.2.4.4 Refractive index
The refractive index of air is close to, but just greater than 1. Systematic variations in refractive index can lead to the bending of light rays over long optical paths. One example is that, under some circumstances, observers on board ships can see other vessels just over the horizon because light is refracted in the same direction as the curvature of the Earth's surface.
The refractive index of air depends on temperature, giving rise to refraction effects when the temperature gradient is large. An example of such effects is the mirage.
2.2.2.5 Circulation
Atmospheric circulation is the large-scale movement of air through the troposphere, and the means (with sea circulation) by which heat is distributed around the Earth. The large-scale structure of the atmospheric circulation varies from year to year, but the basic structure remains fairly constant as it is determined by the Earth's rotation rate and the difference in solar radiation between the equator and poles.
2.2.2.6 Evolution of Earth's atmosphere
2.2.2.6 .1Earliest atmosphere
The first atmosphere would have consisted of gases in the solar nebula, primarily hydrogen. In addition there would probably have been simple hydrides such as are now found in gas-giant planets like Jupiter and Saturn, notably water vapor, methane and ammonia. As the solar nebula dissipated these gases would have escaped, partly driven off by the solar wind.
2.2.2.6 .2 Second atmosphere
The next atmosphere, consisting largely of nitrogen plus carbon dioxide and inert gases, was produced by outgassing from volcanism, supplemented by gases produced during the late heavy bombardment of Earth by huge asteroids. A major part of carbon dioxide emissions were soon dissolved in water and built up carbonate sediments.
Water-related sediments have been found dating from as early as 3.8 billion years ago. About 3.4 billion years ago, nitrogen was the major part of the then stable "second atmosphere". An influence of life has to be taken into account rather soon in the history of the atmosphere, since hints of early life forms were to be found as early as 3.5 billion years ago. The fact that this is not perfectly in line with the 30% lower solar radiance (compared to today) of the early Sun has been explained as the "faint young Sun paradox".
The geological record however shows a continually relatively warm surface during the complete early temperature record of the Earth with the exception of one cold glacial phase about 2.4 billion years ago. In the late Archeaneon an oxygen-containing atmosphere began to develop, apparently from photosynthesizing cyanobacteria which have been found as stromatolite fossils from 2.7 billion years ago. The early basic carbon isotopy (isotope ratio proportions) is very much in line with what is found today,

suggesting that the fundamental features of the carbon cycle were established as early as 4 billion years ago.
2.2.2.6 .3 Third atmosphere
The constant re-arrangement of continents by plate tectonics influences the long-term evolution of the atmosphere by transferring carbon dioxide to and from large continental carbonate stores. Free oxygen did not exist in the atmosphere until about 2.4 billion years ago during the Great Oxygenation Event and its appearance is indicated by the end of the banded iron formations. Before this time, any oxygen produced by photosynthesis was consumed by oxidation of reduced materials, notably iron. Molecules of free oxygen did not start to accumulate in the atmosphere until the rate of production of oxygen began to exceed the availability of reducing materials. This point signifies a shift from a reducing atmosphere to an oxidizing atmosphere. O2 showed major variations until reaching a steady state of more than 15% by the end of the Precambrian. The following time span was the Phanerozoic eon, during which oxygen-breathing metazoan life forms began to appear.
The amount of oxygen in the atmosphere has fluctuated over the last 600 million years, reaching a peak of about 30% around 280 million years ago, significantly higher than today's 21%. Two main processes govern changes in the atmosphere: Plants use carbon dioxide from the atmosphere, releasing oxygen. Breakdown of pyrite and volcanic eruptions release sulfur into the atmosphere, which oxidizes and hence reduces the amount of oxygen in the atmosphere. However, volcanic eruptions also release carbon dioxide, which plants can convert to oxygen. The exact cause of the variation of the amount of oxygen in the atmosphere is not known. Phases with much oxygen in the atmosphere are associated with rapid development of animals. Today's atmosphere contains 21% oxygen, which is high enough for this rapid development of animals.
Currently, anthropogenic greenhouse gases are accumulating in the atmosphere, which is the main cause of global warming.
2.2.2.6 .4 Air pollution
Air pollution is the introduction into the atmosphere of chemicals, particulate matter, or biological materials that cause harm or discomfort to organisms. Stratospheric ozone depletion is believed to be caused by air pollution (chiefly from chlorofluorocarbons).
2.2.3 Atmospheric circulation
Atmospheric circulation is the large-scale movement of air, and the means (together with the smaller sea circulation) by which thermal energy is distributed on the surface of the Earth.
The large-scale structure of the atmospheric circulation varies from year to year, but the basic climatological structure remains fairly constant. Individual weather systems – mid-latitude depressions, or tropical convective cells – occur "randomly", and it is accepted that weather cannot be predicted beyond a fairly short limit: perhaps a month in hypothesis , or (currently) about ten days in practice. Nonetheless, as the climate is the average of these systems and patterns – where and when they tend to occur again and again – it is stable over long phases of time.
As a rule, the "cells" of Earth's atmosphere shift polewards in warmer climates (e.g. interglacials compared to glacials), but remain largely constant even due to continental drift; they are, fundamentally, a property of the Earth's size, rotation rate, heating and atmospheric depth, all of which change little. Tectonic uplift can significantly alter major elements of it, however – for example the jet stream -, and plate tectonics shift sea currents. In the extremely hot climates of the Mesozoic, indications of a third desert belt at the Equator has been found; it was perhaps caused by convection. But even then, the overall latitudinal pattern of Earth's climate was not much different from the one today.
2.2.3.1 Latitudinal circulation features
The wind belts girdling the planet are organized into three cells: the Hadley cell, the Ferrel cell, and the Polar cell. Contrary to the impression given in the simplified diagram, the vast bulk of the vertical motion occurs in the Hadley cell; the justifications of the other two cells are complex. Note that there is one discrete Hadley cell that may split, shift and merge in a complicated process over time. Low and high pressures on the earth's surface are balanced by opposite relative pressures in the upper troposphere.
2.2.3.1.1 Hadley cell
The Hadley cell mechanism is well understood. The atmospheric circulation pattern that George Hadley explained to provide a justification for the trade winds matches observations very well. It is a closed circulation loop, which begins at the equator with warm, moist air lifted aloft in equatorial low pressure areas (the Intertropical Convergence Zone, ITCZ) to the tropopause and carried poleward. At about 30°N/S latitude, it descends in a high pressure area. Some of the descending air travels equatorially along the surface, closing the loop of the Hadley cell and creating the Trade Winds.
Though the Hadley cell is explained as lying on the equator, it is more accurate to explain it as following the sun’s zenith point, or what is termed the "thermal equator," which undergoes a semiannual north-south migration.
2.2.3.1.2 Polar cell
The Polar cell is likewise a simple system. Though cool and dry relative to equatorial air, air masses at the 60th parallel are still sufficiently warm and moist to undergo convection and drive a thermal loop. Air circulates within the troposphere, limited vertically by the tropopause at about 8 km. Warm air rises at lower latitudes and moves poleward through the upper troposphere at both the north and south poles. When the air reaches the polar areas, it has cooled considerably, and descends as a cold, dry high pressure area, moving away from the pole along the surface but twisting westward as a result of the Coriolis effect to produce the Polar easterlies.
The outflow from the cell creates harmonic waves in the atmosphere known as Rossby waves. These ultra-long waves play an important role in determining the path of the jet stream, which travels within the transitional zone between the tropopause and the Ferrel cell. By acting as a heat sink, the Polar cell also balances the Hadley cell in the Earth’s energy equation.
It can be argued that the Polar cell is the primary weather maker for regions above the middle northern latitudes. While Canadians and Europeans may have to deal with occasional heavy summer storms, there is nothing like a winter visit from a Siberian high to give one a true appreciation of real cold. In fact, it is the polar high which is responsible for generating the coldest temperature recorded on Earth: -89.2°C at Vostok Station in 1983 in Antarctica.
The Hadley cell and the Polar cell are alike in that they are thermally direct; in other words, they exist as a direct consequence of surface temperatures; their thermal characteristics override the effects of weather in their domain. The sheer volume of energy the Hadley cell transports, and the depth of the heat sink that is the Polar cell, ensures that the effects of transient weather phenomena are not only not felt by the system as a whole, but — except under unusual circumstances — are not even permitted to form. The endless chain of passing highs and lows which is part of everyday life for mid-latitude dwellers is unknown above the 60th and below the 30th parallels. There are some notable exceptions to this rule. In Europe, unstable weather extends to at least 70° north.
These atmospheric features are also stable, so even though they may strengthen or weaken regionally or over time, they do not vanish entirely.
2.2.3.1.3 Ferrel cell
The Ferrel cell, theorized by William Ferrel (1817–1891), is a secondary circulation feature, dependent for its existence upon the Hadley cell and the Polar cell. It behaves much as an atmospheric ball bearing between the Hadley cell and the Polar cell, and comes about as a result of the eddy circulations (the high and low pressure areas) of the mid-latitudes. For this reason it is sometimes known as the "zone of mixing." At its southern extent (in the Northern hemisphere), it overrides the Hadley cell, and at its northern extent, it overrides the Polar cell. Just as the Trade Winds can be found below the Hadley cell, the Westerlies can be found beneath the Ferrel cell. Thus, strong high pressure areas which divert the prevailing westerlies, such as a Siberian high (which could be considered an extension of the Arctic high), could be said to override the Ferrel cell, making it discontinuous.
While the Hadley and Polar cells are truly closed loops, the Ferrel cell is not, and the telling point is in the Westerlies, which are more formally known as "the Prevailing Westerlies." While the Trade Winds and the Polar Easterlies have nothing over which to prevail, their parent circulation cells having taken care of any competition they might have to face, the Westerlies are at the mercy of passing weather systems. While upper-level winds are essentially westerly, surface winds can vary sharply and abruptly in the direction. A low moving polewards or a high moving equator ward maintains or even accelerates a westerly flow; the local passage of a cold front may change that in a matter of minutes, and frequently does. A strong high moving polewards may bring easterly winds for days.
The base of the Ferrel cell is characterized by the movement of air masses, and the location of these air masses is influenced in part by the location of the jet stream, which acts as a collector for the air carried aloft by surface lows (a look at a weather map will show that surface lows follow the jet stream). The overall movement of surface air is from the 30th latitude to the 60th. However, the upper flow of the Ferrel cell is not well defined. This is in part because it is intermediary between the Hadley and Polar cells, with neither a strong heat source nor a strong cold sink to drive convection and, in part, because of the effects on the upper atmosphere of surface eddies, which act as destabilizing influences.
2.2.3.2 Longitudinal circulation features
While the Hadley, Ferrel, and Polar cells are major factors in global heat transport, they do not act alone. Disparities in temperature also drive a set of longitudinal circulation cells, and the overall atmospheric motion is known as the zonal overturning circulation.
Latitudinal circulation is the consequence of the fact that incident solar radiation per unit area is highest at the heat equator, and decreases as the latitude increases, reaching its minimum at the poles. Longitudinal

circulation, on the other hand, comes about because water has a higher specific heat capacity than land and thereby absorbs and releases more heat, but the temperature changes less than land. Even at mesoscales (a horizontal range of 5 to several hundred kilometres), this effect is noticeable; it is what brings the sea breeze, air cooled by the water, ashore in the day, and carries the land breeze, air cooled by contact with the ground, out to sea during the night.
On a larger scale, this effect ceases to be diurnal (daily), and instead is seasonal or even decadal in its effects. Warm air rises over the equatorial, continental, and western Pacific Sea regions, flows eastward or westward, depending on its location, when it reaches the tropopause, and subsides in the Atlantic and Indian Oceans, and in the eastern Pacific.
The Pacific Sea cell plays a particularly important role in Earth's weather. This entirely sea -based cell comes about as the result of a marked difference in the surface temperatures of the western and eastern Pacific. Under ordinary circumstances, the western Pacific waters are warm and the eastern waters are cool. The process begins when strong convective activity over equatorial East Asia and subsiding cool air off South America's west coast creates a wind pattern which pushes Pacific water westward and piles it up in the western Pacific. (Water levels in the western Pacific are about 60 cm higher than in the eastern Pacific, a difference due entirely to the force of moving air.)
2.2.3.2.1 Walker circulation
The Pacific cell is of such importance that it has been named the Walker circulation after Sir Gilbert Walker, an early-20th-century director of British observatories in India, who sought a means of predicting when the monsoon winds would fail. While he was never successful in doing so, his work led him to the discovery of an indisputable link between phaseic pressure variations in the Indian Sea and the Pacific, which he termed the "Southern Oscillation".
The movement of air in the Walker circulation affects the loops on either side. Under "normal" circumstances, the weather behaves as expected. But every few years, the winters become unusually warm or unusually cold, or the frequency of hurricanes increases or decreases, and the pattern sets in for an indeterminate phase.
The behavior of the Walker cell is the key to the riddle, and leads to an understanding of the El Niño (more accurately, ENSO or El Niño – Southern Oscillation) phenomenon.
If convective activity slows in the Western Pacific for some reason (this reason is not currently known), the climate dominoes next to it begins to topple. First, the upper-level westerly winds fail. This cuts off the source of cool subsiding air, and consequently the surface Easterlies cease.
The consequence of this is twofold. In the eastern Pacific, warm water surges in from the west since there is no longer a surface wind to constrain it. This and the corresponding effects of the Southern Oscillation result in long-term unseasonable temperatures and precipitation patterns in North and South America, Australia, and Southeast Africa, and disruption of sea currents.
Meanwhile in the Atlantic, high-level, fast-blowing Westerlies which would ordinarily be blocked by the Walker circulation and unable to reach such intensities, form. These winds tear apart the tops of nascent hurricanes and greatly diminish the number which are able to reach full strength.
2.3 Temperature

Temperature is the measure of how hot or cold the air is. It is commonly measured in Celsius or Fahrenheit. Temperature is a very important factor in determining the weather, because it influences other elements of the weather.
Temperature may be affected by:
Sunshine Latitude Altitude Aspect Sea Proximity and Temperature Ocean Currents
2.3.1 Sunshine
The amount of sunshine at a certain place can influence its temperature. The amount of sunshine can be measured in sunshine hours. That is worked out by the number of hours of daylight and how many of these are cloud free. Sunshine is variable due to daylight hours as during the night there is no sunshine as the Earth is pointing away from the sun at the given spot. Also due to the Earth's tilt some times of the year have more sunshine (summer) and some less (winter).
2.3.2 Latitude
Latitude is the distance of a location from the equator. The hottest temperatures on Earth are found near the equator. This is because the sun shines directly on it for more hours during the year than anywhere else. As you move further away from the equator towards the poles, less sun is received during the year and the temperature becomes colder.
2.3.3 Altitude
Altitude is the height you are above sea level. The higher up you are the lower the temperature will be. This is because the air that is higher up is less dense than it is at lower altitudes and air temperature depends on its density. As a general rule for every 1,000m higher you go the temperature will drop by 6.5 °C.
2.3.4 Aspect
Aspect is the direction in which you are facing. So if you are facing towards the equator then the temperature will be warmer than facing away. Consequently in the Northern Hemisphere if you wanted to lie in the sun on a hillside you would do so on the south facing slope (if you were in the Southern Hemisphere it would be the North Facing Slope).
2.3.5 Sea Proximity and Temperature
Sea temperature changes slower than land temperature. If the temperature on land drops then the area next to the sea will be kept warmer for longer than areas inland. Islands consequently have a less dramatic climate than continents. Different seas have different temperatures consequently allowing one side of an island to be a different temperature to the other side.

2.3.6 Ocean Currents
Currents are driven by the prevailing winds passing over the surface of the sea . Consequently winds blowing from tropical areas bring warm currents and vice versa.
2.3.7 Humidity
Humidity is the level of water in the air, the more water vapor in the air the higher the humidity. If the humidity level exceeds the amount of water air can hold condensation occurs forming dew if it's warm or frost if it's cold. When air is at a high altitude and has a high humidity then clouds start to form. Humidity varies with temperature. Warmer air can hold more moisture. Humidity is measured in percentages on the scale of air's ability to hold moisture. Consequently condensation occurs at 100% humidity for a given temperature thus reducing the humidity again.
2.3.8 Precipitation
Precipitation is the term given to moisture that falls from the air to the ground. Precipitation can be snow, hail, sleet, drizzle, fog, mist and rain. The water cycle drives the water from the oceans/seas on-shore were it falls as precipitation and then flows via rivers back in to the sea.
2.4 Pressure Belts and Wind System
2.4.1 Pressure Belts
The unequal heating of the earth and its atmosphere by the sun, because of revolution of the earth on its tilted axis causes difference in pressure. There are three low pressure belts with alternate belts of high pressure.
(a) Equatorial low pressure Due to the vertical rays of the sun the temperature here is high. The heated air is light and hence rises forming an area of low pressure.
At 60 °N and 60 °S latitudes there is a sub-polar low pressure belt due to the descending of air from the polar region and the air from 30° North and South high pressure belts blows towards it, forming sub polar low- pressure belt above.
(b) High pressure belts (i) At 30 °N latitude and 30 °S latitude (ii) At the poles.
The rotation of the earth causes the air at the equator to swing towards the poles, part of the air on the way cools and settles at 30°N and 30°S forming an area of sub-tropical pressure belts.
The poles are intensely cold; hence they are the areas of permanent high pressure. Winds from this high pressure belt blows towards 60 °N and 60 °S.
Winds always blow from high pressure areas to low pressure areas. From these major high pressure belts winds blow towards the low pressure belts giving rise to permanent (prevailing) winds, - trade winds, Westerlies and polar winds.
2.4.2 Wind system

Wind is the movement of air caused by the uneven heating of the Earth by the sun. It does not have much substance—you cannot see it or hold it—but you can feel its force. It can dry your clothes in summer and chill you to the bone in winter. It is strong enough to carry sailing ships across the sea and rip huge trees from the ground. It is the great equalizer of the atmosphere, transporting heat, moisture, pollutants, and dust great distances around the globe. Landforms, processes, and impacts of wind are called Aeolian landforms, processes, and impacts. Differences in atmospheric pressure generate winds. At the Equator, the sun warms the water and land more than it does the rest of the globe. Warm equatorial air rises higher into the atmosphere and migrates toward the poles. This is a low-pressure system. At the same time, cooler, denser air moves over Earth’s surface toward the Equator to replace the heated air. This is a high-pressure system. Winds generally blow from high-pressure areas to low-pressure areas. The boundary between these two areas is called a front. The complex relationships between fronts cause different types of wind and weather patterns. Prevailing winds are winds that blow from a single direction over a specific area of the Earth. Areas where prevailing winds meet are called convergence zones. Generally, prevailing winds blow east-west rather than north-south. This happens because the Earth’s rotation generates what is known as the Coriolis effect. The Coriolis effect makes wind systems twist counter-clockwise in the Northern Hemisphere and clockwise in the Southern Hemisphere. The Coriolis effect causes some winds to travel along the edges of the high-pressure and low-pressure systems. These are called geostrophic winds. In 1857, Dutch meteorologist Christoph Buys Ballot formulated a law about geostrophic winds: When you stand with your back to the wind in the Northern Hemisphere, low pressure is always to your left. (In the Southern Hemisphere, low-pressure systems will be on your right.) 2.4.2.1 Wind Zones The Earth contains five major wind zones: polar easterlies, westerlies, horse latitudes, trade winds, and the doldrums. 2.4.2.1.1 Polar Easterlies Polar easterlies are dry, cold prevailing winds that blow from the east. They emanate from the polar highs, areas of high pressure around the North and South Poles. Polar easterlies flow to low-pressure areas in sub-polar regions. 2.4.2.1.2 Westerlies Westerlies are prevailing winds that blow from the west at mid latitudes. They are fed by polar easterlies and winds from the high-pressure horse latitudes, which sandwich them on either side. Westerlies are strongest in the winter, when pressure over the pole is low, and weakest in summer, when the polar high creates stronger polar easterlies. The strongest westerlies blow through the ―Roaring Forties,‖ a wind zone between 40 and 50 degrees latitude in the Southern Hemisphere. Throughout the Roaring Forties, there are few landmasses to slow winds. The tip of South America and Australia, as well as the islands of New Zealand, are the only large landmasses to penetrate the Roaring Forties. The westerlies of the Roaring Forties were very important to sailors during the Age of Exploration, when explorers and traders from Europe and western Asia used the strong winds to reach the spice markets of Southeast Asia and Australia.

Westerlies have an enormous impact on sea currents, especially in the Southern Hemisphere. Driven by westerlies, the powerful Antarctic Circumpolar Current (ACC) rushes around the continent (from west to east) at about 4 kilometers per hour (2.5 miles per hour). In fact, another name for the Antarctic Circumpolar Current is the West Wind Drift. The ACC is the largest sea current in the world, and is responsible for transporting enormous volumes of cold, nutrient-rich water to the sea , creating healthy marine ecosystems and food webs. 2.4.2.1.3 Horse Latitudes The horse latitudes are a narrow zone of warm, dry climates between westerlies and the trade winds. Horse latitudes are about 30 and 35 degrees north and south. Many deserts, from the rainless Atacama of South America to the arid Kalahari of Africa, are part of the horse latitudes. The prevailing winds at the horse latitudes vary, but are usually light. Even strong winds are often short in duration. 2.4.2.1.4 Trade Winds
Trade winds are the powerful prevailing winds that blow from the east across the tropics. Trade winds are generally very predictable. They have been instrumental in the history of exploration, communication, and trade. Ships relied on the trade winds to establish quick, reliable routes across the vast Atlantic and, later, Pacific Oceans. Even today, shipping depends on trade winds and the sea currents they drive. In 1947, Norwegian explorer Thor Heyerdahl and a small crew used trade winds to travel from the coast of Peru to the coral reefs of French Polynesia, more than 6,920 kilometers (4,300 miles), in a sail-powered raft. The expedition, named after the raft (Kon-Tiki) aimed to prove that ancient mariners could have used predictable trade winds to explore wide stretches of the Pacific. Trade winds that form over land (called continental trade winds) are warmer and drier than those that form over the sea (maritime trade winds). The relationship between continental and maritime trade winds can be violent. Most tropical storms, including hurricanes, cyclones, and typhoons, develop as trade winds. Differences in air pressure over the sea cause these storms to develop. As the dense, moist winds of the storm encounter the dry winds off the coast, the storm can increase in intensity. Strong trade winds are associated with a lack of precipitation, while weak trade winds carry rainfall far inland. The most famous rain pattern in the world, the Southeast Asian monsoon, is a seasonal, moisture-laden trade wind. Besides ships and rainfall, trade winds can also carry particles of dust and sand for thousands of kilometers. Particles from Saharan sand and dust storms can blow across islands in the Caribbean Sea and the U.S. state of Florida, more than 8,047 kilometers (5,000 miles) away. Dust storms in the tropics can be devastating for the local community. Valuable topsoil is blown away and visibility can drop to almost zero. Across the sea , dust makes the sky hazy. These dust storms are often associated with dry, low-pressure areas and a lack of tropical storms. 2.4.2.1.5 Doldrums The place where the trade winds of the two hemispheres meet is called the intertropical convergence zone (ITCZ). The area around the ITCZ is called the doldrums. Prevailing winds in the doldrums are very weak, and the weather is unusually calm.

The ITCZ straddles the Equator. In fact, the low-pressure doldrums are created as the sun heats the equatorial region and causes air masses to rise and travel north and south. (This warm, low-pressure equatorial wind descends again around the horse latitudes. Some equatorial air masses return to the doldrums as trade winds, while others circulate in the other direction as westerlies.) Although monsoon impact tropical as well as equatorial regions, the wind itself is created as the ITCZ moves slightly away from the Equator each season. This change in the doldrums disturbs the usual air pressure, creating the moisture-laden Southeast Asian monsoon. 2.4.2.2 Results of Wind Wind traveling at different speeds, different altitudes, and over water or land can cause different types of patterns and storms. 2.4.2.2.1 Jet Streams Jet streams are geostrophic winds that form near the boundaries of air masses with different temperatures and humidity. The rotation of the Earth and its uneven heating by the sun also contribute to the formation of high-altitude jet streams. These strong, fast winds in the upper atmosphere can blow 480 kph (298 mph). Jet streams blow through a layer of the atmosphere called the stratosphere, at altitudes of 8 to 14 kilometers (5 to 9 miles) above Earth’s surface. There is little turbulence in the stratosphere, which is why commercial airline pilots like to fly in this layer. Riding with jet streams saves time and fuel. Have you ever heard someone talk about a headwind or tailwind when they are talking about airplanes? These are jet streams. If they are behind the plane, pushing it forward, they are called tailwinds. They can help you get to your destination more quickly. If the winds are in front of the plane, pushing it back, they are called headwinds. Strong headwinds can cause flight delays. 2.4.2.2.2 Hurricane A hurricane is a giant, spiraling tropical storm that can pack wind speeds of over 257 kph (160 mph) and unleash more than 9 trillion liters (2.4 trillion gallons) of rain. These same tropical storms are known as hurricanes in the Atlantic Sea , cyclones in the northern Indian Sea , and typhoons in the western Pacific Sea . These tropical storms have a spiral shape. The spiral (swirling counter-clockwise in the Northern Hemisphere and clockwise in the Southern Hemisphere) develops as a high-pressure area twists around a low-pressure area. The Atlantic Ocean’s hurricane season peaks from mid-August to late October and averages five to six hurricanes per year. Wind conditions that can lead to hurricanes are called tropical disturbances. They begin in warm sea waters when the surface temperatures are at least 26.6 degrees Celsius (80 degrees Fahrenheit). If the disturbance lasts for more than 24 hours and gets to speeds of 61 kph (38 mph), it becomes known as a tropical depression. When a tropical depression speeds up to 63-117 kph (39-73 mph), it is known as a tropical storm, and is

given a name. Meteorologists name the storms in alphabetical order, and alternate with female and male names. When a storm reaches 119 kph (74 mph), it becomes a hurricane and is rated from 1 to 5 in severity on the Saffir Simpson scale. A Category 5 hurricane is the strongest storm possible on the Saffir-Simpson scale. Winds of a Category 5 blow at 252 kph (157 mph). Hurricanes spin around a low-pressure (warm) center known as the ―eye.‖ Sinking air inside the eye makes it very calm. The eye is surrounded by a violent circular ―eye wall.‖ This is where the storm’s strongest winds and rain are. Hurricane Ethel, the strongest hurricane in recorded history, roared across the Gulf of Mexico in September 1960. Winds were sustained at 260 kph (160 mph). However, Hurricane Ethel quickly dissipated. Although its winds ultimately blew as far north as the U.S. states of Ohio and Kentucky, by the time it hit the coastline of the U.S. states of Louisiana and Mississippi, the storm surge was only about 1.5 meters (5 feet). Only one person died as a result of Hurricane Ethel, and damage to buildings and boats was limited to less than $2 million. Hurricanes bring destruction to coastal ecosystems and communities. When a hurricane reaches land, it often produces waves that can reach 6 meters (20 feet) high and be pushed by high winds 161 kilometers (100 miles) inland. These storm surges are extremely dangerous and cause 90 percent of all hurricane deaths. The deadliest hurricane on record is the Great Hurricane of 1780. Although sophisticated meteorological equipment was not available at that time, winds may have reached 320 kph (200 mph) as the hurricane hit Barbados and other islands in the Caribbean Sea. This may have been enough to strip the bark from trees. More than 20,000 people died as a result of the hurricane as it made its way across Barbados, St. Lucia, Martinique, Dominica, Guadeloupe, Dominican Republic, Bahamas, Turks and Caicos, and Bermuda. Although it decreased in intensity, the hurricane was tracked through the U.S. state of Florida before dissipating in the Canadian province of Newfoundland. Hurricanes can be destructive in other ways. High winds can create tornadoes. Heavy rains contribute to floods and landslides, which may occur many kilometers inland. Damage to homes, businesses, schools, hospitals, roads, and transportation systems can devastate communities and entire regions. Hurricane Katrina, which blew through the Gulf of Mexico and into the southern U.S. in 2005, is the most expensive hurricane in recorded history. Damage to buildings, vehicles, roads, and shipping facilities is estimated at about $133.8 billion (adjusted for inflation). New Orleans, Louisiana, was almost completely devastated by Hurricane Katrina. New Orleans, as well as Mobile, Alabama, and Gulfport, Mississippi, took years to recover from the damage done to their structures and infrastructure. The best defense against a hurricane is an accurate forecast that gives people time to get out of its way. The National Hurricane Center issues hurricane watches for storms that may endanger communities, and hurricane warnings for storms that will reach land within 24 hours. 2.4.2.2.3 Cyclones
Cyclones blow through the Indian Sea in the same way hurricanes blow across the Atlantic. Cyclones blow in with air masses from the east, often the South China Sea, or the south. The most powerful and devastating cyclone in recorded history was the 1970 Bhola Cyclone. Like Hurricane Katrina, the Bhola Cyclone was a Category 3 storm. Its winds were about 185 kph (115 mph)

as it made landfall along the coast of the Bay of Bengal, in what is today Bangladesh. More than 300,000 people died, and more than a million were made homeless. Cyclonic winds devastated fishing villages, and storm surges drowned crops. The economic damage from the Bhola Cyclone was more than $479 million, adjusted for inflation. 2.4.2.2.4 Typhoon Typhoons are tropical storms that develop over the northwest Pacific Sea . Their formation is identical to hurricanes and cyclones. Typhoons form as equatorial winds and blow westward before turning north and merging with westerlies around the mid-latitudes.
Typhoons can impact a wide area of the eastern Pacific. The islands of the Philippines, China, Vietnam, and Japan are the most affected. However, typhoons have also been recorded as far as the U.S. states of Hawaii and even Alaska. Typhoons are often associated with extremely heavy rainfall. The wettest typhoon ever recorded was Typhoon Morakot in 2009. Morakot devastated the entire island of Taiwan, with winds of about 140 kph (85 mph). Storm surges and floods caused by those winds, however, caused the most damage. More than 277 centimeters (109 inches) of rain drenched Taiwan, leading to 461 deaths and $6.2 billion in damage. 2.4.2.2.5 Nor’easters and Blizzards A nor'easter is a strong winter storm combining heavy snowfall, strong winds, and very cold temperatures. It blows from the northeast along the East Coast of the U.S. and Canada. A strong nor’easter is called a blizzard. The U.S. Weather Service calls a storm a blizzard when the storm has wind speeds of more than 56 kph (35 mph) and low visibility. (Visibility is the distance that a person can see—blizzards, like fog, make visibility difficult and a task like driving dangerous.) The storm must go on for a prolonged phase of time to be classified as a blizzard, usually a few hours. Blizzards can isolate and paralyze areas for days, especially if the area rarely has snowfall and does not have the equipment to clear it from the streets. The Great Blizzard of 1888 was perhaps the worst in U.S. recorded history. Winds of up to 72 kph (45 mph) whipped the East Coast from Chesapeake Bay to as far north as Nova Scotia, Canada. More than 147 centimeters (58 inches) of snow fell across the region, causing freezing temperatures and massive flooding as the snow melted. The Great Blizzard resulted in 400 deaths and $1.2 billion in damage. 2.4.2.2.6 Monsoon A monsoon is a seasonal change in the prevailing wind system of an area. They always blow from cold, high-pressure regions. Monsoons are part of a yearlong cycle of uneven heating and cooling of tropical and mid-latitude coastal regions. Monsoons are part of the climate of Australia, Southeast Asia, and in the southwestern region of North America. The air over land is heated and cooled more quickly than the air over the sea . During summer, this means warm land-air rises, creating a space for the cool and moist air from the sea . As the land heats the moist air, it rises, cools, condenses, and falls back to Earth as rain. During the winter, the land cools more quickly than the sea . The warm air over the sea rises, allowing cool land-air to flow in. Most winter monsoons are cool and dry, while summer monsoons are warm and moist. Asia’s winter monsoons bring cool, dry air from the Himalaya mountains. The famous summer monsoon, on the other
hand, develops over the Indian Sea , absorbing tremendous amounts of moisture. Summer monsoons bring warmth and precipitation to India, Sri Lanka, Bangladesh, and Myanmar. The summer monsoon is essential for the health and economies of the Indian subcontinent. Aquifers are filled, allowing water for drinking, hygiene, industry, and irrigation. 2.4.2.2.7 Tornado A tornado, also called a twister, is a violently rotating funnel of air. Tornadoes can occur individually or in multiples, as two spinning vortexes of air rotating around each other. Tornadoes can occur as waterspouts or landspouts, spinning from hundreds of meters in the air to connect the land or water with clouds above. Although destructive tornadoes can occur at any time of day, most of them occur between 4 and 9 p.m. local time. Tornadoes often occur during intense thunderstorms called supercells. A supercell is a thunderstorm with a powerful, rotating updraft. (A draft is simply a vertical movement of air.) This powerful updraft is called a mesocyclone. A mesocyclone contains rotating drafts of air 1 to 10 kilometers (1 to 6 miles) in the atmosphere. When rainfall increases in the supercell, rain can drag the mesocyclones down with it to the ground. This downdraft is a tornado. Depending on the temperature and moisture of the air, a tornado can last a few minutes or over an hour. However, cool winds (called rear flank downdrafts) eventually wrap around the tornado and cut off the supply of warm air that feeds it. The tornado thins out into the ―rope-like‖ stage and dissipates a few minutes later. Most tornadoes have wind speeds of less than 177 kph (110 mph), and are about 76 meters (250 feet) across. They can travel for several kilometers before dissipating. However, the most powerful tornadoes can have wind speeds of more than 482 kph (300 mph) and be more than 3 kilometers (2 miles) across. These tornadoes can travel across the ground for dozens of kilometers and through several states. These violent storms occur around the world, but the United States is a major hotspot with about a thousand tornadoes every year. "Tornado Alley," a region that includes eastern South Dakota, southern Minnesota, Nebraska, Kansas, Oklahoma, northern Texas, and eastern Colorado, is home to the most powerful and destructive of these storms. The most extreme tornado ever recorded occurred on March 18, 1925. This ―Tri-State Tornado‖ sped for 338 kilometers (219 miles) through Missouri, Illinois, and Indiana. The tornado destroyed local communications, making warnings for the next town nearly impossible. The Tri-State Tornado killed 695 people in 3.5 hours. The best protection against a tornado is early warning. In areas where tornadoes are common, many communities have tornado warning systems. In Minnesota, for example, tall towers throughout neighborhoods sound an alarm if a tornado is near. 2.4.2.3 Measuring Winds Wind is often measured in terms of wind shear. Wind shear is a difference in wind speed and direction over a set distance in the atmosphere. Wind shear is measured both horizontally and vertically. Wind shear is measured in meters per second times kilometers of height. Under normal conditions, the winds move much faster higher in the atmosphere, creating high wind shear in high altitudes.

Engineers must consider an area’s average wind shear when constructing buildings. Wind shear is higher near the coast, for example. Skyscrapers must account for this increased wind by having a stronger foundation or being engineered to safely ―sway‖ with the wind. The amount of force that wind is generating is measured according to the Beaufort scale. The scale is named for Sir Francis Beaufort, who established a system for describing wind force in 1805 for the British Royal Navy. The Beaufort scale has 17 levels of wind force. ―0‖ explains conditions that are so calm that smoke rises vertically. ―12‖ explains a hurricane, and ―13-17‖ are reserved only for tropical typhoons, the most powerful and potentially destructive wind systems. An anemometer is a device for measuring wind speed. Anemometers are used with tornado data collectors, which measure the velocity, precipitation, and pressure of tornadoes. Tornadoes’ strength is measured according to the Fujita scale. The scale has six categories that designate increasing damage. After the tornado has passed, meteorologists and engineers determine the tornado’s strength based on its wind speed, width, and damage to vegetation and human-built structures. In 2007, the Enhanced Fujita Scale was established in the U.S.; it provides more specific effects of the tornado to determine its destructive power. The Enhanced Fujita Scale has 28 categories, with the strongest cataloging damage to hardwood and softwood trees. Hurricanes are measured using the Saffir-Simpson scale. In addition to tropical depressions and tropical storms, there are five categories of hurricanes. The most powerful, Category 5, is measured by winds whipping at 252 kph (157 mph). Tropical cyclones and typhoons are often measured using other scales, such as Japan’s Tropical Cyclone Intensity Scale, which measures a typhoon as winds at 118 kph (73 mph). 2.4.2.4 Impact on Climate Wind is a major factor in determining weather and climate. Wind carries heat, moisture, pollutants, and pollen to new areas. Many daily weather patterns depend on wind. A coastal region, for instance, undergoes changes in wind direction daily. The sun heats the land more quickly than the water. Warm air above the land rises, and cooler air above the water moves in over the land, creating an inland breeze. Coastal communities are usually much cooler than their inland neighbors. San Francisco is a coastal city in ―sunny California,‖ and yet the author Mark Twain noticed that ―the coldest winter I ever spent was a summer in San Francisco!‖ Wind affects the climate of a mountainous area differently. Rain shadows are created as wind interacts with a mountain range. As wind approaches a mountain, it brings moisture with it, which condenses as rain and other precipitation before coming over the crest of the mountain. On the other side of the mountain, dry ―downslope winds‖ can speed through mountain passes at nearly 160 kph (100 mph). One of the most familiar of these downslope winds is the Föhn. Föhn winds—nicknamed ―snow-eaters‖—develop as air descends over the Alps, creating a warmer climate in central Europe. Winds also help drive sea surface currents around the world. The Antarctic Circumpolar Current transports cold, nutrient-rich water around Antarctica. The Gulf Stream brings warm water from the Gulf of Mexico up the East Coast of North America and across the Atlantic to Northern Europe. Due to the Gulf Stream, Northern Europe enjoys a much warmer, milder climate than other areas at alike latitudes, such as the U.S. state of Alaska.

2.4.2.5 Impact on Ecology Wind has the power to move particles of earth—usually dust or sand—in great quantities, and over far distances. Dust from the Sahara crosses the Atlantic to create hazy sunsets in the Caribbean. Winds transport volcanic ash and debris for thousands of kilometers. Winds carried ash from the 2010 eruption of Eyjafjallajökull, a volcano in Iceland, as far west as Greenland and as far east as Great Britain. The massive 1883 eruption of Krakatoa, an island volcano in Indonesia, had even more dramatic atmospheric results. Winds carried volcanic ash and debris high in the atmosphere across the globe. Europe endured years of cold, damp summers and pink sunsets. Wind’s ability to move earth can erode the landscape. In some cases, this takes places in the desert, as sand dunes migrate and change shape over time. The wind can also pick up massive amounts of sand and ―sandblast‖ rock formations into stunning sculptures. The Altiplano region of South America has dramatically shaped ventifacts—rocks carved by the wind-driven sand and ice. The wind’s power to erode the land can be detrimental to agriculture. Loess, a sediment that can develop into one of the richest soils for farming, is easily swept up by wind. Even when farmers take precautions to protect it, the wind can erode up to 2.5 kilograms of loess per square meter (1.6 pound per square foot) every year. The most famous example of this devastating windstorm is probably the Dust Bowl of 1930s North America. Dust Bowl storms could reduce visibility to a few feet, and earned names like "Black Blizzards." Millions of farmers, especially those in the U.S. states of Oklahoma, Arkansas, and Texas, lost their land when they were unable to harvest any crops. However devastating to the economy, wind is an important way plants disperse seeds. This form of seed dispersal is called anemochory. Plants that rely on anemochory produce hundreds and even thousands of seeds. Seeds are carried by the wind to distant or nearby places, increasing the spread of the plant’s genetics. Some of the most familiar seeds dispersed by the wind are those of the fuzzy dandelion. 2.4.2.6 Wind Energy Wind has been used as a source of energy for more than a thousand years—it has pushed ships around the globe and been captured in windmills to pump water; it has turned giant stones to grind grains, make paper, saw logs, and crush ore. Today, most wind energy is used to generate electricity for homes, businesses, hospitals, schools, and industry. Wind is a renewable resource that does not directly cause pollution. Wind energy is harnessed through powerful turbines. Wind turbines have a tall tubular tower with two or three propeller-like blades rotating at the top. When the wind turns the blades, the blades turn a generator and create electricity. Often, wind turbines are collected in windy areas in arrays known as wind farms. Many wind farms have been established on mountains, in valleys, and offshore, as the air from the sea interacts with land-air. Some people think wind turbines are ugly and complain about the noise they make. The slowly rotating blades can also kill birds and bats—but not nearly as many as cars, power lines, and high-rise buildings. The economic drawback to wind farms, however, is the wind itself. If it's not blowing, there's no electricity generated.
Still, use of wind energy has more than quadrupled between 2000 and 2006. Germany has the most installed wind energy capacity, followed by Spain, the United States, India, and Denmark. Development is also growing quickly in France and China. Industry experts predict that if this pace of growth continues, by 2050, one-third of the world’s electricity needs could be met by wind.
2.5 Clouds and Rainfall Types
2.5.1 Clouds
In meteorology, a cloud is a visible mass of liquid droplets or frozen crystals made of water or various chemicals suspended in the atmosphere above the surface of a planetary body. These suspended particles are also known as aerosols and are studied in the cloud physics branch of meteorology.
Terrestrial cloud formation is the result of air in Earth's atmosphere becoming saturated due to either or both of two processes; cooling of the air and adding water vapor. With sufficient saturation, precipitation will fall to the surface; an exception is virga, which evaporates before reaching the surface.
Clouds in the troposphere, the atmospheric layer closest to Earth's surface, have Latin names due to the universal adaptation of Luke Howard's nomenclature. It was introduced in December 1802 and became the basis of the modern classification system. Synoptic surface weather observations use code numbers to record and report any type of tropospheric cloud visible at scheduled observation times based on its height and physical appearance.
The international cloud classification system is based on the fact that these aerosols in their most basic forms can show free-convective upward growth into low or vertical heaps of cumulus, appear in non-convective layered sheets at various altitudes as with low stratus and its higher variants, or take the form of high thin fibrous wisps of cirrus. In the case of low and vertical or multi-level clouds, prefixes are used whenever necessary to express variations or complexities in these basic forms. These include strato- for low cumulus layers with limited convection that show some stratus-like characteristics, cumulo- for complex highly convective vertical nimbus storm clouds, and nimbo- for thick stratus layers with sufficient vertical extent to produce moderate to heavy precipitation. For higher-based cloud types, the prefixes specify middle or high altitude ranges; alto- for middle, and cirro- for high. Cloud types prefixed by altitude range may be of simple non-convective stratiform structure or show slightly to moderately complex stratocumuliform structure due to limited convective activity. Free-convective clouds with potentially more complex forms are not prefixed by altitude range. Whether or not a cloud is classified as low, middle, or high level depends on the altitude range of its base above Earth's surface. In the case of a layer or heap with significant vertical extent, the height of the top is also a factor that defines its altitude classification.. A vertically developed cloud can initially form or have its base in the low or middle altitude range of the troposphere depending on the moisture content of the air, while the top can be in the middle or high range.
While a majority of clouds form in Earth's troposphere, there are occasions when they can be observed at much higher altitudes in the stratosphere and mesosphere. These three main atmospheric layers are collectively known as the homosphere. Above this lies the thermosphere and exosphere, which together make up the heterosphere that marks the transition to outer space. Clouds have been observed on other

planets and moons within the Solar System, but, due to their different temperature characteristics, they are composed of other substances such as methane, ammonia, and sulfuric acid.
2.5.1.1 Cooling air to its dew point
2.5..1.1.1Adiabatic cooling
All weather-related clouds form in the troposphere, the lowest layer of Earth's atmosphere. This generally happens when one or more lifting agents causes air containing invisible water vapor to rise and cool to its dew point, the temperature at which the air becomes saturated. The main mechanism behind this process is adiabatic cooling. Atmospheric pressure decreases with altitude, so the rising air expands in a process that expends energy and causes the air to cool, which reduces its capacity to hold water vapor. If the air is cooled to its dew point and becomes saturated, it normally sheds vapor it can no longer retain which condenses into cloud.
2.5..1.1.2 Lifted condensation level
The altitude at which this begins to happen is called the lifted condensation level, which roughly determines the height of the cloud base. Water vapor in saturated air is normally attracted to condensation nuclei such as salt particles that are small enough to be held aloft by normal circulation of the air. If the condensation process occurs below the freezing level in the troposphere, the nuclei help transform the vapor into very small water droplets. The average size of a newly formed droplet is around 0.02 mm (0.0008 in). Clouds that form just above the freezing level are composed mostly of supercooled liquid droplets, while those that condense out at higher altitudes where the air is much colder generally take the form of ice crystals. An absence of sufficient condensation particles at and above the condensation level causes the rising air to become supersaturated and the formation of cloud tends to be inhibited.
2.5..1.1.3 Frontal and cyclonic lift
There are three main agents of vertical lift. One comprises two closely related processes which work together. Frontal lift and cyclonic lift occur when stable or slightly unstable air, which has been subjected to little or no surface heating, is forced aloft at weather fronts and around centers of low pressure. Cloud droplets form when the air is lifted beyond the condensation level where water vapor condenses on so-called nuclei; (small particles) that grow to a size of typically 0.02 mm (.001 in). In a cloud the droplets collide to form larger droplets. These larger droplets remain aloft as long as the drag force of the air dominates over the gravitational force for small particles. If the cloud droplets continue to grow past this size, they become too heavy to be held aloft as the gravitational force overcomes the atmospheric drag, and they fall from the cloud as rain. When this process takes place just above the freezing level, the vapor tends to condense into supercooled water droplets, which with additional lifting and growth in size, can eventually turn into freezing rain. At temperatures well below freezing, the vapor desublimates into ice crystals that average about 0.25 mm in length. Continuing lift and desublimation will tend to increase the number of ice crystals which may combine until they are too heavy to be supported by the vertical air currents and fall out as snow.
2.5..1.1.4 Convective lift
Another agent is the buoyant convective upward motion caused by significant daytime solar heating at surface level, or by relatively high absolute humidity. Air warmed in this way becomes increasingly unstable. This causes it to rise and cool until temperature equilibrium is achieved with the surrounding air
aloft. If air near the surface becomes extremely warm and unstable, its upward motion can become quite explosive resulting in towering clouds that can break through the tropopause or cause severe weather. Strong convection upcurrents may allow the droplets to grow to nearly .08 mm (.003 in) before precipitating as heavy rain from an active thundercloud. More occasionally, very warm unstable air is present around fronts and low-pressure centers. As with non-frontal convective lift, increasing instability promotes upward vertical cloud growth and raises the potential for severe weather.
2.5..1.1.5 Orographic lift
A third source of lift is wind circulation forcing air over a physical barrier such as a mountain (orographic lift). If the air is generally stable, nothing more than lenticular cap clouds will form. However, if the air becomes sufficiently moist and unstable, orographic showers or thunderstorms may appear.
2.5..1.1.6 Non-adiabatic cooling
Along with adiabatic cooling that requires a lifting agent, there are three other main mechanisms for lowering the temperature of the air to its dew point, all of which occur near surface level and do not require any lifting of the air. Conductive, radiational, and evaporative cooling can cause condensation at surface level resulting in the formation of fog. Conductive cooling takes place when air from a relatively mild source area comes into contact with a colder surface, as when mild marine air moves across a colder land area. Radiational cooling occurs due to the emission of infrared radiation, either by the air or by the surface underneath. This type of cooling is common during the night when the sky is clear. Evaporative cooling happens when moisture is added to the air through evaporation, which forces the air temperature to cool to its wet-bulb temperature, or sometimes to the point of saturation.
2.5..1.1.7 Adding moisture to the air
There are five main ways water vapor can be added to the air. Increased vapor content can result from wind convergence over water or moist ground into areas of upward motion. Precipitation or virga falling from above also enhances moisture content. Daytime heating causes water to evaporate from the surface of oceans, water bodies or wet land. Transpiration from plants is another typical source of water vapor. Lastly, cool or dry air moving over warmer water will become more humid. As with daytime heating, the addition of moisture to the air increases its heat content and instability and helps set into motion those processes that lead to the formation of cloud or fog.
2.5..1.1.8 Cohesion and dissolution
There are forces in the atmosphere such as wind shear and downdrafts that can impact the structural integrity of a cloud. However, as long as the air remains saturated, the natural force of cohesion that hold the molecules of a substance together acts to keep the cloud from breaking up. Dissolution of the cloud can occur when the process of adiabatic cooling ceases after the passage of a weather disturbance or following the loss of daytime heating of the lower troposphere. Upward lift of the air is replaced by subsidence. This leads to at least some degree of adiabatic warming of the air which can result in the cloud droplets evaporating and turning back into invisible water vapor.
2.5..1.2 Distribution: variable global prevalence
2.5..1.2.1 Convergence
Atmospheric convergence is a process that involves the horizontal inflow and accumulation of air at a given location, as well as the rate at which this happens. This accumulation causes air to rise. If higher altitude divergence (horizontal outflow) of an equal amount occurs simultaneously above the same location, the surface atmospheric pressure is theoretically not affected. However, much of the surface convergence that occurs in the atmosphere is caused by the drawing in of air in the form of wind currents towards areas of low pressure that are the product of unequal heating of the Earth's surface.
2.5..1.2.2 Low-pressure zones
Although the local distribution of clouds can be significantly influenced by topography, the global prevalence of cloud cover tends to vary more by latitude. This is the result of atmospheric motion driven by the uneven horizontal distribution of net incoming radiation from the sun. Cloudiness reaches maxima close to the equator and near the 50th parallels of latitude in the northern and southern hemispheres. These are zones of low pressure that encircle the Earth as part of a system of large latitudinal cells that influence atmospheric circulation. In both hemispheres working away from the equator, they are the tropical Hadley cells, the mid-latitude Ferrel, and the polar cells. The 50th parallels coincide roughly with bands of low pressure situated just below the polar highs. These extratropical convergence zones are occupied by the polar fronts where air masses of polar origin meet and clash with those of tropical or subtropical origin. This leads to the formation of weather-making extratropical cyclones composed of cloud systems that may be stable or unstable to varying degrees according to the stability characteristics of the various airmasses that are in conflict.
2.5..1.2.3 Intertropical convergence zone
Near the equator, increased cloudiness is due to the presence of the low-pressure Intertropical Convergence Zone or monsoon trough. Monsoon troughing in the western Pacific reaches its latitudinal zenith in each hemisphere above and below the equator during the late summer when the wintertime surface high-pressure ridge in the opposite hemisphere is strongest. The trough can reach as far as the 40th parallel north in East Asia during August and the 20th parallel south in Australia during February. Its poleward progression is accelerated by the onset of the summer monsoon which is characterized by the development of lower air pressure of greater instability over the warmest parts of the various continents. Cloud cover formed in this way tends to be unstable and free-convective in nature. The resulting weather systems often produce heavy showers and thunderstorms These can result in the formation of tropical storms and hurrucanes composed mainly of towering thunderclouds. In the southern hemisphere, the trough associated with the Australian monsoon reaches its most southerly latitude in February, oriented along a west-northwest to east-southeast axis.
2.5..1.2.4 Divergence
Divergence is the opposite of convergence. In the Earth's atmosphere, it involves the hoizontal outflow of air from the upper part of a rising column of air, or from the lower part of a subsiding column often associated with an area or ridge of high pressure.
2.5..1.2.5 Subtropical ridge
Cloudiness reaches minima near the poles and in the subtropics close to the 20th parallels, north and south. The latter are sometimes referred to as the horse latitudes. The presence of a large-scale high-pressure subtropical ridge on each side of the equator reduces cloudiness at these low latitudes. Heating of the Earth near the equator leads to large amounts of upward motion and convection along the monsoon

trough or intertropical convergence zone. These rising air currents diverge in the upper troposphere and move away from the equator at high altitude in both northerly and southerly directions. As it moves towards the mid-latitudes on both sides of the equator, the air cools and sinks. The resulting air mass subsidence creates a subtropical ridge near the 30th parallel of latitude in both hemispheres where the formation of cloud is minimal. At surface level, the sinking air diverges again with some moving back to the equator and completing the vertical cycle. This circulation on each side of the equator is known as the Hadley cell in the tropics. Many of the world's deserts are caused by these climatological high-pressure areas.
2.5..1.2.6 Polar high
Alike patterns also occur at higher latitudes in both hemispheres. Upward currents of air along the polar fronts diverge at high tropospheric altitudes. Some of the diverging air moves to the poles where air mass subsidence inhibits cloud formation and leads to the creation of the polar areas of high pressure. Divergence occurs near surface level resulting in a return of the circulating air to the polar fronts where rising air currents can create extensive cloud cover and precipitation. This vertical cycle comprises the polar cell in each latitudinal hemisphere. Some of the air rising at the polar fronts diverges away from the poles and moves in the opposite direction to the high level zones of convergence and subsidence at the subtropical ridges on each side of the equator. These mid-latitude counter-circulations create the Ferrel cells that encircle the globe in the northern and southern hemispheres.
2.5.1.3 Classification
2.5.1.3.1 Luke Howard and Jean-Baptiste Lamarck
Luke Howard, a methodical observer with a strong grounding in the Latin language, used his background to categorize the various tropospheric cloud types and forms during December 1802. He believed that the changing cloud forms in the sky could unlock the key to weather forecasting. Jean-Baptiste Lamarck worked independently on cloud categorization and came up with a different naming scheme that failed to make an impression even in his home country of France because it used unusual French names for cloud types. His system of nomenclature included twelve categories of clouds, with such names as (translated from French) hazy clouds, dappled clouds and broom-like clouds. Howard used universally accepted Latin, which caught on quickly. As a sign of the popularity of the naming scheme, the German dramatist and poet Johann Wolfgang von Goethe composed four poems about clouds, dedicating them to Howard. Classification systems would be proposed by Heinrich Dove of Germany in 1828 and Elias Loomis of the United States in 1841, but neither became the international standard that Howard's system became. It was formally adopted by the International Meteorological Commission in 1929.
2.5.1.3.1.1 First comprehensive classification
Howard's original system established three general cloud categories based on physical appearance and process of formation: cirriform (mainly detached and wispy), cumuliform or convective (mostly detached and heaped, rolled, or rippled), and non-convective stratiform (mainly continuous layers in sheets). These were cross-classified into lower and upper families. Cumuliform clouds forming in the lower level were given the genus name cumulus, and low stratiform clouds the genus name stratus. Physically alike clouds forming in the upper height range were given the genus names cirrocumulus (generally showing more limited convective activity than low level cumulus) and cirrostratus, respectively. Cirriform category clouds were identified as always upper level and given the genus name cirrus. To these, Howard added the genus nimbus for clouds of complex structure producing significant precipitation that came to be identified as a distinct nimbiform physical category.
2.5.1.3.1.2 Howard's successors
Around 1840–41, German meteorologist Ludwig Kaemtz added stratocumulus as a mostly detached low-cloud genus of limited convection with both cumuliform- and stratiform characteristics alike to upper-level cirrocumulus. This had the effect of creating a stratocumuliform category that included rolled and rippled clouds separately from the more freely convective heap clouds. About fifteen years later, Emilien Renou, director of the Parc Saint-Maur and Montsouris observatories, began work on an elaboration of Howard's classifications that would lead to the introduction during the 1870s of altocumulus (physically more closely related to stratocumulus than to cumulus) and altostratus. These were respectively stratocumuliform and stratiform cloud genera of a newly defined middle height range above stratocumulus and stratus but below cirrocumulus and cirrostratus, with free convective cumulus and non-convective nimbus occupying more than one altitude range as clouds with vertical extent. In 1880, Philip Weilbach, secretary and librarian at the Art Academy in Copenhagen, and like Luke Howard, an amateur meteorologist, proposed and had accepted by the permanent committee of the International Meteorological Organization (IMO), a forerunner of the present-day World Meteorological Organization (WMO), the designation of a new free-convective vertical genus type, cumulonimbus, which would be distinct from cumulus and nimbus and identifiable by its often very complex structure (frequently including a cirriform top and what are now recognized as multiple accessory clouds), and its ability to produce thunder. With this addition, a canon of ten cloud genera was established that came to be officially and universally accepted. At about the same time, several cloud specialists proposed variations that came to be accepted as species subdivisions and varieties determined by more specific variable aspects of the structure of each genus. A further modification of the genus classification system came when an IMC commission for the study of clouds put forward a refined and more restricted definition of the genus nimbus which was effectively recategorized as a stratiform cloud type. It was then renamed nimbostratus and published with the new name in the 1932 edition of the International Atlas of Clouds and of States of the Sky. This left cumulonimbus as the only nimbiform physical category-type as indicated by its root-name. In 1976, the National Aeronautics and Space Administration (NASA) published a cloud classification that showed a change in name of the nimbiform category to cumulonimbiform, although some other agencies have continued to recognize the earlier category name.
2.5.1.4 Physical categories
As established by Howard and his successors, clouds are commonly grouped into physical categories that can be up to five in number: cirriform, cumuliform, cumulonimbiform, stratocumuliform, and stratiform. These designations distinguish a cloud's physical structure and process of formation.
2.5.1.4.1 Cirriform
Cirriform-category clouds generally have a wispy fibrous appearance and form at high tropospheric altitudes along the very leading edges of a frontal or low-pressure weather disturbance and often along the fringes of its other borders. In general, they are non-convective but occasionally acquire a tufted or turreted appearance caused by small-scale high-altitude convection. These high clouds do not produce precipitation as such but are often accompanied or followed by lower-based clouds that do.
2.5.1.4.2 Cumuliform
Cumuliform clouds typically have flat bases and puffy domed tops. They are the product of localized free-convective lift and can vary in vertical extent depending on the stability characteristics of the air mass where they are forming. Incoming short-wave radiation generated by the sun is re-emitted as long-

wave radiation when it reaches Earth's surface. This process warms the air closest to ground and increases air mass instability by creating a steeper temperature gradient from warm or hot at surface level to cold aloft. Moderate instability allows for the formation of cumuliform clouds of moderate size that can produce light showers if the airmass is sufficiently moist. The more the air is heated from below, the more unstable it tends to become. This may cause large towering cumuliform clouds to form in the lower half of the troposphere with tops growing into the upper levels. These buildups can cause moderate to occasionally heavy showers. They tend to be more concentrated and intense when they are associated with fast-moving unstable cold fronts.
2.5.1.4.3 Cumulonimbiform
The largest free-convective cumuliform clouds often have complex structures that include cirriform tops and multiple accessory clouds and are sometimes classified separately as cumulonimbiform. At maturity, they have very strong updrafts that can penetrate the tropopause. They can produce thunderstorms and a variety of types of lightning including cloud-to-ground that can cause wildfires. Other convective severe weather may or may not be associated with thunderstorms and include heavy rain or snow showers, hail, strong wind shear, downbursts, and tornadoes.
2.5.1.4.4 Stratiform
In general, stratiform-category clouds have a flat sheet-like structure and form at any altitude in the troposphere where there is sufficient condensation as the result of non-convective lift of relatively stable air, especially along warm fronts, around areas of low pressure, and sometimes along stable slow moving cold fronts. In general, precipitation falls from stratiform clouds in the lower half of the troposphere. If the weather system is well-organized, the precipitation is generally steady and widespread. The intensity varies from light to heavy according to the thickness of the stratiform layer as determined by moisture content of the air and the intensity of the weather system creating the clouds and weather. Unlike free convective cumuliform and cumulonimbiform clouds that tend to grow upward, stratiform clouds achieve their greatest thickness when precipitation that forms in the middle level of the troposphere triggers downward growth of the cloud base to near surface level. Stratiform clouds can also form in precipitation below the main frontal cloud deck where the colder air is trapped under the warmer airmass being forced above by the front. Non-frontal low stratiform cloud can form when advection fog is lifted above surface level during breezy conditions.
2.5.1.4.5 Stratocumuliform
Clouds of this physical structure have both cumuliform and stratiform characteristics and generally form as a result of limited convection in slightly unstable air. They can form at any altitude in the troposphere wherever and whenever there is sufficient moisture and lift. High stratocumuliform clouds also tend show some cirriform characteristics or form in association with cirriform clouds. If a poorly organized low-pressure weather system is present, virga or weak intermittent precipitation may fall from those stratocumuliform clouds that form mostly in the low and lower-middle height ranges of the troposphere.
2.5.1.4.6 Families and cross-classification into genera
The individual genus types result from the physical categories being cross-classified by height range family within the troposphere. A general consensus exists as to the designation of high, middle, and low families, the makeup of the basic canon of ten cloud genera that results from this cross-classification, and the family affiliation of non-vertical genus types. Several but not all methods of altitude classification

treat clouds with significant vertical extent as a separate family. The base-height range for each family varies depending on the latitudinal geographical zone. Moderate and towering vertical clouds can have low or middle bases depending on the moisture content of the air.
2.5.1.4.6.1 High
Clouds of the high family form at altitudes of 3,000 to 7,600 m (10,000 to 25,000 ft) in the polar regions, 5,000 to 12,200 m (16,500 to 40,000 ft) in the temperate regions and 6,100 to 18,300 m (20,000 to 60,000 ft) in the tropical region. All cirriform clouds are classified as high-range and thus constitute a single genus cirrus (Ci). Stratocumuliform and stratiform clouds in the high-altitude family carry the prefix cirro-, yielding the respective genus names cirrocumulus (Cc) and cirrostratus (Cs). Strato- is excluded from cirrocumulus to avoid double prefixing. Most high cloud forms as a result of natural atmospheric processes. However, contrails formed from the exhaust of high-flying aircraft can persist and spread into formations resembling cirrus, cirrocumulus, or cirrostratus. This variant has no special WMO designation, but is sometimes given the faux-Latin name Aviaticus.
2.5.1.4.6.2 Middle
The family of middle clouds typically comprises one stratocumuliform and one stratiform genus. They are prefixed by alto-, yielding the genus names altocumulus (Ac) and altostratus (As). Strato- is also excluded from altocumulus. These clouds can form as low as 2,000 m (6,500 ft) above surface at any latitude, but may be based as high as 4,000 m (13,000 ft) near the poles, 7,000 m (23,000 ft) at mid latitudes, and 7,600 m (25,000 ft) in the tropics.
2.5.1.4.6.3 Low
Low clouds are found from near surface up to 2,000 m (6,500 ft). This family mainly includes one stratocumuliform and one stratiform genus whenever vertical clouds are classified separately. When a low stratiform cloud contacts the ground, it is called fog, although radiation and advection types of fog do not form from stratus layers. Genus types in this family either have no prefix or carry one that refers to a characteristic other than altitude. Of the two main cloud types in this family, the prefixed genus is stratocumulus (Sc), a low altitude cloud of limited convection, and the non-prefixed genus is non-convective stratus (St) that usually forms into a comparatively thin layer. Small fair weather cumulus (Cu) of limited convection is also often included with this family.
2.5.1.4.6.4 Vertical
Upward-growing free-convective clouds have low to middle bases that form anywhere from near surface to about 2,400 m (8,000 ft) in temperate climates, and often much higher in arid regions, even to the very top of the middle altitude range of the troposphere. This family, when recognized as such, includes the singular cumuliform and cumulonimbiform genus types, and one stratiform genus. The first of these is free-convective cumulus (Cu) that carries no prefix. It usually forms in the low-altitude range except during conditions of very low relative humidity when the clouds bases can rise into the middle range. The other two types have non height-related prefixes. Cumulonimbus (Cb) is prefixed according to its free-convective characteristics. Nimbostratus (Ns) is a non-convective deep stratiform genus that normally forms from middle-altitude altostratus and achieves vertical extent as it thickens during precipitation with the base subsiding into the low altitude range. The nimbo- prefix refers to its ability to produce significant rain or snow over a wide area.

Some methods of height classification limit the term vertical to upward-growing free-convective cumuliform and cumulonimbiform genera whose vertical thickness exceeds their horizontal base-width. Downward-growing nimbostratus can be as thick as most upward-growing vertical cumulus, but its horizontal extent tends to be even greater. This sometimes leads to the exclusion of this genus type from the family of vertical clouds. Authorities who follow this approach usually classify nimbostratus either as low to denote its normal base height range, or as middle, based on the altitude range at which it normally forms. Sometimes the term multi-level is used for all very thick or tall cloud types including nimbostratus to avoid the connotation of 'vertical' with free-convective cumuliform only. Alternatively, some classifications do not recognize a vertical family designation and include all vertical free-convective cumuliform and cumulonimbiform types with the family of low clouds.
Nimbostratus and some cumulus in this family usually only achieve comparatively moderate vertical extent. However, with sufficient airmass instability, upward-growing cumuliform clouds can grow to towering proportions. Although genus types with vertical extent are often considered a single family, the International Civil Aviation Organization (ICAO) further distinguishes towering vertical clouds as a separate group or sub-group by specifying that these very large cumuliform and cumulonimbiform types must be identified by their standard names or abbreviations in all aviation observations (METARS) and forecasts (TAFS) to warn pilots of possible severe weather and turbulence. When towering vertical types are considered separately, they comprise the aforementioned cumulonimbus genus and one cumulus species, cumulus congestus (Cu con). The latter is a sub-type of the genus cumulus. This species is designated towering cumulus (Tcu) by ICAO. There is no stratiform type in this group because by definition, even very thick stratiform clouds cannot have towering vertical structure, although they may be accompanied by embedded towering cumuliform or cumulonimbiform types.
2.5.1.4.6.5 Species
Genus types are divided into species that indicate specific structural details. However, because these latter types are not always restricted by height range, some species can be common to several genera that are differentiated mainly by altitude.
2.5.1.4.6.6 Stable stratocumuliform
Good examples of species common to more than one genus are the stratiformis and lenticularis types, each of which is common to mostly stable stratocumuliform genera in the high-, middle-, and low-height ranges (cirrocumulus, altocumulus, and stratocumulus, respectively). Stratiformis species normally occur in extensive sheets or in smaller patches where there is only minimal convective activity. Lenticularis species tend to have lens-like shapes tapered at the ends. They are most commonly seen as orographic mountain-wave clouds, but can occur anywhere in the troposphere where there is strong wind shear combined with sufficient airmass stability to maintain a generally flat cloud structure.
2.5.1.4.6.7 Stable cirriform and stratiform
Cirrus clouds have a couple of species that are unique to the wispy structures of this genus and an additional species which is also seen with high stratiform clouds. Uncinus filaments with upturned hooks and spissatus filaments that merge into dense patches are both considered cirriform species. However the species fibratus can be seen with cirrus and with cirrostratus that is transitional to or from cirrus. Cirrostratus at its most characteristic tends to be mostly of the stratiform species nebulosus, which creates a rather diffuse appearance lacking in structural detail. Altostratus and nimbostratus clouds always have this physical appearance without significant variation or deviation and, consequently, do not need to be

subdivided into species. Low stratus is also of the species nebulosus except when broken up into ragged sheets of stratus fractus.
2.5.1.4.6.8 Unstable cirriform and stratocumuliform
With increasing airmass instability, castellanus structures, which resemble the turrets of a castle when viewed from the side, can be found with any stratocumuliform genus. This species is also sometimes seen with convective patches of cirrus, as are the more detached tufted floccus species, which are common to cirrus, cirrocumulus, and altocumulus, but not stratocumulus.
2.5.1.4.6.9 Cumuliform and cumulonimbiform
With the exception of stratocumulus castellanus, local airmass instability in the lower levels tends to produce clouds of the more freely convective cumulus and cumulonimbus genera, whose species are mainly indicators of degrees of vertical development. A cumulus cloud initially forms as a cloudlet of the species fractus or humilis that shows only slight vertical development. If the air becomes more unstable, the cloud tends to grow vertically into the species mediocris, then congestus, the tallest cumulus species. With further instability, the cloud may continue to grow into cumulonimbus calvus (essentially a very tall congestus cloud that produces thunder), then ultimately capillatus when supercooled water droplets at the top turn into ice crystals giving it a cirriform appearance.
2.5.1.4.6.10 Varieties
Genus and species types are further subdivided into varieties whose names can appear after the species name to provide a fuller description of a cloud. Some cloud varieties are not restricted to a specific altitude range or physical structure, and can consequently be common to more than one genus or species.
2.5.1.4.6.11 Opacity-based
All cloud varieties fall into one of two main groups. One group identifies the opacities of particular low and middle cloud structures and comprises the varieties translucidus (translucent), perlucidus (opaque with translucent breaks), and opacus (opaque). These varieties are always identifiable for cloud genera and species with variable opacity. All three are associated with the stratiformis species of altocumulus and stratocumulus. However, only two are seen with altostratus and stratus nebulosus whose uniform structures prevent the formation of a perlucidus variety. Opacity-based varieties are not applied to high clouds because they are always translucent, or in the case of cirrus spissatus, always opaque. Alikely, these varieties are also not attached to moderate and towering vertical clouds because they are always opaque.
2.5.1.4.6.12 Pattern-based
A second group explains the occasional arrangements of cloud structures into particular patterns that are discernable by a surface-based observer (cloud fields usually being visible only from a significant altitude above the formations). These varieties are not always present with the genera and species with which they are otherwise associated, but only appear when atmospheric conditions favor their formation. Intortus and vertebratus varieties occur on occasion with cirrus fibratus. They are respectively filaments twisted into irregular shapes, and those that are arranged in fishbone patterns, usually by uneven wind currents that favor the formation of these varieties. The variety radiatus is associated with cloud rows of a particular type that appear to converge at the horizon. It is sometimes seen with the fibratus and uncinus species of
cirrus, the stratiformis species of altocumulus and stratocumulus, all species of cumulus, and with the genus altostratus. Another variety, duplicatus (closely spaced layers of the same type, one above the other), is sometimes found with cirrus of both the fibratus and uncinus species, and with altocumulus and stratocumulus of the species stratiformis and lenticularis. The variety undulatus (having a wavy undulating base) can occur with any clouds of the species stratiformis or lenticularis, and with altostratus. It is only rarely observed with stratus nebulosus. Under conditions of strong atmospheric wind-shear and instability, this wave-like formation may break into regularly spaced crests. This variant has no separate WMO Latin designation, but is sometimes known informally as Kelvin-Helmholtz. The variety lacunosus is caused by localized downdrafts that create circular holes in the form of a honeycomb or net. It is occasionally seen with cirrocumulus and altocumulus of the species stratiformis, castellanus, and floccus, and with stratocumulus of the species stratiformis and castellanus.
2.5.1.4.6.13 Combinations
It is possible for some species to show combined varieties at one time, especially if one variety is opacity-based and the other is pattern-based. An example of this would be an opaque layer of altocumulus stratiformis arranged in seemingly converging rows. The full technical name of a cloud in this configuration would be altocumulus stratiformis opacus radiatus, which would identify respectively its genus, species, and two combined varieties.
2.5.1.4.7 Accessory clouds and other supplementary features
Supplementary features are not further subdivisions of cloud types below the species and variety level. Rather, they are either hydrometeors or special cloud formations with their own Latin names that form in association with certain cloud genera, species, and varieties.
2.5.1.4.7.1 Precipitation-based
One group of supplementary features are not actual cloud formations but rather precipitation that falls when water droplets that make up visible clouds have grown too heavy to remain aloft. Virga is a feature seen with clouds producing precipitation that evaporates before reaching the ground, these being of the genera cirrocumulus, altocumulus, altostratus, nimbostratus, stratocumulus, cumulus, and cumulonimbus. When the precipitation reaches the ground without completely evaporating, it is designated as the feature praecipitatio. This normally occurs with altostratus opacus, which can produce widespread but usually light precipitation, and with thicker clouds that show significant vertical development. Of the latter, upward-growing cumulus mediocris produces only isolated light showers, while downward growing nimbostratus is capable of heavier, more extensive precipitation. Towering vertical clouds have the greatest ability to produce intense precipitation events, but these tend to be localized unless organized along fast-moving cold fronts. Showers of moderate to heavy intensity can fall from cumulus congestus clouds. Cumulonimbus, the largest of all cloud genera, has the capacity to produce very heavy showers. Low stratus clouds usually produce only light precipitation, but this always occurs as the feature praecipitatio due to the fact this cloud genus lies too close to the ground to allow for the formation of virga.
2.5.1.4.7.2 Cloud-based
The heavier precipitating clouds, nimbostratus, towering cumulus (cumulus congestus), and cumulonimbus, also typically see the formation in precipitation of the pannus feature, low ragged clouds

of the genera and species cumulus fractus or stratus fractus. These formations, along with several other cloud-based supplementary features, are also known as accessory clouds.
After the pannus types, the remaining supplementary features comprise cloud formations that are associated mainly with upward-growing cumuliform and cumulonimbiform clouds of free convection. Incus is the most type-specific supplementary feature, seen only with cumulonimbus of the species capillatus. A cumulonimbus incus cloud top is one that has spread out into a clear anvil shape as a result of rising air currents hitting the stability layer at the tropopause where the air no longer continues to get colder with increasing altitude. The mamma feature forms on the bases of clouds as downward-facing bubble-like protuberances caused by localized downdrafts within the cloud. It is also sometimes called mammatus, an earlier version of the term used before a standardization of Latin nomenclature brought about by the World Meterorological Organization during the 20th century. The best-known is cumulonimbus with mammatus, but the mamma feature is also seen occasionally with cirrus, cirrocumulus, altocumulus, altostratus, and stratocumulus. Pileus is a cap cloud that can form over a cumulonimbus or large cumulus cloud, whereas a velum feature is a thin horizontal sheet that sometime forms like an apron around the middle or in front of the parent cloud . An arcus feature is a roll or shelf cloud that forms along the leading edge of a squall line or thunderstorm outflow. Some arcus clouds form as a consequence of interactions with specific geographical features. Perhaps the strangest geographically specific arcus cloud in the world is the Morning Glory, a rolling cylindrical cloud that appears unpredictably over the Gulf of Carpentaria in Northern Australia. Associated with a powerful "ripple" in the atmosphere, the cloud may be "surfed" in glider aircraft. A tuba feature is a cloud column that may hang from the bottom of a cumulus or cumulonimbus. A newly formed or poorly organized column might be comparatively benign, but can quickly intensify into a funnel cloud or tornado.
2.5.1.4.7.3 Mother clouds
Clouds initially form in clear air or become clouds when fog rises above surface level. The genus of a newly formed cloud is determined mainly by air mass characteristics such as stability and moisture content. If these characteristics change over a phase of time, the genus tends to change accordingly. When this happens, the original genus is called a mother cloud. If the mother cloud retains much of its original form after the appearance of the new genus, it is termed a genitus cloud. One example of this is stratocumulus cumulogenitus, a stratocumulus cloud formed by the partial spreading of a cumulus type when there is a loss of convective lift. If the mother cloud undergoes a complete change in genus, it is considered to be a mutatus cloud. It is theoretically possible for some lengthy terminologies to emerge by combining the names of all applicable genera, species, varieties, and supplementary features to provide a complete description of an active and evolving genitus or mutatus cloud formation. As an extreme example, a flat opaque layer of altocumulus formed by the spreading of cumulus arranged in parallel bands accompanied by precipitation not reaching the ground could be termed altocumulus stratiformis opacus radiatus cumulogenitus virga.
2.5.1.4.7.4 Stratocumulus fields
Stratocumulus clouds can be organized into "fields" that take on certain specially classified shapes and characteristics. In general, these fields are more discernable from high altitudes than from ground level. They can often be found in the following forms:
Actinoform, which resembles a leaf or a spoked wheel. Closed cell, which is cloudy in the center and clear on the edges, alike to a filled honeycomb. Open cell, which resembles an empty honeycomb, with clouds around the edges and clear, open
space in the middle.

2.5.1.5 Cloud symbols used on weather office maps
2.5.1.5.1 Selection of symbols
Weather maps plotted and analyzed at weather forecasting centers employ special symbols to denote various cloud families, genera, species, varieties, mutations, and cloud movements that are considered important to identify conditions in the troposphere that will assist in preparing the forecasts. The cloud symbols are translated from numerical codes included with other meteorological data that make up the contents of international synoptic messages transmitted at regular intervals by professionally trained staff at major weather stations. In a couple of cases, an entire genus like cirrocumulus is represented by one cloud symbol, regardless of species, varieties, or any other considerations. In general though, the codes and their symbols are used to identify cloud types at the species level. A number of varieties and supplementary features are also deemed important enough to have their own weather map symbols. For the sake of economy, a particular genus, species, or variety may share a numerical reporting code and symbol with another alike cloud type. Sometimes, a separate symbol is used to indicate whether or not a particular genus has transformed or emerged from a mother cloud of another genus, or is increasing in amount or invading the sky (usually in the form of parallel bands in a radiatus configuration) ahead of an approaching weather disturbance.
2.5.1.5.2 International synoptic code
The international synoptic code (or SYNOP) provides for reporting the three basic altitude ranges for tropospheric clouds, but makes no special provision for multi-level clouds that can occupy more than one altitude range at a particular time. Consequently, cloud genera with significant vertical development are coded as low when they form in the low or lower-middle altitude range of the troposphere and achieve vertical extent by growing upward into the middle or high altitude range, as is the case with cumulus and cumulonimbus. Conversely, nimbostratus is coded as middle because it usually initially forms at mid-altitudes of the troposphere and becomes vertically developed by growing downward into the low altitude range. Because of the structure of the SYNOP code, a maximum of three cloud symbols can be plotted for each reporting station that appears on the weather map; one symbol each for a low (or upward growing vertical) cloud type, a middle (or downward growing vertical) type, and one for a high cloud type.
The symbol used on the map for each of these levels at a particular observation time will be for the genus, species, variety, mutation, or cloud motion that is considered most important according to criteria set out by the World Meteorological Organization (WMO). If these elements for any synoptic cloud level at the time of observation are deemed to be of equal importance, then the type which is predominant in amount is coded by the observer and plotted on the weather map. Although the SYNOP code has no separate formal classification for vertical or multi-level clouds, the observer procedure for selecting numerical codes is designed to give high reporting priority to those genera or species that show significant vertical development.
2.5.1.6 Clouds and weather forecasting
The identification and reporting of clouds contribute to the process of weather forecasting. Satellite pictures used in conjunction with the cloud symbols plotted on weather maps provide the forecaster with important information about conditions within the troposphere and the weather systems that form as a result.
2.5.1.6.1 Warm front or low-pressure area
The presence of significant high cirrus or cirrostratus cloud cover indicates an organized low-pressure disturbance or an associated warm front is about 300 km away from the point of observation. Clouds associated with warm fronts tend to be mostly stratiform in structure at all altitude levels. However, if cirrocumulus also appears, there is greater airmass instability arriving with the front which increases the risk that thunderstorms may accompany the system. When these high clouds progressively invade the sky and the barometric pressure begins to fall, precipitation associated with the disturbance is likely about 24 to 36 hours away. A thickening and lowering of cirrostratus into mid-level altostratus is a good sign the warm front or low has moved closer and precipitation may begin within 24 hours. A further thickening of the altostratus is often accompanied by virga and the arrival of precipitation is imminent. The cloud layer achieves significant vertical extent as it lowers and changes into nimbostratus. Rain or snow begins to reach surface level at the beginning of a precipitation event that can last up to 36 hours depending and the size of the weather system and its speed of movement. As the low and the warm front pass, the nimbostratus thins out into low stratus and the precipitation tapers off.
2.5.1.6.2 Cold front
A cold front tends to give less warning of its approach because it usually moves faster than a warm front and has a narrower band of clouds and weather. If the cold front is active enough to produce thunderstorms, anvil cirrus clouds may spread ahead of the front as a warning of its approach. The other cloud types associated with a cold front depend on atmospheric conditions such as air mass stability and wind shear, but are mostly cumuliform or stratocumuliform, with mid-level altocumulus giving way to lower stratocumulus and intermittent light precipitation if there is only slight airmass instability. With significant instability, vertically developed cumulus or cumulonimbus with showers and thunderstorms will form along the front.
2.5.1.6.3 High-pressure area
After the passage of the front, the sky usually clears as high pressure builds in behind the system, although significant amounts of cumulus or stratocumulus, often in the form of long bands called cloud streets may persist if the air mass behind the front remains humid. Small and unchanging amounts of cumulus or cirrus clouds in an otherwise clear sky are usually indications of continuing fair weather as long as the barometric pressure remains comparatively high.
2.5.1.7 Rainmaking bacteria
There is evidence that clouds, especially in the weather-making troposphere, contain biological ice nuclei that may play a key role in the formation of precipitation. Bioprecipitation, the concept of rain-making bacteria, was proposed by David Sands from Bozeman Campus, Montana State University, USA. Such microbes – called ice nucleators – are found in rain, snow, and hail throughout the world. These bacteria may be part of a constant feedback between terrestrial ecosystems and tropospheric clouds and may even have evolved the ability to promote rainstorms as a means of dispersal. They may rely on the rainfall to spread to new habitats, much as some plants rely on windblown pollen grains.
2.5.1.8 Summary of families, genera, species, varieties, supplementary features, mother clouds, and associated weather
2.5.1.8.1 High cirriform, stratocumuliform, and stratiform
Genus cirrus (Ci):

These are mostly fibrous wisps of delicate white cirriform ice crystal cloud that show up clearly against the blue sky. Cirrus are generally non-convective except castellanus and floccus species which show limited convection. They often form along a high altitude jetstream and at the very leading edge of a frontal or low-pressure disturbance where they may merge into cirrostratus.
Species: This genus is divided into five species which are grouped to form the basis of reporting cirrus in the SYNOP code. Cirrus fibratus (Ci fib) consists of thin fibrous streaks with no tufts or hooks. Cirrus uncinus (Ci unc) is alike except that the filaments are hooked at the ends. Both species are coded CH1. Cirrus spissatus (Ci spi) consists of patchy dense high cloud. The castellanus species (Ci cas) has convective buildups that give the cloud a partly or mainly turreted appearance, especially when viewed from the side. Cirrus with a tufted appearance is designated cirrus floccus (Ci flo). All three of these dense cirrus species are coded CH2.
Varieties: Certain cirrus species can sometimes be divided into pattern-based varieties. The filaments of cirrus fibratus intortus are twisted into irregular patterns. Cirrus fibratus vertebratus sees the filaments arranged in a pattern that resembles the backbone of a fish. Another pattern-based variety can be found with fibratus and uncinus species. Cirrus radiatus consists of parallel bands that appear to converge at the horizon. This pattern is often seen when the high cloud is invading the sky or increasing in amount. It is then reported on the SYNOP observation code as CH4, or as CH5 or 6 (depending on how much of the sky is covered) if accompanied by cirrostratus. Cirrus duplicatus is observable when the fibratus or uncinus filaments are arranged in closely spaced layers, one above the other. Pattern-based varieties are not commonly associated with the species spissatus, castellanus, or floccus. Opacity-based varieties are not associated with cirrus of any types because the wispy or fibrous species are always translucent while the more dense species are inherently opaque.
Precipitation-based supplementary features: These are not associated with cirrus clouds because they do not produce any precipitation.
Accessory cloud: Mamma is cloud-based supplementary feature that can be seen with cirrus spissatus cumulonimbogenitus (CH3). It appears as bubble-like downward protuberances from the cloud base and is caused by localized downdrafts in the cloud.
Genitus mother clouds: Apart from the aforementioned cumulonimbus mother cloud, cirrus fibratus cirrocumulogenitus or altocumulogenitus can form when cirrocumulus or very high altocumulus mother clouds lose some of their stratocumuliform structure and take on a more wispy or fibrous appearance.
Mutatus mother cloud: Cirrus fibratus cirrostratomutatus forms from a cirrostratus mother cloud when mostly continuous sheets of high cloud break up into more detached wispy or fibrous streaks.
Genus cirrocumulus (Cc):
This is a pure white stratocumuliform layer of limited convection. It is composed of ice crystals or supercooled water droplets appearing as small unshaded round masses or flakes in groups or lines with ripples like sand on a beach. Cc occasionally form alongside cirrus or cirrostratus clouds at the very leading edge of an active weather system. It is coded CH9 for all species.
Species: Cirrocumulus stratiformis (Cc str) is one of four species and appears in the form of relatively flat stratocumuliform sheets or patches. The species lenticularis (Cc len)

takes its name from the lens-shaped structure of this cloud which is tapered at each end. Cirrocumulus castellanus (Cc cas) has cumuliform buildups that give the cloud a partly or mainly turreted appearance. When the cumuliform parts have more of a tufted appearance, it is given the species name floccus (Cc flo)
Varieties: This genus type is always translucent and so has no opacity-based varieties. However, like cirrus, certain cirrocumulus species can sometimes be divided into pattern-based varieties. The undulatus variety has a wavy undulating base and is seen mostly with the stratiformis and lenticularis species types. The lacunosus variety contains circular holes caused by downdrafts in the cloud and is associated mainly with the species stratiformis, castellanus and floccus.
Precipitation-based supplementary feature: Cirrocumlus occasionally produces virga, precipitation that evaporates before reaching the ground..
Accessory cloud: Mamma in the form of downward forming bubbles is infrequently seen as a cloud-based supplementary feature.
Mother clouds: This genus type has no recognized genitus mother clouds. However cirrocumulus stratiformis cirromutatus or cirrostratomutatus can result from sheets or filaments of high cloud taking on a stratocumuliform structure as a result of high altitude convection. A high layer of white or light grey altocumulus of a particular species can thin out into pure white cirrocumulus altocumulomutatus of the same species.
Genus cirrostratus (Cs):
Cirrostratus is a thin non-convective stratiform ice crystal veil that typically gives rise to halos caused by refraction of the sun's rays. The sun and moon are visible in clear outline. Cirrostratus typically thickens into altostratus ahead of a warm front or low-pressure area.
Species: Cirrostratus fibratus (Cs fib) is a high fibrous sheet alike to cirrus but with less detached semi-merged filaments. It is reported in the SYNOP code as CH8 or as CH5 or 6 (depending on the amount of sky covered) if increasing in amount. If the high cloud covers the entire sky and takes on the form of a featureless veil, it is classified as cirrostratus of the species nebulosus (Cs neb) and is coded CH7.
Varieties: Cirrostratus species have no opacity-based varieties as they are always translucent. Two pattern-based varieties are sometimes seen with the species fibratus. These are the closely spaced duplicatus and wavy undulatus types alike to those seen with cirrus fibratus. Pattern-based varieties are not commonly associated with the species nebulosus due to its lack of features.
Supplementary features: Cirrostratus produces no precipitation or virga, and is not accompanied by any accessory clouds.
Genitus mother clouds: Cirrostratus fibratus cirrocumulogenitus sometimes appears as the latter cloud flattens and loses some of its stratocumuliform structure. Cirrostratus fibratus cumulonimbogenitus may form if the cirriform top of a mature thundercloud spreads and flattens sufficiently to become a high stratiform cloud.
Mutatus mother clouds: Cirrostratus fibratus cirromutatus or cirrocumulomutatus are the result of a complete transformation from cirrus and cirrocumulus genus types. Cirrostratus nebulosis altostratomutatus results when a high grey nebulous altostratus layer thins out into a whitish layer of featureless high cloud.

2.5.1.8.2 Middle stratocumuliform and stratiform
Genus altocumulus (Ac):
This is a stratocumuliform cloud layer of limited convection that is usually appears in the form of irregular patches or rounded masses in groups, lines, or waves. High altocumulus may resemble cirrocumulus but is usually thicker and composed of water droplets so that the bases show at least some light-grey shading. Opaque altocumulus associated with a weak frontal or low-pressure disturbance can produce virga, very light intermittent precipitation that evaporates before reaching the ground. If the altocumulus is mixed with moisture-laden altostratus, the precipitation may reach the ground.
Species: Altocumulus has the same four species as cirrocumulus. The stratiformis species (Ac str) is composed of sheets or relatively flat patches of stratocumuliform cloud. The synoptic coding is determined by the predominant variety or occasionally by the genitus mother cloud. Altocumulus lenticularis (Ac len) is a lens-shaped middle cloud alike to its cirrocumulus counterpart but usually with at least some grey shading. It is coded CM4 on the SYNOP weather observation. Grey shading is also seen with altocumulus castellanus (Ac cas), a turreted middle cloud that signals increasing airmass instability. It is coded CM8. The floccus species (Ac flo) is a tufted middle cloud which is also associated with greater instability. It shares the same code CM8. Chaotic altocumulus, often poorly defined with multiple species or transitional forms arranged in several layers, is coded CM9.
Opacity-based varieties: Altocumulus stratiformis has three opacity-based varieties; Translucidus (CM3), perlucidus (CM3 or 7 depending on predominant opacity), and opacus (CM7). Varieties based on opacity are not commonly associatied with the species lenticularis, castellanus, or floccus.
Pattern-based varieties: Radiatus (arranged in parallel bands) is sometimes seen with the stratformis and castellanus species. Altocumulus stratiformis radiatus of any opacity is coded CM5 if it is increasing in amount. The duplicatus or undulatus varieties are occasionally seen with the stratiformis and lenticularis species. Altocumulus stratiformis duplicatus is coded CM7 if it is not overridden by another coding of higher importance. Lacunosus is very occasionally associated with altocumulus of the species stratiformis, castellanus, or floccus.
Supplementary feature: Altocumulus often produces virga but usually not the precipitatio feature that reaches the ground.
Accessory cloud: Mamma caused by localized downdrafts in the cloud layer are occasionally seen with altocumulus.
Genitus Mother clouds: Altocumulus stratiformis cumulogenitus or cumulonimbogenitus can form when the middle or upper part of a towering free convective cloud begins to spread horizontally due to a loss of convective lift. It is coded CM6.
Mutatus mother clouds: Altocumulus can form due to the complete transformation of cirrocumulus, altostratus, nimbostratus, or stratocumulus.
Genus altostratus (As):
Altostratus is a mid-level opaque or translucent stratiform or non-convective veil of grey/blue-grey cloud that often forms along warm fronts and around low-pressure areas where it may
thicken into nimbostratus. Altostratus is usually composed of water droplets but may be mixed with ice crystals at higher altitudes. Widespread opaque altostratus can produce light continuous or intermittent precipitation.
Species: Altostratus is not divided into species because it is always nebulous or featureless in structure.
Opacity-based varieties: Altocumulus translucidus is relatively thin so that the sun or moon is always visible as if seen through frosted glass. it is coded CM1 in the SYNOP report. The opacus variety is sufficiently thick to obscure the sun or moon and is coded CM2.
Pattern-based varieties: Radiatus, duplicatus, and undulatus are all occasionally associated with Altostratus.
Precipitation-based supplementary features: Altostratus opacus can be thick enough to produce both virga or praecipitatio features.
Accessory clouds: Pannus forming in precipitation is the most common cloud-based supplementary feature and is coded CL7. Mamma may be occasionally seen with altostratus, especially if it is associated with or changing to or from altocumulus.
Genitus mother clouds: Altostratus altocumulogenitus forms due to the fusing of altocumulus elements. Altostratus cumulonimbogenitus results from the spreading of the middle part of a cumulonimbus cloud.
Mutatus mother clouds: Cirrostratus can thicken into altostratus cirrostratomutatus, usually ahead of an approaching disturbance. Nimbostratus associated with an organized weather system may lift and change into to altostratus nimbostratomutatus, especially if the distubance is weakening or moving out of a particular area.
2.5.1.8.3 Low stratocumuliform, stratiform, and cumuliform
Genus stratocumulus (Sc):
This genus type is a stratocumuliform cloud layer of limited convection, usually in the form of irregular patches or rounded masses alike to altocumulus but having larger elements with deeper-gray shading. Opaque stratocumulus associated with a weak frontal or low-pressure disturbance can produce very light intermittent precipitation. This cloud often forms under a precipitating deck of altostratus or high-based nimbostratus associated with a well-developed warm front, slow-moving cold front, or low-pressure area. This can create the illusion of continuous precipitation of more than very light intensity falling from stratocumulus. All species are coded CL5 except when formed from free convective mother clouds (CL4) or when formed separately from co-existing cumulus (CL8).
Species: Stratocumulus has three species which it shares in common with the other stratocumuliform genus types. The stratiformis species (Sc str) consists of sheets or relatively flat patches of low cloud alike if thicker in structure to the higher altocumulus and cirrocumulus types. Stratocumulus lenticularis (Sc len) and castellanus (Sc cas) also have alike structures to their Ac and Cc counterparts.
Opacity-based varieties: The translucidus, perlucidus, and opacus varieties are the same for stratocumulus stratiformis as for Ac stratiformis. Varieties based on opacity are not commonly associated with species lenticularis or castellanus.

Pattern-based varieties: Parallel bands of radiatus are occasionally seen with the stratiformis species. Duplicatus and undulatus varieties are sometimes associated with stratocumulus stratiformis and lenticularis. With increased airmass instability, lacunosus downdraft holes may appear in layers of stratocumulus stratiformis and castellanus.
Precipitation-based supplementary features: Virga or praecipitatio features of weak intensity may be seen with stratocumulus.
Accessory cloud: Mamma in the form of downward facing bubble-like protuberances may form as a result of localized downdrafts in the cloud layer.
Genitus mother clouds: Stratocumulus may form from the spreading of cumulus or cumulonimbus (CL4), or the partial transformation of altostratus or nimbostratus.
Mutatus mother clouds: This genus type may also result from the complete transformation of altocumulus, nimbostratus, or stratus.
Genus stratus (St):
This low cloud is a uniform layer of low non-convective cloud resembling fog but not resting on the ground. Only very weak precipitation can fall from this cloud (usually drizzle or snow grains), although heavier rain or snow may fall through a stratus layer from a higher precipitating cloud deck.
Species: There are two species of stratus. The nebulosus species (St neb) is a featureless veil of low cloud sometimes producing light drizzle that is coded CL6 in the SYNOP report. Stratus fractus (St fra) appears as a ragged broken up sheet that often forms as an accessory cloud in precipitation falling from a higher cloud deck. It is coded CL7 when associated with bad weather. This species may also result from a continuous sheet of stratus in clear air becoming broken up by the wind, in which case it is coded CL6, the same as for stratus nebulosis not associated with bad weather.
Opacity-based varieties: Stratus nebulosus can appear as translucidus or opacus depending on its thickness. The perlucidus variety is not usually associated with this species because of its relatively even structure.
Pattern-based variety: Stratus nebulosus usually shows no patterns. However a slightly disturbed gentle wind current can create a mild undulatus pattern, but this is rarely seen. Varieties of any kind are not commonly associated with stratus fractus because of the highly fragmented structure that identifies this species.
Precipitation-based supplementary feature: Stratus cloud is too low to produce virga, but the praecipitatio feature can bee seen in the form of drizzle or snow grains.
Accessory clouds: Stratus does not have any accessory clouds as such, but may form in precipitation as a cloud based supplementary feature associated with other precipitating clouds.
Genitus mother clouds: Stratus can form from the spreading or thinning of the base of clouds with significant vertical development, particularly nimbostratus, cumulus, or cumulonimbus.
Mutatus mother clouds: This genus type can form as the result of the fusing of stratocumulus elements into an even featureless sheet.
Genus cumulus (Cu) – little vertical extent:

These are small fair-weather cumuliform clouds of limited convection that do not grow vertically and generally do not produce rain showers.
Species: Cumulus species are mainly indicators of degrees of vertical development. The smallest type is cumulus fractus (Cu fra) which consists of cumulus broken up into ragged and changing fragments. Fair weather Cu fractus is coded CL1. It can also form in precipitation as a pannus accessory cloud which is coded CL7. Cumulus humilis (Cu hum) is the smallest non-ragged cloud and usually shows a light-grey shading underneath. Fair weather Cu humilis is also coded CL1 in the SYNOP code. Cumulus fractus and humilis are two species that cannot be explaind as vertical in the true sense of the word. Being at or near the beginning of the convective cloud's daily life cycle, they lack the moderate vertical extent of cumulus mediocris. Consequently they are commonly classified as low clouds despite the fact their bases can be in the middle height range when the moisture content of the air is very low. When cumulus fractus and cumulus humilis are classified as vertical, it is on the basis of their potential for at least moderate upward growth during their daily cycle.
Opacity-based varieties: Cumulus fractus is inherently translucent and the humilis species is generally opaque, so these do not have opacity- based varieties.
Pattern-based varieties: Radiatus is occasionally seen with fair-weather cumulus when arranged in parallel rows.
Supplementary features: These are not commonly seen with small cumulus, but Cu fractus of bad weather may be seen as a pannus feature with precipitating clouds.
Genitus mother clouds: Cumulus fractus or humilis may form as the result of a partial transformation of altocumulus or stratocumulus.
Mutatus mother clouds: These cumulus species may also appear due to a complete transformation of stratocumulus or stratus.
2.5.1.8.4 Vertical cumuliform, stratiform, and cumulonimbiform (low to middle cloud base)
Genus cumulus (Cu) – moderate vertical extent:
These cumuliform clouds of free convection generally have clear-cut flat bases and domed tops and are capable of producing showers.
Species Cumulus mediocris (Cu med): This species achieves moderate vertical development, has medium-grey shading underneath, and can produce scattered showers of light intensity. This larger species is coded CL2.
Varieties: Cumulus mediocris is always opaque and consequently has no opacity-based varieties. A single pattern-based variety, radiatus, is sometime seen when the individual clouds are arranged into parallel rows.
Precipitation-based supplementary features: Cumulus mediocris can produce virga and praecipitatio features.
Accessory clouds: The pannus supplementary feature is sometimes seen with precipitating Cu mediocris, however the CL7 reporting code normally used with this feature is overridden by the CL2 code that identifies cumulus with significant vertical
development. Pileus (cap cloud), velum (apron), arcus (roll or shelf cloud) and tuba (vertical column) features are also occasionally seen with cumulus mediocris.
Genitus mother clouds: Cumulus mediocris may form as a result of a partial transformation of altocumulus or stratocumulus.
Mutatus mother clouds: This genus and species type may also be the result of a complete transformation of stratocumulus or stratus.
Genus nimbostratus (Ns):
This is a very thick diffuse dark-grey non-convective stratiform layer that looks feebly illuminated from the inside. It normally forms from altostratus and achieves vertical extent when the base subsides into the low altitude range during precipitation that can reach moderate to heavy intensity. It is coded CM2 on the SYNOP report.
Species and varieties: Nimbostratus is very thick, opaque, and featureless, so this genus type is not subdivided into species or varieties.
Precipitation-based supplementary features: Nimbostratus is a major precipition cloud and produces the virga or praecipitatio features. The latter can achieve heavy intensity due to the cloud's vertical depth.
Accessory cloud: Pannus frequently forms in precipitation and is coded CL7. Genitus mother clouds: This genus type can form from cumulus and cumulonimbus. Mutatus mother clouds: Nimbostratus can form due to the complete transformation of
altocumulus, altostratus and stratocumulus.
ICAO towering vertical sub-group:
Genus cumulus (Cu) – great vertical extent:
Increasing airmass instability can cause free-convective cumulus to grow very tall to the extent that the vertical height from base to top is greater than the base-width of the cloud.
Species: Cumulus congestus (Cu Con) is the largest of the cumulus species and is designated separately as towering cumulus (Tcu) by the International Civil Aviation Organization : They grow upward to great vertical size, usually with dark-grey bases, and are capable of producing severe turbulence and showers of moderate to heavy intensity. It is coded CL2. The varieties, supplementary features, and mother clouds assiciated with Cu-congestus or towering-Cu are the same as for cumulus mediocris.
Non-WMO variant: Pyrocumulus (No official abbreviation) is a free convective cloud associated with volcanic eruptions and large-scale fires. Pyrocumulus is not recognized by the WMO as a distinct genus or species, but is, in essence, cumulus congestus formed under special circumstances that can also cause severe turbulence.
Genus cumulonimbus (Cb):
This genus type is a heavy towering cumulonimbiform mass of free convective cloud with a dark-grey to nearly black base that is associated with thunderstorms and showers. Thunderstorms can produce a range of severe weather that includes hail, tornadoes, a variety of other localized strong wind events, several types of lightning, and local very heavy downpours of rain that can cause

flash floods, although lightning is the only one of these that requires a thunderstorm to be taking place. In general, cumulonimbus require moisture, an unstable air mass, and a lifting force (heat) in order to form. Cumulonimbus typically go through three stages: the developing stage, the mature stage (where the main cloud may reach supercell status in favorable conditions), and the dissipation stage. The average thunderstorm has a 24 km (15 mi) diameter. Depending on the conditions present in the atmosphere, these three stages take an average of 30 minutes to go through.
Species: Cumulonimbus calvus (Cb cal) has a very high clear-cut domed top alike to towering cumulus and is coded CL3. The capillatus species (Cb cap) has very high tops that have become fibrous due to the presence of ice crystals. It is coded CL9 in the SYNOP report.
Varieties: Cumulonimbus is too large and opaque to show any opacity or pattern-based varieties.
Precipitation-based supplementary features: This is also a major precipitation cloud and can produce virga or praecipitatio features, of which the latter can reach heavy intensity.
Accessory clouds: The cloud-based supplementary features normally associated with cumulonimbus are pannus, incus (cirriform anvil top), mamma, pileus, velum, arcus, and tuba. As with precipitating cumulus, the CL7 coding for pannus is overridden by higher codes, in this case CL3 or 9 depending on the species of cumulonimbus. The tuba feature can develop into a funnel cloud, water spout, or tornado.
Genitus mother clouds: Cumulonimbus can develop from altocumulus, altostratus, nimbostratus, stratocumulus, and cumulus.
Mutatus mother cloud: This genus type can also result from the complete transformation of cumulus undergoing rapid vertical growth.
2.5.1.9 Polar stratospheric class
2.5.1.9.1 Formation and distribution
This class forms at altitudes of about 15,000–25,000 m (49,200–82,000 ft) during the winter when the stratosphere is coldest and has the best chance of triggering condensation caused by adiabatic cooling. It is typically very thin with an undulating cirriform appearance. Moisture is very scarce in the stratosphere, so cloud at this altitude range is rare and is usually restricted to polar regions where the air is coldest.
2.5.1.9.2 Classification
The formation of Polar stratospheric cloud is limited to a single very high range of altitude, so this class is not divided into height-related families. Polar stratospheric has a generally cirriform structure and appearance and does not have separate genus types, species, or varieties. Instead, the classification is alpha-numeric and is based on chemical makeup rather than variations in physical appearance.
2.5.1.9.3 Very high cirriform
Type 1 (Non-nacreous): This type contains supercooled nitric acid and water droplets and lacks any special coloration. It is dividable into subtype 1A which is mostly made up of ice crystals and

frozen nitric acid, and 1B which remains in a supercooled state and includes sulfuric acid and water in a ternary solution. Nacreous type 2 is sometimes associated or embedded.
Type 2 (Nacreous): Nacreous polar stratospheric cloud consists of ice crystals only and generally shows mother-of-pearl colors.
2.5.1.10 Polar mesospheric class
2.5.1.10.1 Formation and distribution
Polar mesospheric clouds are the highest in the atmosphere and occur mostly at altitudes of 80 to 85 km (50 to 53 mi), which is about ten times the altitude of tropospheric high clouds. From ground level, they can occasionally be seen illuminated by the sun during deep twilight. Ongoing research indicates that convective lift in the mesophere is strong enough during the polar summer to cause adiabatic cooling of small amount of water vapour to the point of saturation. This tends to produce the coldest temperatures in the entire atmosphere just below the mesopause. These conditions result in the best environment for the formation of polar mesospheric clouds. There is also evidence that smoke particles from burnt-up meteors provide much of the condensation nuclei required for the formation of noctilucent cloud.
Because of the need for maximum cooling of the water vapor to produce these clouds, their distribution tends to be restricted to polar regions of Earth during the respective summer seasons in the northern and southern hemispheres. Sightings are rare more than 40 degrees south of the north pole or north of the south pole.
2.5.1.10.2 Classification
Polar mesospheric clouds all tend to form at an extreme altitude range and are consequently not classified into height-related families. They are given the Latin name Noctilucent because of their illumination well after sunset and before sunrise. An alpha-numeric classification is used to identify variations in physical appearance.
2.5.1.10.3 Noctilucent (extremely high cirriform)
Type 1: The first type is characterized by very tenuous filaments resembling cirrus fibratus.
Type 2: This type comprises bands in the form of long streaks, often in groups or interwoven at small angles, alike to cirrus intortus. It is dividable into two subtypes; 2A where the streaks have diffuse, blurred edges, and 2B where they have sharply defined edges.
Type 3: Billows in the form of short streaks can be seen that are clearly spaced and roughly parallel. Subtype 3A has short, straight, narrow streaks while 3B has wave-like streaks alike to cirrus undulatus.
Type 4: This shows whirls in the form of partial or rarely complete rings with dark centers. With subtype 4A, the whirls are of small angular radius and have a alike appearance to surface water ripples. 4B is characterized by simple curves of medium angular radius with one or more bands. Subtype 4C has whirls with large-scale ring structure.

2.5.1.11 Throughout the homosphere
2.5.1.11.1 Coloration
Striking cloud colorations can be seen at many altitudes in the homosphere, which includes the troposphere, stratosphere, and mesophere. The first recorded colored cloud was seen by Nathan Ingleton in 1651, he wrote the event in his diary but the records were destroyed in 1666, in the Great Fire of London. The color of a cloud, as seen from Earth, tells much about what is going on inside the cloud.
In the troposphere, dense, deep clouds exhibit a high reflectance (70% to 95%) throughout the visible spectrum. Tiny particles of water are densely packed and sunlight cannot penetrate far into the cloud before it is reflected out, giving a cloud its characteristic white color, especially when viewed from the top. Cloud droplets tend to scatter light efficiently, so that the intensity of the solar radiation decreases with depth into the gases. As a result, the cloud base can vary from a very light to very-dark-grey depending on the cloud's thickness and how much light is being reflected or transmitted back to the observer. Thin clouds may look white or appear to have acquired the color of their environment or background. High tropospheric clouds appear mostly white if composed entirely of ice crystals or supercooled water droplets.
As a tropospheric cloud matures, the dense water droplets may combine to produce larger droplets. If the droplets become too large and heavy to be kept aloft by the air circulation, they will fall from the cloud as rain. By this process of accumulation, the space between droplets becomes increasingly larger, permitting light to penetrate farther into the cloud. If the cloud is sufficiently large and the droplets within are spaced far enough apart, a percentage of the light that enters the cloud is not reflected back out but is absorbed giving the cloud a darker look. A simple example of this is one's being able to see farther in heavy rain than in heavy fog. This process of reflection/absorption is what causes the range of cloud color from white to black.
Other colors occur naturally in tropospheric clouds. Bluish-grey is the result of light scattering within the cloud. In the visible spectrum, blue and green are at the short end of light's visible wavelengths, whereas red and yellow are at the long end. The short rays are more easily scattered by water droplets, and the long rays are more likely to be absorbed. The bluish color is evidence that such scattering is being produced by rain-size droplets in the cloud. A cumulonimbus cloud that appears to have a greenish/bluish tint is a sign that it contains extremely high amounts of water; hail or rain. Supercell type storms are more likely to be characterized by this but any storm can appear this way. Coloration such as this does not directly indicate that it is a severe thunderstorm, it only confirms its potential. Since a green/blue tint signifies copious amounts of water, a strong updraft to support it, high winds from the storm raining out, and wet hail; all elements that improve the chance for it to become severe, can all be inferred from this. In addition, the stronger the updraft is, the more likely the storm is to undergo tornadogenesis and to produce large hail and high winds. Yellowish clouds may occur in the late spring through early fall months during forest fire season. The yellow color is due to the presence of pollutants in the smoke. Yellowish clouds caused by the presence of nitrogen dioxide are sometimes seen in urban areas with high air pollution levels.
Within the troposphere, red, orange, and pink clouds occur almost entirely at sunrise/sunset and are the result of the scattering of sunlight by the atmosphere. When the angle between the sun and the horizon is less than 10 percent, as it is just after sunrise or just prior to sunset, sunlight becomes too red due to refraction for any colors other than those with a reddish hue to be seen. The clouds do not become that color; they are reflecting long and unscattered rays of sunlight, which are predominant at those hours. The effect is much like if one were to shine a red spotlight on a white sheet. In combination with large, mature

thunderheads, this can produce blood-red clouds. Clouds look darker in the near-infrared because water absorbs solar radiation at those wavelengths.
In high latitude regions of the stratosphere, nacreous clouds occasionally found there during the polar winter tend to display quite striking displays of mother-of-pearl colorations. This is due to the refraction and diffusion of the sun's rays through thin clouds with supercooled droplets that often contain compounds other than water. At still higher altitudes up in the mesospere, noctilucent clouds made of ice crystals are sometimes seen in polar regions in the summer. They typically have a silvery white coloration that can resemble brightly illuminated cirrus.
2.5.1.12 Effects on climate
The role of tropospheric clouds in regulating weather and climate remains a leading source of uncertainty in projections of global warming. This uncertainty arises because of the delicate balance of processes related to clouds, spanning scales from millimeters to planetary. Hence, interactions between the large-scale (synoptic meteorology) and clouds becomes difficult to represent in global models. The complexity and diversity of clouds, as outlined above, adds to the problem. On the one hand, white-colored cloud tops promote cooling of Earth's surface by reflecting short-wave radiation from the sun. Most of the sunlight that reaches the ground is absorbed, warming the surface, which emits radiation upward at longer, infrared, wavelengths. At these wavelengths, however, water in the clouds acts as an efficient absorber. The water reacts by radiating, also in the infrared, both upward and downward, and the downward radiation results in a net warming at the surface. This is analogous to the greenhouse effect of greenhouse gases and water vapor.
High tropospheric clouds, such as cirrus, particularly show this duality with both short-wave albedo cooling and long-wave greenhouse warming effects. On the whole though, clouds in the upper troposphere tend to favor net warming. The short-wave effect is dominant with middle and low clouds like altocumulus and stratocumulus, which results in a net cooling with almost no long-wave effect. As a consequence, much research has focused on the response of low clouds to a changing climate. Leading global models can produce quite different results, however, with some showing increasing low-level clouds and others showing decreases.
Polar stratospheric and mesospheric clouds are not common or widespread enough to have a significant effect on climate. However an increasing frequency of occurrence of noctilucent clouds since the 19th century may be the result of climate change.
2.5.1.13 Global brightening
New research indicates a global brightening trend. The details are not fully understood, but much of the global dimming (and subsequent reversal) is thought to be a consequence of changes in aerosol loading in the atmosphere, especially sulfur-based aerosol associated with biomass burning and urban pollution. Changes in aerosol burden can have indirect effects on clouds by changing the droplet size distribution or the lifetime and precipitation characteristics of clouds.
2.5.1.14 Extraterrestrial
Cloud cover has been seen on most other planets in the solar system. Venus's thick clouds are composed of sulfur dioxide and appear to be entirely layered without embedded cumuliform types. On Mars, cirrus, cirrocumulus and stratocumulus composed of water-ice have been detected mostly near the poles.
Both Jupiter and Saturn have an outer cirriform cloud deck composed of ammonia, an intermediate deck of ammonium hydrosulfide, and an inner deck of cumulus water clouds. Embedded cumulonimbus are known to exist near the Great Red Spot on Jupiter. The same two category-types can be found covering Uranus, and Neptune, but are all composed of Methane. Saturn's moon Titan has cirrus clouds believed to be composed largely of methane. The Cassini–Huygens Saturn mission uncovered evidence of a fluid cycle on Titan, including lakes near the poles and fluvial channels on the surface of the moon.
2.5.2 Rainfall Types
In meteorology, rainfall types can include the character or phase of the precipitation which is falling to ground level. There are three distinct ways that rain can occur. These methods include orographic rainfall. Convective precipitation is generally more intense, and of shorter duration, than stratiform precipitation. Precipitation can also fall in two phases, either liquid or solid. Liquid forms of precipitation include rain and drizzle. Rain or drizzle which freezes on contact within a subfreezing air mass gains the preceding word of freezing, becoming known as freezing rain or freezing drizzle. Frozen forms of precipitation include snow, ice needles, sleet, hail, and graupel. Intensity is determined either by rate of fall, or by visibility restriction.
2.5.2.1Phases
Precipitation falls in various forms, or phases. They can be subdivided into:
Liquid precipitation: o Drizzle (DZ) o Rain (RA)
Freezing precipitation: o Freezing drizzle (FZDZ) o Freezing rain (FZRA)
Frozen precipitation: o Snow (SN) o Snow grains (SG) o Ice pellets/Sleet (PL) o Hail (GR) o Snow pellets/Graupel (GS) o Ice crystals (IC).
The capital from letters A to Z in the parentheses are the METAR codes for each phenomenon.
2.5.2.2 Mechanisms
Precipitation occurs when air is saturated; this occurs when air rises; which in turn usually occurs in one of three ways.
Convective precipitation occurs when air rises vertically through the (temporarily) self-sustaining mechanism of convection. Stratiform precipitation occurs when large masses over air rise slant-wise as

larger-scale atmospheric dynamics force them to move over each other. Orographic precipitation is alike, except the upwards motion is forced when a moving airmass encounters a rising slope.
2.5.2.3 Convection
Convection occurs when the Earth's surface, mainly in the equatorial region, within a conditionally unstable, or moist atmosphere, becomes heated more than its surroundings, leading to significant evaporation. Convective rain, or showery precipitation, occurs from convective clouds, e.g., cumulonimbus or cumulus congestus. It falls as showers with rapidly changing intensity. Convective precipitation falls over a certain area for a relatively short time, as convective clouds have limited horizontal extent. Most precipitation in the tropics appears to be convective; however, it has been suggested that stratiform precipitation thunderstorms. Graupel and hail indicate convection. In mid-latitudes, convective precipitation is associated with cold fronts (often behind the front), squall lines, and warm fronts in very moist air.
2.5.2.4 Stratiform
Stratiform rainfall is also caused by frontal systems surrounding extratropical cyclones or lows, which form when warm and often tropical air meets cooler air. Stratiform precipitation falls out of nimbostratus clouds. When masses of air with different density (moisture and temperature characteristics) meet, warmer air overrides colder air. The warmer air is forced to rise and if conditions are right becomes saturated, causing precipitation. In turn, precipitation can enhance the temperature and moisture contrast along a frontal boundary. Fronts cause sudden changes in general temperature, and in the humidity and pressure in the air. Warm fronts occur where the warm air scours out a previously lodged cold air mass. The warm air 'overrides' the cooler air and moves upward. Warm fronts are followed by extended phases of light rain and drizzle, because, after the warm air rises above the cooler air (which sinks to the ground), it gradually cools due to the air's expansion while being lifted, which forms clouds and leads to precipitation. Cold fronts occur when a mass of cooler air dislodges a mass of warm air. This type of transition is sharper, since cold air is more dense than warm air. The rain duration is less, and generally more intense, than that which occurs ahead of warm fronts. A wide variety of weather can be found along an occluded front, with thunderstorms possible, but usually their passage is associated with a drying of the air mass.
2.5.2.4 Orographic
Orographic or relief rainfall is caused when masses of air pushed by wind are forced up the side of elevated land formations, such as large mountains. The lift of the air up the side of the mountain results in adiabatic cooling, and ultimately condensation and precipitation. In mountainous parts of the world subjected to relatively consistent winds (for example, the trade winds), a more moist climate usually prevails on the windward side of a mountain than on the leeward (downwind) side. Moisture is removed by orographic lift, leaving drier air on the descending (generally warming), leeward side where a rain shadow is observed.
In Hawaii, Mount Waiʻaleʻale (Wai a̒le a̒le), on the island of Kauai, is notable for its extreme rainfall, as it has the highest average annual rainfall on Earth, with 460 inches (12,000 mm). Storm systems affect the state with heavy rains between October and March. Local climates vary considerably on each island due to their topography, divisible into windward (Ko o̒lau) and leeward (Kona) regions based upon location relative to the higher mountains. Windward sides face the east to northeast trade
winds and receive much more rainfall; leeward sides are drier and sunnier, with less rain and less cloud cover.
In South America, the Andes mountain range blocks Pacific moisture that arrives in that continent, resulting in a desertlike climate just downwind across western Argentina. The Sierra Nevada range creates the same effect in North America forming the Great Basin desert, Mojave Desert and Sonoran Desert.
2.5.2.5 Intensity
Precipitation is measured using a rain gauge. When classified according to the rate of precipitation, rain can be divided into categories. Very light rain explains rainfall with a precipitation rate of less than 0.25 millimetres (0.0098 in) per hour. Light rain explains rainfall which falls at a rate of between 0.25 millimetres (0.0098 in) and 1 millimetre (0.039 in) per hour. Moderate rain explains rainfall with a precipitation rate of between 1 millimetre (0.039 in) and 4 millimetres (0.16 in) per hour. Heavy rain explains rainfall with a precipitation rate of between 4 millimetres (0.16 in) and 16 millimetres (0.63 in) per hour. Very heavy rain terminology can be used when the precipitation rate is between 16 millimetres (0.63 in) and 50 millimetres (2.0 in) per hour. Extreme rain can explain rainfall with precipitation rates exceeding 50 millimetres (2.0 in) per hour.
Snowfall's intensity is determined by visibility. When the visibility is over 1 kilometre (0.62 mi), snow is determined to be light. Moderate snow explains snowfall with visibility restrictions between .5 kilometres (0.31 mi) and 1 kilometre (0.62 mi). Heavy snowfall explains conditions when visibility is restricted below .5 kilometres (0.31 mi).
2.6 Cyclones and Anti-Cyclones
2.6.1 Cyclones
In meteorology, a cyclone is an area of closed, circular fluid motion rotating in the same direction as the Earth. This is usually characterized by inward spiraling winds that rotate anti-clockwise in the Northern Hemisphere and clockwise in the Southern Hemisphere of the Earth. Most large-scale cyclonic circulations are centered on areas of low atmospheric pressure. The largest low-pressure systems are cold-core polar cyclones and extratropical cyclones which lie on the synoptic scale. According to the NHC glossary, warm-core cyclones such as tropical cyclones and subtropical cyclones also lie within the synoptic scale. Mesocyclones, tornadoes and dust devils lie within the smaller mesoscale. Upper level cyclones can exist without the presence of a surface low, and can pinch off from the base of the Tropical Upper Tropospheric Trough during the summer months in the Northern Hemisphere. Cyclones have also been seen on extraterrestrial planets, such as Mars and Neptune. Cyclogenesis explains the process of cyclone formation and intensification. Extratropical cyclones form as waves in large regions of enhanced mid-latitude temperature contrasts called baroclinic zones. These zones contract to form weather fronts as the cyclonic circulation closes and intensifies. Later in their life cycle, cyclones occlude as cold core systems. A cyclone's track is guided over the course of its 2 to 6 day life cycle by the steering flow of the cancer or subtropical jet stream.
Weather fronts separate two masses of air of different densities and are associated with the most prominent meteorological phenomena. Air masses separated by a front may differ in temperature or humidity. Strong cold fronts typically feature narrow bands of thunderstorms and severe weather, and may on occasion be preceded by squall lines or dry lines. They form west of the circulation center and generally move from west to east. Warm fronts form east of the cyclone center and are usually preceded
by stratiform precipitation and fog. They move poleward ahead of the cyclone path. Occluded fronts form late in the cyclone life cycle near the center of the cyclone and often wrap around the storm center.
Tropical cyclogenesis explains the process of development of tropical cyclones. Tropical cyclones form due to latent heat driven by significant thunderstorm activity, and are warm core. Cyclones can transition between extratropical, subtropical, and tropical phases under the right conditions. Mesocyclones form as warm core cyclones over land, and can lead to tornado formation. Waterspouts can also form from mesocyclones, but more often develop from environments of high instability and low vertical wind shear. In the Atlantic basin, a tropical cyclone is generally referred to as a hurricane (from the name of the ancient Central American deity of wind, Huracan), a cyclone in the Indian Ocean and parts of the Pacific, and a typhoon in the Northwest Pacific region.
2.6.1.1 Structure
There are a number of structural characteristics common to all cyclones. A cyclone is a low pressure area. A cyclone's center (often known in a mature tropical cyclone as the eye), is the area of lowest atmospheric pressure in the region. Near the center, the pressure gradient force (from the pressure in the center of the cyclone compared to the pressure outside the cyclone) and the force from the Coriolis effect must be in an approximate balance, or the cyclone would collapse on itself as a result of the difference in pressure.
Because of the Coriolis effect, the wind flow around a large cyclone is counterclockwise in the Northern Hemisphere and clockwise in the Southern Hemisphere. Cyclonic circulation is sometimes referred to as contra solem. In the Northern Hemisphere, the fastest winds relative to the surface of the Earth consequently occur on the eastern side of a northward-moving cyclone and on the northern side of a westward-moving one; the opposite occurs in the Southern Hemisphere. (The wind flow around an anticyclone, on the other hand, is clockwise in the northern hemisphere, and counterclockwise in the southern hemisphere.)
2.6.1.2 Formation
Cyclogenesis is the development or strengthening of cyclonic circulation in the atmosphere (a low pressure area). Cyclogenesis is an umbrella term for several different processes, all of which result in the development of some sort of cyclone. It can occur at various scales, from the microscale to the synoptic scale.
Extratropical cyclones form as waves along weather fronts before occluding later in their life cycle as cold core cyclones.
Tropical cyclones form due to latent heat driven by significant thunderstorm activity, and are warm core.
Mesocyclones form as warm core cyclones over land, and can lead to tornado formation. Waterspouts can also form from mesocyclones, but more often develop from environments of high instability and low vertical wind shear. Cyclogenesis is the opposite of cyclolysis, and has an anticyclonic (high pressure system) equivalent which deals with the formation of high pressure areas—Anticyclogenesis.
The surface low has a variety of ways of forming. Topography can force a surface low when dense low-level high pressure system ridges in east of a north-south mountain barrier. Mesoscale convective systems can spawn surface lows which are initially warm core. The disturbance can grow into a wave-like formation along the front and the low will be positioned at the crest. Around the low, flow will become

cyclonic, by definition. This rotational flow will push polar air equatorward west of the low via its trailing cold front, and warmer air with push poleward low via the warm front. Usually the cold front will move at a quicker pace than the warm front and ―catch up‖ with it due to the slow erosion of higher density airmass located out ahead of the cyclone and the higher density airmass sweeping in behind the cyclone, usually resulting in a narrowing warm sector. At this point an occluded front forms where the warm air mass is pushed upwards into a trough of warm air aloft, which is also known as a trowal.
Tropical cyclogenesis is the technical term describing the development and strengthening of a tropical cyclone in the atmosphere. The mechanisms through which tropical cyclogenesis occurs are distinctly different from those through which mid-latitude cyclogenesis occurs. Tropical cyclogenesis involves the development of a warm-core cyclone, due to significant convection in a favorable atmospheric environment. There are six main requirements for tropical cyclogenesis: sufficiently warm sea surface temperatures, atmospheric instability, high humidity in the lower to middle levels of the troposphere, enough Coriolis force to develop a low pressure center, a preexisting low level focus or disturbance, and low vertical wind shear. An average of 86 tropical cyclones of tropical storm intensity form annually worldwide, with 47 reaching hurricane/typhoon strength, and 20 becoming intense tropical cyclones (at least Category 3 intensity on the Saffir–Simpson Hurricane Scale).
2.6.2 Anti-Cyclones
An anticyclone is a region of high atmospheric pressure relative to the surrounding air, generally thousands of kilometres in diameter and also known as a high or high-pressure system. Anticyclones appear on weather charts as a series of concentric, widely spaced isobars of 1000 mbs and above. The roughly circular closed isobar at its central region indicates the area of highest pressure.
The centre of an anticyclone has a characteristic pattern of air circulation, with subsiding air and horizontal divergence of the air near the surface. The name anticyclone comes from the circulatory flow of air within the system; anticyclonic circulation has a local circulation that is opposed to the Earth's rotation. Winds, generally light, circulate around the high pressure centre in a clockwise direction in the Northern Hemisphere and anticlockwise in the Southern Hemisphere.
The subsiding air compresses as it descends, causing adiabatic warming. The eventually warmer and drier air suppresses cloud formation and thus anticyclones are usually associated with fine weather in the summer and dry, cold, and sometimes foggy weather in the winter. Calm settled weather is usually synonymous with anticyclones in temperate latitudes. Anticyclones are typically relatively slow moving features.
However, mid-latitude anticyclones can be divided into warm and cold anticyclones (continental highs). Subtropical anticyclones are usually warm and quasi permanent features of the Earth's general circulation (e.g. the Azores high). In mid-latitudes anticyclones are often located beneath the leading edge of ridges in the upper-air westerlies, where they may be associated with blocking weather patterns.
2.7 Major Climatic Types
Köppen climate classification, widely used, vegetation-based empirical climate classification system developed by German botanist-climatologist Wladimir Köppen. His aim was to devise formulas that would define climatic boundaries in such a way as to correspond to those of the vegetation zones (biomes) that were being mapped for the first time during his lifetime. Köppen published his first scheme in 1900 and a revised version in 1918. He continued to revise his system of classification until his death
in 1940. Other climatologists have modified portions of Köppen’s procedure on the basis of their experience in various parts of the world.
Köppen’s classification is based on a subdivision of terrestrial climates into five major types, which are represented by the capital letters A, B, C, D, and E. Each of these climate types except for B is defined by temperature criteria. Type B designates climates in which the controlling factor on vegetation is dryness (rather than coldness). Aridity is not a matter of precipitation alone but is defined by the relationship between the precipitation input to the soil in which the plants grow and the evaporative losses. Since evaporation is difficult to evaluate and is not a conventional measurement at meteorological stations, Köppen was forced to substitute a formula that identifies aridity in terms of a temperature-precipitation index (that is, evaporation is assumed to be controlled by temperature). Dry climates are divided into arid (BW) and semiarid (BS) subtypes, and each may be differentiated further by adding a third code, h for warm and k for cold.
As noted above, temperature defines the other four major climate types. These are subdivided, with additional letters again used to designate the various subtypes. Type A climates (the warmest) are differentiated on the basis of the seasonality of precipitation: Af (no dry season), Am (short dry season), or Aw (winter dry season). Type E climates (the coldest) are conventionally separated into tundra (ET) and snow/ice climates (EF). The mid-latitude C and D climates are given a second letter, f (no dry season), w (winter dry), or s (summer dry), and a third symbol (a, b, c, or d [the last subclass exists only for D climates]), indicating the warmth of the summer or the coldness of the winter. Although Köppen’s classification did not consider the uniqueness of highland climate regions, the highland climate category, or H climate, is sometimes added to climate classification systems to account for elevations above 1,500 metres (about 4,900 feet).
The Köppen classification has been criticized on many grounds. It has been argued that extreme events, such as a phaseic drought or an unusual cold spell, are just as significant in controlling vegetation distributions as the mean conditions upon which Köppen’s scheme is based. It also has been pointed out that factors other than those used in the classification, such as sunshine and wind, are important to vegetation. Moreover, it has been contended that natural vegetation can respond only slowly to environmental change, so that the vegetation zones observable today are in part adjusted to past climates. Many critics have drawn attention to the rather poor correspondence between the Köppen zones and the observed vegetation distribution in many areas of the world. In spite of these and other limitations, the Köppen system remains the most popular climatic classification in use today.
2.7.1 World distribution of major climatic types
The following discussion of the climates of the world is based on groupings of Köppen’s climatic types. It should be noted that the highland climate (H) is also included here.
2.7.1.1 Type A climates
Köppen’s A climates are found in a nearly unbroken belt around the Earth at low latitudes, mostly within 15° N and S. Their location within a region in which available net solar radiation is large and relatively constant from month to month ensures both high temperatures (generally in excess of 18 °C [64 °F]) and a virtual absence of thermal seasons. Typically, the temperature difference between day and night is greater than that between the warmest and the coolest month, the opposite of the situation in mid-latitudes. The terms winter and summer have little meaning, but in many locations annual rhythm is

provided by the occurrence of wet and dry seasons. Type A climates are controlled mainly by the seasonal fluctuations of the trade winds, the intertropical convergence zone (ITCZ), and the Asian monsoon. Köppen specifies three A climates:
Wet equatorial climate (Af) Tropical monsoon and trade-wind littoral climate (Am) Tropical wet-dry climate (Aw)
2.7.1.2 Type B climates
Arid and semiarid climates cover about a quarter of Earth’s land surface, mostly between 50° N and 50° S, but they are mainly found in the 15–30° latitude belt in both hemispheres. They exhibit low precipitation, great variability in precipitation from year to year, low relative humidity, high evaporation rates (when water is available), clear skies, and intense solar radiation. Köppen’s classification recognizes three B climates:
Review Questions
1. Define the Indian Agriculture?
2. Explain the Temperature?
3. Explain the Pressure Belts and Wind System?
4. Explain the Cyclones and Anti cyclones?
Discussion Questions
Discuss the Clouds and Rainfall Types?

Chapter 3- Oceanography
Learning Objectives
To define the Relief of the Ocean Basins.
To explain the Temperature of the Ocean Water.
To explain the Salinity.
To describe the Ocean Currents.
3.1 Introduction
Oceanography, also called oceanology or marine science, is a huge science considered a branch of the Earth sciences. Oceanography is an interdisciplinary science that uses insights from biology, chemistry, geology, meteorology, and physics to analyze ocean currents, marine ecosystems, ocean storms, waves, ocean plate tectonics, and features of the ocean floor, including exotic biomes such as cold seeps and hydrothermal vents. Modern oceanography began in the 1760s with science-minded explorers such as British James Cook and the French Antoine de Bougainville, who included oceanographic observations in reports of their journeys.
Oceanography is divided into four general categories: biological oceanography (marine oceanography), the study of marine biota and their interactions; chemical oceanography (marine chemistry), which studies
the chemistry of the oceans, both past and present, and the way it interacts with the atmosphere and the carbon cycle; geological oceanography (marine geology), which studies the gelological makeup of the ocean floor, including the motion and interaction of various oceanic tectonic plates; and physical oceanography (marine physics), studying the physics of the oceans, including the complex ways that light, sound, and radio waves traverse the ocean. Oceanography is also heavily used in ocean engineering, commercial or scientific ventures involving the construction of oil platforms, ships, harbors, and maybe in the future, floating cities.
Many of the important initial discoveries in oceanography occurred in the mid-19th century. The first modern sounding (exploration with reflecting sound waves) of the deep ocean was conducted by Sir James Clark Ross. Charles Darwin, famous for coming up with the hypothesis of evolution, published some of the first papers on reefs and atolls in the 1830s. The continental shelves, sharp drop-offs usually occurring 80 km (50 mi) offshore worldwide, were discovered in 1850. The presence of continental shelves was eventually used to support theories of continental drift.
Some of the most innovative oceanographical work since WWII has been conducted by deep-sea submersibles, like the famous Alvin, which has been in operation since 1964. Using these submersibles, oceanographers have explored the wreckage of the Titanic, discovered sea floor biomes completely independent of the Sun's light, and reached the lowest point on the Earth's surface, the Challenger Deep in the Marianas Trench of the west Pacific.
3.2 Relief of the Ocean Basins
Hydrologically, an oceanic basin may be anywhere on Earth that is covered by seawater, but geologically ocean basins are large geologic basins that are below sea level. Geologically, there are other undersea geomorphological features such as the continental shelves, the deep ocean trenches, and the undersea mountain ranges (for example, the mid-Atlantic Ridge) which are not considered to be part of the ocean basins; while hydrologically, oceanic basins include the flanking continental shelves and shallow, epeiric seas.
3.2.1 History
Older references (ex. Littlehales 1930) consider the oceanic basins to be the complement to the continents, with erosion dominating the latter, and the sediments so derived ending up in the ocean basins. More modern sources (ex. Floyd 1991) regard the ocean basins more as basaltic plains, then as sedimentary depositories, since most sedimentation occurs on the continental shelves and not in the geologically-defined ocean basins.
Hydrologically some geologic basins are both above and below sea level, such as the Maracaibo Basin in Venezuela, although geologically it is not considered an oceanic basin because it is on the continental shelf and underlain by continental crust.
Earth is the only known solar planet with bimodal hypsography expressed as different kinds of crust, oceanic crust and continental crust. Oceans cover 70% of the Earth's surface. Because oceans lie lower than continents, the former serve as sedimentary basins that collect sediment eroded from the continents, known as clastic sediments, as well as precipitation sediments. Ocean basins also serve as repositories for the skeletons of carbonate- and silica-secreting organisms such as coral reefs, diatoms, Radiolarians, and foraminifera.

Geologically, an oceanic basin may be actively changing size or may be relative, tectonically inactive, depending on whether there is a moving plate tectonic boundary associated with it. The elements of an active - and growing - oceanic basin include an elevated mid-ocean ridge, flanking abyssal hills leading down to abyssal plains. The elements of an active oceanic basin often include the oceanic trench associated with a subduction zone.
The Atlantic ocean and the Arctic ocean are good examples of active, growing oceanic basins, whereas the Mediterranean Sea is shrinking. The Pacific Ocean is also an active, shrinking oceanic basin, even though it has both spreading ridge and oceanic trenches. Perhaps the best example of an inactive oceanic basin is the Gulf of Mexico, which formed in Jurassic times and has been doing nothing but collecting sediments since then. The Aleutian Basin is another example of a relatively inactive oceanic basin. The Japan Basin in the Sea of Japan which formed in the Miocene, is still tectonically active, although recent changes have been relatively mild.
3.3 Temperature of the Ocean Water
If you want to know about the temperature of the ocean, you have to learn about the parts of the ocean first. The top part of the ocean is called the surface layer. Then there is a boundary layer called the thermocline. The thermocline separates the surface layers and the deep water of the ocean. The deep ocean is the third part of the ocean.
The Sun hits the surface layer of the ocean, heating the water up. Wind and waves mix this layer up from top to bottom, so the heat gets mixed downward too. The temperature of the surface waters varies mainly with latitude. The polar seas (high latitude) can be as cold as -2 degrees Celsius (28.4 degrees Fahrenheit) while the Persian Gulf (low latitude) can be as warm as 36 degrees Celsius (96.8 degrees Fahrenheit). Ocean water, with an average salinity of 35 psu, freezes at -1.94 degrees Celsius (28.5 degrees Fahrenheit). That means at high latitude sea ice can form. The average temperature of the ocean surface waters is about 17 degrees Celsius (62.6 degrees Fahrenheit).
90 % of the total volume of ocean is found below the thermocline in the deep ocean. The deep ocean is not well mixed. The deep sea is made up of horizontal layers of equal density. Much of this deep sea water is between 0-3 degrees Celsius (32-37.5 degrees Fahrenheit)! It's really, really cold down there!
There is a neat program that is measuring the temperature and salinity of sea surface waters around the world. The Argo program deploys floats that measure salinity and temperature throughout the surface layer of the sea . Over 3,000 free-drifting floats have been deployed all over the sea and each float is programmed to sink 2,000 meters down, drifting at that depth for about 10 days. The float then makes its way to the surface measuring temperature and salinity the whole time. Data is transmitted to a satellite once the float reaches the surface, so that scientists and the public have access to the state of the sea within hours of the data collection. At a greater depth in the water, measurements are often made with a CTD instrument (CTD = conductivity, temperature, depth), where the instrument is placed in the sea water from a ship or a platform. These instruments are used by the Bermuda Institute of Sea Sciences (BIOS), where they have been tracking sea measurements like temperature, salinity and oxygen concentrations for over 55 years.
The Argos and BIOS program have both published results that confirm that the sea is warming. Surface water temperatures obviously change from season to season and year to year, but the whole sea has warmed about 0.1 degree Fahrenheit (0.055 degree Celsius) in the past 30-50 years. This may not seem like much of a temperature change, but it is significant. Think about a pot of water heating on a stove. A small pot of water will heat quickly, while a large pot of water at the same heat setting will heat very

slowly. This is due to a difference in heat capacity. The sea has an enormous heat capacity because of its large size. So it is like an enormous pot of water, and it takes a great amount of heat to warm the sea . The fact that the sea has warmed significantly in 30 to 50 years is remarkable and concerning.
3.4 Salinity
Salinity refers to the dissolved salt content of a substance like soil or water. It may be measured in a number of ways; parts per thousand and parts per million are the two most common measurements, and it is sometimes expressed as a percentage as well. A number of devices are designed to be used in the assessment, as the salinity of a substance is a very important characteristic. Many people think of it in terms of salty water, but high salinity in soils is also a major issue.
In sea water, salinity is more properly termed halinity, since a group of salts known as halides are dissolved in the sea . Some people are surprised to learn that sea halinity varies around the world, and that deeper water as a general rule tends to be saltier. The movement of water around the world's sea s is known as thermohaline circulation, a reference to the factors of temperature and halinity which lead to differing densities. Some scientists have expressed concerns about interruption of the thermohaline circulation system.
In other types of water, salinity is a perfectly accurate measure. Generally, when the level is less than 500 parts per million, the water is considered to the fresh water. Brackish water is somewhat saltier, with levels of up to 30,000 parts per million. Saline water has a salinity of between 30-50,000 parts per million, while even saltier water is considered brine. The dissolved salt content of water can be measured with a variety of tools, most of which can be used in the field by scientists.
Since salts have a profound impact on many living organisms, water salinity is an important concern for biologists. In an estuary, for example, a zone where salt and fresh water mix, the levels vary widely, supporting a wide range of flora and fauna. If this balance is disturbed by something like a storm surge or a flood of freshwater, it can have unpleasant results for some of the animals that call the estuary home.
In soils, salt can prevent crops from growing, a major concern in several countries where soil salinity is on the rise. Levels in soil are generally increased through poor land management, such as overfarming and excessive use of chemical fertilizers, compounded with extremely dry conditions. If the rise in salinity is not checked, the land can become useless for farming, and it may take decades to recover.
3.5 Ocean Deposits
Sea deposits are blanket of sediments ling on sea floor.Unconsolidated material lying over sea floor covering some of its features.Sea deposits pattern differs from one area to another area. 3.5.1 Marine deposits are of two types Material derived from wear and tear of rocks Deposits of marine animals and plants 3.5.2 Ocean deposits can be broadly classified in two categories 1) Terrigenous(Deposits on continental shelf ) 2) pelagic( Deep sea deposits) All types of rock are continuously exposed to disintegration and decomposition process.Rock are

disintegrated in to smaller segments which are carried by the rivers to the oceans.Finer materials gets transported in to open sea. However, with the sharp line of demarcation between them, the pelagic deposits may sometimes extend far up to the continental slope and the terrigenous deposits may be carried to the deep sea region. 3.5.3 Ocean deposit type 3.5.3.1 On the basis of size of rock segments Grave Sand Mud 3.5.3.2 Volcanic deposits(consists of lava material instead of quartz) Organic deposits (shells and skeletons of sea animals and plants.mostly calcium carbonate). terrigenous (mud,silt,sand) Sources of terrigenous sediments include volcanoes, weathering of rocks, wind-blown dust, grinding by glaciers, and sediment carried by iceberg 3.5.3.3 Pelagic sediments oozes(siliceous(15%) and calcareous(48 %) sediments) -Ooze is pelagic sediment that consists of at least 30% of microscopic remains of either calcareous or siliceous planktonic debris organisms
3.6 Ocean Currents
Sea currents are the vertical or horizontal movement of both surface and deep water throughout the world’s oceans. Currents normally move in a specific direction and aid significantly in the circulation of the Earth’s moisture, the resultant weather, and water pollution.
Oceanic currents are found all over the globe and vary in size, importance, and strength. Some of the more prominent currents include the California and Humboldt Currents in the Pacific, the Gulf Stream and Labrador Current in the Atlantic, and the Indian Monsoon Current in the Indian Sea . These are just a sampling of the seventeen major surface currents found in the world’s oceans.
3.6 .1The Types and Causes of Ocean Currents In addition to their varying size and strength, sea currents differ in type. They can be either surface or deep water.
Surface currents are those found in the upper 400 meters (1,300 feet) of the sea and make up about 10% of all the water in the sea . Surface currents are mostly caused by the wind because it creates friction as it moves over the water. This friction then forces the water to move in a spiral pattern, creating gyres. In the northern hemisphere, gyres move clockwise and in the southern they spin counterclockwise. The speed of surface currents is greatest closer to the ocean’s surface and decreases at about 100 meters (328 ft) below the surface.
Because surface currents travel over long distances, the Coriolis force also plays a role in their movement and deflects them, further aiding in the creation of their circular pattern. Lastly, gravity plays a role in the movement of surface currents because the top of the sea is uneven. Mounds in the water form in areas

where the water meets land, where water is warmer, or where two currents converge. Gravity then pushes this water down slope on the mounds and creates currents.
Deep water currents, also called thermohaline circulation, are found below 400 meters and make up about 90% of the sea . Like surface currents, gravity plays a role in the creation of deep water currents but these are mainly caused by density differences in the water.
Density differences are a function of temperature and salinity. Warm water holds less salt than cold water so it is less dense and rises toward the surface while cold, salt laden water sinks. As the warm water rises though, the cold water is forced to rise through upwelling and fill the void left by the warm. By contrast, when cold water rises, it too leaves a void and the rising warm water is then forced, through downwelling, to descend and fill this empty space, creating thermohaline circulation.
Thermohaline circulation is known as the Global Conveyor Belt because its circulation of warm and cold water acts as a submarine river and moves water throughout the sea .
Lastly, seafloor topography and the shape of the ocean’s basins impact both surface and deep water currents as they restrict areas where water can move and "funnel" it into another.
3.6 .2 The Importance of Ocean Currents Because sea currents circulate water worldwide, they have a significant impact on the movement of energy and moisture between the oceans and the atmosphere. As a result, they are important to the world’s weather. The Gulf Stream for example is a warm current that originates in the Gulf of Mexico and moves north toward Europe. Since it is full of warm water, the sea surface temperatures are warm, which keeps places like Europe warmer than other areas at alike latitudes.
The Humboldt Current is another example of a current that affects weather. When this cold current is normally present off the coast of Chile and Peru, it creates extremely productive waters and keeps the coast cool and northern Chile arid. However, when it becomes disrupted, Chile’s climate is altered and it is believed that El Niño plays a role in its disturbance.
Like the movement of energy and moisture, debris can also get trapped and moved around the world via currents. This can be man-made which is significant to the formation of trash islands or natural such as icebergs. The Labrador Current, which flows south out of the Arctic Sea along the coasts of Newfoundland and Nova Scotia, is famous for moving icebergs into shipping lanes in the North Atlantic.
Currents plan an important role in navigation as well. In addition to being able to avoid trash and icebergs, knowledge of currents is essential to the reduction of shipping costs and fuel consumption. Today, shipping companies and even sailing races often use currents to reduce time spent at sea.
Lastly, sea currents are important to the distribution of the world’s sea life. Many species rely on currents to move them from one location to another whether it is for breeding or just simple movement over large areas.
3.6 .3 Ocean Currents as Alternative Energy Today, sea currents are also gaining significance as a possible form of alternative energy. Because water is dense, it carries an enormous amount of energy that could possibly be captured and converted into a

usable form through the use of water turbines. Currently this is an experimental technology being tested by the United States, Japan, China, and some European Union countries.
Whether sea currents are used as alternative energy, to reduce shipping costs, or in their natural to state to move species and weather worldwide, they are significant to geographers, meteorologists, and other scientists because they have a tremendous impact on the globe and earth-atmosphere relations.
3.7 ElNino and LaNino
3.7.1 ElNino
El Niño is a weather phenomenon characterized by abnormally high surface temperatures in the tropical Pacific Sea , and weaker trade winds, which have been known to cause a global ripple effect of turbulent and unusual weather. The effect is caused in large part by the weakening of the trade winds, which normally push the warmer surface water of the Pacific westward. As these winds grow weaker, they allow warm surface water to change course and ebb eastward. As the sea and sky encourage different behavior in one another, jet streams change course, causing storm systems to show up in locations they normally don't. This weather condition can often cause fishing populations to die off, as they are unable to cope with drastic changes in sea temperature. It also tends to make hurricane season around Central and North America less fierce.
Scientists aren't exactly sure what causes El Niño conditions, but they are quite good at anticipating them. Buoys placed throughout the Pacific Sea detect water levels and temperatures, letting researchers know of any abnormal conditions. Although the weather ramifications from one El Niño to the next aren't exactly the same, researchers forewarned by data about an upcoming El Niño season are able to give the public a general idea of what to expect. More research is being conducted in the attempt to understand exactly what causes phaseic and drastic changes in the Pacific Ocean's climate.
El Niño conditions in the Pacific are something of a climate flip-flop. In normal conditions, eastern countries in the South Pacific, such as Australia and Indonesia, experience heavy rainfall. During seasons with strange weather patterns, however, these countries often experience drought-like conditions. Conversely, western countries around the South Pacific experience abnormally high precipitation. Peru, for instance, experiences heavy rainfall and flooding. Temperatures in the United States plummet far below standard temperatures in certain areas of the country, causing severe winter weather systems, while other states experience less precipitation. This topsy-turvy reversal is known as the El Niño southern oscillation (ENSO), as it resembles a kind of see-saw of weather patterns.
El Niño is Spanish, and literally means "the boy," but it's better understood in its colloquial use in South America, where it often refers to the baby Jesus. South American fisherman came up with this name because the strange weather patterns they witnessed tend to occur around Christmas. It was also fitting that researchers gave weather patterns opposite to El Niño the name La Niña.
3.7.2 La Nina
La Niña is an extreme phase of a climate cycle that occurs naturally. The climate cycle involved is a coupled sea -atmospheric occurrence resulting from the interaction between the atmosphere and the surface of the sea . Known as the Southern oscillation, this climate cycle includes El Niño on one extreme and La Niña on the other. La Niña is the cold phase of the cycle. A La Niña pattern exists when unusually
cool sea-surface temperatures occur in the eastern and central tropical Pacific Sea around the equator in the area between the International Date Line and the coast of South America.
Taken together, La Niña and El Niño generally are viewed by scientists as among the most powerful of weather phenomena on the planet, because they can affect the climate over more than half the Earth. On average, this cycle of cold surface sea temperatures occurs every three to five years and, typically, lasts about nine to 12 months. Cold episodes are important because they disrupt the usual patterns of atmospheric circulation and tropical precipitation. The effect of the disruption of these patterns is to enhance the normal climate that prevails in affected regions of the earth.
During a La Niña, for example, an area such as the Pacific Northwest in the United States, where there usually is a wet winter, would have a winter that is wetter than normal. On the other hand, the more arid climates of the southwestern U.S. would be drier than normal, and the rest of the country would tend to experience unusually warm weather during a La Niña cycle. Southeast Asia and India probably would have abnormally heavy monsoonal rains, and eastern Australia could be wetter than usual. This weather effect extends as far north as western Canada, where it causes colder winters, and as far east as southeastern Africa, where the winter weather tends to become cooler and wetter.
La Niña also affects the intensity and position of the jet streams; this, in turn, affects both the track and intensity of storms. During this cold cycle of sea temperatures, the chances of hurricane activity affecting the Caribbean and the U.S. increase, as does the likelihood that the storms will be more intense. In addition, a strong jet stream is a necessary ingredient for severe weather such as tornadoes. A change in the position of the jet streams affects which regions are most likely to experience tornadoes in the U.S.
Review Questions
1. Define the Relief of the Ocean Basins?
2. Explain the Temperature of the Ocean Water?
3. Explain the Salinity?
4. Explain the Ocean Currents?
Discussion Questions
Discuss the ElNino and LaNina?

“The lesson content has been compiled from various sources in public domain including but not limited to the internet for the convenience of the users. The university has no proprietary right on the same.”
?
Rai Technology University Campus
Dhodballapur Nelmangala Road, SH -74, Off Highway 207, Dhodballapur Taluk, Bangalore - 561204
E-mail: [email protected] | Web: www.raitechuniversity.in