Characterization of steel corrosion in mortar by various electrochemical and physical techniques
11
Characterization of steel corrosion in mortar by various electrochemical and physical techniques q Aleš C ˇ esen, Tadeja Kosec, Andraz ˇ Legat ⇑ Slovenian National Building and Civil Engineering Institute, Dimic ˇeva 12, SI-1000 Ljubljana, Slovenia article info Article history: Received 8 April 2013 Accepted 18 May 2013 Available online 29 May 2013 Keywords: A. Steel reinforced concrete A. Concrete B. Electrochemical calculation C. Alkaline corrosion C. Pitting corrosion abstract In the study characterization of steel corrosion in concrete at the macro- and micro-level was performed. Physical (electrical-resistance probes) and electrochemical techniques (coupled multi-electrode arrays) were implemented in order to upgrade the general information that conventional electrochemical tech- niques can provide. Measurements were performed in mortar exposed to periodic wetting and drying. Steel corrosion damage was assessed by micro X-ray computer tomography (CT) and SEM. The results were compared and interpreted. By combined use of micro-CT and electrochemical methods, new insights into the corrosion mechanisms of steel in concrete were obtained. Ó 2013 The Authors. Published by Elsevier Ltd. All rights reserved. 1. Introduction It is well known that the corrosion of steel reinforcement in concrete is one of the main reasons for the reduced service life of concrete structures [1]. The economic importance of this topic has caused intensive development of new technologies and mate- rials, whose aim is to increase the durability of concrete structures [2]. Simultaneously, deeper knowledge of the basic corrosion mechanisms of steel in concrete has been established. The impor- tance of macro-cells has been known for some time [3], but their exact explanation and modelling were not realized until recently [4]. On the other hand, it has been confirmed that small non-uni- formities in the transition zone between the concrete and the steel reinforcement can represent distinct corrosion initiation sites [5]. It was found that, under specific conditions, the corrosion pro- cesses of steel in concrete exhibit very high dynamics, and that cor- rosion initiation and repassivation might consist of a sequence of several events [6]. These observations have also provided an expla- nation as to why corrosion parameters and the evolution of corro- sion processes in concrete cannot be exactly compared to those which occur in simulated pore water [7,8]. One of the main problems in measuring and explaining the corrosion of steel in concrete is the relatively large range of dimensions (a few tens of cm in the case of a structural element, up to a few tens of m in the case of a whole structure). On the other hand, at the same time the distribution of anodic and cathodic sites on the micro-scale could also be very important [9]. In this sense, as opposed to macro-cell corrosion, the term self-corrosion has been applied by some authors [10]. Due to these difficulties, a combination of ‘‘so-called’’ mapping tech- niques (potential mapping, electrical resistance mapping, polari- zation resistance mapping), as well as confined measurements, are usually used for the assessment of the corrosion of reinforced concrete structures [5,6]. In some cases the local electrochemical parameters of rebars have been obtained by means of embedded sensors [11–13]. The limitations and uncertainties of surface ap- plied techniques and various types of sensors are described else- where [14–16]. A commonly used electrochemical technique for the quantita- tive assessment of steel corrosion rates in concrete consists of po- tential mapping and polarization resistance measurements. Electrochemical impedance spectroscopy (EIS) is a more advanced electrochemical technique, since it measures dynamic response over a wider frequency interval [17]. This technique has been suc- cessfully implemented for basic studies of the corrosion processes in mortars and concrete [17,18], but in the case of practical appli- cations, a simplified method, the so-called galvanostatic pulse technique, is generally used [14–16]. All the of the above-men- tioned electrochemical techniques can be used for monitoring of the evolution of corrosion processes, but during the performance 0010-938X/$ - see front matter Ó 2013 The Authors. Published by Elsevier Ltd. All rights reserved. http://dx.doi.org/10.1016/j.corsci.2013.05.015 q This is an open-access article distributed under the terms of the Creative Commons Attribution-NonCommercial-No Derivative Works License, which per- mits non-commercial use, distribution, and reproduction in any medium, provided the original author and source are credited. ⇑ Corresponding author. Tel.: +386 1 2804250. E-mail address: [email protected] (A. Legat). Corrosion Science 75 (2013) 47–57 Contents lists available at SciVerse ScienceDirect Corrosion Science journal homepage: www.elsevier.com/locate/corsci
Transcript of Characterization of steel corrosion in mortar by various electrochemical and physical techniques
Corrosion Science 75 (2013) 47–57
Contents lists available at SciVerse ScienceDirect
Corrosion Science
journal homepage: www.elsevier .com/ locate /corsc i
Characterization of steel corrosion in mortar by various electrochemicaland physical techniques q
0010-938X/$ - see front matter � 2013 The Authors. Published by Elsevier Ltd. All rights reserved.http://dx.doi.org/10.1016/j.corsci.2013.05.015
q This is an open-access article distributed under the terms of the CreativeCommons Attribution-NonCommercial-No Derivative Works License, which per-mits non-commercial use, distribution, and reproduction in any medium, providedthe original author and source are credited.⇑ Corresponding author. Tel.: +386 1 2804250.
E-mail address: [email protected] (A. Legat).
Aleš Cesen, Tadeja Kosec, Andraz Legat ⇑Slovenian National Building and Civil Engineering Institute, Dimiceva 12, SI-1000 Ljubljana, Slovenia
a r t i c l e i n f o
Article history:Received 8 April 2013Accepted 18 May 2013Available online 29 May 2013
Keywords:A. Steel reinforced concreteA. ConcreteB. Electrochemical calculationC. Alkaline corrosionC. Pitting corrosion
a b s t r a c t
In the study characterization of steel corrosion in concrete at the macro- and micro-level was performed.Physical (electrical-resistance probes) and electrochemical techniques (coupled multi-electrode arrays)were implemented in order to upgrade the general information that conventional electrochemical tech-niques can provide. Measurements were performed in mortar exposed to periodic wetting and drying.Steel corrosion damage was assessed by micro X-ray computer tomography (CT) and SEM. The resultswere compared and interpreted. By combined use of micro-CT and electrochemical methods, newinsights into the corrosion mechanisms of steel in concrete were obtained.
� 2013 The Authors. Published by Elsevier Ltd. All rights reserved.
1. Introduction
It is well known that the corrosion of steel reinforcement inconcrete is one of the main reasons for the reduced service life ofconcrete structures [1]. The economic importance of this topichas caused intensive development of new technologies and mate-rials, whose aim is to increase the durability of concrete structures[2]. Simultaneously, deeper knowledge of the basic corrosionmechanisms of steel in concrete has been established. The impor-tance of macro-cells has been known for some time [3], but theirexact explanation and modelling were not realized until recently[4]. On the other hand, it has been confirmed that small non-uni-formities in the transition zone between the concrete and the steelreinforcement can represent distinct corrosion initiation sites [5].It was found that, under specific conditions, the corrosion pro-cesses of steel in concrete exhibit very high dynamics, and that cor-rosion initiation and repassivation might consist of a sequence ofseveral events [6]. These observations have also provided an expla-nation as to why corrosion parameters and the evolution of corro-sion processes in concrete cannot be exactly compared to thosewhich occur in simulated pore water [7,8].
One of the main problems in measuring and explaining thecorrosion of steel in concrete is the relatively large range ofdimensions (a few tens of cm in the case of a structural element,up to a few tens of m in the case of a whole structure). On theother hand, at the same time the distribution of anodic andcathodic sites on the micro-scale could also be very important[9]. In this sense, as opposed to macro-cell corrosion, the termself-corrosion has been applied by some authors [10]. Due tothese difficulties, a combination of ‘‘so-called’’ mapping tech-niques (potential mapping, electrical resistance mapping, polari-zation resistance mapping), as well as confined measurements,are usually used for the assessment of the corrosion of reinforcedconcrete structures [5,6]. In some cases the local electrochemicalparameters of rebars have been obtained by means of embeddedsensors [11–13]. The limitations and uncertainties of surface ap-plied techniques and various types of sensors are described else-where [14–16].
A commonly used electrochemical technique for the quantita-tive assessment of steel corrosion rates in concrete consists of po-tential mapping and polarization resistance measurements.Electrochemical impedance spectroscopy (EIS) is a more advancedelectrochemical technique, since it measures dynamic responseover a wider frequency interval [17]. This technique has been suc-cessfully implemented for basic studies of the corrosion processesin mortars and concrete [17,18], but in the case of practical appli-cations, a simplified method, the so-called galvanostatic pulsetechnique, is generally used [14–16]. All the of the above-men-tioned electrochemical techniques can be used for monitoring ofthe evolution of corrosion processes, but during the performance
48 A. Cesen et al. / Corrosion Science 75 (2013) 47–57
of a single measurement the conditions should be at steady state,otherwise interpretations of results could be misleading.
One of the methods which can be used to detect the initiation ofsteel corrosion in concrete, and any subsequent repassivation, iselectrochemical noise (EN). Since EN consists of current and poten-tial fluctuations that are spontaneously generated by corrosionreactions, the absence of intrusiveness is one of the main advanta-ges of this technique. Although several studies have been per-formed in connection with various aspects of corrosion [19–22],applications of EN for measuring corrosion in concrete are fairlyrare [7,23–25]. On the other hand, a very similar method, the so-called macro-cell coupling current technique, was widely imple-mented in concrete some time ago [5,6]. There is actually no signif-icant difference between the current EN and the macro-cell currenttechniques, except in the type of signal analysis. In general, mea-sured macro-cell current signals are described primarily in thetime domain, whereas in EN terminology various mathematicaltools are known (spectral, chaotic, wavelet). Both methods canonly be realized with embedded electrodes, where the couplingcurrent can be measured also between the steel and a pseudo-ref-erence electrode made from a more noble material. With a ladderof steel electrodes positioned at different levels in the concrete, thecarbonation front and chloride penetration can be monitored, andconsequently the corrosion process can be predicted [11]. It hasbeen confirmed that both the EN and the macro-cell current tech-niques can reliably be used to monitor the dynamics of corrosionprocesses in concrete [7,24].
Measuring with various kinds of electrode arrays is a some-what advanced EN technique. The first type of such arrays con-sisted of uncoupled electrodes, known as a so-called wire beamelectrode [26,27]. Coupled electrode arrays, which allow mea-surements of partial corrosion currents, appeared slightly later[28]. At the very beginning, they were implemented in investiga-tions of the spatiotemporal electrochemical behaviour of selectedmetals in different electrolytes [28,29]. More recently, they havebeen used to study crevice corrosion under various geometricaland environmental conditions [30–32], and corrosion evolutionunder coatings and in soil [26,33]. Different names are still used,but the term ‘‘coupled multi-electrode array’’ (CMEA) has beenmore or less generally accepted for this type of array configura-tion. It has been confirmed that CMEA can reliably follow the dis-tribution of anodic and cathodic currents over time. Despite thevery promising capabilities of this technique, CMEA has beenused only a few times for monitoring steel corrosion in concrete[24,34]. On the basis of these measurements, maximum localizedcorrosion rates have been assessed during different stages of wet-ting and drying of concrete [24].
One specific type of embedded sensor is an electrical resistance(ER) probe that measures the thickness reduction due to corrosion[35]. Although applications of these probes in concrete are rela-tively rare, the results have proved that they can accurately deter-mine the cumulative corrosion damage of steel in cementitiousmaterials [7]. Consequently, reliable assessment of the averagegeneral corrosion rate over defined time intervals is possible [7].On the other hand, the response of these probes to localized corro-sion types and transient events is limited. ER probes are based onphysical response to corrosion, and are therefore not directly sus-ceptible to variations in the electrochemical parameters. For thisreason they are particularly suited for the long-term verificationof the suitability of electrochemical sensors for corrosion measure-ments in concrete.
Computed X-ray microtomography (X-ray CT) is a widely ac-cepted technique that is used in medicine and material science[36]. It can be used to obtain 3D images of an internal structurewhich are combined from multiple cross-sectional X-ray scans.Unlike in the case of conventional X-ray radiography, during
acquisition X-ray radiographs are recorded at different angles dur-ing step-wise rotation around a vertical axis. X-ray CT has foundnumerous applications in various corrosion studies, where its pos-sibilities of use have been confirmed [10,37]. The results of the firstattempts to study the internal structure of stone and concrete bymeans of X-ray CT were presented a decade ago [38,39], but morecomprehensive studies of steel corrosion in concrete have beenperformed quite recently [40,41].
The main aim of the present study was to monitor and char-acterize the time and spatial evolution of steel corrosion in con-crete. Thus this research was actually an upgrade of our previousexperiments [7,24]. In order to accomplish the aforementionedgoal, various electrochemical techniques were combined with se-lected physical methods. Besides potential mapping, a galvano-static pulse technique, macro-cell coupling current (EN current)measurements, CMEA (coupled multi-electrode arrays) wereused. ER (electrical resistance) probes and X-ray CT (computertomography) scans were implemented, in order to verify resultsobtained by the electrochemical techniques. After the tests hadbeen completed, the surfaces of the rebars, electrodes, and probeswere analysed by SEM. The results obtained by using individualtechniques were compared, and then carefully interpreted. Theclearly evident differences observed between them received con-siderable attention, and the limitations of specific measuringtechniques were determined. Some new insights into the corro-sion processes of steel in concrete were established.
2. Experimental
2.1. Preparation of the test specimens
Four types of test specimens were prepared for this study, aspresented in Fig. 1. Potential maps and measurements by meansof galvanostatic pulse technique were performed on mortarblocks (with dimensions of 3 � 3 � 10 cm) with one embeddedcarbon steel rod (Fig. 1a). The diameter of these rods was5 mm. Similarly, specimens for measuring coupling currentswere prepared, but 2 rods were embedded in each specimen(Fig. 1b). One rod was placed 5 mm below the mortar surface,whereas the distance of the other rod to the surface was20 mm. A coupled multi-electrode array (CMEA) was prepared.It consisted of 25 carbon steel electrodes with a diameter of0.8 mm, which were arranged in a 5 � 5 mesh. The centre-to-centre distance of the electrodes was 1.6 mm. Only the cross-sections of the electrodes were exposed to mortar, whereasthe sides of the electrodes were placed in an epoxy resin(Fig. 1c). The exact structure of the array, as well as the electri-cal configuration for the measurements, has been described inour previous work [24]. The thickness of the mortar cover was5 mm. Prior to concreting the specimens, the steel rods andelectrodes were abraded with 1200-grid emery paper, degreasedwith acetone and then well dried.
The electrical resistance (ER) probes were constructed from 4resistors made by the electrochemical etching of a 240 lm thickcarbon steel plate. The width of the electrical leads in the resistorelements was about 0.5 mm. The nominal surface area of one sen-sor element was 3.5 cm2. These resistors were placed as a Wheat-stone bridge: 2 of them were protected, whereas the other 2 wereexposed to the mortar. Since 2 resistor elements were exposed tocorrosion, the nominal corroded surface area of the corroding partwas 7 cm2. The exact construction of the probe, and the measure-ment procedure, has been described in one of our previous papers[24]. The thickness of the mortar cover was, in this case, too, 5 mm(Fig. 1d). Before installation of the probes, the steel surface wascleaned by ethanol and dried.
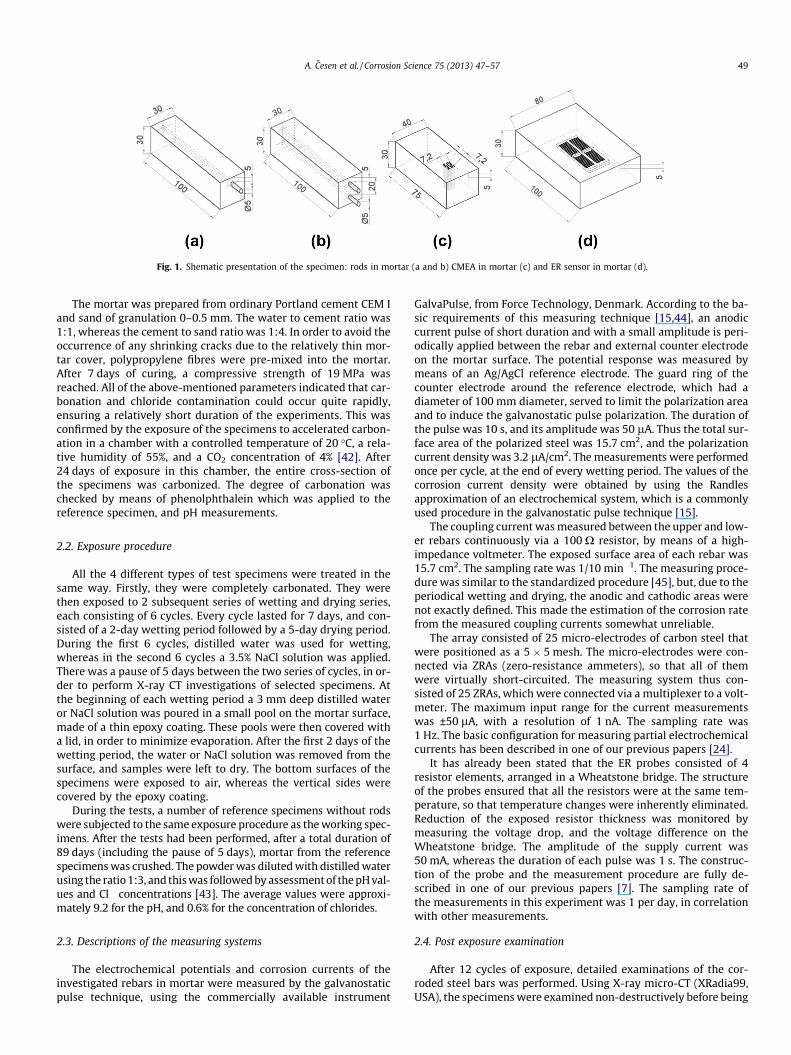
Fig. 1. Shematic presentation of the specimen: rods in mortar (a and b) CMEA in mortar (c) and ER sensor in mortar (d).
A. Cesen et al. / Corrosion Science 75 (2013) 47–57 49
The mortar was prepared from ordinary Portland cement CEM Iand sand of granulation 0–0.5 mm. The water to cement ratio was1:1, whereas the cement to sand ratio was 1:4. In order to avoid theoccurrence of any shrinking cracks due to the relatively thin mor-tar cover, polypropylene fibres were pre-mixed into the mortar.After 7 days of curing, a compressive strength of 19 MPa wasreached. All of the above-mentioned parameters indicated that car-bonation and chloride contamination could occur quite rapidly,ensuring a relatively short duration of the experiments. This wasconfirmed by the exposure of the specimens to accelerated carbon-ation in a chamber with a controlled temperature of 20 �C, a rela-tive humidity of 55%, and a CO2 concentration of 4% [42]. After24 days of exposure in this chamber, the entire cross-section ofthe specimens was carbonized. The degree of carbonation waschecked by means of phenolphthalein which was applied to thereference specimen, and pH measurements.
2.2. Exposure procedure
All the 4 different types of test specimens were treated in thesame way. Firstly, they were completely carbonated. They werethen exposed to 2 subsequent series of wetting and drying series,each consisting of 6 cycles. Every cycle lasted for 7 days, and con-sisted of a 2-day wetting period followed by a 5-day drying period.During the first 6 cycles, distilled water was used for wetting,whereas in the second 6 cycles a 3.5% NaCl solution was applied.There was a pause of 5 days between the two series of cycles, in or-der to perform X-ray CT investigations of selected specimens. Atthe beginning of each wetting period a 3 mm deep distilled wateror NaCl solution was poured in a small pool on the mortar surface,made of a thin epoxy coating. These pools were then covered witha lid, in order to minimize evaporation. After the first 2 days of thewetting period, the water or NaCl solution was removed from thesurface, and samples were left to dry. The bottom surfaces of thespecimens were exposed to air, whereas the vertical sides werecovered by the epoxy coating.
During the tests, a number of reference specimens without rodswere subjected to the same exposure procedure as the working spec-imens. After the tests had been performed, after a total duration of89 days (including the pause of 5 days), mortar from the referencespecimens was crushed. The powder was diluted with distilled waterusing the ratio 1:3, and this was followed by assessment of the pH val-ues and Cl� concentrations [43]. The average values were approxi-mately 9.2 for the pH, and 0.6% for the concentration of chlorides.
2.3. Descriptions of the measuring systems
The electrochemical potentials and corrosion currents of theinvestigated rebars in mortar were measured by the galvanostaticpulse technique, using the commercially available instrument
GalvaPulse, from Force Technology, Denmark. According to the ba-sic requirements of this measuring technique [15,44], an anodiccurrent pulse of short duration and with a small amplitude is peri-odically applied between the rebar and external counter electrodeon the mortar surface. The potential response was measured bymeans of an Ag/AgCl reference electrode. The guard ring of thecounter electrode around the reference electrode, which had adiameter of 100 mm diameter, served to limit the polarization areaand to induce the galvanostatic pulse polarization. The duration ofthe pulse was 10 s, and its amplitude was 50 lA. Thus the total sur-face area of the polarized steel was 15.7 cm2, and the polarizationcurrent density was 3.2 lA/cm2. The measurements were performedonce per cycle, at the end of every wetting period. The values of thecorrosion current density were obtained by using the Randlesapproximation of an electrochemical system, which is a commonlyused procedure in the galvanostatic pulse technique [15].
The coupling current was measured between the upper and low-er rebars continuously via a 100 X resistor, by means of a high-impedance voltmeter. The exposed surface area of each rebar was15.7 cm2. The sampling rate was 1/10 min�1. The measuring proce-dure was similar to the standardized procedure [45], but, due to theperiodical wetting and drying, the anodic and cathodic areas werenot exactly defined. This made the estimation of the corrosion ratefrom the measured coupling currents somewhat unreliable.
The array consisted of 25 micro-electrodes of carbon steel thatwere positioned as a 5 � 5 mesh. The micro-electrodes were con-nected via ZRAs (zero-resistance ammeters), so that all of themwere virtually short-circuited. The measuring system thus con-sisted of 25 ZRAs, which were connected via a multiplexer to a volt-meter. The maximum input range for the current measurementswas ±50 lA, with a resolution of 1 nA. The sampling rate was1 Hz. The basic configuration for measuring partial electrochemicalcurrents has been described in one of our previous papers [24].
It has already been stated that the ER probes consisted of 4resistor elements, arranged in a Wheatstone bridge. The structureof the probes ensured that all the resistors were at the same tem-perature, so that temperature changes were inherently eliminated.Reduction of the exposed resistor thickness was monitored bymeasuring the voltage drop, and the voltage difference on theWheatstone bridge. The amplitude of the supply current was50 mA, whereas the duration of each pulse was 1 s. The construc-tion of the probe and the measurement procedure are fully de-scribed in one of our previous papers [7]. The sampling rate ofthe measurements in this experiment was 1 per day, in correlationwith other measurements.
2.4. Post exposure examination
After 12 cycles of exposure, detailed examinations of the cor-roded steel bars was performed. Using X-ray micro-CT (XRadia99,USA), the specimens were examined non-destructively before being

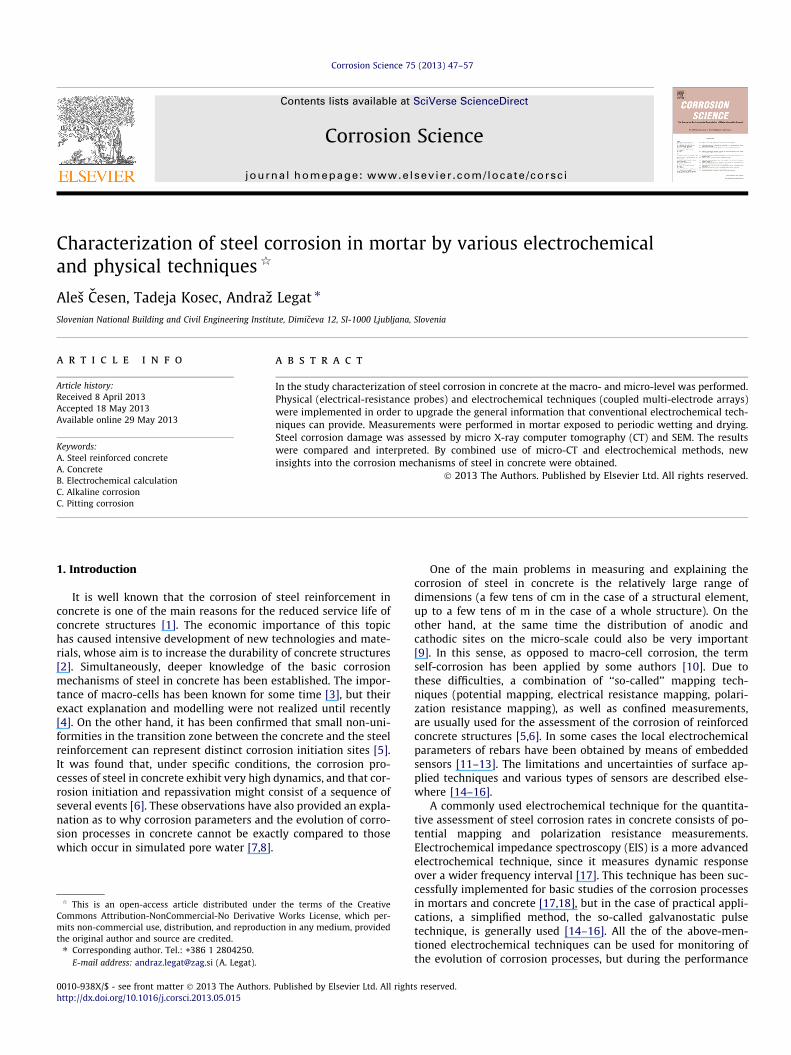
Fig. 2. Potentials and measured corrosion rates (4 specimens).
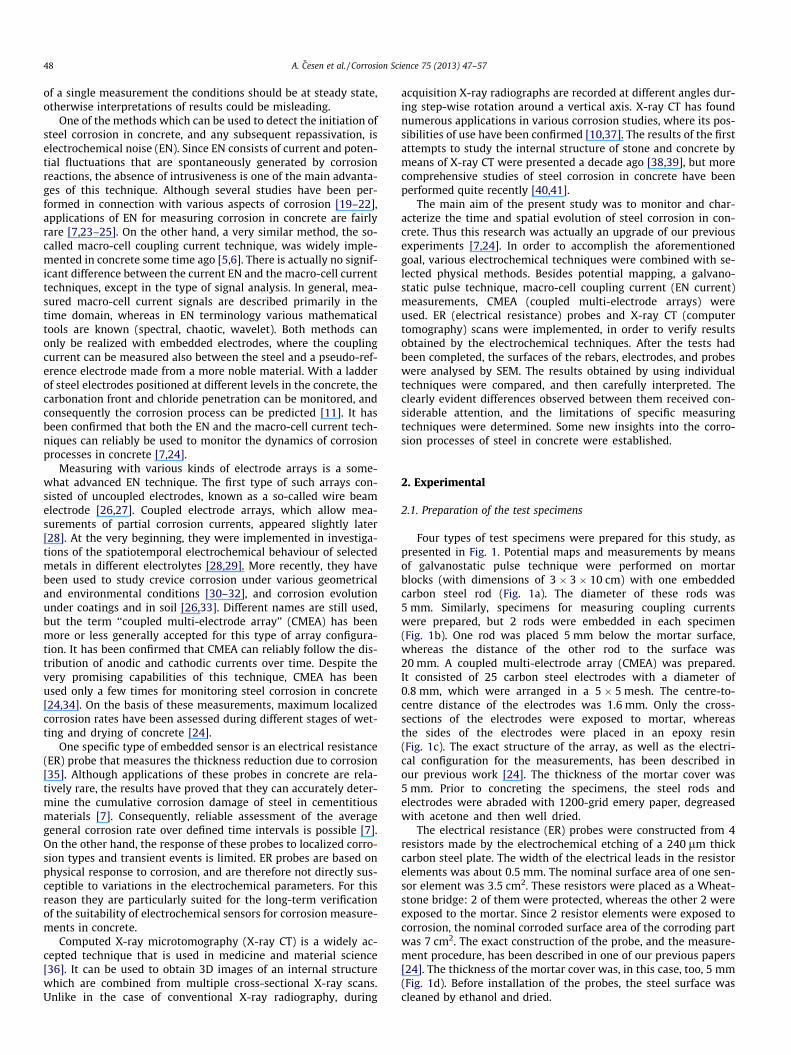
Fig. 3. X-ray CT images of a steel rod – (a) cross-sectional view, (b) detail of the cross section, and (c) longitudinal 3D view.
50 A. Cesen et al. / Corrosion Science 75 (2013) 47–57
dismantled. A spatial resolution of around 4 lm voxel was achieved,which allowed clear detection of individual pits on the CMEA elec-trodes, as well as on the ER sensors. It should be pointed out thatX-ray CT was applied also after the first 6 cycles (wetting withwater), but the resolution was about the same as the order of magni-tude of the corrosion damage. Additionally, it should be mentionedthat the X-ray CT scanning of concrete specimens in cm dimensionswith the highest resolution is relatively time-consuming (in the or-der of a week), which makes wider implementation of this techniqueduring such experiments somewhat difficult. For this reason only afew specimens were scanned with the highest resolution.
After the X-ray CT scanning had been performed, the specimenswere dismantled, and then inspected by SEM. The rebars and theprobes were first immersed in a 50 vol.% HCl solution with 3.5 g/L ofurothropine, for 5 min. The steel surfaces were then cleaned with eth-anol and well dried. A low-vacuum JEOL 5500 LV, JEOL scanning elec-tron microscope (SEM) was used to systematically investigate the steelsurfaces. The amount and type of corrosion damage were evaluated.
3. Results
3.1. Galvanostatic pulse measurements
It has been mentioned above that the corrosion of rebars wasmonitored in 4 identical mortar specimens by the galvanostatic
pulse technique. Corrosion potentials and corrosion rates were ob-tained at the end of each wetting period (Fig. 2). It was observedthat the potentials fluctuated slightly during wetting with waterand the chloride solution, but without any general trend. Duringthe first wetting cycles with chlorides the measured potentialseven somewhat increased, but a clear negative trend of potentialscan be seen during the last part of the exposure. On the other hand,the measured corrosion rates continuously increased during themeasurements. The average measured corrosion rate during thefirst 6 cycles (wetting with water) was around 110 lm per year,whereas the average corrosion rate during wetting with the chlo-ride solution was significantly higher, around 670 lm per year.The highest corrosion rate was 840 lm per year.
It is clear that these corrosion rates are relatively high: the totalaverage corrosion rate was approximately 390 lm per year. Onespecimen was investigated more fully by means of X-ray CT. Somewider pits, a few tens of lm wide and deep were found, but mildgeneral corrosion formed the predominant form of corrosion dam-age (Fig. 3). The total volume of the corroded steel was estimatedfrom the X-ray CT scans. Taking into account the fact that the cor-rosion damage was generated mainly during the exposure to chlo-rides, the estimated average corrosion rate was around 65 lm peryear. The largest pit had a depth of roughly 150 lm, which corre-sponded to a corrosion rate of approximately 1300 lm per year.It should be mentioned that the resolution of the X-ray CT was,
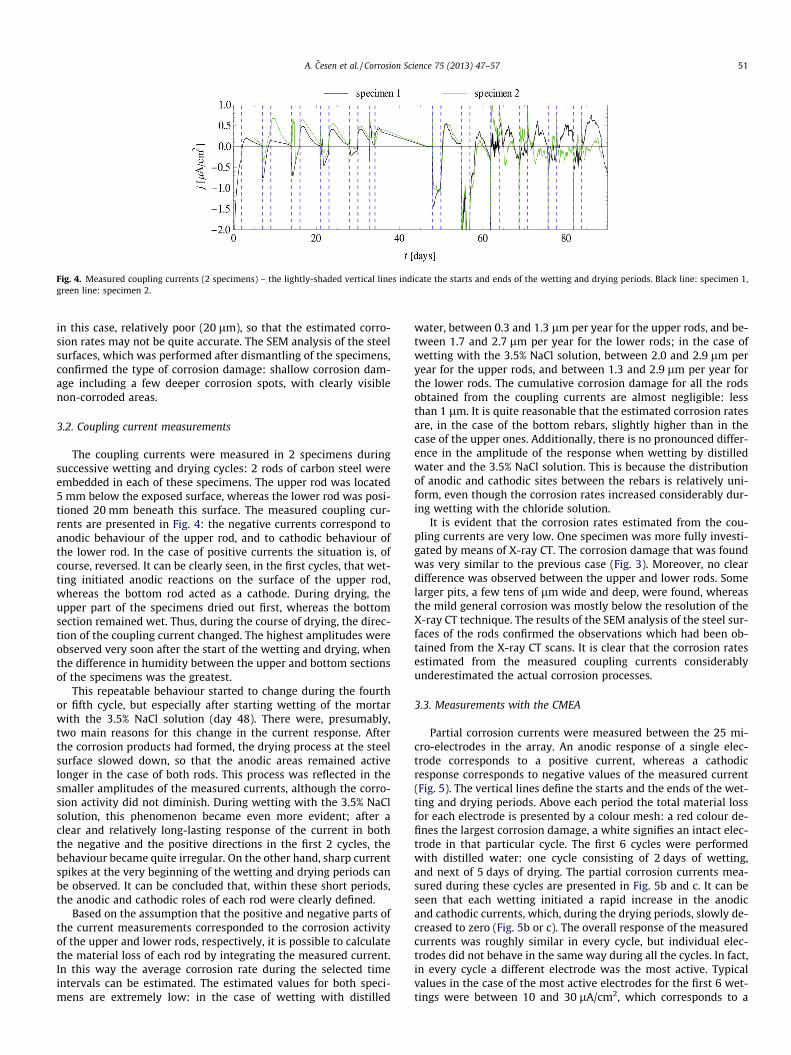
Fig. 4. Measured coupling currents (2 specimens) – the lightly-shaded vertical lines indicate the starts and ends of the wetting and drying periods. Black line: specimen 1,green line: specimen 2.
A. Cesen et al. / Corrosion Science 75 (2013) 47–57 51
in this case, relatively poor (20 lm), so that the estimated corro-sion rates may not be quite accurate. The SEM analysis of the steelsurfaces, which was performed after dismantling of the specimens,confirmed the type of corrosion damage: shallow corrosion dam-age including a few deeper corrosion spots, with clearly visiblenon-corroded areas.
3.2. Coupling current measurements
The coupling currents were measured in 2 specimens duringsuccessive wetting and drying cycles: 2 rods of carbon steel wereembedded in each of these specimens. The upper rod was located5 mm below the exposed surface, whereas the lower rod was posi-tioned 20 mm beneath this surface. The measured coupling cur-rents are presented in Fig. 4: the negative currents correspond toanodic behaviour of the upper rod, and to cathodic behaviour ofthe lower rod. In the case of positive currents the situation is, ofcourse, reversed. It can be clearly seen, in the first cycles, that wet-ting initiated anodic reactions on the surface of the upper rod,whereas the bottom rod acted as a cathode. During drying, theupper part of the specimens dried out first, whereas the bottomsection remained wet. Thus, during the course of drying, the direc-tion of the coupling current changed. The highest amplitudes wereobserved very soon after the start of the wetting and drying, whenthe difference in humidity between the upper and bottom sectionsof the specimens was the greatest.
This repeatable behaviour started to change during the fourthor fifth cycle, but especially after starting wetting of the mortarwith the 3.5% NaCl solution (day 48). There were, presumably,two main reasons for this change in the current response. Afterthe corrosion products had formed, the drying process at the steelsurface slowed down, so that the anodic areas remained activelonger in the case of both rods. This process was reflected in thesmaller amplitudes of the measured currents, although the corro-sion activity did not diminish. During wetting with the 3.5% NaClsolution, this phenomenon became even more evident; after aclear and relatively long-lasting response of the current in boththe negative and the positive directions in the first 2 cycles, thebehaviour became quite irregular. On the other hand, sharp currentspikes at the very beginning of the wetting and drying periods canbe observed. It can be concluded that, within these short periods,the anodic and cathodic roles of each rod were clearly defined.
Based on the assumption that the positive and negative parts ofthe current measurements corresponded to the corrosion activityof the upper and lower rods, respectively, it is possible to calculatethe material loss of each rod by integrating the measured current.In this way the average corrosion rate during the selected timeintervals can be estimated. The estimated values for both speci-mens are extremely low: in the case of wetting with distilled
water, between 0.3 and 1.3 lm per year for the upper rods, and be-tween 1.7 and 2.7 lm per year for the lower rods; in the case ofwetting with the 3.5% NaCl solution, between 2.0 and 2.9 lm peryear for the upper rods, and between 1.3 and 2.9 lm per year forthe lower rods. The cumulative corrosion damage for all the rodsobtained from the coupling currents are almost negligible: lessthan 1 lm. It is quite reasonable that the estimated corrosion ratesare, in the case of the bottom rebars, slightly higher than in thecase of the upper ones. Additionally, there is no pronounced differ-ence in the amplitude of the response when wetting by distilledwater and the 3.5% NaCl solution. This is because the distributionof anodic and cathodic sites between the rebars is relatively uni-form, even though the corrosion rates increased considerably dur-ing wetting with the chloride solution.
It is evident that the corrosion rates estimated from the cou-pling currents are very low. One specimen was more fully investi-gated by means of X-ray CT. The corrosion damage that was foundwas very similar to the previous case (Fig. 3). Moreover, no cleardifference was observed between the upper and lower rods. Somelarger pits, a few tens of lm wide and deep, were found, whereasthe mild general corrosion was mostly below the resolution of theX-ray CT technique. The results of the SEM analysis of the steel sur-faces of the rods confirmed the observations which had been ob-tained from the X-ray CT scans. It is clear that the corrosion ratesestimated from the measured coupling currents considerablyunderestimated the actual corrosion processes.
3.3. Measurements with the CMEA
Partial corrosion currents were measured between the 25 mi-cro-electrodes in the array. An anodic response of a single elec-trode corresponds to a positive current, whereas a cathodicresponse corresponds to negative values of the measured current(Fig. 5). The vertical lines define the starts and the ends of the wet-ting and drying periods. Above each period the total material lossfor each electrode is presented by a colour mesh: a red colour de-fines the largest corrosion damage, a white signifies an intact elec-trode in that particular cycle. The first 6 cycles were performedwith distilled water: one cycle consisting of 2 days of wetting,and next of 5 days of drying. The partial corrosion currents mea-sured during these cycles are presented in Fig. 5b and c. It can beseen that each wetting initiated a rapid increase in the anodicand cathodic currents, which, during the drying periods, slowly de-creased to zero (Fig. 5b or c). The overall response of the measuredcurrents was roughly similar in every cycle, but individual elec-trodes did not behave in the same way during all the cycles. In fact,in every cycle a different electrode was the most active. Typicalvalues in the case of the most active electrodes for the first 6 wet-tings were between 10 and 30 lA/cm2, which corresponds to a
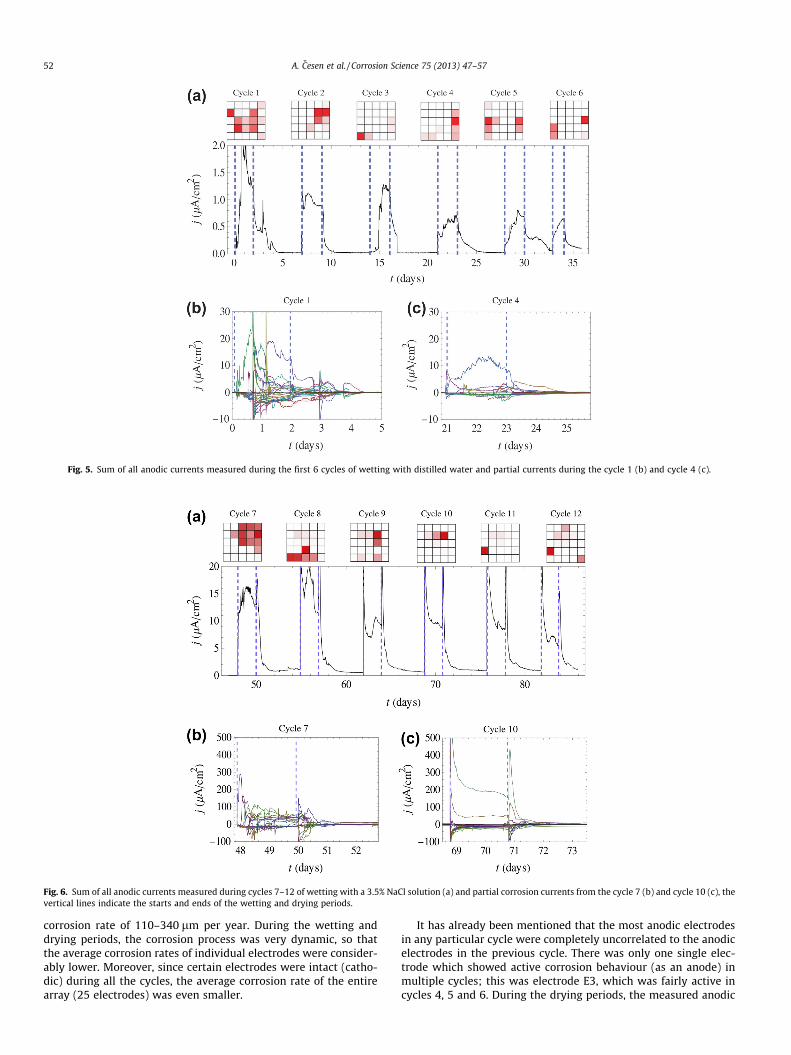
Fig. 5. Sum of all anodic currents measured during the first 6 cycles of wetting with distilled water and partial currents during the cycle 1 (b) and cycle 4 (c).
Fig. 6. Sum of all anodic currents measured during cycles 7–12 of wetting with a 3.5% NaCl solution (a) and partial corrosion currents from the cycle 7 (b) and cycle 10 (c), thevertical lines indicate the starts and ends of the wetting and drying periods.
52 A. Cesen et al. / Corrosion Science 75 (2013) 47–57
corrosion rate of 110–340 lm per year. During the wetting anddrying periods, the corrosion process was very dynamic, so thatthe average corrosion rates of individual electrodes were consider-ably lower. Moreover, since certain electrodes were intact (catho-dic) during all the cycles, the average corrosion rate of the entirearray (25 electrodes) was even smaller.
It has already been mentioned that the most anodic electrodesin any particular cycle were completely uncorrelated to the anodicelectrodes in the previous cycle. There was only one single elec-trode which showed active corrosion behaviour (as an anode) inmultiple cycles; this was electrode E3, which was fairly active incycles 4, 5 and 6. During the drying periods, the measured anodic

A. Cesen et al. / Corrosion Science 75 (2013) 47–57 53
currents decreased to negligible values within the first two daysafter water removal. The cumulative corrosion damage for a giventime period was calculated by simple numerical integration of theanodic current. At the end of cycle 6 the most heavily damagedelectrode was electrode E3, with a loss of material of 1.6 lm. Thisdamage corresponds to an average corrosion rate of approximately14 lm per year, over 6 weeks of exposure, in the case of this par-ticular electrode. In the case of the entire array (all 25 electrodes)the average corrosion rate for the first 6 weeks of the exposure was3.2 lm per year. It is clear that, at this point, the corrosion damagewas still too small to be observed by means of X-ray CT.
After cycle 6 had been completed, chlorides were induced intothe mortar by wetting with a 3.5% NaCl solution. The responses,i.e. the measured partial corrosion currents during cycles 7–12,are presented in Fig. 6. It is clear that the measured currents weresignificantly higher than those measured during the previous 6 cy-cles: the highest anodic current densities were around 200 lA/cm2,which corresponds to a corrosion rate of roughly 2 mm per year.However, at certain points a few pronounced current peaks wereobserved: these spikes, within a range of up to 10 mA/cm2, cannotbe clearly seen in Fig. 6 due to the limited scale. The highest cur-rent peaks were observed immediately after pouring the NaCl solu-tion onto the specimen’s surface, and they lasted for a few hours. Asecond group of peaks was generated shortly after removing thesolution from the surfaces, at the end of the wetting periods. Sim-ilarly, as in the case of wetting by water, no anodic electrode wasobserved which would be active during several consecutive expo-sure periods: 2 electrodes were active in 2 subsequent cycles (A4and E3). However, in most of the cycles treated with the NaCl solu-tion, there were only a few dominant anodic electrodes, whichindicated more localized corrosion compared to the first 6 cyclesusing distilled water. In the case of wetting with the NaCl solution,the corrosion currents also decreased significantly during the dry-ing periods. However, they did not drop close to zero, but stayedmostly in the range between 5 and 15 lA/cm2. That means thatsome of the electrodes corroded even during the supposedly drystages, with a corrosion rate of roughly 100 lm per year. The aver-age corrosion rate for the 2 most corroded electrodes (A4 and D2)was, over all 6 periods of wetting with the NaCl solution, estimatedto be approximately 290 lm per year. The average corrosion rateover the entire exposed area (25 electrodes) was roughly 60 lmper year, which is nearly 20 times faster than in the case of wettingby water.
The coupled multi-electrode array (CMEA) was thoroughlyinvestigated by means of X-ray CT (Fig. 7a). The spatial resolution
Fig. 7. X-ray CT scans of the CMEA; CT: (a) the entire
of X-ray CT scans for the entire array was roughly 10 lm, whichmeans that the scanning was relatively coarse compared to thescale of the estimated corrosion damage (Fig. 7a). It can be clearlyseen that a few of the electrodes were heavily corroded (A4, C2,D2), whereas half of the remaining electrodes showed mediumdamage (A5, C1, C4, D1, D3, D5), and the other half (A1, A2, A3,B1, B3, B4) remained completely intact. It is clear that the observa-tions obtained on the basis of the X-ray CT scans are in completeagreement with those obtained from the measured currents.
In order to correlate as closely as possible the measured signalsin the CMEA and the corrosion damage, selected electrodes with ananodic response were scanned with higher precision: the spatialresolution of the X-ray CT scans being, in this case, around 4 lm.The scans of 2 electrodes (C2 and D2) can be seen in Fig. 7b. It isclear that the pits on these two electrodes were much deeper (sev-eral hundreds of lm) than the scanning resolution, so that rela-tively good accuracy for the estimation of the corroded volumewas ensured. The results obtained from the measured currents bymeans of the CMEA, and the results estimated from the X-ray CTscans, are presented in Table 1. It can be clearly seen that the resultsare mostly comparable within the resolution of the scans. The rela-tively large error which occurred in the case of the scan of electrodeA4 was due to the absence of any major pit, and there was fairly uni-form corrosion damage across the surface. It is clear that even incases of predominant pitting the majority of the corrosion currentwas measured by means of the CMEA – the volumes obtained fromthe measured currents would, otherwise, be much lower.
3.4. Measurements with ER probes
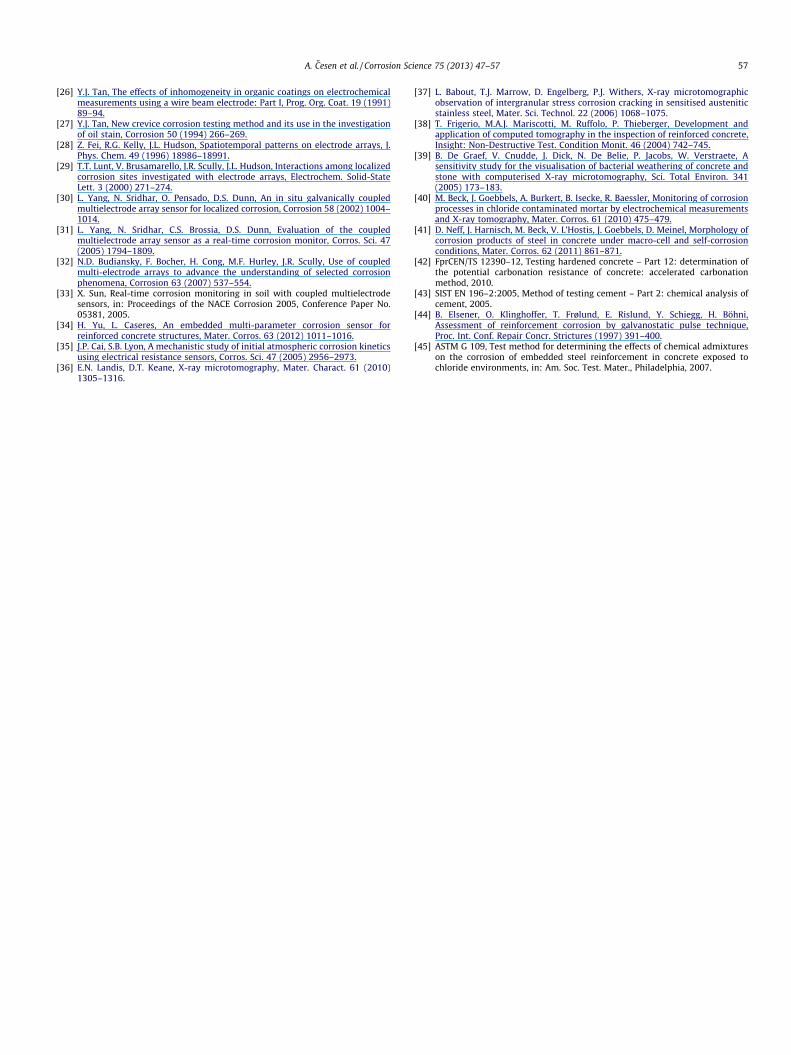
In the last group of specimens, measurements were performedon embedded electrical resistance (ER) probes. Four specimenswere treated with an identical procedure, as all the others. Fig. 8shows the effective thickness measured on the ER probes, andthe corrosion rates estimated as the time derivatives of the thick-nesses. It can be seen that the time resolution of the system wastoo low to be able to observe clear changes in the corrosion ratesduring any single period of wetting and drying (the sampling rateof the measurements was 1 per day). On the other hand, an in-crease in the corrosion rates can be observed. The corrosion ratesduring the first 6 cycles increased significantly from approximately3 lm per year to roughly 20 lm per year. After this, when the spec-imens were exposed to the effect of chlorides, the corrosion ratesincreased rapidly and then remained more or less constant, withina range between 23 and 58 lm per year. It can be seen, however,
array; and (b) selected electrodes (C2 and D2).
Table 1Loss of material in lm3 determined by means of the CMEA and from the X-ray CTscans.
Electrode CMEA X-ray lCT
A4 1.7 � 105 (1.8 ± 0.5) � 105
A5 4.9 � 106 (4 ± 2) � 106
B5 4.6 � 106 (3 ± 1) � 106
C2 7.1 � 106 (9 ± 2) � 106
D1 1.6 � 106 (1.1 ± 0.6) � 106
D2 1.6 � 105 (1.7 ± 0.1) � 105
D3 4.6 � 106 (6 ± 1) � 106
54 A. Cesen et al. / Corrosion Science 75 (2013) 47–57
that not all of the ER probe samples corroded to the same extent:the lowest corrosion rate was measured in the case of specimen4, with an average rate of 23 lm per year during the last 6 cycles,whereas the highest corrosion rate was measured in the case ofspecimen 2, with an average rate of 47 lm per year. It can alsobe seen that the corrosion rates observed during wetting withthe 3.5% NaCl solution were roughly 10 times greater in compari-son with the rates observed during wetting with distilled water.
A selected ER probe (from specimen 2) was investigated bymeans of X-ray CT. The spatial resolution of the CT scans (roughly30 lm) that were performed on the mortar specimen was too lowto be able to detect all the details. On the other hand, numerouscorrosion spots on the resistance element were clearly indicated(Fig. 9a). Due to the multilayer structure of the probe it was notpossible to increase the resolution of the X-ray CT scans. For thisreason a more exact analysis of the probe (with a resolution ofaround 1 lm) was performed after dismantling of the specimen.It was concluded that X-ray CT is a very powerful tool also forthe investigation of corroded surfaces without any cover. Thecross-section of the lead within the ER probe indicated slight gen-eral corrosion, combined with a few deeper pits (Fig. 9b). Some cre-vice corrosion on the protected side (at the bottom) can also beobserved. A top view of the lead clearly confirmed the presenceof minor general corrosion and numerous pits, including a few dee-per ones (Fig. 9c). Although the resolution of the SEM analysis washigher (Fig. 9d), the X-ray CT scans provided a better 3D image. Anexcellent correlation between the two images can be seen.
4. Discussion
Four different methods were used to monitor steel corrosion inmortar specimens exposed to the same wetting and drying treat-
Fig. 8. Reduction of thicknesses and corrosion rates obtained in the ca
ment: galvanostatic pulse measurements, coupling current mea-surements, CMEA, and measurements using ER probes. It is clearthat the results obtained by these methods were, in some cases,comparable, but in other cases they differed significantly. A com-parison of the results, averaged over longer periods, is presentedin Table 2. It can be clearly seen that the corrosion rates obtainedwhen using the GP technique were relatively high, whereas the val-ues estimated from the measured coupled currents were fairly low.The corrosion rates estimated by means of CMEA (i.e. for the entirearray), and by means of the ER probes, were somewhere in between,and quite comparable. There was a similar relationship between themaximum average corrosion rates (see Table 3) during a single wet-ting period, and also between the maximum instantaneous corro-sion rates (see Table 4). The sampling rates for the GPmeasurements, as well as for the measurements with the ER probes,were fairly low, so that the instantaneous corrosion rates were notmuch higher. On the other hand, the maximum corrosion rates ob-tained when using the CMEA (at a single electrode) were very high.
It is clear that one of the main reasons for different observedcorrosion rates is the complexity of the corrosion processes onsteel in mortar, in relation to the limitations of the individualmethods. The currents measured by means of a CMEA directly re-flect the corrosion process over time and in space. Due to this capa-bility measured maximum corrosion rates could be very high, but,with averaging over the whole array over a longer period of time,these values are generally significantly lower. On the other hand,ER probes themselves average the response to localized corrosion,since pitting does not affect the entire cross-section of the lead – atleast not until the cross-section is already significantly reduced.The time response of ER probes is to some degree averaged by asimilar process, except in the case of predominant uniform corro-sion. The limitations of the coupling current measurement methodhave already been mentioned: basically, the method is comparableto CMEA, but the area of the two electrodes used in this method ismuch larger than that in the case of the CMEA sensor. Due to thislarger area, anodic and cathodic sites are frequently not completelyseparated between the two electrodes, so that only a part of thecorrosion current can be measured. The time resolution is, as inthe case of CMEA, defined by the sampling rate.
The galvanostatic pulse (GP) method is commonly used on realconcrete structures, in order to assess corrosion rates at specificlocations. As has already been noted, it was found, in this study,that the measured values were somewhat higher than those
se of measurements using ER probes (4 lines denote 4 samples).

Fig. 9. (a) X-ray CT scans of a corroded resistance element in mortar; (b) cross-section of the corroded lead within the resistance element obtained by X-ray CT scans; (c) topview of the corroded lead obtained by X-ray CT scans; and (d) SEM image of the corroded lead.
Table 2Average corrosion rates in lm/year for all the different measurement methods,showing values obtained over longer periods (6 cycles).
Wetting media GP Coupled current CMEA ER
Distilled water 110 ± 100 1.5 3.7 3–193.5% NaCl solution 470 ± 200 2.1 65 36
Table 3Maximum average corrosion rates during a single wetting period (2 days) in lm/yearfor all the different measurement methods.
Wetting media GP Coupled current CMEAa CMEAb ER
Distilled water 580 12 104 14 263.5% NaCl solution 840 22 3400 195 58
a At a single electrode.b Averaged over the entire array (25 electrodes).
Table 4Maximum instantaneous corrosion rates in lm/year for all the different measurementmethods.
Wetting media GP Coupled current CMEAa CMEAb ER
Distilled water 580 37 300 40 263.5% NaCl solution 840 38 9000 1000 58
a At a single electrode.b Averaged over the entire array (25 electrodes).
A. Cesen et al. / Corrosion Science 75 (2013) 47–57 55
obtained by using other methods. It is assumed that there are twomain reasons for this lack of agreement. In this study the GP mea-surements were performed at the end of each wetting period; atthis particular point the corrosion rates were relatively high any-way, and it is uncertain as to what extent these values could beextrapolated for longer time periods. It is believed that the dynam-ics of corrosion processes in real concrete structures are, in general,more moderate, but frequent measurements are still needed if reli-able assessments of corrosion rates are to be obtained. The secondreason is, presumably, related to the method used to analyse themeasurements: as has already been described, corrosion rateswere obtained by using the Randles approximation of an electro-chemical system (one time constant). There are some indicationsthat, with the growth of corrosion products, this approximationis no longer valid, so that the obtained values are overestimated.Both possible reasons will be one of the subjects of the authors’ongoing investigations.
The results of the study described in this paper clearly showedthat X-ray CT is a very powerful technique for studying the corro-sion of steel in concrete. Contrary to most commonly used meth-ods for the evaluation of corrosion damage, this technique can beused without any damage being caused to the investigated con-crete specimen. This makes it possible to follow the evolution ofcorrosion during the exposure of specimens, and to correlate thecorrosion damage directly to results obtained by using other meth-ods. The capabilities of X-ray CT can be identified from Figs. 3, 7and 9, but the clearest evidence of its effectiveness is presentedin Fig. 10. After the specimen had been dismantled, the CMEA

Fig. 10. CMEA electrodes examined by means of X-ray CT and SEM – (a and b) electrode C2; (c and d) electrode D2.
56 A. Cesen et al. / Corrosion Science 75 (2013) 47–57
was carefully inspected also by SEM. A comparison of the SEMmicrographs and the X-ray CT scans of two of the corroded elec-trodes (C2 and D2) revealed excellent agreement: the boundariesof the pits matched completely within the limits of the method’sresolution (Fig. 10). This means that X-ray CT can be used in con-crete specimens to measure steel corrosion even at the microlevel.Thus, the only deficiencies of X-ray CT are connected to the dimen-sions of the specimen, and to the relatively large amount of timeneeded to perform the measurements.
5. Conclusions
Various techniques were applied to monitor the corrosion pro-cesses of steel in mortar during periodical wetting and drying cy-cles. Besides a group of electrochemical methods, electricalresistance (ER) probes and X-ray computer tomography (CT) wereimplemented. It was found that that the results obtained by thesemethods were generally comparable, but in specific cases they dif-fered significantly.
Corrosion rates obtained when using the GP (galvanostaticpulse) technique were somehow higher than those obtained byusing other methods. Two possible reasons for this lack of agree-ment were suggested. To the contrary with the GP technique, theresults obtained by coupling current measurements generallyunderestimated corrosion rates. X-ray CT indicated that anodicand cathodic areas were distributed at both steel rods, what causedthat only a minor part of corrosion current was measured.
It was confirmed that the used microelectrode array success-fully followed the time and spatial evolution of steel corrosion inmortar. The measured currents revealed the temporal anodic andcathodic activities of the individual electrodes, and detected local-ized corrosion rates. It was found that the distribution of activecorrosion areas within the mortar changed over time, and that usu-ally neighbouring electrodes did not corrode simultaneously. Itwas found that no electrode actively corroded during all the wet-ting periods, and that some electrodes remained passive duringall the cycles.
The electrical resistance probes (ER) can reliably measure theaverage general corrosion rate, but their response to the highdynamics of steel corrosion in mortar was somehow diminished.Capability of these probes to detect predominant localized corro-sion is also limited.
Micro X-ray computed tomography (CT) was found to be a veryeffective, non-destructive tool for the assessment of the corrosionof steel in mortar, including the type and size of damage.
Acknowledgments
Financial support by the Slovene Research Agency (Grant No.1000-08-310067) and by European Commission, project TRIMM,is greatly appreciated.
References
[1] C.L. Page, Mechanism of corrosion protection in reinforced concrete marinestructures, Nature 258 (1975) 514–515.
[2] B.B. Hope, J.A. Page, A.K.C. Ip, Corrosion rates of steel in concrete, Cem. Concr.Res. 16 (1986) 771–781.
[3] C. Alonso, C. Andrade, J.A. González, Relation between resistivity and corrosionrate of reinforcements in carbonated mortar made with several cement types,Cem. Concr. Res. 18 (1988) 687–698.
[4] G.K. Glass, C.L. Page, N.R. Short, Factors affecting the corrosion rate of steel incarbonated mortars, Corros. Sci. 32 (1991) 1283–1294.
[5] J. Broomfield, Corrosion of Steel in Concrete: Understanding, Investigation andRepair, E & FN Spon, London, 1997.
[6] R. Cigna, C. Andrade, U. Nuernberger, R. Polder, R. Weydert, E. Seitz (Eds.), COST521 action: corrosion of steel in reinforced concrete structures, Final Report,European Communities, Luxembourg, 2003.
[7] A. Legat, M. Leban, Z. Bajt, Corrosion processes of steel in concretecharacterized by means of electrochemical noise, Electrochim. Acta 49(2004) 2741–2751.
[8] M. Beck, A. Burkert, J. Harnisch, B. Isecke, K. Osterminski, M. Raupach, P.Schießl, W. Tian, J. Warkus, Deterioration model and input parameters forreinforcement corrosion, Struct. Concr. 13 (2012) 145–155.
[9] B. Elsener, Macrocell corrosion of steel in concrete – implications for corrosionmonitoring, Cement Concr. Compos. 24 (2002) 65–72.
[10] M. Beck, J. Goebbels, A. Burkert, B. Isecke, R. Bäßler, Monitoring of corrosionprocesses in chloride contaminated mortar by electrochemical measurementsand X-ray tomography, Mater. Corros. 61 (2010) 475–479.
[11] M. Raupach, P. Schiessl, Macrocell sensor systems for monitoring of thecorrosion risk of the reinforcement in concrete structures, NDT E Int. 34 (2001)435–442.
[12] G.S. Duffo, S.B. Farina, Development of an embeddable sensor to monitor thecorrosion process of new and existing reinforced concrete structures, Constr.Build. Mater. 23 (2009) 2746–2751.
[13] Y. Schiegg, L. Steiner, Cost effectiveness and application of online monitoringin reinforced concrete structures, Mater. Corros. 61 (2012) 490–493.
[14] S. Feliu, J.A. González, J.M. Miranda, V. Feliu, Possibilities and problems of insitu techniques for measuring steel corrosion rates in large reinforced concretestructures, Corros. Sci. 47 (2005) 217–238.
[15] B. Elsener, Corrosion rate of steel in concrete – measurements beyond the Tafellaw, Corros. Sci. 47 (2005) 3019–3033.
[16] C. Christodoulou, C.I. Goodier, S.A. Austin, J. Webb, G. Glass, On-site transientanalysis for the corrosion assessment of reinforced concrete, Corros. Sci. 62(2012) 176–183.
[17] C. Andrade, M. Keddam, X.R. Nóvoa, M.C. Pérez, C.M. Rangel, H. Takenouti,Electrochemical behaviour of steel rebars in concrete: influence ofenvironmental factors and cement chemistry, Electrochim. Acta 46 (2001)3905–3912.
[18] M. Serdar, L.V. Zulj, D. Bjegovic, Long-term corrosion behaviour of stainlessreinforcing steel in mortar exposed to chloride environment, Corros. Sci. 69(2013) 149–157.
[19] P.C. Searson, J.L. Dawson, Analysis of electrochemical noise generated bycorroding electrodes under open circuit conditions, J. Electrochem. Soc. 135(1988) 1908–1915.
[20] A. Legat, C. Zevnik, The electrochemical noise of mild and stainless steel invarious water solutions, Corros. Sci. 35 (1993) 1661–1666.
[21] R.A. Cottis, M.A. Al-Ansari, G. Bagley, A. Pettiti, Electrochemical noisemeasurements for corrosion studies, Mater. Sci. Forum 189 (1998) 741–754.
[22] J. Kovac, C. Alaux, T.J. Marrow, E. Govekar, A. Legat, Correlations ofelectrochemical noise, acoustic emission and complementary monitoringtechniques during intergranular stress-corrosion cracking of austeniticstainless steel, Corros. Sci. 52 (2010) 2015–2025.
[23] K. Videm, Field and laboratory experience with electrochemical methods forassessing corrosion of steel concrete, Mater. Sci. Forum 289 (1998) 3–14.
[24] A. Legat, Monitoring of steel corrosion in concrete by electrode arrays andelectrical resistance probes, Electrochim. Acta 52 (2007) 7590–7598.
[25] G. Qiao, H. Xiao, G. Sun, Identification of the reinforcing steel’s corrosion statein RC beams based on electrochemical sensor, Sens. Rev. 31 (2011) 218–227.
A. Cesen et al. / Corrosion Science 75 (2013) 47–57 57
[26] Y.J. Tan, The effects of inhomogeneity in organic coatings on electrochemicalmeasurements using a wire beam electrode: Part I, Prog. Org. Coat. 19 (1991)89–94.
[27] Y.J. Tan, New crevice corrosion testing method and its use in the investigationof oil stain, Corrosion 50 (1994) 266–269.
[28] Z. Fei, R.G. Kelly, J.L. Hudson, Spatiotemporal patterns on electrode arrays, J.Phys. Chem. 49 (1996) 18986–18991.
[29] T.T. Lunt, V. Brusamarello, J.R. Scully, J.L. Hudson, Interactions among localizedcorrosion sites investigated with electrode arrays, Electrochem. Solid-StateLett. 3 (2000) 271–274.
[30] L. Yang, N. Sridhar, O. Pensado, D.S. Dunn, An in situ galvanically coupledmultielectrode array sensor for localized corrosion, Corrosion 58 (2002) 1004–1014.
[31] L. Yang, N. Sridhar, C.S. Brossia, D.S. Dunn, Evaluation of the coupledmultielectrode array sensor as a real-time corrosion monitor, Corros. Sci. 47(2005) 1794–1809.
[32] N.D. Budiansky, F. Bocher, H. Cong, M.F. Hurley, J.R. Scully, Use of coupledmulti-electrode arrays to advance the understanding of selected corrosionphenomena, Corrosion 63 (2007) 537–554.
[33] X. Sun, Real-time corrosion monitoring in soil with coupled multielectrodesensors, in: Proceedings of the NACE Corrosion 2005, Conference Paper No.05381, 2005.
[34] H. Yu, L. Caseres, An embedded multi-parameter corrosion sensor forreinforced concrete structures, Mater. Corros. 63 (2012) 1011–1016.
[35] J.P. Cai, S.B. Lyon, A mechanistic study of initial atmospheric corrosion kineticsusing electrical resistance sensors, Corros. Sci. 47 (2005) 2956–2973.
[36] E.N. Landis, D.T. Keane, X-ray microtomography, Mater. Charact. 61 (2010)1305–1316.
[37] L. Babout, T.J. Marrow, D. Engelberg, P.J. Withers, X-ray microtomographicobservation of intergranular stress corrosion cracking in sensitised austeniticstainless steel, Mater. Sci. Technol. 22 (2006) 1068–1075.
[38] T. Frigerio, M.A.J. Mariscotti, M. Ruffolo, P. Thieberger, Development andapplication of computed tomography in the inspection of reinforced concrete,Insight: Non-Destructive Test. Condition Monit. 46 (2004) 742–745.
[39] B. De Graef, V. Cnudde, J. Dick, N. De Belie, P. Jacobs, W. Verstraete, Asensitivity study for the visualisation of bacterial weathering of concrete andstone with computerised X-ray microtomography, Sci. Total Environ. 341(2005) 173–183.
[40] M. Beck, J. Goebbels, A. Burkert, B. Isecke, R. Baessler, Monitoring of corrosionprocesses in chloride contaminated mortar by electrochemical measurementsand X-ray tomography, Mater. Corros. 61 (2010) 475–479.
[41] D. Neff, J. Harnisch, M. Beck, V. L’Hostis, J. Goebbels, D. Meinel, Morphology ofcorrosion products of steel in concrete under macro-cell and self-corrosionconditions, Mater. Corros. 62 (2011) 861–871.
[42] FprCEN/TS 12390–12, Testing hardened concrete – Part 12: determination ofthe potential carbonation resistance of concrete: accelerated carbonationmethod, 2010.
[43] SIST EN 196–2:2005, Method of testing cement – Part 2: chemical analysis ofcement, 2005.
[44] B. Elsener, O. Klinghoffer, T. Frølund, E. Rislund, Y. Schiegg, H. Böhni,Assessment of reinforcement corrosion by galvanostatic pulse technique,Proc. Int. Conf. Repair Concr. Strictures (1997) 391–400.
[45] ASTM G 109, Test method for determining the effects of chemical admixtureson the corrosion of embedded steel reinforcement in concrete exposed tochloride environments, in: Am. Soc. Test. Mater., Philadelphia, 2007.