
Optimal Insurance Purchase Strategies via Optimal Multiple Stopping Times
Upload
khangminh22Category
view
0download
0
OPTIMAL SELECTION AND DESIGN OF A METHANOL PROCESS WITH
ENHANCED CO2 UTILIZATION
A Thesis
by
ABDULRAHMAN SALEH A ALSUHAIBANI
Submitted to the Office of Graduate and Professional Studies of
Texas A&M University
in partial fulfillment of the requirements for the degree of
MASTER OF SCIENCE
Chair of Committee, Mahmoud El-Halwagi
Co-Chair of Committee, Nimir Elbashir
Committee Members, Sam Mannan
Fadwa El-Jack
Head of Department, M. Nazmul Karim
December 2018
Major Subject: Chemical Engineering
Copyright 2018 Abdulrahman Saleh A Alsuhaibani

ii
ABSTRACT
The recent discoveries of significant reserves of shale gas have spurred various
monetization pathways including the production of methanol. There are several routes to convert
shale/natural gas to methanol. The decisions for technology selection and process design were
typically based on techno-economic criterial. Because of the growing interest in reducing the
greenhouse gas emissions of gas processing, carbon footprint is emerging as a primary criterion in
the selection and design of the process. The purpose of this work is to carry out process synthesis,
selection, and design of a shale-gas to methanol process with multiple objectives including
profitability and carbon footprint. Several reforming pathways along with the associated
downstream processing are considered. In addition to the screening of individual types of
reforming, the study also considers combined reforming of methane which incorporates three types
of reforming, namely steam reforming, partial oxidation, and dry reforming. It is desired to
consider existing technologies and to also modify the design of an existing methanol technology
to include combined reforming. Utilization of CO2 is addressed while maintaining the suitable
syngas ratio for methanol synthesis, and minimizing CO2 emissions, waste water generation, and
energy requirements of the overall process. A methanol from natural gas production plant with a
capacity of processing 280 MMSCFD is considered as the base case scenario. The plant employs
conventional reforming (e.g. steam reforming, partial oxidation, or ATR) to generate syngas for
methanol synthesis. Aspen HYSYS is used to simulate the process scenarios and SWROIM is used
to aid determining the ultimate reforming configuration based on economic and sustainability
indicators. Heat and power integration are performed to improve the sustainability and profitability
of the process, through identifying water and heat sinks in the overall design. A techno-economic

iii
analysis of the proposed designs are conducted, including the fixed capital cost, carbon taxes, and
utility requirements. Sensitivity analysis of each proposed design is carried out to assess the impact
of natural gas and methanol prices on the profitability. Additionally, sensitivity analysis is
performed to evaluate the effects of imposing carbon tax and carbon credit regulations.
Keywords: syngas, carbon footprint, integration, design, sustainability.

iv
DEDICATION
To the memory of a leading scholar, a stalwart educator and a caring mentor, Prof. Sam Mannan.

v
ACKNOWLEDGEMENTS
I would like to express my thanks to my academic advisor Prof. Mahmoud El-Halwagi
for his unlimited support, guidance and encouragement throughout my master’s program. I am
honored and sincerely grateful to have Prof. El-Halwagi as my advisor, and for his contribution
to my development on both the professional and personal levels.
I am also thankful for Prof. Elbashir for serving as a co-chair on my committee and for
sharing and providing his insights and thoughts on this research work. Thanks also go to Dr.
Mannan and Dr. Eljack for serving on my committee and sharing their suggestions to improve
the quality of this work.
Also thanks go to my friends, colleagues, department faculty and staff for enriching my
experience throughout this journey, and special thanks go to my friend Ashwin Agarwal for
sharing his thoughts about this work.
Finally, I am grateful and thankful to my parents, Prof. Saleh Alsuhaibani and Munierah
Alsuhaibani as well as my siblings for their unconditional love and support during this journey. I
consider myself fortunate to have my father providing constant feedbacks to help me navigate
through this. I am also thankful to my mother, whom her presence is inspiring and helping me to
excel in this life.

vi
CONTRIBUTORS AND FUNDING SOURCES
Contributors
This work was supported by a thesis committee consisting of the advisor Professor
Mahmoud El-Halwagi, co-advisor Professor Nimir Elbashir of the Department of Chemical
Engineering, Dr. Fadwa Eljack of the Department of Chemical Engineering and Dr. Sam Mannan
of the Department of Petroleum Engineering.
All work for the thesis was completed by the student, under the advisement of Professor
Mahmoud El-Halwagi of the Department of Chemical Engineering and Professor Nimir Elbashir
of the Department of Chemical Engineering.
Funding Sources
Graduate study was supported by a scholarship from Saudi Aramco.

vii
TABLE OF CONTENTS
Page
ABSTRACT .................................................................................................................................... ii
DEDICATION ............................................................................................................................... iv
ACKNOWLEDGEMENTS ............................................................................................................ v
CONTRIBUTORS AND FUNDING SOURCES ......................................................................... vi
LIST OF FIGURES ....................................................................................................................... ix
LIST OF TABLES ......................................................................................................................... xi
1. INTRODUCTION AND BACKGROUND ............................................................................ 1
2. PROBLEM STATEMENT ...................................................................................................... 5
2.1 Objectives ..........................................................................................................................5
3. METHODOLOGY ..................................................................................................................... 6
3.1 Preliminary Screening of conventional Technologies ...........................................................7
3.1.1 Feed Pretreatment ............................................................................................................8
3.1.2 Reforming ........................................................................................................................9
3.1.3 Methanol Synthesis Technologies (4, 5, 25, 30-33) ......................................................14
3.2 Flowsheet simulation ...........................................................................................................18
3.2.1 Feed pretreatment ..........................................................................................................19
3.2.2 Syngas production .........................................................................................................21
3.2.3 Syngas conditioning ......................................................................................................30
3.2.4 Methanol synthesis, synloop and purification unit ........................................................30
3.3 Heat and power integration (H&PI) .....................................................................................31
3.4 Economics ............................................................................................................................31
3.4.1 Raw material ..................................................................................................................32
3.4.2 Total Capital Investment (TCI) .....................................................................................33

viii
Page
3.4.3 Operating costs and Utilities .........................................................................................36
3.5 Profitability ..........................................................................................................................37
3.6 Environmental ......................................................................................................................37
3.7 Safety ...................................................................................................................................39
4. RESULTS AND DISCUSSION ............................................................................................... 40
4.1 Process Economics ...............................................................................................................40
4.1.1 Base Case ......................................................................................................................40
4.1.2 Cases After Applying Heat and Power Integration (HP&I) ..........................................45
4.1.3 Sensitivity Analysis .......................................................................................................47
4.2 Sustainability ........................................................................................................................53
4.3 Safety Analysis ....................................................................................................................56
5. CONCLUSION AND RECOMMENDATION ........................................................................ 57
5.1 Future work ..........................................................................................................................58
REFERENCES ............................................................................................................................. 60
APPENDIX ................................................................................................................................... 64

ix
LIST OF FIGURES Page
Figure 1 Methanol demand by end use (Reprinted from IHS (3)) ................................................. 1
Figure 2 Flowchart showing the approach ..................................................................................... 7
Figure 3 Global methanol Production by Technology (Reprinted from ICI, now J. Matthey) ... 15
Figure 4 Natural gas to methanol process sequance .................................................................... 19
Figure 5 Feed pretreatment unit ................................................................................................... 20
Figure 6 Case 1a ........................................................................................................................... 23
Figure 7 Case 1b .......................................................................................................................... 24
Figure 8 Case 2a ........................................................................................................................... 25
Figure 9 Case 2b .......................................................................................................................... 25
Figure 10 Case 3 .......................................................................................................................... 26
Figure 11 Case 4 .......................................................................................................................... 27
Figure 12 Case 5 .......................................................................................................................... 28
Figure 13 Case 6 .......................................................................................................................... 29
Figure 14 Case 7 .......................................................................................................................... 29
Figure 15 Breakdown for the FCI by equipment type ................................................................. 41
Figure 16 Utilities cost per equipment type - Base case .............................................................. 43
Figure 17 ROI vs production capacity for the different reforming options ................................. 44
Figure 18 Case 1a grand composite curve ................................................................................... 45
Figure 19 Case 1b grand composite curve ................................................................................... 46
Figure 20 Sensitivity analysis for the most profitable case ......................................................... 48
Figure 21 Sensitivity analysis for least profitable case ................................................................ 48

x
Page
Figure 22 Sensitivity analysis for cases (a) 1a (b) 1b (c) 2a (4) 2b ............................................. 51
Figure 23 Sensitivity analysis for cases (a) 3 (b) 4 (c) 5 (d) 6 ..................................................... 52
Figure 24 Relative CO2 emissions by case .................................................................................. 53
Figure 25 Case 1b sensitivity analysis ......................................................................................... 64
Figure 26 Case 2a sensitivity analysis ......................................................................................... 64
Figure 27 Case 2b sensitivity analysis ......................................................................................... 65
Figure 28 Case 3 sensitivity analysis ........................................................................................... 65
Figure 29 Case 4 sensitivity analysis ........................................................................................... 66
Figure 30 Case 5 sensitivity analysis ........................................................................................... 66
Figure 31 Case 6 sensitivity analysis ........................................................................................... 67

xi
LIST OF TABLES Page
Table 1 Mean compositions of gas feedstock ................................................................................ 8
Table 2 Summary of reforming technologies in order to produce syngas ................................... 14
Table 3 Feedstock conditions ....................................................................................................... 19
Table 4 Constraints imposed on the reforming block of the simulation ...................................... 21
Table 5 Reactions and conversion rates for the methanol converter............................................ 31
Table 6 Raw material costs and product sale price ...................................................................... 32
Table 7 Fired heater cost constants .............................................................................................. 34
Table 8 Cost estimation parameters for reformers ....................................................................... 35
Table 9 Hand factor for equipment used in simulation ................................................................ 36
Table 10 Costs of utilities............................................................................................................. 36
Table 11 CO2 emissions sources and the corresponding emission factor .................................... 38
Table 12 MISR and EGP values obtained all design options ...................................................... 40
Table 13 ROI and Utilities cost before and after H&PI ............................................................... 47
Table 14 Economic viability of the reforming cases at various feed and product prices ............ 49
Table 15 CO2 emissions by case after H&PI ............................................................................... 54
Table 16 Waste water recovered and recycled back to the process ............................................. 55
Table 17 The impact of sustainability on the ROI using SWROIM ............................................ 56
1
1. INTRODUCTION AND BACKGROUND
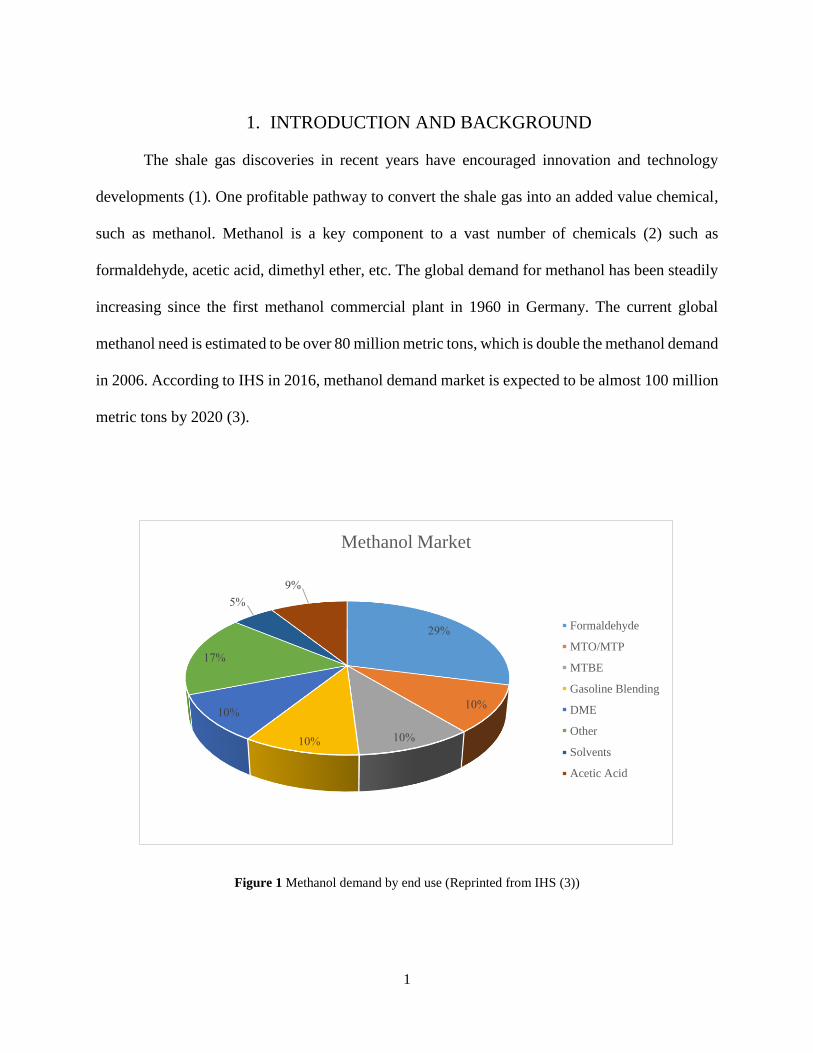
The shale gas discoveries in recent years have encouraged innovation and technology
developments (1). One profitable pathway to convert the shale gas into an added value chemical,
such as methanol. Methanol is a key component to a vast number of chemicals (2) such as
formaldehyde, acetic acid, dimethyl ether, etc. The global demand for methanol has been steadily
increasing since the first methanol commercial plant in 1960 in Germany. The current global
methanol need is estimated to be over 80 million metric tons, which is double the methanol demand
in 2006. According to IHS in 2016, methanol demand market is expected to be almost 100 million
metric tons by 2020 (3).
Figure 1 Methanol demand by end use (Reprinted from IHS (3))
29%
10%
10%10%
10%
17%
5%
9%
Methanol Market
Formaldehyde
MTO/MTP
MTBE
Gasoline Blending
DME
Other
Solvents
Acetic Acid

2
In order to produce methanol, the shale/natural gas goes under catalytic reforming where
syngas at a certain ratio is produced, the syngas is then sent to a reactor where crude methanol is
synthesized. The generation of syngas is an extensive energy process (4), the conventional methods
used are either by using steam reforming, partial oxidation or a combination of both. In steam
reforming, the reformer operates at high temperature >700 oC (5), natural gas is usually used as
fuel to supply heat to the reactor, this method of providing energy generates a large amount of flue
gas containing CO2. For the cases where partial oxidation or auto-thermal reforming options are
chosen, heat maybe produced or the reformer could be thermally balanced. The feed that is
supplied to POx is reacted with high purity oxygen (6), oxygen is supplied by an external air
separation unit. Oxygen processing requires a large amount of energy for the separation of oxygen
from air, thus emitting CO2. In addition, the costs of the reforming unit in a methanol plant
represents around 60% of the overall plant cost (7). The use of the aforementioned conventional
technologies leads to increasing the greenhouse gases, namely CO2 in the atmosphere. The process
of methanol production has gone under a series of developments, starting from improving the
operating conditions of the methanol reactor, to catalyst development and expanding the reforming
options of the natural/shale gas to produce syngas. Yet, the reformer unit is considered the most
energy extensive step among the methanol production train, thus accounting for the majority of
the costs associated with the methanol plant (7, 8).
In recent years, it has become a desire to utilize waste, specifically CO2 as a feedstock and
a source of carbon for fuels and chemicals, to improve the economic and environmental aspects of
the process. Song (9) proposed the new process of tri-reforming, where three types of reforming
are combined in one. The three types are steam reforming of methane (SRM), Partial Oxidation of
Methane (POx) and Dry Reforming of Methane (DRM), where the latter employs CO2 and
3
methane as the primary feedstock. This combination overcomes a number of issues that are
associated with the single reformer options (9, 10), the combined reforming can (i) produce the
desired ratio of syngas (ii) prevent the catalyst deactivation caused by carbon formation (iii) reduce
issues associated with the formation of hot spots on the catalyst. Also, there is no need to pre-treat
the CO2 obtained from the power plant flue gas the (9). Noureldin et al. (11) presented and
developed an equilibrium model that takes into account the economics, energy and environmental
aspects. In addition to the aforementioned benefits, the employment of combined reforming
reduces the carbon footprint (12, 13). Challiwala et al. conducted a combined thermo-kinetic study
investigating different scenarios for combined reformer. The scenarios include the effect of
equilibrium temperature and pressure, addition of steam, addition of oxygen and the simultaneous
addition of steam and oxygen. They determined the optimal feed compositions and conditions for
the reformer with 47.8% conversion of CO2 in the reformer. A techno-economic assessment was
conducted by Julian-Duran et al. (13) examining all the conventional reforming options along with
combined reforming, showing that ATR and POx had the highest economic potential, while CR
had the lowest carbon footprint. Some work have been done in the area of flue gas compositions,
Minutillo and Perna (14) studied the impact of different flue gas compositions on the quality of
syngas composition as well as CO2 emissions. They were able to determine the optimum operating
conditions of the reformer for different types of flue gasses compositions as well as reducing CO2
emissions by 83% for flue gas from a power plant that utilizes natural gas as fuel and 84% for a
flue gas coming from a power plant that utilizes coal as fuel. The same authors also extended their
study (15) to include methanol synthesis part, where they emphasized on the significance and
importance of flue gases compositions containing low concentrations of oxygen. Ng et al. (16)
investigated the economic feasibility of different cogeneration process combinations with either

4
CO2 storage or utilization. They highlighted the techno-economic improvements when CO2 is
being utilized and converted into methanol through combined reforming rather than storing the
CO2. Zhang et al. (17) developed a flowsheet for the production of methanol from methane and
CO2 via combined reforming, as well as performing heat integration to reduce the costs of the
process. They also highlighted the differences between combined reforming and steam reforming
in terms of energy requirement and methanol production. Dwivedi et al. (18) modified the
flowsheet that was developed by Zhang et al. (17) in order to improve the process outputs. They
performed two major modification that resulted in four different scenarios. The first modification
was adjusting the reformer pressure in order to reduce the reactor volume. The second change was
installing a water separation unit after the reformer to eliminate water prior to the methanol
synthesis section since water reduces the catalyst activity (19-21) thus lowering methanol
conversion.
The purpose of this study is to enhance the economics and environmental aspects of an existing
methanol plant through process synthesis, selection, and design. CO2 is utilized as a feedstock for
the production of syngas. Different shale gas reforming options are screened, investigated and
modified to determine the optimal design of the reforming unit. Mass and energy integration
analyses are performed through identifying water and heat sinks to enhance the sustainability and
to make the process economically attractive. Aspen HYSYS is used to simulate the process
flowsheet, SWROIM is used to determine the ultimate configuration option based on economic
and sustainability indicators. A detailed economic analysis is performed, including the fixed
capital investment, carbon taxes, and energy requirements.

5
2. PROBLEM STATEMENT
An existing methanol production plant with a capacity of processing 280 MMSCFD of
shale gas, utilizes a conventional reforming technology to produce syngas. It is desired to retrofit
the plant by including other forms of reforming (e.g., dry reforming) to reduce carbon footprint,
and to increase the profitability and the sustainability of the process. In additions, determine the
impact of the fluctuations of shale gas and product prices. The effect of carbon tax and carbon
credit is addressed.
2.1 Objectives
Maintain the desired syngas ratio and stoichiometric number at the levels that are suitable
for methanol synthesis
Perform economic analyses on the final designs to determine the feasibility of the each
proposed reforming design
Identify mass and energy integration opportunities in the process that arise from produced
flowsheets
Assess sustainability of the final proposed designs

6
3. METHODOLOGY
A methanol plant that utilizes conventional reforming technology (e.g. steam reforming,
partial oxidation, etc.) as the primary source for syngas is considered for modifications, where
other forms of syngas production are incorporated in the design, to enhance CO2 utilization while
maintaining the desired syngas ratio required for methanol synthesis. Several designs for methanol
production using different reforming pathways are proposed and evaluated from an economic and
environmental prospective. The considered reforming technologies in this study includes Partial
Oxidation (POx), Dry Reforming (DRM), a combination of steam reforming and partial oxidation
which is known as autothermal reforming (ATR), and a combination of steam, partial oxidation
and dry reforming which is referred to as Combined Reforming (CRM). The approach is divided
into five major steps (i) preliminary screening of conventional methanol plants including the
syngas production unit (ii) flowsheet simulation using Aspen HYSYS and the validation of the
flowsheet (iii) flowsheet modification where one or more of the aforementioned technologies are
involved in the production of syngas (iv) mass and heat integration (v) comprehensive economic
and environmental assessment of each proposed scenario and give recommendations.

7
Modify the conventional reformer block to
incorporate CO2 utilization and generate
various reforming configurations
Construct methanol process flowsheet using
Aspen HYSYS
Perform a heat and power integration on the
proposed design configurations
Conduct detailed economic and sustainability
evaluation on the proposed process flowsheets
Design recommendation
Assess and quantify the economics and
sustainability indicators of all reforming
options
Figure 2 Flowchart showing the approach
3.1 Preliminary Screening of conventional Technologies
The production of methanol from natural/shale gas starts by removing impurities such as
hydrogen sulfide (H2S). The next step is reforming, where syngas is produced, depending on the
process conditions and reforming option, if the syngas is produced at the desired ratio then no
conditioning step is needed. However, if the syngas ratio is more/less than the desired ratio, then
8
the conditioning step is required (e.g. WGS). Once the obtained syngas has the desired ratio, the
feed is compressed and fed to a methanol converter, where crude methanol is produced. Finally,
methanol is purified to produce grade product methanol through the use of distillation.
In this Overview, various reforming and syngas production routes are introduced and discussed in
depth along with most common commercialized technology to convert syngas to methanol.
3.1.1 Feed Pretreatment
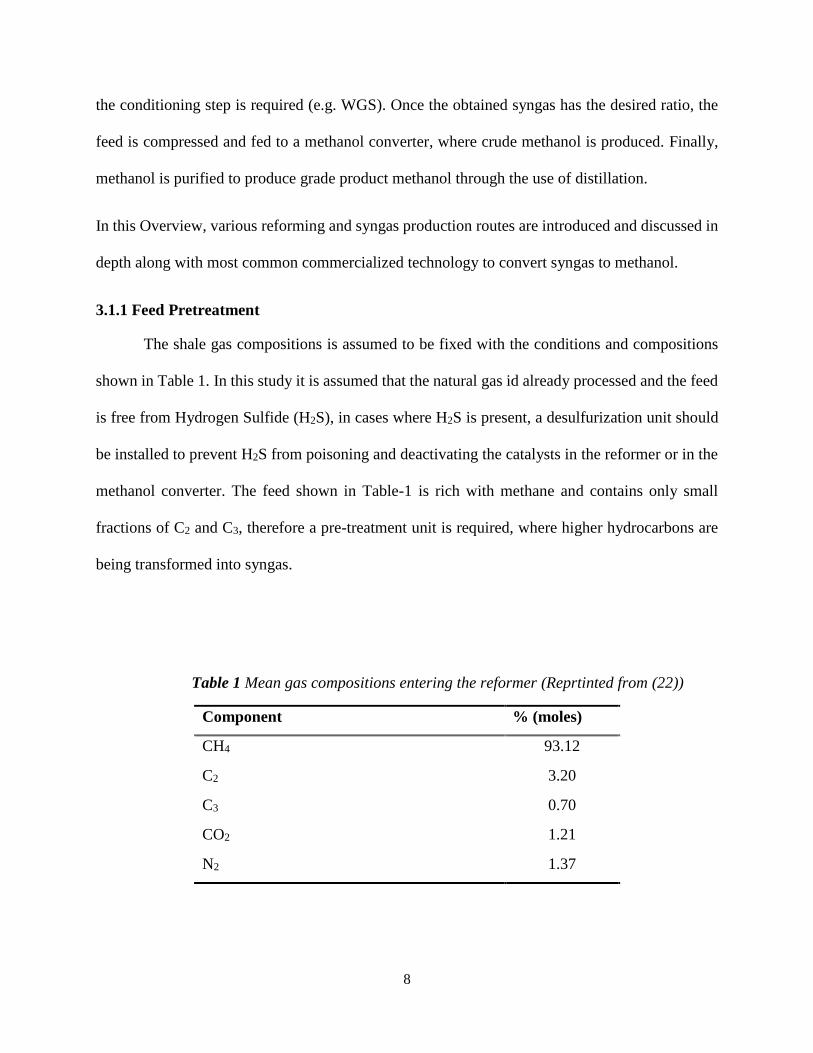
The shale gas compositions is assumed to be fixed with the conditions and compositions
shown in Table 1. In this study it is assumed that the natural gas id already processed and the feed
is free from Hydrogen Sulfide (H2S), in cases where H2S is present, a desulfurization unit should
be installed to prevent H2S from poisoning and deactivating the catalysts in the reformer or in the
methanol converter. The feed shown in Table-1 is rich with methane and contains only small
fractions of C2 and C3, therefore a pre-treatment unit is required, where higher hydrocarbons are
being transformed into syngas.
Table 1 Mean gas compositions entering the reformer (Reprtinted from (22))
Component % (moles)
CH4 93.12
C2 3.20
C3 0.70
CO2 1.21
N2 1.37

9
3.1.2 Reforming
The pre-treated gas is then sent to a steam reformer where the production of syngas takes
place. As mentioned above, the energy consumption of the reformer unit is generally high, which
results in emitting large quantities of CO2 through flue gas. To overcome the large energy
requirements, some commercialized methanol technologies combine two types of reforming where
endothermic and exothermic reactions are carried out in either one or two reactors, these two
reactions are SMR and Partial Oxidation of Methane (POx). The combination where SMR and
POx are combined in one reactor is called Auto-Thermal Reforming (ATR) and is used to offset
the extensive energy required by SMR, since POx produces heat as the reaction proceeds. In most
cases where ATR is used the reactor can sustain the required energy from the exothermic reaction.
Although ATR may not require an energy output, a great deal of energy have been already
consumed in order to separate the high purity oxygen from air in the Air-Separation-Unit (ASU),
before it is being sent to the reformer (23). Another distinguished type of reforming is called Dry
Reforming of Methane (DRM). Although DRM uses CO2 as feedstock the net carbon emission is
positive, since the reaction is highly endothermic and requires a massive amount of energy in order
for the reaction to be favored. An additional drawback of DRM usage in a methanol plant is the
poor syngas quality that is obtained from DRM.
In some plant designs, a secondary reactor is added to aid in the primary reformer in
converting the feed into syngas and to help prevent coke formation (4). The secondary reactor
could be installed before (pre-reformer) or after (post reformer). In the case of pre-reformer, higher
hydrocarbons are converted into methane in a lower temperature than that of regular reformer due
to the relative simplicity of breaking the bonds of higher hydrocarbons, the hydrocarbon reactivity
has been suggested as follows (24):

10
Cyclohexane > trimethylbutane > n-butane & n-decane > n-heptane > ethane > benzene >
methane
The post reformer converts the methane residuals thus reducing the cost through increasing the
capacity. Another technique to increase the capacity of the primary reformer is to recover the heat
from the effluent stream via preheating primary reactor feed. An important variable of the process
is the Steam-to-Carbon ratio or S/C, which has a significant impact on the carbon formation on the
catalyst surface (4).
As mentioned above, there are multiple options to choose from for the reforming of
natural/shale gas. There is no best route to produce syngas. However, there are practical routes and
designs which depend on the project needs and the available resources (5). Typically, a nickel
based catalyst is used for in the reformer (4). Each reforming type produces a certain syngas ratio
that is characterized by the following formulas:
S =moles H2−moles CO2
moles CO+ moles CO2 (1)
R =H2
2×CO+3 ×CO2 (2)
Where S is stoichiometric number and R is syngas ratio.
For methanol synthesis, the suitable syngas ratio should be around one and stoichiometric
number equals to or slightly over two. In cases where the syngas ratio or stoichiometric number
go over one and two, respectively, this indicates hydrogen surplus (or carbon deficiency). On the
other hand, if the syngas ratio falls below 1 and stoichiometric number is under 2, excess CO
and/or CO2 is present in the feed stream.

11
In this study steam reforming is chosen to work at an elevated temperature and high steam
to carbon ratio (S/C) when excess hydrogen is needed to achieve the specified syngas and
stoichiometric ratios. However, it is important to note that varying the temperature and the amount
of steam that is fed to the reformer can lead to WGS or RWGS reactions to occur, thus altering
syngas ratios. For partial oxidation, the reformer herein is chosen to work as an adiabatic reformer
and at elevated pressure. The generation of H2 and CO is favored at higher temperatures, and since
this reformer works adiabatically the temperature was adjusted through adjusting O2 that is being
fed to the reactor, oxygen to methane ratio being below 1 in all the proposed cases, in order to
produce the required syngas ratio. In cases where DRM is involved the ratio of CO2 to methane
tends to be around one, the syngas ratio and stoichiometric number is controlled through adjusting
the amount of methane that is sent to DRM. For combined reforming, the ratio of syngas produced
in this type reformers follows the same behavior specified by Noureldin et al. (11), where O2 goes
to a complete conversion and it reduces the syngas ratio while providing energy, where steam
enhances H2 and therefore enhancing syngas quality, while dry reforming produces more CO. The
last two reforming types require energy input. All of these considerations are taken into account
when simulating case 7. Challiwala et al. (12) also conducted a study on combined reforming,
showing that energy requirement is lowered by the addition of O2, and syngas quality is enhanced
by the addition of steam. Since the combined reforming works under adiabatic conditions some
modifications are imposed as a result of this constraint.
3.1.2.1 Steam Reforming of Methane (SRM)
Steam reforming (R-1) is the most conventional route among the other options, whereas
natural gas is preheated by the flue gas from the fired heater prior to entering the reformer and
react with steam.
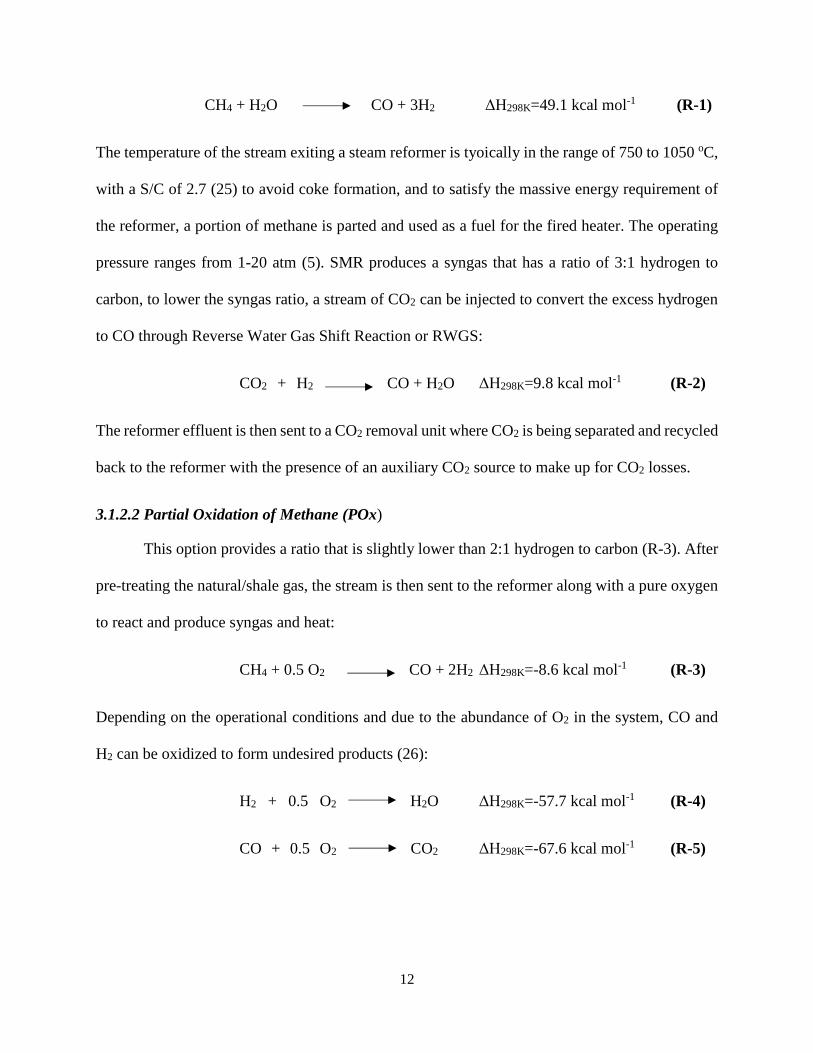
12
CH4 + H2O CO + 3H2 ΔH298K=49.1 kcal mol-1 (R-1)
The temperature of the stream exiting a steam reformer is tyoically in the range of 750 to 1050 oC,
with a S/C of 2.7 (25) to avoid coke formation, and to satisfy the massive energy requirement of
the reformer, a portion of methane is parted and used as a fuel for the fired heater. The operating
pressure ranges from 1-20 atm (5). SMR produces a syngas that has a ratio of 3:1 hydrogen to
carbon, to lower the syngas ratio, a stream of CO2 can be injected to convert the excess hydrogen
to CO through Reverse Water Gas Shift Reaction or RWGS:
CO2 + H2 CO + H2O ΔH298K=9.8 kcal mol-1 (R-2)
The reformer effluent is then sent to a CO2 removal unit where CO2 is being separated and recycled
back to the reformer with the presence of an auxiliary CO2 source to make up for CO2 losses.
3.1.2.2 Partial Oxidation of Methane (POx)
This option provides a ratio that is slightly lower than 2:1 hydrogen to carbon (R-3). After
pre-treating the natural/shale gas, the stream is then sent to the reformer along with a pure oxygen
to react and produce syngas and heat:
CH4 + 0.5 O2 CO + 2H2 ΔH298K=-8.6 kcal mol-1 (R-3)
Depending on the operational conditions and due to the abundance of O2 in the system, CO and
H2 can be oxidized to form undesired products (26):
H2 + 0.5 O2 H2O ΔH298K=-57.7 kcal mol-1 (R-4)
CO + 0.5 O2 CO2 ΔH298K=-67.6 kcal mol-1 (R-5)

13
The reformer operates at a high temperature and pressure 1200oC and >50 atm, respectively (5,
27, 28), therefore a further compression of syngas for the methanol converter is not required. The
heat generated from this reaction could be recovered to generate steam.
3.1.2.3 Auto-Thermal Reforming (ATR)
A combination of steam reforming (R-1) and partial oxidation of methane (R-3), this
reforming option doesn’t require nor produce excess heat. These reactions can be carried-out
simultaneously in one reactor or in separate reactors (a primary and a secondary reactor). The
syngas ratio varies and can be adjusted by adjusting the load on each reactor. This type of reformers
can produce just the suitable syngas quality for methanol synthesis.
3.1.2.4 Dry Reforming of Methane (DRM)
This reformer utilizes CO2 as a feedstock and follow the chemical reaction (R-6):
CH4 + CO2 2CO + 2H2 ΔH298K=247 kcal mol-1 (R-6)
R-6 is a highly endothermic reaction, a fired heater is required to maintain the high temperature of
the reformer. Syngas ratio obtained from DRM reaction is close to unity, a further syngas condition
is required to achieve the desirable ratio of 2:1 hydrogen to carbon to synthesize methanol.
3.1.2.5 Combined Reforming of Methane (CRM)
This type of reforming utilizes R-1, R-3 and R-6. Based on the objectives and the
requirements of the process, reactor configuration can be modified to carry out the reactions. One
possible configuration could be coupling steam reforming in parallel with dry reforming and no
partial oxidation (29). The produced syngas ratio varies, and it depends on the feed composition
ratios. A number of studies have revealed the potential of CRM in utilizing up to 90% of total CO2
fed to the reformer and a net CO2 reduction of up to 67% (14, 17, 29), and reducing the overall

14
heating requirements of the reforming section (12). Table 2 summarizes the aforementioned
reforming technologies:
Table 2 Summary of reforming technologies in order to produce syngas
Reformer Type Reaction set ΔH Syngas ratio (Hydrogen-to-Carbon)
Steam Reforming R-1 Endothermic 2.8-3.0
Partial Oxidation R-2 Exothermic Below 2
Dry Reforming R-3 Endothermic 1.0
Auto-thermal Reforming R-1 and R-2 ~0 Varies, can be adjusted to 2.0
Combined Reforming R-1, R-2 and R-3 Endothermic Varies, can be adjusted to 2.0
3.1.3 Methanol Synthesis Technologies (4, 5, 25, 30-33)
For methanol synthesis from natural/shale gas, there is a number of different technologies
that have been already established and commercialized such as Lurgi Low Pressure (LLP)
methanol synthesis, Imperial Chemical Industry-Low Pressure (ICI-LP) methanol synthesis and
Mitsubishi Gas Company (MGC) technology. All the aforementioned technologies have the same
process train sequence, starting from natural/shale gas desulfurization, followed by reforming of
methane, to methanol synthesis and finally methanol distillation or purification.

15
Figure 3 Global methanol Production by Technology (Reprinted from ICI, now J. Matthey)
Although, these technologies may or may not use the same reforming route and purification
technology, the main difference arises in the methanol synthesis block. Each company has its own
reactor design, operating conditions and synthesis loop to fresh recycle ratio (synloop) at which
the methanol is produced, however, all the technologies utilizes copper based catalyst. These three
technologies combined represent about 96% of methanol global capacity in today’s world. The
characteristics of each technology are discussed in the following sections.
3.1.3.1 Imperial Chemical Industries (ICI)
In 1966, ICI introduced the new concept of low pressure methanol synthesis by developing
Cu-oxide catalyst, which also decreased the required reactor temperature. This leap reduced the
cost of methanol production, given that lower pressure rated equipment and energy is needed for
the process. The process used steam reforming (800-850oC) to produce syngas, and since the

16
hydrogen carbon ratio of steam reforming is higher than 2, a syngas conditioning shift was used to
adjust the ratio to around 2. The excess heat of the conditioned syngas was recovered by a steam,
which was used to power the compressor in order to compress the conditioned syngas as well as
the feed for the reformer. Once the conditioned syngas was compressed, it is then combined with
synloop and sent to a quench reactor to be converted into methanol. The ratio of fresh syngas to
synloop was typically1 to 5. The feed entered the quench reactor from the top and the pressure
temperature of the reactor were between 50-100 atm and 250-300oC, respectively. The converter
consisted of a multiple beds and operated adiabatically, as the reaction carried out in the reactor it
was quenched several times by a quench gas to maintain the reactor temperature. The heat of this
reaction was recovered at the bottom of the reactor. After that, crude methanol and water were
condensed from other gaseous which were partially purged and the rest were sent back to synloop.
In a more sophisticated design, CO2 would be fed directly to the steam reformer, it is true that only
a fraction of CO2 reacted to form syngas, however, this technique did not require syngas
conditioning step. The exiting syngas from the latter design would go under amine absorption
process where CO2 is captured and recycled back to the reformer. An auxiliary CO2 source is
present to make-up for the lost CO2.
3.1.3.2 Lurgi Low Pressure (LLP)
The next technology that produces methanol from natural gas is LLP. In this process, the
natural gas which contains higher hydrocarbon components undergoes a pre-reformer where the
higher hydrocarbon are converted to methane prior to entering the primary reformer which his
basically an auto-thermal reformer. The pre-refomer is typically operated in lower temperature
ranges than that of the primary reformer. Once the stream is mostly methane, it combined with
steam before entering the auto-thermal reformer, whereas an oxygen is being fed as well. The auto-

17
thermal reforming operates in a temperature range of 100-1400oC, and a pressure up to 80 bar. The
produced syngas ratio is adequate for methanol synthesis. Since the auto-thermal reformer operates
in a relatively high pressure, there is no need to compress the syngas prior to entering methanol
converter. The Lurgi’s isothermal reactor has and internal design of shell and tube, such that the
catalyst is loaded and the reaction is carried out in the tube side, while steam is fed to shell side to
recover the heat from the exothermic reaction. The reactor effluent is then condensed to recover
crude methanol and water and sent to the purification section to produce the desired grade of
product methanol. While the other gaseous are partially purged, and the rest are compressed and
recycled back to the converter. The fresh feed to synloop ratio is 1 to 5 which is almost similar to
that in ICI synloop. In a more recent advancement, Lurgi announced its MegaMethanol TM
technology where Lurgi claims that it has a significant cost reduction and improved process
efficiency by doubling the capacity of methanol production and by introducing the dual methanol
reactors.
3.1.3.3 Mitsubishi Gas Company Technology (MGC)
The Mitsubishi technology to produce methanol from hydrocarbon is almost similar in the
reforming part as the other aforementioned technologies. The raw gas entering the process is
desulfurized prior to the reforming step. MGC technology utilizes a steam reformer to produce
syngas at 850oC, the required heat is being supplied to the reformer through natural gas as well as
through excess hydrogen from methanol converter and synloop. Once, the syngas exits the
reformer a heat recovery unit is installed to cool down the syngas temperature before compressing
it for the methanol converter. The compressed gas is mixed with the recycled gas from the synloop
before it is being fed to the reactor. The methanol reactor is a double bed quench-type reactor and
utilizes a copper based catalyst. This reactor design includes a heat recovery step in an intermediate

18
stages to capture the reaction heat. The effluent stream from the reactor is condensed to separate
crude methanol from other gasses. The latter goes partially under purging to prevent accumulation
of inerts in synloop. Once crude methanol is separated, it is sent to a distillation column to obtain
the desired methanol grade. Depending on the feedstock and process requirements, some MGC’s
processes employs auto-thermal reforming along with steam reforming to produce syngas.
3.2 Flowsheet simulation
In this stage of the study, a base case flowsheet that utilizes steam reforming is developed
using data from the literature. Once the simulation is performed, the inputs and outputs of the
process are compared to the literature in order to validate the simulation. Each produced process
scenario is modified and developed independently using the base case flowsheet to insure
consistency. The available feedstock conditions are shown in table 3.
The process sequence of all the proposed cases is kept unchanged figure 4, meaning that
no extra treatment unit is added nor removed. The process starts with pretreating natural gas prior
to sending the feed to a fired heater, where reactant are brought to the desired temperature of
reforming. The heated natural gas is then sent to the reforming unit, where one or more reformers
are present. The natural gas is then distributed to the reformers along with the required reactants
(e.g. steam, oxygen, etc…).
The produced syngas is then combined and cooled, where excess water is removed. An
intercooled compression stage is implemented to compress syngas to the desired pressure. The
compressed syngas is mixed with unreacted/recycled syngas from methanol reactor. The mixed
feed is fed to the reactor where methanol is formed. Reactor effluent is expanded to allow for crude
methanol recovery using a flash column. A fraction of the unreacted gaseous is purged and the rest

19
is compressed using an intercooled compression stage prior to mixing it with the fresh feed. Crude
methanol containing high concentration of water and impurities is sent to a distillation column,
where a high purity (99.0wt%) methanol is obtained.
Table 3 Feedstock conditions
Raw Material T (oF) P (psia)
Shale gas 85 20
Steam 520 230
Oxygen 138 435
CO2 120 310
Air 77 14.7
Figure 4 Natural gas to methanol process sequance
3.2.1 Feed pretreatment
The feed of natural/shale gas is assumed to be preprocessed in a nearby facility before it is
sent to the methanol plant. The preprocessing step involves acid gas removal, in order to prepare
the feed for the pretreatment of a methanol production. The pretreatment section of methanol plant
is shown in the figure 5. The first step in the pretreatment section is to saturate natural gas before
it enters the first heat exchanger, where the temperature is raised to 720 F.
Natural Gas
TreatmentFeed Treated NG
Reforming of
Natural GasSyngas
Methanol
SynthesisDistillationCrude Methanol >90 %wt. Methanol

20
Prereformer
WASH WATER
FeedTo The
Fired Heater
Figure 5 Feed pretreatment unit
The performer operates adiabatically and cracks down C2+ to hydrogen and CO in order to
prevent the formation of coke when the feed is sent to the primary reformer at an elevated
temperature (34). A stoichiometric (or a converter) block is used to model the pre-reformer and
assuming 100% conversion of C2+ and heavy hydrocarbons to syngas. The ratio of steam to carbon
that is fed to the reactor is based on the following chemical reaction (34):
CnH2n+2 + nH2O nCO + (2n+1)H2 (R-7)
For most cases, the pre-reformed feed is sent to a fired heater in order to heat the prior to
reforming. In some cases, especially when a reformer operates at a relatively high pressure (e.g.
partial oxidation), the pre-reformed feed undergoes a multistage compression with an intercooler
in between before bringing the feed to the desired inlet temperature of the reactor. Fired heater
operates at an efficiency of 75%, and it uses natural gas as fuel. Air supplied to the reactor is
compressed to 20 psia and heated to 350 F to increase and maintain the efficiency of the fired
heater. The fuel and air flow to the heater is adjusted using the “adjust” tool by HYSYS, in order

21
to maintain the temperature of the hot stream at 1300 F. When heat integration is performed, heat
from flue gas is recovered through cooling the flue gas (hot stream) to 250 F.
3.2.2 Syngas production
The syngas production section is the part that this study is most concerned with. The feed
coming from the pre-treatment section is divided and distributed to different reformers with certain
ratios based on the on the configuration. Seven designs are produced and investigated herein, and
in order to have a fair comparison and assessment between all the configurations, some constraints
are implemented for simulation parameters, these constrains are shown in the following table.
Table 4 Constraints imposed on the reforming block of the simulation
Reforming Section Constraints
All reforming scenarios Configurations must include a form of CO2 utilization
(CO2 being fed as a reactant). Syngas ratio:
0.9<R<1.1. Stoichiometric number: 1.8<SN<2.2
Steam Reforming Inlet T: 1300 F, outlet T: 1600 F. Pressure: 20 psia
Additional heat is supplied through an external source
Partial Oxidation Inlet T: 700 F, outlet T: ~2000 F. Pressure: 310 psia
Adiabatic
Dry Reforming Inlet T: 1300 F, outlet T: 1600 F. Pressure: 20 psia.
Additional heat is supplied through an external source
WGS Inlet T: 480, outlet T:450 . Pressure: 20 psia
Autothermal Reforming Inlet T: 1450 F Outlet T:~2000 F. Pressure: 310 psia
Adiabatic
Combined Reforming Inlet T:2200 F, outlet T: ~1600 F. Pressure: 310 psia
Adiabatic

22
All reformers are modeled using Gibbs block (12, 14, 16), where the equilibrium compositions are
calculated through the minimization of the total Gibbs free energy:
𝑮𝒕 = ∑ 𝒏𝒊𝑮𝒊𝒐 + 𝑹𝑻 ∑ 𝒏𝒊𝒍𝒏
𝒇𝒊
𝒇𝒊𝒐
𝑵𝒊=𝟏
𝑵𝒊=𝟏 (3)
Other fluids packages can be used including Peng-Robinson-Boston-Mathias (PRBM) which
showed no significant differences in syngas production when compared to PR as reported by
Zhang et al. (17), and Peng-Robinson-Stryjek-Vera (35, 36) which accounts and predicts the non-
ideality of the system in methanol synthesis (37). However, when the water-gas-shift reactor is
used, an equilibrium block is used with the following expression (34):
KWGS=exp[(4578/T) - 4.33] (4)
It is assumed that there is no pressure drop in heat exchangers across the process. Also, all
compressor have a compression ratio no larger than 4. The designs and specifications of the seven
reforming pathways are shown in great details in the following section, and it is worth mentioning
that all co-reactants to methane ratios shown here are in molar basis, unless otherwise specified.
3.2.2.1 Case I
This scenario utilizes steam and dry reforming technologies for the production of syngas. Two
possible configurations could be obtained from this combination which are shown figure 6 and figure 7.
The load assigned to each reforming in both configurations is the same. In configuration 1a, the ratio of
methane entering steam reformer to methane entering dry reformer is 0.6:0.4, meaning that the steam
reformer is assigned for the 60% of the load in reforming section, while dry reforming has the rest of 40%.
In configuration 1b, a slight modification is added, where the two reforming technologies are combined
into one reactor, however, the flowrates of steam and CO2 fed to the reactor stays same as in 1a. Thus the
same load distribution applies here, where 60% of reforming is done by steam reforming and the rest is by

23
dry reforming. The ratio co-reactants (steam and CO2, in this case) are adjusted until the syngas ratio and
stoichiometric number are met, and the ratio of steam to methane and CO2 to methane are 2:1 and
1:1, respectively.
Feed from The
Fired HeaterSMR
DRM
Steam
CO2
Crude
Syngas
Figure 6 Case 1a

24
SMR & DRM
Steam
CO2
Crude
Syngas
Pretreated
Feed
Figure 7 Case 1b
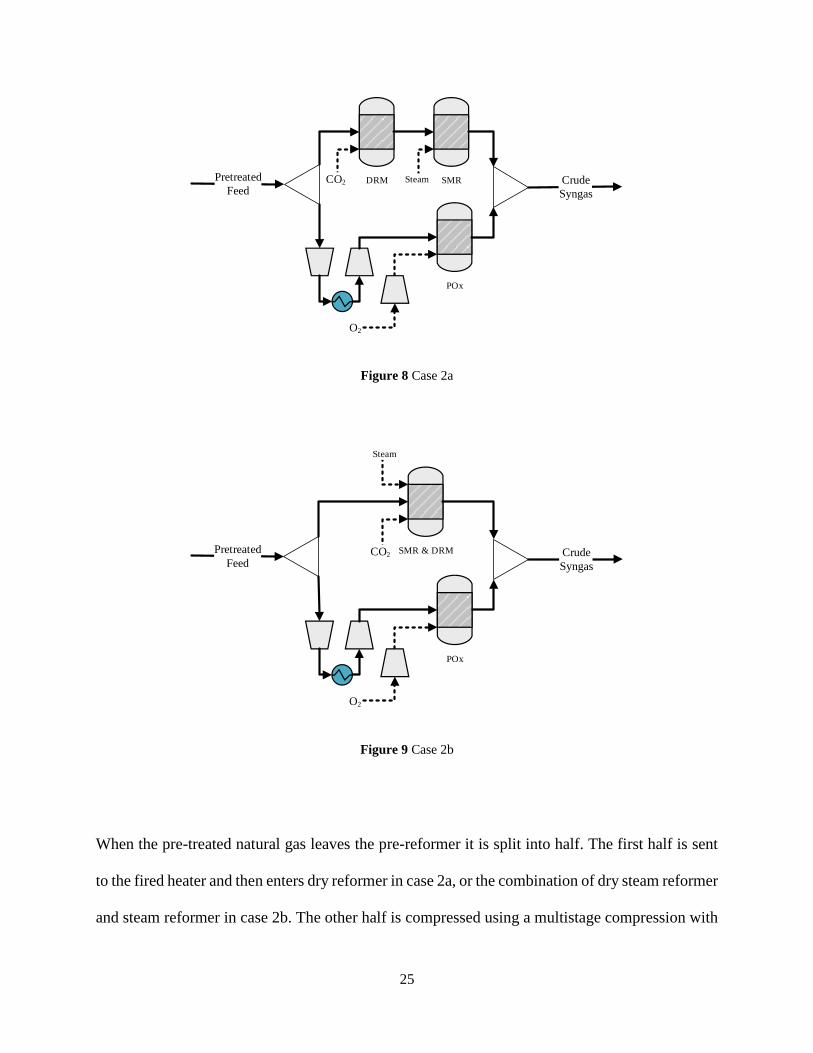
3.2.2.2 Case II
Three reforming technologies are utilized in this case, and two configurations are obtained.
The first configuration implements a partial oxidation reformer in parallel to dry reforming that is
in series with steam reforming as shown in figure 8. The second option combines dry and steam
reforming in one reactor, while leaving partial oxidation parallel.
25
Pretreated
FeedDRM
POx
CO2 Crude
Syngas
O2
SMRSteam
Figure 8 Case 2a
Pretreated
Feed
SMR & DRM
POx
CO2 Crude
Syngas
O2
Steam
Figure 9 Case 2b
When the pre-treated natural gas leaves the pre-reformer it is split into half. The first half is sent
to the fired heater and then enters dry reformer in case 2a, or the combination of dry steam reformer
and steam reformer in case 2b. The other half is compressed using a multistage compression with

26
an intercooler in between. Once the feed is compressed its temperature increases to the desired
temperature of partial oxidation reformer. Co-reactants ratio to methane is the same for both
configurations, where steam-to-methane is 1:1, oxygen-to-methane is 0.6:1, and CO2-to-methane
is 0.4:1.
3.2.2.3 Case III
This scenario implements three reforming technologies is parallel to each other, as shown
in figure 10. 83% of the pre-reformed gas is fed to the fired heater, where 58% percent of it is sent
steam reforming and the remaining 42% to dry reforming. The unused pre-reformed gas is
compressed prior to feeding it partial oxidation.
Pretreated
Feed
SMR
DRM
Steam
CO2
Crude
Syngas
POx
O2
Figure 10 Case 3
Co-reactatns to methane ratios in this scenario are 2.5:1 steam-to-methane, 0.7:1 oxygen-to-
methane, and 1:1 CO2-to-methane.

27
3.2.2.4 Case IV
The reforming configuration in Case 4 is shown in figure 11. Heated natural gas from the
fired heater is divided into two streams, the first feed stream which is three quarters of heated
natural gas from the furnace goes to steam reforming, and steam-to-methane ratio that is fed to the
reformer is 0.6:1. This ratio is significantly lower than any of the scenario mentioned earlier, this
is due to dividing the reforming load of this stream between steam reforming and partial oxidation.
Around 60% is reformed by steam reforming and the remaining is done by the subsequent partial
oxidation reformer. A cooler is installed just after steam reforming in order to cool down the feed
before the multistage compression. The rest of heated methane exiting the furnace is sent to dry
reforming with a ratio of 1:1 carbon-to-methane ratio.
Pretreated
Feed
SMR
DRM
Steam
CO2
POx
O2
Crude
Syngas
Figure 11 Case 4

28
3.2.2.5 Case V
This reforming configuration is similar to the one of case IV with a minor modification. A water
gas shift reactor is installed after dry reforming, although case IV is able to achieve the
requirements of syngas that are specified earlier, water gas shift is able to enhance syngas ratio R
but not the stoichiometric number. The flowsheet of this scenarios is shown in the following figure.
3.2.2.6 Case VI
Autothermal reforming is implemented in parallel with dry reforming. Steam and oxygen are being
fed to the autothermal reformer with the same ratio of 0.55:1 for both steam-to-methane and
oxygen-to-methane ratios. The portion of Natural gas leaving pre-treatment section to the
autothermal reforming is compressed through a multistage compression and then heated using heat
exchanger. The load of autothermal reforming in this configuration is 90%, while the rest is done
by dry reforming. CO2-to-methane ratio is set to 0.75:1 in order to satisfy the constraints of syngas
quality. The flowsheet of this reforming combination is shown in figure 13.
Pretreated
Feed
SMR
DRM
Steam
CO2
POx
O2
Crude
Syngas
WGSSteam
Figure 12 Case 5
29
Pretreated
Feed
DRM
ATR
CO2 Crude
Syngas
O2
Steam
Figure 13 Case 6
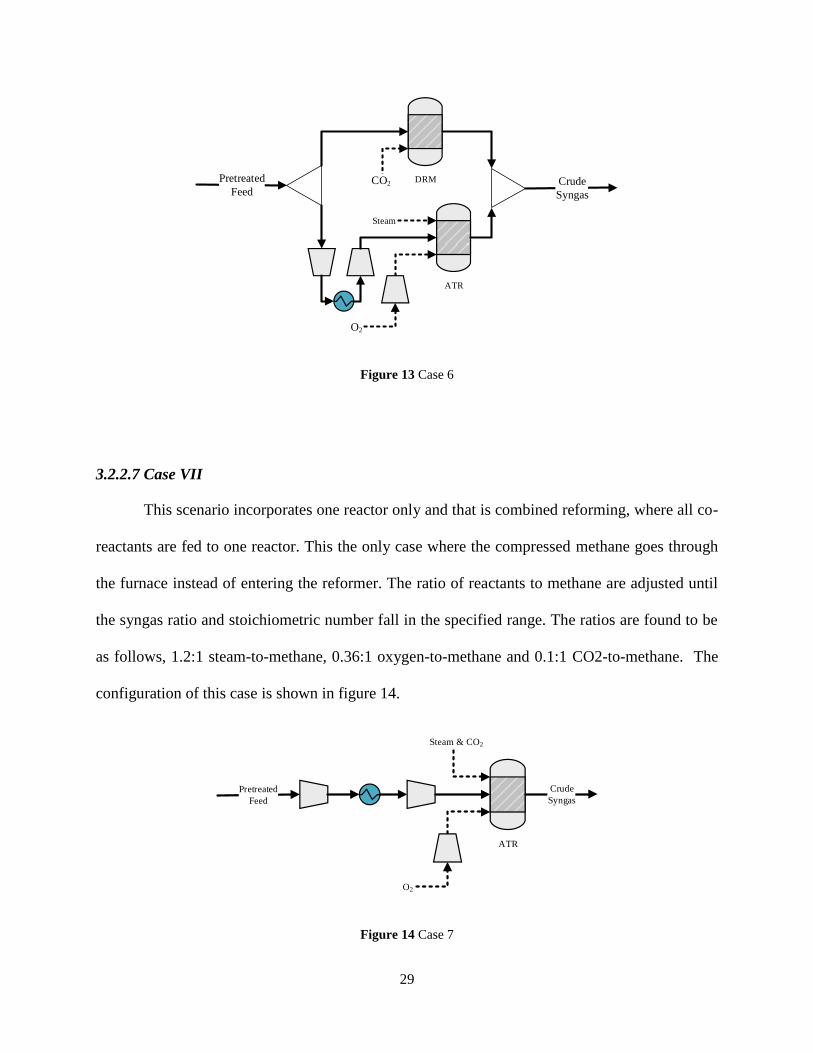
3.2.2.7 Case VII
This scenario incorporates one reactor only and that is combined reforming, where all co-
reactants are fed to one reactor. This the only case where the compressed methane goes through
the furnace instead of entering the reformer. The ratio of reactants to methane are adjusted until
the syngas ratio and stoichiometric number fall in the specified range. The ratios are found to be
as follows, 1.2:1 steam-to-methane, 0.36:1 oxygen-to-methane and 0.1:1 CO2-to-methane. The
configuration of this case is shown in figure 14.
Pretreated
Feed
ATR
O2
Steam & CO2
Crude
Syngas
Figure 14 Case 7

30
3.2.3 Syngas conditioning
Once syngas is produces through various reforming pathways, the products of all reformers
are combined into one stream for further condition, where water is separated from crude syngas
and to prepare syngas for methanol synthesis. Since all reforming technologies operate at an
elevated temperature, the combined crude syngas is cooled down in two stages. The first heat
exchanger cools down crude syngas to 900 F and the second heat exchanger reduces the
temperature further to 90 F, this step allows excess water in crude syngas to condense. Following
heat exchangers, a flash column is installed to separate water from syngas. The recovered water
requires further treatment in order to be recycled back to the process.
3.2.4 Methanol synthesis, synloop and purification unit
At this stage, syngas now has low water contents and it is ready to enter the multistage
compression with intercoolers in between. Fresh syngas is compressed from 20 psia to 1100 psia.
Unreacted gases leaving the synthesis flash column are compressed using a multistage
compression with an intercooler in between as well. After the final compression stage, both fresh
and recycled streams are cooled down to 400 F before they are mixed and fed to the methanol
converter. A stoichiometric block is chosen to model the reactor with the conversion rates (38)
shown in table 5. The pressurized reactor products are sent to a two stage expanders in order to
recover crude methanol from unreacted and undesired gases, where the stream is depressurized
from 1050 to 80 psia. As an expansion result, the temperature of the stream drops from 428 F to
120 F, however, this temperature is not sufficient to condense high quantities of crude methanol.
Therefore, a cooler is installed to bring the temperature down to 90 prior to entering the flash
column. The overhead products are partially purged and the remaining is compressed and recycled
back to the methanol converter.

31
Table 5 Reactions and conversion rates for the methanol converter
Chemical reaction Conversion rate %
Carbon monoxide hydrogenation:
CO + 2H2 CH3OH
9
Carbon dioxide hydrogenation:
CO2 + 3H2 CH3OH + H2O
5
Reverse Water Gas Shift:
CO2 + H2 CO + H2O
3
The bottoms product is sent for purification unit. The fluid package for the distillation
column is changed NRTL thermodynamic package. A distillation column with 45 trays is
implemented with a partial condenser to recover high methanol purity of 99.0 wt%.
3.3 Heat and power integration (H&PI)
Heat integration is performed on all the seven cases to aid both the economics and
environmental indicators. All streams passing through heat exchangers and reactors are considered
in this study. Grand Composite Curves for all scenarios are produced. For power integration,
energy produced from expanders are used to power compressors.
3.4 Economics
A comprehensive economic evaluation and calculations of the complete process scenarios
are conducted to assess the economic viability of each option. Total capital investment of the plant
calculations are shown in details in this section.
32
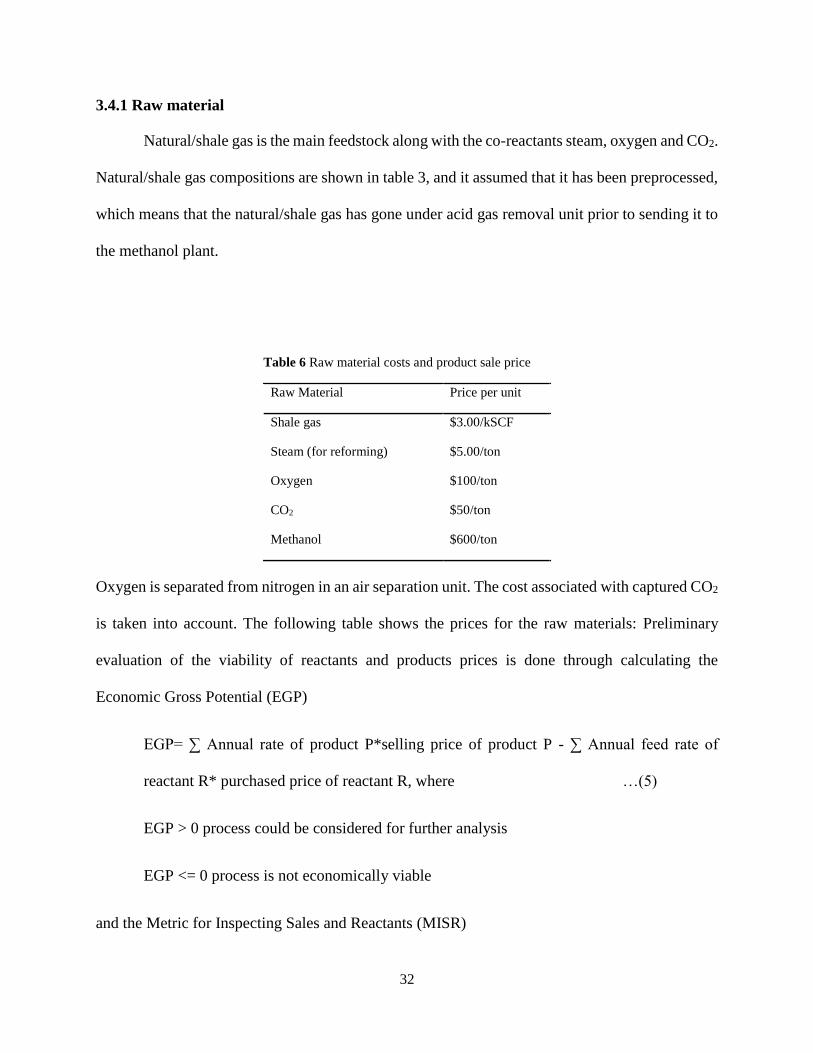
3.4.1 Raw material
Natural/shale gas is the main feedstock along with the co-reactants steam, oxygen and CO2.
Natural/shale gas compositions are shown in table 3, and it assumed that it has been preprocessed,
which means that the natural/shale gas has gone under acid gas removal unit prior to sending it to
the methanol plant.
Table 6 Raw material costs and product sale price
Raw Material Price per unit
Shale gas $3.00/kSCF
Steam (for reforming) $5.00/ton
Oxygen $100/ton
CO2 $50/ton
Methanol $600/ton
Oxygen is separated from nitrogen in an air separation unit. The cost associated with captured CO2
is taken into account. The following table shows the prices for the raw materials: Preliminary
evaluation of the viability of reactants and products prices is done through calculating the
Economic Gross Potential (EGP)
EGP= ∑ Annual rate of product P*selling price of product P - ∑ Annual feed rate of
reactant R* purchased price of reactant R, where …(5)
EGP > 0 process could be considered for further analysis
EGP <= 0 process is not economically viable
and the Metric for Inspecting Sales and Reactants (MISR)

33
MISR = (∑ Annual rate of product P*selling price of product P/∑ Annual feed rate of
reactant R* purchased price of reactant R) …(6)
MISR > 1 process could be considered for further analysis
MISR <= 1 process is not economically viable
These indicators provide insights on whether one should proceed further with analyzing and
developing the process based on the feedstock and products quantities and prices.
3.4.2 Total Capital Investment (TCI)
Total capital investment is the sum of Fixed Capital Investment (FCI) and Working Capital
Investment (WCI), and it represents the amount of money needed to install and provide all the
facility with all needed services and process equipment. FCI consists mainly from purchasing
equipment and installing these equipment in the plant. The majority of equipment cost estimation
is done using ASPEN Process Economic Analyzer, except for some equipment such as reactors
where the literature is used to estimate the cost.
3.4.2.1 ASPEN Process Economic Analyzer (ASPEN PEA)
This powerful tool provides cost estimation of process equipment. ASPEN HYSYS has a
built-in function where one can export the flowsheet, hence allowing ASPEN PEA to size and to
provide a practical equipment cost based on information collected from the user’s process
flowsheet. In this work, ASPEN PEA is used to estimate the cost of heat exchangers, compressors,
flash and distillation columns.

34
3.4.2.2 Cost curves for purchased equipment costs
For some equipment such as the fired heater, ASPEN PEA does not assist the user with
estimating the purchased cost. Therefore, the cost of the fired heater is estimated using correlations
by Towler and Sinnott (40) in the form of
Ce=(a + bSn ) * (CEPCI Equipment (Jan 2018)/ CEPCI Equipment (Jan 2018))
Where
Ce= purchased equipment cost on U.S. Gulf Coast basis, Jan 2010 (CEPCI Equipment=698.2)
a&b= costs constant
S= Size parameter (MW)
n= exponent for that type of equipment
For fired heater the constants are shown in the following table
Table 7 Fired heater cost constants
a b n CEPCI Equipment (jan-18)
43,000 111,000 0.8 695
3.4.2.3 six tenths
Some equipment such as reactors, where they might have complex internal design and lack
economic evaluation data, Sixth-Tenths-Factor Rule is used to estimate the cost of similar
equipment but with different sizes:
35
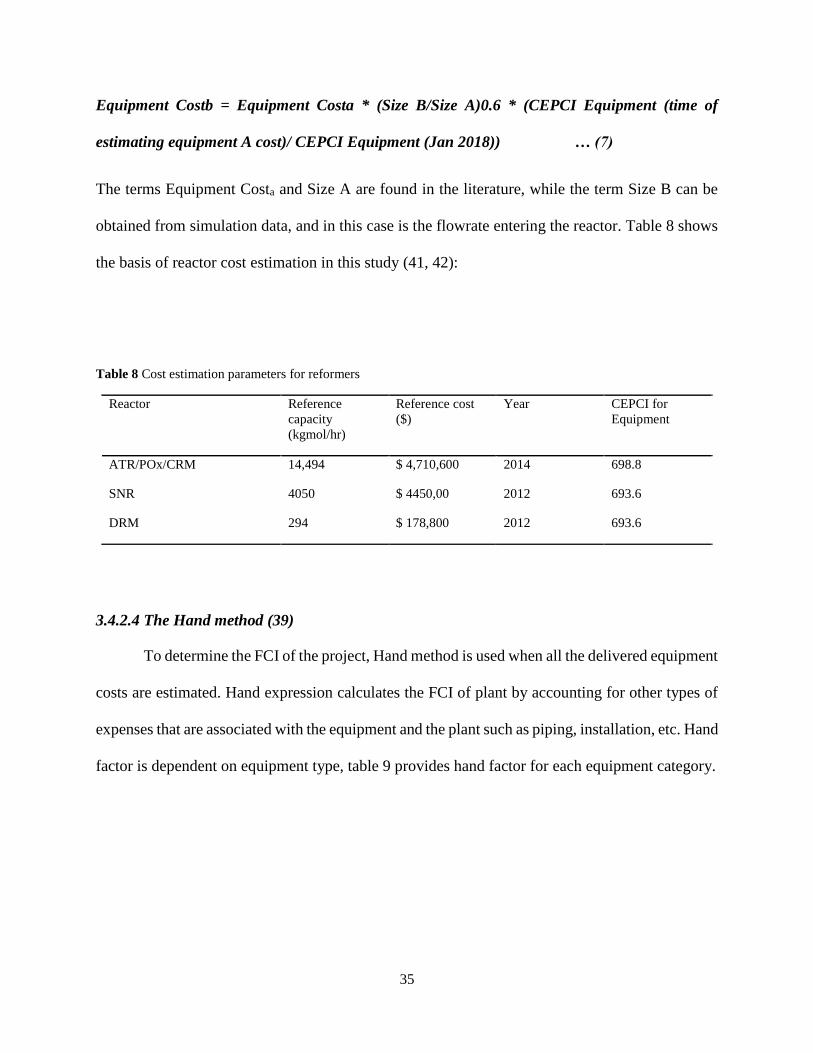
Equipment Costb = Equipment Costa * (Size B/Size A)0.6 * (CEPCI Equipment (time of
estimating equipment A cost)/ CEPCI Equipment (Jan 2018)) … (7)
The terms Equipment Costa and Size A are found in the literature, while the term Size B can be
obtained from simulation data, and in this case is the flowrate entering the reactor. Table 8 shows
the basis of reactor cost estimation in this study (41, 42):
Table 8 Cost estimation parameters for reformers
Reactor Reference
capacity
(kgmol/hr)
Reference cost
($)
Year CEPCI for
Equipment
ATR/POx/CRM 14,494 $ 4,710,600 2014 698.8
SNR 4050 $ 4450,00 2012 693.6
DRM 294 $ 178,800 2012 693.6
3.4.2.4 The Hand method (39)
To determine the FCI of the project, Hand method is used when all the delivered equipment
costs are estimated. Hand expression calculates the FCI of plant by accounting for other types of
expenses that are associated with the equipment and the plant such as piping, installation, etc. Hand
factor is dependent on equipment type, table 9 provides hand factor for each equipment category.
36
Table 9 Hand factor for equipment
Equipment Type Hand Factor
Compressors 2.5
Distillation columns 4.0
Fired heaters 2.0
Pressure vessels/tanks 4.0
Heat exchangers 3.5
Instruments 4.0
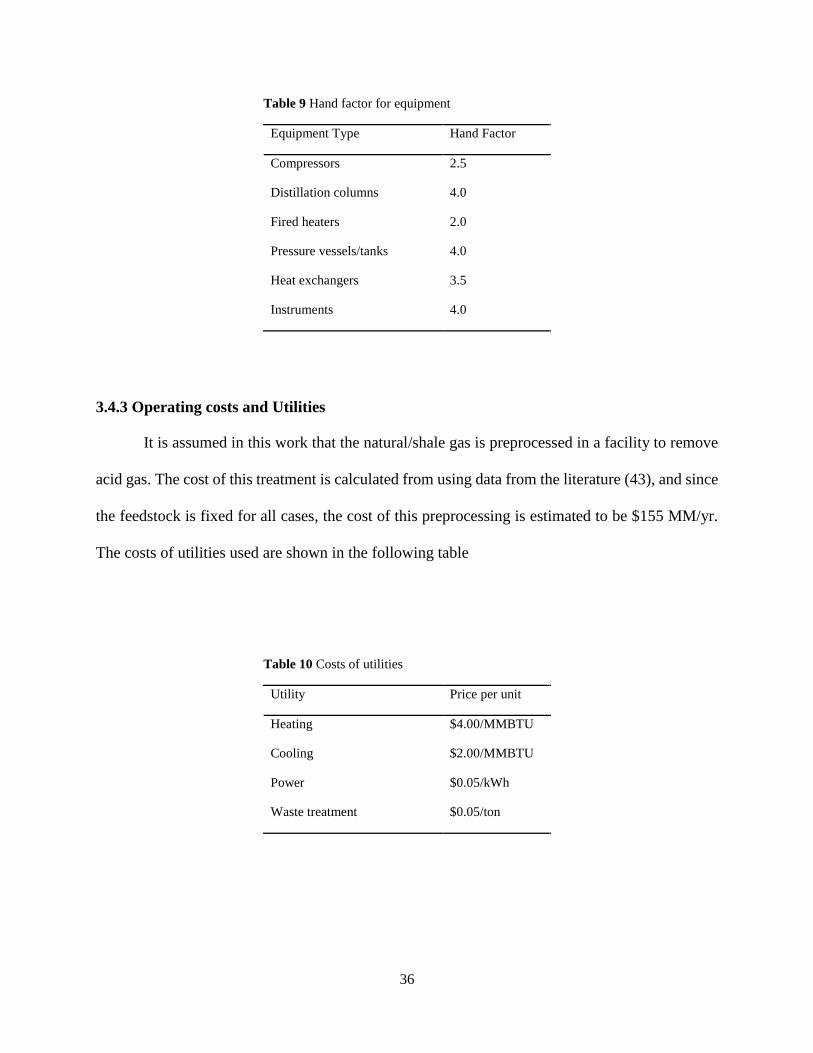
3.4.3 Operating costs and Utilities
It is assumed in this work that the natural/shale gas is preprocessed in a facility to remove
acid gas. The cost of this treatment is calculated from using data from the literature (43), and since
the feedstock is fixed for all cases, the cost of this preprocessing is estimated to be $155 MM/yr.
The costs of utilities used are shown in the following table
Table 10 Costs of utilities
Utility Price per unit
Heating $4.00/MMBTU
Cooling $2.00/MMBTU
Power $0.05/kWh
Waste treatment $0.05/ton

37
3.5 Profitability
The profitability of the various reforming cases are assessed through Return Of
Investments (ROI). ROI is calculated through the following expression:
ROI= Annual after tax profit / (FCI+WCI) …(8)
Where:-
WCI = 15/85 * FCI
and the annual after tax profit can be calculated using:
Annual after tax profit= (Methanol sales – raw material – utilities cost – depreciation) x (1 – tax
rate) + depreciation + Tax credit - carbon Tax …(9)
Tax credit is basically the amount of CO2 that is avoided, whether that is in a direct way such as
integrating CO2 as feedstock or through applying heat and power integration where less energy is
used and thus less carbon footprint.
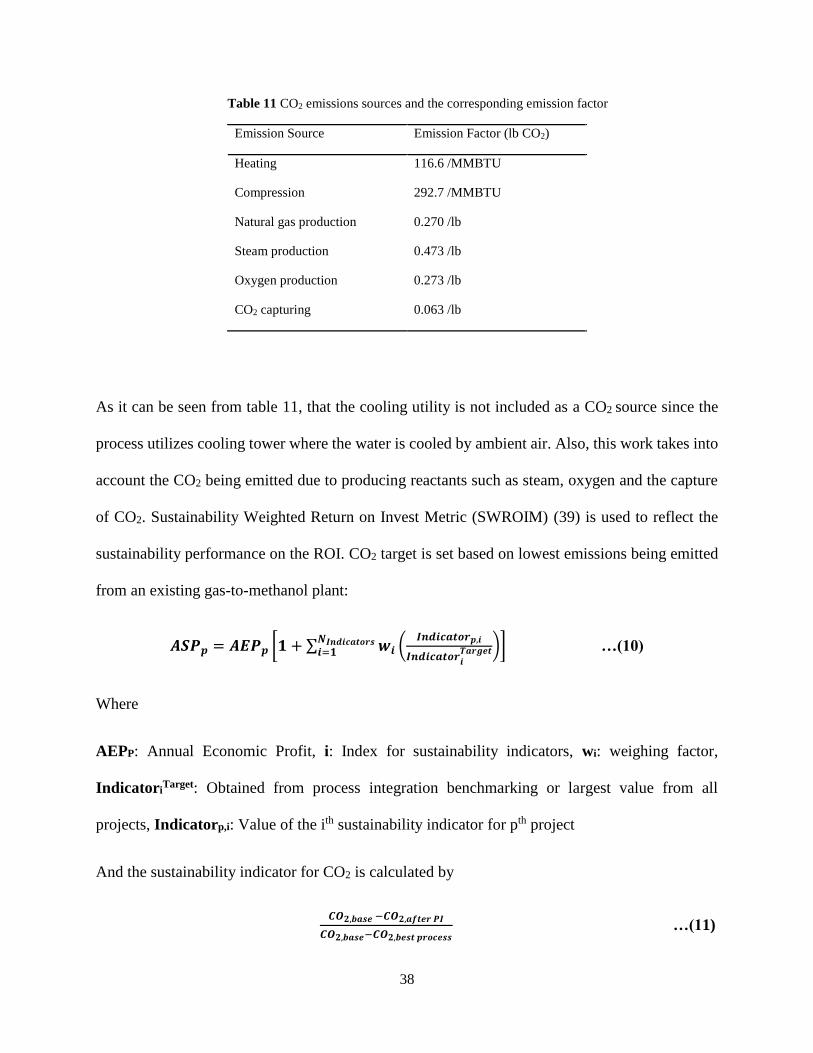
3.6 Environmental
A comprehensive environmental assessment is thoroughly performed to determine the
most sustainable scenario, by accounting for direct and indirect CO2 emissions and waste water
generation. Aside from purging and flaring, there are different sources within the process that
contributes to CO2 emission indirectly. These sources are presented in table 11(44, 45)
38
Table 11 CO2 emissions sources and the corresponding emission factor
Emission Source Emission Factor (lb CO2)
Heating 116.6 /MMBTU
Compression 292.7 /MMBTU
Natural gas production 0.270 /lb
Steam production 0.473 /lb
Oxygen production 0.273 /lb
CO2 capturing 0.063 /lb
As it can be seen from table 11, that the cooling utility is not included as a CO2 source since the
process utilizes cooling tower where the water is cooled by ambient air. Also, this work takes into
account the CO2 being emitted due to producing reactants such as steam, oxygen and the capture
of CO2. Sustainability Weighted Return on Invest Metric (SWROIM) (39) is used to reflect the
sustainability performance on the ROI. CO2 target is set based on lowest emissions being emitted
from an existing gas-to-methanol plant:
𝑨𝑺𝑷𝒑 = 𝑨𝑬𝑷𝒑 [𝟏 + ∑ 𝒘𝒊𝑵𝑰𝒏𝒅𝒊𝒄𝒂𝒕𝒐𝒓𝒔𝒊=𝟏 (
𝑰𝒏𝒅𝒊𝒄𝒂𝒕𝒐𝒓𝒑,𝒊
𝑰𝒏𝒅𝒊𝒄𝒂𝒕𝒐𝒓𝒊𝑻𝒂𝒓𝒈𝒆𝒕)] …(10)
Where
AEPP: Annual Economic Profit, i: Index for sustainability indicators, wi: weighing factor,
IndicatoriTarget: Obtained from process integration benchmarking or largest value from all
projects, Indicatorp,i: Value of the ith sustainability indicator for pth project
And the sustainability indicator for CO2 is calculated by
𝑪𝑶𝟐,𝒃𝒂𝒔𝒆 −𝑪𝑶𝟐,𝒂𝒇𝒕𝒆𝒓 𝑷𝑰
𝑪𝑶𝟐,𝒃𝒂𝒔𝒆−𝑪𝑶𝟐,𝒃𝒆𝒔𝒕 𝒑𝒓𝒐𝒄𝒆𝒔𝒔 …(11)

39
Where CO2, best process is taken to be equal to 1lb CO2 / 1 lb methanol (46). Whereas the target for
water is calculated based on the total discharged waste water over the actual amount of treated and
recycled waste water. The weighing factors for CO2 and waste water generation are 0.25 and 0.10,
respectively.
3.7 Safety
The Dow Fire and Explosion Index (F&EI) is used to assess and rank the safety of the
proposed designs. The factors for the general process hazards that are taken into consideration in
this work are the nature of the reaction (e.g. exothermic or endothermic), material handling, and
the number of process units. For the special process hazards, the factors are toxic material(s),
operating pressure, and the quantity of flammable material used in the process. Safety analyses are
performed and presented with respect to the reforming section only.

40
4. RESULTS AND DISCUSSION
4.1 Process Economics
4.1.1 Base Case
The simulation of several reforming configurations to produce methanol is carried out to
highlight the differences in the economic profitability and sustainability of each design. Starting
with the MISR and EGP defined earlier by expressions 5 and 6, all cases are showing economic
potential for further analyses based on reactants and product costs. These two metrics should be
only used to evaluate the economic feasibility of the process at the early stage of the work, further
analyses are required to determine whether a certain project is viable or not.
Table 12 MISR and EGP values obtained all design options
Scenario MISR EGP
Case 1a 2.7 $ 689,760,106
Case 1b 2.9 $ 779,526,822
Case 2a 2.1 $ 499,858,742
Case 2b 2.1 $ 498,804,113
Case 3 2.4 $ 622,987,028
Case 4 2.1 $ 482,247,111
Case 5 2.1 $ 496,863,040
Case 6 1.7 $ 353,177,502
Case 7 1.4 $ 194,863,766
41
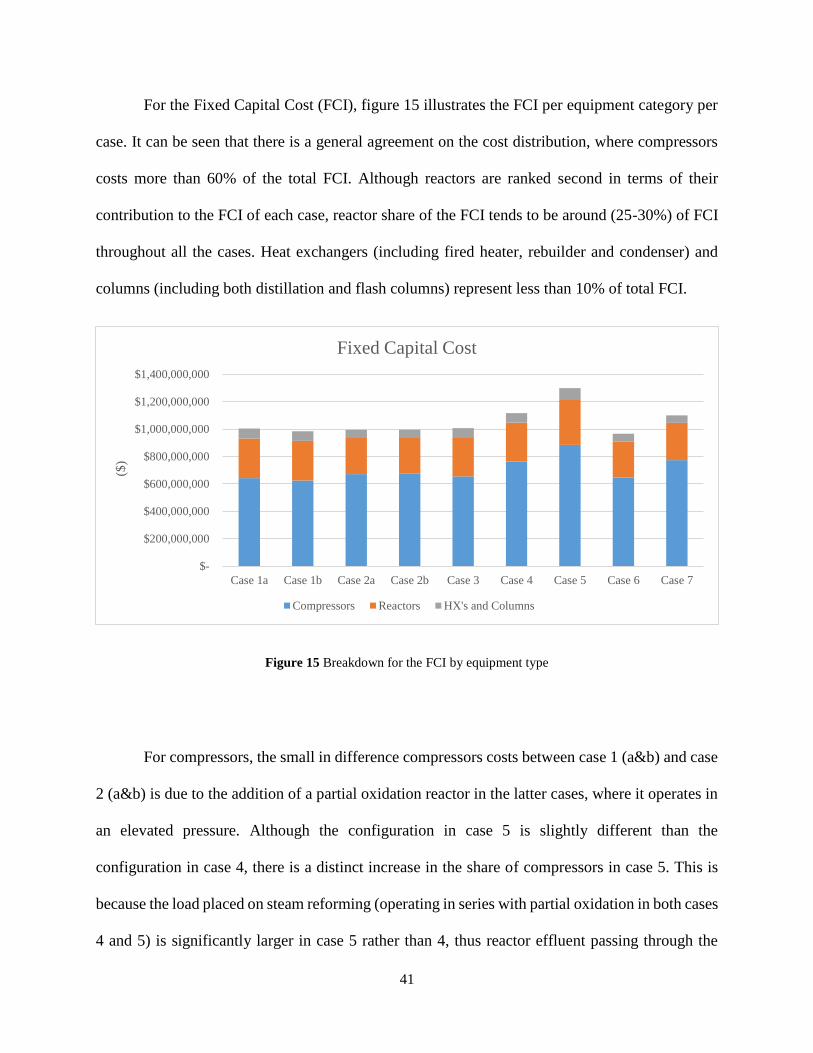
For the Fixed Capital Cost (FCI), figure 15 illustrates the FCI per equipment category per
case. It can be seen that there is a general agreement on the cost distribution, where compressors
costs more than 60% of the total FCI. Although reactors are ranked second in terms of their
contribution to the FCI of each case, reactor share of the FCI tends to be around (25-30%) of FCI
throughout all the cases. Heat exchangers (including fired heater, rebuilder and condenser) and
columns (including both distillation and flash columns) represent less than 10% of total FCI.
Figure 15 Breakdown for the FCI by equipment type
For compressors, the small in difference compressors costs between case 1 (a&b) and case
2 (a&b) is due to the addition of a partial oxidation reactor in the latter cases, where it operates in
an elevated pressure. Although the configuration in case 5 is slightly different than the
configuration in case 4, there is a distinct increase in the share of compressors in case 5. This is
because the load placed on steam reforming (operating in series with partial oxidation in both cases
4 and 5) is significantly larger in case 5 rather than 4, thus reactor effluent passing through the
$-
$200,000,000
$400,000,000
$600,000,000
$800,000,000
$1,000,000,000
$1,200,000,000
$1,400,000,000
Case 1a Case 1b Case 2a Case 2b Case 3 Case 4 Case 5 Case 6 Case 7
($)
Fixed Capital Cost
Compressors Reactors HX's and Columns

42
multi stage compressors in case 5 is larger in terms of the flowrate and therefore requires larger
compressors. For cases 6 and 7, where the first has an ATR operating in parallel to a dry reforming
and the latter has only one combined reforming, the noticeable increase in compressors cost is due
to compressing the whole feed of natural gas in case 7 prior to feeding it to CRM. Whereas in case
6, part of the feed is diverted to dry reforming which operates under low pressure than that of ATR.
Unlike the fixed capital cost where reactors represent 10% of total FIC, utilities supplied
to reactors are the largest for most cases. However, when oxygen is used as a co-reactant, the utility
required by reactors for reforming of natural gas drops significantly. Since all reactor utilizing
oxygen operates adiabatically, thus no heating is required. This example can be seen clearly in
figure 16 where case 7 has almost no utility required for reactors, except for cooling methanol
reactor.

43
Figure 16 Utilities cost per equipment type - Base case
Figure 17 shows the ROI of the base case vs production rate of methanol. There is a general
trend where the ROI increases as the plant’s capacity increases. Since the production of methanol
in this work depends solely on the compositions of syngas produced, the extremely low ROI in
case 7 traces back to the fact that only one reactor is used to produce syngas, and since there are
number of constraints, the degrees of freedom here becomes limited for this type of design, thus
lowering methanol production rate. Although case 4 and 5 have more production capacity than
case 6, yet they have lower ROI than case 6, owing it to implementation of more reactors in the
reforming section compared to case 6. In addition, the reforming section in case 6 requires
significantly lower utilities than that of case 4 and 5, since the majority of reforming load in case
$-
$50,000,000
$100,000,000
$150,000,000
$200,000,000
$250,000,000
$300,000,000
$350,000,000
$400,000,000
$450,000,000
$500,000,000
Case 1a Case 1b Case 2a Case 2b Case 3 Case 4 Case 5 Case 6 Case 7
($/y
r)Base Case - Utilities
Reactors Heat Exchanger network Compression

44
Figure 17 ROI vs production capacity for the different reforming options
6 is placed on the adiabatic ATR. The same argument can be made between the cases of 2(a,b) and
case 3. It can be seen clearly that case 3 has more methanol production capacity than 2a and 2b,
however, due to higher utility requirements for case 3 than utility requirements of both cases in 2
($400 MM/yr compared to < $250 MM/yr), the ROI is slightly lower in case 3. In general,
methanol production capacity plays a big role in the calculations of the ROI, as the capacity
increases the profitability of the process increases as well. However, for some cases where utility
requirements are significantly higher it could overcome the profit generated from methanol sales
and therefore decreases the profitability of that design configuration.
-4%
-1%
2%
5%
8%
11%
14%
3.00E+03 3.50E+03 4.00E+03 4.50E+03 5.00E+03 5.50E+03 6.00E+03
RO
I
Capacity (tons/day)
Base Case ROI
Case 1b
Case 2a
Case 1a
Case 2b
Case 3
Case 6
Case 4
Case 5
Case 7

45
4.1.2 Cases After Applying Heat and Power Integration (HP&I)
The economic performance of all the cases is enhanced by conducting heat and power
integration. It is important to note that the streams entering and exiting the fired heater in this
analysis are not considered except for the flue gas stream. When heat integration is implemented
and Grand Composite Curves produced, nearly all process configurations required 0 heating
utilities, except for cases 1a and 1b where the minimum heating utility needed are 16 and 43
MMBTU/hr Figure18. This due to not utilizing oxygen as a co-reactant, where it provides a
tremendous amount of heat that can be used toward heating endothermic reactions such as steam
reforming and dry reforming. Flue gas exiting the furnace is another major source of energy for
replacing heating utilities, the heat from the flue gas is recovered and used to preheat reactants.
Figure 18 Case 1a grand composite curve
0
500
1000
1500
2000
0.00E+00 1.00E+09 2.00E+09 3.00E+09 4.00E+09
T (F
)
BTU/hr
Case 1a
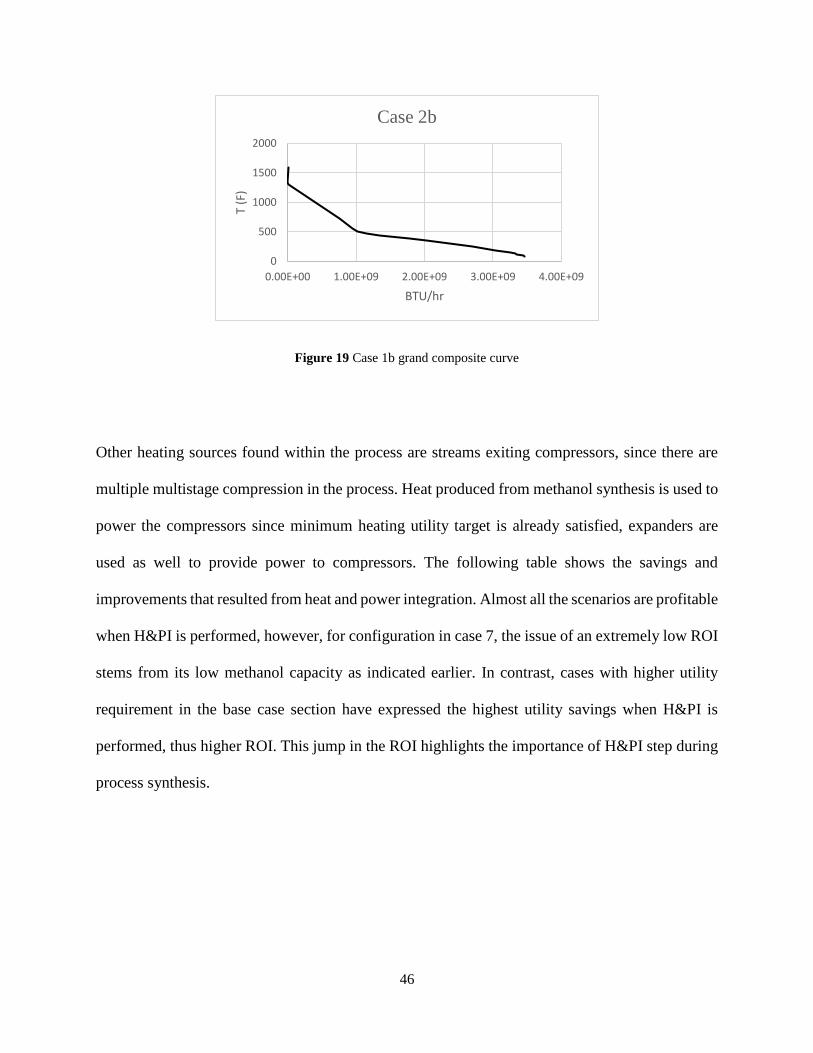
46
Figure 19 Case 1b grand composite curve
Other heating sources found within the process are streams exiting compressors, since there are
multiple multistage compression in the process. Heat produced from methanol synthesis is used to
power the compressors since minimum heating utility target is already satisfied, expanders are
used as well to provide power to compressors. The following table shows the savings and
improvements that resulted from heat and power integration. Almost all the scenarios are profitable
when H&PI is performed, however, for configuration in case 7, the issue of an extremely low ROI
stems from its low methanol capacity as indicated earlier. In contrast, cases with higher utility
requirement in the base case section have expressed the highest utility savings when H&PI is
performed, thus higher ROI. This jump in the ROI highlights the importance of H&PI step during
process synthesis.
0
500
1000
1500
2000
0.00E+00 1.00E+09 2.00E+09 3.00E+09 4.00E+09
T (F
)
BTU/hr
Case 2b

47
Table 13 ROI and Utilities cost before and after H&PI
Scenario ROI (%) Utilities ($)
Before H&PI After H&PI Before H&PI After H&PI
Case 1a 10 28 402,638,329 103,485,736
Case 1b 14 27 432,256,038 105,885,634
Case 2a 10 18 212,572,344 88,455,147
Case 2b 8 18 250,237,000 92,380,773
Case 3 7 24 398,170,900 223,369,491
Case 4 2 14 344,439,555 116,759,177
Case 5 -1 16 424,783,119 58,309,628
Case 6 5 10 156,859,615 82,953,850
Case 7 -2 1 127,079,791 72,611,300
4.1.3 Sensitivity Analysis
4.1.3.1 Natural/shale Gas cost and Methanol Selling Price
A sensitivity analysis is performed to explore the effects of natural/shale gas price
fluctuation and variation in methanol demand, thus the sale price. The sensitivity analysis is
conducted on cases after H&PI is performed. Table 14 shows the result of this analysis, and
demonstrate the feasibility of the proposed designs under varying feed cost and product selling
price. As one can clearly see that Case 1a has the most economic viability among other designs,
especially under low methanol selling price of (0.20 $/lb). On the other side, cases 6 and 7 are not
viable when methanol prices are under 0.5$/lb and no matter what the feed cost is. This illustrate
that these design configurations shall not be considered for implementation under any
circumstance due to their poor ROI even at higher methanol selling prices.

48
Figure 20 Sensitivity analysis for the most profitable case
Figure 21 Sensitivity analysis for least profitable case
0%
10%
20%
30%
40%
50%
60%
70%
80%
0.1 0.15 0.2 0.25 0.3 0.35 0.4 0.45
RO
I
Methanol Price ($/lb)
Case 1a
$1.50 $3.00 $4.50 $6.00
0%
10%
20%
30%
40%
50%
60%
70%
80%
0.1 0.15 0.2 0.25 0.3 0.35 0.4 0.45
RO
I
Methanol Price ($/lb)
Case 7
$1.50 $3.00 $4.50 $6.00

49
Table 14 Economic viability of the reforming cases at various feed and product prices
Feed Cost ($/kSCF) /
Methanol selling
0.20 0.25 0.30 0.35 0.40
1.5 Case 1a Case 1 (a&b)
Case 2 (a&b)
Case 3
Case 4
Case 5
Case 1 (a&b)
Case 2 (a&b)
Case 3
Case 5
Case 1 (a&b)
Case 2 (a&b)
Case 3
All cases
3.0 - Case 1 (a&b)
Case 3
Case 1 (a&b)
Case 2 (a&b)
Case 3
Case 5
Case 1 (a&b)
Case 2 (a&b)
Case 3
All cases
except for 7
4.5 - - Case 1 (a&b)
Case 3
Case 1 (a&b)
Case 2 (a&b)
Case 3
Case 4
Case 5
All cases
except for 7
6 - - - Case 1 (a&b)
Case 3
Case 1 (a&b)
Case 2 (a&b)
Case 3
Case 4
4.1.3.2 Carbon Tax and Carbon Credit
Although this study takes into account the price of capturing CO2, the change in
profitability of a process due to carbon emission and carbon credit is evaluated. Since
environmental regulations could severely affect the economic viability of a process (47).
Therefore, a sensitivity analysis on carbon tax and carbon credit is conducted to further explore
the limits of each proposed design. 3-D plots are generated by MATLAB to show how
50
environmental regulations represented by carbon tax and carbon credit (which is in this study is
how much carbon have been utilized as feedstock during the process of methanol production) can
affect the proposed process designs. The calculations herein are based on $3.00/kSCF for natural
gas and $0.30/lb for methanol. In general and from figures 22 and 23, one can see that the color
of the 3-D bars tend to change more with changing carbon tax rate rather than the variation of
carbon credit rate. This is due to the fact that more carbon is being emitted by the process rather
than being consumed. However, cases such as 1a and 1b still can make profit even at higher carbon
tax rate and low carbon credit. In contrast, when even a low carbon tax value ($5/ton) is placed
and a high value for carbon credit is given ($25/ton), cases 4, 5 and 6 would be still affected
negatively by the regulations and are hardly making a profit, hence becoming economically
unattractive. For the other process scenarios, namely 2 (a&b) and 3, are still feasible when a carbon
tax of $5/ton is implemented and without giving any credit for CO2 utilization.

51
(a) (b)
(c) (d)
Figure 22 Sensitivity analysis for cases (a) 1a (b) 1b (c) 2a (4) 2b

52
(a) (b)
(c) (d)
Figure 23 Sensitivity analysis for cases (a) 3 (b) 4 (c) 5 (d) 6

53
4.2 Sustainability
The sustainability of the process is evaluated and quantified based on CO2 emissions and
waste water generation. CO2 emission sources are calculated as explained and described earlier
in the methodology section. Figure 24 shows the improvements of CO2 emissions reduction after
implementing heat and power integration.
Figure 24 Relative CO2 emissions by case
Overall, H&PI improved the sustainability of all scenarios, especially the ones with higher utility
consumption before H&PI. This is the same analogy as how the ROI of all the cases has increased
after performing H&PI. Although integrating CO2 as a feedstock reduces the net CO2 emissions,
CO2 emissions are heavily impacted by H&P. The above figure represents only how CO2 is
Before H&PI After H&PI
48%50%
Case 1a Case 1b Case 2a Case 2b Case 3
10%17%46%
46%36%32%
44%
Case 4 Case 5 Case 6 Case 7
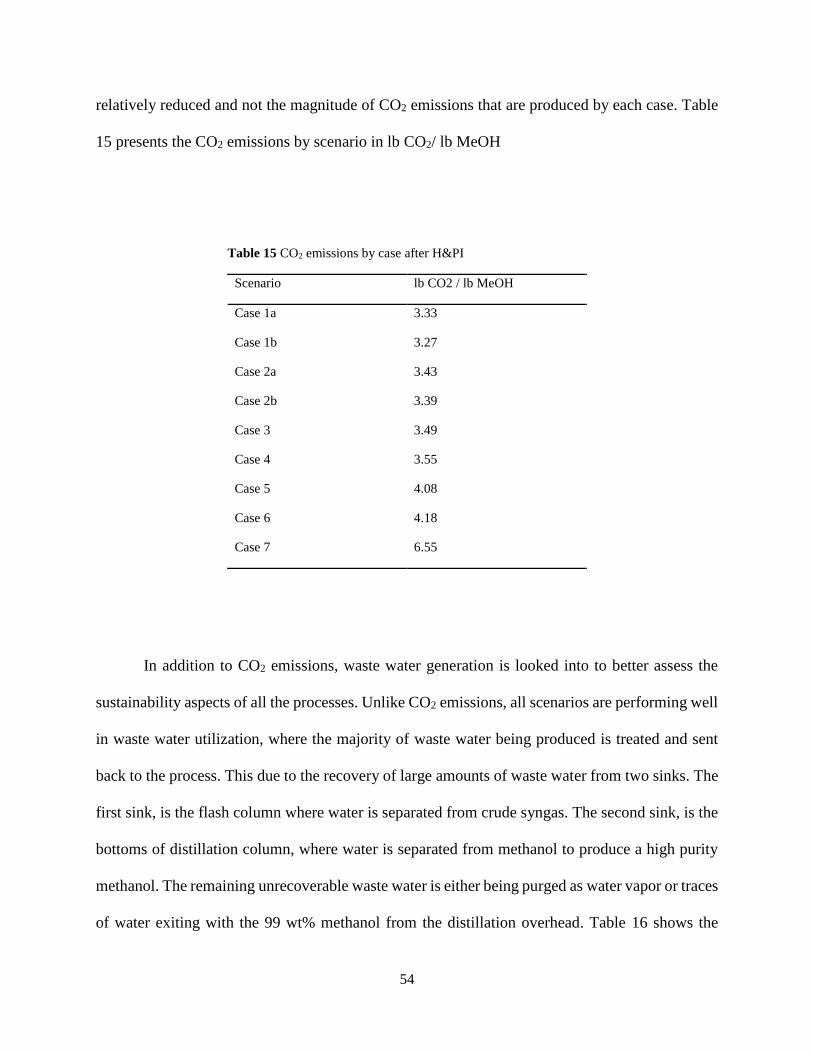
54
relatively reduced and not the magnitude of CO2 emissions that are produced by each case. Table
15 presents the CO2 emissions by scenario in lb CO2/ lb MeOH
Table 15 CO2 emissions by case after H&PI
Scenario lb CO2 / lb MeOH
Case 1a 3.33
Case 1b 3.27
Case 2a 3.43
Case 2b 3.39
Case 3 3.49
Case 4 3.55
Case 5 4.08
Case 6 4.18
Case 7 6.55
In addition to CO2 emissions, waste water generation is looked into to better assess the
sustainability aspects of all the processes. Unlike CO2 emissions, all scenarios are performing well
in waste water utilization, where the majority of waste water being produced is treated and sent
back to the process. This due to the recovery of large amounts of waste water from two sinks. The
first sink, is the flash column where water is separated from crude syngas. The second sink, is the
bottoms of distillation column, where water is separated from methanol to produce a high purity
methanol. The remaining unrecoverable waste water is either being purged as water vapor or traces
of water exiting with the 99 wt% methanol from the distillation overhead. Table 16 shows the

55
amount of waste water that is being recovered, treated and recycled to the process per each
scenario. To better quantify these results, SWROIM is used to reflect the sustainability
performance of a process on its ROI. Table 17 shows the SWROI values for all the cases, where
the weighing factor is chosen to be 0.25 for CO2 emissions and 0.1 for waste water generation. It
can be clearly seen that the ROI of all processes is improved, however, the rate of improvement
differ from case to another, and that is due to their original ROI values and sustainability
performance. For example the improvement in case 7 is insignificant when compared to case 1a
or case 3. In general, the average improvement of all the cases hovers around 20% of the original
ROI.
Table 16 Waste water recovered and recycled back to the process
Scenario Waste Water Recovery %
Case 1a 98
Case 1b 97
Case 2a 94
Case 2b 97
Case 3 98
Case 4 95
Case 5 98
Case 6 98
Case 7 99

56
Table 17 The impact of sustainability on the ROI using SWROIM
Scenario ROI SWROIM
Case 1a 28% 35%
Case 1b 27% 33%
Case 2a 18% 21%
Case 2b 18% 21%
Case 3 24% 29%
Case 4 14% 17%
Case 5 16% 19%
Case 6 10% 11%
Case 7 1% 1%
4.3 Safety Analysis
The safety of each design are assessed with the aid of the Dow F&EI. The ranking of the
safer reforming scenario is as follows:-
Case 1b > Case 1a > Case 7 > Case 4 > Case 6 > Case 3 > Case 5 > Case 2b > Case 2a
For cases 1a and 1b, the absence of the high pressure reactor vessel as well as the absence of the
exothermic reaction (no oxygen stream) have a significant impact that improved the safety of
these scenarios when compared to the other alternatives. Although case 7 utilizes oxygen as one
of the co-reactants and operates under high pressure, this process scenario utilizes one reformer,
hence eliminating hazards that may stem from adding another reactor. For cases 2a and 2b, the
increase of the process dependence on the exothermic reaction to produce syngas has led to
elevating the hazards that are associated with these scenarios.
57
5. CONCLUSION AND RECOMMENDATION
In conclusion, a comprehensive evaluation of the economic and environmental aspects of
different configurations and combinations of reforming technologies to produce syngas that is
suitable for methanol synthesis. A methanol plant that utilizes conventional reforming technology
(e.g. steam reforming, partial oxidation or autothermal reforming) as the primary source for syngas
is considered for modifications, where other forms of syngas production from CO2 are
incorporated within the process. The modifications are contained solely within the reforming
section, while maintaining the rest of the process unchanged in order to compare the alternatives.
Nine unique reforming options are produced, and ASPEN HYSYS is used to simulate the
processes. ASPEN Process Economic Analyzer is utilized to size and calculate the costs of some
process equipment such as heat exchangers and compressors. Values from the literature are used
to evaluate the cost of reactors and turbo-expanders through Six-tenths factor rule. The FCI of all
options is calculated using the Hand factor and Hand method. Heat and power integration is
conducted to enhance both economic and environmental performance of the proposed design.
Direct and indirect CO2 emissions are taken into account, where direct emission is calculated by
how much the process is directly emitting CO2 into the atmosphere. While indirect CO2 emissions
are concerned with carbon footprint natural/shale gas, co-reactants, and energy production. In
addition to CO2 emissions assessment, waste water sinks are identified in order to recover and
recycle waste streams. Results show that ROI increases with increasing production except for some
cases such as case 5, where four reactors are implemented in the reforming section leading to a
considerably higher FCI, therefore overcoming the high production of methanol and decreasing
the ROI. Although when H&PI is not implemented some processes are making profit, yet when
H&PI is conducted the ROI increases significantly for most cases, with case 1a (where a steam

58
reforming is in parallel with dry reforming) being the most profitable design. In contrast, case 7 or
combined reforming showed the lost ROI, due to the imposed constraints of syngas production
discussed earlier and the lack of degrees of freedom when utilizing one reactor. SWROIM is used
to quantify sustainability metrics and reflect them on the ROI of the process. The results showed
significant ROI increase for all cases except for case 7 where no improvement where only 10%
CO2 avoidance is achieved compared to 50% avoidance achieved by case 1a. Sensitivity analysis
is conducted to evaluate the fluctuations of natural/shale gas prices as well as methanol selling
price. Case 1a and to less extent cases 1b and 3 showed the most robust economic profitability
when the prices of methanol dropped. Also, sensitivity analysis is extended to measure the impact
of regulations carbon tax and carbon credit. Analysis shows that carbon tax has higher impact on
the ROI when compared to tax credit, and this is because all the processes emit more CO2 than
they consume to produce syngas. Results from economic and sustainability analyses suggest that
all current conventional processes can be modified to incorporate dry reforming and make profit,
except for processes that utilize autothermal and combined reforming.
5.1 Future work
The presented work can be extended to involve
Lift constraints that are included in this study such as:
o Reformers that utilize oxygen as a co-reactant operates adiabatically
o Adjust the temperature to find the optimal temperature for each reactor in each
proposed scenario
Optimize reactants ratios that are being fed to the reformer, where economic and
sustainability indicators are taken into account

59
Reflect and provide insights on the role of catalysis and intrinsic kinetics of methanol
synthesis reaction on the process, through simulating process outcomes when a catalyst
with certain functions has been developed
Use an equilibrium block to replace the stoichiometric block for methanol converter:
o Develop a kinetic expression from the literature
o Optimize the kinetic parameters to account for the variation in syngas ratios,
especially CO and CO2 contribution to methanol synthesis
60
REFERENCES
1. Liss WE. Impacts of Shale Gas Advancements on Natural Gas Utilization in the United States.
Energy Technology. 2014 Dec;2(12):953-67.
2. Riaz A, Zahedi G, Klemeš JJ. A review of cleaner production methods for the manufacture
of methanol. Journal of Cleaner Production. 2013 Oct;57:19-37.
3. Alvarado M. The changing face of the global methanol industry. IHS Chemical Bulletin.
2016(3):10-1.
4. Liu K, Song C, Subramani V. Hydrogen and syngas production and purification technologies.
John Wiley & Sons; 2009.
5. Rase HF. Handbook of commercial catalysts: heterogeneous catalysts. CRC press; 2000.
6. Hu YH, Ruckenstein E. Catalytic conversion of methane to synthesis gas by partial oxidation
and CO 2 reforming. Advances in catalysis. 2004;48:297-345.
7. Rostrup-Nielsen JR. aew aspects of syngas production and use. Catalysis Today. 2000
December 25,;63(2):159-64.
8. Spath PL, Dayton DC. Preliminary Screening -- Technical and Economic Assessment of
Synthesis Gas to Fuels and Chemicals with Emphasis on the Potential for Biomass-Derived
Syngas. 2003 /12/01.
9. Song CS. Tri-reforming: A new process concept for effective conversion and utilization of
CO2 in flue gas from electric power plants. ABSTRACTS OF PAPERS OF THE AMERICAN
CHEMICAL SOCIETY; AMER CHEMICAL SOC 1155 16TH ST, NW, WASHINGTON, DC
20036 USA; 2000.
10. Ruckenstein E, Hu YH. Combination of CO2 reforming and partial oxidation of methane
over NiO/MgO solid solution catalysts. Ind Eng Chem Res. 1998;37(5):1744-7.
11. Noureldin MM, Elbashir NO, El-Halwagi MM. Optimization and selection of reforming
approaches for syngas generation from natural/shale gas. Ind Eng Chem Res. 2013;53(5):1841-
55.
12. Challiwala MS, Ghouri MM, Linke P, El-Halwagi MM, Elbashir NO. A combined thermo-
kinetic analysis of various methane reforming technologies: Comparison with dry reforming.
Journal of CO2 Utilization. 2017;17:99-111.
13. Julian-Duran LM, Ortiz-Espinoza AP, El-Halwagi MM, Jimenez-Gutierrez A. Techno-
economic assessment and environmental impact of shale gas alternatives to methanol. ACS
Sustainable Chemistry & Engineering. 2014;2(10):2338-44.
61
14. Minutillo M, Perna A. A novel approach for treatment of CO.sub.2 from fossil fired power
plants, Part A: The integrated systems ITRPP. International Journal of Hydrogen Energy. 2009
May 1,;34(9):4014.
15. Minutillo M, Perna A. A novel approach for treatment of CO 2 from fossil fired power
plants. Part B: The energy suitability of integrated tri-reforming power plants (ITRPPs) for
methanol production. International Journal of Hydrogen Energy. 2010;35(13):7012-20.
16. Ng K, Zhang N, Sadhukhan J. Techno-economic analysis of polygeneration systems with
carbon capture and storage and CO2 reuse. Chemical Engineering Journal. 2013 Mar 1,;219:96-
108.
17. Zhang Y, Cruz J, Zhang S, Lou HH, Benson TJ. Process simulation and optimization of
methanol production coupled to tri-reforming process. International Journal of Hydrogen Energy.
2013 Oct;38(31):13617-30.
18. Dwivedi A, Gudi R, Biswas P. An improved tri-reforming based methanol production
process for enhanced CO2 valorization. Int J Hydrogen Energy. 2017;42(36):23227-41.
19. Nowak P, Lachowska M, Skrzypek J. Influence of water vapour on methanol synthesis over
CuO-ZnO-Al2O3 catalyst. Chemical Engineering Science. 1991 January 1,;46(12):3324-5.
20. Kung HH, Liu G, Willcox D. EFFECT OF CO2 AND H2O IN THE METHANOL
SYNTHESIS REACTION ON Cu-Zn-O. ; 1984.
21. BARDET R, THIVOLLECAZAT J, TRAMBOUZE Y. METHANOLIZATION UNDER
PRESSURE OF CARBON OXIDES AND THEIR MIXTURE ON CU-ZN-AL2O3
CATALYSTS-ROLE OF CARBON-DIOXIDE. ABSTRACTS OF PAPERS OF THE
AMERICAN CHEMICAL SOCIETY; AMER CHEMICAL SOC 1155 16TH ST, NW,
WASHINGTON, DC 20036; 1984.
22. Naber JD, Siebers DL, Di Julio SS, Westbrook CK. Effects of natural gas composition on
ignition delay under diesel conditions. Combust Flame. 1994;99(2):192-200.
23. Smith AR, Klosek J. A review of air separation technologies and their integration with
energy conversion processes. Fuel Process Technol. 2001;70(2):115-34.
24. Rostrup-Nielsen JR. Activity of nickel catalysts for steam reforming of hydrocarbons.
Journal of Catalysis. 1973;31(2):173-99.
25. Cheng W. Methanol production and use. CRC Press; 1994.
26. Kéromnès A, Metcalfe WK, Heufer KA, Donohoe N, Das AK, Sung C, et al. An
experimental and detailed chemical kinetic modeling study of hydrogen and syngas mixture
oxidation at elevated pressures. Combustion and Flame. 2013 June 1,;160(6):995-1011.

62
27. Vernon PD, Green ML, Cheetham AK, Ashcroft AT. Partial oxidation of methane to
synthesis gas. Catalysis Letters. 1990;6(2):181-6.
28. York AP, Xiao T, Green ML. Brief overview of the partial oxidation of methane to synthesis
gas. Topics in Catalysis. 2003;22(3-4):345-58.
29. Even though many studies have been conducted to investigate steam reforming, dry methane
reforming, only a few have considered combination of these two processes. Avci, investigated
the reaction of steam reforming of methane. Optimal Design and Decision for Combined Steam
Reforming Process with Dry Methane Reforming to Reuse CO2 as a Raw Material. Ind Eng
Chem Res. 2012;51(13):4982-9.
30. Lee S. Methanol synthesis technology. CRC Press; 1989.
31. Olah GA, Goeppert A, Prakash GS. Beyond oil and gas: the methanol economy. John Wiley
& Sons; 2011.
32. Meyers RA, Meyers RA. Handbook of petrochemicals production processes. McGraw-Hill
Prof Med/Tech; 2005.
33. Petrochemical Processes Handbook 2014. Hydrocarbon Processing. 2014 May 1,.
34. Klerk Ad. Fischer-Tropsch Refining. John Wiley & Sons; 2012.
35. Stryjek R, Vera JH. PRSV: An improved Peng—Robinson equation of state for pure
compounds and mixtures. The canadian journal of chemical engineering. 1986;64(2):323-33.
36. Stryjek R_, Vera JH. PRSV—An improved peng‐Robinson equation of state with new
mixing rules for strongly nonideal mixtures. The Canadian Journal of Chemical Engineering.
1986;64(2):334-40.
37. Pellegrini LA, Soave G, Gamba S, Langè S. Economic analysis of a combined energy–
methanol production plant. Applied Energy. 2011 December 1,;88(12):4891-7.
38. Chen L, Jiang Q, Song Z, Posarac D. Optimization of methanol yield from a Lurgi reactor.
Chem Eng Technol. 2011;34(5):817-22.
39. El-Halwagi MM. Sustainable design through process integration: fundamentals and
applications to industrial pollution prevention, resource conservation, and profitability
enhancement. Butterworth-Heinemann; 2017.
40. Sinnott RK, Towler G. Chemical Engineering Design: SI edition. Elsevier; 2009.
41. Maqbool W, Lee ES. Syngas Production Process Development and Economic Evaluation for
Gas‐to‐Liquid Applications. Chem Eng Technol. 2014;37(6):995-1001.

63
42. Gangadharan P, Kanchi KC, Lou HH. Evaluation of the economic and environmental impact
of combining dry reforming with steam reforming of methane. Chemical Engineering Research
and Design. 2012 November 1,;90(11):1956-68.
43. Ehlinger VM, Gabriel KJ, Noureldin MM, El-Halwagi MM. Process design and integration
of shale gas to methanol. ACS Sustainable Chemistry & Engineering. 2013;2(1):30-7.
44. Van-Dal ES, Bouallou C. Design and simulation of a methanol production plant from
CO.sub.2 hydrogenation. Journal of Cleaner Production. 2013 Oct 15,;57:38.
45. David J, Herzog H. The cost of carbon capture. fifth international conference on greenhouse
gas control technologies, Cairns, Australia; ; 2000.
46. Śliwińska A, Burchart-Korol D, Smoliński A. Environmental life cycle assessment of
methanol and electricity co-production system based on coal gasification technology. Sci Total
Environ. 2017;574:1571-9.
47. Baranzini A, Goldemberg J, Speck S. A future for carbon taxes. Ecol Econ. 2000;32(3):395-
412.

64
APPENDIX
Figure 25 Case 1b sensitivity analysis
Figure 26 Case 2a sensitivity analysis
0%
10%
20%
30%
40%
50%
60%
70%
80%
0.1 0.15 0.2 0.25 0.3 0.35 0.4 0.45
RO
I
Methanol Price ($/lb)
Case 1b
$1.50 $3.00 $4.50 $6.00
0%
10%
20%
30%
40%
50%
60%
70%
80%
0.1 0.15 0.2 0.25 0.3 0.35 0.4 0.45
RO
I
Methanol Price ($/lb)
Case 2a
$1.50 $3.00 $4.50 $6.00

65
Figure 27 Case 2b sensitivity analysis
Figure 28 Case 3 sensitivity analysis
0%
10%
20%
30%
40%
50%
60%
70%
80%
0.1 0.15 0.2 0.25 0.3 0.35 0.4 0.45
RO
I
Axis Title
Case 2b
$1.50 $3.00 $4.50 $6.00
0%
10%
20%
30%
40%
50%
60%
70%
80%
0.1 0.15 0.2 0.25 0.3 0.35 0.4 0.45
RO
I
Methanol Price ($/lb)
Case 3
$1.50 $3.00 $4.50 $6.00

66
Figure 29 Case 4 sensitivity analysis
Figure 30 Case 5 sensitivity analysis
0%
5%
10%
15%
20%
25%
30%
35%
40%
45%
50%
0.1 0.15 0.2 0.25 0.3 0.35 0.4 0.45
RO
I
Methanol Price ($/lb)
Case 4
$1.50 $3.00 $4.50 $6.00
0%
10%
20%
30%
40%
50%
60%
70%
80%
0.1 0.15 0.2 0.25 0.3 0.35 0.4 0.45
RO
I
Methanol Price ($/lb)
Case 5
$1.50 $3.00 $4.50 $6.00

67
Figure 31 Case 6 sensitivity analysis
0%
10%
20%
30%
40%
50%
60%
70%
80%
0 0.05 0.1 0.15 0.2 0.25 0.3 0.35 0.4 0.45
RO
I
Methanol Price ($/lb)
Case 6
$1.50 $3.00 $4.50 $6.00
Copyright © 2022 FDOKUMEN