On the selection of optimal global geopotential model for geoid modeling: A case study in Pakistan
13
On the selection of optimal global geopotential model for geoid modeling: A case study in Pakistan Muhammad Sadiq a, * , Zulfiqar Ahmad b a National Engineering and Scientific Commission (NESCOM), Presently Ph.D. Scholar at Department of Earth Sciences, Quaid-i-Azam University, Islamabad, Pakistan b Department of Earth Sciences, Quaid-i-Azam University, Post Code 45320, Islamabad, Pakistan Received 19 January 2009; received in revised form 14 April 2009; accepted 3 May 2009 Abstract A statistical comparison has been made between gravity field parameters derived from different global geopotential models (GGMs) and observed gravity anomalies, gravimetric geoid and GPS-Leveling data. The motivation behind this study is the selection of best pos- sible global geopotential model that best matches statistically with the local observed data in Pakistan. This will facilitate in decreasing the load on observed data for the development of regional gravimetric geoid in remove-compute-restore technique when used in the Sto- kes’s integral for computation of the residual part. It is observed that combined geopotential models such as EGM96 and PGM200A, EIGEN-GL04C and EIGEN-CG03C reflect the better match in the total spectral range of gravity and GPS-Leveling data. Results of the precise local geoid model also indicate similar characteristics. A very-high-degree model ‘‘EGM2008” (degree/order 2160) exhibits rel- atively superior statistical fit with observed ground data in Pakistan region. For satellite-only models an increasing trend in the standard deviation can be seen with maximum of about 4 m in difference between GPS-Leveling and corresponding GGM’s geoid with increase in the order from 50 to 120 and then it decreases afterwards. However, for the EIGEN-CHAMP03SP, standard deviation saturates to a value of 3.4 m. This is an indication of contamination in the long to medium wavelength part, i.e. 50–100° for the satellite-only models. Moreover, the models DEOS-CHAMP-01C, GGM02C and then ITG-GRACE03 appear to have better fit for medium to long wave- length and can possibly be recommended for use as long wavelength part with the local observed data. While a hybrid geopotential model selection can be achieved through the selection from either of DEOS-CHAMP-01C, GGM02C, GGM02S, EIGEN-GRACE02S or ITG-GRACE03 in the long wavelength (to degree and order 40) and EGM96, PGM200A, EIGEN-GL04C, EIGEN-CG03C or even EGM2008 in medium to short wavelength, i.e. from degree 41 to maximum degree and order. Ó 2009 COSPAR. Published by Elsevier Ltd. All rights reserved. Keywords: Gravity field parameters; GPS-Leveling; Global geopotential models; Percentage recovery of the gravity field parameters 1. Introduction The medium to long wavelength geoid signal (NL) is the main component of the geoid N, and its value can easily be evaluated from a global geopotential model, defined in terms of a set of spherical harmonic coefficients up to a cer- tain degree and order. The spherical harmonic model relates to the end product of a complex process of mathe- matical modeling by which several data sources are com- bined. These datasets include terrestrial gravity and elevation data for fine details of the gravity field, the obser- vations of artificial earth satellites and satellite altimetry providing information on the predominantly long wave- length characteristics of the gravity. The combination of all these datasets through mathematical modeling leads to the solution for the best approximation of the Earth’s grav- itational field. A real benefit is being obtained in the regional geoid modeling process when a best fit geopotential model is selected for a certain area. Obviously, it will reduce the 0273-1177/$36.00 Ó 2009 COSPAR. Published by Elsevier Ltd. All rights reserved. doi:10.1016/j.asr.2009.05.004 * Corresponding author. Tel.: +92513009190612; fax: +925192188881. E-mail addresses: [email protected] (M. Sadiq), [email protected] (Z. Ahmad). www.elsevier.com/locate/asr Available online at www.sciencedirect.com Advances in Space Research 44 (2009) 627–639
-
Upload
independent -
Category
Documents
-
view
1 -
download
0
Transcript of On the selection of optimal global geopotential model for geoid modeling: A case study in Pakistan
Available online at www.sciencedirect.com
www.elsevier.com/locate/asr
Advances in Space Research 44 (2009) 627–639
On the selection of optimal global geopotential modelfor geoid modeling: A case study in Pakistan
Muhammad Sadiq a,*, Zulfiqar Ahmad b
a National Engineering and Scientific Commission (NESCOM), Presently Ph.D. Scholar at Department of Earth Sciences,
Quaid-i-Azam University, Islamabad, Pakistanb Department of Earth Sciences, Quaid-i-Azam University, Post Code 45320, Islamabad, Pakistan
Received 19 January 2009; received in revised form 14 April 2009; accepted 3 May 2009
Abstract
A statistical comparison has been made between gravity field parameters derived from different global geopotential models (GGMs)and observed gravity anomalies, gravimetric geoid and GPS-Leveling data. The motivation behind this study is the selection of best pos-sible global geopotential model that best matches statistically with the local observed data in Pakistan. This will facilitate in decreasingthe load on observed data for the development of regional gravimetric geoid in remove-compute-restore technique when used in the Sto-kes’s integral for computation of the residual part. It is observed that combined geopotential models such as EGM96 and PGM200A,EIGEN-GL04C and EIGEN-CG03C reflect the better match in the total spectral range of gravity and GPS-Leveling data. Results of theprecise local geoid model also indicate similar characteristics. A very-high-degree model ‘‘EGM2008” (degree/order 2160) exhibits rel-atively superior statistical fit with observed ground data in Pakistan region. For satellite-only models an increasing trend in the standarddeviation can be seen with maximum of about �4 m in difference between GPS-Leveling and corresponding GGM’s geoid with increasein the order from 50 to 120 and then it decreases afterwards. However, for the EIGEN-CHAMP03SP, standard deviation saturates to avalue of 3.4 m. This is an indication of contamination in the long to medium wavelength part, i.e. 50–100� for the satellite-only models.Moreover, the models DEOS-CHAMP-01C, GGM02C and then ITG-GRACE03 appear to have better fit for medium to long wave-length and can possibly be recommended for use as long wavelength part with the local observed data. While a hybrid geopotentialmodel selection can be achieved through the selection from either of DEOS-CHAMP-01C, GGM02C, GGM02S, EIGEN-GRACE02Sor ITG-GRACE03 in the long wavelength (to degree and order 40) and EGM96, PGM200A, EIGEN-GL04C, EIGEN-CG03C or evenEGM2008 in medium to short wavelength, i.e. from degree 41 to maximum degree and order.� 2009 COSPAR. Published by Elsevier Ltd. All rights reserved.
Keywords: Gravity field parameters; GPS-Leveling; Global geopotential models; Percentage recovery of the gravity field parameters
1. Introduction
The medium to long wavelength geoid signal (NL) is themain component of the geoid N, and its value can easily beevaluated from a global geopotential model, defined interms of a set of spherical harmonic coefficients up to a cer-tain degree and order. The spherical harmonic modelrelates to the end product of a complex process of mathe-
0273-1177/$36.00 � 2009 COSPAR. Published by Elsevier Ltd. All rights rese
doi:10.1016/j.asr.2009.05.004
* Corresponding author. Tel.: +92513009190612; fax: +925192188881.E-mail addresses: [email protected] (M. Sadiq), [email protected]
(Z. Ahmad).
matical modeling by which several data sources are com-bined. These datasets include terrestrial gravity andelevation data for fine details of the gravity field, the obser-vations of artificial earth satellites and satellite altimetryproviding information on the predominantly long wave-length characteristics of the gravity. The combination ofall these datasets through mathematical modeling leads tothe solution for the best approximation of the Earth’s grav-itational field.
A real benefit is being obtained in the regional geoidmodeling process when a best fit geopotential model isselected for a certain area. Obviously, it will reduce the
rved.
628 M. Sadiq, Z. Ahmad / Advances in Space Research 44 (2009) 627–639
amount of the geoid contribution required from regionalintegration of Stokes’s formula or some modificationsthereafter. Besides, some inherent errors also exist inGGMs which are generally detected by a suitable compar-ison with local data.
Nowadays additional GGMs are available in the publicdomain (ICGEM http://icgem.gfz.potsdam.de/ICGEM).These models can contribute in a better way to the mediumand long wavelength part of a gravimetric geoid in terms ofresolution and accuracy. These models contain data mainlyfrom CHAMP (Reigber et al., 1999) and GRACE (Reigberet al., 2000) satellite gravity missions. Therefore a study onthe global models will help to establish and select the mostfeasible global model which best matches the spectral prop-erties of the gravity/geoid field in Pakistan area.
It is well known fact that a local gravimetric geoidmodel may become contaminated by the errors due toerrors in both the observed gravity data and GGMs in aparticular area. It is avoidable through the comparisonwith local observed gravity, geoid and GPS-Leveling datawith GGMs derived gravimetric quantities (Kirby et al.,1998). Here, it must be taken into account that these com-parisons give less information in the lower frequencies dueto the well known error in the vertical geodetic data, e.g.bias in the GPS-Leveling data, etc. and long wavelengtherrors in the gravity data (Featherstone, 2002). Therefore,it is thought to be more relevant to study the existingGGMs in the context of presence of representative spectralbands of gravity field in the observed gravity and GPS-Lev-eling data.
As such comparisons of geopotential models with inde-pendent data in a region of interest is the most informativeway of determining the best fit GGM for subsequent gravi-metric geoid studies. The geopotential model that provideclosest statistical fit to the observed ground data can beassumed to be the most suitable model to adopt for thedetermination gravimetric geoid in Pakistan. Such compar-ison is important when combining a geopotential model ina Remove–Restore procedure as best fit model can reducethe impact of the assumptions and approximationsinvolved in the application of Stokes’s formula.
The orthometric height system is being used in Pakistan.Due to unavailability of normal heights, orthometricheights will be employed for the computation gravity fieldparameters. Therefore, comparison of geodetic parametersshould consider the errors caused by using orthometricheights instead of normal heights for the derivation ofobserved as well as model free-air anomalies and onwardgeoid heights. The vertical datum of orthometric heightsystem refers to mean tide system, i.e. mean sea level, soit is pertinent to compare GGM derived geoid with GPS-Leveling geoid in the same tide system. Due to this reason,all the GGM derived parameters were transformed tomean tide system (Lemoine et al., 1998). The difference oforthometric and normal heights, particularly in northernPakistan could be of the order of 3–4 m (Sadiq et al.,2009b). This is particularly important in northern Pakistan,
where such difference would be significant. It could causeerror of the order of 1.0–1.5 mgal in the derived free-airanomalies. In this context it should also be kept in mindthat the best fit of the GGMs with local data here will meanthe lowest standard deviation of the differences and not thebest model (Rudriguez-Caderot et al., 2006) due to theerrors in the vertical leveling data.
The investigations carried out here are essentially a con-tinuation of the work carried out by earlier researchers, e.g.Keasley and Holloway (1989) and Keasley and Govind(1991). Similar to our studies, Kirby et al. (1998), Amosand Featherstone (2003) and Omang et al. (2003) alsomade comparisons based on statistical differences in thetheir particular areas of study. Other procedures could bethe parametric determination and adjustment of the biasand tilt as proposed in Fotopoulus (2005) and Kiamehrand Sjoberg (2005) using a four, five or seven parametertransformation or by estimating the bias and tilt using leastsquare collocation with parameters (Tscherning, 2002)before this statistical fitting process.
The sequence of the study is described as follows: Sec-tion 2 describes some characteristic GGMs and other datasets used for this study with some brief data description.Section 3 briefly describes the GGM selection strategyand comparison of results and finally, discussion on com-parison of results and conclusions are given in Sections 4and 5.
2. Datasets used for comparison
Four data sets have been used which are described withsuitable details in the following sections.
2.1. Global geopotential model gravity anomaly data
To have better insight of the different earth system phys-ical processes, it is necessary to improve our knowledge ofthe gravity field both in terms of accuracy and spatial res-olution (Rummel et al., 2002). This can only be achievedglobally, homogeneously and within a reasonable time per-iod through dedicated satellite missions, such as CHAMPand GRACE and future mission GOCE. These satelliteshave improved our knowledge about the gravity field interms of spatial resolution sensitivity and measurement ofother non-gravitational forces for onward compensation.These satellites are kept as low as possible to achieve bettersignal to noise ratio of the gravity field measured parame-ters. In Pakistan this signal/noise ratio should be higherand distinguishable due to high peaks of the HimalayanRegion.
There are two classes of GGMs which are included inthis test comparison, i.e. satellite-only and combined globalgeopotential models. Tailored models which are developedfrom above types of GGMs have not been included due tonon-availability of enough land gravity data used in thedevelopment of above mentioned models. A total of 13
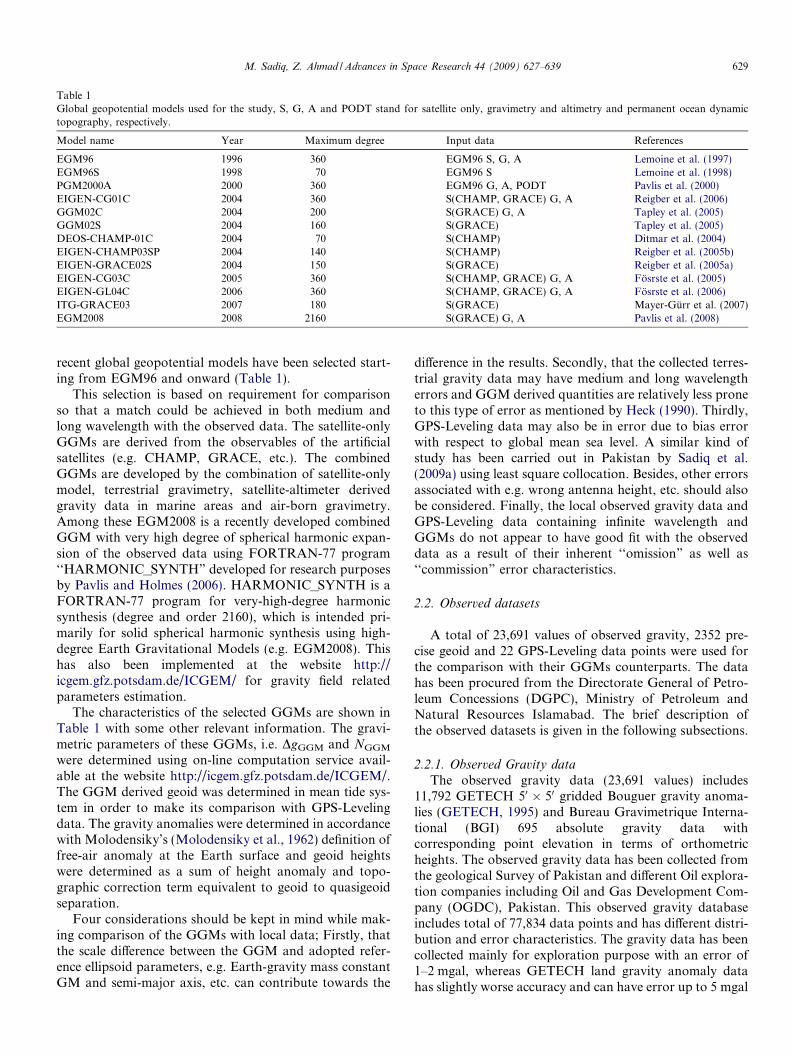
Table 1Global geopotential models used for the study, S, G, A and PODT stand for satellite only, gravimetry and altimetry and permanent ocean dynamictopography, respectively.
Model name Year Maximum degree Input data References
EGM96 1996 360 EGM96 S, G, A Lemoine et al. (1997)EGM96S 1998 70 EGM96 S Lemoine et al. (1998)PGM2000A 2000 360 EGM96 G, A, PODT Pavlis et al. (2000)EIGEN-CG01C 2004 360 S(CHAMP, GRACE) G, A Reigber et al. (2006)GGM02C 2004 200 S(GRACE) G, A Tapley et al. (2005)GGM02S 2004 160 S(GRACE) Tapley et al. (2005)DEOS-CHAMP-01C 2004 70 S(CHAMP) Ditmar et al. (2004)EIGEN-CHAMP03SP 2004 140 S(CHAMP) Reigber et al. (2005b)EIGEN-GRACE02S 2004 150 S(GRACE) Reigber et al. (2005a)EIGEN-CG03C 2005 360 S(CHAMP, GRACE) G, A Fosrste et al. (2005)EIGEN-GL04C 2006 360 S(CHAMP, GRACE) G, A Fosrste et al. (2006)ITG-GRACE03 2007 180 S(GRACE) Mayer-Gurr et al. (2007)EGM2008 2008 2160 S(GRACE) G, A Pavlis et al. (2008)
M. Sadiq, Z. Ahmad / Advances in Space Research 44 (2009) 627–639 629
recent global geopotential models have been selected start-ing from EGM96 and onward (Table 1).
This selection is based on requirement for comparisonso that a match could be achieved in both medium andlong wavelength with the observed data. The satellite-onlyGGMs are derived from the observables of the artificialsatellites (e.g. CHAMP, GRACE, etc.). The combinedGGMs are developed by the combination of satellite-onlymodel, terrestrial gravimetry, satellite-altimeter derivedgravity data in marine areas and air-born gravimetry.Among these EGM2008 is a recently developed combinedGGM with very high degree of spherical harmonic expan-sion of the observed data using FORTRAN-77 program‘‘HARMONIC_SYNTH” developed for research purposesby Pavlis and Holmes (2006). HARMONIC_SYNTH is aFORTRAN-77 program for very-high-degree harmonicsynthesis (degree and order 2160), which is intended pri-marily for solid spherical harmonic synthesis using high-degree Earth Gravitational Models (e.g. EGM2008). Thishas also been implemented at the website http://icgem.gfz.potsdam.de/ICGEM/ for gravity field relatedparameters estimation.
The characteristics of the selected GGMs are shown inTable 1 with some other relevant information. The gravi-metric parameters of these GGMs, i.e. DgGGM and NGGM
were determined using on-line computation service avail-able at the website http://icgem.gfz.potsdam.de/ICGEM/.The GGM derived geoid was determined in mean tide sys-tem in order to make its comparison with GPS-Levelingdata. The gravity anomalies were determined in accordancewith Molodensiky’s (Molodensiky et al., 1962) definition offree-air anomaly at the Earth surface and geoid heightswere determined as a sum of height anomaly and topo-graphic correction term equivalent to geoid to quasigeoidseparation.
Four considerations should be kept in mind while mak-ing comparison of the GGMs with local data; Firstly, thatthe scale difference between the GGM and adopted refer-ence ellipsoid parameters, e.g. Earth-gravity mass constantGM and semi-major axis, etc. can contribute towards the
difference in the results. Secondly, that the collected terres-trial gravity data may have medium and long wavelengtherrors and GGM derived quantities are relatively less proneto this type of error as mentioned by Heck (1990). Thirdly,GPS-Leveling data may also be in error due to bias errorwith respect to global mean sea level. A similar kind ofstudy has been carried out in Pakistan by Sadiq et al.(2009a) using least square collocation. Besides, other errorsassociated with e.g. wrong antenna height, etc. should alsobe considered. Finally, the local observed gravity data andGPS-Leveling data containing infinite wavelength andGGMs do not appear to have good fit with the observeddata as a result of their inherent ‘‘omission” as well as‘‘commission” error characteristics.
2.2. Observed datasets
A total of 23,691 values of observed gravity, 2352 pre-cise geoid and 22 GPS-Leveling data points were used forthe comparison with their GGMs counterparts. The datahas been procured from the Directorate General of Petro-leum Concessions (DGPC), Ministry of Petroleum andNatural Resources Islamabad. The brief description ofthe observed datasets is given in the following subsections.
2.2.1. Observed Gravity data
The observed gravity data (23,691 values) includes11,792 GETECH 50 � 50 gridded Bouguer gravity anoma-lies (GETECH, 1995) and Bureau Gravimetrique Interna-tional (BGI) 695 absolute gravity data withcorresponding point elevation in terms of orthometricheights. The observed gravity data has been collected fromthe geological Survey of Pakistan and different Oil explora-tion companies including Oil and Gas Development Com-pany (OGDC), Pakistan. This observed gravity databaseincludes total of 77,834 data points and has different distri-bution and error characteristics. The gravity data has beencollected mainly for exploration purpose with an error of1–2 mgal, whereas GETECH land gravity anomaly datahas slightly worse accuracy and can have error up to 5 mgal
630 M. Sadiq, Z. Ahmad / Advances in Space Research 44 (2009) 627–639
(GETECH, 1995). The distribution of the observed gravitydata has an average interval of 2 min and becomes 2–50
after combination with GETECH Bouguer anomaly data.The observed gravity and GETECH Bouguer anomaly
data was first reduced to surface free-air anomalies (seeEq. (1)), and later gravity anomaly values obtained fromeach of the above mentioned models were subtracted toobtain the residual values (Eq. (3)) for statisticalcomparison.
DgFA ¼ gobs � c0 þdc
dH N H N
� �ð1Þ
where HN is the normal height; DgFA, free-air anomaly(Torge, 2001, p. 218) at the Earth surface; gobs, observed(terrestrial) gravity; co, normal gravity at the ellipsoid(GRS80) (Torge, 1980) using closed formula of Somigliana(Heiskanen and Moritz, 1967)
c0 ¼ ce1þ k sin2 uffiffiffiffiffiffiffiffiffiffiffiffiffi1� e2p
sin2 uð2Þ
where k ¼ bcp
ace� 1, ce ¼ kM
ab ð1� 32m� 3
14e=2mÞ and
cp ¼ kMa2 ð1þ m� 3
7e=2mÞ; a, b are major and minor semi-
axes of the ellipsoid, respectively; ce, cp, normal gravity at
the equator and poles, respectively; e=2, a, square of the2nd ellipsoidal eccentricity and geodetic latitude.
All the land gravity data might not be referenced tosame reference ellipsoid as information was missing on thissubject for some datasets (GETECH, 1995). However,most of the data was referenced to GRS80 formula. There-fore, it was supposed that all data is referenced to sameellipsoidal datum, i.e. GRS80 and no additional correctionmade to the observed data for global data comparison. Thecomparison of free-air anomaly refers to
DgDiff ¼ DgFA � DgGGM ð3Þ
where DgDiff is difference of gravity anomalies derived fromGGMs and observed data and DgGGM is gravity anomalyfrom a geopotential model at the Earth surface in accor-dance of definition Molodensiky’s definition. The corre-sponding gravity and height anomaly/geoid signal weredetermined from the spherical harmonic expansions
DgGGM ¼GM
R2
XM
n¼2
ðn� 1Þ
�X360
m¼0
Cnm cos mkþ Snm sin mk� �
P nmðsin uÞ ð4Þ
and surface height anomaly
foðu; k; rÞ ¼GMcr
XM
n¼2
ar
� �n
�X360
m¼0
Cnm cos mkþ Snm sin mk� �
P nmðsin uÞ
ð5Þ
where ‘‘c” is the normal gravity at the ellipsoid and ‘‘a” isits semi-major axis, Cnm; Snm are fully normalized potentialcoefficients of degree n and order m and P nm is fully normal-ized Legendre functions. The maximum harmonic expan-sion used for the models is shown in Table 1. Thecorresponding model geoid heights can be derived by usingthe additional term of geoid-quasigeoid separation whichcan also be computed at the same website http://icgem.gfz.potsdam.de/ICGEM/ as a combined solution.
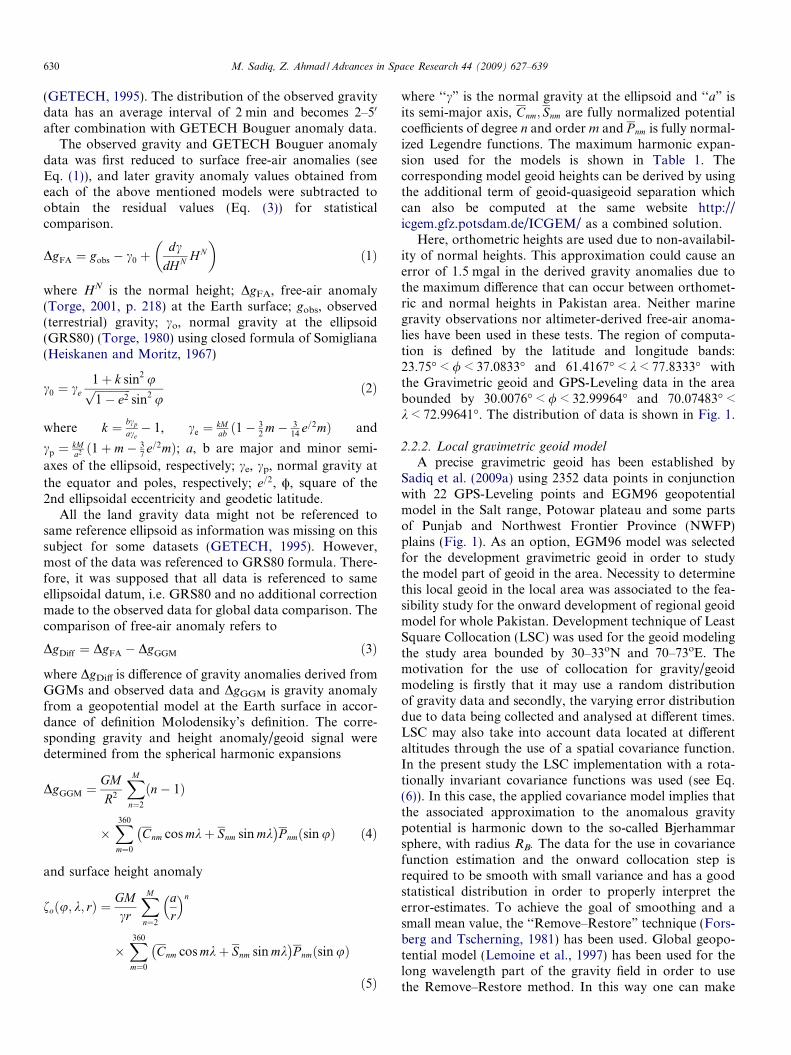
Here, orthometric heights are used due to non-availabil-ity of normal heights. This approximation could cause anerror of 1.5 mgal in the derived gravity anomalies due tothe maximum difference that can occur between orthomet-ric and normal heights in Pakistan area. Neither marinegravity observations nor altimeter-derived free-air anoma-lies have been used in these tests. The region of computa-tion is defined by the latitude and longitude bands:23.75� < / < 37.0833� and 61.4167� < k < 77.8333� withthe Gravimetric geoid and GPS-Leveling data in the areabounded by 30.0076� < / < 32.99964� and 70.07483� <k < 72.99641�. The distribution of data is shown in Fig. 1.
2.2.2. Local gravimetric geoid modelA precise gravimetric geoid has been established by
Sadiq et al. (2009a) using 2352 data points in conjunctionwith 22 GPS-Leveling points and EGM96 geopotentialmodel in the Salt range, Potowar plateau and some partsof Punjab and Northwest Frontier Province (NWFP)plains (Fig. 1). As an option, EGM96 model was selectedfor the development gravimetric geoid in order to studythe model part of geoid in the area. Necessity to determinethis local geoid in the local area was associated to the fea-sibility study for the onward development of regional geoidmodel for whole Pakistan. Development technique of LeastSquare Collocation (LSC) was used for the geoid modelingthe study area bounded by 30–33oN and 70–73oE. Themotivation for the use of collocation for gravity/geoidmodeling is firstly that it may use a random distributionof gravity data and secondly, the varying error distributiondue to data being collected and analysed at different times.LSC may also take into account data located at differentaltitudes through the use of a spatial covariance function.In the present study the LSC implementation with a rota-tionally invariant covariance functions was used (see Eq.(6)). In this case, the applied covariance model implies thatthe associated approximation to the anomalous gravitypotential is harmonic down to the so-called Bjerhammarsphere, with radius RB. The data for the use in covariancefunction estimation and the onward collocation step isrequired to be smooth with small variance and has a goodstatistical distribution in order to properly interpret theerror-estimates. To achieve the goal of smoothing and asmall mean value, the ‘‘Remove–Restore” technique (Fors-berg and Tscherning, 1981) has been used. Global geopo-tential model (Lemoine et al., 1997) has been used for thelong wavelength part of the gravity field in order to usethe Remove–Restore method. In this way one can make
62 64 66 68 70 72 74 76
24
26
28
30
32
34
36
Longitude(degrees)
Latit
ude(
degr
ees)
Fig. 1. Distribution of land gravity GPS-Leveling and gravimetric geoid data (black filled circle, observed gravity data; green filled square, gravimetricgeoid; red filled triangle, GPS-Leveling geoid). (For interpretation of the references to color in this figure legend, the reader is referred to the web version ofthis paper.)
M. Sadiq, Z. Ahmad / Advances in Space Research 44 (2009) 627–639 631
combination solution which can be applicable to a limitedregion.
The terrain effects have been calculated using the pureresidual terrain modeling (RTM) technique (Forsbergand Tscherning, 1997). In this reduction technique topo-graphic irregularities relative to a smooth mean elevationsurface with resolution comparable to the resolution ofthe used EGM are computationally removed. For a meanelevation surface a reference elevation grid is generatedfrom 1 km � 1 km SRTM30 (USGS, EROS data Center)data by means of GRAVSOFT (Tscherning et al., 1992;Tscherning, 1994) programs SELECT and TCGRID. Thegenerally recommended smoothing (Forsberg and Tschern-ing, 1997) was achieved by preparing a 20 grid from the 3000
elevation grid which was again passed by a filter with meanfactors of 3, 3 cells (to make 60 grid) and average factors of3, 3 (to make a 180 grid) to obtain the reference height grid.Moreover, a reference grid of resolution of about 36 km isconstructed for optimum RTM reduction with near zero
Table 2Observed, RTM and residual gravity data used for geoid determination. FAA
Physical parameter Observed gravity data
Minimum
Elevation (m) 106.2Observed FAA at topography (mgal) �167.54EGM962 FAA at topography (mgal) �122.79Residual EGM FAA (mgal) �57.777RTM effect on gravity (mgal) �27.64RTM residual FAA (mgal) �51.93
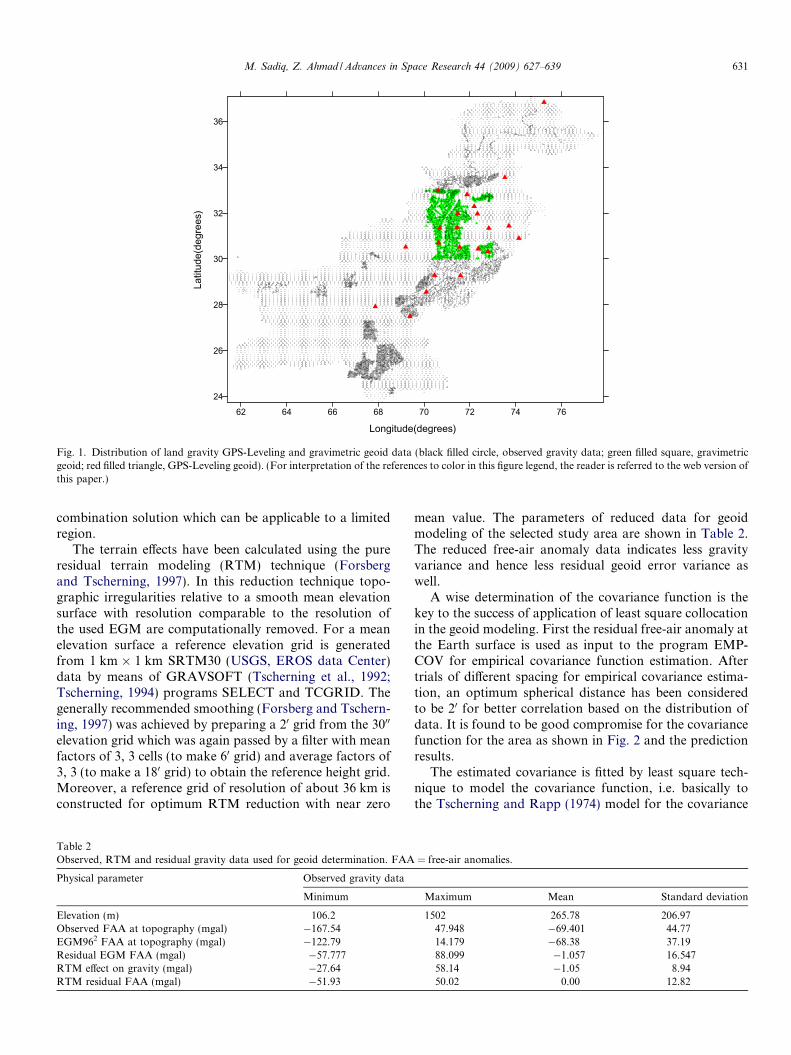
mean value. The parameters of reduced data for geoidmodeling of the selected study area are shown in Table 2.The reduced free-air anomaly data indicates less gravityvariance and hence less residual geoid error variance aswell.
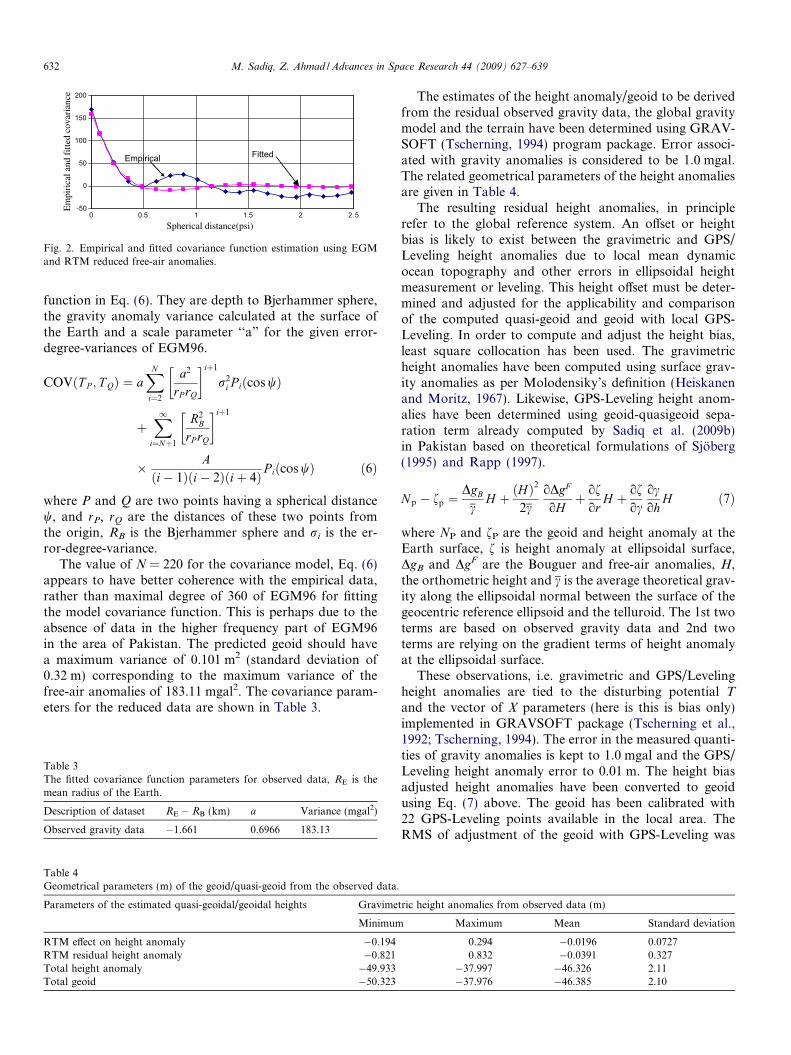
A wise determination of the covariance function is thekey to the success of application of least square collocationin the geoid modeling. First the residual free-air anomaly atthe Earth surface is used as input to the program EMP-COV for empirical covariance function estimation. Aftertrials of different spacing for empirical covariance estima-tion, an optimum spherical distance has been consideredto be 20 for better correlation based on the distribution ofdata. It is found to be good compromise for the covariancefunction for the area as shown in Fig. 2 and the predictionresults.
The estimated covariance is fitted by least square tech-nique to model the covariance function, i.e. basically tothe Tscherning and Rapp (1974) model for the covariance
= free-air anomalies.
Maximum Mean Standard deviation
1502 265.78 206.9747.948 �69.401 44.7714.179 �68.38 37.1988.099 �1.057 16.54758.14 �1.05 8.9450.02 0.00 12.82
-50
0
50
100
150
200
0 0.5 1 1.5 2 2.5Spherical distance(psi)
Em
piri
cal a
nd f
itted
cov
aria
nce
FittedEmpirical
Fig. 2. Empirical and fitted covariance function estimation using EGMand RTM reduced free-air anomalies.
632 M. Sadiq, Z. Ahmad / Advances in Space Research 44 (2009) 627–639
function in Eq. (6). They are depth to Bjerhammer sphere,the gravity anomaly variance calculated at the surface ofthe Earth and a scale parameter ‘‘a” for the given error-degree-variances of EGM96.
COVðT P ; T QÞ ¼ aXN
i¼2
a2
rP rQ
iþ1
r2i P iðcos wÞ
þX1
i¼Nþ1
R2B
rP rQ
iþ1
� Aði� 1Þði� 2Þðiþ 4Þ P iðcos wÞ ð6Þ
where P and Q are two points having a spherical distancew, and rP, rQ are the distances of these two points fromthe origin, RB is the Bjerhammer sphere and ri is the er-ror-degree-variance.
The value of N = 220 for the covariance model, Eq. (6)appears to have better coherence with the empirical data,rather than maximal degree of 360 of EGM96 for fittingthe model covariance function. This is perhaps due to theabsence of data in the higher frequency part of EGM96in the area of Pakistan. The predicted geoid should havea maximum variance of 0.101 m2 (standard deviation of0.32 m) corresponding to the maximum variance of thefree-air anomalies of 183.11 mgal2. The covariance param-eters for the reduced data are shown in Table 3.
Table 3The fitted covariance function parameters for observed data, RE is themean radius of the Earth.
Description of dataset RE � RB (km) a Variance (mgal2)
Observed gravity data �1.661 0.6966 183.13
Table 4Geometrical parameters (m) of the geoid/quasi-geoid from the observed data.
Parameters of the estimated quasi-geoidal/geoidal heights Gravime
Minimum
RTM effect on height anomaly �0.194RTM residual height anomaly �0.821Total height anomaly �49.933Total geoid �50.323
The estimates of the height anomaly/geoid to be derivedfrom the residual observed gravity data, the global gravitymodel and the terrain have been determined using GRAV-SOFT (Tscherning, 1994) program package. Error associ-ated with gravity anomalies is considered to be 1.0 mgal.The related geometrical parameters of the height anomaliesare given in Table 4.
The resulting residual height anomalies, in principlerefer to the global reference system. An offset or heightbias is likely to exist between the gravimetric and GPS/Leveling height anomalies due to local mean dynamicocean topography and other errors in ellipsoidal heightmeasurement or leveling. This height offset must be deter-mined and adjusted for the applicability and comparisonof the computed quasi-geoid and geoid with local GPS-Leveling. In order to compute and adjust the height bias,least square collocation has been used. The gravimetricheight anomalies have been computed using surface grav-ity anomalies as per Molodensiky’s definition (Heiskanenand Moritz, 1967). Likewise, GPS-Leveling height anom-alies have been determined using geoid-quasigeoid sepa-ration term already computed by Sadiq et al. (2009b)in Pakistan based on theoretical formulations of Sjoberg(1995) and Rapp (1997).
N p � fp ¼DgB
cH þ ðHÞ
2
2coDgF
oHþ of
orH þ of
ococoh
H ð7Þ
where NP and fP are the geoid and height anomaly at theEarth surface, f is height anomaly at ellipsoidal surface,DgB and DgF are the Bouguer and free-air anomalies, H,the orthometric height and c is the average theoretical grav-ity along the ellipsoidal normal between the surface of thegeocentric reference ellipsoid and the telluroid. The 1st twoterms are based on observed gravity data and 2nd twoterms are relying on the gradient terms of height anomalyat the ellipsoidal surface.
These observations, i.e. gravimetric and GPS/Levelingheight anomalies are tied to the disturbing potential T
and the vector of X parameters (here is this is bias only)implemented in GRAVSOFT package (Tscherning et al.,1992; Tscherning, 1994). The error in the measured quanti-ties of gravity anomalies is kept to 1.0 mgal and the GPS/Leveling height anomaly error to 0.01 m. The height biasadjusted height anomalies have been converted to geoidusing Eq. (7) above. The geoid has been calibrated with22 GPS-Leveling points available in the local area. TheRMS of adjustment of the geoid with GPS-Leveling was
tric height anomalies from observed data (m)
Maximum Mean Standard deviation
0.294 �0.0196 0.07270.832 �0.0391 0.327
�37.997 �46.326 2.11�37.976 �46.385 2.10
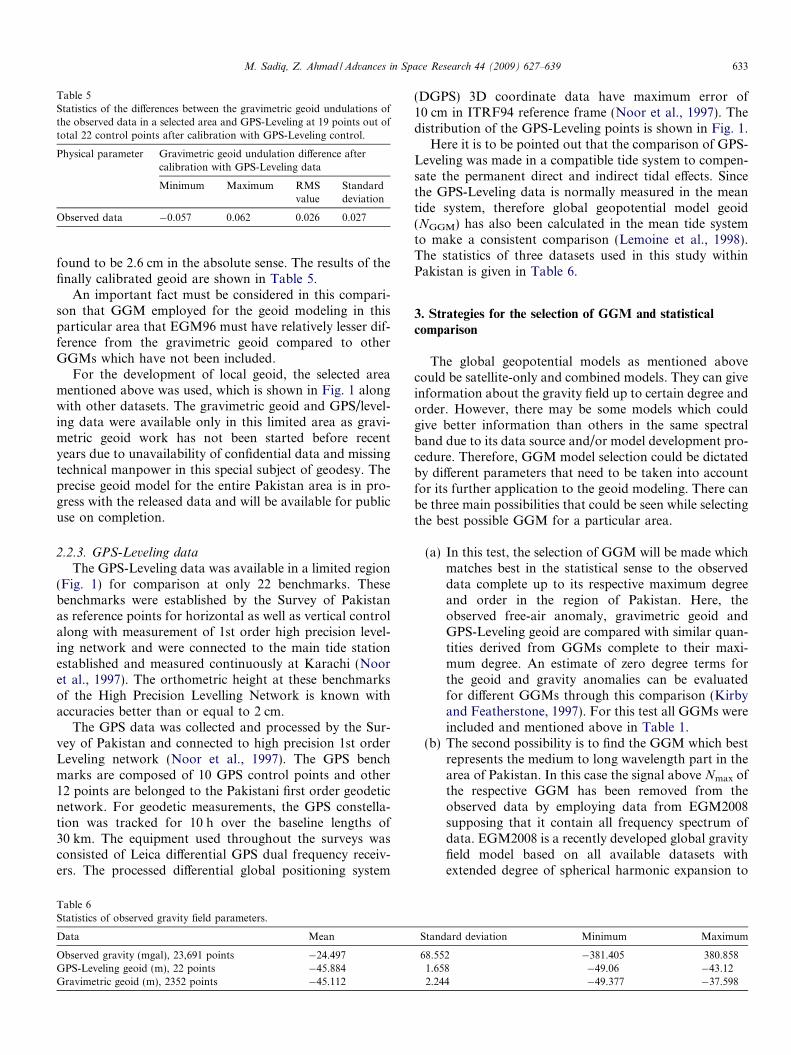
Table 5Statistics of the differences between the gravimetric geoid undulations ofthe observed data in a selected area and GPS-Leveling at 19 points out oftotal 22 control points after calibration with GPS-Leveling control.
Physical parameter Gravimetric geoid undulation difference aftercalibration with GPS-Leveling data
Minimum Maximum RMSvalue
Standarddeviation
Observed data �0.057 0.062 0.026 0.027
M. Sadiq, Z. Ahmad / Advances in Space Research 44 (2009) 627–639 633
found to be 2.6 cm in the absolute sense. The results of thefinally calibrated geoid are shown in Table 5.
An important fact must be considered in this compari-son that GGM employed for the geoid modeling in thisparticular area that EGM96 must have relatively lesser dif-ference from the gravimetric geoid compared to otherGGMs which have not been included.
For the development of local geoid, the selected areamentioned above was used, which is shown in Fig. 1 alongwith other datasets. The gravimetric geoid and GPS/level-ing data were available only in this limited area as gravi-metric geoid work has not been started before recentyears due to unavailability of confidential data and missingtechnical manpower in this special subject of geodesy. Theprecise geoid model for the entire Pakistan area is in pro-gress with the released data and will be available for publicuse on completion.
2.2.3. GPS-Leveling data
The GPS-Leveling data was available in a limited region(Fig. 1) for comparison at only 22 benchmarks. Thesebenchmarks were established by the Survey of Pakistanas reference points for horizontal as well as vertical controlalong with measurement of 1st order high precision level-ing network and were connected to the main tide stationestablished and measured continuously at Karachi (Nooret al., 1997). The orthometric height at these benchmarksof the High Precision Levelling Network is known withaccuracies better than or equal to 2 cm.
The GPS data was collected and processed by the Sur-vey of Pakistan and connected to high precision 1st orderLeveling network (Noor et al., 1997). The GPS benchmarks are composed of 10 GPS control points and other12 points are belonged to the Pakistani first order geodeticnetwork. For geodetic measurements, the GPS constella-tion was tracked for 10 h over the baseline lengths of30 km. The equipment used throughout the surveys wasconsisted of Leica differential GPS dual frequency receiv-ers. The processed differential global positioning system
Table 6Statistics of observed gravity field parameters.
Data Mean
Observed gravity (mgal), 23,691 points �24.497GPS-Leveling geoid (m), 22 points �45.884Gravimetric geoid (m), 2352 points �45.112
(DGPS) 3D coordinate data have maximum error of10 cm in ITRF94 reference frame (Noor et al., 1997). Thedistribution of the GPS-Leveling points is shown in Fig. 1.
Here it is to be pointed out that the comparison of GPS-Leveling was made in a compatible tide system to compen-sate the permanent direct and indirect tidal effects. Sincethe GPS-Leveling data is normally measured in the meantide system, therefore global geopotential model geoid(NGGM) has also been calculated in the mean tide systemto make a consistent comparison (Lemoine et al., 1998).The statistics of three datasets used in this study withinPakistan is given in Table 6.
3. Strategies for the selection of GGM and statistical
comparison
The global geopotential models as mentioned abovecould be satellite-only and combined models. They can giveinformation about the gravity field up to certain degree andorder. However, there may be some models which couldgive better information than others in the same spectralband due to its data source and/or model development pro-cedure. Therefore, GGM model selection could be dictatedby different parameters that need to be taken into accountfor its further application to the geoid modeling. There canbe three main possibilities that could be seen while selectingthe best possible GGM for a particular area.
(a) In this test, the selection of GGM will be made whichmatches best in the statistical sense to the observeddata complete up to its respective maximum degreeand order in the region of Pakistan. Here, theobserved free-air anomaly, gravimetric geoid andGPS-Leveling geoid are compared with similar quan-tities derived from GGMs complete to their maxi-mum degree. An estimate of zero degree terms forthe geoid and gravity anomalies can be evaluatedfor different GGMs through this comparison (Kirbyand Featherstone, 1997). For this test all GGMs wereincluded and mentioned above in Table 1.
(b) The second possibility is to find the GGM which bestrepresents the medium to long wavelength part in thearea of Pakistan. In this case the signal above Nmax ofthe respective GGM has been removed from theobserved data by employing data from EGM2008supposing that it contain all frequency spectrum ofdata. EGM2008 is a recently developed global gravityfield model based on all available datasets withextended degree of spherical harmonic expansion to
Standard deviation Minimum Maximum
68.552 �381.405 380.8581.658 �49.06 �43.122.244 �49.377 �37.598
634 M. Sadiq, Z. Ahmad / Advances in Space Research 44 (2009) 627–639
degree and order 2160 (Pavlis et al., 2008). Then thesequantities are compared with the residual free-airanomalies and geoids from observed datasets. Forthis comparison all the satellite-only GGMs havebeen considered as per selection in Table 1.
(c) There is another option for the selection of best pos-sible model based on the spectral properties of a par-ticular model in the long and the medium wavelengthparts, e.g. CHAMP and GRACE Satellites basedmodels should have good coverage of actual longwavelength part due to their altitude and bettersensors. They could be good candidates for longwavelength parts as mentioned by Amos andFeatherstone (2003), Vanıcek and Sjoberg (1991)and Rummel et al. (2002) in the range from 30� to40� in the long wavelength range and above thesedegrees could be taken from combined models, e.g.EGM96 or EIGEN-GL04C or even EGM2008.
Since, the GGMs derived gravimetric quantities do notcontain the zero and 1st degree terms. These ‘‘forbidden”
degrees can distort the mean value of the differencebetween observed and GGM derived gravity anomaliesand geoid. Among the statistics used for the comparisonof difference between geopotential model and ground truth
Table 7Statistics of difference (mgal) among observed and model gravity values to th
Model name Maximum degree Mean
EGM96 360 �4.005EGM96S 70 �18.275PGM2000A 360 �3.967EIGEN-CG01C 360 �4.237GGM02C 200 �5.797GGM02S 160 �6.075DEOS-CHAMP-01C 70 �13.542EIGEN-CHAMP03SP 140 �11.631EIGEN-GRACE02S 150 �4.937EIGEN-CG03C 360 �3.50EIGEN-GL04C 360 �3.867ITG-GRACE03 180 �5.704EGM2008 2160 �0.655
Table 8Statistics of difference (m) of gravimetric and global geo potential geoid.
Model name Maximum degree Mean
EGM96 360 �0.972EGM96S 70 �5.220PGM2000A 360 �0.969EIGEN-CG01C 360 �1.227GGM02C 200 �1.162GGM02S 160 �1.831DEOS-CHAMP-01C 70 �2.751EIGEN-CHAMP03SP 140 �2.052EIGEN-GRACE02S 150 �1.508EIGEN-CG03C 360 �1.163EIGEN-GL04C 360 �1.182ITG-GRACE03 180 �1.133EGM2008 2160 �0.460
data, standard deviation is most informative because themean and RMS differences are distorted by the exclusionof the zero order term.
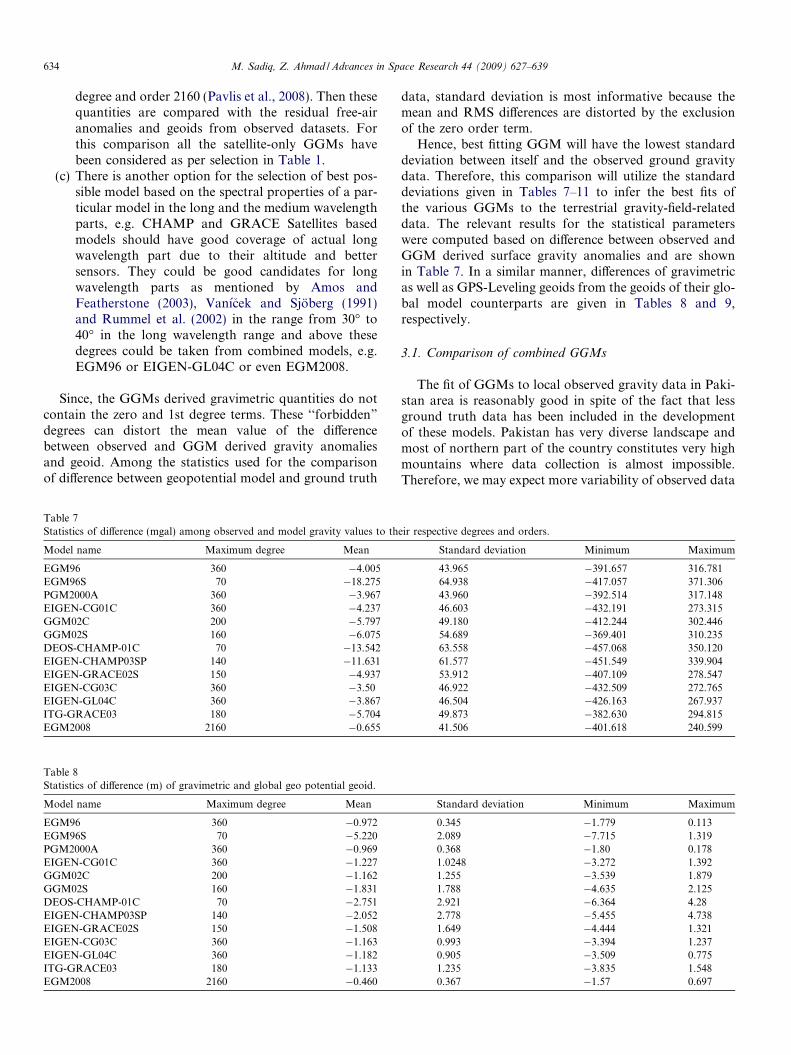
Hence, best fitting GGM will have the lowest standarddeviation between itself and the observed ground gravitydata. Therefore, this comparison will utilize the standarddeviations given in Tables 7–11 to infer the best fits ofthe various GGMs to the terrestrial gravity-field-relateddata. The relevant results for the statistical parameterswere computed based on difference between observed andGGM derived surface gravity anomalies and are shownin Table 7. In a similar manner, differences of gravimetricas well as GPS-Leveling geoids from the geoids of their glo-bal model counterparts are given in Tables 8 and 9,respectively.
3.1. Comparison of combined GGMs
The fit of GGMs to local observed gravity data in Paki-stan area is reasonably good in spite of the fact that lessground truth data has been included in the developmentof these models. Pakistan has very diverse landscape andmost of northern part of the country constitutes very highmountains where data collection is almost impossible.Therefore, we may expect more variability of observed data
eir respective degrees and orders.
Standard deviation Minimum Maximum
43.965 �391.657 316.78164.938 �417.057 371.30643.960 �392.514 317.14846.603 �432.191 273.31549.180 �412.244 302.44654.689 �369.401 310.23563.558 �457.068 350.12061.577 �451.549 339.90453.912 �407.109 278.54746.922 �432.509 272.76546.504 �426.163 267.93749.873 �382.630 294.81541.506 �401.618 240.599
Standard deviation Minimum Maximum
0.345 �1.779 0.1132.089 �7.715 1.3190.368 �1.80 0.1781.0248 �3.272 1.3921.255 �3.539 1.8791.788 �4.635 2.1252.921 �6.364 4.282.778 �5.455 4.7381.649 �4.444 1.3210.993 �3.394 1.2370.905 �3.509 0.7751.235 �3.835 1.5480.367 �1.57 0.697
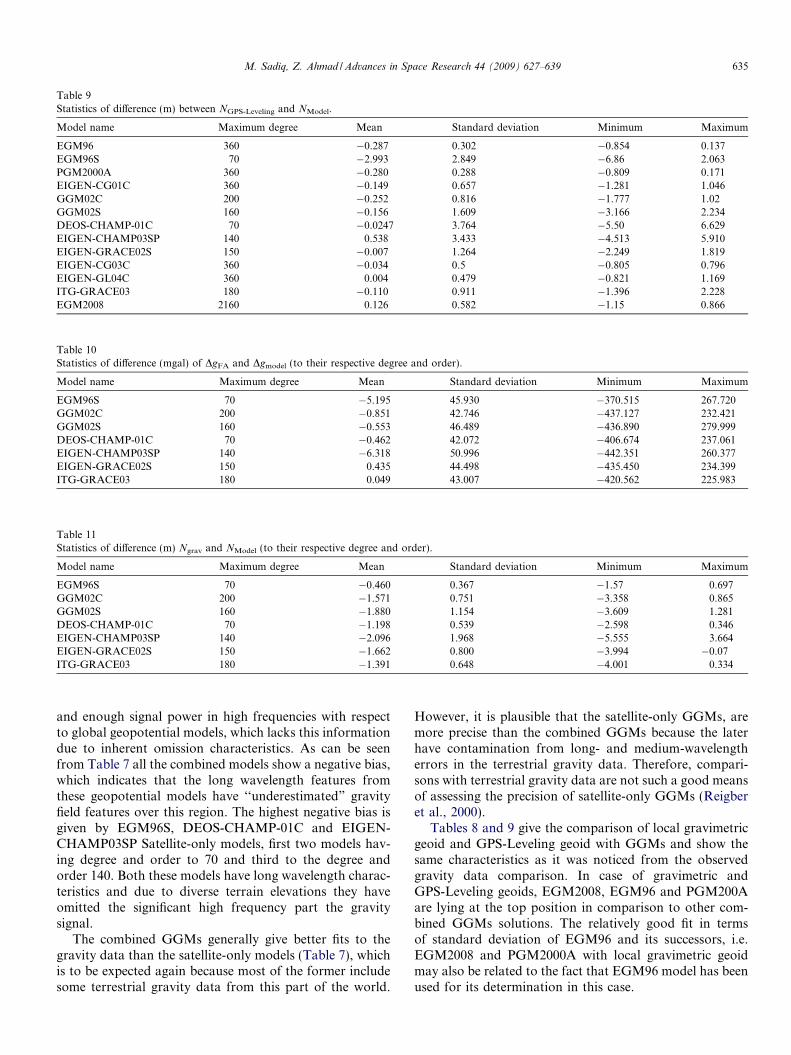
Table 9Statistics of difference (m) between NGPS-Leveling and NModel.
Model name Maximum degree Mean Standard deviation Minimum Maximum
EGM96 360 �0.287 0.302 �0.854 0.137EGM96S 70 �2.993 2.849 �6.86 2.063PGM2000A 360 �0.280 0.288 �0.809 0.171EIGEN-CG01C 360 �0.149 0.657 �1.281 1.046GGM02C 200 �0.252 0.816 �1.777 1.02GGM02S 160 �0.156 1.609 �3.166 2.234DEOS-CHAMP-01C 70 �0.0247 3.764 �5.50 6.629EIGEN-CHAMP03SP 140 0.538 3.433 �4.513 5.910EIGEN-GRACE02S 150 �0.007 1.264 �2.249 1.819EIGEN-CG03C 360 �0.034 0.5 �0.805 0.796EIGEN-GL04C 360 0.004 0.479 �0.821 1.169ITG-GRACE03 180 �0.110 0.911 �1.396 2.228EGM2008 2160 0.126 0.582 �1.15 0.866
Table 10Statistics of difference (mgal) of DgFA and Dgmodel (to their respective degree and order).
Model name Maximum degree Mean Standard deviation Minimum Maximum
EGM96S 70 �5.195 45.930 �370.515 267.720GGM02C 200 �0.851 42.746 �437.127 232.421GGM02S 160 �0.553 46.489 �436.890 279.999DEOS-CHAMP-01C 70 �0.462 42.072 �406.674 237.061EIGEN-CHAMP03SP 140 �6.318 50.996 �442.351 260.377EIGEN-GRACE02S 150 0.435 44.498 �435.450 234.399ITG-GRACE03 180 0.049 43.007 �420.562 225.983
Table 11Statistics of difference (m) Ngrav and NModel (to their respective degree and order).
Model name Maximum degree Mean Standard deviation Minimum Maximum
EGM96S 70 �0.460 0.367 �1.57 0.697GGM02C 200 �1.571 0.751 �3.358 0.865GGM02S 160 �1.880 1.154 �3.609 1.281DEOS-CHAMP-01C 70 �1.198 0.539 �2.598 0.346EIGEN-CHAMP03SP 140 �2.096 1.968 �5.555 3.664EIGEN-GRACE02S 150 �1.662 0.800 �3.994 �0.07ITG-GRACE03 180 �1.391 0.648 �4.001 0.334
M. Sadiq, Z. Ahmad / Advances in Space Research 44 (2009) 627–639 635
and enough signal power in high frequencies with respectto global geopotential models, which lacks this informationdue to inherent omission characteristics. As can be seenfrom Table 7 all the combined models show a negative bias,which indicates that the long wavelength features fromthese geopotential models have ‘‘underestimated” gravityfield features over this region. The highest negative bias isgiven by EGM96S, DEOS-CHAMP-01C and EIGEN-CHAMP03SP Satellite-only models, first two models hav-ing degree and order to 70 and third to the degree andorder 140. Both these models have long wavelength charac-teristics and due to diverse terrain elevations they haveomitted the significant high frequency part the gravitysignal.
The combined GGMs generally give better fits to thegravity data than the satellite-only models (Table 7), whichis to be expected again because most of the former includesome terrestrial gravity data from this part of the world.
However, it is plausible that the satellite-only GGMs, aremore precise than the combined GGMs because the laterhave contamination from long- and medium-wavelengtherrors in the terrestrial gravity data. Therefore, compari-sons with terrestrial gravity data are not such a good meansof assessing the precision of satellite-only GGMs (Reigberet al., 2000).
Tables 8 and 9 give the comparison of local gravimetricgeoid and GPS-Leveling geoid with GGMs and show thesame characteristics as it was noticed from the observedgravity data comparison. In case of gravimetric andGPS-Leveling geoids, EGM2008, EGM96 and PGM200Aare lying at the top position in comparison to other com-bined GGMs solutions. The relatively good fit in termsof standard deviation of EGM96 and its successors, i.e.EGM2008 and PGM2000A with local gravimetric geoidmay also be related to the fact that EGM96 model has beenused for its determination in this case.
636 M. Sadiq, Z. Ahmad / Advances in Space Research 44 (2009) 627–639
The fit of the GGMs to the GPS-Leveling data has con-sistently same characteristics (Table 9). Acknowledging thepresence of GPS-Leveling errors as well as more ruggedtopography and gravity field variations in Pakistan, thisdifference is likely to exit and could be as large as 0.7 m(Sadiq et al., 2009a).
There are some candidates having lowest mean andstandard deviations; among them, EGM2008, EIGEN-CG01C, EIGEN-CG03C, EIGEN-GL04C, PGM2000Aand GEGM96 indicate mean difference in the range from�3.5 to �4.0 mgal throughout Pakistan due to their com-bined model characteristics. PGM2000A has been modeledby adding more data from PODT in addition to EGM96data and modeling (Pavlis et al., 2000) and has slightly bet-ter fit than EGM96 in all three data sets. A more recentlydeveloped combined model EGM2008 (Pavlis et al.,2008) has even better fit characteristics due to inclusionof very high frequency components by expansion to degreeand order 2160 and include better long and short wave-length characteristics as it is evident from results Tables7–9. This shows that better fit of these models with terres-trial values can be achieved if spherical harmonic expan-sion of the GGM increases. Here, this may be kept inmind that fit of combined GGMs may be considered interms of less omission error characteristics of model andnot necessarily improvement in low frequency part (Amosand Featherstone, 2003).
Among others are EIGEN-CG01C, EIGEN-CG03Cand EIGEN-GL04C all having comparable statistics(Table 7). The statistics of difference from GPS-Levelingand global model geoid show that some other global modelcan be considered as good candidates for this purpose.Among these, EIGEN-CG03C EIGEN-GL04C andEIGEN-CG01C are having relatively good statisticalparameters. Other GGMs have relatively bad fit with thedata for the use with Remove–Restore problem. The fitof GPS-Leveling may also be deteriorated due the presenceof vertical bias, a parameter normally exists as a result ofpermanent offset between local and global mean sea leveldue to permanent ocean dynamic topography (Torge,2001) in addition to the contribution from the ‘‘forbidden”
zero and 1st terms for the geopotential models (Kirby andFeatherstone, 1997).
0
0.5
1
1.5
2
2.5
3
3.5
4
4.5
0 50 100 150Degrees
Sta
ndard
devi
atio
n
Fig. 3. Plot of standard deviations (m) of differences of
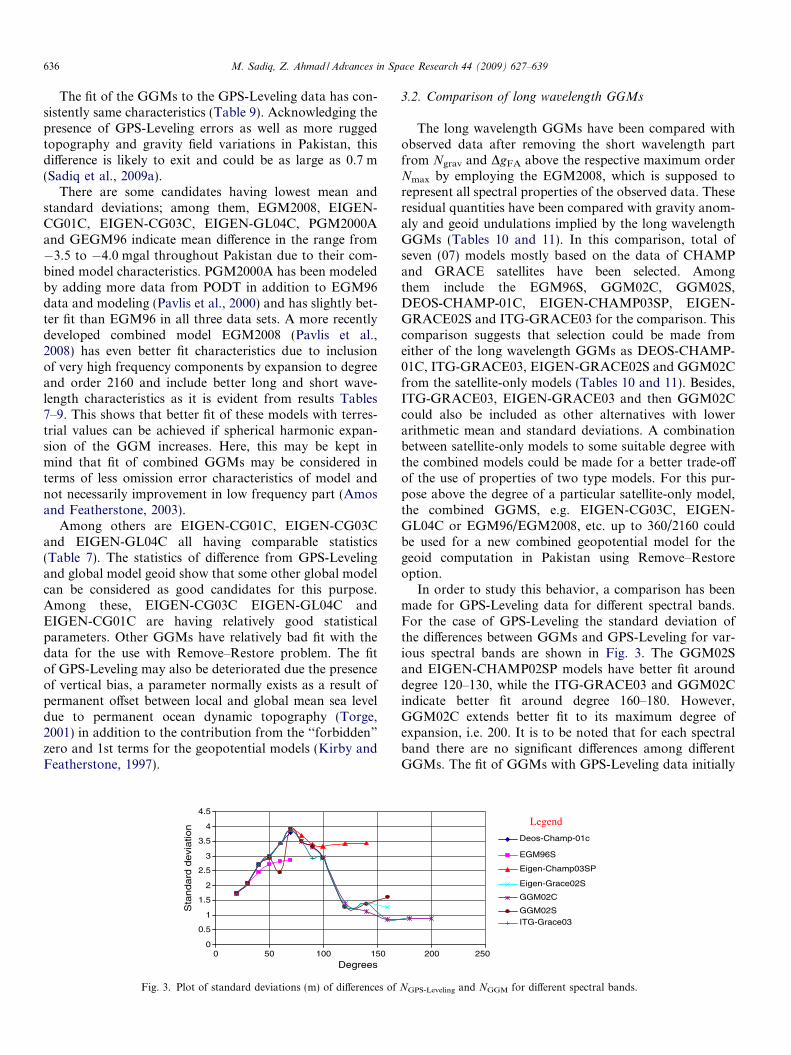
3.2. Comparison of long wavelength GGMs
The long wavelength GGMs have been compared withobserved data after removing the short wavelength partfrom Ngrav and DgFA above the respective maximum orderNmax by employing the EGM2008, which is supposed torepresent all spectral properties of the observed data. Theseresidual quantities have been compared with gravity anom-aly and geoid undulations implied by the long wavelengthGGMs (Tables 10 and 11). In this comparison, total ofseven (07) models mostly based on the data of CHAMPand GRACE satellites have been selected. Amongthem include the EGM96S, GGM02C, GGM02S,DEOS-CHAMP-01C, EIGEN-CHAMP03SP, EIGEN-GRACE02S and ITG-GRACE03 for the comparison. Thiscomparison suggests that selection could be made fromeither of the long wavelength GGMs as DEOS-CHAMP-01C, ITG-GRACE03, EIGEN-GRACE02S and GGM02Cfrom the satellite-only models (Tables 10 and 11). Besides,ITG-GRACE03, EIGEN-GRACE03 and then GGM02Ccould also be included as other alternatives with lowerarithmetic mean and standard deviations. A combinationbetween satellite-only models to some suitable degree withthe combined models could be made for a better trade-offof the use of properties of two type models. For this pur-pose above the degree of a particular satellite-only model,the combined GGMS, e.g. EIGEN-CG03C, EIGEN-GL04C or EGM96/EGM2008, etc. up to 360/2160 couldbe used for a new combined geopotential model for thegeoid computation in Pakistan using Remove–Restoreoption.
In order to study this behavior, a comparison has beenmade for GPS-Leveling data for different spectral bands.For the case of GPS-Leveling the standard deviation ofthe differences between GGMs and GPS-Leveling for var-ious spectral bands are shown in Fig. 3. The GGM02Sand EIGEN-CHAMP02SP models have better fit arounddegree 120–130, while the ITG-GRACE03 and GGM02Cindicate better fit around degree 160–180. However,GGM02C extends better fit to its maximum degree ofexpansion, i.e. 200. It is to be noted that for each spectralband there are no significant differences among differentGGMs. The fit of GGMs with GPS-Leveling data initially
200 250
Deos-Champ-01c
EGM96S
Eigen-Champ03SP
Eigen-Grace02S
GGM02C
GGM02SITG-Grace03
Legend
NGPS-Leveling and NGGM for different spectral bands.
Table 12Percentage recovery of gravity field and geoid from global geopotentialmodels.
GGMs description Gravitydata (%)
Gravimetricgeoid (%)
GPS-Levelinggeoid (%)
EGM96/PGM2000Aand EGM2008
�36–39 �79 �79
GRACE/CHAMP basedcombined GGMs, e.g.EIGEN-CG01C/01C.GL04C
�32 �59 �69
Satellite-only �5–26 �49 �50
M. Sadiq, Z. Ahmad / Advances in Space Research 44 (2009) 627–639 637
decreases till degree and order 70 and then it improves foralmost all models except EIGEN-CHAM03SP for whichstandard deviation saturates to the value of 3.4 m. TheGGM02C has better fit after 160� than the GGM02S dueto the obvious reason that former is combined model whilethe later contains only satellite data.
4. Results and discussion
Based on the results of combined GGMs, it is relativelydifficult to select the combined GGM that gives best fit tothe Pakistan ground data. There are mainly six combinedGGMs including EGM96, PGM200A, EIGEN-CG01C,EIGEN-GL04C, EIGEN-CG03C and EGM2008 whichgive statistically promising results considering the errorsin the control data. The statistical results are used to rec-ommend the EGM2008 in all respects due to its very highdegree of spherical harmonic expansion in relation to thenew data addition in comparison to the old models. Theother excellent choices include EGM96 (Sadiq and Ahmad,2007) or PGM2000A due to their good comparison withground data. However, PGM2000A reflects a very small(and insignificant) improvement on EGM96 and/or othermodels due to the use of additional data and modelingnot used in the other combined GGMs at that time (Pavliset al., 2000). The CHAMP/GRACE satellite data basedcombined GGMs that include EIGEN-CG01C, EIGEN-GL04C and EIGEN-CG03C fall in 3rd choice while con-sidering the statistical results. However, it is important tonote that these combined GGMs must have good longwavelength characteristics than prior global models dueto their good coverage of data relatively good sensors(Rummel et al., 2002). Though, this fact is not prominentin comparison to EGM96 in Pakistan area.
Among satellite-only GGMs, GGM02C and ITG-GRACE03 are good candidates in terms of original spec-tral properties of satellite-only models. The results for allsatellite-only models show a strong contamination in thelong-medium wavelength range and require careful studyfor selection. However, comparison of satellite-only modelsas per selection strategy of section-3b, the DEOS-CHAMP01C satellite-only GGM gives a slightly better fitto the terrestrial gravity and GPS-Leveling data other thansatellite-only GGMs when compared with observed datawith its particular spectral range (Tables 10 and 11).Assuming that satellite data are less prone to low-fre-quency errors than the terrestrial gravity data, if a satel-lite-only solution is to be used for Pakistani geoid modelin a Remove–Restore sense, then EIGEN-CHAMP01Cor subsequent GGMs, e.g. GGM02C/GGM02S or ITG-GRACE03 which include dedicated satellite gravity dataare preferably recommended for use.
A final remark is attributed to the relative ability ofGGMs for the recovery of gravity and geoid informationaccording to the spectral relation between geoid and grav-ity. Table 12 provides some results regarding percentagerecovery by means of GGMs in Pakistan.
The comparison of the recovery percentage for threedatasets using Table 6 with Tables 7–9 show that amongcombined GGMs EGM96, PGM2000A and EGM2008are superior in all three datasets mentioned in Table 12in the recovery of gravity and geoid fields. As per expecta-tion, data in Table 12 demonstrates that majority of thegeoid power is contained in the low degree harmonics,whereas power in the gravity field is held in the mediumand high degree harmonics as pointed out by Schwarz(1984).
The percentage recovery results show that recovery isnot promising for land gravity data, i.e. less than �40%,however, GPS-Leveling and Gravimetric geoid can berecovered to �60–80% in case of combined GGMs. Thisrecovery percentage is even more less for satellite-onlyGGMs, which is logical due to their omission of shortwavelength part of gravity and geoid signal. Two aspectsare pertinent to consider behind these results, first beingless inclusion of ground truth data in the modeling of theglobal geopotential models and second due to the omissionof very short wavelength part especially in northern Paki-stan which is highly mountainous region.
5. Conclusion and recommendation
As such this comparison of observed data with geopo-tential models has provided important information regard-ing the best fit global geopotential model for subsequentgravimetric geoid. Based on the analysis of results, thisstudy leads to the following main conclusions andrecommendations:
1. The observed land gravity data deficiency in the devel-opment of geopotential models is one of the major rea-sons behind relative poor fit in addition to the presenceof commission and omission errors of the global geopo-tential models. The scale difference between GGM basedEarth-gravity mass constant ‘‘GM” and semi-major axis‘‘a” and adopted GRS80 ellipsoid can also contribute tothis misfit. This has not been accounted for in the pres-ent study, though it has smaller magnitude.
2. There is an indication that medium to long wavelengthgeoid features have been underestimated, which couldbe improved if a better coverage of terrestrial gravity
638 M. Sadiq, Z. Ahmad / Advances in Space Research 44 (2009) 627–639
data from this region were to be used in the calculationof the coefficients of spherical harmonic of the geopoten-tial models. Indeed, the mountainous regions in thenorth, and areas where there is a lack of gravity havemore contribution towards the larger difference of meanand standard deviation values.
3. From the analysis of the mean and standard deviation ofthe residual gravity anomalies, the EGM2008, EGM96and PGM2000A models have proven to be superior toother models for modeling the medium to long wave-length signals of the geoid for the regional study inPakistan. The EGM2008 EGM96 or PGM200A couldbe good alternatives from combined global geopotentialmodels with EGM2008 as the best possible options.
4. If the regional geoid is to be based on satellite-onlyGGM, GGM02C/GGM02S or ITG-GRACE03 couldbe suitable candidates.
5. There could be a possibility of hybrid solution by com-bining DEOS-CHAMP-01C in longer wavelength (todegree and order 40) with EGM96/EGM2008 in themedium to short wavelength part, i.e. from 41� to 360/2160�.
It is of no need to mention that tailored GGMs havemuch difference from the combined one as there will beno data addition in comparison with combined GGMsespecially in Pakistan. In addition to this it is highly recom-mended that ground gravity and geoid data may beincluded in the development of global geopotential modelsfor their better representation in Pakistan area.
Acknowledgments
Higher Education Commission of Pakistan is highlyacknowledged for sponsoring this study under the indige-nous Ph.D. program at the Department of Earth SciencesQuaid-i-Azam University (QAU) Islamabad, Pakistan.The Directorate General of Petroleum Concessions(DGPC), Ministry of Petroleum and Natural Resources,Survey of Pakistan GETECH, University of Leads andBGI are also acknowledged for providing the gravity datato the Department of Earth Sciences, Quaid-i-Azam Uni-versity, Islamabad. We also acknowledge with thanks theProfessor C.C. Tscherning, NBI Copenhagen UniversityDenmark for providing software and lecture notes ofGeoid School held in Copenhagen University, 2006.
References
Amos, M.J., Featherstone, W.E. Comparison of recent global geopoten-tial models with terrestrial gravity field data over New Zealand andAustralia. Geomat. Res. Aust. 79, 1–20, 2003.
Ditmar, P., vanEck, A., vanderSluijs, A. A technique for modeling theEarth’s gravity field on the basis of satellite accelerations. J. Geodesy78 (1–2), 12–33, 2004.
Featherstone, W.E. Report of IAG Special Study Group 3.177 SyntheticModelling of the Earth’s Gravity Field (1999–2001), Report of the
IAG 3.177. Available from: <http://www.cage.curtin.edu.au/will/iagssg3177.html>, 2002.
Fosrste, C., Flechtner, F., Schmidt, R., Meyer, U., Stubenvoll, R.,Barthelmes, F., Konig, R., Neumayer, K.H., Rothacher, M., Reigber,Ch., Biancale, R., Bruinsma, S., Lemoine, J.-M., Raimondo, J.C. Anew high resolution global gravity field model derived from combina-tion of GRACE and CHAMP Mission and Altimetry/GravimetrySurface Gravity Data Poster presented at EGU General Assembly2005, Vienna, Austria, 24–29, April, 2005.
Fosrste, C., Flechtner, F., Schmidt, R., Konig, R., Meyer, U., Stubenvoll,R., Rothacher, M., Barthelmes, F., Neumayer, H., Biancale, R.,Bruinsma, S., Lemoine, J.-M., Loyer, S. A mean global gravity fieldmodel from the combination of satellite mission and altimetry/gravimetry surface data – EIGEN-Gl04C Geophysical ResearchAbstracts, vol. 8, 03462, 2006.
Forsberg, R., Tscherning, C.C. The use of height data in gravity fieldapproximation by collocation. J. Geophys. Res. 86 (B9), 7843–7854,1981.
Forsberg, R., Tscherning, C.C. Topographic effects in gravity fieldmodelling or BVP, in: Sanso, F., Rummel, R. (Eds.), GeodeticBoundary Value Problems in View of the Centimeter Geoid LectureNotes in Earth Sciences, vol. 65. Springer, Berlin, pp. 241–272, 1997.
Fotopoulus, G. Calibration of geoid error models via a combinedadjustment of ellipsoidal, orthometric and gravimetric geoid heightdata. J. Geodesy 79, 111–123, 2005.
GETECH. GETECH report on South East Asia Gravity project(SEAGP), GETECH Group plc., Kitson House, Elmete Hall ElmeteLane, Roundhay University of Leeds, LS8 2LJ, UK, 1995.
Heck, B. An evaluation of some systematic error sources affectingterrestrial gravity anomalies. Bull. Geodesique 64, 88–108, 1990.
Heiskanen, W.A., Moritz, H. Physical Geodesy. Freeman, San Francisco,1967.
Keasley, A.H.W., Holloway, R.D. Tests on geopotential models in theAustralian region. Aust. J. Geodesy Photogramm. Survey. 50, 1–17,1989.
Keasley, A.H.W., Govind, R. Geoid evaluation in Australia, a statusreport. Aust. Surveyor 36 (1), 30–40, 1991.
Kiamehr, R., Sjoberg, L.E. Comparison of the qualities of recent globaland local gravimetric geoid model in Iran. Stud. Geophys. Geod. 49,289–304, 2005.
Kirby, J.F., Featherstone, W.E. A study of zero and first degree terms ingeopotential models over Australia. Geomat. Res. Aust. 66, 93–108,June, 1997.
Kirby, J.F., Featherstone, W.E., Kearsley, A.H.W. Tests of the DMA/GSFC geopotential models over Australia. Int. Geoid Service Bull. 7,2–13, 1998.
Lemoine, F.G., Smith, D.E., Smith, R., Kunz, L., Pavlis, N.K., Klosko,S.M., Chinn, D.S., Torrence, M.H., Williamson, R.G., Cox, C.M.,Rachlin, K.E., Wang, Y.M., Pavlis, E.C., Kenyon, S.C., Salman, R.,Trimmer, R., Rapp, R.H., Nerem, R.S. The development of theNASA, GSFC and NIMA joint geopotential model. In: Segawa,Fugimoto, Okubo (Eds.), IAG Synzposza 117: Gravzly, Geozd, andMarzne Geodesy, Springer, Berlin, pp. 461–470, 1997.
Lemoine, F.G., Kenyon, S.C., Factor, J.K., Trimmer, R.G., Pavlis, N.K.,Chinn, D.S., Cox, C.M., Klosko, S.M., Luthcke, S.B., Torrence,M.H., Wang, Y.M., Williamson, R.G., Pavlis, E.C., Rapp, R.H.,Olson, T.R. The development of the joint NASA GSFC and theNational Imagery and Mapping Agency (NIMA) Geopotential ModelEGM96 (1998) NASA Technical Paper NASA/TP1998206861, God-dard Space Flight Center, Greenbelt, USA, 1998.
Molodensiky, M.S., Eremeev, V.F., Yurkina, M.I. Methods for the studyof the external gravitational field and figure of the Earth. IsraeliProgram for Scientific Translations, Jerusalem, 1962.
Noor, E., Chen, J., Yulin Li, Zhang, J. Report on data processing/adjustment regarding ‘‘A” & ‘‘AB” order GPS networks of PakistanJune 15–24, 1997, Survey of Pakistan Rawalpindi, 1997.
Omang, Ch.D., Forsberg, R., Strykowski, R. Comparison of new geoidmodels and EIGEN-2S in the North Atlantic Region. In: Sanso, F.
M. Sadiq, Z. Ahmad / Advances in Space Research 44 (2009) 627–639 639
(Ed.). A Window on the Future of Geodesy, IAG Symposia, vol. 128,pp. 306�309, 2003.
Pavlis, N.K., Chinn, D.S., Cox, C.M., Lemoine, F.G. Geopotential modelimprovement using POCM_4B dynamic ocean topography informa-tion: PGM2000A. In: Paper presented at the Joint TOPEX/Poseidonand Jason-1 Science Working Team Meeting, Miami, 2000.
Pavlis, N.K., Holmes, S.A. A FORTRAN program for very-high-degreeharmonic synthesis harmonic_synth (Version 05/01/2006). Preparedfor the IGeS Geoid School 2006: ‘‘The Determination and Use of theGeoid” University of Copenhagen, Copenhagen, Denmark, June 19–23, 2006.
Pavlis, N.K., Holmes S.A., Kenyon S.C., Factor, J.K. An Earthgravitational model to degree 2160: EGM2008. In: Presented at the2008 General Assembly of the European Geosciences Union, Vienna,Austria, April 13–18, 2008.
Reigber, Ch., Schwintzer, P., Luhr, H. CHAMP geopotential mission.Bull. Geofis. Theoret. Appl. 40, 285–289, 1999.
Reigber, Ch., Luhr, P., Schwintzer, P. Status of the CHAMP mission, in:Rummel, R., Drewes, H., Bosch, H., Hornik, H. (Eds.), Towards anIntegrated Global Geodetic Observing System. Springer, Berlin, pp.53–65, 2000.
Reigber, Ch., Schmidt, R., Flechtner, F., Konig, R., Meyer, U.,Neumayer, K.H., Schwintzer, P., Zhu, S.Y. An Earth gravity fieldmodel complete to degree and order 150 from GRACE: EIGEN-GRACE02S. J. Geodyn. 39, 1–10, 2005a.
Reigber, Ch., Schwintzer, P., Stubenvoll, R., Schmidt, R., Flechtner, F.,Meyer, U., Konig, R., Neumayer, H.-K., Forste, Ch., Barthelmes, F.,Zhu, S.Y., Balmino, G., Biancale, R., Lemoine, J.-M., Meixner, H.,Raimondo, J.C. A high resolution global gravity field model combin-ing CHAMP and GRACE Satellite Mission and surface data:EIGENCG01C. Scientific Technical Report STR06/07, Geofors-chungszentrum Potsdam, Potsdam, 2006.
Rudriguez-Caderot, G., Lacy, M.C., Gil, A.J., Blazquez, B. Comparingrecent geopotential models in Andalusia (Southern Spain). Stud.Geophys. Geodaet. 50 (4), 619–631, 2006.
Rummel, R., Balmino, G., Johannessen, J., Visser, P., Woodworth, P.Dedicated gravity field missions – principles and aims. J. Geodyn. (33),3{20}, 2002.
Rapp, R.H. Use of potential coefficient models for geoid undulationdeterminations using a spherical harmonic representation of theheight anomaly/geoid undulation difference. J. Geodesy 71, 282–289,1997.
Sadiq, M., Ahmad, Z. On the selection of optimal global geopotentialmodel for geoid modeling: a case study in Pakistan. Internal report#11, Department of Earth Sciences QAU, Islamabad, 2007.
Sadiq, M., Tscherning, C.C., Ahmad, Z. An estimation of the heightsystem bias parameter No using least squares collocation fromobserved gravity and GPS/leveling data. Stud. Geophys. Geodaet, inpress, 2009a.
Sadiq, M., Ahmad, Z., Akhter, G. A study on the evaluation of the geoid-quasigeoid separation term over Pakistan with solution of 1st and 2ndorder height terms. Earth Planet and Space, Japan, 2009b.
Schwarz, K.P. Data type and their spectral properties, in: Schwarz, L.(Ed.), Local Gravity Field Approximation. Beijing InternationalSchool, pp. 9–10, 1984.
Sjoberg, L.E. On the quasigeoid to geoid separation. ManuscriptaGeodaet. 20, 182–192, 1995.
Tapley, B., Ries, J., Bettadpur, S., Chambers, D., Cheng, M., Condi, F.,Gunter, B., Kang, Z., Nagel, P., Pastor, R., Pekker, T., Poole, S.,Wang, F. GGM02: an improved gravity field model from GRACE. J.Geodesy 79, 467–478, doi:10.1007/s00190-005-0480-z, 2005.
Tscherning, C.C. Geoid determination by least square collocation usingGRAVSOFT. Lecture notes on international school of the determi-nation and use of the geoid Milano, October 1994, pp. 135–164,published by International Geoid Service, 1994.
Tscherning, C.C. Datum-shift, error-estimation and gross-error detectionwhen using least-squares collocation for geoid determination. Lecturenotes, IGeS Geoid School, Thessaloniki, July, 2002.
Tscherning, C.C., Rapp, R.H. Closed covariance expressions for gravityanomalies, geoid undulations, and deflections of the vertical implied byanomaly degree variance models, Department of Geodetic Science,OSU, Report No. 208, 1974.
Tscherning, C.C., Forsberg, R., Knudsen, P. The GRAVSOFT packagefor geoid determination. Proceedings 1. Continental Workshop on theGeoid in Europe, Prague, May 1992, pp. 327–334, Research Instituteof Geodesy, Topography and Cartography, Prague, 1992.
Torge, W. Geodesy. W. de Gruyter, Amsterdam, 1980.Torge, W. Geodesy, third ed. W. de Gruyter, Berlin, New York, 2001.USGS, EROS, SRTM30 Digital Elevation Model DATA Center, SIOUX
Fall, SD 57198-0001. Available from: <http://topex.ucsd.edu/WWW_html/srtm30_plus.html>.
Vanıcek, P., Sjoberg, L.E. Reformulation of Stokes’s theory for higherthan second degree reference field and modification of integrationkernels. J. Geophys. Res.-Solid Earth 96, 6529–6539, 1991.