The Infrared Emission of Circumstellar Envelopes, Dark Silhouettes, and Photoionized Disks in H II...
51
arXiv:astro-ph/0207567v1 25 Jul 2002 To appear on Ap.J, v578 n2 October 20, 2002. The Infrared Emission of Circumstellar Envelopes, Dark Silhouettes and Photoionized Disks in HII Regions M. Robberto 1 , S. V. W. Beckwith, N. Panagia 1 Space Telescope Science Institute, 3700 San Martin Drive, Baltimore, MD 21218, USA [email protected], [email protected], [email protected] ABSTRACT We have modeled the infrared (IR) Spectral Energy Distribution (SED) of cir- cumstellar disks embedded in a HII region and photoevaporated by the external ultraviolet radiation. The model applies to the photoevaporated disks (proplyds) in the Orion Nebula, most of them illuminated by the O6.5 star θ 1 Ori C. First we calculate the IR emission of a Pre-Main-Sequence star surrounded by a dusty globule that is immersed within an HII region. The globule is assumed to be spherical, homogeneous, optically thin at IR wavelengths and photoevaporated according to the Dyson (1968) model. Second, we consider the IR emission of a disk directly exposed to the nebular environment. The reprocessing disk is passive and treated according to the Chiang and Goldreich (1997, CG97) model. We improve over the CG97 treatment by tracing the propagation of the vari- ous radiative fluxes (from the star exciting the HII region, nebular, and grazing from the disk central star) through the disk superheated atmosphere. Since the opposite disk sides receive different amounts of radiation, the flaring angle and the surface temperature distributions are different, resulting in well distinguished SEDs for the two disk faces. Finally, we combine the globule and disk models to estimate the IR emission of proplyds. The energy input from the central star and the nebular environment increase the disk flaring angle, and therefore also the amount of stellar radiation intercepted by the disk. The relative intensity of the disk vs. envelope emission varies with the tilt angle relative to the directions of θ 1 Ori C and of the Earth. We explore the dependence of the SEDs upon the tilt angle with respect to the Earth, the distance from θ 1 Ori C, the size on the 1 On assignment from Research and Science Department of ESA
Transcript of The Infrared Emission of Circumstellar Envelopes, Dark Silhouettes, and Photoionized Disks in H II...

arX
iv:a
stro
-ph/
0207
567v
1 2
5 Ju
l 200
2
To appear on Ap.J, v578 n2 October 20, 2002.
The Infrared Emission of Circumstellar Envelopes, Dark
Silhouettes and Photoionized Disks in HII Regions
M. Robberto1, S. V. W. Beckwith, N. Panagia1
Space Telescope Science Institute, 3700 San Martin Drive, Baltimore, MD 21218, USA
[email protected], [email protected], [email protected]
ABSTRACT
We have modeled the infrared (IR) Spectral Energy Distribution (SED) of cir-
cumstellar disks embedded in a HII region and photoevaporated by the external
ultraviolet radiation. The model applies to the photoevaporated disks (proplyds)
in the Orion Nebula, most of them illuminated by the O6.5 star θ1Ori C. First
we calculate the IR emission of a Pre-Main-Sequence star surrounded by a dusty
globule that is immersed within an HII region. The globule is assumed to be
spherical, homogeneous, optically thin at IR wavelengths and photoevaporated
according to the Dyson (1968) model. Second, we consider the IR emission of
a disk directly exposed to the nebular environment. The reprocessing disk is
passive and treated according to the Chiang and Goldreich (1997, CG97) model.
We improve over the CG97 treatment by tracing the propagation of the vari-
ous radiative fluxes (from the star exciting the HII region, nebular, and grazing
from the disk central star) through the disk superheated atmosphere. Since the
opposite disk sides receive different amounts of radiation, the flaring angle and
the surface temperature distributions are different, resulting in well distinguished
SEDs for the two disk faces. Finally, we combine the globule and disk models
to estimate the IR emission of proplyds. The energy input from the central star
and the nebular environment increase the disk flaring angle, and therefore also
the amount of stellar radiation intercepted by the disk. The relative intensity of
the disk vs. envelope emission varies with the tilt angle relative to the directions
of θ1Ori C and of the Earth. We explore the dependence of the SEDs upon the
tilt angle with respect to the Earth, the distance from θ1Ori C, the size on the
1On assignment from Research and Science Department of ESA

– 2 –
envelope, the inner disk radius and the temperature of the central star. The
resulting SEDs are characterized by a broad peak of emission at 30-60µm and
are in general significantly different from those of isolated disks in low-mass star
forming regions like Taurus-Auriga. Our model indicates that in the presence
of an external radiation field, relatively evolved ”Class 2” objects may display a
SED peaking at mid-IR and far-IR wavelengths. Also, the model can account
for the strong mid-IR excess we have recently detected at 10µm from embedded
disks in the Orion Nebula.
Subject headings: infrared: stars — stars: pre-main-sequence — accretion: ac-
cretion disks — sources: Orion Nebula
1. Introduction
Circumstellar disks are thought to be the birthsites of planetary systems, and it is
primarily for this reason that their properties have been studied extensively since the early
1980s (Shu, Adams, and Lizano 1987; Beckwith & Sargent 1996; Hartmann 1998). The
discovery of several tens of extra-solar planetary systems (e.g. Marcy, Cochran & Mayor
2000) added weight to the argument that disks create planets, although there is some debate
about how often planetary systems really occur around stars. Nevertheless, an understanding
of the evolutionary properties of disks around young stars is thought to be an essential part
of the understanding of our own origins.
Disks can also affect the early evolution of stars themselves. Several authors have
suggested that stellar rotation is locked to the orbital rates of the inner disks at early times
allowing the disk to regulate the stellar angular momentum (Edwards et al. 1993, Choi &
Herbst 1996), although this idea is still controversial (Stassun et al. 1999, Rebull 2001).
Typical disk masses and accretion rates appear to be too small to greatly change the mass of
the stars through accretion (Palla & Stahler, 1999). A number of observable characteristics
of young star/disk systems play an important role in determining the stellar properties and
therefore understanding even subtle changes is important to ensure that the stellar properties
are correctly interpreted.
Most of the stars in the Galaxy are thought to be born in dense OB clusters such
as the Orion Nebula (Bally et al. 1998a; McCaughrean & Stauffer 1994). However, our
understanding of circumstellar disks comes mainly from studies of nearby dark clouds such
as the Taurus/Auriga complex, and it is not clear that the extant knowledge of circumstellar
disks applies to the majority of young star/disk systems in the Galaxy. The study of the

– 3 –
disks in Orion presents several problems that has slowed progress: they are seen against the
Orion HII region, a bright, highly nonuniform source of radiation at wavelengths from the
ultraviolet through millimeter; they appear to be fainter on average at millimeter wavelengths
(Bally et al. 1998b); and the Orion nebula is three times farther from Earth than the well-
studied dark clouds. Many of the disks are embedded within the HII region, meaning that
they are surrounded by ionized halos of gas and dust that complicate the observation of disk
properties alone.
To address these difficulties, we present in this paper a series of models of the emission
from disks embedded within the Orion HII region, under the influence of other radiation
sources in addition to the stars at their center. Section 2 is a discussion of various sources of
radiation in the HII region to prepare for the calculations of emission from discrete sources.
In the following sections, we show how the different radiation affects the IR emission arising
from three type of sources: a spherically symmetric, dusty globule surrounding a star (section
3), a star/disk system directly exposed to the ionized environment (section 4), and finally a
star/disk system surrounded by a dusty globule (section 5). Section 6 contains a discussion
of our findings with an exploration of the critical parameters, comparison with observations,
and remarks on the limit of our treatment.
2. General parameters of the HII region
We assume the HII region is spherical, isothermal, and has uniform density. For sim-
plicity, we consider the brightest star at its center as the only source of ionizing photons,
neglecting the radiation emitted by other stars within or around the nebula. This approx-
imation is appropriate for the Trapezium cluster, where θ1Ori C supplies at least 80% of
the Lyman continuum luminosity: LLyc ≈ 8 × 10⁴ L⊙ versus a total luminosity of ∼ 105 L⊙
for the entire cluster (Bally et al. 1998a). We assume the HII region is radiation bounded
with Stromgren radius, RHII , i.e. all the Lyman-continuum radiation is absorbed within
the nebula. We use for the HII region the typical parameters of the Orion Nebula, with a
Stromgren radius RHII = 1 × 1018 cm and a distance D = 450 pc.
To estimate the relative importance of the various dust heating mechanisms, it is appro-
priate to distinguish between the stellar, Fs, and the nebular, Fn, radiative fluxes (Panagia
1974, Natta & Panagia 1976). The stellar flux is comprised of ionizing, F EUVs , and nonion-
izing, F FUVs , radiation. The former maintains the ionization balance and is mostly absorbed
in the vicinity of the Stromgren boundary. Once absorbed, it is transformed into nebular
radiation, Fn, that fills the HII region uniformly. Fn can be divided into the resonantly
scattered Ly-α radiation, F Ly−αn , and the rest, e.g. Balmer continuum and lines, forbidden

– 4 –
lines from various atomic species, continuum emission, etc., in short all referred to hereafter
as nebular radiation, and indicated by F othern .
If ρ denotes the fraction of total luminosity, Ls, emitted by the central star in the
Lyman continuum (Extreme Ultraviolet – EUV; hν > hνLyC = 13.6 eV), the ionizing flux at
a distance, d, is:
F EUVs (d) = ρ
Ls
4πd2e−τEUV (d), (1)
where τEUV (d) is the radial optical depth at the effective wavelength of the ionizing radiation,
λEUV (∼ 570A for θ1Ori C). The non-ionizing stellar radiation (Far Ultraviolet – FUV;
6 eV< hν < 13.6 eV) is
F FUVs (d) = (1 − ρ)
Ls
4πd2e−τF UV (d) (2)
with an effective wavelength, λFUV ≃ 1200A (Panagia 1974).
With the exception of the dusty globules and disks, discussed later in this paper, we
assume that the amount of dust mixed with the ionized gas is negligible, so that both the
EUV and FUV fluxes cross the HII region almost unaffected by dust.
Recombination theory predicts that as long as the electron density is << 104 cm−3 a
fraction ≃ 2/3 of the Ly-continuum photons are eventually transformed into Ly-α photons
at λLy−α = 1216 A through the 2p-1s transition, the remaining decaying to 1s via two-photon
emission from the 2s level (e.g. Osterbrock 1989). The generation rate of Ly-α photons is
therefore
NLy−α ∼= 2
3
ρLs
hνLyC, (3)
and the corresponding luminosity is
LLy−αn
∼= 2
3ρLs
(
λLyC
λLy−α
)
≃ 1
3ρLs, (4)
where λLyC = c/νLyC = 912 A.
For the ionizing star we adopt the parameters of an O6.5V star: Ls = 6 × 1038erg s−1
and ρ = 0.4 (Panagia 1973).
For the remaining nebular radiation,
Lothern = ρLs − LLy−α
n ≃ 2
3ρLs. (5)
The energy density of the nebular radiation is obtained by multiplying the luminosity
by the crossing time, RHII/c, and dividing by the nebular volume, Vneb = (4/3)πR3HII . In

– 5 –
the case of the Ly-α radiation, the photons are resonantly scattered many times within the
nebula before being absorbed. Numerical models (Panagia 1978, Hummer & Kunasz 1980)
indicate that whereas Ly-α photons undergo approximately 105 scatterings before reaching
the boundary of an HII region, the space crossed between most of the scatterings is very
short, so that a Ly-α photon reaches the boundary after having traveled on average a path
length about q ∼ 10 − 20 times the radius of the HII region. Therefore, the absorption of
Ly-α photons by dust is about q times more efficient than it is for non-resonant radiation
with similar frequency. From the point of view of the dust heating by Ly-α radiation, the
factor, q, can be treated either as an apparent increase of the Ly-α energy density seen by
the dust,
ULy−αn =
qρLs
4πcR2HII
, (6)
or as an increase of the dust absorption efficiency Qabs at the Ly-α wavelength,
Qabs(Ly-α) = qQabs(UV ). (7)
This second approach is more correct, since the apparent increase of the energy density holds
only as long as Ly-α photons are present, i.e. inside a dust-depleted HII region and at the
outer edges of any embedded globule, disk, etc. In these objects, Ly-α photons will cause
an increase of the surface temperature, but at an optical depth to UV radiation τ ≃ 1 they
will be entirely absorbed. Equation (7) has been adopted in the rest of this paper.
Concerning the nebular radiation, one has
Uothern =
2ρLs
4πcR2HII
. (8)
3. Circumstellar globules
3.1. Neutral flow
The ionized globules in the central part of the Orion nebula are typically shaped like
tear-drops with the tail pointing away from θ1Ori C. For simplicity, we treat them as spheres
of neutral gas surrounded by a shell that is photoionized on the hemisphere facing the ionizing
star. Johnstone, Hollenbach & Bally (1998) and Storzer & Hollenbach (1999) have modeled
the structure of the globules in terms of photoevaporated winds. They showed that two
different outflow regimes may develop: EUV-dominated and FUV-dominated flows. The
former are produced when the ionizing radiation reaches the disk surface, typically in the
vicinity (d . 1017 cm) of the ionizing star, and/or in the very early phases of disk exposure to

– 6 –
the EUV radiation. FUV-dominated flows are more common and occur when the EUV flux
is absorbed at large distances from the disk surface. In this case, the disk photoevaporation
is driven by the FUV radiation. The photodissociation region (PDR) that develops between
the disk surface and the ionization front may extend hundreds of astronomical units, or a
few disk radii (∼ 100AU) from the disk. Typical solutions of the flow equations indicate
that in EUV-dominated flows the density remains approximately constant, whereas in FUV-
dominated flows the expanding neutral flow has nearly constant velocity until it reaches an
isothermal shock, which separates the inner region with density ∝ r−2 from the isobaric
upstream region where the density is approximately constant.
Storzer & Hollenbach (1999) have shown that in most FUV-dominated cases the shock
front occurs much closer to the central star than to the ionization front. The region with
constant density therefore fills most of the globule’s volume. The dense inner flow may still
dominate the radial column density, but it is generated in the outer disk regions, where the
thermal supersonic neutral wind at 2-6 km s−1 exceeds the escape velocity from the rotating
disk. The neutral outflow will be initially cylindrical by symmetry, while a spherical flow
develops only at distances of the order of the disk size. The star should therefore remain
in a cavity relatively free of dust, possibly dominated by the presence of collimated jets
(Bally, O’Dell, & McCaughrean, 2000). In conclusion, both EUV- and FUV- dominated
flow models predict the presence of broad regions around the central star with uniform
density. We shall therefore consider only FUV-dominated flows with constant density. Our
neutral region spans from the ionization radius Ri down the an inner radius R0, encircling
a dust-free cavity set by the dust evaporation temperature, Te = 1, 500K. We shall refer to
this structure as a “neutral globule”.
The density within the proplyds is regulated by the dust opacity to the FUV flux (Bally
et al. 1998a). If the density - and therefore, opacity - increases, the number of FUV photons
reaching the disk diminishes. The smaller number of FUV photons causes the evaporation
rate to drop with a consequent decrease of the density (opacity) in the globule. More FUV
photons will then be able to reach the disk, keeping the system in equilibrium through
negative feedback. Both Johnstone et al. (1998) and Storzer & Hollenbach (1999) estimated
the column density of the neutral medium, N(H) ≃ 1021 cm−2, corresponding to AV ≃ 0.5
assuming average ISM opacity. This column density translates into a radial optical depth
τRi≃ 1 − 2 in the UV (both EUV and FUV), the exact value depending on the dust
properties. In the next section, we shall see how τRiis directly related to the ionizing flux
and to the radius of the globule.

– 7 –
3.2. Photo-ionized wind
Behind the ionization front, the gas flow is approximately spherically symmetric. At
large distances from the globule, the interaction with the wind from the ionizing star will
create the characteristic stationary arcs of [OIII]+Hα emission seen around several sources
in the inner core of the Orion nebula (Bally et al. 1998a, Bally et al. 2000). Dust is trapped
within the photoevaporating flow, as demonstrated by the arcs closer to θ1Ori C, which
are prominent at 10µm. In fact, the Ney-Allen nebula is mostly due to the optically thin
emission of dust in these arcs (Hayward, Houck, & Miles 1994).
Dyson (1968) first studied the evaporation of dense neutral globules in HII regions
as a mechanism to provide high turbulence to the ionized medium. In Dyson’s model, the
globules are self gravitating spherical condensations of neutral hydrogen. Under the influence
of the ionizing radiation, the ionized material at the globule surface streams out at supersonic
velocities, injecting momentum and energy into the HII region. In this model, the spherically
symmetric, steady flow has a solution given by
r
Ri
=
√
cII
v(r)exp
[
v(r)2 − c2II
4c2II
]
(9)
andn(r)
ni= exp
[
c2II − v(r)2
2c2II
]
, (10)
where r is the distance from the center of the globule, n(r) and v(r) are the flow density and
velocity, and ni is the atomic density at Ri.
We assume cII = 106 cm s−1 for the sound speed in the ionized gas. The Dyson solution
neglects the role of gravity. In our case, gravity is negligible at distances from a central
star r & 100AU, since the escape velocity, ve =√
GM⋆/r ≃ 1 km s−1, for a central star of
mass M⋆ = 1 M⊙ is significantly lower than cII (see also Henney et al. 1996, Johnstone et
al. 1998). In any case, the emitted IR spectrum is almost insensitive to the details of the
density and velocity profiles.
In the expanding ionized flow, the neutral hydrogen and the grains compete for the
absorption of the ionizing photons. The effects of dust in the photoevaporation flow has
been studied by Pastor, Canto, & Rodriguez (1991), and we refer the reader to their paper
for the details. The optical depth within the globule is given by their Equation (12):
F = nicIIeτ∞
d + αBn2i Rib(τ
0d ), (11)
valid in the plane-parallel approximation, relating the flux of ultraviolet photons entering the
globule, F , to the opacity from the ionization front to infinity, τ∞d , to τ 0
d = σdniRi. Here, αB

– 8 –
is the recombination coefficient to the excited levels of the hydrogen, and σd = 2×10⁻²¹ cm−2
is the grain cross-section per hydrogen nucleus to the EUV radiation. The function, b(τ 0d ),
has been tabulated by Pastor et al. (1991) for the Dyson’s density profile. When τ 0d ≤ 10,
one can approximate
b(τ 0d ) = 0.12e0.37τ0
d . (12)
In this case (Pastor et al 1991):
τ∞d = 0.45τ 0
d . (13)
Figure 1 shows how the optical depth, τ 0d , depends on the ionizing flux (i.e. distance
from the ionizing star) and on the radius of the ionization front (i.e. globule’s size) through
Equations (11)-(13). In general, τ 0d increases with the globule size and decreases with the
ionizing flux. At distances from the ionizing star larger than 0.06 − 0.08 pc, it is τ 0d ≃
1 − 2. This corresponds to the range of values for τRimentioned above. In fact, under the
assumption that the neutral, inner part of the globule has constant density, and as long as
R0 << Ri, τ 0d coincides with the radial optical depth τRi
. In this case, Equation (11) links
τRito the ionizing flux and to the globule radius. Both parameters can be easily obtained,
or constrained, by the observations.
3.3. Radiation field inside the globule
Assuming the number density of globules present within the HII region to be low enough
that each one of them is directly exposed to the radiation coming from the central star, the
primary sources of energy within a globule of radius R will be:
1. The radiation (both ionizing and nonionizing) from the star exciting the HII region:
Lsg(d) = Ls
R2
4d2; (14)
2. The diffuse radiation, including both Ly-α and other nebular radiation:
Lnebularg =
3
4ρLs
(
R
RHII
)2
(15)
3. The radiation L⋆ from the star at the center of the globule.
Within the globule, the energy density results from a combination of these three terms,
plus the thin shell discussed in the previous section, each one attenuated by the dust and
– 9 –
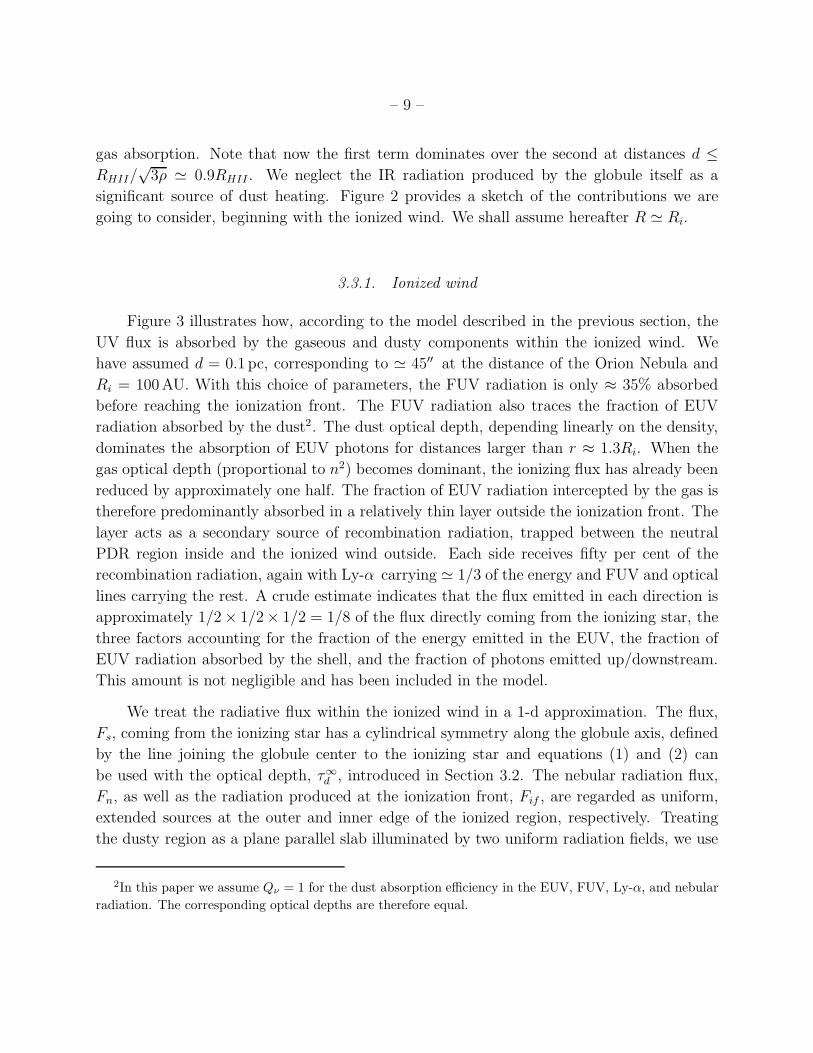
gas absorption. Note that now the first term dominates over the second at distances d ≤RHII/
√3ρ ≃ 0.9RHII . We neglect the IR radiation produced by the globule itself as a
significant source of dust heating. Figure 2 provides a sketch of the contributions we are
going to consider, beginning with the ionized wind. We shall assume hereafter R ≃ Ri.
3.3.1. Ionized wind
Figure 3 illustrates how, according to the model described in the previous section, the
UV flux is absorbed by the gaseous and dusty components within the ionized wind. We
have assumed d = 0.1 pc, corresponding to ≃ 45′′ at the distance of the Orion Nebula and
Ri = 100AU. With this choice of parameters, the FUV radiation is only ≈ 35% absorbed
before reaching the ionization front. The FUV radiation also traces the fraction of EUV
radiation absorbed by the dust2. The dust optical depth, depending linearly on the density,
dominates the absorption of EUV photons for distances larger than r ≈ 1.3Ri. When the
gas optical depth (proportional to n2) becomes dominant, the ionizing flux has already been
reduced by approximately one half. The fraction of EUV radiation intercepted by the gas is
therefore predominantly absorbed in a relatively thin layer outside the ionization front. The
layer acts as a secondary source of recombination radiation, trapped between the neutral
PDR region inside and the ionized wind outside. Each side receives fifty per cent of the
recombination radiation, again with Ly-α carrying ≃ 1/3 of the energy and FUV and optical
lines carrying the rest. A crude estimate indicates that the flux emitted in each direction is
approximately 1/2× 1/2× 1/2 = 1/8 of the flux directly coming from the ionizing star, the
three factors accounting for the fraction of the energy emitted in the EUV, the fraction of
EUV radiation absorbed by the shell, and the fraction of photons emitted up/downstream.
This amount is not negligible and has been included in the model.
We treat the radiative flux within the ionized wind in a 1-d approximation. The flux,
Fs, coming from the ionizing star has a cylindrical symmetry along the globule axis, defined
by the line joining the globule center to the ionizing star and equations (1) and (2) can
be used with the optical depth, τ∞d , introduced in Section 3.2. The nebular radiation flux,
Fn, as well as the radiation produced at the ionization front, Fif , are regarded as uniform,
extended sources at the outer and inner edge of the ionized region, respectively. Treating
the dusty region as a plane parallel slab illuminated by two uniform radiation fields, we use
2In this paper we assume Qν = 1 for the dust absorption efficiency in the EUV, FUV, Ly-α, and nebular
radiation. The corresponding optical depths are therefore equal.

– 10 –
the attenuation averaged over 2π steradian:
⟨
e−τ⟩
2π=
1∫
0
e−τ/xdx (16)
In general, all nebular Ly-α photons entering the ionized wind will be rapidly absorbed by
the dust, whereas a fraction,⟨
e−τ∞
d
⟩
2π, of the nebular radiation will cross the region.
To these terms, we add, together with the flux from the central star, F⋆, the fraction
of nebular recombination lines, Ly-α excluded, coming from the back side after crossing the
neutral globule.
3.3.2. Neutral globule
Within the neutral region, we use a 2-d treatement. No EUV radiation is present, and
the fraction of FUV radiation crossing the ionization front is further attenuated by an optical
depth,
τ2d(r, θ) = τRi
[
1 +
(
r
Ri
)2
− 2
(
r
Ri
)
cos(θ − θh)
]1/2
, (17)
between the point Q(θh) at the globule surface and the point P (r, θ), along the line parallel
to the globule axis. It is θh = arcsin [r sin θ/Ri] (Figure 4). Note that since the globule is
homogeneous, distances and optical depths are related by the simple relation:
τr = τRi
r
Ri. (18)
On the hemisphere facing the ionizing star, the ionized shell converts UV photons into
recombination line photons. Like the ionized wind, the neutral globule is optically thick to
Ly-α photons and translucent to recombination lines at the range of optical depths we are
dealing with. To illustrate their propagation, we consider first the energy input, E, from an
isotropic radiation field with specific intensity, Iν , on the surface of radius, Ri:
Eν = (4πR2i )πIν . (19)
Within the globule, the radiation field is attenuated by a factor:
⟨
e−τ ′(r)⟩
sphere=
1
2
∫ π
0
e−τ ′(r,θ′) sin θ′dθ′, (20)
where τ ′(r, θ′) is the optical depth between the point R, assumed for simplicity on the globule
axis (θ = 0) and a point S(θ′) on the surface (see Figure 4). Figure 5 shows that when the

– 11 –
globule is optically thick, the energy density at the center goes to zero, whereas at the surface
it approximates 50% of its value in the open space, as the flux comes only from the outer
side. Continuity across the globule edge is preserved, as the outer energy density is also
reduced in the globule shadow with respect to the value in open space. The attenuation in
the vicinity of the surface can then be estimated integrating Equation (20) between 0 and
π/2 in the limit τRi>> τ , τ being the radial optical depth from the surface. In this case,
Equation (20) reduces to Equation (16).
Since the two hemispheres are illuminated by different sources of radiation, isotropy is
broken, and Equation (20) must be replaced by an equation weighting the two contributions
separately. The flux at a point P will now depend also on the angle θ (see Figure 4). It is
convenient to write Equation (19) as
Eν = πa2(4πIν), (21)
and split the isotropic flux intercepted by the sphere cross section in two terms:
4πIν = Ω1A1I1ν + Ω2A2I
2ν . (22)
Here, Ωi are the solid angles subtended by the areas radiating with intensity, Ii, and Ai are
the corresponding mean attenuations. It is
A1(r, θ) =⟨
e−τ ′(r,θ)⟩
up=
1
4π
[
∫ 2π
0
∫ θ′2π(r,θ,φ′)
0
e−τ ′(r,θ,θ′,φ′) sin(θ′)dθ′dφ′
]
, (23)
and,
A2(r, θ) =⟨
e−τ ′(r,θ)⟩
down=
1
4π
[
∫ 2π
0
∫ 2π
θ′2π(r,θ,φ′)
e−τ ′(r,θ,θ′,φ′) sin(θ′)dθ′dφ′
]
. (24)
The optical depth, τ ′(r, θ, θ′, φ′), between the point, P (r, θ), inside the globule and a point,
S(θ′, φ′), on the surface of the sphere is related through Equation (18) to r′, solution of the
equation
r′2+ 2r (cos θ cos θ′ + sin θ sin θ′ cos φ′) r′ + r2 − R2 = 0, (25)
whereas the angle, θ′2π(r, θ, φ′), at P between the direction of the ionizing star, and the
globule’s equator is given by the equation:
r2 cos2 θ tan2 θ′2π − 2r2 sin θ cos θ cos φ′ tan θ′2π + r2 sin2 θ − R2 = 0. (26)
3.3.3. Flux from the central star
The flux from the central star depends on r−2 and on the radial extinction. Since
the central stars of the proplyds in the Orion Nebula typically have late spectral types,
– 12 –
we account for the corresponding reduction of the dust optical depth through the ratio of
absorption efficiencies Q(λT⋆)/QUV∼= Q(λT⋆), where λT⋆ is the effective wavelength of the
photospheric radiation. At distances larger than R0, the stellar flux is
F⋆(r) =L⋆
4πr2e−τr(r)Q(λT⋆ ). (27)
where τr is the radial optical depth from the central star. Figure 6 shows the flux densities
along the symmetry axis for a globule again with Ri = 100AU and d = 0.1 pc. For the star,
we assumed T⋆ = 4, 000K and R⋆ = 2.5R⊙. We shall refer hereafter to these values as the
standard case. Within the ionized wind, the dust heating is dominated by the FUV flux.
Inside the globule, the dominant source of heating is the radiation from the central star, in
the inner parts, and the Ly-α radiation closer to the ionization front.
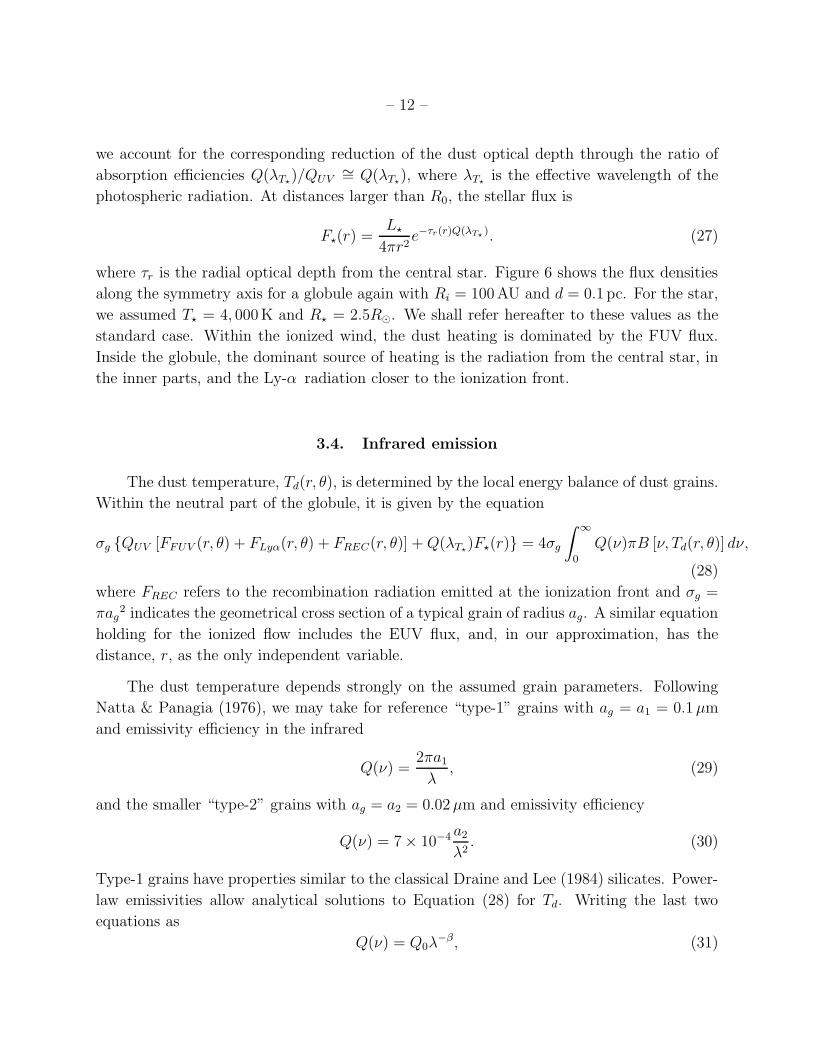
3.4. Infrared emission
The dust temperature, Td(r, θ), is determined by the local energy balance of dust grains.
Within the neutral part of the globule, it is given by the equation
σg QUV [FFUV (r, θ) + FLyα(r, θ) + FREC(r, θ)] + Q(λT⋆)F⋆(r) = 4σg
∫ ∞
0
Q(ν)πB [ν, Td(r, θ)] dν,
(28)
where FREC refers to the recombination radiation emitted at the ionization front and σg =
πag2 indicates the geometrical cross section of a typical grain of radius ag. A similar equation
holding for the ionized flow includes the EUV flux, and, in our approximation, has the
distance, r, as the only independent variable.
The dust temperature depends strongly on the assumed grain parameters. Following
Natta & Panagia (1976), we may take for reference “type-1” grains with ag = a1 = 0.1 µm
and emissivity efficiency in the infrared
Q(ν) =2πa1
λ, (29)
and the smaller “type-2” grains with ag = a2 = 0.02 µm and emissivity efficiency
Q(ν) = 7 × 10⁻⁴ a2
λ2. (30)
Type-1 grains have properties similar to the classical Draine and Lee (1984) silicates. Power-
law emissivities allow analytical solutions to Equation (28) for Td. Writing the last two
equations as
Q(ν) = Q0λ−β, (31)

– 13 –
the black body averaged dust opacity Qβ is
QβT4+βd =
∫ ∞
0
Q(ν)πB(ν, Td)dν =
1.510 × 10⁻⁴Q0T5d β = 1;
5.150 × 10⁻⁴Q0T6d β = 2.
(32)
Equation (28) therefore becomes
Td(r, θ) =
[FFUV (r, θ) + FLyα(r, θ) + FREC(r, θ)] + Q(λT⋆)F⋆(r)
4 · Qβ
1/(4+β)
, (33)
and a similar equation holds for the ionized wind. In Figure 7, we compare the temperature
distributions along the globule axis resulting from the two types of grains, assuming the
standard parameters. The smaller grains reach temperatures more than twice that of the
larger grains, i.e Td ≃ 260K vs. Td ≃ 120K. Also, with the exception of the region closer to
the central star (r . 1/3Ri), the temperature is almost constant due to the weak dependency
of the temperature on the flux. In the rest of this paper, we shall use Type-1 grains to be
consistent with our treatment of the disk, as also assumed by Chiang and Goldreich (1997,
CG97). This choice allows us to use Equation (33) to obtain the dust temperature and to
apply the tabulated dust efficiency of Draine and Lee (1984) to calculate a more realistic
spectral energy distribution. We remark here that scattering of stellar radiation from dust
grains is not considered in our model.
The emitted IR spectrum is given by the integrals:
LIR(ν) =
∫ Ri
R0
∫ π
0
⟨
e−τ(ν)⟩
ndπa2gQ(ν)πB [ν, Td(r, θ)] 2πr2 sin θdθdr, (34)
in the neutral part of the globule, and
LIR(ν) =
∫ R∞
Ri
⟨
e−τ(ν)⟩
nd(r)πa2gQ(ν)πB [ν, Td(r)]πR2
i dr (35)
for the ionized wind. To keep our treatment as simple as possible, we neglect the absorption
of IR radiation in the energy budget of the envelope. This assumption is valid within the
range of the optical depths in the UV and allows us to use Equation (33) avoiding the iterative
computation of the IR radiative transfer. On the other hand, the 10µm silicate feature can
be self-absorbed even at our relatively modest optical depths, having an absorption cross
section comparable to that at 2.2µm. Therefore, we introduced the exponential factors in
Equations (34)-(35) to account for this effect.
Figure 8 shows the Spectral Energy Distributions (SEDs), νFIR(ν), calculated for the
Draine and Lee (1984) dust grains and, for comparison, for the Panagia’s type 2 grains.
The resulting SEDs peak at ≈ 25µmand ≈ 10µm, respectively. Depending on the grain
properties, the emission can be dominated by neutral globule or by the ionized shell.
– 14 –
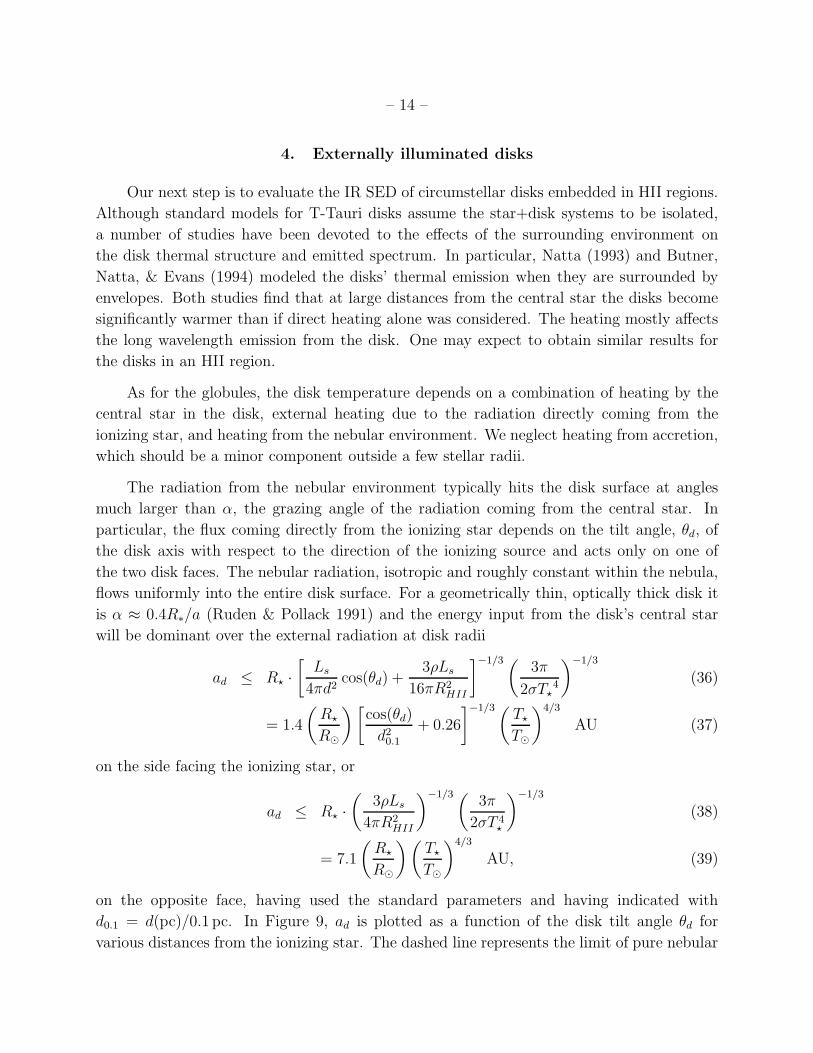
4. Externally illuminated disks
Our next step is to evaluate the IR SED of circumstellar disks embedded in HII regions.
Although standard models for T-Tauri disks assume the star+disk systems to be isolated,
a number of studies have been devoted to the effects of the surrounding environment on
the disk thermal structure and emitted spectrum. In particular, Natta (1993) and Butner,
Natta, & Evans (1994) modeled the disks’ thermal emission when they are surrounded by
envelopes. Both studies find that at large distances from the central star the disks become
significantly warmer than if direct heating alone was considered. The heating mostly affects
the long wavelength emission from the disk. One may expect to obtain similar results for
the disks in an HII region.
As for the globules, the disk temperature depends on a combination of heating by the
central star in the disk, external heating due to the radiation directly coming from the
ionizing star, and heating from the nebular environment. We neglect heating from accretion,
which should be a minor component outside a few stellar radii.
The radiation from the nebular environment typically hits the disk surface at angles
much larger than α, the grazing angle of the radiation coming from the central star. In
particular, the flux coming directly from the ionizing star depends on the tilt angle, θd, of
the disk axis with respect to the direction of the ionizing source and acts only on one of
the two disk faces. The nebular radiation, isotropic and roughly constant within the nebula,
flows uniformly into the entire disk surface. For a geometrically thin, optically thick disk it
is α ≈ 0.4R∗/a (Ruden & Pollack 1991) and the energy input from the disk’s central star
will be dominant over the external radiation at disk radii
ad ≤ R⋆ ·[
Ls
4πd2cos(θd) +
3ρLs
16πR2HII
]−1/3(3π
2σT⋆4
)−1/3
(36)
= 1.4
(
R⋆
R⊙
)[
cos(θd)
d20.1
+ 0.26
]−1/3(T⋆
T⊙
)4/3
AU (37)
on the side facing the ionizing star, or
ad ≤ R⋆ ·(
3ρLs
4πR2HII
)−1/3(3π
2σT 4⋆
)−1/3
(38)
= 7.1
(
R⋆
R⊙
)(
T⋆
T⊙
)4/3
AU, (39)
on the opposite face, having used the standard parameters and having indicated with
d0.1 = d(pc)/0.1 pc. In Figure 9, ad is plotted as a function of the disk tilt angle θd for
various distances from the ionizing star. The dashed line represents the limit of pure nebular

– 15 –
illumination. This occurs a) on the disk face opposite to the ionizing star, b) on both faces if
the disk is oriented edge-on with respect to the ionizing star, (θd ≃ 90), 3) at large distances
from the ionizing star. Figure 9 clearly shows that, with our standard set of parameters, the
heating of typical circumstellar disks is generally dominated by the nebular environment at
distances larger than a few AU.
In reality, the EUV flux hardly reaches the disk surface in environments like the core of
the Orion Nebula, since the neutral photoevaporated wind pushes away the ionization front
from the disk. All radiation fields, including the radiation from the disk’s central star, are
attenuated by the evaporated wind. In the next section, devoted to the actual predictions for
the SEDs of photoionized globules in the Orion Nebula, this effect will be explicitely taken
into account. Here, however, we shall not reduce the external fluxes by generic absorption
coefficients. This because, on the one hand, the main goal of this section is to illustrate how
we build the model, and we want to keep the formalism as close as possible to our assumed
reference model for circumstellar disks. On the other hand, at large distances from the
ionizing star, photoevaporation can be so negligible that the diluted EUV flux can actually
reach the disk surface. Prominent photoevaporated proplyds in the Orion Nebula are clearly
concentrated within ≈ 30′′ from θ1Ori C. In particular, one does not expect the rear face
of the disks to be photoevaporated, as it is heated only by the disk’s central star, and by
the nebular radiation possibly attenuated by the evaporated material streaming away from
the system (the cometary tails of the proplyd). The dark disks seen in silhouette against
the nebular background do not show evidence for photoevaporeted winds (McCaughrean &
Stauffer 1994). In principle, they can can be modeled using the equations presented in this
section. The reader is cautioned, in any case, that a comparison with real sources should
take into account absorption effects3.
4.1. Disk Spectral Energy Distributions
We calculate the disk emission using our modified version of the CG97 model, which
provides a self-consistent treatment of the vertical hydrostatic equilibrium and radiative
transfer of a disk. Disk flaring results from the hydrostatic equilibrium of the disk material
in the gravitational field of the central star (Shakura & Sunyaev 1973, Kenyon & Hartmann
1987). In the CG97 model, radiation from the central star grazes the disk surface at an
angle α and is entirely absorbed once it has reached a tangential optical depth τ‖ ≃ 1 at
3For reference, the envelope discussed in the previous section reduces the flux from the ionizing star by
a factor ≈ 1/5, an amount comparable to moving the source twice as far.

– 16 –
the characteristic wavelength of the stellar radiation. This absorption produces an optically
thin layer of “superheated” dust grains, since the grain emissivity in the infrared is lower
than the absorption efficiency in the visible. Half of the radiation emitted by the layer goes
inward and regulates the inner disk temperature.
We have modified this scheme to account for the external radiation field. Since the
external radiation usually hits the disk at an angle much larger than α, photons entering
along the normal to the disk surface will be absorbed deeper in the disk than those coming
from the central star. We introduce a perpendicular optical depth τ⊥ related to the tangential
optical depth by the equation τ⊥ ≈ τ‖α. Instead of referring to the τ‖ = 1 limit for the grazing
radiation as CG97, we use the optical depth, τ⊥ as the variable that governs the propagation
of the radiation through the disk. In this way, the dust temperature can be estimated at any
disk radius, a, as a function of τ⊥ instead of the single value estimated at τ = 1 by CG97.
With these assumptions, the flux from the central star is attenuated by a factor,
e−τ⊥Q(λT⋆)/α(a), within the disk, whereas the flux from the ionizing star is reduced by a
factor, e−τ⊥/ cos θd. To be consistent with the notation used in the previous sections, τ⊥ is
now the optical depth at UV wavelengths. In principle, the disk flaring produces a mod-
ulation of θd, but we ignore this effect considering that the variations average to zero over
the circumference. We also assume that all the radiation coming from the ionizing star is
locally absorbed by the dust, directly or through absorption of recombination radiation. It
is, therefore,
F sd (τ⊥) =
Ls
4πd2cos(θd) · e−τ⊥/ cos θd. (40)
The attenuation of the nebular radiation within the disk can be readily expressed as a
function of τ⊥ by using Equation (16), assuming the disk curvature is negligible:
Fnebular(τ⊥) =ρLs
8πR2HII
[∫ 1
0
e−qτ⊥/xdx + 2
∫ 1
0
e−τ⊥/xdx
]
, (41)
where x is the distance from the normal to the disk surface. The two terms on the right side
represent the Ly-α and the nebular lines, respectively. The total external flux on the disk
face pointing to the ionizing star is therefore
Fout(τ⊥) = F sd (τ⊥) + Fnebular(τ⊥), (42)
whereas on the other face only the term containing Fnebular(τ⊥) will be present.
The external radiation affects the geometry of the disk. In particular, the grazing angle,
α(a), depends on the external flux. Following CG97, it is:
α(a) ≈ α1
a+ a
d
da
(
H
a
)
, (43)

– 17 –
where α1 ≃ 0.4R⋆, and H is the disk height above the midplane. For a disk vertically
isothermal, it is
H
a≈ 4
(
a
R⋆
)2/7(Te
Tc
)4/7
., (44)
where the effective temperature, Te, is a measure of the energy input at the disk surface and
Tc = GM⋆µ/(kR⋆), µ being the mean molecular weight of the gas. If an outer radiation field
is present, it is
Te(a) ≈[
(α
2
)
(
R⋆
a
)2
T 2⋆ +
Fout(0)
σ
]1/4
. (45)
With this expression for Te, Equation (43) cannot be solved analytically. In the limit of outer
radiation field dominating the disk heating (i.e. at large distances from the disk central star),
the first term can be neglected and we have:
H
a≈ 4
(
a
R⋆
)1/2
[Fout(0)/σ]1/4
Tc
1/2
. (46)
In this case,
α(a) ≈ α1
a+ α3a
1/2 (47)
with
α3 = 2
√
[
Fout(0)
σ
]1/41
TcR⋆. (48)
In Figure 10, we show the vertical disk profiles calculated for a disk facing the ionizing star
at d = 0.1 pc, with no extinction in front of the disk surface. In this situation, the flaring
calculated on both faces, i.e. with and without the EUV radiation, is significantly higher
than that resulting from the standard CG97 model. In practice, these disk profiles are only
indicative of an optical depth surface, since when photoevaporation is present there is no
discontinuity between the disk surface and the envelope. A large flaring angle can rather be
regarded as an indication for disk photoevaporation. The case with no direct radiation from
the ionizing star provides the minimum flaring profile for the back surface of a disk within
the HII region (assuming negligible extinction from the envelope material).
The disk flaring will be dominated by the external flux at distances larger than
Rflaring =
(
4
7
)143
T83
⋆ T−13
c
(
Fout
σ
)−7/12
R⋆. (49)
With our typical parameters, Rflaring ≃ 2AU.

– 18 –
The temperature of the superheated dust layer is given by the combination of internal
and external contributions at the optical depth, τ⊥:
Tds(τ⊥, a) =
[
(
R∗
a
)2
σT4∗e
−τ⊥Q(λT⋆)/α(a) +2
α(a)Fout(τ⊥)
]1
4+β(
T βd1
2σ
)1
4+β
, (50)
where
Td1 =hc
8πagk(51)
is a characteristic temperature of the dust grains, related to the black body averaged dust
emissivity at temperature T by
Q(T ) =
(
T
Td1
)β
. (52)
In Figure 11, we plot the temperature distribution calculated at various distances from
the central star as a function of the vertical optical depth. By comparison, the CG97
approximation of uniform temperature across the superheated layer:
Tds =
[
(
R⋆
a
)2
σT 2⋆ + Fout(0)
]1/(4+β)(
Td1
4σ
)1/(4+β)
, (53)
would have provided Tds = 355K, 220K, 147K, and 113K for the a = 3, 10, 30, 100AU,
respectively.
The flux emitted by the superheated layer will be given by
F (a, ν) =
∫ 3
0
e−τ ′
⊥·Q(ν)Q(ν)Bν [ν, Tds(τ
′⊥, a)] dτ ′
⊥ (54)
having assumed that all the flux is absorbed when τ⊥ = 3. The luminosity density from the
superheated layer, normalized to the stellar luminosity L⋆, is
Lds(ν) =8π2ν
L⋆
1
2
∫ ao
ai
F (a, ν)da, (55)
where ai = 0.07AU and ao = 100AU are our assumed inner and outer disk radii, and we
have taken into account that only 1/2 of the flux is radiated in the outer space.
In what concerns the inner disk, we adopt the same scheme of CG97 with modifications
needed to account for the ambient radiation. Equations 12a-c of GC97 now become:
Tin(a) ≈ 121/4
[
c44a
−3/2 + Fout(0)σ
]1/4
region a
Tin(a) ≈ Tβ/(4+β)d1
(2KV Σ0)1/(4+β)
[
c44 + Fout(0)
σa3/2
]1/(4+β)
region b
Tin(a) ≈ 121/(4+β)
[
c44a
−3/2 + Fout(0)σ
] [
(
R∗
a
)2σT 4
∗ + Fout(0)σ
]1/(4+β)
T1/(4+β)ds region c
(56)

– 19 –
having defined c4 as
c4 =(α3
4
)1/4
R1/2∗ T∗. (57)
The three regions are limited by the radii aa|b and ab|c, derived by setting τ⊥ ∼= 2 and
τ⊥ ∼= 1.5, respectively. With CG97, we have defined
τ(a) = Q1,2κV Σ0a−3/2 (58)
with Q1 =(
Tint
Td1
)β
and Q2 =(
Tds
Td1
)β
for the two conditions, κV = 400 cm2 g−1, and Σ0 =
103 g cm−2. Consistent with CG97, we used Equation (53) for the temperature, Tds. With
our standard parameters, aa|b = 140AU. The temperature of the internal disk is constant at
Td1 ≃ 60K over most of the disk. The luminosity density from the disk interior normalized
to the stellar luminosity L⋆ is now
Lin(ν) =8π2ν
L⋆
∫ ao
ai
[
1 − e−τ⊥(x,ν)]
B [ν, Tin(x)] xdx. (59)
Figure 12 shows the SED for the front surface of the flared disk. The distribution reaches
a minimum at ≈ 4µm, and then rises up to a maximum at ≈ 60µm. The silicate peaks
prominent at 10 and 20µm, are emitted in the superheated layer. In Figure 13, we present
the SED for the face of the disk opposite to the ionizing star. There is a general reduction of
the disk luminosity, both from the superheated atmosphere at short wavelengths and from
the interior in the far-IR. As we already mentioned, this type of SED can be representative
of the dark silhouettes seen in projection against the nebular background in Orion. For
these disks, Ly-α radiation may play a role only if the disks are still embedded within
the HII region, whereas the other nebular radiation is relevant also if the disk is in the
PDR region behind the ionization front. One must remember that the Orion nebula is
essentially density bounded in the direction of the Earth, being limited by a nonuniform
veil of foreground material which is not completely optically thick (O’Dell & Yusuf-Zadeh,
2000). Dark silhouette disks can therefore be subject to a broad range of radiative input, as
shown for example by the presence of [OI] emission in only one object reported by Bally et
al. (2000).
5. Photo-ionized proplyds
In this section, we model the thermal emission produced by a photoevaporated disk
enshrouded in a dusty photoevaporated envelope. We treat the envelope as a dusty pho-
toionized globule of the type discussed in Section 3, whereas the disk treatment will follow

– 20 –
the model presented in the previous section. However, when the globule is merged with the
disk, some of the assumptions adopted for the isolated cases are no longer valid:
1. The disk is now directly exposed to only a fraction of the outer radiation, due to the
globule attenuation. In particular, no EUV radiation reaches the surface of the disk.
2. The disk is exposed to the radiation reemitted by the globule, mostly in the infrared.
We shall assume that the IR radiation crosses undisturbed the superheated layer and
is absorbed in the inner disk.
3. The feedback contribution of the disk emission to the heating of the globule can be
neglected, since a passive disk emits mostly in the far-IR, where the dust opacity is
negligible.
4. The radiation emitted by the disk and by the central star is attenuated crossing the
envelope. We also take into account the attenuation of the envelope radiation within
the envelope itself.
We shall assume the globule to be spherical with the disk lying in the equatorial plane.
The angles, θd, between the disk axis and the direction of the ionizing star, and, θ⊕, between
the disk axis and the Earth are both critical to model SEDs matching the observational
data. They have been taken into account in an approximate way: the former modulates
the amount of stellar radiation falling on the disk surface through Equation (40) but not on
the envelope. The latter affects the tilt angle of the disk with respect to the observer. For
simplicity, however, the plots presented in this section have been obtained assuming both
θd = 0 and θ⊕ = 0. A disk oriented face-on both to the ionizing star and to the Earth is
located along the line of sight of, and behind, the ionizing star.
The globule structure is described by the same set of equations discussed in Section (3).
The only change is that the term containing I2ν in Equation (22) is now equal to zero,
since the disk, optically thick to ultraviolet radiation, shields the hemisphere opposite to the
ionizing star. In what concerns the radiation flowing into the disk, both the fluxes coming
from the HII region and from the central star are attenuated by the globule. In agreement
with our previous assumption of FUV dominated flows, the EUV flux is entirely absorbed
before reaching the surface of the disk. The radiation propagates through the superheated
layer and then through the disk interior. Only the IR flux re-emitted by the globule crosses
the thin layer undisturbed.
The total IR flux emitted by the globule and reaching the disk surface is given by
F (a) =
∫ 2π
0
∫ θmax(a)
0
∫ R∞
Ri
∫ ∞
0
Fenv(r, θ, φ, ν)
4πd2a
cos θar sin θdνdrdθdφ (60)

– 21 –
where Fenv = ndπa2g(ν)B(ν, Td) is the flux emitted by a cubic centimeter of dust within the
globule (cfr. Equations (34-35)), and da is the distance between the point, P (r, θ, φ), within
the envelope and a point, A, on the surface of the disk at a projected (equatorial) distance,
a, form the star and on the plane defined by φ = 0. It is
da =√
r2 + (2a sin θ cos φ − cos θ tan α) r + a2 (1 + tan α)), (61)
and θa is the angle between the line, PA, and the normal to the disk surface, given by:
θa = sin αr sin θ cos φ
da+ cos α
r cos θ − a tanα
da(62)
An accurate estimate of da would require an iterative solution of Equation (60), since the
actual position of the point, A, within the globule depends on the flaring angle, α(a), which
in turn depends on the radiative heating on the disk. To avoid the rather heavy numer-
ical computation, we adopted the approximate assumption that the position of point, A,
is initially given by Equation (47), this time with the absorption through the envelope ex-
plicetely taken into account, and then used the value of F (a) resulting from Equation (60)
to recalculate the disk flaring angle.
The flux emitted by the disk is calculated following the treatment presented in Section 4
with a few changes. We assume that the temperature of the superheated layer does not
depend on the flux emitted by the globule, as the IR emission propagates almost undisturbed
through the disk atmosphere. Due to presence of the absorbing envelope, the flaring angle
now depends on the distance, a, also via the external flux, Fout, (Equation 42). In general,
Rflaring (Equation 49) remains of the order of a few AUs over a broad range of parameters,
and even when the extinction by the wind/envelope is included, as it affects both the flux
from the disk central star and from the outer space. Within the Orion Nebula the disk
flaring is usually dominated by the external flux, so we shall adopt the approximation of
Equation (47). The luminosity of the superheated layer is given by Equations (54)-(55).
In what concerns the temperature of the disk interior, it will depend on the sum of the IR
radiation received from the superheated layer and from the globule, plus the flux emitted
by the disk interior itself when the disk is optically thick. Equations (56)-(59) apply also in
this case.
Neglecting the interstellar contribution, the optical depth between P and an observer
on Earth is
τν(r, φ, θ, θ⊕) = τRiQ(ν)
[
(r
Ri
sin θ cos φ + sin θR cos φR)2 + (cos θR − r
Ri
cos θ)2
]
. (63)
The angles, θR, and, φR, define the point where the line from P with angle, θ⊕, intercepts
the globule surface. They are related to the coordinates of P and to θ⊕ by equations:
r sin θ sin φ = Ri sin θR sin(π − φR) (64)

– 22 –
and
tan θ⊕ =r sin θ cos φ + Ri sin θR cos(π − φR)
Ri cos θR − r cos θ(65)
solved numerically. Crossing the ionized wind, the radiation is further attenuated by an
optical depth ≃ Qντ∞d . We neglect the self absorption of the IR radiation emitted by the
ionized wind
Figure 14 shows the SED distribution arising from the front face of the disk. With our
standard set of parameters, the emission is dominated by the disk atmosphere at wavelengths
. 40 µm and by the internal disk emission at longer wavelengths. The envelope emission
never produces a noticeable contribution. The disk atmosphere has a pronounced peak of
emission at 3µm due to secondary heating by the envelope. The relevance of this effect
depends on the amount of dust located in the immediate surroundings of the star. We have
assumed uniform density within the globule up to the dust evaporation radius, which is
of the order of a few stellar radii. A larger dust free cavity would significantly reduce the
intensity of the 3µm bump.
6. Discussion
The geometry we have assumed to illustrate the physical basis of our model represents
in practice an extreme case. A disk oriented face-on with respect to the ionizing star receives
the maximum amount of radiation. This causes a substantial increase of the flaring angle,
and therefore of the inner stellar flux intercepted by the disk. If the disk is also oriented
face-on with respect to the Earth, the observer will receive the highest amount of disk
radiation. Even if chances of having such a fortunate alignment are rather low, one of the
most intriguing 10µm sources of the Orion Nebula, SC3 (McCaughrean & Gezari 1991,
Hayward et al. 1994; Figure 15) can be readily interpreted in this way. With a 10µm flux
of ≃ 4 Jy, SC3 is the brightest compact source in the Orion Nebula, excepting the BN/KL
region. It is located at a projected distance ≈ 1′′ W of θ1Ori C, and mostly for this reason
it has never been observed at wavelengths shorter than 2µm. In our 10µm images, SC3 is
spatially resolved with FWHM ≃ 0.5′′, corresponding to approximately 200AU, the typical
size of circumstellar disks in Orion. A direct comparison with the nearby complex of arc-like
structures produced by the wind-wind interactions suggests that SC3 is a different kind of
phenomenon. Despite the fact that it has the shortest projected distance from θ1Ori C,
SC3 is apparently undisturbed by the powerful wind from the O6.5 star, as it is the only
extended source with circular shape. This indicates that the physical distance between
SC3 and θ1Ori C is much larger than for the other sources. The simplest interpretation
is that SC3 is a star+disk system in the background with respect to θ1Ori C with a very

– 23 –
high mid-IR brightness produced by the disk being oriented face-on both to θ1Ori C and
to us. Figure 18 shows that the 10µm photometry of SC3 is compatible with our standard
model and a distance slightly lower than 30”=0.065 pc. It must also be noticed that the
low resolution 10µm spectrum of SC3 obtained by Hayward et al. (1994) shows silicate
emission, whereas our standard model predicts at these distances an almost featurless SED
dominated by the inner disk emission. Further data on this sources are needed to constrain
our set of parameters.
In general, disks are randomly tilted with respect both to the ionizing star and to the
Earth, and therefore their apparent brightness will be reduced in comparison to our standard
case. In Section 4.1 we stated that the tilt angle with respect to the ionizing star, θd, can be
simply accounted for by a projection factor cos θd in the flux received by the disk surface.
However, this is strictly true only for tilt angles θd < α(ao). Since disks are intrinsically
flared, large tilt angles may cause part of the surface exposed to the ionizing star to go under
the edge’s shadow. When this happens, the heating of the surface is no longer uniform, the
flaring angle varies with the azimuthal angle and the disk loses its symmetry around the
rotation axis. Along its orbit around the central star, the disk material will experience a
periodic modulation of pressure and temperature, and the resulting differential drag may
cause the disk to warp. Photoevaporation will occur only from the area directly exposed to
the flux from the ionizing star, as well as on the opposite disk edge. Photoevaporation from
the edge appears compatible with the observations showing that disks in the Orion Nebula
are truncated (McCaughrean, Stapelfeldt & Close 2000). As the analysis of the structure
and evolution of circumstellar disks in these conditions goes beyond the scope of this paper,
one can maintain the “cos θd” treatment to account for a reduced flux falling on the disk
surface, keeping in mind that the derived tilt angle in this case is an overestimate of the real
one.
In what concerns the tilt angle with respect to the Earth, θ⊕, Chiang and Goldreich
(1999) have studied the corresponding variation of the SEDs for isolated disks. They found
that the SED shows negligible variations until θ⊕ approaches the flaring angle at the disk
outer radius α(a0). When the inner disk regions enter in the shadow, the short wavelength
emission begins to disappear from the vantage point of the observer. To account for this
effect, we simply multiply the flux emitted by the disk at each radius by the fraction of visible
area. Figure 16 shows the dramatic reduction of the disk brightness at short wavelengths,
together with the stellar radiation, when θ⊕ increases from 45 to 50 crossing α(a0) ≃ 48.
Our geometrical treatment is only valid as long as the disk is optically thick at all wavelengths
and large enough to contain a strongly flared surface. In the scheme of CG97, the outer disk
regions are in a completely optically thin regime (region c of Equation 56), and therefore
the transition is modulated by the variation of optical depth across the disk. In our case,

– 24 –
however, the truncated disk remains optically thick (region a) up to the disk edges. We find
that the disk remains optically thick up to ao ≃ 100AU over a wide range of parameters. In
particular, our standard disk+envelope model has aa|b = 113AU. Thus, the change of SED
at short wavelengths is much more abrupt. The decrease of disk emission at λ > 30µm, is
correct as long as the outer parts of the disk are also optically thick and, therefore, sensitive
to the disk orientation. In conclusion, the disk orientation with respect to the Earth can be
regarded like a “switch” for the short wavelength radiation. If the star is directly visible (e.g.
with HST), then the brightness at near- and mid-IR wavelengths will be high, otherwise if the
star is invisible. Transition objects with heavily reddened stars should be rare. Observations
at 10µm of dark silhouette disks appear to confirm this result: the the large dark silhouette
114-426, seen edge-on, has a star under Av ≥ 60 magnitudes of extinction (McCaughrean et
al 1998) and remained undetected at [N ] ≃ 9 in our deep survey performed with the UKIRT
3.8m telescope (Robberto et al, 2002), whereas the dark silhouette with the brightest central
star, object 218-354, has been detected at 10µm both by Hayward & McCaughrean (1997)
and by us.
In the standard case, the envelope contribution is negligible at all wavelengths with
respect to that coming from the disk. For some disk orientations, however, the envelope
emission becomes important. This because the envelopes are extended, and the larger the
value of θ⊕, the more the disk emission will be suppressed, whereas the fraction of envelope
obscured by the disk will be negligible. If the disk is seen close to edge-on, the envelope
emission may eventually dominate. Figure 22 shows two of the most prominent objects,
sources 177-341 (HST 1) and 182-413 (HST 10), as observed by with MAX on UKIRT
and, for comparison, with the HST. These systems, with the disks seen edge-on, are clearly
resolved at 10µm with some evidence of a central peak. Size and orientation in the mid-IR
correspond to that observed in the recombination lines. These images provide conclusive
evidence that photo-evaporated dust can be heated in the photoionized globule and emit
significantly in the mid-IR, with brightness comparable to that of the disk. It is clear that
all possible combinations of angles θd and θ⊕ may generate a variety of SEDs similar to
those presented in Figure 16. All are characterized by an SED peaking at ≃ 30−60µm and
relatively low fluxes at wavelengths shorter than 10µm.
Let us consider the impact of other basic parameters on the SEDs. In Figure 18, we
present the SED obtained by placing our standard proplyd at various distances between 30′′
(d=0.065 pc) and 150′′ (d=0.33 pc) from the ionizing star. The SEDs are renormalized to the
total stellar luminosity to compare their structure independently of the geometrical dilution
of the signal with the distance. Still, the (relative) stellar flux in the visible increases with the
distance, due to the corresponding reduction of optical depth within the globule described
in Section 3.2 (see also Figure 1). In the far-IR the flux drops with the distance because the

– 25 –
outer disk is colder, as it receives less flux from the ionizing star, and it is therefore flatter,
receiving less flux also from the central star. In comparison, the flux from the superheated
layer is less affected by the distance from the ioninzing star, and for this reason the silicate
peak in emission becomes relatively more prominent.
Figure 19 shows the variation of the SED with Rout, the distance of the ionization front.
We have considered Rout = 100AU, 200AU and 300AU. The emerging stellar flux is reduced
due to the increase of optical depth in the envelope with the globule size (see again Figure
1). The relative importance of the envelope emission increases significantly, but the SED
is still dominated by the disk emission due to the special alignment of our standard case
mentioned above. To facilitate the comparison with our standard case, we have neglected
here the contribution from the hemisphere opposite to the ionizing star.
The change of SED with the inner disk radius, ai, is shown in Figure 20. The gap in
the inner disk produces the expected decrease of the SED between 2 and 10µm. Finally,
the variation of SEDs with the stellar temperature is illustrated in Figure 21. Since we have
kept the stellar radius constant, this plot also illustrates the variation of SEDs with the
luminosity of the central star. Reducing the stellar temperature the disk emission becomes
more and more important because the external contribution has been assumed to remain
constant.
A direct application of our model is presented in Figure 17, showing a fit to the available
photometric data of source 177-341=HST1 (see Figure 22). We have assumed θd = 45 and
θ⊕ = 75, to account for a disk seen nearly edge-on. We used a distance d = 43.′′2, twice
the projected distance from θ1Ori C. Hillenbrand (1997) gives a spectral type later than
K6. We have adopted a M1 spectral type with T⋆ = 3750K and radius R⋆ = 2.18R⊙.
Concerning the geometry, we have assumed an ionization front at Rout = 300AU and a disk
with an inner radius ai = 0.3AU. To match the stellar photometry, we assumed Av = 2.2.
The model predicts τR=1.45, so that approximately 0.6 magnitudes of visual extinction must
be attributed to foreground extinction. In this fit, the envelope and disk have comparable
brightness, the disk emission been provided by the disk interior.
Given the number of parameters left unconstrained by the available observational data,
it is not surprising that with our model we are able to fit a single photometric point at 10µm.
On the other hand, the 10µm photometry cannot be readily explained with conventional
disk models. Our model also provides a strong prediction for high mid- and far-IR fluxes
from these systems. Future high spatial resolution observations at these wavelengths will
asses the validity of our assumptions and provide insights into the evolution of circumstellar
disks in the most typical environmental conditions.

– 26 –
A number of assumptions deserve some additional comment. First, we have assumed
that the disk atmosphere remains well defined and treatable by the CG97 approximation even
when the flaring angles become extreme (up to ≃ 45). In presence of photoevaporation,
however, the conditions of hydrostatic equilibrium used to set the disk profile are no longer
valid, and the locus of the disk “atmosphere” should be recalculated taking into account
the radially diverging flow. Second, although we have a basic understanding of the globule
physics, it is still very hard to constrain the actual structure from the observations, deriving
information such as the density distribution. Third, the grain properties are critical, not
only in what concerns the absorption efficiencies (Section 3.4), but also the albedo, that we
neglected. Scattering processes affect the near- and mid-IR emission of disks seen nearly
edge on. Also, it has been shown that dust scattering in an optically thin envelope can
contribute to the increase of disk temperature at large distances from the central star (Natta
1993), therefore adding a further contribution to the energy input at the origin of the disk
flaring. Finally, we assumed in Section 2 a simplified model for the Orion Nebula. It is
known (O’Dell 2001a, O’Dell 2001b) that the density in the Orion Nebula decreases with
the distance from the interface with the Orion Molecular Cloud, where the main ionization
front is located. Also, θ1Ori C is approximately three times closer to the main ionization
front than to the foreground veil of neutral material, where a secondary ionization front is
also located. The major effect of a more refined description would be a reduction of our
estimates for the Ly-α energy density. We have seen that this is a secondary source of dust
heating. A modulation over the r−2 dependency of the central radiation field would also be
introduced. This effect may be significant in future studies aimed to the detailed comparison
of the SED for different objects.
7. Summary and conclusion
We have explored the IR emission of circumstellar disks in the environment where star
formation most typically occurs, i.e. a HII region powered by massive OB stars. This scenario
applies in particular to the Orion Nebula, where the interaction of circumstellar disk with
the environment has been directly resolved by the HST. We have build our model considering
the four types of radiation relevant to the dust heating in a HII region, e.g ionizing (EUV)
and non-ionizing (FUV) flux from the exciting star (θ1Ori C), resonant Ly-α radiation and
the remaining nebular radiation. We evaluated how these radiation sources affect the IR
SED arising from:
1. A spherical, homogeneous, optically thin, circumstellar globule, photoevaporated by
the UV radiation of the HII region exciting star. The globule has a neutral core of

– 27 –
uniform density, and the photoevaporated atmosphere is treated following the Dyson
(1968) model. With our assumptions, the most important parameter constraining the
IR emission, the radial optical depth to the UV radiation, depends only on the distance
from the ionizing star and on the globule size. The thermal emission peaks in the range
10 − 30µm, depending mostly on the dust composition.
2. A non-accreting disk directly exposed to the nebular radiation. The disk is in hy-
drostatic and radiative equilibrium, and treated following the prescription of Chiang
and Goldreich (1997). We modify the CG97 scheme to account for the fact that the
nebular radiation hits the disk surface with large angles. We follow the propagation
of the various radiative fluxes through the disk superheated atmosphere, deriving the
vertical temperature profile of the disk atmosphere. The disk faces receive unequal
amount of radiation and present different flaring angles. In particular, the flux emitted
from the face opposite to the ionizing star provides a model to the IR emission of the
dark silhouette disks observed in the Orion Nebula.
3. A combined system composed by the disk and the photoevaporated envelope, i.e. a
photoionized proplyd of the type observed in the immediate surroundings of θ1Ori C
in the Orion Nebula.
Depending on the distance and on the tilt angle of the disk with respect to the ionizing star,
the disk flaring may be substantially higher than in the case of isolated disks. The tilt angle
with respect to the Earth plays also a major role by hiding the central parts of the disk. The
relative intensity of the disk vs. envelope emission varies with the tilt angle to the direction
of the Earth. The high temperatures reached by the dust either at the disk atmosphere or
within the envelope produce a SED peaking at 30 − 60µm.
We explore the dependency of the SEDs upon the tilt angle with respect to the Earth,
the distance from the ionizing star, the size on the envelope, the inner disk radius, and the
temperature of the disk’s central star. The resulting SEDs are characterized by a broad
peak of emission at 30-60µm and are in general significantly different from those of isolated
disks in low-mass star forming regions like Taurus-Auriga. Our model indicates that in the
presence of an external radiation field, relatively evolved “Class 2” objects may display a
SED peaking at mid-IR and far-IR wavelengths. The model explains the strong mid-IR
excess we have recently detected on several sources in a 10µm survey of the Orion Nebula.

– 28 –
8. Acknowledgments
The authors whish to thank Bob O’Dell and an anonymous referee for carefull reading
of the origial manuscript and useful comments.
REFERENCES
Bally, J., Sutherland, R. S., Devine, D., Johnstone, D. 1998, AJ, 116, 293 (1998a)
Bally, J., Testi, L., Sargent, A., & Carlstrom, J. 1998, AJ, 116, 854 (1998b)
Bally, J., O’Dell, C. R., & McCaughrean, M. J. 2000, AJ, 119, 2919
Beckwith, S. V. W., Sargent, A. I., Chini, R. S., & Gusten, R. 1990, AJ, 99, 924
Beckwith, S. V. W., Sargent, A. I. 1996, Nature, 383, 139
Butner, H. M., Natta, A., and Evans, N. J. II 1994, ApJ, 420, 326
Chiang, E. I., Goldreich, P. 1997, ApJ, 490, 368
Chiang, E. I., Goldreich, P. 1999, ApJ, 519, 279
Choi, P. & Herbst, W. 1996, AJ, 111, 283
Draine, B. T., & Lee, H. M. 1984, ApJ, 285, 89
Dyson, J. E. 1968, ApJS, 1, 388
Edwards, S., Strom, S., Hartigan, P., Strom, K. M., Hillenbrand, L. A., Herbst, W., Attridge,
J., Merril, K. M., Probst, R., & Gatley, I. 1993, AJ, 106, 372
Hartmann, K. 1998, Accretion Processes in Astrophysics, Cambridge University Press, 157
Hayward, T. L., Houck, J. R., Miles, J. W. 1994, ApJ, 433, 157
Hayward, T. L., McCaughrean, M. J. 1997, AJ, 113, 346
Henney, W. J., Raga, A. C., Lizano, S., & Curiel, S. 1996, ApJ, 465, 216
Hillenbrand, L. A. 1997, AJ, 113, 1733
Hummer, D. G., & Kunasz, P. B. 1980, ApJ, 236, 609
Johnstone, D., Hollenbach, D., & Bally, J. 1998, ApJ, 499, 758
Kenyon, S. J., & Hartmann, L. 1987, ApJ, 322, 293
Marcy, G. W., Cochran, W. D., & Mayor, M. 2000, in Protorstar and Planets IV, V. Mannin,
A. P. Boss and S. R. Russell eds., The University of Arizona Press, Tucson, p. 1285

– 29 –
McCaughrean, M. J., & Gezari, D. Y. 1991, in ASP Conf. Ser. 14, Astrophysics with
Infrared Arrays, Ed. R. Elston (San Francisco: ASP), 301
McCaughrean, M. J., & Stauffer, J. R., 1994, AJ, 108, 1382
McCaughrean, M. J., Chen, H., Bally, J., Erickson, E., Thompson, R., Rieke, M., Schneider,
G., Stolovy, S., & Young, E. 1998, ApJ, 429, L157
McCaughrean, M. J., Stapelfeldt, K. R., & Close, L. M. 2000, in Protorstar and Planets IV,
V. Mannin, A. P. Boss and S. R. Russell eds., The University of Arizona Press, Tucson,
p. 485
Natta, A. 1993, ApJ, 412, 76115.
Natta, A., & Panagia, N. 1976, A&A, 50, 191
Osterbrock, D. E. 1989, Astrophysics of Gaseous Nebulae and Active Galactic Nuclei, Uni-
versity Science Books, Mill Valley, California
O’Dell, C. R. 2000, ARA&A, 39, 990 (2001a)
O’Dell, C. R. 2000, PASP, 113,209 (2001b)
O’Dell, C. R., & Yusef-Zadeh, F. 2000, AJ120, 382
Palla, F. & Stahler S. W. 1999, ApJ, 525, 772
Panagia, N. 1973, AJ, 78, 929
Panagia, N. 1974, ApJ, 192, 221
Panagia, N. 1978, in Infrared Astronomy, ed. G. Setti and F. Fazio, D. Reidel Publ. Co., p.
115
Pastor, J., Canto, J., & Rodriguez, L. F. 1991, A&A, 246, 551
Rebull, L. M. 2001, AJ, 121, 1676
Robberto, M., Beckwith, S. V. W., Herbst, T. M. 2002, in prep.
Ruden, S. P., & Pollack, J. B. 1991, ApJ, 375, 740
Shakura, N. I., & Sunyaev, R. A. 1973, A&A, 24, 337
Shu, F., Adams, F. C., & Lizano, S. 1987, ARA&A, 25,23
Stassun, K. G., Mathieu, R. D., Mazeh, T., & Vrba, F. J. 1999, AJ, 117, 2941
Storzer, H., & Hollenbach, D. 1999, ApJ, 515, 669
This preprint was prepared with the AAS LATEX macros v5.0.

– 30 –
Fig. 1.— Optical depth τ 0d = σdniRi as a function of the distance d from θ1Ori C. Six
different globules are considered, with ionization front at R = 50, 100, 200, 300, 400, and
500 AU.
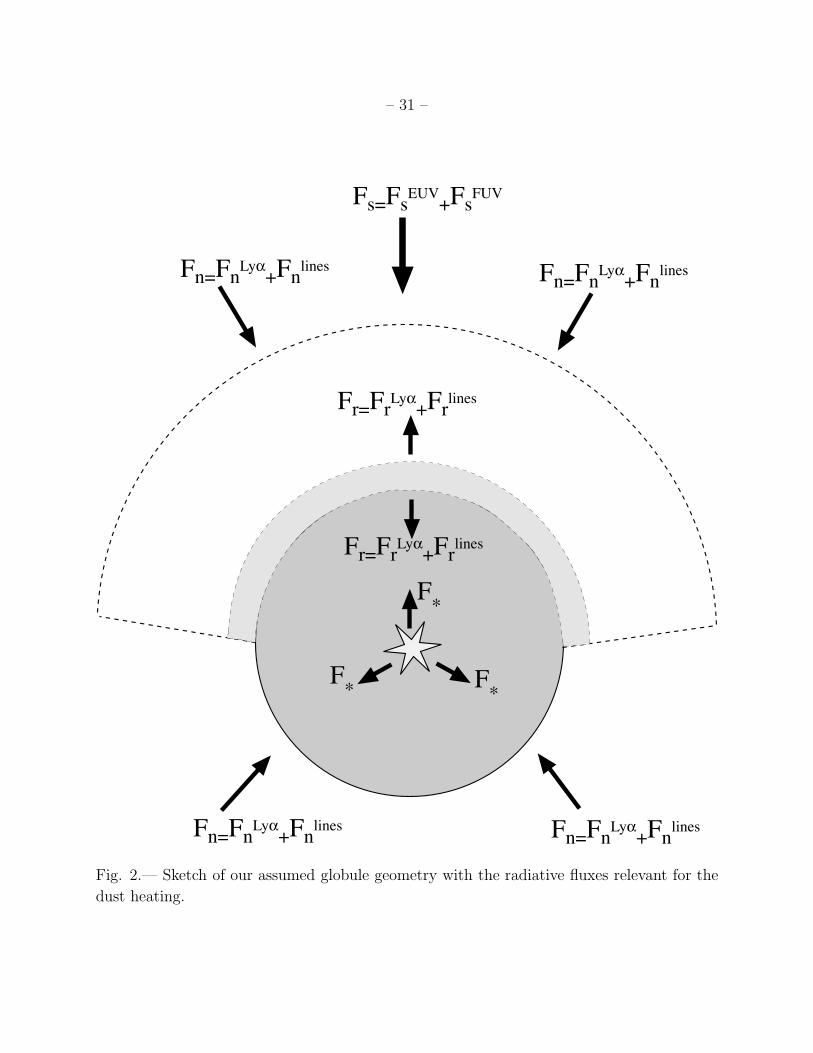
– 31 –
Fig. 2.— Sketch of our assumed globule geometry with the radiative fluxes relevant for the
dust heating.

– 32 –
Fig. 3.— Propagation of the flux from θ1Ori C within the ionized wind. The two solid
lines represent the FUV flux (upper line) and the EUV flux (lower line). The dashed line
represents the dust optical depth, whereas the dot-dashed line represents the gas optical
depth. The dotted line represents the ionization fraction.

– 33 –
t2d dt
Ri
q
q
O
TQ
S
R
qh
P
r
tr
Ri
t d
Fig. 4.— Globule geometry. The left side shows our naming conventions for the optical
depths, the right side for the distances. There is a simple relation between optical depth and
distance (Equation 18), and corresponding quantities share the same index. Note, however,
that τ corresponds to the distance Ri − r.
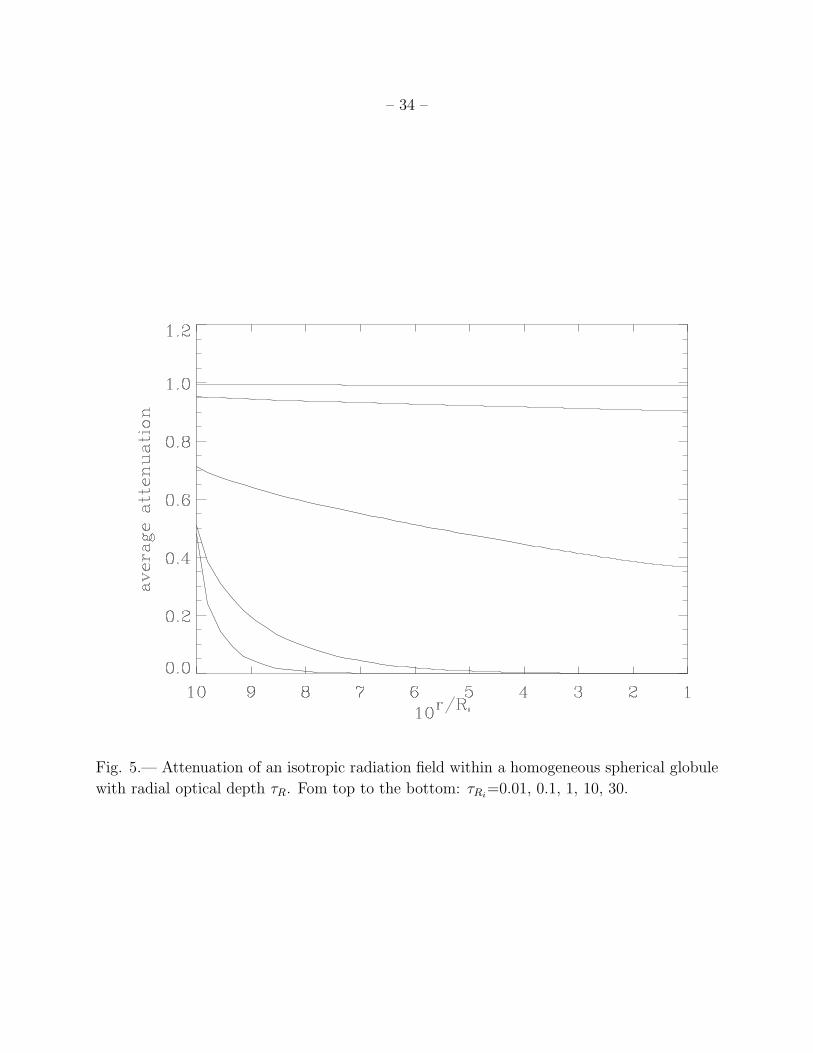
– 34 –
Fig. 5.— Attenuation of an isotropic radiation field within a homogeneous spherical globule
with radial optical depth τR. Fom top to the bottom: τRi=0.01, 0.1, 1, 10, 30.

– 35 –
Fig. 6.— Flux density along the globule axis. The vertical dotted line indicates the position
of the ionization front at Ri = 100 AU. The fluxes represented are: non-ionizing FUV
radiation from θ1Ori C (solid thin line), ionizing EUV radiation from θ1Ori C (solid thick
line); radiation from the globule central star (long-dashed line), recombination line radiation
from the nebular environment and from the ionization front (dot-dashed line); Ly-α radiation
from the nebular environment and from the ionization front(short-dashed line), this last close
to zero and mostly visible with a peak at the ionization front.

– 36 –
Fig. 7.— Temperature distribution along the globule axis resulting from the radiation sources
represented in Figure 6.

– 37 –
Fig. 8.— Spectrum emitted by a dusty globule with our standard set of parameters. The
two solid curves are relative to type-1 grains (left) and type-2 grains (right). Each curve is
the sum of the contributions from the neutral (dashed line) and ionized (dotted line) parts
of the envelope. Self absorpion has not been considered. The stellar spectrum is not plotted.

– 38 –
Fig. 9.— Radius ad at which the disk heating from the central star equals that from the
HII region as a function of the disk tilt angle θd and of the distance from θ1Ori C. From
top to bottom, the lines represent decreasing distances from θ1Ori C. The dashed part of
each line represents the case of pure nebular heating, occurring on the rear face of the disk
(dark silhouette) within the HII region. The dotted lines at θd = 80−90 are relative to the
case of a disk aligned almost edge-on with respect to the direction of θ1Ori C. The stellar
parameters are T⋆ = 4, 500 K and L⋆ = 2.5L⊙.

– 39 –
Fig. 10.— Vertical sections of the disk. The continuous line represents the locus of the
disk photosphere when both the flux from θ1Ori C and the nebular radiation are taken into
account. The dot-dashed line has been obtained by neglecting the flux from θ1Ori C and
is therefore representative of the dark face of the disk. The dotted line has been obtained
taking into account only the radiation from the disk central star (as in CG97).

– 40 –
Fig. 11.— Temperature of the superheated layer in absence of external luminosity at dis-
tances (top to bottom) a=3, 10, 30, 100 AU from the central star.
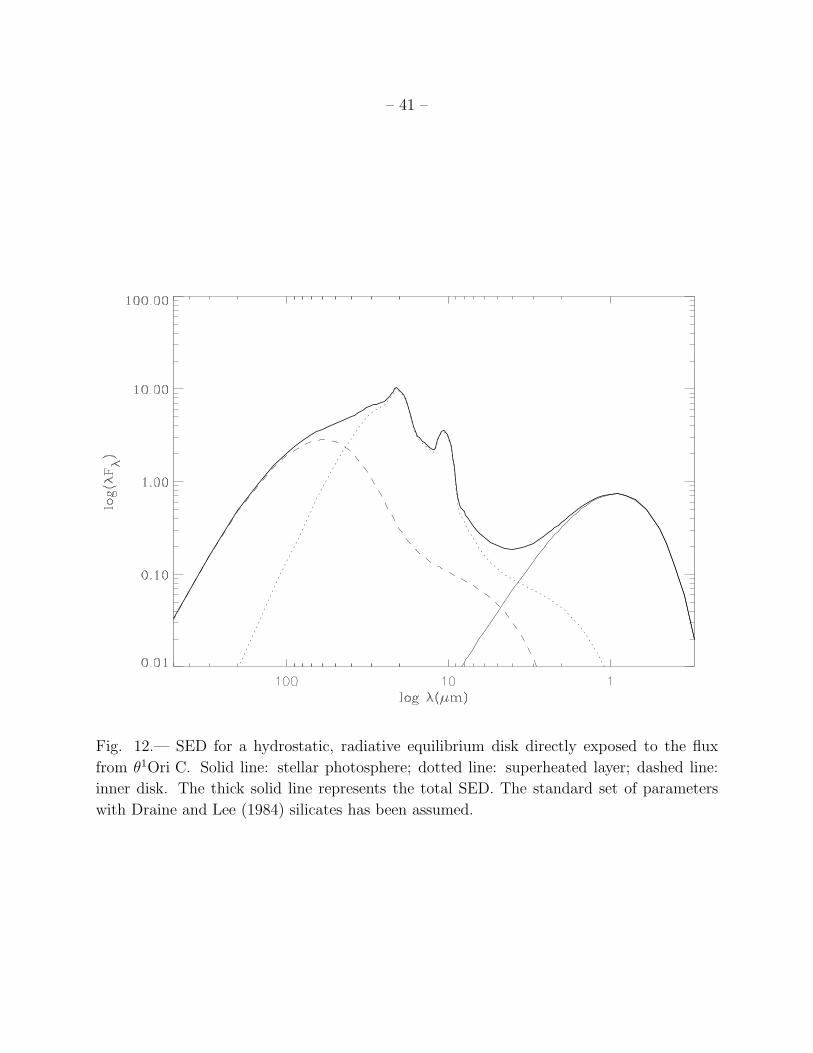
– 41 –
Fig. 12.— SED for a hydrostatic, radiative equilibrium disk directly exposed to the flux
from θ1Ori C. Solid line: stellar photosphere; dotted line: superheated layer; dashed line:
inner disk. The thick solid line represents the total SED. The standard set of parameters
with Draine and Lee (1984) silicates has been assumed.

– 42 –
Fig. 13.— Same as Figure 12, for a hydrostatic, radiative equilibrium disk directly exposed
to the nebular radiation only.

– 43 –
Fig. 14.— SED of a flaring disk embedded within a photoevaporated envelope. Solid line:
stellar photosphere; dotted line: superheated layer; dashed line: inner disk; dot-dashed line:
outer envelope; thick solid line: total SED.

– 44 –
Fig. 15.— Image at 10µm of the θ1Ori C field. The arrows mark the position of θ1Ori C.
Source SC3 is the bright knot at located ≈ 1′′ to the West of θ1Ori C. The field size is
approximately 15′′×15′′ and the pixel size is 0.26′′/pixel. The image has been obtained with
the MAX camera on the UKIRT telescope and is part of a large mosaic of the Orion nebula
core (Robberto et al 2002, in preparation).

– 45 –
Fig. 16.— SED of a flaring disk embedded within a photoevaporated envelope for different
values of the tilt angle with respect to the Earth θ⊕. The thick line refers to the standard
case.

– 46 –
Fig. 17.— Photometry of the proplyd source 177-341 = HST 1 (crosses) and model SED
assuming a flaring disk embedded within a photoevaporated envelope. See text for the fit
parameters. The 10µm photometric point derives from the image presented in Figure 22.
PHotometry at shorter wavelengths is from Hillnebrand (1997) and from Robberto et al.
(2002).

– 47 –
Fig. 18.— SED of a flaring disk embedded within a photoevaporated envelope for different
values of the distance from θ1Ori C. The thick line refers to the standard case.

– 48 –
Fig. 19.— SED of a flaring disk embedded within a photoevaporated envelope for different
values of the ionization radius Rout.

– 49 –
Fig. 20.— SED of a flaring disk embedded within a photoevaporated envelope for different
values of the disk inner radius ai.

– 50 –
Fig. 21.— SED of a flaring disk embedded within a photoevaporated envelope for different
values of the effective stellar temperature T⋆.

– 51 –
Fig. 22.— The prominent proplyd sources 177-341 (HST 1, left) and 182-413 (HST 10,
right) imaged by the HST (top) and MAX on UKIRT (bottom). The HST images refer to a
combination of recombination lines, namely [NII] (red), Hα (green) and [OIII] (blue). The
MAX images have been taken in N-broad band with integration time of the order of 600
seconds on source (see Robberto et al. 2002 for details)