
Bioclimatic Envelopes for Two Bat Species from a Tropical ...
21
Citation: Bandara, A.P.M.J.; Madurapperuma, B.D.; Edirisinghe, G.; Gabadage, D.; Botejue, M.; Surasinghe, T.D. Bioclimatic Envelopes for Two Bat Species from a Tropical Island: Insights on Current and Future Distribution from Ecological Niche Modeling. Diversity 2022, 14, 506. https://doi.org/ 10.3390/d14070506 Academic Editor: Michael Wink Received: 6 April 2022 Accepted: 17 June 2022 Published: 22 June 2022 Publisher’s Note: MDPI stays neutral with regard to jurisdictional claims in published maps and institutional affil- iations. Copyright: © 2022 by the authors. Licensee MDPI, Basel, Switzerland. This article is an open access article distributed under the terms and conditions of the Creative Commons Attribution (CC BY) license (https:// creativecommons.org/licenses/by/ 4.0/). diversity Article Bioclimatic Envelopes for Two Bat Species from a Tropical Island: Insights on Current and Future Distribution from Ecological Niche Modeling A. P. Malsha J. Bandara 1, * , Buddhika D. Madurapperuma 2 , Gayan Edirisinghe 3 , Dinesh Gabadage 3 , Madhava Botejue 3 and Thilina D. Surasinghe 4 1 Commercial Bank of Ceylon PLC, No 21, Sir Razik Fareed Mawatha, Colombo 00100, Sri Lanka 2 Green Diamond, 220/B, Maharanugegoda, Ragama 11010, Sri Lanka; [email protected] 3 Biodiversity Conservation Society, No: 150/6, Stanly Thilakaratne Mawatha, Nugegoda 10250, Sri Lanka; [email protected] (G.E.); [email protected] (D.G.); [email protected] (M.B.) 4 Department of Biological Sciences, Bridgewater State University, Bridgewater, MA 02325, USA; [email protected] * Correspondence: [email protected]; Tel.: +94-773973781 Abstract: Bats perform critical ecosystem functions, including the pollination, seed dispersal, and regulation of invertebrate populations. Yet, bat populations are declining worldwide primarily due to habitat loss and other anthropogenic stressors. Thus, studies on bat ecology, particularly on environ- mental determinants of bat occupancy, are paramount to their conservation. High mobility, nocturnal behavior, and roosting site selection of bats make conventional surveys challenging. Moreover, little is known about geographic distribution, habitat suitability, and responses to climate change among tropical bat species. To bridge these research gaps, we applied ecological niche modeling to two Ceylonese bat species, Kerivoula malpasi and Kerivoula picta, to map their geographic distribution. Seasonal variations in temperature and precipitation were critical environmental predictors of bat distribution in general. Southwestern lowland forests contained the most optimal habitats for the relatively wide-ranging Kerivoula picta, while the central highlands provided the most suitable habi- tats for the narrow-ranging Kerivoula malpasi. No tangible changes in the highly suitable habitats were evident in response to projected climate change for either species. Yet, the optimal ranges of K. malpasi can become fragmented in the future, whereas the most optimal habitats for K. picta are likely to become spatially contiguous in the future. Habitat availability or fundamental niche alone is insufficient to reliably forecast species persistence, thus we caution against considering these two bat species as resilient to climate change. Our findings will enable the conservation authorities to initiate preemptive conservation strategies, such as the establishment of landscape-scale habitat connectivity and management of buffer zones around conservation lands. We also encourage conservation author- ities to employ ecological niche models to map potential species distributions and to forecast range shifts due to climate change. Keywords: Kerivoula picta; Kerivoula malpasi; MaxEnt; climate change; ecological niche modeling 1. Introduction Given their ability to fly, bats have inherited a unique position in the mammalian phylogeny [1,2]. Among mammals, global-scale species diversification (~1400 species) of bats is only second to rodents [3]. Flight and echolocation are among the key adaptive traits underlying their success and cosmopolitan biogeography [4]. While certain chiropteran lineages (e.g., leaf-nosed bats) have undergone remarkable niche specializations following adaptive radiation [5], recent evidence also suggests multiple instances of convergent evolution [6]. Bats are often considered environmental indicators given their heightened sensitivity to deforestation and damage to other terrestrial ecosystems, disturbances at Diversity 2022, 14, 506. https://doi.org/10.3390/d14070506 https://www.mdpi.com/journal/diversity
-
Upload
khangminh22 -
Category
Documents
-
view
0 -
download
0
Transcript of Bioclimatic Envelopes for Two Bat Species from a Tropical ...

Citation: Bandara, A.P.M.J.;
Madurapperuma, B.D.; Edirisinghe,
G.; Gabadage, D.; Botejue, M.;
Surasinghe, T.D. Bioclimatic
Envelopes for Two Bat Species from a
Tropical Island: Insights on Current
and Future Distribution from
Ecological Niche Modeling. Diversity
2022, 14, 506. https://doi.org/
10.3390/d14070506
Academic Editor: Michael Wink
Received: 6 April 2022
Accepted: 17 June 2022
Published: 22 June 2022
Publisher’s Note: MDPI stays neutral
with regard to jurisdictional claims in
published maps and institutional affil-
iations.
Copyright: © 2022 by the authors.
Licensee MDPI, Basel, Switzerland.
This article is an open access article
distributed under the terms and
conditions of the Creative Commons
Attribution (CC BY) license (https://
creativecommons.org/licenses/by/
4.0/).
diversity
Article
Bioclimatic Envelopes for Two Bat Species from a TropicalIsland: Insights on Current and Future Distribution fromEcological Niche ModelingA. P. Malsha J. Bandara 1,* , Buddhika D. Madurapperuma 2, Gayan Edirisinghe 3, Dinesh Gabadage 3,Madhava Botejue 3 and Thilina D. Surasinghe 4
1 Commercial Bank of Ceylon PLC, No 21, Sir Razik Fareed Mawatha, Colombo 00100, Sri Lanka2 Green Diamond, 220/B, Maharanugegoda, Ragama 11010, Sri Lanka; [email protected] Biodiversity Conservation Society, No: 150/6, Stanly Thilakaratne Mawatha, Nugegoda 10250, Sri Lanka;
[email protected] (G.E.); [email protected] (D.G.); [email protected] (M.B.)4 Department of Biological Sciences, Bridgewater State University, Bridgewater, MA 02325, USA;
[email protected]* Correspondence: [email protected]; Tel.: +94-773973781
Abstract: Bats perform critical ecosystem functions, including the pollination, seed dispersal, andregulation of invertebrate populations. Yet, bat populations are declining worldwide primarily due tohabitat loss and other anthropogenic stressors. Thus, studies on bat ecology, particularly on environ-mental determinants of bat occupancy, are paramount to their conservation. High mobility, nocturnalbehavior, and roosting site selection of bats make conventional surveys challenging. Moreover,little is known about geographic distribution, habitat suitability, and responses to climate changeamong tropical bat species. To bridge these research gaps, we applied ecological niche modeling totwo Ceylonese bat species, Kerivoula malpasi and Kerivoula picta, to map their geographic distribution.Seasonal variations in temperature and precipitation were critical environmental predictors of batdistribution in general. Southwestern lowland forests contained the most optimal habitats for therelatively wide-ranging Kerivoula picta, while the central highlands provided the most suitable habi-tats for the narrow-ranging Kerivoula malpasi. No tangible changes in the highly suitable habitatswere evident in response to projected climate change for either species. Yet, the optimal ranges ofK. malpasi can become fragmented in the future, whereas the most optimal habitats for K. picta arelikely to become spatially contiguous in the future. Habitat availability or fundamental niche alone isinsufficient to reliably forecast species persistence, thus we caution against considering these two batspecies as resilient to climate change. Our findings will enable the conservation authorities to initiatepreemptive conservation strategies, such as the establishment of landscape-scale habitat connectivityand management of buffer zones around conservation lands. We also encourage conservation author-ities to employ ecological niche models to map potential species distributions and to forecast rangeshifts due to climate change.
Keywords: Kerivoula picta; Kerivoula malpasi; MaxEnt; climate change; ecological niche modeling
1. Introduction
Given their ability to fly, bats have inherited a unique position in the mammalianphylogeny [1,2]. Among mammals, global-scale species diversification (~1400 species) ofbats is only second to rodents [3]. Flight and echolocation are among the key adaptive traitsunderlying their success and cosmopolitan biogeography [4]. While certain chiropteranlineages (e.g., leaf-nosed bats) have undergone remarkable niche specializations followingadaptive radiation [5], recent evidence also suggests multiple instances of convergentevolution [6]. Bats are often considered environmental indicators given their heightenedsensitivity to deforestation and damage to other terrestrial ecosystems, disturbances at
Diversity 2022, 14, 506. https://doi.org/10.3390/d14070506 https://www.mdpi.com/journal/diversity

Diversity 2022, 14, 506 2 of 21
roosting sites, broad-spectrum pesticides, and resource depletion [7–10]. They also playcrucial ecosystem services in pollination, seed dispersal, forest regeneration, suppressarthropod populations in both natural and agricultural landscapes, and nutrient andenergy redistribution [11–13].
Bats are declining worldwide, which can be linked to both habitat loss (e.g., deforesta-tion, expansion of commercial farmlands, urbanization) and anthropogenic disturbances(e.g., visitations at roosting sites, pesticide applications) [9]. Implementing conservationmeasures to counter these declines warrants information on species distribution, habitatsuitability, and species responses to global change [14]. However, due to their nocturnalbehavior and the incomplete sampling of roosting sites, field surveys may underestimatetheir true distribution [12]. Given taxonomic crypsis, the identification of bats to the specieslevel with gross morphological features alone is challenging and can result in improperestimations of their geographic distribution [15]. Although theoretical developments insoundscape ecology [16], automated recording devices, and machine-learning models [17]offer promising alternatives for conventional field sampling. Implementing such passivesurveys across broader geographies can be prohibitively expensive. Hence, there is apressing need to develop alternative methods to map the current and future distribution ofbats. Herein, predictive geospatial models that piggyback on environmental covariates ofspecies occupancy and limited georeferenced data on species presence, known as habitatsuitability models (species distribution models or ecological niche models, hereafter ENMs),can provide reliable solutions. This modeling approach is applicable for both mappingcurrent distribution and forecasting future range shifts in response to global environmentalchange [14,18].
Successful applications of ENMs depend on the selection of biologically meaning-ful proxies and spatial characteristics that correlate with the probability of species occu-pancy [14]. The ENMs strike an empirical relationship between observed species distri-bution and spatially explicit environmental variables [14,18], and thereby predict speciesoccurrence across geographies, forecast future distribution ranges in response to changingenvironment, and help prioritize conservation targets [19,20]. The ENMs have been widelyutilized to address questions pertaining to biogeography, conservation, evolution, hindcasthistorical species distributions, and estimate the magnitude of climate change on speciesgeographic ranges [21]. Seasonality and climate are critical drivers of habitat selectionby bats, as is evident from their variable roosting-site selection across seasons [22,23].Life-history stages of bats, such as mating, parturition, lactation, postnatal care, and peakfood-availability (e.g., such as insect swarms), are tethered to seasonality [10,18,24]. Bothresource acquisition and energy conservation by bats are also climate-mediated [25]. There-fore, bioclimatic variables are useful environmental proxies to model the fundamental nicheof bats.
Due to logistical and financial constraints, there is a paucity of island-wide bat surveysin Sri Lanka, and thus the current geographic ranges of bats remain unresolved. AlthoughENMs can at least partly address these knowledge gaps, such applications are considerablylimited in certain tropical biodiversity hotspots. For instance, in the Indian-oceanic islandof Sri Lanka, ENMs are uncommon in ecological and conservation research [26–28]. Ascholarly search across numerous (PubMed, BioOne, ProQuest, Web of Science, Dimensions)databases did not reveal any research on ENMs targeting Ceylonese bats.
Tropical islands, such as Sri Lanka, can be physiologically stressful environments char-acterized by disturbances emerging from frequent tropical storms, which can negativelyimpact bat populations [9]. Episodic extreme climate events (e.g., typhoons, hurricanes,or extended drought), put island bats at an elevated risk of catastrophic population de-clines [29]. Climate change can compound the psychological stress encountered by insularbats. For instance, rising global average air temperatures elevate the metabolic rate (i.e.,Arrhenius effect) [30], whereas the frequency and intensity of extreme climate events (e.g.,heat waves, tropical storms) are also likely to heighten in the tropical realm due to globalwarming [31]. Together, these phenomena impose physiological stress on endotherms such

Diversity 2022, 14, 506 3 of 21
as bats [30]. As warming trends escalate, geographic ranges can shift into cooler climates,either towards higher altitudes or higher latitudes [32,33]. Nevertheless, these adaptiverelocations are untenable for island bats (such as those of Sri Lanka) given geographicisolation, limited dispersal opportunities, and smaller island size. Hence, understandinghow climate change impacts island bats is crucial for conservation planning. Yet, howCeylonese bats respond to climate change remains understudied. Collectively, these sci-entific deficiencies impede conservation and management actions in Sri Lanka as well asother tropical islands [4]. To fulfill this research gap and applied needs, in this study (1) wedeveloped ENMs for two Ceylonese bat species under both current and future climatechange scenarios and (2) estimated their extent of occurrence (EOO) and area of occupancy(AOO) to re-evaluate their national conservation status. The ENMs we developed willmap both the current and future (in response to climate change) geographic ranges oftwo Sri Lankan bat species. Our efforts in mapping the potential distribution will pavepathways to develop similar applications for other bat species, both in Sri Lanka and othertropical islands.
2. Materials and Methods2.1. Focal Species
Sri Lanka is home to 31 species of bats (8 families), of which 18 are listed as threat-ened [3,34]. The genus Kerivoula (Family Vespertilionidae; subfamily Kerivoulinae, woolybats) comprises seven species distributed across Paleotropics, particularly in south andsoutheastern Asia, Australasia, as well as Sub-Saharan Africa [3]. Kerivoula congeners areinterior forest-dwellers that roost in foliage or tree cavities, and forage in high-clutter (i.e.,with dense vegetation) environments [35]. Only two Kerivoula congeners are known inSri Lanka: the Painted bat (K. picta) and the Sri Lankan Woolly bat (K. malpasi) [3,36–38](Figure 1).
Diversity 2022, 14, x FOR PEER REVIEW 4 of 22
Figure 1. (a) Painted bat (Kerivoula picta) (Male) (Photo credit—Gayan Edirisinghe) and (b) Sri
Lankan Woolly bat (Kerivoula malpasi) (Male) (Photo credit—Madhava Botejue), both species
roosting on Banana fronds.
Kerivoula picta is broadly distributed across the Indo-Malayan region [3,10] and
listed as “Near threatened” in both the Global and Sri Lankan Red Lists [34,39]. The Sri
Lankan endemic K. malpasi is nationally categorized as “Critically Endangered” [3], while
its Global status remains unassessed [3,34]. The existing distribution records of K. picta
are scattered throughout the Sri Lankan lowlands (<600 m), although they have been in-
frequently recorded in higher elevations (up to 1372 m). In contrast, K. malpasi is only
known from very few localities of the central highlands (up to 1260 m), and southwestern
and northeastern Sri Lanka [3,40] (Figure 2).
Figure 1. Cont.

Diversity 2022, 14, 506 4 of 21
Diversity 2022, 14, x FOR PEER REVIEW 4 of 22
Figure 1. (a) Painted bat (Kerivoula picta) (Male) (Photo credit—Gayan Edirisinghe) and (b) Sri
Lankan Woolly bat (Kerivoula malpasi) (Male) (Photo credit—Madhava Botejue), both species
roosting on Banana fronds.
Kerivoula picta is broadly distributed across the Indo-Malayan region [3,10] and
listed as “Near threatened” in both the Global and Sri Lankan Red Lists [34,39]. The Sri
Lankan endemic K. malpasi is nationally categorized as “Critically Endangered” [3], while
its Global status remains unassessed [3,34]. The existing distribution records of K. picta
are scattered throughout the Sri Lankan lowlands (<600 m), although they have been in-
frequently recorded in higher elevations (up to 1372 m). In contrast, K. malpasi is only
known from very few localities of the central highlands (up to 1260 m), and southwestern
and northeastern Sri Lanka [3,40] (Figure 2).
Figure 1. (a) Painted bat (Kerivoula picta) (Male) (Photo credit—Gayan Edirisinghe) and (b) Sri LankanWoolly bat (Kerivoula malpasi) (Male) (Photo credit—Madhava Botejue), both species roosting onBanana fronds.
Kerivoula picta is broadly distributed across the Indo-Malayan region [3,10] and listedas “Near threatened” in both the Global and Sri Lankan Red Lists [34,39]. The Sri Lankanendemic K. malpasi is nationally categorized as “Critically Endangered” [3], while its Globalstatus remains unassessed [3,34]. The existing distribution records of K. picta are scatteredthroughout the Sri Lankan lowlands (<600 m), although they have been infrequentlyrecorded in higher elevations (up to 1372 m). In contrast, K. malpasi is only known from veryfew localities of the central highlands (up to 1260 m), and southwestern and northeasternSri Lanka [3,40] (Figure 2).
2.2. Distribution Records
Species occurrence records were obtained for both focal species within Sri Lanka from(1) unpublished opportunistic observations by field biologists updated from 2016 to 2020;(2) published historical accounts [3,10,36,40–47]; (3) the Global Biodiversity InformationFacility [48]. Although distribution of K. picta is not limited to Sri Lanka, since our focalarea is Sri Lanka, we did not use distribution records outside Sri Lanka. Species–habitat re-lationships vary throughout their biogeography, thus interpolating K. picta’s environmentalproxies from its overall geographical range to map its distribution in Sri Lanka may lead tospurious results. Since our historical records (beyond 2000) were not georeferenced, thecoordinates for those observations correspond to the nearest town at the reported elevation.Since our historical records predate the year 2000, we cross-validated the historical recordsagainst field observations to confirm contemporary species presence.
2.3. Data Sources and Modeling Approach
Following a maximum entropy approach, we built the ENMs using georeferencedlocations of both bat species (63 and 5 locations for K. picta and K. malpasi, respectively)with the MaxEnt software version 3.3 (http://www.cs.princeton.edu/~schapire/maxent/(accessed on 20 February 2022)) [20]. Maximum Entropy (MaxEnt) is a machine-learningapproach to ENMs that uses environmental variables and georeferenced locations of speciespresence to predict both the current and future distribution ranges with weighted habitatsuitability [19].
Although our sample size for K. malpasi is small, MaxEnt can deliver reliable distribu-tion models even for sample sizes as small as five [49,50]. We screened records of K. pictafor spatial autocorrelation using SDMtoolbox in ArcMap (ver. 10.8.1) to remove correlatedgeoreferenced species-occurrence points [51], and subsequently extracted 58 spatially in-dependent (on average, 18 km between any two nearest occurrence points) georeferencedpoints for the ENM. Since the georeferenced points for K. malpasi were limited and spatially

Diversity 2022, 14, 506 5 of 21
dispersed (on average, 35 km between any two nearest occurrence points), we did notperform any autocorrelation diagnoses.
Diversity 2022, 14, x FOR PEER REVIEW 5 of 22
Figure 2. Updated distribution map of K. picta and K. malpasi in Sri Lanka. Published records were
extracted from the literature [3,10,36,40–48]. New records are from unpublished data from personal
observations of the authors and personnel communications with expert field biologists.
2.2. Distribution Records
Species occurrence records were obtained for both focal species within Sri Lanka
from (1) unpublished opportunistic observations by field biologists updated from 2016 to
2020; (2) published historical accounts [3,10,36,40–47]; (3) the Global Biodiversity Infor-
mation Facility [48]. Although distribution of K. picta is not limited to Sri Lanka, since our
focal area is Sri Lanka, we did not use distribution records outside Sri Lanka. Species–
habitat relationships vary throughout their biogeography, thus interpolating K. picta’s
environmental proxies from its overall geographical range to map its distribution in Sri
Lanka may lead to spurious results. Since our historical records (beyond 2000) were not
georeferenced, the coordinates for those observations correspond to the nearest town at
the reported elevation. Since our historical records predate the year 2000, we
Figure 2. Updated distribution map of K. picta and K. malpasi in Sri Lanka. Published records wereextracted from the literature [3,10,36,40–48]. New records are from unpublished data from personalobservations of the authors and personnel communications with expert field biologists.
As predictor variables, we used WorldClim bioclimatic variables, elevation, and land-cover geospatial data layers. The land-cover data was obtained from the CopernicusGlobal Land Cover (CGLC) dataset produced by the Land Monitoring Service at 100 mspatial resolution [52]. This global-scale dataset identifies a total of 23 land-use and land-cover types [52,53], which includes different types of forest types (evergreen, deciduous,mixed vegetation types as well as both open and closed forests), shrublands, herbaceousvegetation, herbaceous wetlands, moss and lichen, bare/sparse vegetation, croplands,permanent water bodies, and built-up land surfaces. The CGLC data were developed

Diversity 2022, 14, 506 6 of 21
from Sentinel-2 imagery (collected in 2019) and has been validated and used in geospatialanalyses [54].
The bioclimatic data were obtained from WorldClim database (http://www.worldclim.org/bioclim.htm (accessed on 4 January 2022)) [55,56] at a 1 km spatial resolution. Theelevation data were derived from NASA’s shuttle Radar topography mission, aggregatedto 1 km spatial resolution, using the median value. This elevation dataset has undergonepostprocessing to correct for no-data voids via interpolation techniques [57,58]. The orig-inal data for WorldClim bioclimatic variables were assembled from a variety of weatherstations (e.g., Global Historical Climate Network Dataset) using monthly precipitation,mean temperature, and minimum and maximum temperature data within a large climaticstations network. Bioclimatic variables were derived from the monthly temperature andprecipitation measurements to generate more biologically relevant variables suitable forENMs. These bioclimatic variables represent annual (e.g., mean annual temperature, an-nual precipitation) as well as seasonal (e.g., annual range in temperature and precipitation)trends and extreme conditions (e.g., temperature of the coldest and warmest month, andprecipitation of the wet and dry quarters).
2.4. Bioclimatic Variable Selection
We downloaded all 19 bioclimatic variables from WorldClim, which were derived fromthe past 30 years (1970–2000), and future averages over 20 years (2041–2060) [57,58] (Table 1).Both current and forecasted bioclimatic variables were available for the full geographicextents of Sri Lanka. The bioclimatic data was converted to the BIL raster files, and the datawere clipped to Sri Lanka’s geographical boundary (9.9433◦–5.8681◦ N, 79.3125◦–82.2285◦ E)using ArcGIS 10.8.1. These bioclimatic variables express annual trends and seasonality andare critical determinants of bat life histories and their fundamental niche [18]. Bioclimaticvariables have been used in the ENMs to map the current distribution, as well as to forecastfuture ranges in response to climate change [59,60].
Table 1. Bioclimatic variables from WorldClim 2.0 used to predict the current and future distributionof two Sri Lankan bat species.
Code Variable Description Unit
bio1 Annual mean temperature The average temperature for each month ◦C
bio2 Annual mean diurnal rangeMeasure of temperature change over the course ofthe year using monthly maximum temperatures
and monthly minimum temperatures
◦C
bio3 IsothermalityDerived by calculating the ratio of the mean
diurnal range (bio 2) to the annual temperature range(bio 7, discussed below), and then multiplying by 100
%
bio4 Temperature seasonality(Standard Deviation)
The amount of temperature variation over a cause ofthe year, based on the standard deviation (variation)
of monthly temperature averages%
bio5 Max temperature of warmest month The maximum monthly temperature occurrence over a givenyear (time series) or averaged span of years (normal)
◦C
bio6 Min temperature of coldest month The minimum monthly temperature occurrence over a givenyear (time series) or averaged span of years (normal)
◦C
bio7 Annual Temperature range A measure of temperature variation over a given period.(bio 7 = bio 5 − bio 6)
◦C
bio8 Mean temperature of wettest quarter Mean temperatures that prevail during the wettest season ◦C
bio9 Mean temperature of driest quarter Quarterly index approximates mean temperaturesthat prevail during the driest quarter
◦C
bio10 Mean temperature of warmest quarter Quarterly index approximates mean temperaturesthat prevail during the warmest quarter
◦C

Diversity 2022, 14, 506 7 of 21
Table 1. Cont.
Code Variable Description Unit
bio11 Mean temperature of coldest quarter Quarterly index approximates mean temperaturesthat prevail during the coldest quarter
◦C
bio12 Annual precipitation Sum of all total monthly precipitation values mm
bio13 Precipitation of wettest period The total precipitation that prevails during the wettest month. mm
bio14 Precipitation of driest period The total precipitation that prevails during the driest month mm
bio15 Precipitation seasonality(Coefficient variable)
Measure of the variation in monthlyprecipitation totals over the course of the year %
bio16 Precipitation of wettest quarter Total precipitation that prevails during the wettest quarter mm
bio17 Precipitation of driest quarter Total precipitation that prevails during the driest quarter mm
bio18 Precipitation of warmest quarter Total precipitation that prevails during the warmest quarter mm
bio19 Precipitation of coldest quarter Total precipitation that prevails during the coldest quarter mm
The multiple bioclimatic variables we used from WorldClim can be highly corre-lated [55]. High collinearity among bioclimatic variables may lead to model overfitting,and thereby overestimate distribution ranges [61,62]. We performed a Pearson correlationtest via the Species Distribution model toolbox v2.5 (SDM toolbox) in ArcMap (ver. 10.8.1)to diagnose multicollinearity. After removing highly correlated variables (i.e., Pearsoncorrelation coefficient ≥ 0.90), we selected 12 bioclimatic variables (bio1–10, bio15, andbio17) to develop ENMs.
For the future species distribution model, we used the bioclimatic variables for the year2050 (the midpoint for the 2041–2060 period) based on two different climate projections,namely Geophysical Fluid Dynamics Laboratory climate model version 3 (GFDL-CM3) [63]developed by the National Oceanic and Atmospheric Administration and the NorwegianEarth System Model 1-medium resolution (NorESM1-M) [64,65] developed by the NorwegianClimate Center [66]. The 12 bioclimatic variables we used for modeling current distributionwere also used for the future ENMs (Table 2 andTable 3). Both GFDL-CM3 and NorESM1-M best captured the mean precipitation and mean temperature observed in the Indiansubcontinent, thus suitable for forecasting climate projections in Sri Lanka [67,68]. Landcover and elevation were retained as additional predictor variables for future ENMs as well.
Table 2. Estimates of percent contribution (PC) and permutation importance (PI) of bioclimatic andenvironmental predictor variables of the MaxEnt habitat suitability modeling for the current andfuture (2050) distribution based on GFDL-CM3 and NorESM1-M of Kerivoula picta in Sri Lanka.
VariableCurrent GFDL-CM3 NorESM1-M
PC PI PC PI PC PI
bio1 0.2 0 0.2 1.5 2.4 3.5bio2 5.3 1.7 0.2 0 5 3.7bio3 2.8 4.4 1.4 2.1 1.1 1.3bio4 39.6 17.3 36.5 20.7 30.1 19.9bio5 3.3 0.7 8.7 7.2 7.2 5.3bio6 2.6 16.2 0.6 0.7 0.1 0.1bio7 1.9 0.2 4.1 9.1 0.8 1.2bio8 0.2 0.3 2.2 7 0.7 0.6bio9 0 0 1.6 5.7 0 0bio10 0.1 0.5 8.3 7.1 0.4 0.2bio15 9.5 16.8 5.9 5.6 21.8 23.6bio17 9 7.7 18.5 8.3 19.9 20.4
land-use 18.8 14.4 5.6 6.5 4.4 5elevation 6.7 19.9 6.3 18.6 6.1 15.4

Diversity 2022, 14, 506 8 of 21
Table 3. Top three variable contributors based on percent contribution (PC), permutational importance(PI) and jackknifing (JK) to the Maxent models for current and future ecological niche models basedon GFDL-CM3 and NorESM1-M.
SpeciesCurrent GFDL-CM3 NorESM1-M
PC PI JK PC PI JK PC PI JK
K. pictabio4 elevation bio4 bio4 bio4 bio15 bio4 bio15 bio15
land use bio4 bio15 bio17 elevation bio4 bio15 bio17 bio4bio15 bio15 bio17 bio5 bio7 bio17 bio17 bio4 bio17
K. malpasibio15 bio15 bio15 bio15 bio15 bio15 bio15 bio15 bio15bio2 bio2 bio9 bio2 bio2 bio17 bio2 bio2 bio2
land use land use bio2 bio17 bio9 bio2 land use bio9 elevation
The Intergovernmental Panel on Climate Change (IPCC) Fifth Assessment Reportsets climate projections based on variable greenhouse gas (GHG) concentrations followingfour Representative Concentration Pathways (RCPs) [69]. Each RCP defines variable heatenergy generated (Wm−2) via radiative forcing due to GHGs. We selected RCP 8.5, whichfollows the highest possible radiative forcing by GHGs for 2100 expected due to highpopulation growth and a lower rate of technology development (worst-case climate changescenario). The monthly values for these climatic variables were averaged over 20-yeartimeframes (2021–2040, 2041–2060, 2061–2080, 2081–2100) [70,71]. For this study, weselected averaged climatic projection data for 2041–2060.
According to the National Physical planning policy of Sri Lanka, numerous major land-cover transformations (new expressways, an east–west economic corridor, and several largemetropolitan regions) are expected by 2050. Therefore, to model the future distribution, wesimulated land-cover change for Sri Lanka for the year 2050 following the National PhysicalPlan, as described below [72]. First, we converted the CGLC raster dataset into a vectorformat and then edited the CGLC layer to incorporate both the east–west economic corridor(that links southwest to northeastern coasts) and five metropolitan regions (located in thenorthern, southeastern, south central, and southwestern coastal Sri Lanka) by manuallydigitizing these new land uses. Next, we classified both the economic corridor and themetropolitan areas as built-up land surfaces. These edits increased the urban areas in SriLanka by 31%. We assumed the rest of the land areas in Sri Lanka to remain unchanged.
2.5. Model Building and Evaluation
MaxEnt combines species-presence point data with spatially referenced, grid-scaleenvironmental variables, where species presence is confirmed to estimate the suitability ofspecific areas for the species of interest. Then, utilizing a machine-learning approach, theMaxEnt model assesses how similar the environmental conditions (i.e., climate, elevation,land-use) of other regions are to the environments required by the focal species on acontinuous scale from 0 to 1 (most dissimilar to most similar, respectively). The latter isa proxy of habitat suitability for a defined spatial extent with regard to the focal species(0: unsuitable, 1: optimal) [20,67,68,73]. However, the estimation of species suitability maybe reduced if sampling is incomplete across the landscape [74].
For each species, we constructed the models under current and future climatic scenar-ios with 15 replicates, 500 iterations, and 10,000 background points while using defaultMaxEnt settings [75]. Species occurrence information was divided into training (75% of totaloccurrence records) and test sets (25% of total occurrence records) for model calibration [76].To evaluate the predictive performance of the model, we calculated the maximum true skillstatistics (TSS) [77] of presence–absence by the predicted values in addition to the AUC (areaunder the receiver operating characteristic curve). MaxEnt model prediction performancewas assessed using the AUC, TSS, sensitivity, specificity, and overall accuracy. Spatiallyexplicit predictions (such as ENMs) are liable to omission (false negatives, omitting knowndistributional areas from the predicted distribution) and commission errors (false positives,

Diversity 2022, 14, 506 9 of 21
including unsuitable areas into the predicted distribution) [78]. The True Skill Statistic (TSS)evaluates the predictive accuracy of an ENM and calculates the sensitivity + specificity − 1,which ranges from −1 to +1. MaxEnt automatically generates background predictions frombackground points (i.e., pseudoabsences), and sample predictions from species occurrence.We used the 10th percentile training presence logistic threshold (i.e., 0.344 for K. picta and0.489 for K. malpasi) to calculate the overall accuracy, sensitivity, specificity, and TSS, usingthe logistic suitability outputs to evaluate the predictive performance of the MaxEnt model.Overall accuracy is the rate of correctly classified pixels. Sensitivity is the probability thatthe ENM correctly classifies a presence. Specificity is the probability that the ENM correctlyclassifies an absence.
We used two default metrics provided by MaxEnt percent contribution, permutationimportance, and a Jackknife test to determine the importance of environmental variables inthe final model [20]. Percent contribution was calculated by MaxEnt during model training.The permutation importance of each variable was computed by randomly permutatingeach predictor variable during model training. Through MaxEnt’s built-in Jackknife test(suitable for small sample (4–23 presence points) sample sizes) [50], each environmentalvariable was sequentially dropped, the remaining variables were refitted, and the modelgain was computed to estimate the contributions from the dropped variable to the modelfitting [79]. Finally, the model gains in each step were compared to determine the relativeimportance of each variable.
The MaxEnt output maps were exported to ArcMap 10.8.1 for subsequent processing.Habitat suitability on the predicted map was binned into four intervals based on probabilityvalues [80]: unsuitable 0–0.2, less suitable 0.2–0.4, moderately suitable 0.4–0.6, and highlysuitable 0.6–1.0. These habitat-suitability categories were adopted from MaxEnt-derivedhabitat classifications [81,82].
2.6. Extent of Occurrence and Area of Occupancy
We used the Geospatial Conservation Assessment Tool (GeoCAT—http://geocat.kew.org/ (accessed on 5 February 2022)) [83] to calculate the EOO and AOO, thereby assessingthe IUCN status of the focal species (May 2021). GeoCAT is a web-based, open-sourceapplication that determines the IUCN Red List status by plotting georeferenced speciespresence data on the Google Maps interphase, and therefrom calculates both EOO andAOO following IUCN Red List categories and criteria [84].
We obtained the current EOO by calculating the area contained by the minimum bound-ing geometry of the convex hull drawn encircling all georeferenced points. We calculated thecurrent AOO by summation of 1 km2 grids within the species-present localities. In addition,using GeoCAT (an open-source geospatial conservation assessment tool), we calculated bothAOO and EOO from ENM generated current and future distribution maps for the highhabitat suitability (with >60% probability of species presence) class. Herein, we reclassifiedthe high suitability class as category 1 and all other classes as no data. Next, we convertedthe raster to points, generated a CSV file for highly suitable localities, and imported the CSVfile into GeoCAT to compute both EOO and AOO (within a 1 km square grid).
3. Results3.1. Habitat Suitability Modeling3.1.1. Evaluation of the Model and Analysis of Variable Contribution
The model accuracy for K. picta can be considered “good”, since the average trainingAUC values were 0.714 ± 0.012, 0.755 ± 0.001 and 0.751 ± 0.009 for the current andfuture distributions, respectively. Models for K. malpasi showed a high accuracy, withaverage AUC values for current and future distributions being 0.937 ± 0.019, 0.938 ± 0.019and 0.953 ± 0.023 for the current and future distributions, respectively (Table S1). Thesevalues indicated that the distribution patterns characterized by the selected bioclimatic andenvironmental variables are highly satisfactory. The overall accuracy for K. picta rangedfrom 0.5 to 0.6, while K. malpasi ranged from 0.9 to 1.0 for the current and future predictions,

Diversity 2022, 14, 506 10 of 21
respectively. The TSS values for both species are under the threshold of 0.20–0.40 andslightly variable among current and future predictions.
3.1.2. Variables of Importance for Kerivoula picta
MaxEnt model projections based on percent contribution indicated that temperatureseasonality (bio4) was the most important predictor, followed by land-use, precipitationseasonality (bio15) and precipitation of the driest quarter (bio17) (Table 2). For the GFDL-CM3 future scenario, temperature seasonality (bio4) best explained the future distribution,followed by precipitation of the driest quarter (bio17) and maximum temperature ofwarmest month (bio5) (Table 2). Based on the NorESM1-M future scenario, temperatureseasonality (bio4), precipitation seasonality (bio15) and precipitation of the driest quarter(bio17) contributed to explain the future distribution (Table 2).
When permutation importance was considered, elevation had the highest impact onthe current distribution, followed by temperature seasonality (bio4), precipitation seasonal-ity (bio15) and minimum temperature of the coldest month (bio6). Temperature seasonality(bio4), elevation and annual temperature range (bio7) showed a higher permutation im-portance for the GFDL-CM3-based future distribution (Table 2). The future distributionmodeled from the NorESM1-M dataset identified precipitation seasonality (bio15), precipi-tation of the driest quarter (bio17), temperature seasonality (bio4) and elevation as variableswith relatively high contributions (Table 2).
The Jackknife test that assessed the relative contributions of the predictor variablesfor modeling the current distribution showed temperature seasonality (bio4), precipitationseasonality (bio15) and precipitation of the driest quarter (bio17) with the highest gains,whereas precipitation seasonality (bio15), temperature seasonality (bio4) and precipitationof the driest quarter (bio17) showed the highest contributions when modeling the futuredistribution for both GFDL-CM3 and NorESM1-M datasets (Table 3; Figure S1).
3.1.3. Variables of Importance for Kerivoula malpasi
Concerning the percent contribution to model the current distribution, precipitationseasonality (bio15) was the most important predictor, followed by annual mean diurnalrange (bio2) (Table 3). In the future distribution model based on GFDL-CM3 dataset,precipitation seasonality (bio15), annual mean diurnal range (bio2), precipitation of thedriest quarter (bio17) and land-use emerged as the variables with the greatest contributions(Table 3). For the NorESM1-M dataset, precipitation seasonality (bio15), annual meandiurnal range (bio2) and land-use had the highest contributions (Table 4).
Table 4. Estimates of percent contribution (PC) and permutation importance (PI) of bioclimatic andenvironmental predictor variables of the MaxEnt habitat suitability modeling for the current andfuture (2050) distribution based on GFDL-CM3 and NorESM1-M of Kerivoula malpasi in Sri Lanka.
VariableCurrent GFDL-CM3 NorESM1-M
PC PI PC PI PC PI
bio1 0 0 0 0 0 0bio2 31.3 35.3 32.1 32 28 28bio3 0 0.4 0 0 0 0bio4 0.1 0 0.3 3.3 0 0.1bio5 0 0 2 0 1.4 0.4bio6 0 0 0 0 0 0bio7 0.2 0 0 0 0 0bio8 0 0 0 0 0 0bio9 0 0 0.9 7 0.2 4.1bio10 0 0 0.6 0 0.3 0bio15 63.6 46.6 40.7 57.6 51.6 67.4bio17 0 0 15 0.1 8.2 0
land-use 3 15.5 8.5 0 9.8 0elevation 1.8 2.2 0 0 0.4 0
Diversity 2022, 14, 506 11 of 21
Based on permutation importance, precipitation seasonality (bio15), annual meandiurnal range (bio2) and land-use ranked highest in the current distribution model (Table 3).Under future scenarios based on GFDL-CM3 dataset, precipitation seasonality (bio15),annual mean diurnal range (bio2) and mean temperature of driest quarter (bio9) had thehighest permutation importance (Table 3). Based on NorESM1-M dataset, precipitationseasonality (bio15) and annual mean diurnal range (bio2) ranked the highest in terms ofthe greatest permutational importance (Table 4).
The variables with highest gain for modeling the current distribution as revealed bythe Jackknife tests were precipitation seasonality (bio15), mean temperature of the driestquarter (bio9) and annual mean diurnal range (bio2). Precipitation seasonality (bio15),precipitation of the driest quarter (bio17) and annual mean diurnal range (bio2) showedthe most gains in the future distribution model when the GFDL-CM3 dataset was used,while precipitation seasonality (bio15), annual mean diurnal range (bio2) and elevationhad the highest gains when the NorESM1-M dataset was used (Table 3, Figure S2).
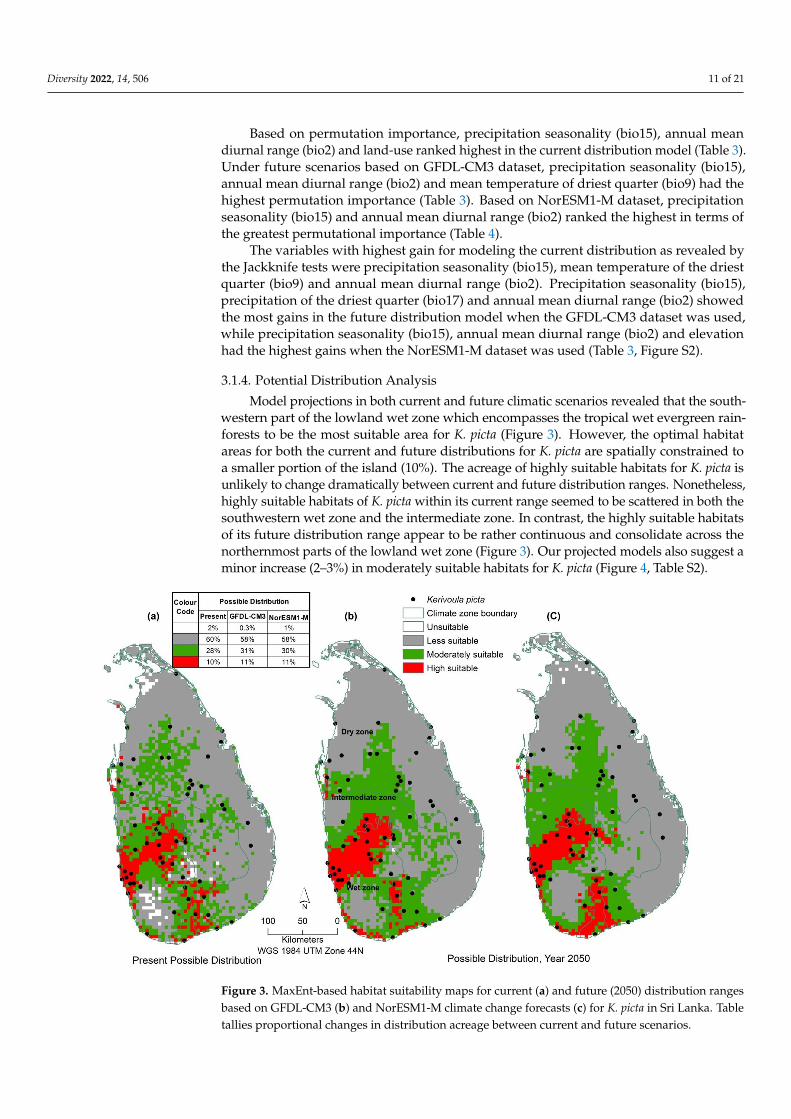
3.1.4. Potential Distribution Analysis
Model projections in both current and future climatic scenarios revealed that the south-western part of the lowland wet zone which encompasses the tropical wet evergreen rain-forests to be the most suitable area for K. picta (Figure 3). However, the optimal habitatareas for both the current and future distributions for K. picta are spatially constrained toa smaller portion of the island (10%). The acreage of highly suitable habitats for K. picta isunlikely to change dramatically between current and future distribution ranges. Nonetheless,highly suitable habitats of K. picta within its current range seemed to be scattered in both thesouthwestern wet zone and the intermediate zone. In contrast, the highly suitable habitatsof its future distribution range appear to be rather continuous and consolidate across thenorthernmost parts of the lowland wet zone (Figure 3). Our projected models also suggest aminor increase (2–3%) in moderately suitable habitats for K. picta (Figure 4, Table S2).
Diversity 2022, 14, x FOR PEER REVIEW 12 of 22
the most gains in the future distribution model when the GFDL-CM3 dataset was used,
while precipitation seasonality (bio15), annual mean diurnal range (bio2) and elevation
had the highest gains when the NorESM1-M dataset was used (Table 3, Figure S2).
3.1.4. Potential Distribution Analysis
Model projections in both current and future climatic scenarios revealed that the
southwestern part of the lowland wet zone which encompasses the tropical wet ever-
green rainforests to be the most suitable area for K. picta (Figure 3). However, the optimal
habitat areas for both the current and future distributions for K. picta are spatially con-
strained to a smaller portion of the island (10%). The acreage of highly suitable habitats
for K. picta is unlikely to change dramatically between current and future distribution
ranges. Nonetheless, highly suitable habitats of K. picta within its current range seemed to
be scattered in both the southwestern wet zone and the intermediate zone. In contrast,
the highly suitable habitats of its future distribution range appear to be rather continuous
and consolidate across the northernmost parts of the lowland wet zone (Figure 3). Our
projected models also suggest a minor increase (2–3%) in moderately suitable habitats for
K. picta (Figure 4, Table S2).
Figure 3. MaxEnt-based habitat suitability maps for current (a) and future (2050) distribution
ranges based on GFDL-CM3 (b) and NorESM1-M climate change forecasts (c) for K. picta in Sri
Lanka. Table tallies proportional changes in distribution acreage between current and future sce-
narios.
Both current and future predictions exhibit highly suitable areas for K. malpasi
within wet as well as intermediate bioclimatic zones (Figure 4, Table S2). Our models did
not detect any dramatic changes in either the highly or moderately suitable habitats be-
tween the current and future distribution ranges of K. malpasi (Figure 4, Table S2).
Figure 3. MaxEnt-based habitat suitability maps for current (a) and future (2050) distribution rangesbased on GFDL-CM3 (b) and NorESM1-M climate change forecasts (c) for K. picta in Sri Lanka. Tabletallies proportional changes in distribution acreage between current and future scenarios.

Diversity 2022, 14, 506 12 of 21
Diversity 2022, 14, x FOR PEER REVIEW 13 of 22
However, the highly suitable habitats of K. malpasi in its future distribution appeared to
be fragmented, with considerable differences in the spatial and geographic configuration
compared to the current distribution. The habitat area with the greatest suitability for K.
malpasi is a single contiguous range across the wet and intermediate zones in its current
range. In forecasted ranges, a substantial degree of fragmentation (i.e., the number of
fragments) is evident among its highly suitable habitats. Sri Lanka’s dry zone appeared
to be unsuitable for K. malpasi in both the current and forecasted distributions.
Figure 4. MaxEnt-based habitat suitability maps for current (a) and future (2050) distribution
ranges based on GFDL-CM3 (b) and NorESM1-M climate change forecasts (c) for K. malpasi in Sri
Lanka. Table tallies proportional changes in distribution acreage between current and future sce-
narios.
3.2. AOO and EOO
Based on georeferenced locations of K. picta, the AOO and EOO were 62 km2 and
55,374 km2 (0.09% and 84.4% of overall land acreage of Sri Lanka, Table 5), respectively.
According to our ENMs for the current scenario, the AOO and EOO (when areas with
>60% probability of occupancy were considered) were 291 km2 and 31,580 km2 (0.44%
and 48.13% of overall land area), respectively. The AOO for both future models (324 km2,
348 km2) will remain approximately the same as the current AOO, while the EOO (19,339
km2, 21,908 km2) is predicted to incur a modest decline. The AOO and EOO calculated
from georeferenced records for K. malpasi were 5 km2 and 5340 km2 (0.01% and 8.08% of
overall area), respectively, while the equivalent, ENM-derived figures for the current
scenario were 91 km2 and 3266 km2; (0.14% and 5% of total land area), respectively. Both
the AOO and EOO of K. malpasi in Sri Lanka are expected to undergo little to no change
in response to future climate scenarios.
Figure 4. MaxEnt-based habitat suitability maps for current (a) and future (2050) distribution rangesbased on GFDL-CM3 (b) and NorESM1-M climate change forecasts (c) for K. malpasi in Sri Lanka.Table tallies proportional changes in distribution acreage between current and future scenarios.
Both current and future predictions exhibit highly suitable areas for K. malpasi withinwet as well as intermediate bioclimatic zones (Figure 4, Table S2). Our models did notdetect any dramatic changes in either the highly or moderately suitable habitats betweenthe current and future distribution ranges of K. malpasi (Figure 4, Table S2). However, thehighly suitable habitats of K. malpasi in its future distribution appeared to be fragmented,with considerable differences in the spatial and geographic configuration compared to thecurrent distribution. The habitat area with the greatest suitability for K. malpasi is a singlecontiguous range across the wet and intermediate zones in its current range. In forecastedranges, a substantial degree of fragmentation (i.e., the number of fragments) is evidentamong its highly suitable habitats. Sri Lanka’s dry zone appeared to be unsuitable forK. malpasi in both the current and forecasted distributions.
3.2. AOO and EOO
Based on georeferenced locations of K. picta, the AOO and EOO were 62 km2 and55,374 km2 (0.09% and 84.4% of overall land acreage of Sri Lanka, Table 5), respectively.According to our ENMs for the current scenario, the AOO and EOO (when areas with>60% probability of occupancy were considered) were 291 km2 and 31,580 km2 (0.44% and48.13% of overall land area), respectively. The AOO for both future models (324 km2, 348 km2)will remain approximately the same as the current AOO, while the EOO (19,339 km2,21,908 km2) is predicted to incur a modest decline. The AOO and EOO calculated fromgeoreferenced records for K. malpasi were 5 km2 and 5340 km2 (0.01% and 8.08% of overallarea), respectively, while the equivalent, ENM-derived figures for the current scenario were91 km2 and 3266 km2; (0.14% and 5% of total land area), respectively. Both the AOO andEOO of K. malpasi in Sri Lanka are expected to undergo little to no change in response tofuture climate scenarios.

Diversity 2022, 14, 506 13 of 21
Table 5. The extent of occurrence (EOO) and area of occupancy (AOO) of K. picta and K. malpasi inboth current and future distribution scenarios as predicted by the ENMs in comparison with thesame metrics calculated by the georeferenced points following IUCN criteria.
Model Distribution Range MetricsSpecies
K. picta K. malpasi
Without ENMsEOO 55,374 (84.40) 5340 (8.14)AOO 62 (0.09) 5 (0.01)
CurrentEOO 31,580 (48.13) 3266 (5.00)AOO 291 (0.44) 91 (0.14)
GFDL-CM3EOO 19,339 (29.48) 4420(6.74)AOO 324 (0.49) 96 (0.14)
NorESM1-MEOO 21,908 (33.39) 4035 (6.15)AOO 348 (0.53) 123 (0.19)
4. Discussion
The ENMs offer effective tools to understand how environmental variables affectdistribution and their response to climate change [18,85,86]. MaxEnt based ENMs areparticularly effective at predicting geographic ranges from minimal presence only groundreferenced data [49], and hence are applicable to map distribution of range restrictedspecies that are challenging to document via field surveys (such as bats). Despite animpressive increase in ENM based studies to map species geographic ranges, bat-focusedENM applications are infrequent in the Indo-Malayan realm [85]. MaxEnt ENMs usebioclimatic, topographic, and land cover variables that influence species physiologicaloptima, their life histories and habitat associations, thus construct the Grinnellian nichebased on abiotic habitat requirements [87,88] to map species distribution across broaderspatial scales [14]. Our study mapped the island-wide geographic range of two bat specieswhose distribution is fundamentally governed by biophysical environmental conditions;thus, MaxEnt provides the most prudent approach. Bats are relatively vagile with highdispersal abilities, and thus less impeded by physical barriers to access suitable habitats.Therefore, abiotic features are a reliable proxy of their habitat occupancy [85,89]. Althoughbiotic features (e.g., insect abundance, disease prevalence) are critical determinants of batoccupancy, physical habitat structure is a proxy for food availability and forage quality [90].Therefore, modeling species distribution based on the Grinnellian-niche concept is bothecologically sound and computationally feasible.
The spatially weighted probability of species occurrence pictured in the ENM gener-ated maps identify high quality habitats, which is useful for conservation planning [91,92].Our models revealed that, despite the broader spatial distribution, the most optimal habitatsfor K. picta are restricted to parts of the southwestern lowlands. Neither the wide-rangingK. picta nor the narrow ranging K. malpasi showed tangible changes in the extent of theiroptimal habitats due to forecasted climate change. Yet, the spatial configuration of optimalhabitats for both species showed remarkable shifts. Optimal habitats for K. malpasi becamefragmented while those of K. picta became rather consolidated in the lowland wet zone.While fragmentation is less likely to impede bat navigation, fragmented habitats maydeteriorate in quality and resource availability due to edge effects [93], become increasinglyvulnerable to subsidized predation, and less resilient to disturbances as well as climatechange [94–98]. Although conventional protected areas have static boundaries, our studyrevealed that the spatial configuration of and connectivity among habitats are likely tochange in response to climate change. Therefore, future conservation planning (i.e., de-marcation of protected areas and landscape-scale corridors) should consider the spatiallyand temporally dynamic nature of suitable habitats (i.e., distribution range shifts) [99,100].The habitats with a high probability of occupancy in future scenarios should be consideredclimate refugia and protected as core habitats to ensure population persistence. The mod-

Diversity 2022, 14, 506 14 of 21
erately suitable habitats surrounding the highly suitable habitats should be managed asbuffer zones.
In Sri Lanka, K. picta is found primarily across the low country and ranges up to thecentral hills (1372 m a.s.l) [3,37,45,48]. The species has been mainly documented in tropicaldry–mixed and lowland wet evergreen forests [3,37,45], and our model predictions for thecurrent range agrees with previous observations. The wide geographic range of K. pictapredicted by our ENM is not surprising given its associations with a range of roostingsites (dried and dead leaves, flower clusters) located in different vegetation communities(primary and secondary forests, home gardens, forest plantations) [10,101,102]. Our modelpredictions on K. malpasi indicates its preference to higher altitudes (>2100 m a.s.l) char-acterized by low annual temperatures and high precipitation; these model predictionsagree with the current consensus on its distribution range being limited to the centralhighlands [3,37,40]. K. malpasi has been reported in both natural and manmade ecosystems,such as dry–mixed evergreen forests, tropical montane forests, paddy fields, home gardens,and banana plantations [3,37,40]. Restricted distribution of K. malpasi to higher elevationsis likely due to its lower physiological thermal tolerance.
Temperature seasonality (bio4) and precipitation seasonality (bio15) emerged as themost critical predictors of the current distribution of K. picta across all variable selectionmethods. Precipitation seasonality (bio15) and annual mean diurnal range (bio2) was themost important predictor to map the current distribution of K. malpasi, regardless of thevariable selection method. The communality of precipitation seasonality (bio15) highlightsthe role of temporal variations in precipitation in defining the fundamental niche of bothbat species. Between-species differences in the environmental drivers may suggest at leastpartial niche separation between species. Neither field observations nor ENM outputssuggest the presence of either bat species in the arid zone of Sri Lanka. Reduced access towater and other critical resources, increased risk of dehydration, and prolonged droughtscan drastically limit these species in the arid zone.
The importance of bioclimatic variables as critical drivers governing the species dis-tribution of bats and other mammals [103] have been well established. These bioclimaticpredictors can override the effects of land-use and land-cover or topography. For instance,summer precipitation, maximum winter temperature, and annual precipitation had thegreatest contribution in modeling distribution of the Great long-eared bat in the UnitedKingdom [104]. Minimum temperatures set the threshold for bat flight, foraging, naviga-tion, and other metabolic activities [105,106]. Low air temperatures increase the metaboliccosts of euthermic homeostasis and reduces aerial insect activities [107]. Precipitationdictates the insect abundance, which provides critical food resources for bats and has alsobeen linked to reproductive success (i.e., gestation, late fledging of young) and postnatalcare (i.e., lactation) of bats [108].
The future ENMs we developed suggested that the range-restricted species, K. malpasi,to be the most negatively impacted from climate change. The impact of climate change isdisproportionately high in range-restricted, specialist species compared to wide-ranginggeneralists [32]. Geographic vulnerability assessments also identify tropical biomes rich inbiodiversity and endemism to peril the most from climate change [109–112]. For instance,the extent of suitable habitats of 66 neotropical bat species are projected to decline by 2050due to climate change [113]. Major declines in biodiversity due to range constrictionsand extinctions have been projected even under optimistic climate-change scenarios forsoutheastern Asia [114].
Data availability on bat distribution in Sri Lanka through standard publications isscant. Lack of long-term island-wide monitoring further complicates this data deficiency.We strongly encourage field biologists as well as research and academic institutes to publishtheir biodiversity data via online open repositories (e.g., Global Biodiversity InformationFacility) or citizen-science platforms (e.g., iNaturliast) with relevant metadata with propercuration of georeferenced points of bat distribution.

Diversity 2022, 14, 506 15 of 21
Given the absence of evidence for population stability or reliable population assess-ments, on-going anthropogenic threats (e.g., pesticide applications) and uncertain pro-tection outside conservation lands, plus our estimations on their ENM-generated AOOand EOO calculations, the IUCN conservation status for both K. picta and K. malpasi in SriLanka should remain “Near Threatened” and “Critically Endangered”, respectively [34,39].Geographically restricted distribution evident in our ENM maps, and the likelihood offragmentation of highly suitable habitats with climate change, justify the retention of thehighest possible conservation status for K. malpasi. Forecasted fragmentation of most suit-able habitats can further be compounded by changes in natural land-cover in the centralhighlands of Sri Lanka. The Global IUCN Red List of K. malpasi is yet to be assessed [3,34].Since this species is a Sri Lankan endemic, we recommend applying “Critically Endan-gered” as the conservation status to the Global IUCN Red List as well. When assessing batconservation status, we propose that conservation authorities calculate both the AOO orEOO for areas with high probability of species presence (e.g., >60%) based on ENMs inplace of the overall AOO and EOO.
5. Limitations of ENM and Future Work
Future range predictions via MaxEnt ENMs assume no changes in the Grinnellianniche (i.e., abiotic habitat preferences remain the same over time) [85,115], although counterevidence to niche conservatism has frequently appeared in the published literature [116,117].Hence, these future predictions should be used with caution. Accurate distribution mod-elling warrants the inclusion of non-climatic environmental variables, such as species disper-sal ability and distance constrained variables (e.g., distance to built-up environments andfarmlands, proximity to water sources), which can alter the distribution of bats [118–120].Covering multiple threats, especially anthropogenic disturbances and fine-scale land-usemodifications will help harness the maximum predictive power from ENMs since speciesresponses to changing environments can either emerge from or become modified by interac-tions between threats [121,122].
As an oceanic island, the impacts of sea-level rise on future species distributions arenon-trivial. While the negative impacts of sea-level rise on Sri Lanka is well documented,most such adversities impact shorelines and nearshore coastal zones [123]. As environ-ments most vulnerable to sea-level rise in Sri Lanka fall outside the distribution range ofboth focal species [124–126], thus we opted not to include seal-level rise as a predictor.The environmental variables we used in our ENMs were of coarse resolution (~1 km),which is sufficient for broad-scale ENMs. Species responses to environmental conditions,conservation planning, and habitat management actions operate at variable spatial scales,including both fine and broad scales [126]. For instance, foraging-site selection and noc-turnal activities of bats are only evident at fine scales, while ecoregion-wide distributioncan be reliably determined at coarse scales. Therefore, a multiscale approach that combinesboth fine- and broad-scale environmental drivers produces the most reliable ENMs [104].However, developing such complex models require individual-specific behavioral datafrom radio-telemetry studies, as well as high-resolution geospatial data on local-scalehabitat features. Lack of such fine-scale, open-access geospatial data in Sri Lanka precludedus from developing such intricate models.
Low extent of predicted suitability areas and range restrictions of K. malpasi couldbe due to spatial bias resulting from lack of observations [85]. Given small sample size,the fundamental niche of K. malpasi could not be fully characterized in our modelingapproach. Therefore, despite the model validation metrics, our results on K. malpasi must beinterpreted with caution when making conservation decisions. The ENM frameworks basedon abiotic factors and presence-only data are frequently used for ENMs. Nonetheless, theseapproaches do not account for biological drivers of species distribution (e.g., competitors,predators, diseases, symbionts), thus cannot correctly represent species occupancy becausethe resultant models may not approximate the realized niches.

Diversity 2022, 14, 506 16 of 21
6. Conclusions
Our study mapped the distribution and applied ENMs for current and future dis-tribution (the latter based on climate-change scenarios) for two bat species of the genusKerivoula for Sri Lanka. According to our ENMs, highly suitable areas for K. malpasi lie in thecentral highlands, whereas the lowland wet zone provide optimal habitats for K. picta. Weunderscore the need to validate the current distribution we predicted, which necessitateseither active field surveys or the deployment of automated ultrasonic recording devices.Given logistic and financial constraints in field surveys, we propose that these efforts beconcentrated in regions of high habitat suitability.
Although neither of our study species showed dramatic changes in their optimalhabitat extent due to climate change, these species should not be treated as resilient toclimate change without additional observations and more comprehensive modeling ontheir realized niche. Our study provides a blueprint to utilize ENMs for predicting thecurrent and future distribution of bat species. We encourage conservation authorities tofollow our ENM approach to map distribution ranges for bat species, particularly whenfield data is insufficient to establish long-term monitoring focusing on specific sites with ahigh probability of occurrence. Such mapping efforts, together with subsequent monitoring,will help effectively target and prioritize conservation efforts.
Supplementary Materials: The following supporting information can be downloaded at: https://www.mdpi.com/article/10.3390/d14070506/s1, Table S1. AUC values of MaxEnt models under thecurrent and future (2050) scenarios based on GFDL-CM3 and NorESM1-M data sets; Figure S1. Relativepredictive power of different environmental variables based on the Jackknife of regularized traininggain in MaxEnt model for K. picta (a) current (b) for the predicted scenario in the year 2050 based onGFDL-CM3 (c) for the predicted scenario in the year 2050 based on NorESM1-M; Figure S2. Relativepredictive power of different environmental variables based on the Jackknife of regularized traininggain in MaxEnt model for K. malpasi (a) current (b) for the predicted scenario in the year 2050 based onGFDL-CM3 (c) for the predicted scenario in the year 2050 based on NorESM1-M; Table S2. Predictedsuitable areas for Kerivoula picta and Kerivoula malpasi under current and future (Year 2050) scenariosbased on GFDL-CM3 and NorESM1-M (km2) Unsuitable 0–0.2, less suitable 0.2–0.4, moderately suitable0.4–0.6, and highly suitable 0.6–1.0.
Author Contributions: Conceptualization, A.P.M.J.B., G.E., D.G. and M.B.; data curation, A.P.M.J.B.,G.E., D.G. and M.B.; Methodology: A.P.M.J.B. and B.D.M., formal analysis and visualization, B.D.M.;writing—original draft: A.P.M.J.B., B.D.M. and T.D.S. writing—review and editing, A.P.M.J.B., B.D.M.,M.B. and T.D.S. All authors have read and agreed to the published version of the manuscript.
Funding: This research received no external funding.
Institutional Review Board Statement: Not applicable.
Informed Consent Statement: Not applicable.
Data Availability Statement: Not applicable.
Acknowledgments: We are grateful to Suranjan Karunarathne for his efforts in building the researchteam and support rendered to the authors throughout this study. We also thank Sameera Akmeemana,Ranil Nanayakkara, Duminda Dissanayake, and Amila Sumanapala for their personal communicationon occurrence points.
Conflicts of Interest: The authors declare no conflict of interest.
References1. Adams, R.A.; Shaw, J.B. Time’s arrow in the evolutionary development of bat flight. In Bat Evolution, Ecology, and Conservation;
Adams, R.A., Pedersen, S.C., Eds.; Springer: New York, NY, USA, 2013; pp. 21–46.2. Cooper, L.N.; Sears, K.E. How to Grow a Bat Wing. In Bat Evolution, Ecology, and Conservation; Adams, R.A., Pedersen, S.C., Eds.;
Springer: New York, NY, USA, 2013; pp. 3–20.3. Burgin, C.J.; Moratelli, R. Family Vespertilionidae (Vesper bats). In Handbook of the Mammals of the World; Wilson, D.E., Mittermeier,
R.A., Eds.; Lynx Ediciones: Barcelona, Spain, 2019; Volume 9, pp. 716–981.4. Jones, G.; Teeling, E.C. The evolution of echolocation in bats. Trends Ecol. Evol. 2006, 21, 149–156. [CrossRef] [PubMed]
Diversity 2022, 14, 506 17 of 21
5. Freeman, P.W. Macroevolution in Microchiroptera: Recoupling morphology and ecology with phylogeny. Evol. Ecol. Res. 2000,2, 317–335.
6. Teeling, E.C.; Madsen, O.; Van Den Bussche, R.A.; de Jong, W.W.; Stanhope, M.J.; Springer, M.S. Microbat paraphyly and theconvergent evolution of a key innovation in Old World rhinolophoid microbats. Proc. Natl. Acad. Sci. USA 2002, 99, 1431–1436.[CrossRef]
7. Ransome, R.D.; Mcowat, T.P. Birth timing and population changes in greater horseshoe bat colonies (Rhinolophus ferrumequinum)are synchronized by climatic temperature. Zool. J. Linn. Soc. 1994, 112, 337–351. [CrossRef]
8. Fleming, T.H.; Eby, P. Ecology of bat migration. In Bat Ecology; Kunz, T.H., FenTON, M.B., Eds.; University of Chicago Press:Chicago, IL, USA, 2003; pp. 156–208.
9. Jones, G.; Jacobs, D.S.; Kunz, T.H.; Willig, M.R.; Racey, P.A. Carpe noctem: The importance of bats as bioindicators. Endanger.Species Res. 2009, 8, 93–115. [CrossRef]
10. Yapa, W. A Field Guide to the Bats of Sri Lanka; Dilmah Ceylon Tea Company PLC: Colombo, Sri Lanka, 2017; 142p.11. Hodgkison, R.; Balding, S.T.; Zubaid, A.; Kunz, T.H. Fruit bats (Chiroptera: Pteropodidae) as seed dispersers and pollinators in a
lowland Malaysian rain forest1. Biotropica 2003, 35, 491–502. [CrossRef]12. Kunz, T.H.; de Torrez, E.B.; Bauer, D.; Lobova, T.; Fleming, T.H. Ecosystem services provided by bats. Ann. N. Y. Acad. Sci. 2011,
1223, 1–38. [CrossRef]13. Ghanem, S.J.; Voigt, C.C. Chapter 7—Increasing awareness of ecosystem services provided by Bats. In Advances in the Study of
Behavior Advances in the Study of Behavior; Brockmann, H.J., Roper, T.J., Naguib, M., Mitani, J.C., Simmons, L.W., Eds.; AcademicPress: Cambridge, MA, USA, 2012; pp. 279–302.
14. Hirzel, A.H.; Le Lay, G. Habitat suitability modelling and niche theory. J. Appl. Ecol. 2008, 45, 1372–1381. [CrossRef]15. Ramasindrazana, B.; Goodman, S.M.; Schoeman, M.C.; Appleton, B. Identification of cryptic species of Miniopterus bats (Chi-
roptera: Miniopteridae) from Madagascar and the Comoros using bioacoustics overlaid on molecular genetic and morphologicalcharacters. Biol. J. Linn. Soc. 2011, 104, 284–302. [CrossRef]
16. Pijanowski, B.C.; Villanueva-Rivera, L.J.; Dumyahn, S.L.; Farina, A.; Krause, B.L.; Napoletano, B.M.; Gage, S.H.; Pieretti, N.Soundscape ecology: The science of sound in the landscape. Bioscience 2011, 61, 203–216. [CrossRef]
17. Aide, T.M.; Corrada-Bravo, C.; Campos-Cerqueira, M.; Milan, C.; Vega, G.; Alvarez, R. Real-time bioacoustics monitoring andautomated species identification. PeerJ 2013, 1, e103. [CrossRef] [PubMed]
18. Pearson, R.G.; Dawson, T.P. Predicting the impacts of climate change on the distribution of species: Are bioclimate envelopemodels useful? Global Ecol. Biogeogr. 2003, 12, 361–371. [CrossRef]
19. Fielding, A.H.; Haworth, P.F. Testing the generality of bird habitat models. Conserv. Biol. 1995, 9, 1466–1481. [CrossRef]20. Phillips, S.J.; Anderson, R.P.; Schapire, R.E. Maximum entropy modeling of species geographic distributions. Ecol. Model. 2006,
190, 231–259. [CrossRef]21. Soto-Centeno, J.A.; Steadman, D.W. Fossils reject climate change as the cause of extinction of Caribbean bats. Sci. Rep. 2015,
5, 7971. [CrossRef] [PubMed]22. Russ, J.M.; Briffa, M.; Montgomery, W.I. Seasonal patterns in activity and habitat use by bats (Pipistrellus spp. and Nyctalus leisleri)
in Northern Ireland, determined using a driven transect. J. Zool. 2003, 259, 289–299. [CrossRef]23. Vasko, V.; Blomberg, A.S.; Vesterinen, E.J.; Suominen, K.M.; Ruokolainen, L.; Brommer, J.E.; Norrdahl, K.; Niemelä, P.; Laine, V.N.;
Selonen, V.; et al. Within-season changes in habitat use of forest-dwelling boreal bats. Ecol. Evol. 2020, 10, 4164–4174. [CrossRef]24. Wang, J.W.; Gao, W.G.; Wang, L.W.; Metzner, W.M.; Ma, J.M.; Feng, J.F. Seasonal variation in prey abundance influences habitat
use by greater horseshoe bats (Rhinolophus ferrumequinum) in a temperate deciduous forest. Can. J. Zool. 2010, 88, 315–323.[CrossRef]
25. Stawski, C.; Willis, C.; Geiser, F. The importance of temporal heterothermy in bats. J. Zool. 2014, 292, 86–100. [CrossRef]26. Hettiarachchi, C.J.; Gamage, S.N.; Marikar, F.M.; Mahanayakage, C.A.; Padmalal, U.K.; Kotagama, S.W. Habitat suitability model
for the montane slender loris in the Hakgala strict nature reserve, Sri Lanka. Asian Primates J. 2018, 7, 2018.27. Kariyawasam, C.S.; Kumar, L.; Ratnayake, S.S. Invasive plant species establishment and range dynamics in Sri Lanka under
climate change. Entropy 2019, 21, 571. [CrossRef]28. Ukuwela, K.D.; Bandara, I.N.; De Zoysa, H.; Rupasinghe, U.D.; Vandercone, R.P. New localities, distribution and habitat modeling
of the critically endangered Sri Lankan frog Nannophrys marmorata. Russ. J. Herpetol. 2020, 27, 33–40. [CrossRef]29. Frick, W.F.; Kingston, T.; Flanders, J. A review of the major threats and challenges to global bat conservation. Ann. N. Y. Acad. Sci.
2020, 1469, 5–25. [CrossRef] [PubMed]30. Lovegrove, B.G.; Canale, C.; Levesque, D.; Fluch, G.; Reháková-Petru, M.; Ruf, T. Are tropical small mammals physiologically
vulnerable to arrhenius effects and climate change? Physiol. Biochem. Zool. 2014, 87, 30–45. [CrossRef] [PubMed]31. Knutson, T.R.; McBride, J.L.; Chan, J.; Emanuel, K.; Holland, G.; Landsea, C.; Held, I.; Kossin, J.P.; Srivastava, A.; Sugi, M. Tropical
cyclones and climate change. Nat. Geosci. 2010, 3, 157–163. [CrossRef]32. Parmesan, C. Ecological and evolutionary responses to recent climate change. Annu. Rev. Ecol. Evol. Syst. 2006, 37, 637–669.
[CrossRef]33. Walther, G.R.; Post, E.; Convey, P.; Menzel, A.; Parmesan, C.; Beebee, T.J.C.; Fromentin, J.M.; Hoegh-Guldberg, O.; Bairlein, F.
Ecological responses to recent climate change. Nature 2002, 416, 389–395. [CrossRef]

Diversity 2022, 14, 506 18 of 21
34. MOE (Ministry of Environment). The National Red List 2012 of Sri Lanka; Conservation Status of the Fauna and Flora; Ministry ofEnvironment: Colombo, Sri Lanka, 2012; pp. viii + 476. Available online: http://www.cea.lk/web/images/pdf/redlist2012.pdf(accessed on 14 August 2021).
35. Kingston, T.; Francis, C.M.; Akbar, Z.; Kunz, T.H. Species richness in an insectivorous bat assemblage from Malaysia. J. Trop. Ecol.2003, 19, 67–79. [CrossRef]
36. Yapa, W.B.; Ratnasooriya, W.D. Ecology and Biology of Sri Lankan Bats; A Report Submitted to National Science Foundation;University of Colombo: Colombo, Sri Lanka, 2012; 28p.
37. Yapa, A.; Ratnavira, G. The Mammals of Sri Lanka; Field Ornithology Group of Sri Lanka, Department of Zoology, University ofColombo: Colombo, Sri Lanka, 2013; 1009p.
38. Kotagama, S.; Goonatilake, S.A. Pictorial Pocket Guide to the Mammals of SriLanka (Revised & Expanded Edition 2019); FieldOrnithology Group of Sri Lanka: Colombo, Sri Lanka, 2019; 66p.
39. The IUCN Red List of Threatened Species 2020, e.T10985A22022952. Available online: https://doi.org/10.2305/IUCN.UK.20202.RLTS.T10985A22022952.en (accessed on 18 July 2021).
40. Gabadage, D.; Edirisinghe, G.; Botejue, M.; Perera, K.; Surasinghe, T.; Karunarathna, S. A new record of the rare Hardwicke’sWoolly Bat Kerivoula hardwickii (Horsefield, 1824) (Mammalia: Chiroptera: Vespertilionidae) after 23 years from a lowlandrainforest of Sri Lanka. J. Threat. Taxa 2018, 10, 12344–12349. [CrossRef]
41. Phillips, W.W.A. Additional to the fauna of Ceylon—Part II. Some new and interesting bats from the hills of the Central Province.Spolia Zeylan. 1932, 16, 331–332.
42. Phillips, W.W.A. Manual of the Mammals of Ceylon; Dulau & Company Ltd.: London, UK, 1935; pp. 130–133.43. Phillips, W.W.A. Manual of the Mammals of Sri Lanka—Part 1, 2nd ed.; Wildlife and Nature Protection Society of Sri Lanka:
Colombo, Sri Lanka, 1980; pp. 93–96.44. Molur, S.; Marimuthu, G.; Srinivasulu, C.; Mistry, S.; Hutson, A.M.; Bates, P.J.J.; Walker, S.; Padmapriya, K.; Binupriya,
A.R. Status of South Asian Chiroptera. Conservation Assessment and Management Plan (C.A.M.P.) Workshop Report; Zoo OutreachOrganization/CBSG-South Asia: Coimbatore, India, 2002; pp. 101–105.
45. Edirisinghe, G.; Surasinghe, T.; Gabadage, D.; Botejue, M.; Perera, K.; Madawala, M.; Weerakoon, D.; Karunarathna, S. Chiropterandiversity in the peripheral areas of the Maduru-Oya National Park in Sri Lanka: Insights for conservation and management.Zookeys 2018, 12, 139–162. [CrossRef] [PubMed]
46. Kelaart, E.F. Prodromus Faunae Zeylanicae; WHT Publications (Private) Limited: Colombo, Sri Lanka, 1998; pp. 24–26.47. Bates, P.J.J.; Harrison, D.L. Bats of the Indian Subcontinent; Harrison Zoological Museum: Sevenoaks, Kent, UK, 1997; pp. 212–215.48. GBIF. Free and Open Access to Biodiversity Data. Available online: https://www.gbif.org (accessed on 13 July 2021).49. Hernandez, P.A.; Graham, C.H.; Master, L.L.; Albert, D.L. The effect of sample size and species characteristics on performance of
different species distribution modeling methods. Ecography 2006, 29, 773–785. [CrossRef]50. Pearson, R.G.; Raxworthy, C.J.; Nakamura, M.; Townsend, P.A. Predicting species distributions from small numbers of occurrence
records: A test case using cryptic geckos in Madagascar. J. Biogeogr. 2007, 34, 102–117. [CrossRef]51. Russo, D.; Di Febbraro, M.; Cistrone, L.; Jones, G.; Smeraldo, S.; Garonna, A.; Bosso, L. Protecting one, protecting both? Scale-
dependent ecological differences in two species using dead trees, the rosalia longicorn beetle and the barbastelle bat. J. Zool. 2015,297, 165–175. [CrossRef]
52. Buchhorn, M.; Smets, B.; Bertels, L.; De Roo, B.; Lesiv, M.; Tsendbazar, N.E.; Linlin, L.; Tarko, A. Copernicus Global Land Service:Land Cover 100m: Version 3 Globe 2015–2019: Product User Manual; Zenodo: Geneva, Switzerland, 2020. [CrossRef]
53. Buchhorn, M.; Lesiv, M.; Tsendbazar, N.-E.; Herold, M.; Bertels, L.; Smets, B. Copernicus Global Land Cover Layers—Collection 2.Remote Sens. 2020, 12, 1044. [CrossRef]
54. Tsendbazar, N.M.; Herold, L.; Li, A.; Tarko, S.; de Bruin, D.; Masiliunas, M.; Lesiv, S.; Fritz, M.; Buchhorn, B.; Smets, R.; et al.Towards operational validation of annual global land cover maps. Remote Sens. Environ. 2021, 266, 112686. [CrossRef]
55. Hijmans, R.J.; Cameron, S.E.; Parra, J.L.; Jones, P.G.; Jarvis, A. Very high re-solution interpolated climate surfaces for global landareas. Int. J. Climatol. 2005, 25, 1965e1978. [CrossRef]
56. Fick, S.E.; Hijmans, R.J. WorldClim 2: New 1-km spatial resolution climate surfaces for global land areas. Int. J. Climatol. 2017,37, 4302–4315. [CrossRef]
57. Jarvis, A.; Reuter, H.I.; Nelson, A.; Guevara, E. Hole-Filled Seamless SRTM Data V4, International Centre for Tropical Agriculture.2008. Available online: http://srtm.csi.cgiar.org (accessed on 1 February 2022).
58. Reuter, H.I.; Nelson, A.; Jarvis, A. An evaluation of void-filling interpolation methods for SRTM data. Int. J. Geogra. Inf. Sci. 2007,21, 983–1008. [CrossRef]
59. Ashoori, A.; Kafash, A.; Varasteh Moradi, H.; Yousefi, M.; Kamyab, H.; Behdarvand, N.; Mohammadi, S. Habitat modeling ofthe common pheasant Phasianuscolchicus (Galliformes: Phasianidae) in a highly modified landscape: Application of speciesdistribution models in the study of a poorly documented bird in Iran. Eur. Zool. J. 2018, 85, 372–380. [CrossRef]
60. Fois, M.; Bacchetta, G.; Cuena-Lombraña, A.; Cogoni, D.; Pinna, M.; Sulis, E.; Fenu, G. Using extinctions in species distributionmodels to evaluate and predict threats: A contribution to plant conservation planning on the island of Sardinia. Environ. Conserv.2018, 45, 11–19. [CrossRef]
61. Butler, C.J.; Wheeler, E.A.; Stabler, L.B. Distribution of the threatened lace hedgehog cactus (Echinocereus reichenbachii) undervarious climate change scenarios. J. Torrey Bot. Soc. 2012, 139, 46–55. [CrossRef]

Diversity 2022, 14, 506 19 of 21
62. Mohammadi, S.; Ebrahimi, E.; Moghadam, M.S. Modelling current and future potential distributions of two desert jerboas underclimate change in Iran. Ecol. Inform. 2019, 52, 7–13. [CrossRef]
63. Donner, L.J.; Wyman, B.L.; Hemler, R.S.; Horowitz, L.W.; Ming, Y.; Zhao, M.; Golaz, J.-C.; Ginoux, P.; Lin, S.-J.; Schwarzkopf, M.D.The dynamical core, physical parameterizations, and basic simulation characteristics of the atmospheric component AM3 of theGFDL global coupled model CM3. J. Clim. 2011, 24, 3484–3519. [CrossRef]
64. Bentsen, M.; Bethke, I.; Debernard, J.B.; Iversen, T.; Kirkevåg, A.; Seland, Ø.; Drange, H.; Roelandt, C.; Seierstad, I.A.;Hoose, C.; et al. The Norwegian Earth System Model, NorESM1-M—Part 1: Description and basic evaluation of the physi-cal climate. Geosci. Model Dev. 2013, 6, 687–720. [CrossRef]
65. Iversen, T.; Bentsen, M.; Bethke, I.; Debernard, J.B.; Kirkevåg, A.; Seland, Ø.; Drange, H.; Kristjansson, J.E.; Medhaug, I.;Sand, M.; et al. The Norwegian Earth System Model, NorESM1-M—Part 2: Climate response and scenario projections. Geosci.Model Dev. 2013, 6, 389–415. [CrossRef]
66. Remya, K.; Ramachandran, A.; Jayakumar, S. Predicting the current and future suitable habitat distribution of Myristicadactyloides Gaertn. using MaxEnt model in the Eastern Ghats, India. Ecol. Eng. 2015, 82, 184–188. [CrossRef]
67. Chaturvedi, R.K.; Joshi, J.; Jayaraman, M.; Bala, G.; Ravindranath, N.H. Multi-model climate change projections for India underrepresentative concentration pathways. Curr. Sci. 2012, Vol., 791–802.
68. Menon, A.; Levermann, A.; Schewe, J.; Lehmann, J.; Frieler, K. Consistent increase in Indian monsoon rainfall and its variabilityacross CMIP-5 models. Earth Syst. Dyn. 2013, 4, 287–300. [CrossRef]
69. van Vuuren, D.P.; Edmonds, J.; Kainuma, M.; Riahi, K.; Thomson, A.; Hibbard, K.; Hurtt, G.C.; Kram, T.; Krey, V.;Lamarque, J.F.; et al. The representative concentration pathways: An overview. Clim. Change 2011, 109, 5–31. [CrossRef]
70. Riahi, K.; Grubler, A.; Nakicenovic, N. Scenarios of long-term socio-economic and environmental development under climatestabilization. Technol. Forecast Soc. 2007, 74, 887–935. [CrossRef]
71. Meinshausen, M.; Smith, S.J.; Calvin, K.; Daniel, J.S.; Kainuma, M.L.; Lamarque, J.F.; Matsumoto, K.; Montzka, S.A.; Raper,S.C.; Thomsom, A.G.J.M.V. The RCP greenhouse gas concentrations and their extensions from 1765 to 2300. Clim. Change 2011,109, 213–241. [CrossRef]
72. Munasinghe, J. National Physical Planning Policy & The Plan 2017–2050; National Physical Planning Department Sri Lanka:Battaramulla, Sri Lanka, 2019; 148p. Available online: https://www.tamilnet.com/img/publish/2020/03/NPPD-ENGweb-27_12.pdf. (accessed on 15 May 2022).
73. Elith, J.; Phillips, S.J.; Hastie, T.; Dudík, M.; Chee, Y.E.; Yates, C.J. A statistical explanation of MaxEnt for ecologists. Divers. Distrib.2011, 17, 43–57. [CrossRef]
74. Peterson, A.T.; Soberón, J. Species Distribution Modeling and Ecological Niche Modeling: Getting the Concepts Right. Nat.Conserv. 2012, 10, 102–107. [CrossRef]
75. Swets, J.A. Measuring the accuracy of diagnostic systems. Science 1988, 240, 1285–1293. [CrossRef] [PubMed]76. Tang, X.; Yingdan, Y.; Xiangming, L.; Jinchi, Z. Maximum entropy modeling to predict the impact of climate change on pine wilt
disease in China. Front. Plant Sci. 2021, 12, 764. [CrossRef]77. Allouche, O.; Tsoar, A.; Kadmon, R. Assessing the accuracy of species distribution models: Prevalence, kappa and the true skill
statistic (TSS). J. Appl. Ecol. 2006, 43, 1223–1232. [CrossRef]78. Peterson, A.T.; Papes, M.; Soberón, J. Rethinking receiver operating characteristic analysis applications in ecological niche
modeling. Ecol. Model. 2008, 213, 63–72. [CrossRef]79. Torres, J.; Brito, J.C.; Vasconcelos, M.J.; Catarino, L.; Gonçalves, J.; Honrado, J. Ensemble models of habitat suitability relate
chimpanzee (Pan troglo-dytes) conservation to forest and landscape dynamics in Western Africa. Biol. Conserv. 2010, 143, 416e425.[CrossRef]
80. Coban, H.O.; Örücü, Ö.K.; Arslan, E.S. MaxEnt modeling for predicting the current and future potential geographical distributionof Quercus libani Olivier. Sustainability 2020, 12, 2671. [CrossRef]
81. Karunarathna, S.; Dayananda, S.K.; Gabadage, D.; Botejue, M.; Madawala, M.; Peabotuwage, I.; Madurapperuma, B.D.;Ranagalage, M.; Udayakumara, A.; Surasinghe, T.D. Distribution, Habitat Associations and Conservation Status of the SriLanka Frogmouth Batrachostomus moniliger. Ardeola 2021, 69, 75–95. [CrossRef]
82. Gabadage, D.; Surasinghe, T.; De Silva, A.; Somaweera, R.; Madurapperuma, B.; Madawala, M.; Karunarathna, S. Ecological andzoological study of endemic Sri Lankan Keelback (Balanophis ceylonensis): With implications for its conservation. Vertebr. Zool.2018, 68, 225–236.
83. Bachman, S.; Moat, J.; Hill, A.W.; de la Torre, J.; Scott, B. Supporting Red List threat assessments with GeoCAT: Geospatialconservation assessment tool. ZooKeys 2011, 150, 117–126. [CrossRef] [PubMed]
84. IUCN. IUCN Red List Categories and Criteria: Version 3.1, 2nd ed.; IUCN Species Survival Commission: Gland, Switzerland;Cambridge, UK, 2012.
85. Razgour, O.; Rebelo, H.; Di Febbraro, M.; Russo, D. Painting maps with bats: Species distribution modelling in bat research andconservation. Hystrix 2016, 27, 1–8.
86. Ellis, E.C. Anthropogenic transformation of the terrestrial biosphere. Phil. Trans. R. Soc. A 2011, 369, 1010–1035. [CrossRef]87. Soberón, J. Grinnellian and Eltonian niches and geographic distributions of species. Ecol. Lett. 2007, 10, 1115–1123. [CrossRef]88. Sánchez-Barradas, A.; Villalobos, F. Species geographical co-occurrence and the effect of Grinnellian and Eltonian niche partition-
ing: The case of a Neotropical felid assemblage. Ecol. Res. 2020, 35, 382–393. [CrossRef]

Diversity 2022, 14, 506 20 of 21
89. Rebelo, H.; Tarroso, P.; Jones, G. Predicted impact of climate change on European bats in relation to their biogeographic patterns.Glob. Change Biol. 2010, 16, 561–576. [CrossRef]
90. Pereira, M.J.R.; Peste, F.; Paula, A.; Pereira, P.; Bernardino, J.; Vieira, J.; Bastos, C.; Mascarenhas, M.; Costa, H.; Fonseca, C.Managing coniferous production forests towards bat conservation. Wildl. Res. 2016, 43, 80–92. [CrossRef]
91. Kumar, S.; Stohlgren, T.J. Maxent modeling for predicting suitable habitat for threatened and endangered tree Canacomyricamonticola in New Caledonia. J. Ecol. Nat. Environ. 2009, 1, 094–098.
92. Marmion, M.; Parviainen, M.; Luoto, M.; Heikkinen, R.K.; Thuiller, W. Evaluation of consensus methods in predictive speciesdistribution modeling. Divers. Distrib. 2009, 15, 59–69. [CrossRef]
93. Harper, K.A.; Macdonald, S.E.; Burton, P.J.; Chen, J.; Brosofske, K.D.; Saunders, S.C.; Euskirchen, E.S.; Roberts, D.; Jaiteh, M.S.;Esseen, P.A. Edge influence on forest structure and composition in fragmented landscapes. Conserv. Biol. 2005, 19, 768–782.[CrossRef]
94. Andrén, H. Effects of landscape composition on predation rates at habitat edges. In Mosaic Landscapes and Ecological ProcessesMosaic Landscapes and Ecological Processes; Springer: Berlin/Heidelberg, Germany, 1995; pp. 225–255.
95. Fox, B.J.; Fox, M.D. Factors determining mammal species richness on habitat islands and isolates: Habitat diversity, disturbance,species interactions and guild assembly rules. Glob. Ecol. Biogeogr. 2000, 9, 19–37. [CrossRef]
96. Synes, N.W.; Ponchon, A.; Palmer, S.C.F.; Osborne, P.E.; Bocedi, G.; Travis, J.M.J.; Watts, K. Prioritising conservation actions forbiodiversity: Lessening the impact from habitat fragmentation and climate change. Biol. Conserv. 2020, 252, 108819. [CrossRef]
97. Opdam, P.; Wascher, D. Climate change meets habitat fragmentation: Linking landscape and biogeographical scale levels inresearch and conservation. Biol. Conserv. 2004, 117, 285–297. [CrossRef]
98. Oliver, T.H.; Brereton, T.; Roy, D.B. Population resilience to an extreme drought is influenced by habitat area and fragmentation inthe local landscape. Ecography 2013, 36, 579–586. [CrossRef]
99. Lawler, J.J.; Hepinstall-Cymerman, J. Conservation planning in a changing climate: Assessing the impacts of potential rangeshifts on a reserve network. In Landscape-Scale Conservation Planning; Springer: Berlin/Heidelberg, Germany, 2010; pp. 325–348.
100. Trombulak, S.C.; Baldwin, R.F. Introduction: Creating a context for landscape-scale conservation planning. In Landscape-ScaleConservation Planning Landscape-Scale Conservation Planning; Springer: Berlin/Heidelberg, Germany, 2010; pp. 1–15.
101. Patel, J.; Gamit, K.; Gamit, N.; Debata, S. Painted Bat (Kerivoula picta) in Gujarat. Zoos Print J. 2017, 32, 13–16.102. Hawkeswood, T.J.; Sommung, B. Record of the Painted Woolly Bat, Kerivoulapicta (Pallas, 1767) (Mammalia: Chiroptera:
Vespertilionidae) from the Sisaket farming district of Thailand. Calodema 2017, 555, 1–4.103. Parmesan, C.; Yohe, G. A globally coherent fingerprint of climate change impacts across natural systems. Nature 2003, 421, 37–42.
[CrossRef]104. Razgour, O.; Hanmer, J.; Jones, G. Using multi-scale modelling to predict habitat suitability for species of conservation concern:
The grey long-eared bat as a case study. Biol. Conser. 2011, 144, 2922–2930. [CrossRef]105. Klüg-Baerwald, B.J.; Gower, L.E.; Lausen, C.L.; Brigham, R.M. Environmental correlates and energetics of winter flight by bats in
southern Alberta, Canada. Can. J. Zool. 2016, 94, 829–836. [CrossRef]106. Catto, C.M.C.; Racey, P.A.; Stephenson, P.J. Activity patterns of the serotine bat (Eptesicus serotinus) at a roost in southern England.
J. Zool. 1995, 235, 635–644. [CrossRef]107. Burles, D.W.B.W.; Brigham, R.M.B.M.; Ring, R.A.R.A.; Reimchen, T.E.R.E. Influence of weather on two insectivorous bats in a
temperate Pacific Northwest rainforest. Can. J. Zool. 2009, 87, 132–138. [CrossRef]108. Grindal, S.D.; Collard, T.S.; Brigham, R.M.; Robert, M.R.B. The influence of precipitation on reproduction by Myotis bats in British
Columbia. Am. Midl. Nat. 1992, 128, 339–344. [CrossRef]109. Mittermeier, R.A.; Gil, P.R.; Hoffman, M.; Pilgrim, J.; Brooks, T.; Mittermeier, C.G.; Lamoreux, J.; Da Fonseca, G.A.B. Hotspots
Revisited: Earth’s Biologically Richest and Most Endangered Terrestrial Ecoregions; Cemex: Mexico City, Mexico, 2005.110. Mittermeier, R.A.; Myers, N.; Mittermeier, C.G.; Gil, P.R. Hotspots: Earth’s Biologically Richest and Most Endangered Terrestrial
Ecoregions; CEMEX, SA, Agrupación Sierra Madre, SC: Mexico City, Mexico, 1999.111. Brooks, T.M.; Mittermeier, R.A.; da Fonseca, G.A.; Gerlach, J.; Hoffmann, M.; Lamoreux, J.F.; Mittermeier, C.G.; Pilgrim, J.D.;
Rodrigues, A.S. Global biodiversity conservation priorities. Science 2006, 313, 58–61. [CrossRef] [PubMed]112. Brooks, T.M.; Mittermeier, R.A.; Mittermeier, C.G.; Da Fonseca, G.A.B.; Rylands, A.B.; Konstant, W.R.; Flick, P.; Pilgrim, J.;
Oldfield, S.; Magin, G. Habitat loss and extinction in the hotspots of biodiversity. Conserv. Biol. 2002, 16, 909–923. [CrossRef]113. Zamora-Gutierrez, V.; Pearson, R.G.; Green, R.E.; Jones, K.E. Forecasting the combined effects of climate and land use change on
Mexican bats. Divers. Distrib. 2018, 24, 363–374. [CrossRef]114. Hughes, A.C. Understanding the drivers of S outheast A sian biodiversity loss. Ecosphere 2017, 8, e01624. [CrossRef]115. Wiens, J.J.; Graham, C.H. Niche conservatism: Integrating evolution, ecology and conservation biology. Annu. Rev. Ecol. Evol.
Syst. 2005, 36, 519–539. [CrossRef]116. Rebelo, H.; Froufe, E.; Brito, J.C.; Russo, D.; Cistrone, L.; Ferrand, N.; Jones, G. Postglacial colonization of Europe by the barbastelle
bat: Agreement between molecular data and past predictive modelling. Mol. Ecol. 2012, 21, 2761–2774. [CrossRef]117. Razgour, O.; Juste, J.; Ibáñez, C.; Kiefer, A.; Rebelo, H.; Puechmaille, S.J.; Arlettaz, R.; Burke, T.; Dawson, D.A.; Beaumont, M.; et al.
The shaping of genetic variation in edge-of-range populations under past and future climate change. Ecol. Lett. 2013, 16, 1258–1266.[CrossRef] [PubMed]

Diversity 2022, 14, 506 21 of 21
118. Hughes, A.C.; Satasook, C.; Bates, P.J.; Bumrungsri, S.; Jones, G. The projected effects of climatic and vegetation changes on thedistribution and diversity of Southeast Asian bats. Glob. Change Biol. 2012, 18, 1854–1865. [CrossRef]
119. Oliver, T.H.; Morecroft, M.D. Interactions between climate change and land use change on biodiversity: Attribution problems,risks, and opportunities. Clim. Change 2014, 5, 317–335. [CrossRef]
120. Heer, K.; Helbig-Bonitz, M.; Fernandes, R.G.; Mello, M.A.; Kalko, E.K. Effects of land use on bat diversity in a complexplantation–forest landscape in northeastern Brazil. J. Mammal. 2015, 96, 720–731. [CrossRef]
121. Costello, M.J.; Michener, W.K.; Gahegan, M.; Zhang, Z.Q.; Bourne, P.E. Biodiversity data should be published, cited, and peerreviewed. Trends Ecol. Evol. 2013, 28, 454–461. [CrossRef]
122. Rabbani, M.; Rahman, A.A.; Islam, N.; Michel, D.; Pandya, A. Climate change and sea level rise: Issues and challenges for coastalcommunities in the Indian Ocean region. Coastl. Zones Clim. Change 2010, Vol., 17–29.
123. Weerakkody, U. Potential impact of accelerated sea-level rise on beaches of Sri Lanka. J. Coast. Res. 1997, Vol., 225–242.124. Gopalakrishnan, T.; Kumar, L. Potential impacts of sea-level rise upon the Jaffna Peninsula, Sri Lanka: How climate change can
adversely affect the coastal zone. J. Coast. Res. 2020, 36, 951–960. [CrossRef]125. Gopalakrishnan, T.; Kumar, L.; Hasan, M.K. Coastal settlement patterns and exposure to sea-level rise in the Jaffna Peninsula, Sri
Lanka. Popul. Environ. 2020, 42, 129–145. [CrossRef]126. Palamakumbure, L.; Ratnayake, A.S.; Premasiri, H.; Ratnayake, N.P.; Katupotha, J.; Dushyantha, N.; Weththasinghe, S.; Weer-
akoon, W. Sea-level inundation and risk assessment along the south and southwest coasts of Sri Lanka. Geoenviron. Disasters 2020,7, 1–9. [CrossRef]