Compton profiles and band structure calculations of IV–VI layered compounds GeS and GeSe
10
Radiation Physics and Chemistry 77 (2008) 391–400 Compton profiles and band structure calculations of IV–VI layered compounds GeS and GeSe A. Rathor a , V. Sharma a , N.L. Heda a , Y. Sharma b , B.L. Ahuja a, a Department of Physics, University College of Science, M.L. Sukhadia University, Udaipur 313001, Rajasthan, India b Department of Physics, Feroze Gandhi College, Rae Bareli 229001, Uttar Pradesh, India Received 3 September 2007; accepted 20 December 2007 Abstract First ever isotropic experimental Compton profiles of GeS and GeSe are presented. Moreover, we present Compton profiles, energy bands and density of states (DOS) using Hartree–Fock, density functional and pseudopotential schemes. It is seen that the Hartree–Fock and density functional theories show a reasonable agreement with the experiment. The equal-valence-electron-density profiles show that GeS is more ionic than GeSe. We have also reported energy bands and DOS using full potential linearized augmented plane-wave method. r 2007 Elsevier Ltd. All rights reserved. PACS: 13.60.Fz; 71.15.Ap; 71.15.Mb; 78.70.Ck Keywords: X-ray scattering; Density functional theory; Electron momentum densities; IV–VI semiconductors 1. Introduction GeX (X ¼ S, Se) have the layered orthorhombic structure with eight atoms per unit cell organized in two adjacent double layers. The layered structure along with its Brillouin zone is shown in Fig. 1. Owing to the peculiar structure of GeX compounds, interesting electronic proper- ties and technological applications (in photovoltaic cells, cut off devices, infrared lasers, detectors, etc.), many workers have reported electronic structure and optical properties of these chalcogenides. Among some later studies, Gashimzade et al. (1992) have reported the band structure of GeS and GeSe along with few other IV–VI layered semiconductor compounds using linear combina- tion of atomic orbitals (LCAO). Employing the high- resolution-electron-energy-loss-spectroscopy, cleaved surfaces of GeS and GeSe have been studied by Yu et al. (1993). The ab-initio total-energy pseudopotential calculations for layered GeSe have been reported by Hsueh et al. (1995) along with the high-pressure angle-dispersive powder X-ray diffraction and vibrational spectroscopy measure- ments. The structural and electrical properties of GeSe and GeTe at high pressure were studied by Onodera et al. (1997) using X-ray diffraction measurements. Very re- cently, using a full potential linearized augmented plane wave (FP-LAPW) method, the band gap and optical properties for GeS have been reported by Makinistian and Albanesi (2006). These authors have compared their data with the available core spectra and optical properties. Of the many probes that are employed in materials only a few (like Compton scattering, electron scattering) access properties that are directly related to electronic wave functions. In the Compton scattering experiments, one measures a projection of electron momentum density. Within the impulse approximation, a Compton profile J(p z ) is taken as a double integrated momentum density rð ~ pÞ over a plane perpendicular to the X-ray scattering vector (Cooper, 1985; Cooper et al., 2004). The J(p z ) is given as J ðp z Þ¼ ZZ rð ~ pÞ dp x dp y (1) where p z lies along the scattering vector. ARTICLE IN PRESS www.elsevier.com/locate/radphyschem 0969-806X/$ - see front matter r 2007 Elsevier Ltd. All rights reserved. doi:10.1016/j.radphyschem.2007.12.011 Corresponding author. Tel.: +91 294 2423322; fax: +91 294 2411950. E-mail address: [email protected] (B.L. Ahuja).
-
Upload
independent -
Category
Documents
-
view
0 -
download
0
Transcript of Compton profiles and band structure calculations of IV–VI layered compounds GeS and GeSe

ARTICLE IN PRESS
0969-806X/$ - s
doi:10.1016/j.ra
�CorrespondE-mail addr
Radiation Physics and Chemistry 77 (2008) 391–400
www.elsevier.com/locate/radphyschem
Compton profiles and band structure calculations of IV–VI layeredcompounds GeS and GeSe
A. Rathora, V. Sharmaa, N.L. Hedaa, Y. Sharmab, B.L. Ahujaa,�
aDepartment of Physics, University College of Science, M.L. Sukhadia University, Udaipur 313001, Rajasthan, IndiabDepartment of Physics, Feroze Gandhi College, Rae Bareli 229001, Uttar Pradesh, India
Received 3 September 2007; accepted 20 December 2007
Abstract
First ever isotropic experimental Compton profiles of GeS and GeSe are presented. Moreover, we present Compton profiles, energy
bands and density of states (DOS) using Hartree–Fock, density functional and pseudopotential schemes. It is seen that the Hartree–Fock
and density functional theories show a reasonable agreement with the experiment. The equal-valence-electron-density profiles
show that GeS is more ionic than GeSe. We have also reported energy bands and DOS using full potential linearized augmented
plane-wave method.
r 2007 Elsevier Ltd. All rights reserved.
PACS: 13.60.Fz; 71.15.Ap; 71.15.Mb; 78.70.Ck
Keywords: X-ray scattering; Density functional theory; Electron momentum densities; IV–VI semiconductors
1. Introduction
GeX (X ¼ S, Se) have the layered orthorhombicstructure with eight atoms per unit cell organized in twoadjacent double layers. The layered structure along with itsBrillouin zone is shown in Fig. 1. Owing to the peculiarstructure of GeX compounds, interesting electronic proper-ties and technological applications (in photovoltaic cells,cut off devices, infrared lasers, detectors, etc.), manyworkers have reported electronic structure and opticalproperties of these chalcogenides. Among some laterstudies, Gashimzade et al. (1992) have reported the bandstructure of GeS and GeSe along with few other IV–VIlayered semiconductor compounds using linear combina-tion of atomic orbitals (LCAO). Employing the high-resolution-electron-energy-loss-spectroscopy, cleaved surfacesof GeS and GeSe have been studied by Yu et al. (1993).The ab-initio total-energy pseudopotential calculations forlayered GeSe have been reported by Hsueh et al. (1995)along with the high-pressure angle-dispersive powder
ee front matter r 2007 Elsevier Ltd. All rights reserved.
dphyschem.2007.12.011
ing author. Tel.: +91294 2423322; fax: +91 294 2411950.
ess: [email protected] (B.L. Ahuja).
X-ray diffraction and vibrational spectroscopy measure-ments. The structural and electrical properties of GeSe andGeTe at high pressure were studied by Onodera et al.(1997) using X-ray diffraction measurements. Very re-cently, using a full potential linearized augmented planewave (FP-LAPW) method, the band gap and opticalproperties for GeS have been reported by Makinistian andAlbanesi (2006). These authors have compared their datawith the available core spectra and optical properties.Of the many probes that are employed in materials only
a few (like Compton scattering, electron scattering) accessproperties that are directly related to electronic wavefunctions. In the Compton scattering experiments, onemeasures a projection of electron momentum density.Within the impulse approximation, a Compton profileJ(pz) is taken as a double integrated momentum densityrð~pÞ over a plane perpendicular to the X-ray scatteringvector (Cooper, 1985; Cooper et al., 2004). The J(pz) isgiven as
JðpzÞ ¼
Z Zrð~pÞdpx dpy (1)
where pz lies along the scattering vector.

ARTICLE IN PRESS
Fig. 1. (a) The crystal structure of Pnma 62 orthorhombic GeS and GeSe. The dark atoms represent Ge. (b) The Brillouin zone of the orthorhombic
structure. The axes x, y, z in direct lattice correspond to kx, ky and kz in the Brillouin zone.
A. Rathor et al. / Radiation Physics and Chemistry 77 (2008) 391–400392
Therefore, the Compton spectroscopy has become awell-established tool for the direct investigation of groundstate electronic structure, chemical bonding, etc. To ourknowledge, theoretical and experimental momentum den-sities of GeS and GeSe are not available in literature. Inthis work, our aim is to fill this gap by performingCompton measurements and extensive band calculationsfor the momentum densities.
Due to non-availability of large size (13mm diameterand 3mm thickness) single crystals of GeS and GeSe, wehave decided to measure the isotropic Compton profiles.Further, isotropic profiles enable to compare the momen-tum density at equal-valence-electron-density (EVED) toconclude about the relative nature of bonding in such typeof isoelectronic semiconductors.
In this paper, we present the first ever Compton profilemeasurements of GeS and GeSe using 137Cs Comptonspectrometer. The experimental data are comparedwith our first ever theoretical profiles computed usingHartree–Fock, density functional schemes, hybridizationof Hartree–Fock to density functional theory andpseodopotential approach as embodied in CRYSTAL03code. In addition, using the same code we have alsoreported the band structures and density of states.Moreover, to check the applicability of full potentiallinearized augmented plane wave method, we have alsocomputed the electronic structure of these compoundsusing WIEN2k package.
2. Experiment
The Compton profile measurements were performedusing a 740GBq (20 Ci) 137Cs Compton spectrometer,described in detail by Ahuja et al. (2006) and Ahuja andSharma (2005). g-Rays of energy 661.65 keV were scatteredthrough an angle of 16070.61 from the sample. The overallmomentum resolution (Gaussian full-width at half-maximum) of the spectrometer was 0.39 a.u., which ismuch better than the conventional resolution (0.6 a.u.)
using 241Am Compton spectrometers. The scattered g-rayswere detected by a high purity germanium detector(model GL0210P, Canberra, USA). The goal of dataprocessing was to extract the true Compton profile fromthe measured intensity distribution. The data processingconsisted of background subtraction and correctionsfor instrumental resolution, detector efficiency, Comptoncross-section, multiple scattering, etc. using the computercode of Warwick group (Felsteiner et al., 1974; Williams,1977; Timms, 1989). Since the contribution of Bremsstrah-lung background in the data is expected to be small(Mathur and Ahuja, 2005), we have not incorporatedthis correction in the present data reduction. Finally,the profiles were normalized to the corresponding freeatom Compton profile (Biggs et al., 1975) area. Someparameters concerning samples and data processing aregiven in Table 1.
3. Theory
3.1. LCAO calculations
CRYSTAL03 package (Pisani and Dovesi, 1980; Towleret al., 1996; Saunders et al., 2003), a quantum mechanicalmethod, is based on the periodic LCAO approach wherecrystalline orbitals are expanded over basis sets of atomicorbitals. It includes various schemes namely Hartree–Fock(HF), density functional theory (DFT) with local densityapproximation (LDA) and generalized gradient approx-imation (GGA), hybrid DFT–HF and pseudopotential(PP). We have used this software for the computation ofCompton profiles, energy bands and density of states, etc.The HF, DFT and PP approaches differ in the form ofmonoelectronic Hamiltonian operator h.In case of HF scheme, h is defined as
hHF ¼ T þ V þ J½rð~rÞ� þ KHF½rð~r;~r0Þ� (2)
where T , V , J and KHF are kinetic, external electron-nuclear interaction potential, Coulomb and non-local

ARTICLE IN PRESS
Table 1
Experimental parameters for Compton profile measurements of GeS and GeSe
Sample Sample thickness, with
diameter (cm)
Bulk density
(g/cm3)
Measurement
time (h)
Intensity under Compton
region (counts)
Multiple scattering
(�10 to +10a.u.) (%)
Normalization
(0�7 a.u.)
(i) GeS 0.3, 2.4 4.21 258.5 2.3� 107 11.57 21.24 e�
(ii) GeSe 0.3, 2.4 3.22 185.9 2.8� 107 7.39 28.32 e�
A. Rathor et al. / Radiation Physics and Chemistry 77 (2008) 391–400 393
exchange operators, respectively. Here the exact exchangeis taken while correlation effects are neglected. In theKohn–Sham formulation of DFT, KHF is replaced byexchange-correlation potential operator (VXC), which isdefined in terms of exchange-correlation energy perparticle in uniform electron gas. The DFT calculationscan be performed within local density approximation(LDA) and the gradient corrected charge density approx-imation so-called the generalized gradient approximation(GGA).
The LDA calculations were performed with theDirac–Slater exchange (Saunders et al., 2003) and thePerdew–Zunger correlation (Perdew and Zunger, 1981)energy functionals. In GGA, the exchange potentialgiven by Becke (1988) was used while the correlationpotential was taken from Perdew and Wang (1986,1992).
One can also calculate the monoelectronic operatorusing a hybridization combination of exact HF exchangeand DFT correlation potentials. This method is referred asthe hybrid DFT–HF method. The B3LYP is a refinedform of the DFT–HF method. In the B3LYP, the EXC isdefined as
EXC ¼ ð1� pÞEXLDA þ pEX
HF þ qDEXB88 þ rEC
LYP þ ð1� rÞECVWN
(3)
where the constants p, q and r are 0.2, 0.72 and 0.81,respectively. DEX
B88 corresponds to exchange function ofBecke (1988), EC
LYP and ECVWN are the correlational
energies defined by Lee et al. (1988) and Vosko et al.(1980), respectively.
In case of ab-initio pseodopotential (PP), the hPP is givenas
hPP ¼ T þ J rð~rÞ½ � þ X þ EPP (4)
where X and EPP are the exchange and effective-corepseudopotential operators, respectively.
In the present calculations, the structure of GeS andGeSe was taken to be orthorhombic with the space groupPnma. The lattice parameters for GeS have been taken asa ¼ 10.47 A, b ¼ 3.641 A and c ¼ 4.297 A, while for GeSethese parameters were 10.79, 3.8 and 4.38 A, respectively.The all electrons Gaussian basis sets for Ge, S and Se weretaken from www.tcm.phy.cam.ac.uk/�mdt26/basis_sets.The effective core pseudopotentials (ECPs) were takenfrom Wadt and Hay (1985). The energy optimization of the
basis sets was undertaken using the BILLY software(Saunders et al., 2003). The self-consistence calculationshave been performed at 125 ~k points in the irreducibleBrillouin zone. The absolute theoretical profiles werenormalized as mentioned in Section 2.
3.2. FP-LAPW calculations
We have also used the FP-LAPW (APW+lo) methodto compute the electronic structure of GeS and GeSe.For this purpose, we have used WIEN2k package(Blaha et al., 1990, 2001) wherein the crystal potentialexpands as
V ð~r ¼Þ
Plm
V lmðrÞY lmðrÞ inside muffin tin ðMTÞ sphere
Pk
V kei~k:~r outside MT sphere;
8><>:
(5)
where Ylm are spherical harmonics. In this theory, gradientof the charge density is considered. This functional is moresensitive to the non-spherical components of the density,which could result in a better performance when applied in afull potential scheme like the one implemented in theWIEN2k (Blaha et al., 2001).All FP-LAPW calculations were performed using the
gradient corrected exchange-correlation, recently devel-oped by Wu and Cohen (2006). In present work, theconvergence criterion was set to 0.01mRy with cut-offcharge density. Radii of MT spheres of Ge and S weretaken to be 2.29 a.u. For the present calculations, 144k-points in the irreducible Brillouin zone IBZ {1000(5� 15� 12) points} were considered. The convergence ofbasis set was controlled by a cutoff parameter RMTKmax ¼ 7,where RMT is atomic sphere radius in the unit cell and Kmax
is the magnitude of the largest K vector in the combinedbasis set of LAPW’s within linear variation method. Themaximum radial expansion lmax was set to 10. In the case ofGeSe, the radius of MT spheres was taken to be 2.37 a.u.for both the MT spheres corresponding to Ge and Se.Further, the number of k-points in the irreducible Brillouinzone IBZ {1000 (5� 14� 12) points} were taken to be 126.Since the WIEN2k code does not include computation ofthe momentum densities, we have not calculated theCompton profiles.
ARTICLE IN PRESS
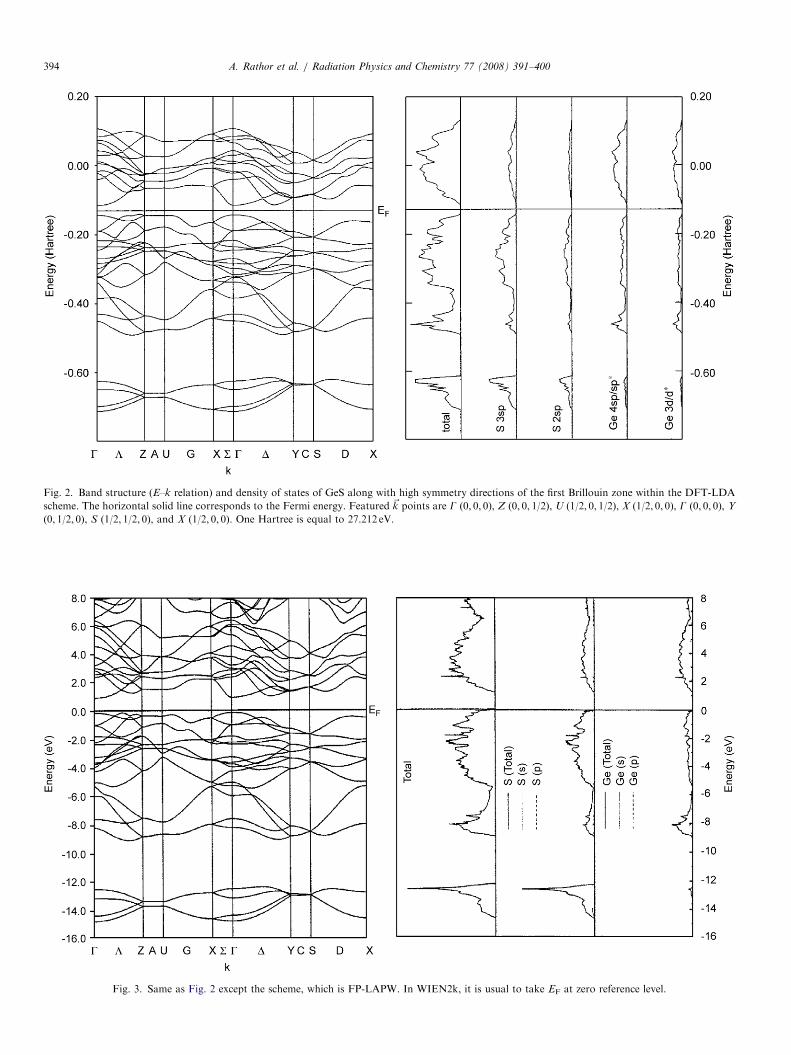
Fig. 2. Band structure (E–k relation) and density of states of GeS along with high symmetry directions of the first Brillouin zone within the DFT-LDA
scheme. The horizontal solid line corresponds to the Fermi energy. Featured ~k points are G (0, 0, 0), Z (0, 0, 1/2), U (1/2, 0, 1/2), X (1/2, 0, 0), G (0, 0, 0), Y
(0, 1/2, 0), S (1/2, 1/2, 0), and X (1/2, 0, 0). One Hartree is equal to 27.212 eV.
Fig. 3. Same as Fig. 2 except the scheme, which is FP-LAPW. In WIEN2k, it is usual to take EF at zero reference level.
A. Rathor et al. / Radiation Physics and Chemistry 77 (2008) 391–400394
ARTICLE IN PRESS
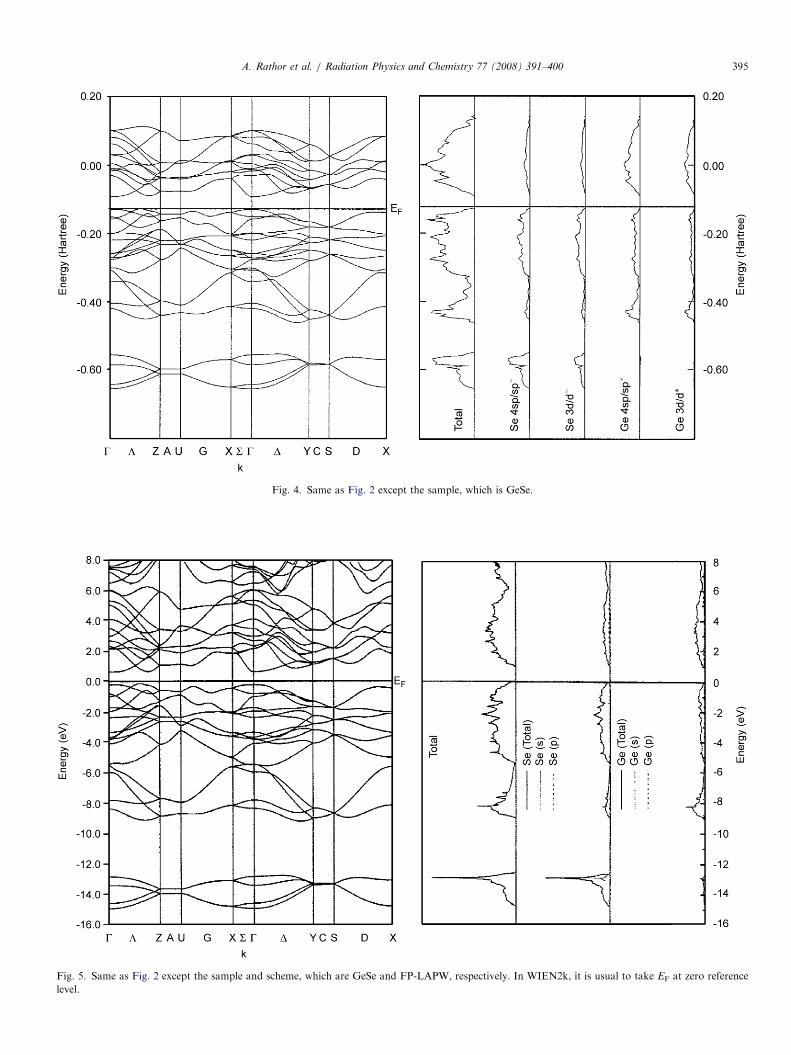
Fig. 4. Same as Fig. 2 except the sample, which is GeSe.
Fig. 5. Same as Fig. 2 except the sample and scheme, which are GeSe and FP-LAPW, respectively. In WIEN2k, it is usual to take EF at zero reference
level.
A. Rathor et al. / Radiation Physics and Chemistry 77 (2008) 391–400 395
ARTICLE IN PRESS
Table 2
The band gap (Eg) in eV for GeS and GeSe
Approach Eg
GeS GeSe
(i) Present work
(a) DFT-LDA 0.73 (direct on G) 1.13 (direct on G)0.83 (indirect in
G–Z)
1.03 (indirect in
G–Z)
(b) DFT-GGA 0.83 (direct on G) 1.24 (direct on G)0.89 (indirect in
G–Z)
1.10 (indirect in
G–Z)
(c) B3LYP 1.53 (direct on G) 2.05 (direct on G)1.73 (indirect in
G–Z)
1.87 (indirect in
G–Z)
(d) FP-LAPW
with GGAa1.053 (direct on G) 0.84 (direct on G)
1.051 (indirect in
G–Z)
0.76 (indirect in
G–Z)
(ii) Theory
(a) Makinistian
and Albanesi (2006)
1.10 (indirect in
G–Z)
–
FP-LAPW with
GGAb1.12 (direct on the Gpoint)
–
(b) Gashimzade et
al. (1992)
1.52 (indirect in
G–Z)
1.50 (indirect in
G–Z)
(c) Hsueh et al.
(1995)
– –
Pseudopotential with
LDA
– 0.35
(iii) Experiment
(a) Eymard and
Otto (1977
1.65 (direct on G) –
(b) Hsueh et al.
(1995)
– 1.53
(c) Wiley et al.
(1975)
1.65 (allowed direct
in G–Z)
–
(d) Elkorashy
(1988)
1.54 (indirect in
G–Z)
–
1.50 (electrical
energy gap)
–
1.56 (allowed
indirect in G–X and
G–Z)
–
1.35 and 1.50
(photoconductivity
energy gap)
–
(e) Haritonidis
and Kyriakos (1989)
2.04 in G–Z and 1.8
in G–Y (both direct
conductivity gaps)
–
(f) Elkorashy
(1990)
1.61370.010 in G–Z
(photoconductivity
energy gap)
–
(g) Kannewurf
and Cashmann
(1961)
– 1.16
aGGA based on exchange-correlation energy of Wu and Cohen (2006).bGGA based on exchange-correlation energy of Perdew et al. (1996).
A. Rathor et al. / Radiation Physics and Chemistry 77 (2008) 391–400396
4. Results and discussion
4.1. Energy bands and density of states
In Figs. 2–5, we have reported the energy bands anddensity of states (DOS) using the DFT-LDA and the FP-LAPW schemes for GeS and GeSe, respectively. From theDOS, it can be seen that the lowest bands shown in thesefigures mainly originates from different states of anion (S,Se). The next group of valence bands, say near �0.40Har-tree as shown in Fig. 2, originates from mixing of cation(Ge) d, sp states and anion sp states. Finally, the group ofupper valence bands (just below EF) are due to spd states ofboth the anions and cations, although the major contribu-tion comes from anion. The conduction bands mainlyoriginate from cation sp and d states. Due to similartopology of energy bands from other computationalschemes of the CRYSTAL03 code, we have only reportedDFT-LDA based energy bands and density of states. Theband gaps computed by us using the FP-LAPW, the DFTwith LDA and GGA and the B3LYP along with theavailable data are summarized in Table 2. From Table 2, itis seen that for both the semiconductors, our DFT-LDAbased band gaps are lower than the experimental data.Separately, we have also computed the band gaps using theHF scheme. As expected, the HF approach provided alarge value of band gap. A similar trend for the HF schemehas been observed in our earlier work on CdS and CdTe(Heda et al., 2007). The data in Table 2 depict that theenergy gaps computed by the B3LYP are close to theexperimental data. The band gap for GeSe as reported byHsueh et al. (1995) using the pseudopotential with LDA isfound to be the lowest among the reported data. In boththe compounds, our FP-LAPW calculation reproduces alower value of band gap than the experimental values.
4.2. Compton profiles
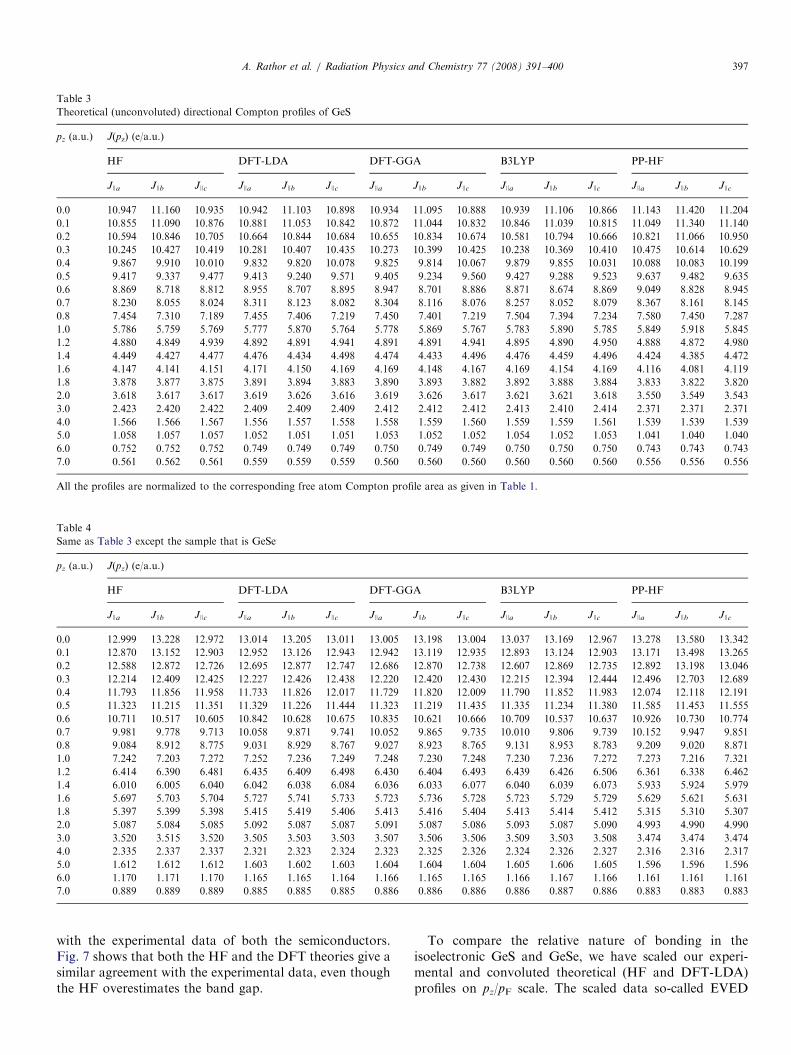
The directional Compton profiles of GeS and GeSewithin the framework of the HF, the DFT (with LDA andGGA), the B3LYP and the PP-HF are listed in Tables 3and 4. For both the semiconductors, all the J(pz) atpz=0a.u. along JJb direction are higher than that of JJa
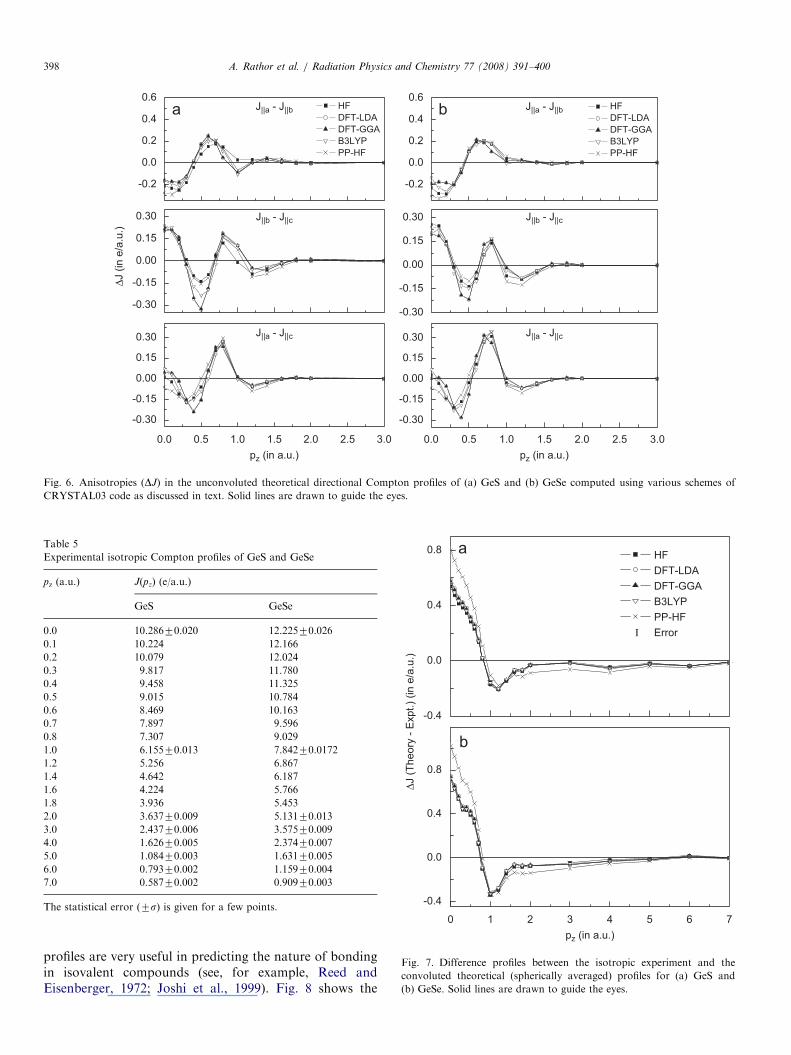
and JJc directions, which shows the larger momentumdensity at G point along JJb direction. Fig. 6 shows theanisotropies between unconvoluted theoretical directionalCompton profiles for GeS and GeSe. It is seen that exceptpseudopotential the general trend of oscillations in all thetheoretical anisotropies, namely JJa�JJb, JJb�JJc andJJa�JJc, is almost same in the given range of pz. Aboutpz ¼ 0.4 a.u., the DFT-GGA calculations overestimate theanisotropies JJb–JJc and JJa–JJb.
To compare our isotropic Compton profiles as given inTable 5 with the model calculations, we have taken thespherical average of the theoretical directional profiles(Tables 3 and 4). In Fig. 7, we have plotted the differencebetween the convoluted theories and the respective experi-
ment. It is seen that in the low momentum region, all thetheories overestimate the momentum density while areverse trend is seen between 0.8 and 5.0 a.u. Thepseudopotential calculations show the poorest agreement
ARTICLE IN PRESS
Table 3
Theoretical (unconvoluted) directional Compton profiles of GeS
pz (a.u.) J(pz) (e/a.u.)
HF DFT-LDA DFT-GGA B3LYP PP-HF
JJa JJb JJc JJa JJb JJc JJa JJb JJc JJa JJb JJc JJa JJb JJc
0.0 10.947 11.160 10.935 10.942 11.103 10.898 10.934 11.095 10.888 10.939 11.106 10.866 11.143 11.420 11.204
0.1 10.855 11.090 10.876 10.881 11.053 10.842 10.872 11.044 10.832 10.846 11.039 10.815 11.049 11.340 11.140
0.2 10.594 10.846 10.705 10.664 10.844 10.684 10.655 10.834 10.674 10.581 10.794 10.666 10.821 11.066 10.950
0.3 10.245 10.427 10.419 10.281 10.407 10.435 10.273 10.399 10.425 10.238 10.369 10.410 10.475 10.614 10.629
0.4 9.867 9.910 10.010 9.832 9.820 10.078 9.825 9.814 10.067 9.879 9.855 10.031 10.088 10.083 10.199
0.5 9.417 9.337 9.477 9.413 9.240 9.571 9.405 9.234 9.560 9.427 9.288 9.523 9.637 9.482 9.635
0.6 8.869 8.718 8.812 8.955 8.707 8.895 8.947 8.701 8.886 8.871 8.674 8.869 9.049 8.828 8.945
0.7 8.230 8.055 8.024 8.311 8.123 8.082 8.304 8.116 8.076 8.257 8.052 8.079 8.367 8.161 8.145
0.8 7.454 7.310 7.189 7.455 7.406 7.219 7.450 7.401 7.219 7.504 7.394 7.234 7.580 7.450 7.287
1.0 5.786 5.759 5.769 5.777 5.870 5.764 5.778 5.869 5.767 5.783 5.890 5.785 5.849 5.918 5.845
1.2 4.880 4.849 4.939 4.892 4.891 4.941 4.891 4.891 4.941 4.895 4.890 4.950 4.888 4.872 4.980
1.4 4.449 4.427 4.477 4.476 4.434 4.498 4.474 4.433 4.496 4.476 4.459 4.496 4.424 4.385 4.472
1.6 4.147 4.141 4.151 4.171 4.150 4.169 4.169 4.148 4.167 4.169 4.154 4.169 4.116 4.081 4.119
1.8 3.878 3.877 3.875 3.891 3.894 3.883 3.890 3.893 3.882 3.892 3.888 3.884 3.833 3.822 3.820
2.0 3.618 3.617 3.617 3.619 3.626 3.616 3.619 3.626 3.617 3.621 3.621 3.618 3.550 3.549 3.543
3.0 2.423 2.420 2.422 2.409 2.409 2.409 2.412 2.412 2.412 2.413 2.410 2.414 2.371 2.371 2.371
4.0 1.566 1.566 1.567 1.556 1.557 1.558 1.558 1.559 1.560 1.559 1.559 1.561 1.539 1.539 1.539
5.0 1.058 1.057 1.057 1.052 1.051 1.051 1.053 1.052 1.052 1.054 1.052 1.053 1.041 1.040 1.040
6.0 0.752 0.752 0.752 0.749 0.749 0.749 0.750 0.749 0.749 0.750 0.750 0.750 0.743 0.743 0.743
7.0 0.561 0.562 0.561 0.559 0.559 0.559 0.560 0.560 0.560 0.560 0.560 0.560 0.556 0.556 0.556
All the profiles are normalized to the corresponding free atom Compton profile area as given in Table 1.
Table 4
Same as Table 3 except the sample that is GeSe
pz (a.u.) J(pz) (e/a.u.)
HF DFT-LDA DFT-GGA B3LYP PP-HF
JJa JJb JJc JJa JJb JJc JJa JJb JJc JJa JJb JJc JJa JJb JJc
0.0 12.999 13.228 12.972 13.014 13.205 13.011 13.005 13.198 13.004 13.037 13.169 12.967 13.278 13.580 13.342
0.1 12.870 13.152 12.903 12.952 13.126 12.943 12.942 13.119 12.935 12.893 13.124 12.903 13.171 13.498 13.265
0.2 12.588 12.872 12.726 12.695 12.877 12.747 12.686 12.870 12.738 12.607 12.869 12.735 12.892 13.198 13.046
0.3 12.214 12.409 12.425 12.227 12.426 12.438 12.220 12.420 12.430 12.215 12.394 12.444 12.496 12.703 12.689
0.4 11.793 11.856 11.958 11.733 11.826 12.017 11.729 11.820 12.009 11.790 11.852 11.983 12.074 12.118 12.191
0.5 11.323 11.215 11.351 11.329 11.226 11.444 11.323 11.219 11.435 11.335 11.234 11.380 11.585 11.453 11.555
0.6 10.711 10.517 10.605 10.842 10.628 10.675 10.835 10.621 10.666 10.709 10.537 10.637 10.926 10.730 10.774
0.7 9.981 9.778 9.713 10.058 9.871 9.741 10.052 9.865 9.735 10.010 9.806 9.739 10.152 9.947 9.851
0.8 9.084 8.912 8.775 9.031 8.929 8.767 9.027 8.923 8.765 9.131 8.953 8.783 9.209 9.020 8.871
1.0 7.242 7.203 7.272 7.252 7.236 7.249 7.248 7.230 7.248 7.230 7.236 7.272 7.273 7.216 7.321
1.2 6.414 6.390 6.481 6.435 6.409 6.498 6.430 6.404 6.493 6.439 6.426 6.506 6.361 6.338 6.462
1.4 6.010 6.005 6.040 6.042 6.038 6.084 6.036 6.033 6.077 6.040 6.039 6.073 5.933 5.924 5.979
1.6 5.697 5.703 5.704 5.727 5.741 5.733 5.723 5.736 5.728 5.723 5.729 5.729 5.629 5.621 5.631
1.8 5.397 5.399 5.398 5.415 5.419 5.406 5.413 5.416 5.404 5.413 5.414 5.412 5.315 5.310 5.307
2.0 5.087 5.084 5.085 5.092 5.087 5.087 5.091 5.087 5.086 5.093 5.087 5.090 4.993 4.990 4.990
3.0 3.520 3.515 3.520 3.505 3.503 3.503 3.507 3.506 3.506 3.509 3.503 3.508 3.474 3.474 3.474
4.0 2.335 2.337 2.337 2.321 2.323 2.324 2.323 2.325 2.326 2.324 2.326 2.327 2.316 2.316 2.317
5.0 1.612 1.612 1.612 1.603 1.602 1.603 1.604 1.604 1.604 1.605 1.606 1.605 1.596 1.596 1.596
6.0 1.170 1.171 1.170 1.165 1.165 1.164 1.166 1.165 1.165 1.166 1.167 1.166 1.161 1.161 1.161
7.0 0.889 0.889 0.889 0.885 0.885 0.885 0.886 0.886 0.886 0.886 0.887 0.886 0.883 0.883 0.883
A. Rathor et al. / Radiation Physics and Chemistry 77 (2008) 391–400 397
with the experimental data of both the semiconductors.Fig. 7 shows that both the HF and the DFT theories give asimilar agreement with the experimental data, even thoughthe HF overestimates the band gap.
To compare the relative nature of bonding in theisoelectronic GeS and GeSe, we have scaled our experi-mental and convoluted theoretical (HF and DFT-LDA)profiles on pz/pF scale. The scaled data so-called EVED
ARTICLE IN PRESS
0.0
-0.30
-0.15
0.00
0.15
0.30 J||a - J||c
ΔJ (i
n e/
a.u.
)
pz (in a.u.)
HFDFT-LDADFT-GGAB3LYPPP-HF
-0.30
-0.15
0.00
0.15
0.30 J||b - J||c
-0.2
0.0
0.2
0.4
0.6J||a - J||b
-0.30
-0.15
0.00
0.15
0.30
HFDFT-LDADFT-GGAB3LYPPP-HF
-0.30
-0.15
0.00
0.15
0.30
-0.2
0.0
0.2
0.4
0.6
J||a - J||c
J||b - J||c
J||a - J||b
0.5 1.0 1.5 2.0 2.5 3.0 0.0pz (in a.u.)
0.5 1.0 1.5 2.0 2.5 3.0
Fig. 6. Anisotropies (DJ) in the unconvoluted theoretical directional Compton profiles of (a) GeS and (b) GeSe computed using various schemes of
CRYSTAL03 code as discussed in text. Solid lines are drawn to guide the eyes.
Table 5
Experimental isotropic Compton profiles of GeS and GeSe
pz (a.u.) J(pz) (e/a.u.)
GeS GeSe
0.0 10.28670.020 12.22570.026
0.1 10.224 12.166
0.2 10.079 12.024
0.3 9.817 11.780
0.4 9.458 11.325
0.5 9.015 10.784
0.6 8.469 10.163
0.7 7.897 9.596
0.8 7.307 9.029
1.0 6.15570.013 7.84270.0172
1.2 5.256 6.867
1.4 4.642 6.187
1.6 4.224 5.766
1.8 3.936 5.453
2.0 3.63770.009 5.13170.013
3.0 2.43770.006 3.57570.009
4.0 1.62670.005 2.37470.007
5.0 1.08470.003 1.63170.005
6.0 0.79370.002 1.15970.004
7.0 0.58770.002 0.90970.003
The statistical error (7s) is given for a few points.0
-0.4
0.0
0.4
0.8
pz (in a.u.)
-0.4
0.0
0.4
0.8 HFDFT-LDADFT-GGAB3LYPPP-HF
Ι Error
ΔJ (T
heor
y - E
xpt.)
(in
e/a.
u.)
1 2 3 4 5 6 7
Fig. 7. Difference profiles between the isotropic experiment and the
convoluted theoretical (spherically averaged) profiles for (a) GeS and
(b) GeSe. Solid lines are drawn to guide the eyes.
A. Rathor et al. / Radiation Physics and Chemistry 77 (2008) 391–400398
profiles are very useful in predicting the nature of bondingin isovalent compounds (see, for example, Reed andEisenberger, 1972; Joshi et al., 1999). Fig. 8 shows the
ARTICLE IN PRESS
0.0
0
2
4
6
J(p z
)∗ pF
(in e
- )
pz/pF
GeSGeSe
0
2
4
6
0
2
4
6
0.5 1.0 1.5 2.0
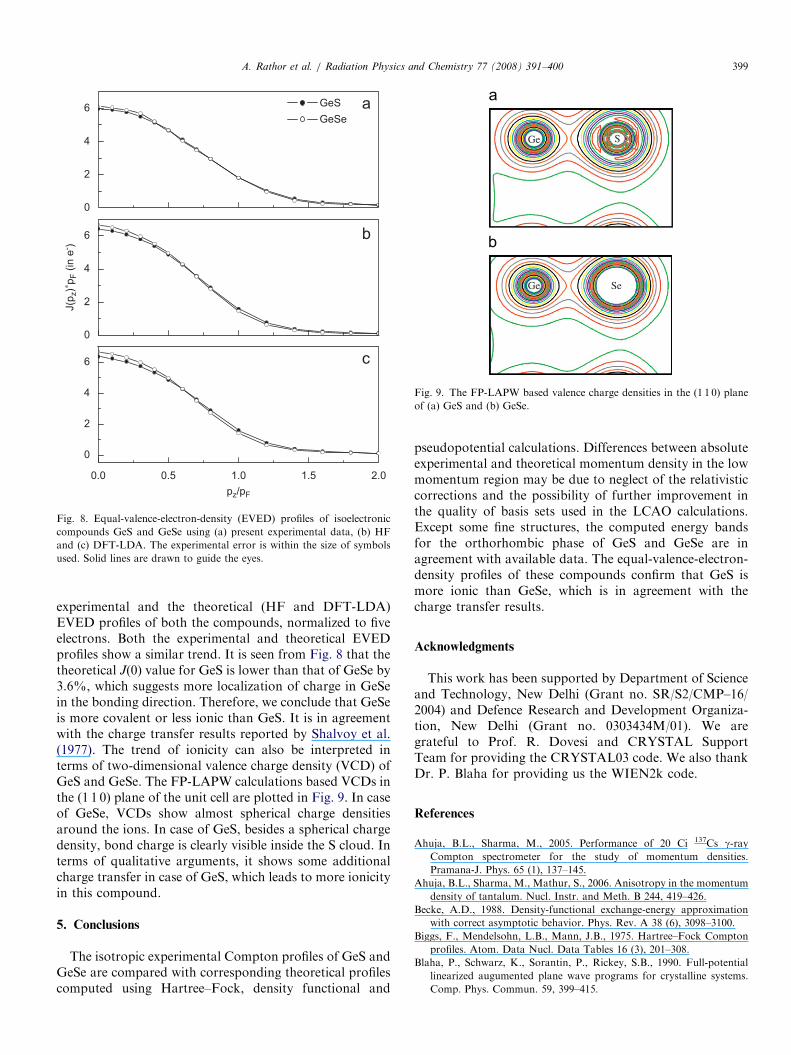
Fig. 8. Equal-valence-electron-density (EVED) profiles of isoelectronic
compounds GeS and GeSe using (a) present experimental data, (b) HF
and (c) DFT-LDA. The experimental error is within the size of symbols
used. Solid lines are drawn to guide the eyes.
Ge S
Ge Se
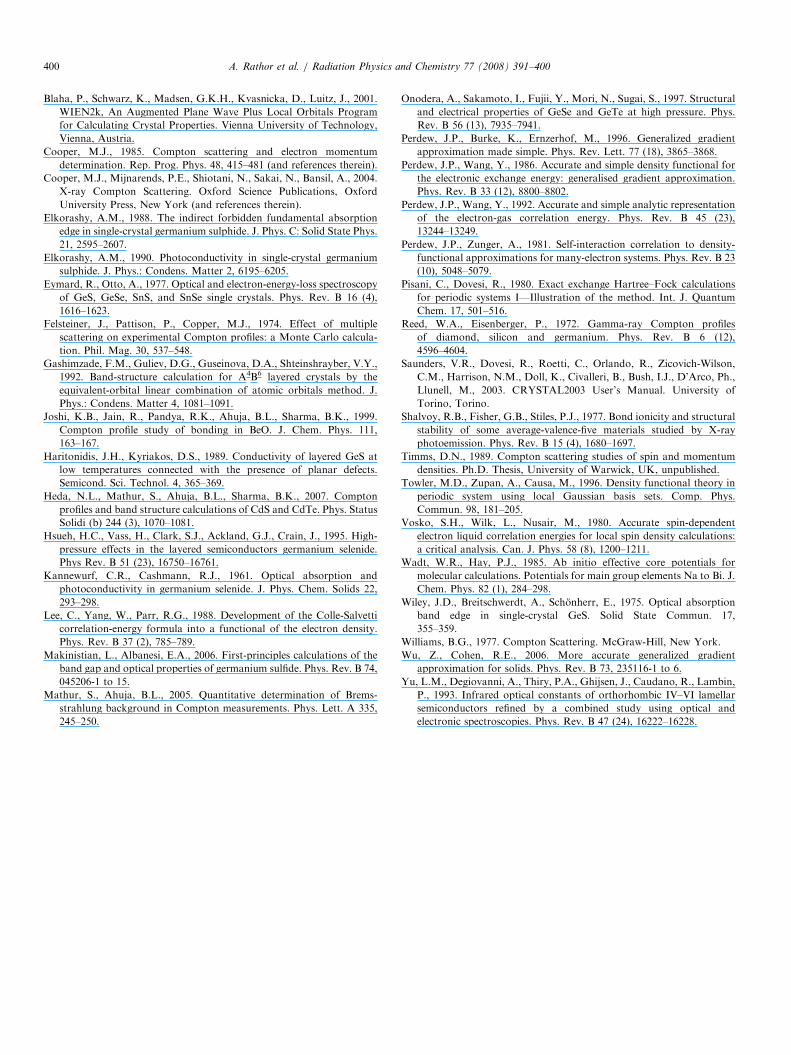
Fig. 9. The FP-LAPW based valence charge densities in the (1 1 0) plane
of (a) GeS and (b) GeSe.
A. Rathor et al. / Radiation Physics and Chemistry 77 (2008) 391–400 399
experimental and the theoretical (HF and DFT-LDA)EVED profiles of both the compounds, normalized to fiveelectrons. Both the experimental and theoretical EVEDprofiles show a similar trend. It is seen from Fig. 8 that thetheoretical J(0) value for GeS is lower than that of GeSe by3.6%, which suggests more localization of charge in GeSein the bonding direction. Therefore, we conclude that GeSeis more covalent or less ionic than GeS. It is in agreementwith the charge transfer results reported by Shalvoy et al.(1977). The trend of ionicity can also be interpreted interms of two-dimensional valence charge density (VCD) ofGeS and GeSe. The FP-LAPW calculations based VCDs inthe (1 1 0) plane of the unit cell are plotted in Fig. 9. In caseof GeSe, VCDs show almost spherical charge densitiesaround the ions. In case of GeS, besides a spherical chargedensity, bond charge is clearly visible inside the S cloud. Interms of qualitative arguments, it shows some additionalcharge transfer in case of GeS, which leads to more ionicityin this compound.
5. Conclusions
The isotropic experimental Compton profiles of GeS andGeSe are compared with corresponding theoretical profilescomputed using Hartree–Fock, density functional and
pseudopotential calculations. Differences between absoluteexperimental and theoretical momentum density in the lowmomentum region may be due to neglect of the relativisticcorrections and the possibility of further improvement inthe quality of basis sets used in the LCAO calculations.Except some fine structures, the computed energy bandsfor the orthorhombic phase of GeS and GeSe are inagreement with available data. The equal-valence-electron-density profiles of these compounds confirm that GeS ismore ionic than GeSe, which is in agreement with thecharge transfer results.
Acknowledgments
This work has been supported by Department of Scienceand Technology, New Delhi (Grant no. SR/S2/CMP–16/2004) and Defence Research and Development Organiza-tion, New Delhi (Grant no. 0303434M/01). We aregrateful to Prof. R. Dovesi and CRYSTAL SupportTeam for providing the CRYSTAL03 code. We also thankDr. P. Blaha for providing us the WIEN2k code.
References
Ahuja, B.L., Sharma, M., 2005. Performance of 20 Ci 137Cs g-rayCompton spectrometer for the study of momentum densities.
Pramana-J. Phys. 65 (1), 137–145.
Ahuja, B.L., Sharma, M., Mathur, S., 2006. Anisotropy in the momentum
density of tantalum. Nucl. Instr. and Meth. B 244, 419–426.
Becke, A.D., 1988. Density-functional exchange-energy approximation
with correct asymptotic behavior. Phys. Rev. A 38 (6), 3098–3100.
Biggs, F., Mendelsohn, L.B., Mann, J.B., 1975. Hartree–Fock Compton
profiles. Atom. Data Nucl. Data Tables 16 (3), 201–308.
Blaha, P., Schwarz, K., Sorantin, P., Rickey, S.B., 1990. Full-potential
linearized augumented plane wave programs for crystalline systems.
Comp. Phys. Commun. 59, 399–415.
ARTICLE IN PRESSA. Rathor et al. / Radiation Physics and Chemistry 77 (2008) 391–400400
Blaha, P., Schwarz, K., Madsen, G.K.H., Kvasnicka, D., Luitz, J., 2001.
WIEN2k, An Augmented Plane Wave Plus Local Orbitals Program
for Calculating Crystal Properties. Vienna University of Technology,
Vienna, Austria.
Cooper, M.J., 1985. Compton scattering and electron momentum
determination. Rep. Prog. Phys. 48, 415–481 (and references therein).
Cooper, M.J., Mijnarends, P.E., Shiotani, N., Sakai, N., Bansil, A., 2004.
X-ray Compton Scattering. Oxford Science Publications, Oxford
University Press, New York (and references therein).
Elkorashy, A.M., 1988. The indirect forbidden fundamental absorption
edge in single-crystal germanium sulphide. J. Phys. C: Solid State Phys.
21, 2595–2607.
Elkorashy, A.M., 1990. Photoconductivity in single-crystal germanium
sulphide. J. Phys.: Condens. Matter 2, 6195–6205.
Eymard, R., Otto, A., 1977. Optical and electron-energy-loss spectroscopy
of GeS, GeSe, SnS, and SnSe single crystals. Phys. Rev. B 16 (4),
1616–1623.
Felsteiner, J., Pattison, P., Copper, M.J., 1974. Effect of multiple
scattering on experimental Compton profiles: a Monte Carlo calcula-
tion. Phil. Mag. 30, 537–548.
Gashimzade, F.M., Guliev, D.G., Guseinova, D.A., Shteinshrayber, V.Y.,
1992. Band-structure calculation for A4B6 layered crystals by the
equivalent-orbital linear combination of atomic orbitals method. J.
Phys.: Condens. Matter 4, 1081–1091.
Joshi, K.B., Jain, R., Pandya, R.K., Ahuja, B.L., Sharma, B.K., 1999.
Compton profile study of bonding in BeO. J. Chem. Phys. 111,
163–167.
Haritonidis, J.H., Kyriakos, D.S., 1989. Conductivity of layered GeS at
low temperatures connected with the presence of planar defects.
Semicond. Sci. Technol. 4, 365–369.
Heda, N.L., Mathur, S., Ahuja, B.L., Sharma, B.K., 2007. Compton
profiles and band structure calculations of CdS and CdTe. Phys. Status
Solidi (b) 244 (3), 1070–1081.
Hsueh, H.C., Vass, H., Clark, S.J., Ackland, G.J., Crain, J., 1995. High-
pressure effects in the layered semiconductors germanium selenide.
Phys Rev. B 51 (23), 16750–16761.
Kannewurf, C.R., Cashmann, R.J., 1961. Optical absorption and
photoconductivity in germanium selenide. J. Phys. Chem. Solids 22,
293–298.
Lee, C., Yang, W., Parr, R.G., 1988. Development of the Colle-Salvetti
correlation-energy formula into a functional of the electron density.
Phys. Rev. B 37 (2), 785–789.
Makinistian, L., Albanesi, E.A., 2006. First-principles calculations of the
band gap and optical properties of germanium sulfide. Phys. Rev. B 74,
045206-1 to 15.
Mathur, S., Ahuja, B.L., 2005. Quantitative determination of Brems-
strahlung background in Compton measurements. Phys. Lett. A 335,
245–250.
Onodera, A., Sakamoto, I., Fujii, Y., Mori, N., Sugai, S., 1997. Structural
and electrical properties of GeSe and GeTe at high pressure. Phys.
Rev. B 56 (13), 7935–7941.
Perdew, J.P., Burke, K., Ernzerhof, M., 1996. Generalized gradient
approximation made simple. Phys. Rev. Lett. 77 (18), 3865–3868.
Perdew, J.P., Wang, Y., 1986. Accurate and simple density functional for
the electronic exchange energy: generalised gradient approximation.
Phys. Rev. B 33 (12), 8800–8802.
Perdew, J.P., Wang, Y., 1992. Accurate and simple analytic representation
of the electron-gas correlation energy. Phys. Rev. B 45 (23),
13244–13249.
Perdew, J.P., Zunger, A., 1981. Self-interaction correlation to density-
functional approximations for many-electron systems. Phys. Rev. B 23
(10), 5048–5079.
Pisani, C., Dovesi, R., 1980. Exact exchange Hartree–Fock calculations
for periodic systems I—Illustration of the method. Int. J. Quantum
Chem. 17, 501–516.
Reed, W.A., Eisenberger, P., 1972. Gamma-ray Compton profiles
of diamond, silicon and germanium. Phys. Rev. B 6 (12),
4596–4604.
Saunders, V.R., Dovesi, R., Roetti, C., Orlando, R., Zicovich-Wilson,
C.M., Harrison, N.M., Doll, K., Civalleri, B., Bush, I.J., D’Arco, Ph.,
Llunell, M., 2003. CRYSTAL2003 User’s Manual. University of
Torino, Torino.
Shalvoy, R.B., Fisher, G.B., Stiles, P.J., 1977. Bond ionicity and structural
stability of some average-valence-five materials studied by X-ray
photoemission. Phys. Rev. B 15 (4), 1680–1697.
Timms, D.N., 1989. Compton scattering studies of spin and momentum
densities. Ph.D. Thesis, University of Warwick, UK, unpublished.
Towler, M.D., Zupan, A., Causa, M., 1996. Density functional theory in
periodic system using local Gaussian basis sets. Comp. Phys.
Commun. 98, 181–205.
Vosko, S.H., Wilk, L., Nusair, M., 1980. Accurate spin-dependent
electron liquid correlation energies for local spin density calculations:
a critical analysis. Can. J. Phys. 58 (8), 1200–1211.
Wadt, W.R., Hay, P.J., 1985. Ab initio effective core potentials for
molecular calculations. Potentials for main group elements Na to Bi. J.
Chem. Phys. 82 (1), 284–298.
Wiley, J.D., Breitschwerdt, A., Schonherr, E., 1975. Optical absorption
band edge in single-crystal GeS. Solid State Commun. 17,
355–359.
Williams, B.G., 1977. Compton Scattering. McGraw-Hill, New York.
Wu, Z., Cohen, R.E., 2006. More accurate generalized gradient
approximation for solids. Phys. Rev. B 73, 235116-1 to 6.
Yu, L.M., Degiovanni, A., Thiry, P.A., Ghijsen, J., Caudano, R., Lambin,
P., 1993. Infrared optical constants of orthorhombic IV–VI lamellar
semiconductors refined by a combined study using optical and
electronic spectroscopies. Phys. Rev. B 47 (24), 16222–16228.