A Comparison of Support Vector Machines and Partial Least Squares regression on spectral data
Upload
independentCategory
view
4download
0
This article was downloaded by: [190.121.135.178]On: 21 March 2014, At: 06:01Publisher: Taylor & FrancisInforma Ltd Registered in England and Wales Registered Number: 1072954 Registered office: MortimerHouse, 37-41 Mortimer Street, London W1T 3JH, UK
Journal of Nuclear Science and TechnologyPublication details, including instructions for authors and subscription information:http://www.tandfonline.com/loi/tnst20
Photoneutron Cross Sections for Au Revisited:Measurements with Laser Compton Scattering γ-Raysand Data Reduction by a Least-Squares MethodOsamu ITOH a , Hiroaki UTSUNOMIYA a , Hidetoshi AKIMUNE a , Takeo KONDO a , MasakiKAMATA a , Tamio YAMAGATA a , Hiroyuki TOYOKAWA b , Hideo HARADA c , FumitoKITATANI c , Shinji GOKO c , Chithra NAIR d & Yiu-Wing LUI ea Department of Physics , Konan University , 8-9-1 Okamoto, Higashinada , Kobe ,658-8501 , Japanb National Institute of Advanced Industrial Science and Technology , Tsukuba , Ibaraki ,305-8568 , Japanc Japan Atomic Energy Agency, Tokai-mura, Naka , Ibaraki , 319-1195 , Japand Institut für Strahlenphysik, Forschungszentrum Dresden-Rossendorf , D-01314 ,Dresden , Germanye Cyclotron Institute, Texas A&M University , College Station , Texas , 77843 , USAPublished online: 05 Jan 2012.
To cite this article: Osamu ITOH , Hiroaki UTSUNOMIYA , Hidetoshi AKIMUNE , Takeo KONDO , Masaki KAMATA , TamioYAMAGATA , Hiroyuki TOYOKAWA , Hideo HARADA , Fumito KITATANI , Shinji GOKO , Chithra NAIR & Yiu-Wing LUI (2011)Photoneutron Cross Sections for Au Revisited: Measurements with Laser Compton Scattering γ-Rays and Data Reduction bya Least-Squares Method, Journal of Nuclear Science and Technology, 48:5, 834-840
To link to this article: http://dx.doi.org/10.1080/18811248.2011.9711766
PLEASE SCROLL DOWN FOR ARTICLE
Taylor & Francis makes every effort to ensure the accuracy of all the information (the “Content”) containedin the publications on our platform. However, Taylor & Francis, our agents, and our licensors make norepresentations or warranties whatsoever as to the accuracy, completeness, or suitability for any purpose ofthe Content. Any opinions and views expressed in this publication are the opinions and views of the authors,and are not the views of or endorsed by Taylor & Francis. The accuracy of the Content should not be reliedupon and should be independently verified with primary sources of information. Taylor and Francis shallnot be liable for any losses, actions, claims, proceedings, demands, costs, expenses, damages, and otherliabilities whatsoever or howsoever caused arising directly or indirectly in connection with, in relation to orarising out of the use of the Content.
This article may be used for research, teaching, and private study purposes. Any substantial or systematicreproduction, redistribution, reselling, loan, sub-licensing, systematic supply, or distribution in anyform to anyone is expressly forbidden. Terms & Conditions of access and use can be found at http://www.tandfonline.com/page/terms-and-conditions

Photoneutron Cross Sections for Au Revisited:
Measurements with Laser Compton Scattering �-Rays
and Data Reduction by a Least-Squares Method
Osamu ITOH1, Hiroaki UTSUNOMIYA1;�, Hidetoshi AKIMUNE1, Takeo KONDO1,Masaki KAMATA1, Tamio YAMAGATA1, Hiroyuki TOYOKAWA2, Hideo HARADA3,
Fumito KITATANI3, Shinji GOKO3, Chithra NAIR4 and Yiu-Wing LUI5
1Department of Physics, Konan University, 8-9-1 Okamoto, Higashinada, Kobe 658-8501, Japan2National Institute of Advanced Industrial Science and Technology, Tsukuba, Ibaraki 305-8568, Japan
3Japan Atomic Energy Agency, Tokai-mura, Naka, Ibaraki 319-1195, Japan4Institut fur Strahlenphysik, Forschungszentrum Dresden-Rossendorf, D-01314 Dresden, Germany
5Cyclotron Institute, Texas A&M University, College Station, Texas 77843, USA
(Received August 11, 2010 and accepted in revised form December 3, 2010)
Photoneutron cross section measurements were made for Au in the entire energy range of the (�,n)channel based on a direct neutron counting with quasi-monochromatic �-rays produced in inverseCompton scattering of laser photons with relativistic electrons. The data were analyzed by a least-squaresmethod to deduce photoneutron cross sections. The analysis significantly reduced experimental uncer-tainties compared with those resulting from the photon difference method. The result is compared with theprevious data by direct neutron counting with �-rays produced in positron annihilation in flight and byphotoactivation with bremsstrahlung. The present data are in good agreement with the previous data nearthe neutron threshold, while there remain some discrepancies between the present and the previous dataabove 10 MeV.
KEYWORDS: ð�; nÞ cross sections, Au, laser Compton-scattering �-rays, direct neutron counting
I. Introduction
Photoneutron cross sections were actively measured innuclear physics in the 1960s to 1980s in the study of giantdipole resonance (GDR).1) Currently the GDR data arewell documented and available at web sites.2,3) Technically,quasi-monochromatic �-rays produced in positron annihila-tion in flight (PAIF) at two major research institutes, theSaclay and the Lawrence Livermore National Laboratory(LLNL), contributed to the photoreaction study on GDR.4)
Photonuclear reaction study in the low-energy region hasbeen revived in the 2000s in conjunction with the study ofthe nucleosynthetic origin of elements in nuclear astrophy-sics5,6) and the development of a new �-ray source referredto as laser Compton scattering (LCS) �-rays.7)
Photoneutron cross sections for Au are regarded as one ofthe most fundamental data in nuclear physics cited in theclassical literature.8) The cross section was measured withthe PAIF �-rays at LLNL and Saclay.9–11) Direct neutroncounting was carried out with a neutron detector consistingof BF3 counters embedded in a paraffin moderator atLLNL9,11) and with a Ga-doped liquid scintillator at
Saclay.10) While the data show rather good agreement nearthe neutron threshold, they show serious discrepancies above10 MeV toward the peak of GDR (see Ref. 11) for commentson the discrepancy). Photoneutron cross sections near theneutron threshold are also used as a standard for photoacti-vation measurements in the study of the p-process nucleo-synthesis.12) Photoactivation technique with bremsstrahlungphotons has been used to study the 197Au(�,n) reaction nearthe threshold.12) The photoactivation data are consistent withthe direct neutron counting data. Recently, photoactivationmeasurements for Au have been extended from the thresholdto the peak energy region of GDR.13)
Photoneutron cross sections for Au were previously meas-ured as reference data for determining 152Sm(�,n) crosssections with LCS �-rays at the National Institute of Ad-vanced Industrial Science and Technology (AIST).14) How-ever, a data reduction by the photon difference method hasended up with large uncertainties. The photon differencemethod is ideally based on ‘‘similitude’’ in spectral shape,that is, the LCS �-ray beams with two different end-pointenergies have low-energy tails with the same slope. (Fig. 5of Ref. 14)). The large experimental uncertainties essentiallyrepresent the statistical uncertainty associated with the sub-traction of a properly normalized spectrum from the other.A safe subtraction was made, taking nonsimilitude in the
� 2011 Atomic Energy Society of Japan, All Rights Reserved.
�Corresponding author, E-mail: [email protected]
Journal of NUCLEAR SCIENCE and TECHNOLOGY, Vol. 48, No. 5, p. 834–840 (2011)
834
ARTICLE
Dow
nloa
ded
by [
190.
121.
135.
178]
at 0
6:01
21
Mar
ch 2
014

spectral shape into account. As a result, it introduced largeuncertainties into the normalization factor a in Eq. (6) ofRef. 14). Furthermore, a large number of neutrons weresubtracted from another large number, leaving relativelysmall neutron events in a narrow energy bin. This subtrac-tion introduced additional uncertainties into the factor g inEq. (5) of Ref. 14).
This paper presents results of independent measurementsof (�,n) cross section for Au carried out with LCS �-raybeams at AIST. A least-squares method was employed indata reduction to provide photoneutron cross sections atthirty energies of the LCS �-ray beam from the (�,n) thresh-old up to close to the (�,2n) threshold. This method deter-mines energy-averaged cross sections with a best-fit functionfor photoneutron cross sections and has been used for116;117Sn and 96Zr.15,16) A similar least-squares method wasalso used in the measurement of photoneutron cross sectionsfor 80Se and 197Au.17) Experimental details are given inSec. II. The data reduction method and the resultant photo-neutron cross sections for Au are presented in Sec. IIIfollowed by a discussion in Sec. IV. A summary is givenin Sec. V.
II. Experiment
Two separate measurements were carried out with LCS �-ray beams at AIST. The first measurement focused on alower-energy region of 8.15–11.01 MeV starting from the(�,n) threshold at 8.072 MeV, while the second measurementcovered a higher-energy region of 10.10–14.50 MeV endingat the (�,2n) threshold at 14.714 MeV. The quoted energiesstand for the maximum energies of the LCS �-ray beams.The experimental procedure of the two measurements wasthe same as described in Refs. 6), 15), and 18) except forthree aspects, namely, target thickness, laser wavelength,and determination of the energy distribution of the LCS �-ray beam.
1. Laser Compton Scattering �-Ray BeamQuasi-monochromatic �-ray beams were produced at
AIST in inverse Compton scattering between laser photonsfrom a high-power Nd:YVO4 Q-switch laser operated at20 kHz and relativistic electrons accumulated in the storagering TERAS (Tsukuba Electron Ring for Acceleration andStorage). The laser produced 1,064 nm photons in the fun-damental harmonics at 40 W in the first measurement, whileit produced 532 nm photons with a frequency-doubler mod-ule at 24 W in the second measurement. The LCS �-raybeam had a macro time structure, 80 ms beam-on and20 ms beam-off, that was made by applying an externalTTL trigger gate to the laser system. The electron beamenergy was changed from 679.8 to 790.9 MeV to tune themaximum energy of LCS �-ray beams in the first measure-ment; it was changed from 537.0 to 644.6 MeV in the secondmeasurement.
Laser Compton scattering �-rays were collimated into apencil-like beam of 2 mm diameter with a 20-cm-thick leadcollimator. A high-purity Ge detector (HPGe) with 120%efficiency was used to measure energy spectra of the LCS �-
ray beam in the first measurement, which was performed asa collaboration between Konan University and AIST. Theenergy spectra of the LCS �-ray beam measured with theHPGe detector were simulated with the Monte Carlo codeEGS4.19) The energy distribution of the LCS �-ray beamwas deduced so as to best reproduce the experimental re-sponse of the HPGe detector.6) In the second measurement,the high-resolution high-energy photon spectrometer(HHS),20,21) which consists of twin high-purity Ge crystalscovered by segmented BGO scintillators, was employed incollaboration with the Japan Atomic Energy Agency. Theresponse function of the HHS was measured with calibratedstandard �-ray sources (60Co, 137Cs) and 10.763 MeV �-raysproduced in the 27Al + p reaction at 1,012 keV22) and wellinvestigated by taking into account the surface channeleffect.23) Energy spectra measured with the HHS were un-folded with the known response function to determine theenergy distribution of the LCS �-ray beam. Figure 1 showsan experimental pulse-height spectrum of the LCS �-raybeam measured with HHS (dotted line) and the unfoldedenergy spectrum (solid line). The energy resolution of HHSis 12 keV (0.13%) in full width at half maximum for9.04 MeV �-rays.24)
The LCS �-ray beam was monitored with a large-volume(8 in. in diameter and 12 in. in length) NaI(Tl) detectorduring neutron measurement runs. Figures 2 and 3 show atypical pile-up spectrum obtained at a full laser power anda single-photon spectrum obtained at a reduced power,respectively. The number of LCS �-rays (NM
� ) incident onthe NaI(Tl) detector was deduced as
NM� ¼
Xi
nixi
!pile-upX
i
nixi
�Xi
ni
!single
; ð1Þ
Fig. 1 Energy spectrum of an LCS �-ray beam measured with thehigh-resolution high-energy photon spectrometer HHS (dottedline) and its unfolded energy distribution (solid line)
Photoneutron Cross Sections for Au Revisited: Measurements with Laser Compton Scattering �-Rays and Data Reduction 835
VOL. 48, NO. 5, MAY 2011
Dow
nloa
ded
by [
190.
121.
135.
178]
at 0
6:01
21
Mar
ch 2
014

where ni is the number of counts, xi is the channel number,and the subscripts ‘‘pile-up’’ and ‘‘single’’ stand for thequantities for the pile-up and single-photon spectra, respec-tively. The denominator is the average channel number ofthe single-photon spectrum. The numerator represents theaverage channel number of the pile-up spectrumðP
i nixi=P
i niÞpile-up multiplied by the number of �-raybeam pulses ð
Pi niÞpile-up. Thus, Eq. (1) gives the average
number of photons per �-ray beam pulse times the numberof beam pulses, which is equal to the total number of LCS�-rays.
2. Au TargetTwo disks of 197Au refined to 99.95% with a diameter
of 20 mm were used. The thicknesses of the targets usedin the first measurement of smaller cross sections in thelow-energy region and the second measurement of larger
cross sections in the high-energy region were 4 and 2 mm,respectively. The uncertainty of thickness was estimated tobe 10 mm.
3. Neutron DetectionA high-efficiency 4� triple-ring neutron detector was used
(see, for example, Fig. 4 of Ref. 14)). The detector consistsof three concentric rings (Ring1, Ring2, and Ring3) of a totalof twenty 3He proportional counters embedded in a36� 36� 50 cm3 neutron moderator made of polyethylenethat was fully covered by additional 5-cm-thick polyethyleneplates with 1-mm-thick cadmium metal for background neu-tron suppression; Ring1, Ring2, and Ring3 of four, eight,and eight 3He proportional counters were located at thedistances of 3.8, 7.0, and 10.0 cm from the �-ray beam axis,respectively. The Au targets were placed at the center of thepolyethylene moderator. Neutrons were detected for a rela-tively short period of time, 10–18 min, in all runs. Typicalcounting statistics is a few percent except at the two lowestenergies immediately above the neutron threshold. Back-ground neutrons were measured during the period of 20 msbeam-off.
The neutron detector was designed to achieve a high totalefficiency of detecting neutrons in the energy range below1 MeV with a capability of deducing the average neutronenergy by the so-called ring ratio technique.4) Figure 4shows results of an MCNP25) Monte Carlo simulation ofthe efficiencies of Ring1, Ring2, and Ring3, and the sum(total) efficiency as a function of the neutron energy. Theefficiencies were measured with a 252Cf source that wascalibrated at the National Metrology Institute of Japan inAIST. The measured efficiencies (open circles) are wellreproduced by the MCNP simulation (filled triangles).
Fig. 2 Pile-up energy spectrum of a pulsed LCS �-ray beammeasured with an 800 � 1200 NaI(Tl) detector
Fig. 3 Single-photon spectrum of a pulsed LCS �-ray beam meas-ured with an 800 � 1200 NaI(Tl) detector. The LCS �-ray beamwas produced at a reduced laser power.
Fig. 4 Neutron detection efficiencies of Ring1 of 4 (solid curve),Ring2 of 8 (dashed curve), and Ring3 of 8 (dotted curve) 3Heproportional counters embedded in a polyethylene neutron mod-erator and the total efficiency. Results of the detection efficiencymeasurement with a 252Cf neutron source are shown by opencircles in comparison with MCNP Monte Carlo simulations(filled triangles).
836 O. ITOH et al.
JOURNAL OF NUCLEAR SCIENCE AND TECHNOLOGY
Dow
nloa
ded
by [
190.
121.
135.
178]
at 0
6:01
21
Mar
ch 2
014

The ring ratio technique that makes use of a neutronenergy dependence of the ring ratio was originally developedby Berman et al.4) Figure 5 shows the results of the MCNPsimulation of the ring ratios as a function of neutron energy.The triple-ring detector has an improved performance for thering ratio technique because of the use of three combinationsof experimental ring ratios, r1 = Ring1/Ring2, r2 = Ring2/Ring3, and r3 = Ring1/Ring3. However, this techniqueis not practical immediately above the neutron thresholdbecause of poor neutron counting statistics. Therefore,the average neutron energy was uniquely determined fromEn ¼ 196
197ð �EE� � SnÞ with the average �-ray energy �EE� and
Sn ¼ 8:072 MeV in the two lowest-energy runs. Note thatthe maximum energy of the LCS �-ray beam in these runsdid not exceed Sn þ Ex, where Ex is the excitation energy(84.66 keV) of the first excited state in the residual nucleus(196Au). The average neutron energy in all the other runswas experimentally determined by the ring ratio technique.Neutron energies corresponding to the three ring ratios wereaveraged with a weight factor proportional to an inverse ofthe statistical uncertainty of the ring ratio. The weighted-average energies deduced were below 1.1 MeV and thetotal detection efficiency in the relevant energy region was59–74%.
III. Data Reduction and Result
The experimental formula for the photoneutron crosssection is given byZ Emax
Sn
n�ðEÞ�ðEÞdE ¼Nn
N�Nt�"n; ð2Þ
where n�ðEÞ is the energy distribution of the LCS �-raybeam normalized to unity in the energy region of the inte-gration, �ðEÞ is the photoneutron cross section, Nn is thenumber of neutrons detected, Nt is the number of target
nuclei per unit area, N� is the number of �-rays incidenton the target with energies above the neutron threshold, "n isthe neutron detection efficiency, and � is a correction factorfor a thick-target measurement, which is given by � ¼ ð1�e��tÞ=�t with the linear attenuation coefficient of photons inthe target material �26) and the thickness of the target t. N� isdeduced from NM
� (Eq. (1)) with a correction for attenuationof the �-ray flux in the target material, NM
� ¼ N�e��t.
The cross section in the monochromatic approximationis deduced by putting a �ðE � EoÞ function into n�ðEÞ. Bychoosing the average energy of the LCS �-ray beam as Eo,photoneutron cross sections are deduced at the averageenergy in the monochromatic approximation by
�monoðEoÞ ¼Nn
N�Nt�"n: ð3Þ
Thus, we refer to the quantity on the right-hand side ofEq. (3) as the monochromatic cross section. However,because of the energy spread of the LCS �-ray beam (seeFig. 1), the monochromatic approximation cannot be usedto determine photoneutron cross sections.
The energy spread of the LCS �-ray beam was correctedby a least-squares method. Let us introduce an empiricalfunction of the cross section �ðEÞ to be used in the fittingprocedure. The GDR cross section is expressed using theLorentzian function except in the vicinity of the neutronthreshold, namely,
�ðEÞ ¼�m
1þðE2 � E2
RÞ2
E2� 2
: ð4Þ
Here, �m is peak cross section, ER is resonance energy, and� is width of GDR. This expression is known, however,to overestimate cross sections near the neutron threshold.Reaction cross sections near the threshold are well investi-gated.27,28) The threshold behavior of photoneutron crosssections can be expressed as,
�ðEÞ ¼ �o
E � Sn
Sn
� �p
: ð5Þ
Incorporating the threshold behavior in the Lorentzian func-tion, we use the following formula for photoneutron crosssections over the relevant energy range from the (�,n)threshold at 8.072 MeV up to the (�,2n) threshold at14.71 MeV:
�ðEÞ ¼ �o
E � Sn
Sn
� �p 1
1þðE2 � E2
RÞ2
E2� 2
: ð6Þ
This formulation of an empirical single-fitting function,which terminates the Lorentzian function at the neutronthreshold, allows a consistent analysis of all the data in aleast-squares analysis with �o, p, ER, and � being fittingparameters. We remark that (�,n) cross sections for Au wereparametrized differently in Ref. 12); namely, Eq. (5), the3rd-order polynomial function, and the Lorentzian functionEq. (4) were used in low-, middle-, and high-energy regions,respectively. Although the separate parametrization may beconvenient for discussing the threshold behavior and the
Fig. 5 MCNP Monte Carlo simulations of three ratios in neutronyield measured with Ring1, Ring2, and Ring3 of 4, 8, and 8 3Heproportional counters, respectively, embedded in a polyethyleneneutron moderator
Photoneutron Cross Sections for Au Revisited: Measurements with Laser Compton Scattering �-Rays and Data Reduction 837
VOL. 48, NO. 5, MAY 2011
Dow
nloa
ded
by [
190.
121.
135.
178]
at 0
6:01
21
Mar
ch 2
014

GDR resonance parameters individually, obviously, thethree functions are not smoothly connected to each otherwith the same value of their first derivatives.
There are 30 sets of experimental quantities, the normal-ized energy distribution of the LCS �-ray beam, n�ðEÞ onthe left-hand side of Eq. (2), and Nn
N�Nt�"non the right-hand
side of Eq. (2), which is the monochromatic cross section,�monoðEoÞ, in Eq. (3). We made a least-squares fit to the30 sets of experimental quantities, n�ðEÞ and the right-handside of Eq. (2) (�monoðEoÞ in Eq. (3)) with the fitting func-tion Eq. (6). The best-fit parameters are given in Table 1.The best-fit function and the monochromatic cross sectionsare shown by the solid line and open squares in Fig. 6,respectively. Also shown in Fig. 6 is the best-fit function(dashed line) for the monochromatic cross sections in theform of Eq. (6). The experimental cross sections corre-sponding to the best-fit function were obtained as the mono-chromatic cross sections times the ratio of the solid lineto the dashed line. The cross sections thus resulting fromthe least-squares analysis are shown by the solid circles inFig. 6.
The photoneutron cross sections for Au are listed inTable 2. The statistical uncertainty represents countingstatistics including the error propagation in the subtractionof the background neutrons detected during the 20 ms beam-off. The systematic uncertainty stemmed from the numberof incident �-rays and the neutron detection efficiency. Theestimate of the number of incident �-rays depends on thelinearity of the response of the �-ray monitor detector topile-up �-rays. The uncertainty was estimated to be 3% inthe statistical analysis of the pile-up spectra in Ref. 29). Theuncertainty of the neutron detection efficiency is attributed tothat (3.2%) of the absolute emission rate of the 252Cf neutronsource used. By summing the uncertainties of the incident�-ray flux (3%) and the neutron detection efficiency (3.2%)quadratically, the overall systematic uncertainty was esti-mated to be 4.4%. The time variation of the energy distri-bution of the LCS �-ray beam during the present short runtime was negligible.
The present measurement covered cross sections foldedwith the energy distribution of the LCS �-ray beams withmaximum energies up to 14.50 MeV (see Eq. (2)), which isabove the peak of GDR but below the (�,2n) thresholdenergy of 14.71 MeV. Thus, the best-fit curve is valid upto 14.50 MeV.
Table 1 Best-fit parameters in the least-squares analysis of thepresent (�; n) cross sections for 197Au with the formula Eq. (6).These parameters are valid in the energy region from the thresh-old energy of 8.072 MeV up to 14.50 MeV.
�o
(mb)p
ER
(MeV)�
(MeV)
549 0.107 13.49 3.70
Fig. 6 Results of the present measurement of (�,n) cross sectionsfor 197Au (solid circles) along with those obtained in the mono-chromatic approximation (open squares). The data are shown atthe average energies of the LCS �-ray beam. The solid linestands for the best-fit function in the form of Eq. (6) obtainedin the present least-squares analysis, while the dashed line standsfor the best-fit function for the cross sections obtained in themonochromatic approximation.
Table 2 Present (�,n) cross sections for 197Au as a function of theaverage energy of the LCS �-ray beam along with the statistical(��stat) and systematic (��syst) uncertainties
E�(MeV)
�(mb)
��stat
(mb)��syst
(mb)
8.08 16.55 9.48 0.738.09 12.83 2.59 0.568.25 27.47 0.52 1.218.42 34.51 0.47 1.528.60 35.55 0.38 1.568.75 38.31 1.90 1.698.88 41.33 0.42 1.828.94 43.23 0.38 1.909.01 44.83 0.49 1.979.10 47.62 0.44 2.109.10 45.23 1.81 1.999.15 48.34 0.58 2.139.22 51.01 0.59 2.249.36 51.09 0.99 2.259.42 57.39 1.59 2.529.53 65.75 1.10 2.899.64 60.14 1.78 2.659.81 69.57 1.08 3.06
10.01 70.20 1.21 3.0910.35 90.31 1.85 3.9710.55 104.74 1.47 4.6110.97 155.06 2.06 6.8211.38 201.49 2.24 8.8711.75 253.32 2.60 11.1511.89 266.40 1.79 11.7212.11 309.49 2.14 13.6212.42 368.63 2.10 16.2212.68 419.92 2.37 18.4812.88 457.10 2.58 20.1113.14 506.72 2.75 22.30
838 O. ITOH et al.
JOURNAL OF NUCLEAR SCIENCE AND TECHNOLOGY
Dow
nloa
ded
by [
190.
121.
135.
178]
at 0
6:01
21
Mar
ch 2
014
IV. Discussion
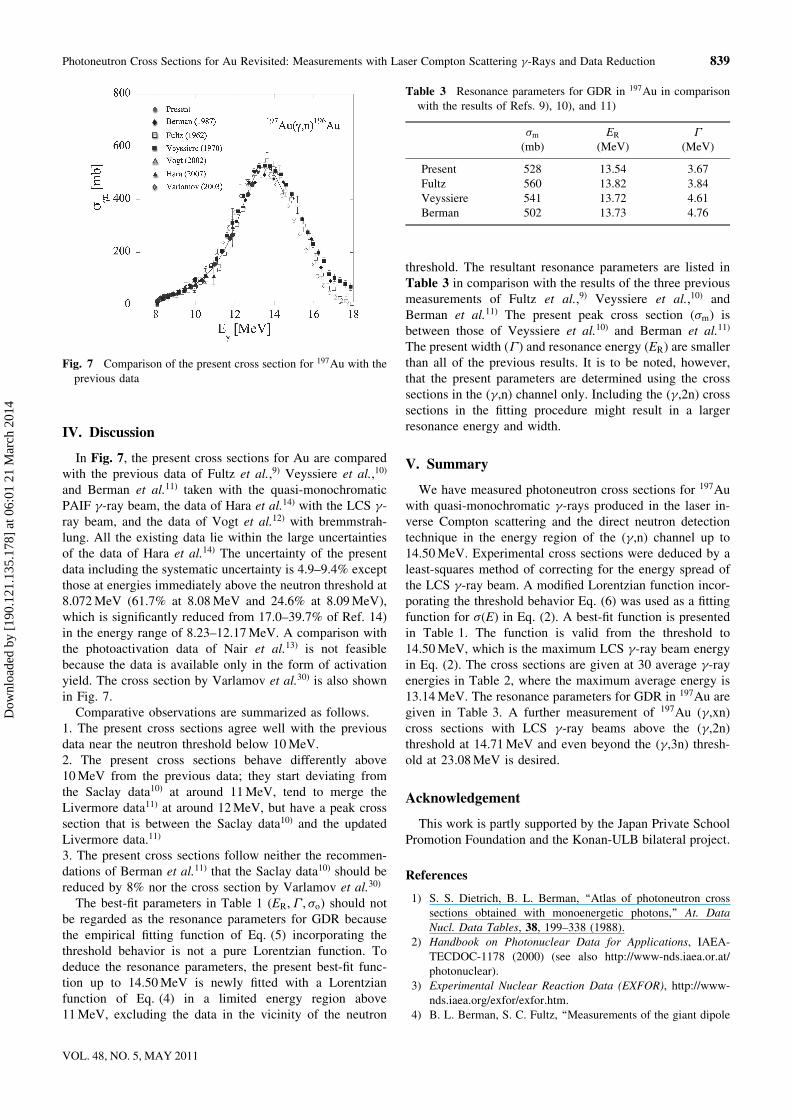
In Fig. 7, the present cross sections for Au are comparedwith the previous data of Fultz et al.,9) Veyssiere et al.,10)
and Berman et al.11) taken with the quasi-monochromaticPAIF �-ray beam, the data of Hara et al.14) with the LCS �-ray beam, and the data of Vogt et al.12) with bremmstrah-lung. All the existing data lie within the large uncertaintiesof the data of Hara et al.14) The uncertainty of the presentdata including the systematic uncertainty is 4.9–9.4% exceptthose at energies immediately above the neutron threshold at8.072 MeV (61.7% at 8.08 MeV and 24.6% at 8.09 MeV),which is significantly reduced from 17.0–39.7% of Ref. 14)in the energy range of 8.23–12.17 MeV. A comparison withthe photoactivation data of Nair et al.13) is not feasiblebecause the data is available only in the form of activationyield. The cross section by Varlamov et al.30) is also shownin Fig. 7.
Comparative observations are summarized as follows.1. The present cross sections agree well with the previousdata near the neutron threshold below 10 MeV.2. The present cross sections behave differently above10 MeV from the previous data; they start deviating fromthe Saclay data10) at around 11 MeV, tend to merge theLivermore data11) at around 12 MeV, but have a peak crosssection that is between the Saclay data10) and the updatedLivermore data.11)
3. The present cross sections follow neither the recommen-dations of Berman et al.11) that the Saclay data10) should bereduced by 8% nor the cross section by Varlamov et al.30)
The best-fit parameters in Table 1 ðER; � ; �oÞ should notbe regarded as the resonance parameters for GDR becausethe empirical fitting function of Eq. (5) incorporating thethreshold behavior is not a pure Lorentzian function. Todeduce the resonance parameters, the present best-fit func-tion up to 14.50 MeV is newly fitted with a Lorentzianfunction of Eq. (4) in a limited energy region above11 MeV, excluding the data in the vicinity of the neutron
threshold. The resultant resonance parameters are listed inTable 3 in comparison with the results of the three previousmeasurements of Fultz et al.,9) Veyssiere et al.,10) andBerman et al.11) The present peak cross section (�m) isbetween those of Veyssiere et al.10) and Berman et al.11)
The present width (� ) and resonance energy (ER) are smallerthan all of the previous results. It is to be noted, however,that the present parameters are determined using the crosssections in the (�,n) channel only. Including the (�,2n) crosssections in the fitting procedure might result in a largerresonance energy and width.
V. Summary
We have measured photoneutron cross sections for 197Auwith quasi-monochromatic �-rays produced in the laser in-verse Compton scattering and the direct neutron detectiontechnique in the energy region of the (�,n) channel up to14.50 MeV. Experimental cross sections were deduced by aleast-squares method of correcting for the energy spread ofthe LCS �-ray beam. A modified Lorentzian function incor-porating the threshold behavior Eq. (6) was used as a fittingfunction for �ðEÞ in Eq. (2). A best-fit function is presentedin Table 1. The function is valid from the threshold to14.50 MeV, which is the maximum LCS �-ray beam energyin Eq. (2). The cross sections are given at 30 average �-rayenergies in Table 2, where the maximum average energy is13.14 MeV. The resonance parameters for GDR in 197Au aregiven in Table 3. A further measurement of 197Au (�,xn)cross sections with LCS �-ray beams above the (�,2n)threshold at 14.71 MeV and even beyond the (�,3n) thresh-old at 23.08 MeV is desired.
Acknowledgement
This work is partly supported by the Japan Private SchoolPromotion Foundation and the Konan-ULB bilateral project.
References
1) S. S. Dietrich, B. L. Berman, ‘‘Atlas of photoneutron crosssections obtained with monoenergetic photons,’’ At. DataNucl. Data Tables, 38, 199–338 (1988).
2) Handbook on Photonuclear Data for Applications, IAEA-TECDOC-1178 (2000) (see also http://www-nds.iaea.or.at/photonuclear).
3) Experimental Nuclear Reaction Data (EXFOR), http://www-nds.iaea.org/exfor/exfor.htm.
4) B. L. Berman, S. C. Fultz, ‘‘Measurements of the giant dipole
Fig. 7 Comparison of the present cross section for 197Au with theprevious data
Table 3 Resonance parameters for GDR in 197Au in comparisonwith the results of Refs. 9), 10), and 11)
�m
(mb)ER
(MeV)�
(MeV)
Present 528 13.54 3.67Fultz 560 13.82 3.84Veyssiere 541 13.72 4.61Berman 502 13.73 4.76
Photoneutron Cross Sections for Au Revisited: Measurements with Laser Compton Scattering �-Rays and Data Reduction 839
VOL. 48, NO. 5, MAY 2011
Dow
nloa
ded
by [
190.
121.
135.
178]
at 0
6:01
21
Mar
ch 2
014

resonance with monoenergetic photons,’’ Rev. Mod. Phys., 47,713–761 (1975).
5) P. Mohr, K. Vogt, M. Babilon, J. Enders, T. Hartmann, C.Hutter, T. Rauscher, S. Volz, A. Zilges, ‘‘Experimental simu-lation of a stellar photon bath by bremsstrahlung: The astro-physical �-process,’’ Phys. Lett. B, 488, 127 (2000).
6) H. Utsunomiya, H. Akimune, S. Goko, M. Ohta, H. Ueda, T.Yamagata, K. Yamasaki, H. Ohgaki, H. Toyokawa, Y.-W. Lui,T. Hayakawa, T. Shizuma, E. Khan, S. Goriely, ‘‘Cross sectionmeasurements of the 181Ta(�,n)180Ta reaction near neutronthreshold and the p-process nucleosynthesis,’’ Phys. Rev.,C67, 015807-1:9 (2003).
7) H. Ohgaki, S. Sugiyama, T. Yamazaki, T. Mikado, M.Chiwaki, K. Yamada, R. Suzuki, T. Noguchi, T. Tomimasu,‘‘Measurement of laser-induced Compton backscatteredphotons with anti-Compton spectrometer,’’ IEEE Trans. Nucl.Sci., 38, 386–392 (1991).
8) A. Bohr, B. R. Mottelson, Nuclear Structure, Vol. II, W. A.Benjamin, Inc., Tokyo, 475 (1975).
9) S. C. Fultz, R. I. Bramblett, T. J. Caldwell, N. A. Kerr,‘‘Photoneutron cross-section measurements on gold usingnearly monochromatic photons,’’ Phys. Rev., 127, 1273–1279(1962).
10) A. Veyssiere, H. Beil, R. Bergere, P. Carlos, A. Leprettre,‘‘Photoneutron cross sections of 208Pb and 197Au,’’ Nucl. Phys.,A159, 561–576 (1970).
11) B. L. Berman, R. E. Pywell, S. S. Dietrich, M. N. Thomppson,K. G. McNeill, J. W. Jury, ‘‘Absolute photoneutron crosssections for Zr, I, Pr, Au, and Pb,’’ Phys. Rev., C36, 1286–1292 (1987).
12) K. Vogt, P. Mohr, M. Babilon, W. Bayer, D. Galaviz, T.Hartmann, C. Hutter, T. Rauscher, K. Sonnabend, S. Volz,A. Zilges, ‘‘Measurement of the (�, n) cross section of thenucleus 197Au close above the reaction threshold,’’ Nucl.Phys., A707, 241–252 (2002).
13) C. Nair, M. Erhard, A. R. Junghans, D. Bemmerer, R. Beyer,E. Grosse, J. Klug, K. Kosev, G. Rusev, K. D. Schilling, R.Schwengner, A. Wagner, ‘‘Photoactivation experiment on197Au and its implications for the dipole strength in heavynuclei,’’ Phys. Rev., C78, 055802-1:9 (2008).
14) K. Y. Hara, H. Harada, F. Kitatani, S. Goko, S. Hohara, T.Kaihori, A. Makinaga, H. Utsunomiya, ‘‘Measurements of the152Sm(�,n) cross section with laser-Compton scattering �-raysand the photon difference method,’’ J. Nucl. Sci. Technol., 44,938–945 (2007).
15) H. Utsunomiya, S. Goriely, M. Kamata, O. Itoh, H. Akimune,T. Yamagata, H. Toyokawa, Y.-W. Lui, S. Hilaire, A. J.Koning, ‘‘�-Ray strength function for 116;117Sn with the pigmydipole resonance balanced in the photoneutron and neutroncapture channels,’’ Phys. Rev., C80, 055806-1:5 (2009).
16) H. Utsunomiya, S. Goriely, H. Akimune, H. Harada, F.Kitatani, S. Goko, H. Toyokawa, K. Yamada, T. Kondo, O.Itoh, M. Kamata, T. Yamagata, Y.-W. Lui, S. Hilaire, A. J.Koning, ‘‘Photoneutron cross sections for 96Zr: A systematicexperimental study of photoneutron and radiative neutron cap-
ture cross sections for zirconium isotopes,’’ Phys. Rev., C81,035801-1:5 (2010).
17) F. Kitatani, H. Harada, S. Goko, H. Utsunomiya, H. Akimune,T. Kaihori, H. Toyokawa, K. Yamada, ‘‘Measurement of the80Se(�,n) cross section using laser-Compton scattering �-rays,’’ J. Nucl. Sci. Technol., 47, 367–375 (2010).
18) A. Makinaga, H. Utsunomiya, S. Goriely, T. Kaihori, S. Goko,H. Akimune, T. Yamagata, H. Toyokawa, T. Matsumoto,H. Harano, H. Harada, F. Kitatani, Y. K. Hara, S. Hohara,Y.-W. Lui, ‘‘Photodisintegration of 80Se: Implications for thes-process branching at 79Se,’’ Phys. Rev., C79, 025801-1:8(2009).
19) W. R. Nelson, H. Hirayama, W. O. Roger, The EGS4 CodeSystems, SLAC-Report-265 (1985).
20) H. Harada, Y. Shigetome, ‘‘High energy resolution measure-ment method of photonuclear reaction cross section,’’ J. Nucl.Sci. Technol., 32, 1189–1191 (1995).
21) Y. Shigetome, H. Harada, ‘‘Development of twin Ge detectorand its performance,’’ Nucl. Instrum. Methods, A469, 185–192(2001).
22) H. Harada, K. Furutaka, S. Nakamura, K. Osaka, H. Akimune,H. Utsunomiya, T. Ohsaki, M. Igashira, ‘‘Response of a high-resolution high-energy photon spectrometer (HHS) to mono-chromatic high-energy gamma-rays,’’ Nucl. Instrum. Methods,A554, 306–313 (2005).
23) H. Utsunomiya, H. Akimune, K. Osaka, T. Kaihori, K.Furutaka, H. Harada, ‘‘Surface channel effect on �-rayresponse function of coaxial germanium detectors,’’ Nucl.Instum. Methods, A548, 455–463 (2005).
24) H. Harada, Y. Shigetome, H. Ohgaki, T. Noguchi, T.Yamazaki, ‘‘High-resolution measurement of fine structure inthe photoabsorption cross section of 18O,’’ Phys. Rev. Lett., 80,33–36 (1998).
25) J. F. Briesmeister, MCNP, A General Monte Carlo N-ParticleTransport Code, Version 4B, Las Alamos National Laboratory(1997).
26) National Institute of Standards and Technology (NIST), Tablesof X-Ray Mass Attenuation Coefficients and Mass Energy-Absorption Coefficients from 1 keV to 20 MeV for ElementsZ ¼ 1 to 92 and 48 Additional Substances of DosimetricInterest, http://physics.nist.gov/PhysiRefData/XrayMassCoef/tab.html.
27) E. Wigner, ‘‘On the behavior of cross sections near thresh-olds,’’ Phys. Rev., 73, 1002–1009 (1948).
28) G. Breit, ‘‘Energy dependence of reactions at thresholds,’’Phys. Rev., 107, 1612–1615 (1957).
29) H. Toyokawa, T. Kii, H. Ohgaki, T. Shima, T. Baba, Y. Nagai,‘‘Flux measurement of the laser-Compton-backscatteredphotons with a Poisson fitting method,’’ IEEE Trans. Nucl.Sci., 47, 1954–1957 (2000).
30) V. V. Varlamov, N. N. Peskov, D. S. Rudenko, M. E.Stepanov, ‘‘Photoneutron reaction cross sections in experi-ments with beams of quasimonoenergetic annihilation pho-tons,’’ Vop. At. Nauki i Tekhn., Ser. Yadernye Konstanty,1-2, 48 (2003).
840 O. ITOH et al.
JOURNAL OF NUCLEAR SCIENCE AND TECHNOLOGY
Dow
nloa
ded
by [
190.
121.
135.
178]
at 0
6:01
21
Mar
ch 2
014
Copyright © 2022 FDOKUMEN