Investigation of the thermal degradation of PET, zinc phosphinate, OMPOSS and their...
12
Thermochimica Acta 495 (2009) 155–166 Contents lists available at ScienceDirect Thermochimica Acta journal homepage: www.elsevier.com/locate/tca Investigation of the thermal degradation of PET, zinc phosphinate, OMPOSS and their blends—Identification of the formed species Aurore Vannier a , Sophie Duquesne b,∗ , Serge Bourbigot b , Jenny Alongi c , Giovanni Camino c , René Delobel a a Centre de Recherche et d’Etude sur les Procédés d’Ignifugation des Matériaux (CREPIM), Parc de la porte Nord, F-62200 Bruay-la-Buissière, France b Laboratoire des Procédés d’Elaboration de Revêtements Fonctionnels (PERF), UMR-CNRS 8008/LSPES – Ecole Nationale Supérieure de Chimie de Lille, BP 90108, F-59652 Villeneuve d’Ascq, France c Centro di Cultura per l’Ingegneria delle Materie Plastiche – Politechnico di Torino, V.le T. Michel, 5, 15100 Alessandria, Italy article info Article history: Received 1 April 2009 Received in revised form 2 June 2009 Accepted 10 June 2009 Available online 18 June 2009 Keywords: Thermal degradation Solid state NMR GC–MS OMPOSS Exolit OP950 phosphinate PET abstract The incorporation of both OMPOSS and Exolit OP950 (zinc phosphinate) into PET leads to increased fire retarding properties and a synergistic effect has been established between the three components. Here the thermal degradation of OMPOSS, Exolit OP950, PET and blends of them is investigated via thermal degradation in pyrolytic and thermo-oxidative conditions. All species formed during the degradation of the additives or the blends are identified by solid state NMR and X-ray diffraction in the condensed phase and by GC–MS in the gas phase. The investigation shows that no chemical interaction occurs between the additives, which suggests that the synergy responsible for the improvement of fire properties of the material has a physical origin. © 2009 Elsevier B.V. All rights reserved. 1. Introduction The large variety of polyhedral oligomeric silsesquioxane (POSS) allows their application in multiple fields. They are usually used as mechanical reinforcement in polymers. Devaux [1], Bourbigot [2] and Fina [3] used different POSS alone to get a better fire behaviour of polymers. The use of POSS as synergist in fire retarded polymers, has only been studied by Chigwada [4] and in our Labora- tory. Chigwada incorporated vinyl POSS and tricresylphosphate into poly(vinylester) and obtained a reduction of 68% of the peak of heat released (pHRR) (with 5% of vinyl POSS and 30% of tricresylphos- phate). In our Lab a synergistic effect has been highlighted between octa methyl POSS (OMPOSS) and a zinc phosphinate (OP950) that lead to a high improvement of the fire properties of the PET [5]. Indeed, whereas the incorporation of 10% of OP950 into polyethy- lene terephtalate (PET) lead to a decrease of the pHRR (−37%) and an increase in the limiting of oxygen index (LOI) value (+3vol.%), the substitution of only 1% of OP950 with OMPOSS brings those results to −61% for the pHRR decrease and +10vol.% for the LOI. This synergistic effect can be due to physical interactions or chem- ∗ Corresponding author. Tel.: +33 0 3 20 33 72 36; fax: +33 0 3 20 43 65 84. E-mail address: [email protected] (S. Duquesne). ical interactions between the components of the formulation. In this paper, we propose to investigate the eventual chemical inter- actions that might occur between the additives in the first step and between the additives and the polymer in a second step. To highlight chemical interactions occurring during the combus- tion of the different components, a systematic approach is used. Each component and blend undergoes a thermal treatment in an oven at different characteristic temperature chosen from the TGA of the components. The residues of the thermal treatments are then analysed by solid state NMR and X-ray diffraction. To complete the obtained information, the different additives also undergo a pyrol- ysis and the gases evolved from those pyrolysis are analysed by gas chromatography coupled with a mass spectrometer. 2. Experimental 2.1. Materials The following products were used. PET is a mixture between 15 wt.% of virgin PET pellets and 85wt.% of recycled flakes, supplied by Wellman Company. Exolit OP950 is a phosphinated compound of general formula [R 1 R 2 POO] n − M n+ , where R 1 and R 2 are ethyl groups and the metal ion is Zn 2+ ion, kindly provided by Clariant. Octa methyl polyhedral 0040-6031/$ – see front matter © 2009 Elsevier B.V. All rights reserved. doi:10.1016/j.tca.2009.06.013
-
Upload
independent -
Category
Documents
-
view
2 -
download
0
Transcript of Investigation of the thermal degradation of PET, zinc phosphinate, OMPOSS and their...
Ia
AGa
b
Bc
a
ARRAA
KTSGOEP
1
aa[bptprpolIlatrT
0d
Thermochimica Acta 495 (2009) 155–166
Contents lists available at ScienceDirect
Thermochimica Acta
journa l homepage: www.e lsev ier .com/ locate / tca
nvestigation of the thermal degradation of PET, zinc phosphinate, OMPOSSnd their blends—Identification of the formed species
urore Vannier a, Sophie Duquesne b,∗, Serge Bourbigot b, Jenny Alongi c,iovanni Camino c, René Delobel a
Centre de Recherche et d’Etude sur les Procédés d’Ignifugation des Matériaux (CREPIM), Parc de la porte Nord, F-62200 Bruay-la-Buissière, FranceLaboratoire des Procédés d’Elaboration de Revêtements Fonctionnels (PERF), UMR-CNRS 8008/LSPES – Ecole Nationale Supérieure de Chimie de Lille,P 90108, F-59652 Villeneuve d’Ascq, FranceCentro di Cultura per l’Ingegneria delle Materie Plastiche – Politechnico di Torino, V.le T. Michel, 5, 15100 Alessandria, Italy
r t i c l e i n f o
rticle history:eceived 1 April 2009eceived in revised form 2 June 2009ccepted 10 June 2009vailable online 18 June 2009
a b s t r a c t
The incorporation of both OMPOSS and Exolit OP950 (zinc phosphinate) into PET leads to increased fireretarding properties and a synergistic effect has been established between the three components. Herethe thermal degradation of OMPOSS, Exolit OP950, PET and blends of them is investigated via thermaldegradation in pyrolytic and thermo-oxidative conditions. All species formed during the degradation ofthe additives or the blends are identified by solid state NMR and X-ray diffraction in the condensed phase
eywords:hermal degradationolid state NMRC–MSMPOSS
and by GC–MS in the gas phase. The investigation shows that no chemical interaction occurs betweenthe additives, which suggests that the synergy responsible for the improvement of fire properties of thematerial has a physical origin.
© 2009 Elsevier B.V. All rights reserved.
xolit OP950 phosphinateET
. Introduction
The large variety of polyhedral oligomeric silsesquioxane (POSS)llows their application in multiple fields. They are usually useds mechanical reinforcement in polymers. Devaux [1], Bourbigot2] and Fina [3] used different POSS alone to get a better fireehaviour of polymers. The use of POSS as synergist in fire retardedolymers, has only been studied by Chigwada [4] and in our Labora-ory. Chigwada incorporated vinyl POSS and tricresylphosphate intooly(vinylester) and obtained a reduction of 68% of the peak of heateleased (pHRR) (with 5% of vinyl POSS and 30% of tricresylphos-hate). In our Lab a synergistic effect has been highlighted betweencta methyl POSS (OMPOSS) and a zinc phosphinate (OP950) that
ead to a high improvement of the fire properties of the PET [5].ndeed, whereas the incorporation of 10% of OP950 into polyethy-ene terephtalate (PET) lead to a decrease of the pHRR (−37%) and
n increase in the limiting of oxygen index (LOI) value (+3 vol.%),he substitution of only 1% of OP950 with OMPOSS brings thoseesults to −61% for the pHRR decrease and +10 vol.% for the LOI.his synergistic effect can be due to physical interactions or chem-∗ Corresponding author. Tel.: +33 0 3 20 33 72 36; fax: +33 0 3 20 43 65 84.E-mail address: [email protected] (S. Duquesne).
040-6031/$ – see front matter © 2009 Elsevier B.V. All rights reserved.oi:10.1016/j.tca.2009.06.013
ical interactions between the components of the formulation. Inthis paper, we propose to investigate the eventual chemical inter-actions that might occur between the additives in the first step andbetween the additives and the polymer in a second step.
To highlight chemical interactions occurring during the combus-tion of the different components, a systematic approach is used.Each component and blend undergoes a thermal treatment in anoven at different characteristic temperature chosen from the TGAof the components. The residues of the thermal treatments are thenanalysed by solid state NMR and X-ray diffraction. To complete theobtained information, the different additives also undergo a pyrol-ysis and the gases evolved from those pyrolysis are analysed by gaschromatography coupled with a mass spectrometer.
2. Experimental
2.1. Materials
The following products were used.
PET is a mixture between 15 wt.% of virgin PET pelletsand 85 wt.% of recycled flakes, supplied by Wellman Company.Exolit OP950 is a phosphinated compound of general formula[R1R2POO]n
− Mn+, where R1 and R2 are ethyl groups and the metalion is Zn2+ ion, kindly provided by Clariant. Octa methyl polyhedral
156 A. Vannier et al. / Thermochimica Acta 495 (2009) 155–166
oP
2
dus
2
aopheTrN
91
2
t1rga(a(
2
2
Bist
(maximum degradation rate 486 C). The photos of the residues of
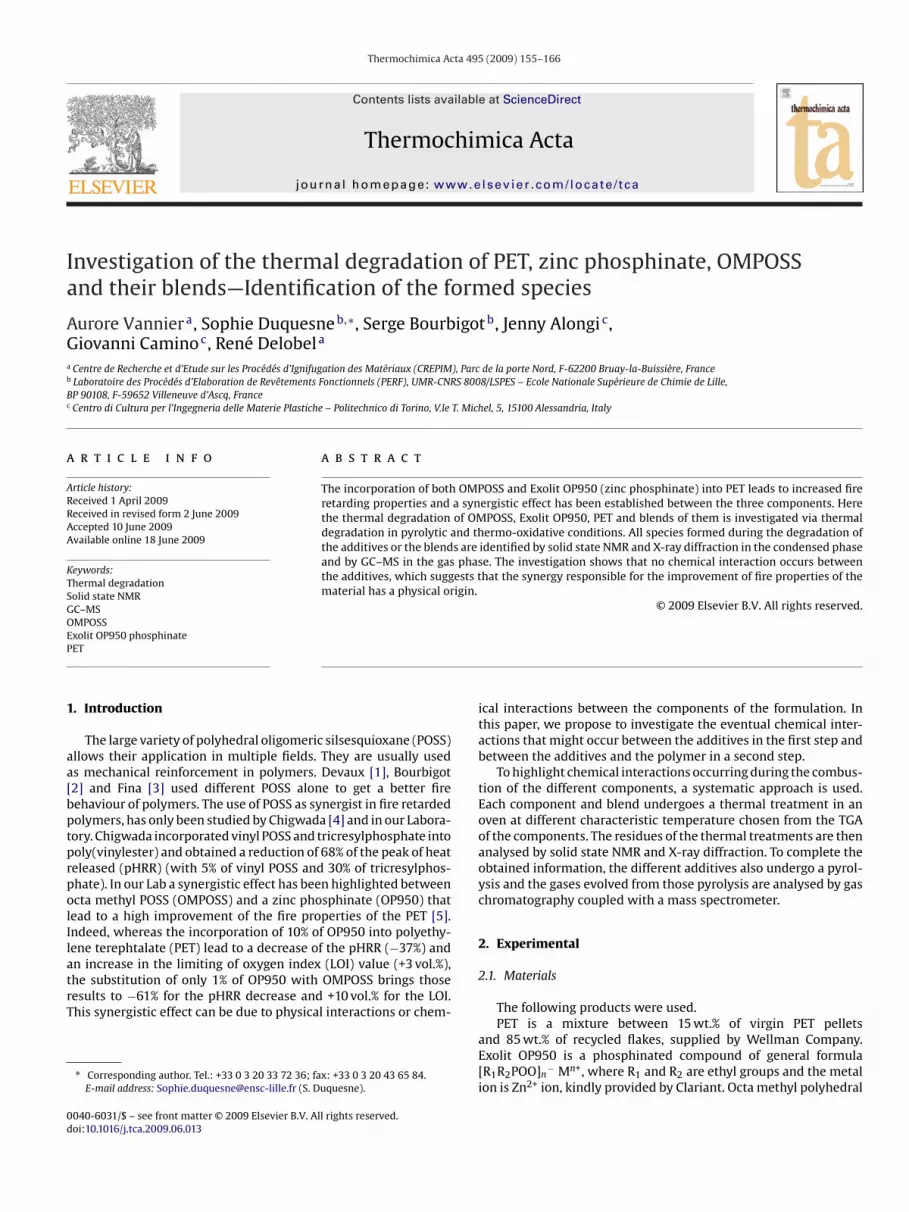
Fig. 1. Structure of OMPOSS.
ligomeric silsesquioxane (OMPOSS) was purchased from Hybridlastics Company and used as received (Fig. 1).
.2. Processing
Materials were mixed under nitrogen at 275 ◦C using a Braben-er mixer (type 350/EH, roller blade, mixing conditions checkedsing the data processing torque rheometer system PL2000, con-tant shear rate: 50 rpm).
.3. Thermo-oxidative degradation
In order to simulate the degradation process of the differentdditives and their blends, thermal treatments have been carriedut in a tubular furnace under air. Samples of approximately 1 g (inowder for the additives and in bulk for the polymeric materials)ave been treated for 3 h at temperatures characteristic of the differ-nt steps of degradation based on TG curves (300, 400 and 500 ◦C).he samples are directly introduced into the furnace, without anyamp. Residues are analysed with X-ray diffraction and solid stateMR.
Analysed samples were: OP950, OMPOSS, mix OP9500%–OMPOSS 10%, PET, PET–OP950 10%, PET–OP950 9%–OMPOSS%.
.4. Thermal volatilisation analysis (pyrolysis)
TVA analysis has been used to identify the gases evolved duringhe degradation under nitrogen of the samples. Samples of aroundg were placed in a vertical oven and underwent a temperature
amp from 20 to 500 ◦C and an isotherm at 500 ◦C for 2 h. Theases evolved during the pyrolysis are trapped into two traps: onet −80 ◦C (ethanol + liquid nitrogen) and another one at −196 ◦Cliquid nitrogen). Once at ambient temperature, the gases werenalysed by gas chromatography coupled to a mass spectrometerGC–MS). Residues are also analysed by solid state NMR.
Analysed samples were: OP950, OMPOSS.
.5. Analysing tools
.5.1. X-ray diffractionXRD spectra were recorded in the 5–60◦ 2�-range using a
rucker AXS D8 diffractometer (�(Cu K�) = 1.5418 ´̊A, 40 keV, 25 mA)n configuration 2�/�. The acquisition parameters were as follows:tep of 0.02◦, step time of 2 s. The data are analysed using the diffrac-ion patterns of Inorganic Crystal Structure Database (ICSD).
Fig. 2. Example of the nomenclature M, D, T, Q with an atom X T2.
2.5.2. Solid state NMRNMR measurements were performed on a Bruker Avance II spec-
trometer (2.35 T and 9.4 T) using 4 or 7 mm probes and magicangle spinning (MAS). 13C NMR measurements were performed at25.2 MHz with 1H–13C cross-polarisation (CP). For all samples, arepetition time of 5–10 s, a contact time of 1 ms and a spinningspeed of 5 kHz were used. The reference used was the tetramethyl-silane (TMS)
31P NMR measurements were performed at 40.5 MHz with andwithout 1H–31P CP (contact time of 2 ms) and with dipolar decou-pling. Experiments without CP were performed with a repetitiontime varying from 5 to 60 s according to the relatively long relax-ation time of phosphorous compounds. With CP, the repetition timeis fixed at 5 s as the relaxation time of protons is shorter. Spectraacquired were the result of the accumulation of 8–64 scans withoutCP and 8–256 scans with CP. The reference used was 85% H3PO4 inaqueous solution.
29Si measurements were performed at 19.6 MHz with and with-out 1H–29Si CP and dipolar decoupling with a MAS speed of 4 kHz.The repetition time applied was varying between 5 and 10 s and thecontact time fixed at 8 ms. TMS is used as a reference.
The X atom can be designated by the letter M, D, T, Q based onthe nature of its surrounding: 3, 2, 1 or no R (alkyl) group (andthus 1, 2, 3 or 4 –O– bond). To this letter is added a superscriptednumber referring to the number of –O–X bond linked to the X atomconcerned. An example of this nomenclature is given in Fig. 2.
2.5.3. GC–MSVolatile species have been analysed with a Perkin Elmer Turbo-
mass Gold mass spectrometer (ionisation energy 70 eV) coupled toa Perkin Elmer Autosystem XL gas chromatographer with a capillarycolumn VF-1 (length 30 m, diameter 0,25 mm, thickness 1 �m). Thevector gas was helium (1 mL min−1), the temperature of the injec-tion chamber was fixed to 280 ◦C and the temperature ramp appliedwas 10 ◦C min−1 between 50 and 300 ◦C. The identification of thedifferent substances is realised through the analyses of the frag-ments masses of the substances validated by comparison with theNIST Chemistry Book Database [6].
3. Results
3.1. Degradation of OP950
3.1.1. Thermo-oxidative degradationAccording to our previous work [5], OP950 degrades in two steps
under air, the first one between 268 and 432 ◦C (maximum degra-dation rate 417 ◦C) and the second one between 432 and 694 ◦C
◦
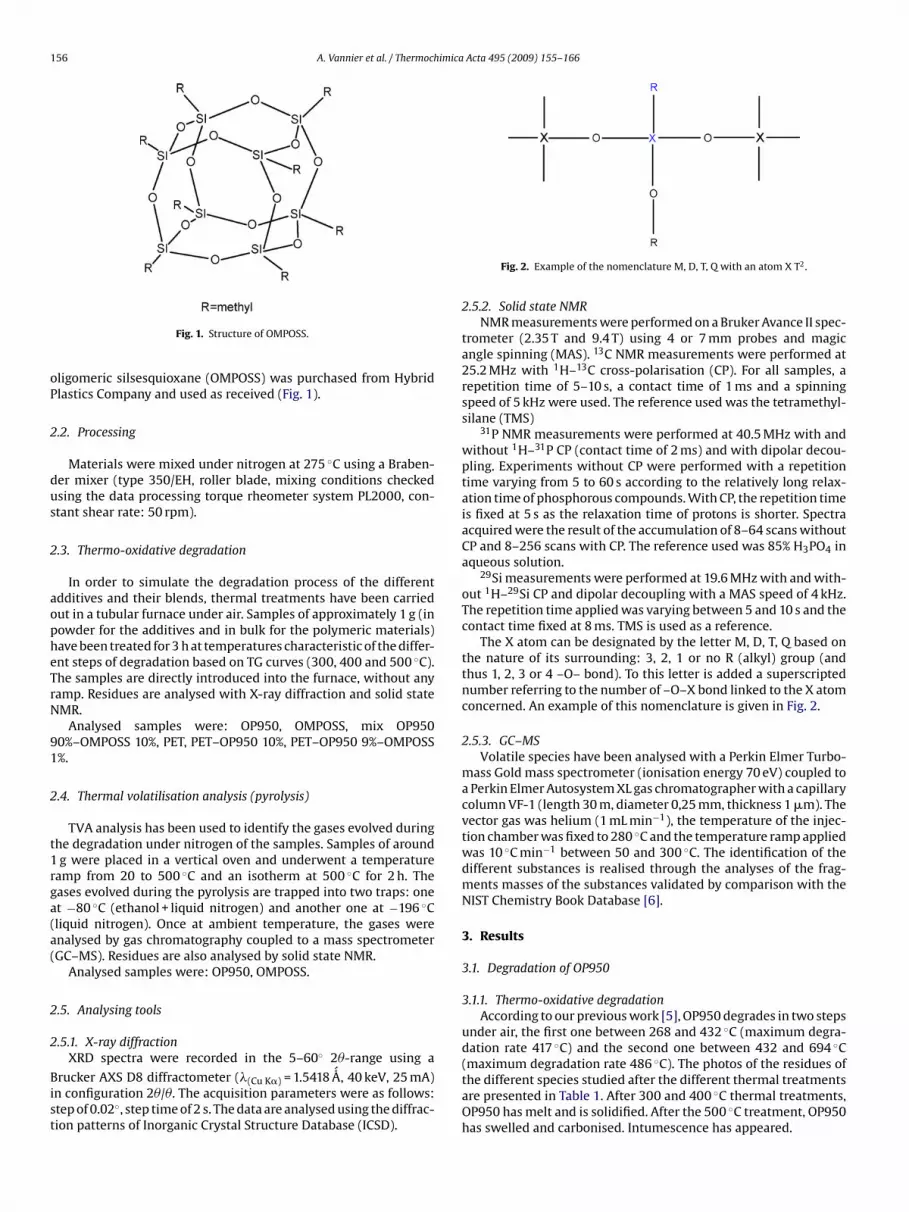
the different species studied after the different thermal treatmentsare presented in Table 1. After 300 and 400 ◦C thermal treatments,OP950 has melt and is solidified. After the 500 ◦C treatment, OP950has swelled and carbonised. Intumescence has appeared.
A. Vannier et al. / Thermochimica Acta 495 (2009) 155–166 157
Table 1Photos of residues of the degradation of the samples under air.
Temperature 300 ◦C 400 ◦C 500 ◦C
OP950
OMPOSS
OP950–OMPOSS
PET–OP950
P
aOamTiaspmaaccptc
OpOmd
Fm
ET–OP950–OMPOSS
In Fig. 3 are presented the NMR CP MAS 13C spectra of OP950nd of its residues at different thermal treatments. For non-treatedP950, a peak at ıc = 6.5 ppm and a doublet at ıc = 20 and 24 ppmre observed. The peak at 6.5 ppm is representative of the twoethyl groups of the phosphinates that are chemically equivalent.
he doublet at 20 and 24 ppm represents unshielded C belong-ng to –CH2– groups linked to the phosphorous atom. After 300nd 400 ◦C thermal treatments, peaks are broader but the samepecies are identified. This enlargement could be attributed to aartial loss of crystallinity of the component. After a 500 ◦C ther-al treatment, a broad peak appears at ıc = 123 ppm, characterising
romatic carbons of the char. A broad band is now observed in theliphatic region (region of the carbon of the phosphinates). Thehemical shifts are slightly shifted that means that the molecule hashanged. Aliphatic carbons remain the same than those of the phos-hinates (CH3–CH2–P bonds) but the phosphorous is no longer inhe phosphinate configuration but in a phosphonate or a phosphateonfiguration as shown by 31P NMR (see comments below).
Fig. 4 represents NMR 31P CP-DD-MAS and DD-MAS spectra ofP950 and of its residues after different thermal treatments. Four
eaks appear at ıP = 45, 47, 52 and 53 ppm for the non-treatedP950. They represent the D0 phosphorous in the phosphinateolecule. The presence of 4 different peaks can be attributed toifferent crystallographic configurations of the phosphorous in the
ig. 3. NMR CP MAS 13C spectra of OP950 and of the residues of its thermal treat-ents.
phosphinate. After a 300 ◦C thermal treatment, peaks are observedwith the same chemical shift but a broad band appears betweenıP = 45 and 53 ppm. A partial loss of crystallinity of the componentduring the thermal treatment and thus the presence of an amor-phous component can explain the enlargement of the peak between45 and 53 ppm and the conservation of the original peaks of thenon-treated phosphinate. Same peaks are observed after a 400 ◦Cthermal treatment. The large band between 45 and 53 ppm is lessvisible but is still there as the baseline does not go back to zero.After a 500 ◦C thermal treatment, bands relative to the phospho-rous in the phosphinate have disappeared but three broad bands,centred at ıP = 23, −8 and −27 ppm appear as well as a small peakat ıP = −2 ppm. These chemical shifts are respectively attributed tothe presence of phosphonates (phosphorous T0), pyrophosphates(phosphorous Q1), ramified polyphosphates (phosphorous Q3) andphosphates (phosphorous Q0). Because of the aliphatic carbonsdetected by 13C NMR, it is reasonable to assume that the phos-phonates formed are ethylphosphonates. Those bands are alsodetectable after the 400 ◦C thermal treatment but with a very lowintensity (cf. framed graph of the 400 ◦C thermal treatment). Thisshows that they are formed from the second step of degradation of
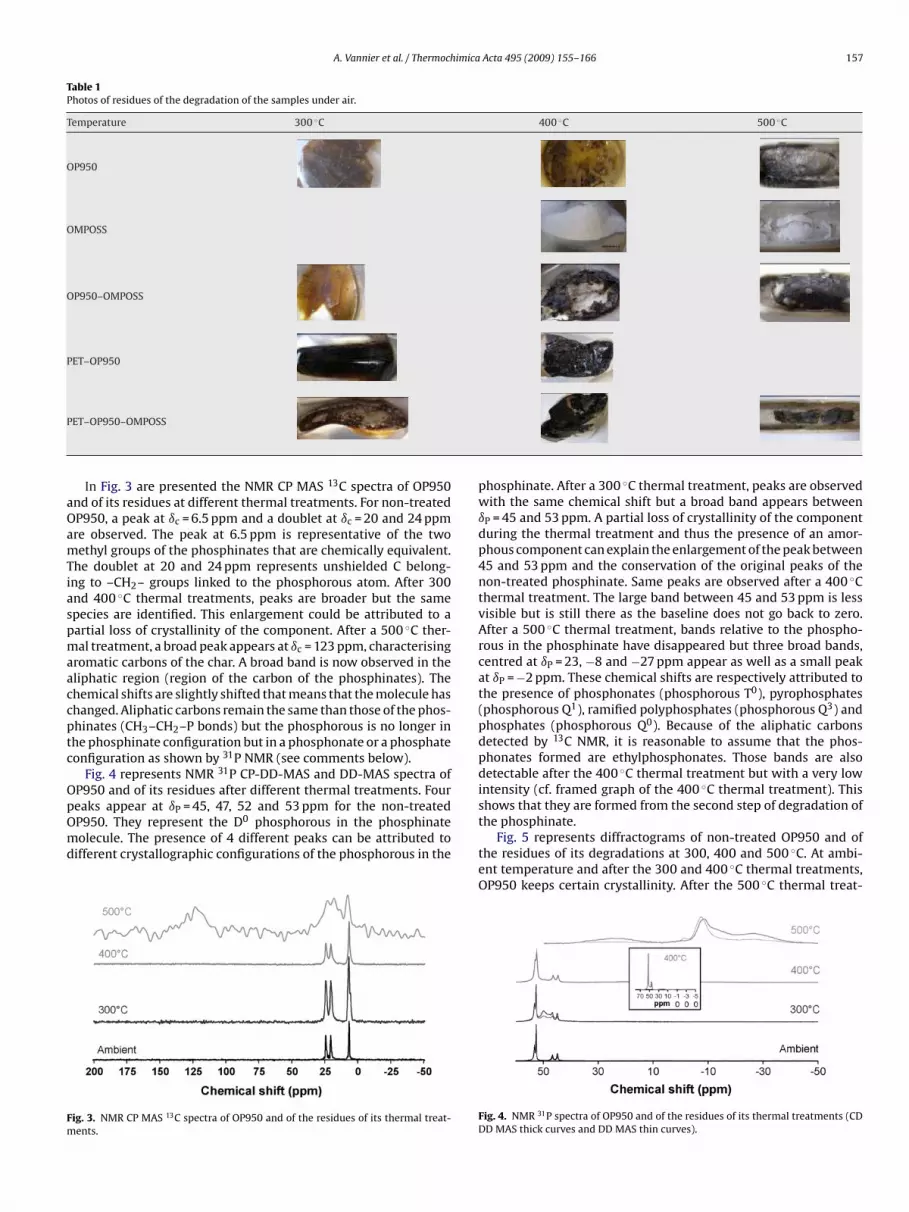
the phosphinate.Fig. 5 represents diffractograms of non-treated OP950 and ofthe residues of its degradations at 300, 400 and 500 ◦C. At ambi-ent temperature and after the 300 and 400 ◦C thermal treatments,OP950 keeps certain crystallinity. After the 500 ◦C thermal treat-
Fig. 4. NMR 31P spectra of OP950 and of the residues of its thermal treatments (CDDD MAS thick curves and DD MAS thin curves).
158 A. Vannier et al. / Thermochimica Acta 495 (2009) 155–166
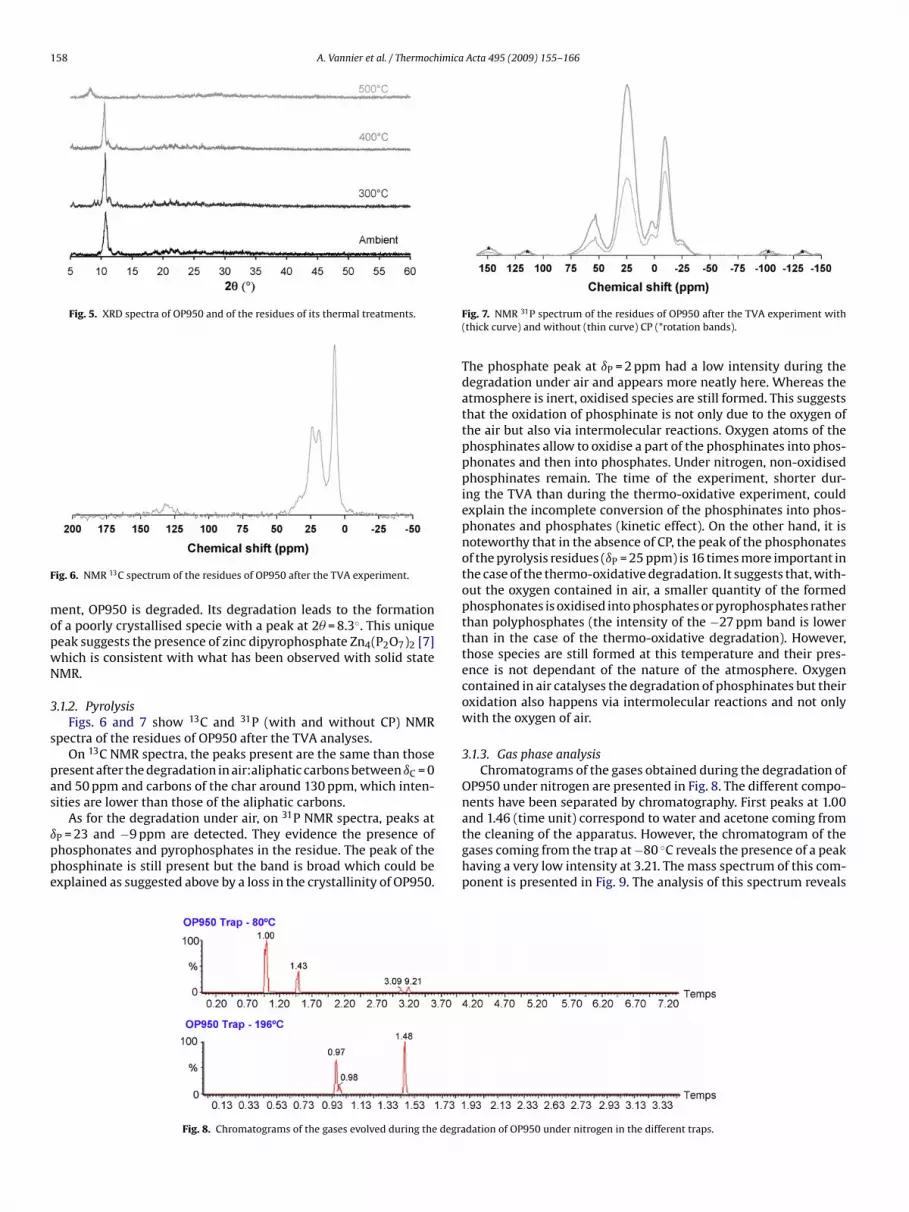
Fig. 5. XRD spectra of OP950 and of the residues of its thermal treatments.
F
mopwN
3
s
pas
ıppe
ig. 6. NMR 13C spectrum of the residues of OP950 after the TVA experiment.
ent, OP950 is degraded. Its degradation leads to the formationf a poorly crystallised specie with a peak at 2� = 8.3◦. This uniqueeak suggests the presence of zinc dipyrophosphate Zn4(P2O7)2 [7]hich is consistent with what has been observed with solid stateMR.
.1.2. PyrolysisFigs. 6 and 7 show 13C and 31P (with and without CP) NMR
pectra of the residues of OP950 after the TVA analyses.On 13C NMR spectra, the peaks present are the same than those
resent after the degradation in air:aliphatic carbons between ıC = 0nd 50 ppm and carbons of the char around 130 ppm, which inten-ities are lower than those of the aliphatic carbons.
As for the degradation under air, on 31P NMR spectra, peaks atP = 23 and −9 ppm are detected. They evidence the presence ofhosphonates and pyrophosphates in the residue. The peak of thehosphinate is still present but the band is broad which could bexplained as suggested above by a loss in the crystallinity of OP950.
Fig. 8. Chromatograms of the gases evolved during the degra
Fig. 7. NMR 31P spectrum of the residues of OP950 after the TVA experiment with(thick curve) and without (thin curve) CP (*rotation bands).
The phosphate peak at ıP = 2 ppm had a low intensity during thedegradation under air and appears more neatly here. Whereas theatmosphere is inert, oxidised species are still formed. This suggeststhat the oxidation of phosphinate is not only due to the oxygen ofthe air but also via intermolecular reactions. Oxygen atoms of thephosphinates allow to oxidise a part of the phosphinates into phos-phonates and then into phosphates. Under nitrogen, non-oxidisedphosphinates remain. The time of the experiment, shorter dur-ing the TVA than during the thermo-oxidative experiment, couldexplain the incomplete conversion of the phosphinates into phos-phonates and phosphates (kinetic effect). On the other hand, it isnoteworthy that in the absence of CP, the peak of the phosphonatesof the pyrolysis residues (ıP = 25 ppm) is 16 times more important inthe case of the thermo-oxidative degradation. It suggests that, with-out the oxygen contained in air, a smaller quantity of the formedphosphonates is oxidised into phosphates or pyrophosphates ratherthan polyphosphates (the intensity of the −27 ppm band is lowerthan in the case of the thermo-oxidative degradation). However,those species are still formed at this temperature and their pres-ence is not dependant of the nature of the atmosphere. Oxygencontained in air catalyses the degradation of phosphinates but theiroxidation also happens via intermolecular reactions and not onlywith the oxygen of air.
3.1.3. Gas phase analysisChromatograms of the gases obtained during the degradation of
OP950 under nitrogen are presented in Fig. 8. The different compo-nents have been separated by chromatography. First peaks at 1.00
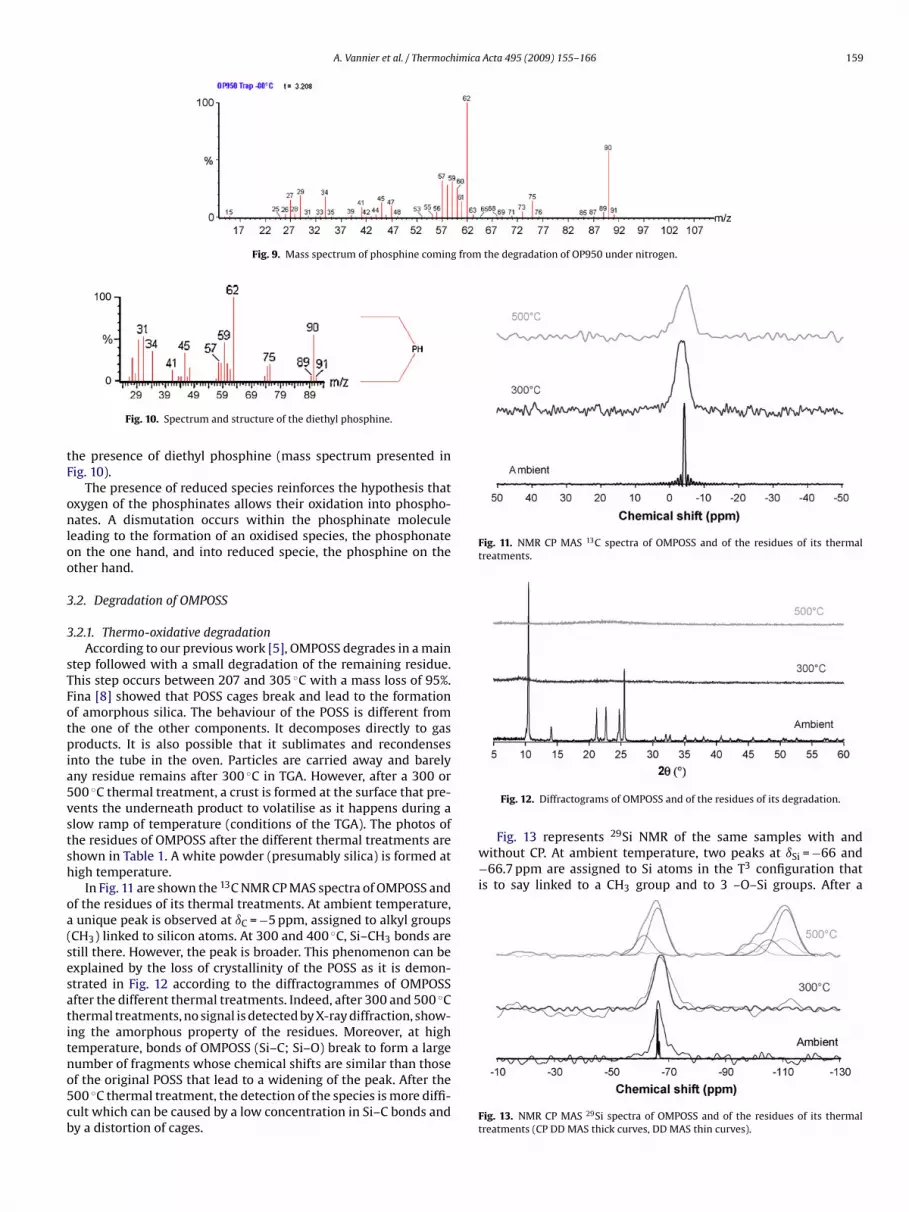
and 1.46 (time unit) correspond to water and acetone coming fromthe cleaning of the apparatus. However, the chromatogram of thegases coming from the trap at −80 ◦C reveals the presence of a peakhaving a very low intensity at 3.21. The mass spectrum of this com-ponent is presented in Fig. 9. The analysis of this spectrum revealsdation of OP950 under nitrogen in the different traps.
A. Vannier et al. / Thermochimica Acta 495 (2009) 155–166 159
Fig. 9. Mass spectrum of phosphine coming from the degradation of OP950 under nitrogen.
tF
onloo
3
3
sTFotpia5vstsh
oa(sesatitno5cb
Fig. 11. NMR CP MAS 13C spectra of OMPOSS and of the residues of its thermaltreatments.
Fig. 13 represents 29Si NMR of the same samples with andwithout CP. At ambient temperature, two peaks at ıSi = −66 and−66.7 ppm are assigned to Si atoms in the T3 configuration thatis to say linked to a CH3 group and to 3 –O–Si groups. After a
Fig. 10. Spectrum and structure of the diethyl phosphine.
he presence of diethyl phosphine (mass spectrum presented inig. 10).
The presence of reduced species reinforces the hypothesis thatxygen of the phosphinates allows their oxidation into phospho-ates. A dismutation occurs within the phosphinate molecule
eading to the formation of an oxidised species, the phosphonaten the one hand, and into reduced specie, the phosphine on thether hand.
.2. Degradation of OMPOSS
.2.1. Thermo-oxidative degradationAccording to our previous work [5], OMPOSS degrades in a main
tep followed with a small degradation of the remaining residue.his step occurs between 207 and 305 ◦C with a mass loss of 95%.ina [8] showed that POSS cages break and lead to the formationf amorphous silica. The behaviour of the POSS is different fromhe one of the other components. It decomposes directly to gasroducts. It is also possible that it sublimates and recondenses
nto the tube in the oven. Particles are carried away and barelyny residue remains after 300 ◦C in TGA. However, after a 300 or00 ◦C thermal treatment, a crust is formed at the surface that pre-ents the underneath product to volatilise as it happens during alow ramp of temperature (conditions of the TGA). The photos ofhe residues of OMPOSS after the different thermal treatments arehown in Table 1. A white powder (presumably silica) is formed atigh temperature.
In Fig. 11 are shown the 13C NMR CP MAS spectra of OMPOSS andf the residues of its thermal treatments. At ambient temperature,unique peak is observed at ıC = −5 ppm, assigned to alkyl groups
CH3) linked to silicon atoms. At 300 and 400 ◦C, Si–CH3 bonds aretill there. However, the peak is broader. This phenomenon can bexplained by the loss of crystallinity of the POSS as it is demon-trated in Fig. 12 according to the diffractogrammes of OMPOSSfter the different thermal treatments. Indeed, after 300 and 500 ◦Chermal treatments, no signal is detected by X-ray diffraction, show-ng the amorphous property of the residues. Moreover, at highemperature, bonds of OMPOSS (Si–C; Si–O) break to form a large
umber of fragments whose chemical shifts are similar than thosef the original POSS that lead to a widening of the peak. After the00 ◦C thermal treatment, the detection of the species is more diffi-ult which can be caused by a low concentration in Si–C bonds andy a distortion of cages.Fig. 12. Diffractograms of OMPOSS and of the residues of its degradation.
Fig. 13. NMR CP MAS 29Si spectra of OMPOSS and of the residues of its thermaltreatments (CP DD MAS thick curves, DD MAS thin curves).
160 A. Vannier et al. / Thermochimica Acta 495 (2009) 155–166
3sbdaOnTamtıNwtindg
3
patfsp(estgto
3
ya
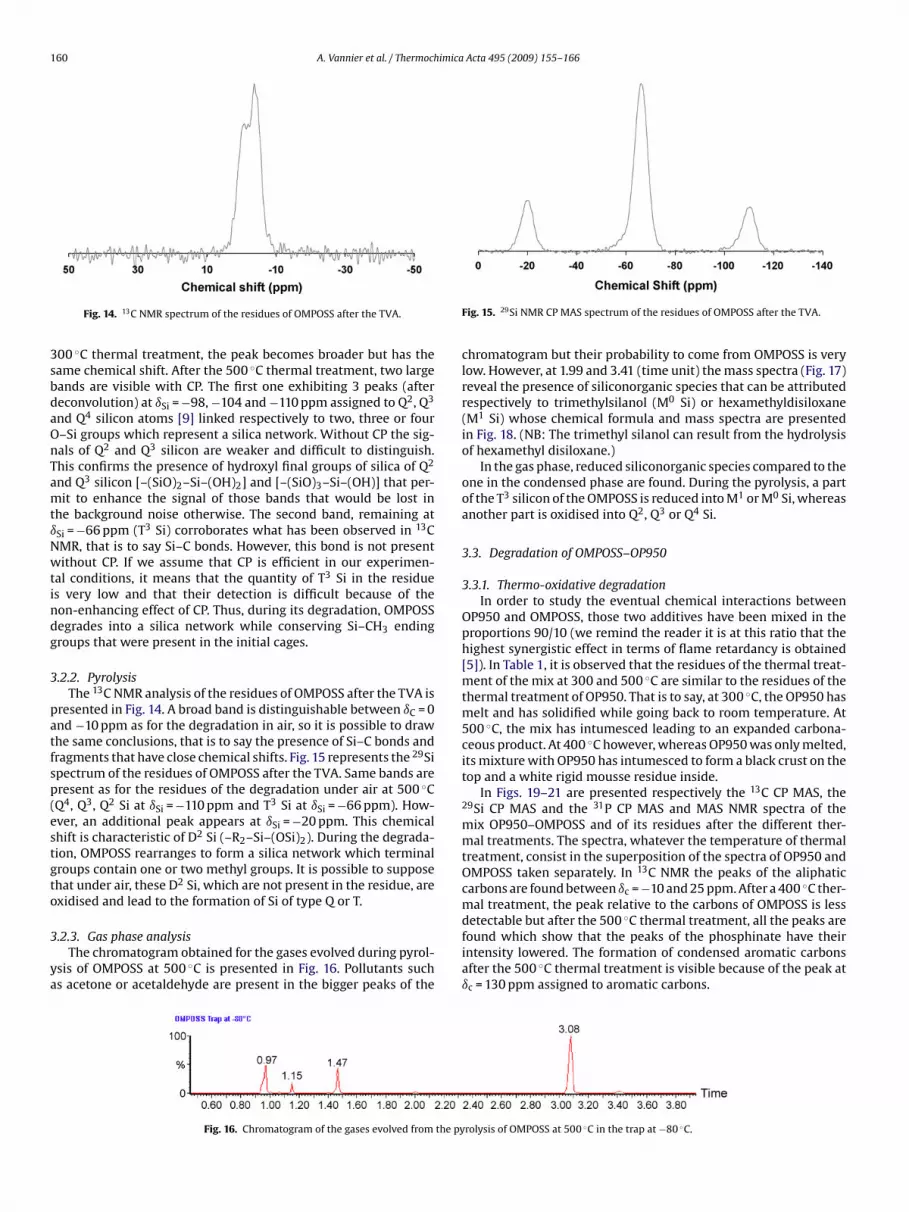
Fig. 14. 13C NMR spectrum of the residues of OMPOSS after the TVA.
00 ◦C thermal treatment, the peak becomes broader but has theame chemical shift. After the 500 ◦C thermal treatment, two largeands are visible with CP. The first one exhibiting 3 peaks (aftereconvolution) at ıSi = −98, −104 and −110 ppm assigned to Q2, Q3
nd Q4 silicon atoms [9] linked respectively to two, three or four–Si groups which represent a silica network. Without CP the sig-als of Q2 and Q3 silicon are weaker and difficult to distinguish.his confirms the presence of hydroxyl final groups of silica of Q2
nd Q3 silicon [–(SiO)2–Si–(OH)2] and [–(SiO)3–Si–(OH)] that per-it to enhance the signal of those bands that would be lost in
he background noise otherwise. The second band, remaining atSi = −66 ppm (T3 Si) corroborates what has been observed in 13CMR, that is to say Si–C bonds. However, this bond is not presentithout CP. If we assume that CP is efficient in our experimen-
al conditions, it means that the quantity of T3 Si in the residues very low and that their detection is difficult because of theon-enhancing effect of CP. Thus, during its degradation, OMPOSSegrades into a silica network while conserving Si–CH3 endingroups that were present in the initial cages.
.2.2. PyrolysisThe 13C NMR analysis of the residues of OMPOSS after the TVA is
resented in Fig. 14. A broad band is distinguishable between ıC = 0nd −10 ppm as for the degradation in air, so it is possible to drawhe same conclusions, that is to say the presence of Si–C bonds andragments that have close chemical shifts. Fig. 15 represents the 29Sipectrum of the residues of OMPOSS after the TVA. Same bands areresent as for the residues of the degradation under air at 500 ◦CQ4, Q3, Q2 Si at ıSi = −110 ppm and T3 Si at ıSi = −66 ppm). How-ver, an additional peak appears at ıSi = −20 ppm. This chemicalhift is characteristic of D2 Si (–R2–Si–(OSi)2). During the degrada-ion, OMPOSS rearranges to form a silica network which terminalroups contain one or two methyl groups. It is possible to supposehat under air, these D2 Si, which are not present in the residue, arexidised and lead to the formation of Si of type Q or T.
.2.3. Gas phase analysisThe chromatogram obtained for the gases evolved during pyrol-
sis of OMPOSS at 500 ◦C is presented in Fig. 16. Pollutants suchs acetone or acetaldehyde are present in the bigger peaks of the
Fig. 16. Chromatogram of the gases evolved from the py
Fig. 15. 29Si NMR CP MAS spectrum of the residues of OMPOSS after the TVA.
chromatogram but their probability to come from OMPOSS is verylow. However, at 1.99 and 3.41 (time unit) the mass spectra (Fig. 17)reveal the presence of siliconorganic species that can be attributedrespectively to trimethylsilanol (M0 Si) or hexamethyldisiloxane(M1 Si) whose chemical formula and mass spectra are presentedin Fig. 18. (NB: The trimethyl silanol can result from the hydrolysisof hexamethyl disiloxane.)
In the gas phase, reduced siliconorganic species compared to theone in the condensed phase are found. During the pyrolysis, a partof the T3 silicon of the OMPOSS is reduced into M1 or M0 Si, whereasanother part is oxidised into Q2, Q3 or Q4 Si.
3.3. Degradation of OMPOSS–OP950
3.3.1. Thermo-oxidative degradationIn order to study the eventual chemical interactions between
OP950 and OMPOSS, those two additives have been mixed in theproportions 90/10 (we remind the reader it is at this ratio that thehighest synergistic effect in terms of flame retardancy is obtained[5]). In Table 1, it is observed that the residues of the thermal treat-ment of the mix at 300 and 500 ◦C are similar to the residues of thethermal treatment of OP950. That is to say, at 300 ◦C, the OP950 hasmelt and has solidified while going back to room temperature. At500 ◦C, the mix has intumesced leading to an expanded carbona-ceous product. At 400 ◦C however, whereas OP950 was only melted,its mixture with OP950 has intumesced to form a black crust on thetop and a white rigid mousse residue inside.
In Figs. 19–21 are presented respectively the 13C CP MAS, the29Si CP MAS and the 31P CP MAS and MAS NMR spectra of themix OP950–OMPOSS and of its residues after the different ther-mal treatments. The spectra, whatever the temperature of thermaltreatment, consist in the superposition of the spectra of OP950 andOMPOSS taken separately. In 13C NMR the peaks of the aliphaticcarbons are found between ıc = −10 and 25 ppm. After a 400 ◦C ther-mal treatment, the peak relative to the carbons of OMPOSS is lessdetectable but after the 500 ◦C thermal treatment, all the peaks are
found which show that the peaks of the phosphinate have theirintensity lowered. The formation of condensed aromatic carbonsafter the 500 ◦C thermal treatment is visible because of the peak atıc = 130 ppm assigned to aromatic carbons.rolysis of OMPOSS at 500 ◦C in the trap at −80 ◦C.

A. Vannier et al. / Thermochimica Acta 495 (2009) 155–166 161
Fig. 17. Mass spectra of the products coming from the pyrolysis of OMPOSS at 500 ◦C.
F
daaoaopqm
d
Ft
ig. 18. Spectra and structures of trimethyl silanol and hexamethyldisiloxane.
In 29Si NMR, peaks corresponding to T3 silicon (−66 ppm) areetected as shown in the previous section as well as the peaksttributed to Q3 and Q4 silicons of the silica network (ıSi = −103nd −110 ppm) from the 400 ◦C thermal treatment. The resolutionf these last peaks is nevertheless lower than for OMPOSS treatedlone. The formation of amorphous silica leads to the enlargementf the peak. Moreover, we established that OMPOSS was decom-
osing to gas products and/or sublimating and according to the fewuantity of OMPOSS in the mix at the beginning (10%), the loss ofaterial explains the loss of the signal.In 31P NMR, peaks that were observed for OP950 alone are alsoetected here. Peaks relative to phosphinates at ıP = 45, 47, 52 and
ig. 19. 13C CP MAS NMR spectra of the mix OP950–OMPOSS and of the residues ofhe mix after thermal treatments.
Fig. 20. 29Si CP MAS NMR spectra of the mix OP950–OMPOSS and of the residues ofits thermal treatments.
53 ppm are observed at ambient temperature. The presence of anamorphous phase and thus of a broad band centred at 50 ppm at300 and 400 ◦C is highlighted. Finally, peaks attributed to phospho-nates (ıP = 24 ppm), phosphates (ıP = −2 ppm) and pyrophosphates(ıP = −10 ppm) are visible after the 500 ◦C thermal treatment anddetectable from the 400 ◦C thermal treatment.
No additional species is formed during the simultaneous degra-dation of OP950 and OMPOSS. Those two components do not reactone with the other. That is why the TVA analysis has not beenperformed on the mix.
Fig. 21. 31P DD NMR spectra of the mix OP950–OMPOSS and of the residues of itsthermal treatments (CP MAS thick curves and MAS thin curves).
162 A. Vannier et al. / Thermochimica Acta 495 (2009) 155–166
F
3
3
ott(tiPabbi
oai
3
Pporboc
3
mpatmwp
ttns
ai1a
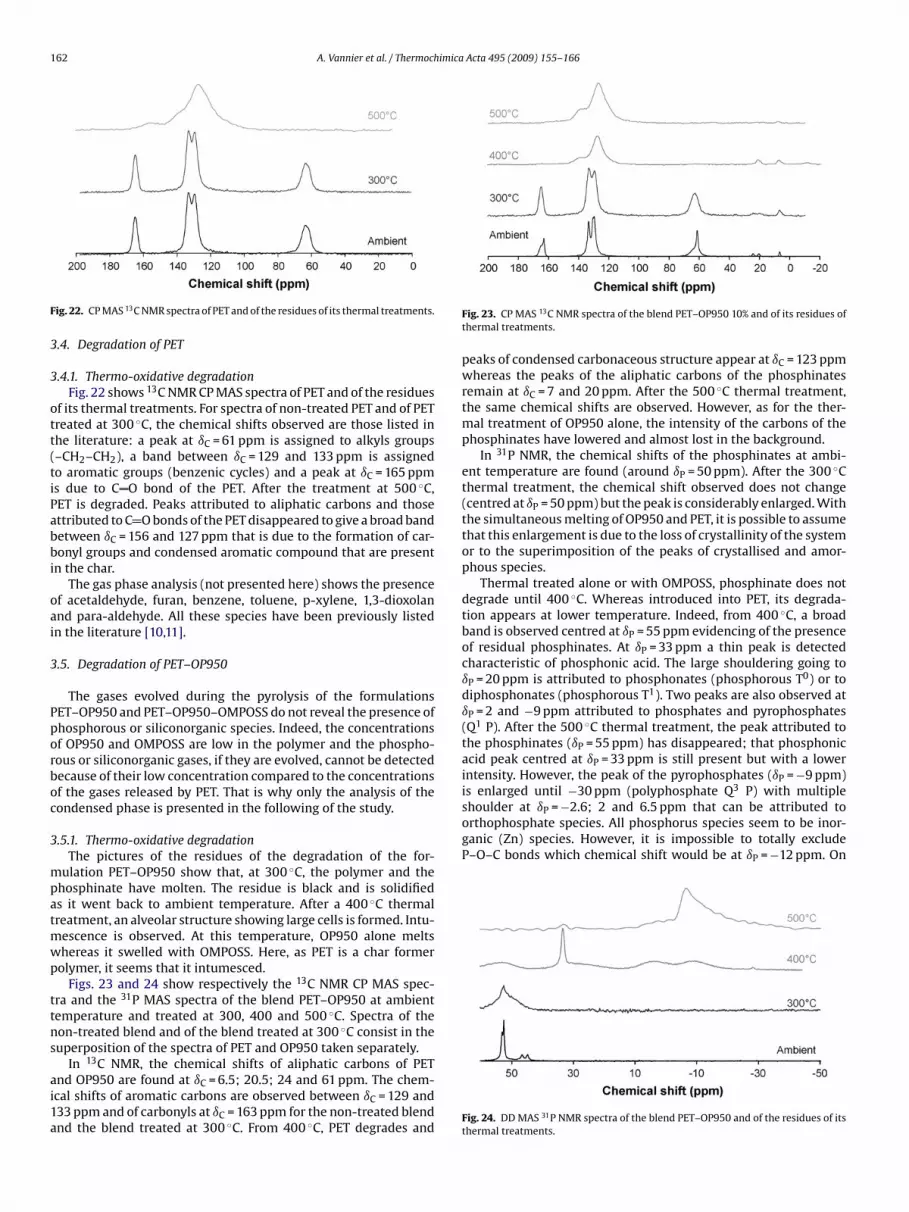
is enlarged until −30 ppm (polyphosphate Q P) with multipleshoulder at ıP = −2.6; 2 and 6.5 ppm that can be attributed toorthophosphate species. All phosphorus species seem to be inor-ganic (Zn) species. However, it is impossible to totally excludeP–O–C bonds which chemical shift would be at ıP = −12 ppm. On
ig. 22. CP MAS 13C NMR spectra of PET and of the residues of its thermal treatments.
.4. Degradation of PET
.4.1. Thermo-oxidative degradationFig. 22 shows 13C NMR CP MAS spectra of PET and of the residues
f its thermal treatments. For spectra of non-treated PET and of PETreated at 300 ◦C, the chemical shifts observed are those listed inhe literature: a peak at ıC = 61 ppm is assigned to alkyls groups–CH2–CH2), a band between ıC = 129 and 133 ppm is assignedo aromatic groups (benzenic cycles) and a peak at ıC = 165 ppms due to C O bond of the PET. After the treatment at 500 ◦C,ET is degraded. Peaks attributed to aliphatic carbons and thosettributed to C O bonds of the PET disappeared to give a broad bandetween ıC = 156 and 127 ppm that is due to the formation of car-onyl groups and condensed aromatic compound that are present
n the char.The gas phase analysis (not presented here) shows the presence
f acetaldehyde, furan, benzene, toluene, p-xylene, 1,3-dioxolannd para-aldehyde. All these species have been previously listedn the literature [10,11].
.5. Degradation of PET–OP950
The gases evolved during the pyrolysis of the formulationsET–OP950 and PET–OP950–OMPOSS do not reveal the presence ofhosphorous or siliconorganic species. Indeed, the concentrationsf OP950 and OMPOSS are low in the polymer and the phospho-ous or siliconorganic gases, if they are evolved, cannot be detectedecause of their low concentration compared to the concentrationsf the gases released by PET. That is why only the analysis of theondensed phase is presented in the following of the study.
.5.1. Thermo-oxidative degradationThe pictures of the residues of the degradation of the for-
ulation PET–OP950 show that, at 300 ◦C, the polymer and thehosphinate have molten. The residue is black and is solidifieds it went back to ambient temperature. After a 400 ◦C thermalreatment, an alveolar structure showing large cells is formed. Intu-
escence is observed. At this temperature, OP950 alone meltshereas it swelled with OMPOSS. Here, as PET is a char former
olymer, it seems that it intumesced.Figs. 23 and 24 show respectively the 13C NMR CP MAS spec-
ra and the 31P MAS spectra of the blend PET–OP950 at ambientemperature and treated at 300, 400 and 500 ◦C. Spectra of theon-treated blend and of the blend treated at 300 ◦C consist in theuperposition of the spectra of PET and OP950 taken separately.
In 13C NMR, the chemical shifts of aliphatic carbons of PETnd OP950 are found at ıC = 6.5; 20.5; 24 and 61 ppm. The chem-cal shifts of aromatic carbons are observed between ıC = 129 and33 ppm and of carbonyls at ıC = 163 ppm for the non-treated blendnd the blend treated at 300 ◦C. From 400 ◦C, PET degrades and
Fig. 23. CP MAS 13C NMR spectra of the blend PET–OP950 10% and of its residues ofthermal treatments.
peaks of condensed carbonaceous structure appear at ıC = 123 ppmwhereas the peaks of the aliphatic carbons of the phosphinatesremain at ıC = 7 and 20 ppm. After the 500 ◦C thermal treatment,the same chemical shifts are observed. However, as for the ther-mal treatment of OP950 alone, the intensity of the carbons of thephosphinates have lowered and almost lost in the background.
In 31P NMR, the chemical shifts of the phosphinates at ambi-ent temperature are found (around ıP = 50 ppm). After the 300 ◦Cthermal treatment, the chemical shift observed does not change(centred at ıP = 50 ppm) but the peak is considerably enlarged. Withthe simultaneous melting of OP950 and PET, it is possible to assumethat this enlargement is due to the loss of crystallinity of the systemor to the superimposition of the peaks of crystallised and amor-phous species.
Thermal treated alone or with OMPOSS, phosphinate does notdegrade until 400 ◦C. Whereas introduced into PET, its degrada-tion appears at lower temperature. Indeed, from 400 ◦C, a broadband is observed centred at ıP = 55 ppm evidencing of the presenceof residual phosphinates. At ıP = 33 ppm a thin peak is detectedcharacteristic of phosphonic acid. The large shouldering going toıP = 20 ppm is attributed to phosphonates (phosphorous T0) or todiphosphonates (phosphorous T1). Two peaks are also observed atıP = 2 and −9 ppm attributed to phosphates and pyrophosphates(Q1 P). After the 500 ◦C thermal treatment, the peak attributed tothe phosphinates (ıP = 55 ppm) has disappeared; that phosphonicacid peak centred at ıP = 33 ppm is still present but with a lowerintensity. However, the peak of the pyrophosphates (ıP = −9 ppm)
3
Fig. 24. DD MAS 31P NMR spectra of the blend PET–OP950 and of the residues of itsthermal treatments.
A. Vannier et al. / Thermochimica Acta 495 (2009) 155–166 163
FT
1
tw
4fipsp
3
a3
ta
th2rp
uao
3
3
tt
Fc
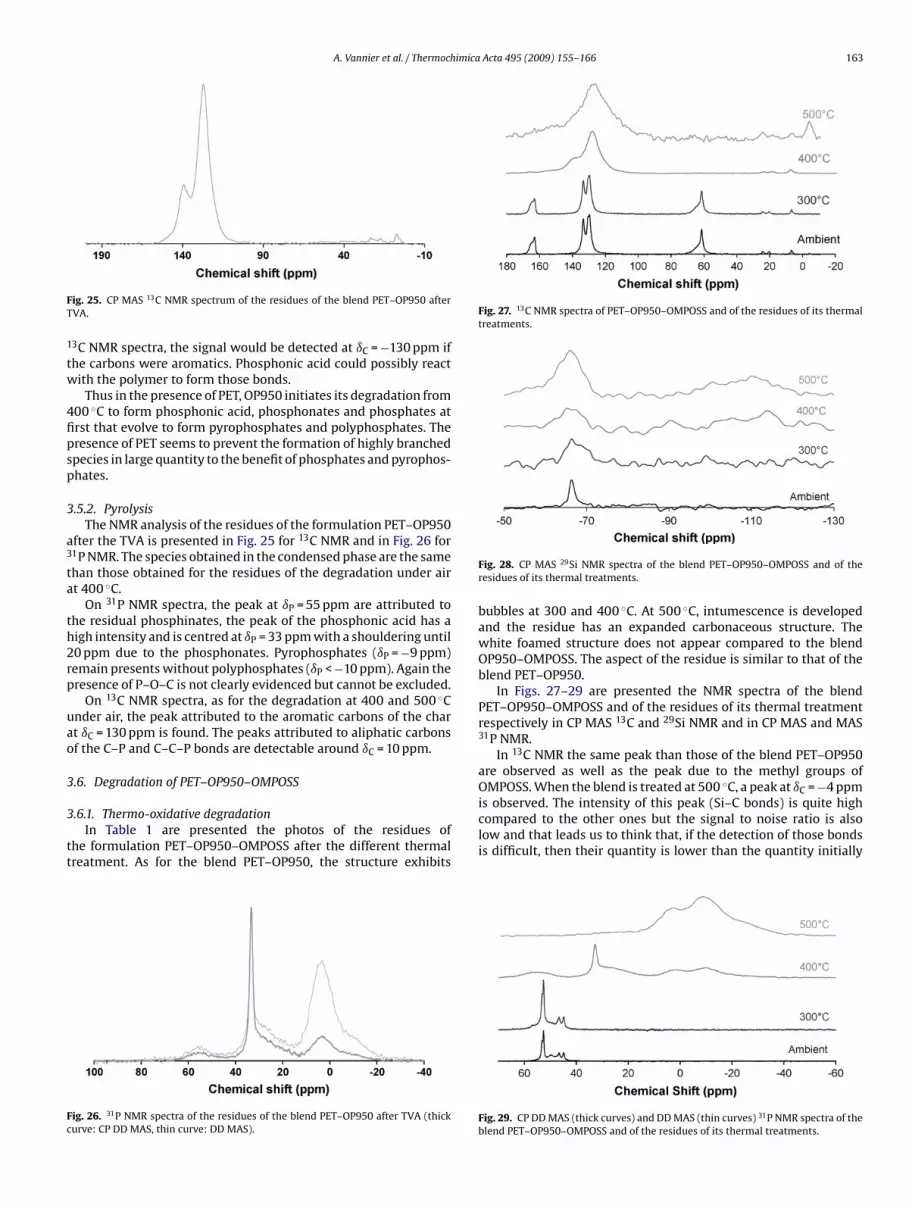
Fig. 27. 13C NMR spectra of PET–OP950–OMPOSS and of the residues of its thermaltreatments.
OMPOSS. When the blend is treated at 500 C, a peak at ıC = −4 ppm
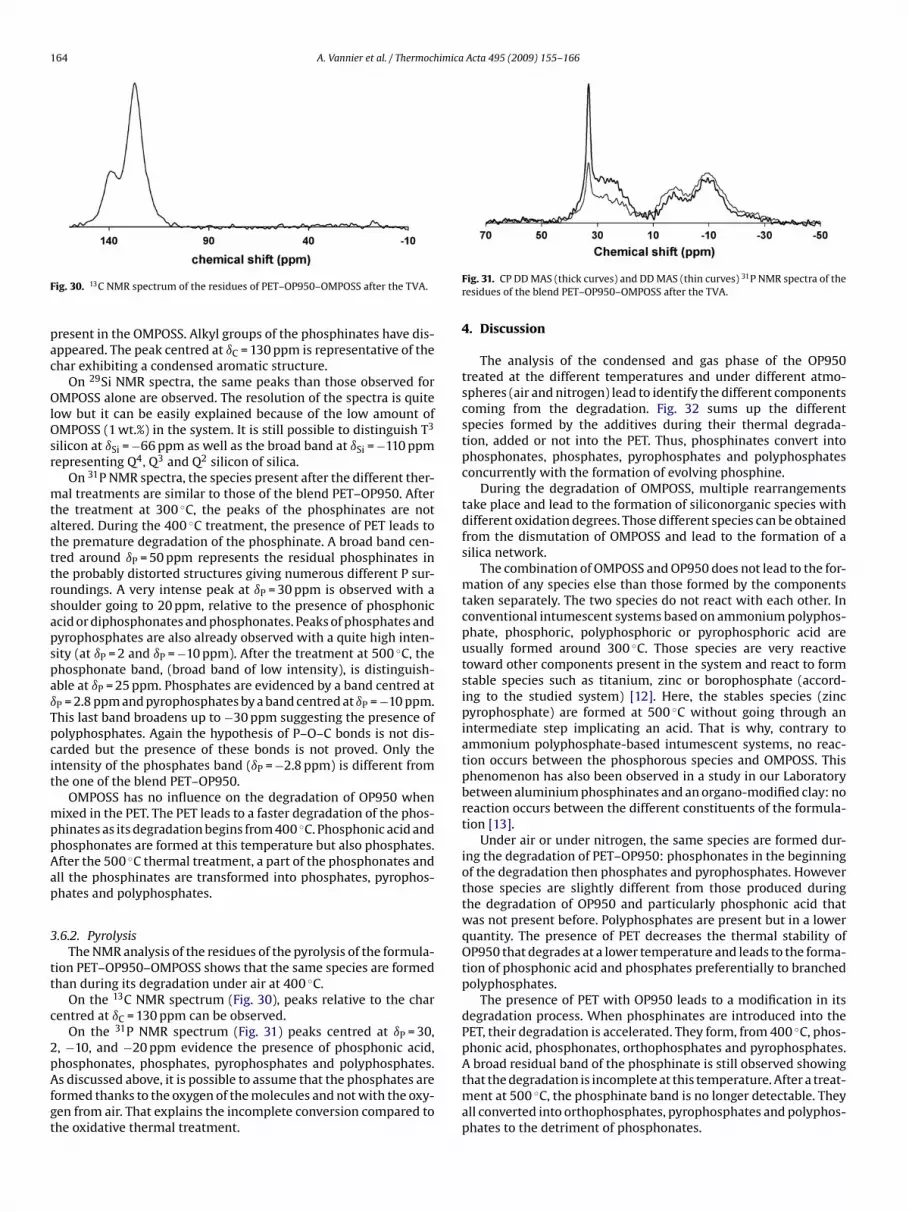
ig. 25. CP MAS 13C NMR spectrum of the residues of the blend PET–OP950 afterVA.
3C NMR spectra, the signal would be detected at ıC = −130 ppm ifhe carbons were aromatics. Phosphonic acid could possibly reactith the polymer to form those bonds.
Thus in the presence of PET, OP950 initiates its degradation from00 ◦C to form phosphonic acid, phosphonates and phosphates atrst that evolve to form pyrophosphates and polyphosphates. Theresence of PET seems to prevent the formation of highly branchedpecies in large quantity to the benefit of phosphates and pyrophos-hates.
.5.2. PyrolysisThe NMR analysis of the residues of the formulation PET–OP950
fter the TVA is presented in Fig. 25 for 13C NMR and in Fig. 26 for1P NMR. The species obtained in the condensed phase are the samehan those obtained for the residues of the degradation under airt 400 ◦C.
On 31P NMR spectra, the peak at ıP = 55 ppm are attributed tohe residual phosphinates, the peak of the phosphonic acid has aigh intensity and is centred at ıP = 33 ppm with a shouldering until0 ppm due to the phosphonates. Pyrophosphates (ıP = −9 ppm)emain presents without polyphosphates (ıP < −10 ppm). Again theresence of P–O–C is not clearly evidenced but cannot be excluded.
On 13C NMR spectra, as for the degradation at 400 and 500 ◦Cnder air, the peak attributed to the aromatic carbons of the chart ıC = 130 ppm is found. The peaks attributed to aliphatic carbonsf the C–P and C–C–P bonds are detectable around ıC = 10 ppm.
.6. Degradation of PET–OP950–OMPOSS
.6.1. Thermo-oxidative degradationIn Table 1 are presented the photos of the residues of
he formulation PET–OP950–OMPOSS after the different thermalreatment. As for the blend PET–OP950, the structure exhibits
ig. 26. 31P NMR spectra of the residues of the blend PET–OP950 after TVA (thickurve: CP DD MAS, thin curve: DD MAS).
Fig. 28. CP MAS 29Si NMR spectra of the blend PET–OP950–OMPOSS and of theresidues of its thermal treatments.
bubbles at 300 and 400 ◦C. At 500 ◦C, intumescence is developedand the residue has an expanded carbonaceous structure. Thewhite foamed structure does not appear compared to the blendOP950–OMPOSS. The aspect of the residue is similar to that of theblend PET–OP950.
In Figs. 27–29 are presented the NMR spectra of the blendPET–OP950–OMPOSS and of the residues of its thermal treatmentrespectively in CP MAS 13C and 29Si NMR and in CP MAS and MAS31P NMR.
In 13C NMR the same peak than those of the blend PET–OP950are observed as well as the peak due to the methyl groups of
◦
is observed. The intensity of this peak (Si–C bonds) is quite highcompared to the other ones but the signal to noise ratio is alsolow and that leads us to think that, if the detection of those bondsis difficult, then their quantity is lower than the quantity initially
Fig. 29. CP DD MAS (thick curves) and DD MAS (thin curves) 31P NMR spectra of theblend PET–OP950–OMPOSS and of the residues of its thermal treatments.
164 A. Vannier et al. / Thermochimica Acta 495 (2009) 155–166
F
pac
OlOsr
mtatttrsapspaıTpcit
mppAap
3
tt
c
2pAfgt
A broad residual band of the phosphinate is still observed showing
ig. 30. 13C NMR spectrum of the residues of PET–OP950–OMPOSS after the TVA.
resent in the OMPOSS. Alkyl groups of the phosphinates have dis-ppeared. The peak centred at ıC = 130 ppm is representative of thehar exhibiting a condensed aromatic structure.
On 29Si NMR spectra, the same peaks than those observed forMPOSS alone are observed. The resolution of the spectra is quite
ow but it can be easily explained because of the low amount ofMPOSS (1 wt.%) in the system. It is still possible to distinguish T3
ilicon at ıSi = −66 ppm as well as the broad band at ıSi = −110 ppmepresenting Q4, Q3 and Q2 silicon of silica.
On 31P NMR spectra, the species present after the different ther-al treatments are similar to those of the blend PET–OP950. After
he treatment at 300 ◦C, the peaks of the phosphinates are notltered. During the 400 ◦C treatment, the presence of PET leads tohe premature degradation of the phosphinate. A broad band cen-red around ıP = 50 ppm represents the residual phosphinates inhe probably distorted structures giving numerous different P sur-oundings. A very intense peak at ıP = 30 ppm is observed with ahoulder going to 20 ppm, relative to the presence of phosphoniccid or diphosphonates and phosphonates. Peaks of phosphates andyrophosphates are also already observed with a quite high inten-ity (at ıP = 2 and ıP = −10 ppm). After the treatment at 500 ◦C, thehosphonate band, (broad band of low intensity), is distinguish-ble at ıP = 25 ppm. Phosphates are evidenced by a band centred atP = 2.8 ppm and pyrophosphates by a band centred at ıP = −10 ppm.his last band broadens up to −30 ppm suggesting the presence ofolyphosphates. Again the hypothesis of P–O–C bonds is not dis-arded but the presence of these bonds is not proved. Only thentensity of the phosphates band (ıP = −2.8 ppm) is different fromhe one of the blend PET–OP950.
OMPOSS has no influence on the degradation of OP950 whenixed in the PET. The PET leads to a faster degradation of the phos-
hinates as its degradation begins from 400 ◦C. Phosphonic acid andhosphonates are formed at this temperature but also phosphates.fter the 500 ◦C thermal treatment, a part of the phosphonates andll the phosphinates are transformed into phosphates, pyrophos-hates and polyphosphates.
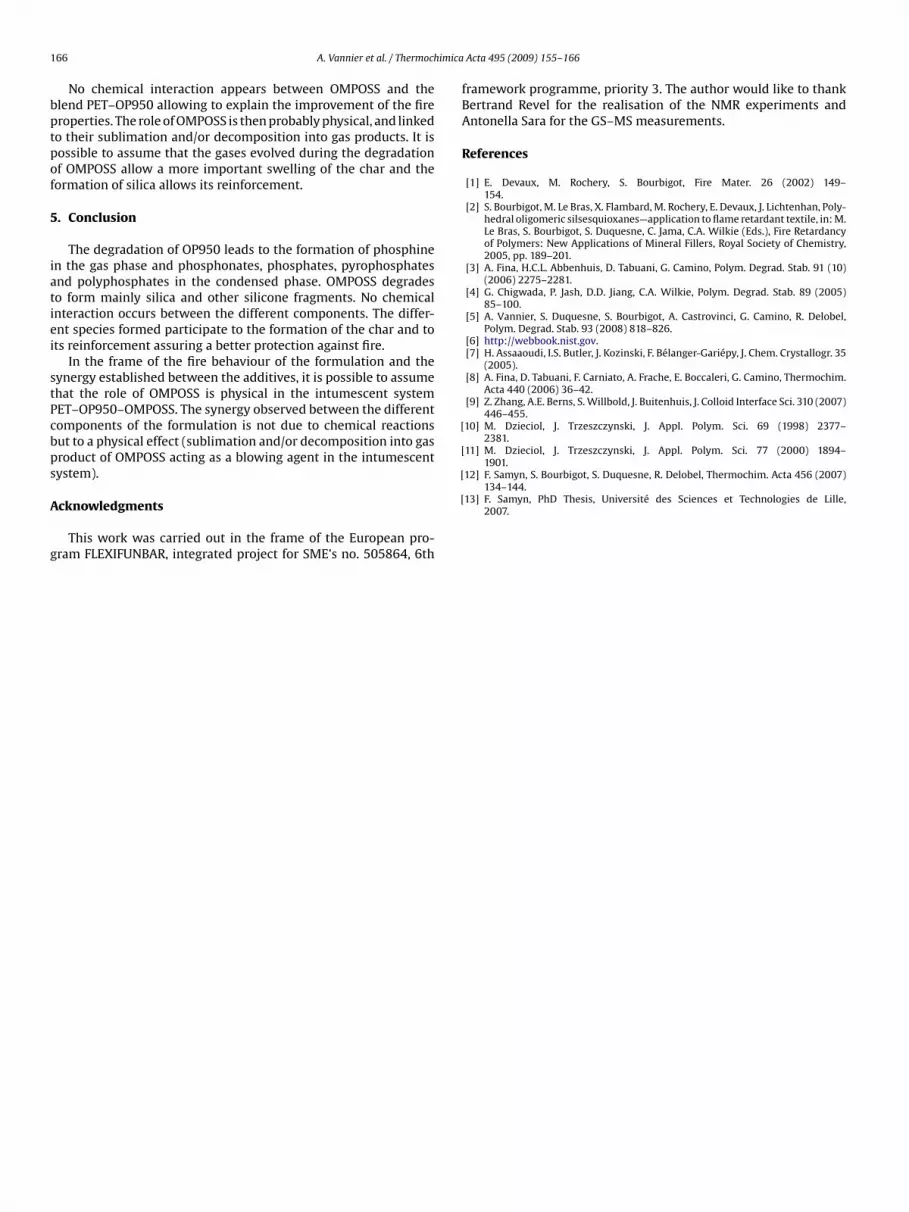
.6.2. PyrolysisThe NMR analysis of the residues of the pyrolysis of the formula-
ion PET–OP950–OMPOSS shows that the same species are formedhan during its degradation under air at 400 ◦C.
On the 13C NMR spectrum (Fig. 30), peaks relative to the charentred at ıC = 130 ppm can be observed.
On the 31P NMR spectrum (Fig. 31) peaks centred at ıP = 30,, −10, and −20 ppm evidence the presence of phosphonic acid,hosphonates, phosphates, pyrophosphates and polyphosphates.
s discussed above, it is possible to assume that the phosphates areormed thanks to the oxygen of the molecules and not with the oxy-en from air. That explains the incomplete conversion compared tohe oxidative thermal treatment.
Fig. 31. CP DD MAS (thick curves) and DD MAS (thin curves) 31P NMR spectra of theresidues of the blend PET–OP950–OMPOSS after the TVA.
4. Discussion
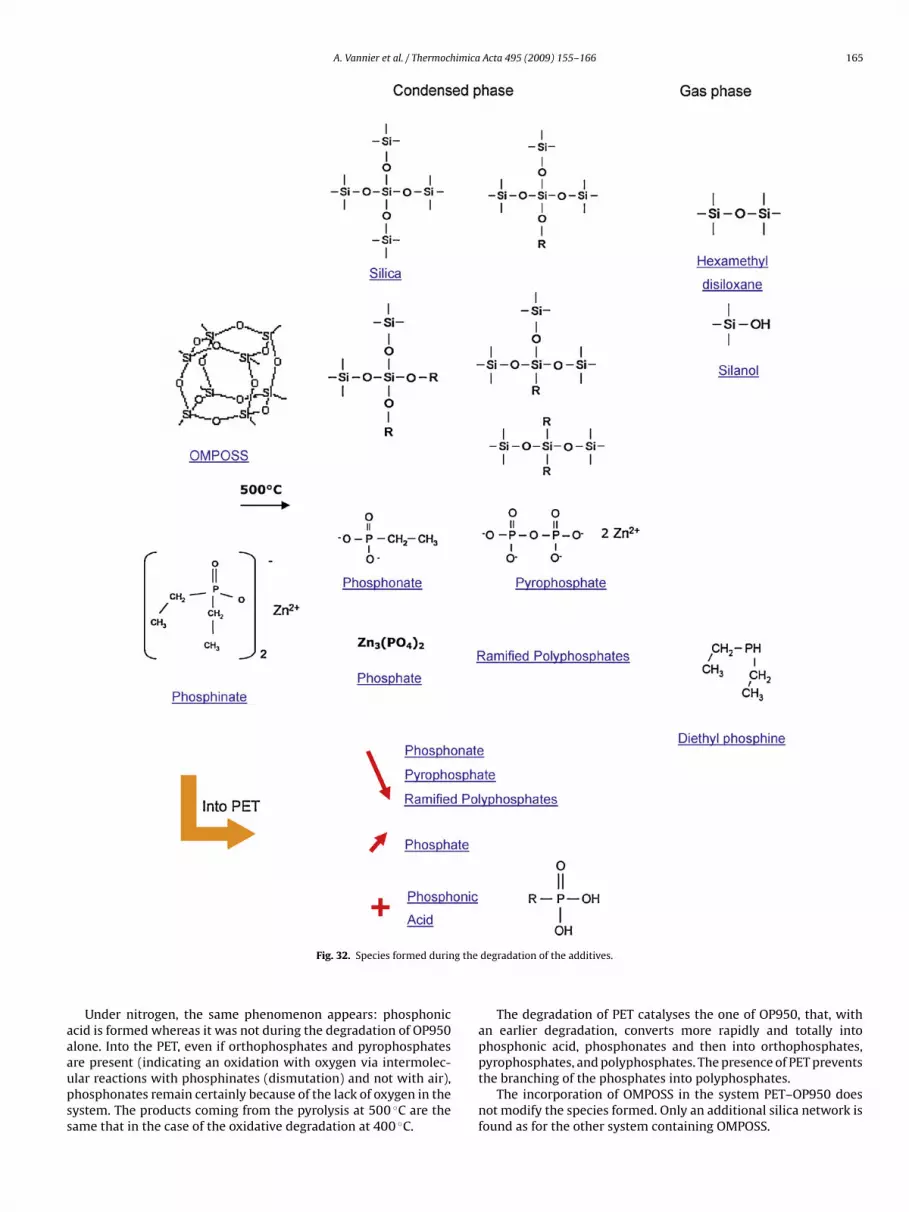
The analysis of the condensed and gas phase of the OP950treated at the different temperatures and under different atmo-spheres (air and nitrogen) lead to identify the different componentscoming from the degradation. Fig. 32 sums up the differentspecies formed by the additives during their thermal degrada-tion, added or not into the PET. Thus, phosphinates convert intophosphonates, phosphates, pyrophosphates and polyphosphatesconcurrently with the formation of evolving phosphine.
During the degradation of OMPOSS, multiple rearrangementstake place and lead to the formation of siliconorganic species withdifferent oxidation degrees. Those different species can be obtainedfrom the dismutation of OMPOSS and lead to the formation of asilica network.
The combination of OMPOSS and OP950 does not lead to the for-mation of any species else than those formed by the componentstaken separately. The two species do not react with each other. Inconventional intumescent systems based on ammonium polyphos-phate, phosphoric, polyphosphoric or pyrophosphoric acid areusually formed around 300 ◦C. Those species are very reactivetoward other components present in the system and react to formstable species such as titanium, zinc or borophosphate (accord-ing to the studied system) [12]. Here, the stables species (zincpyrophosphate) are formed at 500 ◦C without going through anintermediate step implicating an acid. That is why, contrary toammonium polyphosphate-based intumescent systems, no reac-tion occurs between the phosphorous species and OMPOSS. Thisphenomenon has also been observed in a study in our Laboratorybetween aluminium phosphinates and an organo-modified clay: noreaction occurs between the different constituents of the formula-tion [13].
Under air or under nitrogen, the same species are formed dur-ing the degradation of PET–OP950: phosphonates in the beginningof the degradation then phosphates and pyrophosphates. Howeverthose species are slightly different from those produced duringthe degradation of OP950 and particularly phosphonic acid thatwas not present before. Polyphosphates are present but in a lowerquantity. The presence of PET decreases the thermal stability ofOP950 that degrades at a lower temperature and leads to the forma-tion of phosphonic acid and phosphates preferentially to branchedpolyphosphates.
The presence of PET with OP950 leads to a modification in itsdegradation process. When phosphinates are introduced into thePET, their degradation is accelerated. They form, from 400 ◦C, phos-phonic acid, phosphonates, orthophosphates and pyrophosphates.
that the degradation is incomplete at this temperature. After a treat-ment at 500 ◦C, the phosphinate band is no longer detectable. Theyall converted into orthophosphates, pyrophosphates and polyphos-phates to the detriment of phosphonates.
A. Vannier et al. / Thermochimica Acta 495 (2009) 155–166 165
g the
aaaupss
Fig. 32. Species formed durin
Under nitrogen, the same phenomenon appears: phosphoniccid is formed whereas it was not during the degradation of OP950lone. Into the PET, even if orthophosphates and pyrophosphates
re present (indicating an oxidation with oxygen via intermolec-lar reactions with phosphinates (dismutation) and not with air),hosphonates remain certainly because of the lack of oxygen in theystem. The products coming from the pyrolysis at 500 ◦C are theame that in the case of the oxidative degradation at 400 ◦C.degradation of the additives.
The degradation of PET catalyses the one of OP950, that, withan earlier degradation, converts more rapidly and totally intophosphonic acid, phosphonates and then into orthophosphates,
pyrophosphates, and polyphosphates. The presence of PET preventsthe branching of the phosphates into polyphosphates.The incorporation of OMPOSS in the system PET–OP950 doesnot modify the species formed. Only an additional silica network isfound as for the other system containing OMPOSS.
1 imica
bptpof
5
iatiei
stPcbps
A
g
[
[11] M. Dzieciol, J. Trzeszczynski, J. Appl. Polym. Sci. 77 (2000) 1894–1901.
[12] F. Samyn, S. Bourbigot, S. Duquesne, R. Delobel, Thermochim. Acta 456 (2007)
66 A. Vannier et al. / Thermoch
No chemical interaction appears between OMPOSS and thelend PET–OP950 allowing to explain the improvement of the fireroperties. The role of OMPOSS is then probably physical, and linkedo their sublimation and/or decomposition into gas products. It isossible to assume that the gases evolved during the degradationf OMPOSS allow a more important swelling of the char and theormation of silica allows its reinforcement.
. Conclusion
The degradation of OP950 leads to the formation of phosphinen the gas phase and phosphonates, phosphates, pyrophosphatesnd polyphosphates in the condensed phase. OMPOSS degradeso form mainly silica and other silicone fragments. No chemicalnteraction occurs between the different components. The differ-nt species formed participate to the formation of the char and tots reinforcement assuring a better protection against fire.
In the frame of the fire behaviour of the formulation and theynergy established between the additives, it is possible to assumehat the role of OMPOSS is physical in the intumescent systemET–OP950–OMPOSS. The synergy observed between the differentomponents of the formulation is not due to chemical reactionsut to a physical effect (sublimation and/or decomposition into gasroduct of OMPOSS acting as a blowing agent in the intumescentystem).
cknowledgments
This work was carried out in the frame of the European pro-ram FLEXIFUNBAR, integrated project for SME’s no. 505864, 6th
[
Acta 495 (2009) 155–166
framework programme, priority 3. The author would like to thankBertrand Revel for the realisation of the NMR experiments andAntonella Sara for the GS–MS measurements.
References
[1] E. Devaux, M. Rochery, S. Bourbigot, Fire Mater. 26 (2002) 149–154.
[2] S. Bourbigot, M. Le Bras, X. Flambard, M. Rochery, E. Devaux, J. Lichtenhan, Poly-hedral oligomeric silsesquioxanes—application to flame retardant textile, in: M.Le Bras, S. Bourbigot, S. Duquesne, C. Jama, C.A. Wilkie (Eds.), Fire Retardancyof Polymers: New Applications of Mineral Fillers, Royal Society of Chemistry,2005, pp. 189–201.
[3] A. Fina, H.C.L. Abbenhuis, D. Tabuani, G. Camino, Polym. Degrad. Stab. 91 (10)(2006) 2275–2281.
[4] G. Chigwada, P. Jash, D.D. Jiang, C.A. Wilkie, Polym. Degrad. Stab. 89 (2005)85–100.
[5] A. Vannier, S. Duquesne, S. Bourbigot, A. Castrovinci, G. Camino, R. Delobel,Polym. Degrad. Stab. 93 (2008) 818–826.
[6] http://webbook.nist.gov.[7] H. Assaaoudi, I.S. Butler, J. Kozinski, F. Bélanger-Gariépy, J. Chem. Crystallogr. 35
(2005).[8] A. Fina, D. Tabuani, F. Carniato, A. Frache, E. Boccaleri, G. Camino, Thermochim.
Acta 440 (2006) 36–42.[9] Z. Zhang, A.E. Berns, S. Willbold, J. Buitenhuis, J. Colloid Interface Sci. 310 (2007)
446–455.10] M. Dzieciol, J. Trzeszczynski, J. Appl. Polym. Sci. 69 (1998) 2377–
2381.
134–144.13] F. Samyn, PhD Thesis, Université des Sciences et Technologies de Lille,
2007.