Investigation of the Photobleaching Process of Eosin Y in Aqueous Solution by Thermal Lens...
6
Investigation of the Photobleaching Process of Eosin Y in Aqueous Solution by Thermal Lens Spectroscopy L. S. Herculano,* L. C. Malacarne, V. S. Zanuto, G. V. B. Lukasievicz, O. A. Capeloto, and N. G. C. Astrath* Departamento de Física, Universidade Estadual de Maringa ́ , Av. Colombo 5790, Maringa ́ - PR, 87020-900, Brazil ABSTRACT: Eosin Y is known to be a powerful probe of biological molecules and an efficient photosensitizing agent for the production of singlet molecular oxygen. Under continuous laser excitation, degradation through photobleaching is observed in aqueous solutions of eosin Y; this process is driven by the production of singlet oxygen. Optical bleaching in aqueous solutions is known to yield anomalous thermal lens transient signals, which can be evaluated by modeling the relaxation processes that give rise to the generation of heat in the solution. A model describing photobleaching in the thermal lens transient signal is derived and is applied to investigate eosin Y in aqueous solutions at different temperatures. Using this model, quantitative information regarding the molecular diffusion rate, optical bleaching, and fluorescence quantum efficiency is obtained. ■ INTRODUCTION Eosin Y is a halogenated derivative of the xanthene dye fluorescein. Its fluorescent properties are highly dependent on variations in its environment, 1-5 such as solvent polarity and the presence of cationic surfactants; the environment-depend- ent fluorescence makes this organic dye a powerful probe of biological molecules. The applications of eosin Y include detection of submicrogram quantities of a wide range of proteins, 6,7 use in dye-sensitized solar cells, 8-11 photodynamic inactivation of viruses and cells and phototherapy for cancer, 12-14 in which eosin Y is used as an efficient photosensitizing agent to produce singlet molecular oxy- gen 5,15-17 ground state molecular oxygen. Numerous studies have been published over the past few decades on singlet oxygen. 1,13,14,18,19 Of particular importance to singlet oxygen’ s photochemical and photobiological processes, the resistance of dyes toward photodegradation has been systematically studied. 18,19 Although the role of singlet oxygen in photochemical reaction kinetics is mostly inferred from the photoproducts, the mechanisms of reactions with singlet oxygen are often unknown 19 or not easily identified. There are several methods for detecting the kinetics of the reactions of singlet oxygen in solutions and the photobleaching- based degradation effects of singlet oxygen on fluorescein molecules. One of these methods, emission spectroscopy, measures the emission of singlet oxygen at 1270 nm 20-22 this wavelength has a very low emission quantum yield, which reduces the sensitivity of this method. Alternatively, indirect methods, such as flash photolysis and reactive solutions, have been used. 20 In addition, time-resolved thermal lens spectros- copy has been very successful in determining the absolute quantum yield for production of singlet molecular oxygen 23-25 as well as the quantum yields of fluorescence from different sensitizers. 26 This method has very high sensitivity and detects the kinetics of reactions in very dilute solutions. 27-29 Furthermore, thermal lens spectroscopy has been applied to investigate the optical bleaching and nonlinear absorption photophysics of organic dyes. These characteristics make this technique an attractive candidate for use in studying the effects of optical degradation on the thermal, optical, and molecular properties of eosin Y during photobleaching. The thermal lens signal results from changes in the refractive index of the sample; these changes are generated by the heating produced from the optical absorption of a laser beam. The signal is proportional to the optical absorption coefficient of the sample; therefore, the signal is sensitive to changes in the concentration of the absorbing species. Recently, we applied this method to investigate photoinduced chemical reactions in aqueous solutions 30-33 and hydrocarbon fuels. 34 The theoreti- cal description of the thermal lens effect employed in those studies relied on the time dependence of the optical absorption coefficient from changes in the concentration of the absorbing species within the excited volume of the sample. Here, we report a theoretical analysis and experimental measurements that consider signals from thermal, optical bleaching and mass diffusion effects during laser-induced local heating in aqueous solutions. In this work, we investigate the temperature dependence of molecular diffusion and the kinetics of the reactions of aqueous solutions of eosin Y using time-resolved thermal lens spectroscopy. A theoretical model is used to describe the different contributions to the convoluted thermal lens signal, Received: December 4, 2012 Revised: January 15, 2013 Published: January 17, 2013 Article pubs.acs.org/JPCB © 2013 American Chemical Society 1932 dx.doi.org/10.1021/jp3119296 | J. Phys. Chem. B 2013, 117, 1932-1937
-
Upload
uemacademy -
Category
Documents
-
view
4 -
download
0
Transcript of Investigation of the Photobleaching Process of Eosin Y in Aqueous Solution by Thermal Lens...
Investigation of the Photobleaching Process of Eosin Y in AqueousSolution by Thermal Lens SpectroscopyL. S. Herculano,* L. C. Malacarne, V. S. Zanuto, G. V. B. Lukasievicz, O. A. Capeloto,and N. G. C. Astrath*
Departamento de Física, Universidade Estadual de Maringa, Av. Colombo 5790, Maringa - PR, 87020-900, Brazil
ABSTRACT: Eosin Y is known to be a powerful probe of biological molecules and anefficient photosensitizing agent for the production of singlet molecular oxygen. Undercontinuous laser excitation, degradation through photobleaching is observed in aqueoussolutions of eosin Y; this process is driven by the production of singlet oxygen. Opticalbleaching in aqueous solutions is known to yield anomalous thermal lens transient signals,which can be evaluated by modeling the relaxation processes that give rise to the generationof heat in the solution. A model describing photobleaching in the thermal lens transient signalis derived and is applied to investigate eosin Y in aqueous solutions at different temperatures.Using this model, quantitative information regarding the molecular diffusion rate, opticalbleaching, and fluorescence quantum efficiency is obtained.
■ INTRODUCTION
Eosin Y is a halogenated derivative of the xanthene dyefluorescein. Its fluorescent properties are highly dependent onvariations in its environment,1−5 such as solvent polarity andthe presence of cationic surfactants; the environment-depend-ent fluorescence makes this organic dye a powerful probe ofbiological molecules. The applications of eosin Y includedetection of submicrogram quantities of a wide range ofproteins,6,7 use in dye-sensitized solar cells,8−11 photodynamicinactivation of viruses and cells and phototherapy forcancer,12−14 in which eosin Y is used as an efficientphotosensitizing agent to produce singlet molecular oxy-gen5,15−17ground state molecular oxygen.Numerous studies have been published over the past few
decades on singlet oxygen.1,13,14,18,19 Of particular importanceto singlet oxygen’s photochemical and photobiologicalprocesses, the resistance of dyes toward photodegradation hasbeen systematically studied.18,19 Although the role of singletoxygen in photochemical reaction kinetics is mostly inferredfrom the photoproducts, the mechanisms of reactions withsinglet oxygen are often unknown19 or not easily identified.There are several methods for detecting the kinetics of the
reactions of singlet oxygen in solutions and the photobleaching-based degradation effects of singlet oxygen on fluoresceinmolecules. One of these methods, emission spectroscopy,measures the emission of singlet oxygen at 1270 nm20−22thiswavelength has a very low emission quantum yield, whichreduces the sensitivity of this method. Alternatively, indirectmethods, such as flash photolysis and reactive solutions, havebeen used.20 In addition, time-resolved thermal lens spectros-copy has been very successful in determining the absolutequantum yield for production of singlet molecular oxygen23−25
as well as the quantum yields of fluorescence from different
sensitizers.26 This method has very high sensitivity and detectsthe kinetics of reactions in very dilute solutions.27−29
Furthermore, thermal lens spectroscopy has been applied toinvestigate the optical bleaching and nonlinear absorptionphotophysics of organic dyes. These characteristics make thistechnique an attractive candidate for use in studying the effectsof optical degradation on the thermal, optical, and molecularproperties of eosin Y during photobleaching.The thermal lens signal results from changes in the refractive
index of the sample; these changes are generated by the heatingproduced from the optical absorption of a laser beam. Thesignal is proportional to the optical absorption coefficient of thesample; therefore, the signal is sensitive to changes in theconcentration of the absorbing species. Recently, we appliedthis method to investigate photoinduced chemical reactions inaqueous solutions30−33 and hydrocarbon fuels.34 The theoreti-cal description of the thermal lens effect employed in thosestudies relied on the time dependence of the optical absorptioncoefficient from changes in the concentration of the absorbingspecies within the excited volume of the sample. Here, wereport a theoretical analysis and experimental measurementsthat consider signals from thermal, optical bleaching and massdiffusion effects during laser-induced local heating in aqueoussolutions.In this work, we investigate the temperature dependence of
molecular diffusion and the kinetics of the reactions of aqueoussolutions of eosin Y using time-resolved thermal lensspectroscopy. A theoretical model is used to describe thedifferent contributions to the convoluted thermal lens signal,
Received: December 4, 2012Revised: January 15, 2013Published: January 17, 2013
Article
pubs.acs.org/JPCB
© 2013 American Chemical Society 1932 dx.doi.org/10.1021/jp3119296 | J. Phys. Chem. B 2013, 117, 1932−1937
and the time-dependent degradation of eosin Y throughphotobleaching is measured. Quantitative information regard-ing molecular diffusion and the reaction rate is obtained fortemperatures ranging from 21 to 41 °C. Additionally, thefluorescence quantum efficiency is measured in the sametemperature range.
■ THEORY
In the thermal lens experiments considered in this work, thecontinuous excitation and probe beams pass through the samevolume of a liquid sample. The excitation is provided by aGaussian-shaped laser beam, which produces a temperaturegradient with approximately the same radial distribution. Therefractive index changes according to the temperaturedistribution, creating a lens-like optical element in the sample.The effect is monitored by measuring the time-dependentintensity of the central portion of the Gaussian probe beam inthe far-field region.To model the contributions to the thermal lens signal, we
consider optical bleaching in the illuminated volume as follows.The theory describing this effect has been presentedrecently.30−34 Here, we elaborate on the approximationsconsidered in these previous works. Assuming that theabsorbed light energy can induce a chemical reaction in aphotoreacting solution, the concentration of the absorbingspecies is modified in the excited volume, generating a mass(species) gradient. This phenomenon creates a time-dependentand spatially dependent absorption coefficient, which alters thesignal accordingly. The time-dependent absorption coefficientcan be written in terms of the species concentration C(r, t) asβ(r, t) = C(r, t)ε, where ε is the molar optical absorptioncoefficient. In a very dilute solution, the relaxation processescan be assumed to be first-order or pseudo-first-order, and thetime dependence of the species concentration is given by thesolution of the following differential equation
πωσν
∂∂
− ∇ = − ω−
tC r t D C r t
Ph
C r t( , ) ( , )2
e ( , )rm
2 e
0e2
2 /20e
2
(1)
where σ is the reaction cross section, h is Planck’s constant, ν isthe optical frequency, Dm is the mass diffusion coefficient, andω0e and Pe are the radius and the optical power of the excitationlaser beam. The diffusion term in eq 1 accounts for themovement of photochemically modified species from outside toinside the excited volume by Brownian motion. It is assumedthat the drift of particles because of the thermal gradient (Soreteffect) and convection effects does not contribute to theconcentration changes. The term on the right side of eq 1accounts for the distorted Gaussian shape of the initial energydensity of the excited state because of photobleaching.28
Although it is highly desirable to have a closed-form solutionto eq 1, an analytical expression is only possible underapproximations for the spatial distribution of the concentration.Under moderate excitation power, the solution for thisequation can be determined by assuming a spatial average ofeach term of the concentration equation as C(t) = ⟨C(r, t)⟩r.This, in turn, results in a simple form for the effective rateequation, dC(t)/dt = −KTC(t). Here, the total reaction rate KTrepresents the averaged rates of photobleaching and movementbecause of molecular diffusion. The total absorption coefficientcan be written in terms of the equilibrium ratio between themolar absorptivities of the products and reactants, ε, in the
illuminated volume by β(t) = β[(1 − ε)e−KTt + ε]. β is theabsorption coefficient at t = 0.The time-dependent optical absorption coefficient acts
directly on the temperature distribution in the sample andconsequently acts directly on the signal. Assuming an isotropicand weakly absorbing material, the distribution of thetemperature rise is described by the differential equation forheat conduction
β ε ε
∂∂
− ∇
= − + ω− −
tT r t D T r t
Q
( , ) ( , )
[(1 )e ]eK t r
th2
02 /T
20e
2
(2)
where Dth = k/(ρc) is the thermal diffusivity, k is the thermalconductivity, ρ is the mass density, and c is the specific heat ofthe sample. β is the optical absorption coefficient of thereactants. Q0 = 2Peφ/(ρcπω0e
2), where φ is the fraction of theabsorbed energy available for conversion to heat. The sample istreated as an infinite medium with respect to the excitationbeam. The heat conduction equation is solved using integraltransform methods yielding31
∫
∫
β εξ
ξ
ε
ξξ
= +
+ −
+
ω ξ
ξω ξ
− +
−
−− +
⎡⎣⎢⎢
⎤⎦⎥⎥
T r t Qt
t
( , )e
1 2 /d
(1 )e
ee
1 2 /d
t r t
K t
tK
r t
0 0
(2 / )/(1 2 / )
c
0
(2 / )/(1 2 / )
c
20e
2c
T
T
20e
2c
(3)
The characteristic thermal time constant is tc = ω0e2/(4Dth).
The distribution of the temperature rise represented by eq 3changes the refractive index accordingly. The wavefront of theprobe beam is slightly distorted when it propagates through theilluminated volume of the liquid sample. This distortion can beexpressed with an additional phase shift to the probe beam byϕ(r, t) = (2π/λP)L[n(r, t) − n(0, t)],31,32 where n(r, t) = n0 +(dn/dT)T(r, t), n0 is the refractive index, L is the samplethickness, and dn/dT is the temperature coefficient of therefractive index at the probe beam wavelength λP. The phaseshift can be written in terms of the parameters m = (ω1P/ω0e)
2
and g = (r/ω1P)2 by
∫
∫
ϕ θ εξ
ξ ε
ξξ
= −
++ −
−+
ξ
ξξ
− +−
−− +
⎡⎣⎢⎢
⎛⎝⎜⎜
⎞⎠⎟⎟
⎤⎦⎥⎥
g tt t
t
( , )1 e
1 2 /d (1 )e
e1 e
1 2 /d
t mg tK t
tK
mg t
c 0
2 /(1 2 / )
c
0
2 /(1 2 / )
c
cT
Tc
(4)
ω1P is the radius of the probe beam at the sample. Theparameter θ measures the strength of the thermal lens effectand is defined by
θβλ
φ= −P Lk
nT
dd
e
P (5)
After emerging from the sample, the probe beam propagates tothe plane of the detector and the intensity of the central portionof the beam is calculated using Fresnel diffraction theory35 by
∫∫
ϕ=
| − + − |
| − + |
∞
∞I tiV g i g t g
iV g g( )
exp[ (1 ) ( , )] d
exp[ (1 ) ] d0
2
02
(6)
The Journal of Physical Chemistry B Article
dx.doi.org/10.1021/jp3119296 | J. Phys. Chem. B 2013, 117, 1932−19371933

where V = Z1/ZC, ZC is the confocal distance of the probebeam, Z1 is the distance from the probe beam waist to thesample, and ϕ(g, t) is the phase shift of the probe beam givenby eq 4. I(t) can be computed numerically and can be used tofit the experimental data. m and V are parameters of theexperimental setup that were previously determined, and θ, tc,ε, and KT are obtained from the fits.
■ EXPERIMENTAL SECTIONThe thermal lens apparatus used in this study is illustrated inFigure 1. Both the excitation and probe lasers are TEM00 cw
Gaussian beams. An argon ion laser at λe = 514.5 nm(Coherent, Model Innova 90) and a He−Ne laser at λP = 632.8nm (Melles Griot, Model 25-LHR-151-249) are used to excitethe sample and to probe it, respectively. A mechanical shutter(Thorlabs, Model SH05) controls the exposure of the sampleto the excitation laser beam. The excitation beam is focused onthe sample using a lens L1 with a focal length of f = 35 cm. Theprobe beam is focused by a lens L2 with f = 20 cm and passesthrough the sample approximately collinear with the excitationbeam. The probe beam propagates to photodiode P1 (Thorlabs,Model DET100A/M) positioned in the far-field at a distance of>4 m. A pinhole and laser line filter assembly are attached to P1.The signal from P1 is recorded by a digital oscilloscope(Tektronix, Model TDS 1001B), which is triggered byphotodiode P2 (Thorlabs, Model PDA10A).The liquid samples are contained in quartz cuvettes of L =
0.5 cm in a furnace connected to a temperature controller(Lake Shore, Model 340). Thermal lens transient signals arerecorded at different excitation laser power levels and atdifferent temperatures.An optical interferometer experimental system, previously
described in ref 36, is used to measure the temperaturedependence of the temperature coefficient of the refractiveindex (dn/dT) of the solutions. In this method, the sample isheated uniformly, and the interference between the reflectionsof a He−Ne laser beam at 632.8 nm from both cuvette surfaces
creates a temperature-dependent interferogram, which can beused to calculate dn/dT.A stock solution of 68.8 μM eosin Y was prepared by
dissolving 2.38 mg of eosin Y in Milli-Q water (Millipore WaterPurification System). The stock solution was diluted in 25.0 mLof Milli-Q water to obtain a low concentration of 43.5 nM forthe thermal lens measurements. In addition, higher concen-trations were also prepared to measure the optical absorptioncoefficient at different temperatures. A UV/vis spectropho-tometer (Perkin-Elmer, Model LAMBDA 1050) was used tomeasure the absorbance of the higher concentration solutionsat 514.5 nm, and the results were used to calculate the opticalabsorption coefficient of the low concentration solution byextrapolating the data at higher concentrations. The emissionspectrum was measured using a fluorescence spectrometer(Perkin-Elmer, Model LS 45) at an excitation wavelength of514.5 nm. Pure water was also measured using the thermal lenssetup. The solutions were prepared immediately before eachexperiment.
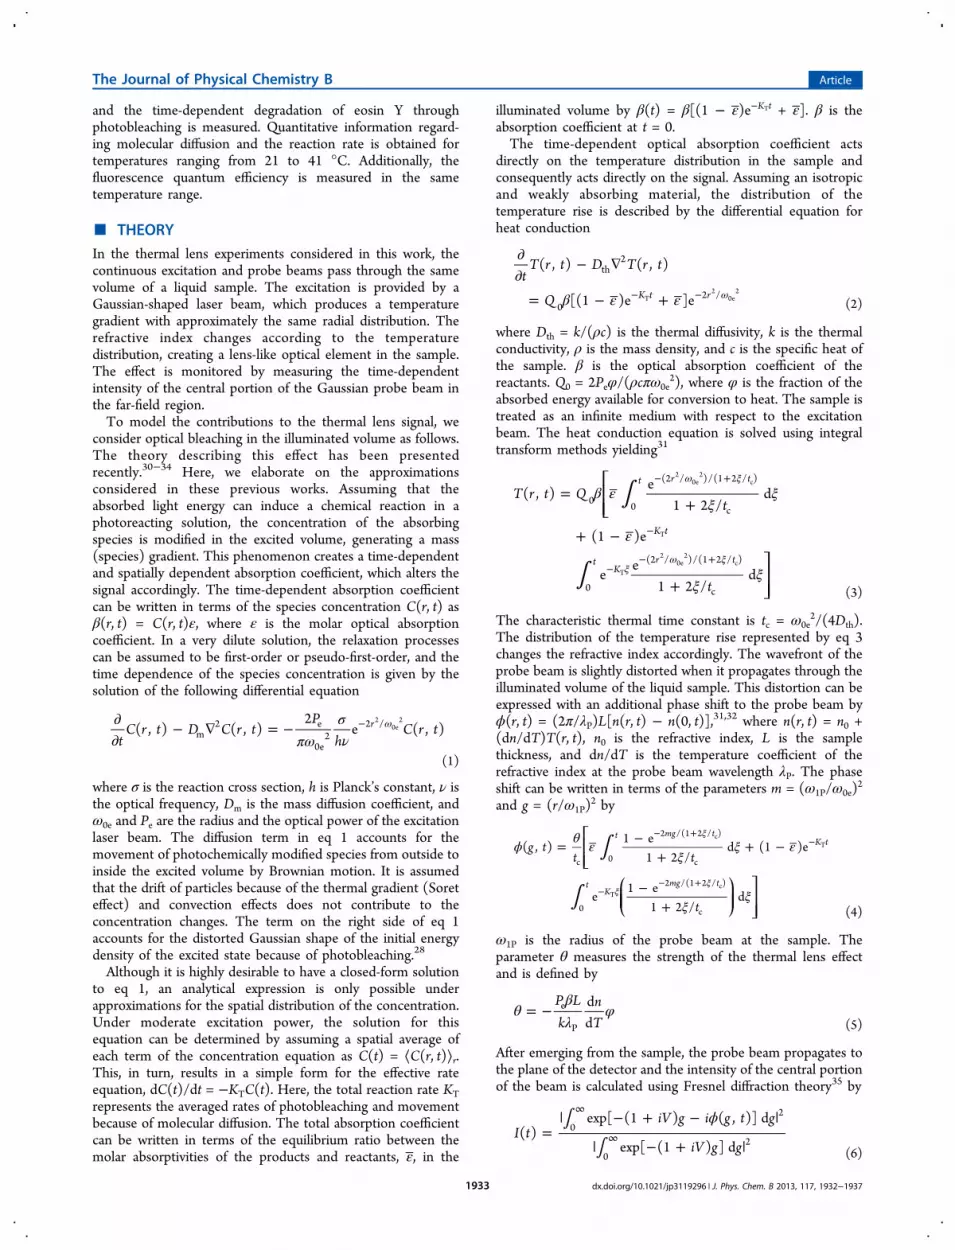
■ RESULTS AND DISCUSSIONFigure 2a shows the absorption and emission spectra of a 2.2μM aqueous solution of eosin Y at T = 21 °C. There is an
intense band at 517 nm, corresponding to the monomeric formof eosin Y, with a shoulder at 494 nm, corresponding to thedimeric form of eosin Y, as previously reported.2 The emissionspectrum has a maximum at around 540 nm and a meanemission wavelength of ⟨λem⟩ = 547 nm. The optical absorptioncoefficient of the 43.5 nM aqueous solution at 514.5 nm was
Figure 1. Schematic of the experimental setup used: Mi, mirrors; Li,lenses; Pi, photodiodes. The experimental parameters are ω0e = 70.0μm, ω1P = 415.0 μm, Z1 = 9.8 cm, ZC = 1.3 cm, m = 35.1, and V = 7.5.
Figure 2. (a) Optical absorption coefficient and emission spectra of anaqueous solution of eosin Y. (b) (open symbols) Normalized thermallens transient signals and (continuous lines) the best fit curves withI(t).
The Journal of Physical Chemistry B Article
dx.doi.org/10.1021/jp3119296 | J. Phys. Chem. B 2013, 117, 1932−19371934

calculated by extrapolating the values obtained at higherconcentrations and at different temperatures.The thermal lens experiments were performed at five
different temperatures from 21 to 41 °C on pure water and43.5 nM aqueous solutions of eosin Y. At each temperature, fivedifferent excitation powers, from 150 to 460 mW, were used. Ateach excitation power, several transients were averaged. Figure2b presents one transient at 26 °C for pure water and twotransients for eosin Y at 21 and 36 °C, in which the effect ofphotobleaching on the thermal lens signal is clearly observed.On exposing the eosin Y solutions to the excitation laser beam,the intensity of the central portion of the probe beam decreasesfor a very short time (<100 ms), during which only thermaleffects are supposed to occur. Thereafter, photobleachingsuppresses the thermal effects by reducing the concentration ofabsorbing species in the excited volume. The signal eventuallyreaches a steady state in which photobleaching and massdiffusion alter the concentration of the absorbing species in theexcited region to approach a relatively stable value. This processis discussed below.The photobleaching process observed in this solution is
driven by the production of singlet oxygen. The cw laser excitesmolecules from the ground state to the first excited singlet bandfollowing thermalization of the sensitizer to the lowest excitedsinglet state. Radiative relaxationspontaneous emissionandinternal conversion to the ground state occur from the firstexcited state band; these processes give rise to the fluorescenceobserved in Figure 2a as well as nonradiative relaxationheatgeneration. In addition, intersystem crossing produces thesensitizer triplet state, thereby allowing this triplet state togenerate singlet oxygen through an energy transfer processassisted by collision of the sensitizer with triplet oxygen. Theeosin Y molecules produce on the order of 104 molecules ofsinglet oxygen 1O2 before being degraded through photo-bleaching by 1O2 or through other processes.18
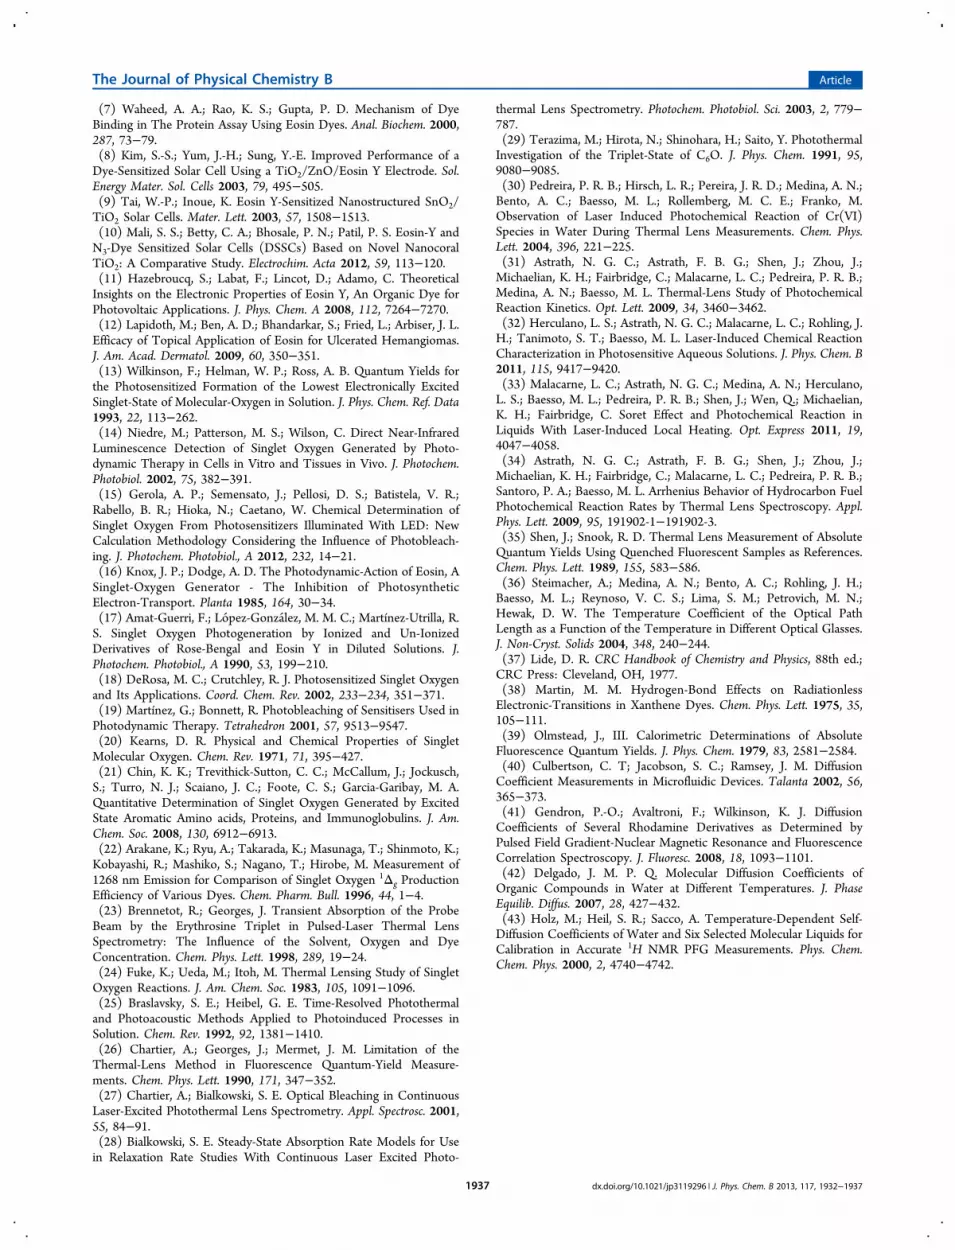
The thermal lens technique measures the slow process of thephotobleaching of eosin Y molecules by 1O2. This process canbe evaluated by fitting the transient signals of the eosin Ysolution to the thermal lens model. In this very dilute solution,the thermal and optical properties (Dth and dn/dT) areexpected to follow those of pure water. For this reason, weperformed thermal lens measurements on pure water at thesame temperatures, and using eq 4 with KT = 0, the transientswere fitted to the model without photobleaching31,32I(t).The temperature dependence of the thermal diffusivity andθwater/Pe of pure water are presented in Figure 3. Dth variedfrom (1.41 ± 0.05) × 10−7 m2 s−1 at 21 °C to (1.67 ± 0.06) ×10−7 m2 s−1 at 41 °C. Dth was later fixed and used to fit thetransients of the eosin Y solution. The continuous lines inFigure 2b represent the fit to I(t) and eq 4. The parameters θ,ε, and KT are obtained from the regressions. At 21 °C, θeosinY =(0.048 ± 0.005), ε = (0.27 ± 0.02), and KT = (1.2 ± 0.1) s−1,and at 36 °C, θeosinY = (0.071 ± 0.002), ε = (0.33 ± 0.01), andKT = (2.0 ± 0.1) s−1. The normalized θeosinY/Pe as a function oftemperature is presented in Figure 3.The parameter θ/Pe gives information on the physical
properties of the solution. For instance, it can be used tocalculate the optical absorption coefficient of pure water, usingφ = 1 in eq 5, provided k and dn/dT are known. k = Dthρc wascalculated from the measured Dth and the specific heat andmass density of water.37 At 21 °C, k = (0.59 ± 0.03) W m−1
K−1, which is in agreement with the literature values for water.37
Figure 4a shows the measured values of dn/dT for water using
the optical interferometer. The temperature coefficientdecreases approximately linearly with temperature, varyingfrom −(0.82 ± 0.02) × 10−4 K−1 at 21 °C to −(1.60 ± 0.03) ×10−4 K−1 at 41 °C. The inset shows the interferogram. Bysubstituting these values for dn/dT into eq 5, the opticalabsorption coefficient of water can be evaluated. The opticalabsorption coefficients of water and the eosin Y solution areshown in Figure 4b. For the eosin Y solution, φ = 1 − ηλe/
Figure 3. Temperature dependence of θ/Pe obtained from fits of thethermal lens transient signals for pure water (open circles) and eosin Y(open squares). The dashed and dotted lines are guides to the eye.
Figure 4. (a) Temperature dependence of dn/dT for pure water. (b)Optical absorption coefficients and fluorescence quantum efficiencyfor water and eosin Y solutions. The inset in part a shows thetemperature dependence of the optical interferogram. The dashed anddotted lines in part b are guides to the eye.
The Journal of Physical Chemistry B Article
dx.doi.org/10.1021/jp3119296 | J. Phys. Chem. B 2013, 117, 1932−19371935

⟨λem⟩, where λe is the excitation beam wavelength, ⟨λem⟩ is themean emission wavelength, and η is the fluorescence quantumefficiency. Using eq 5 for water and eosin Y, one can write
θθ
ββ
ηλ
λ= −
⟨ ⟩
⎛⎝⎜
⎞⎠⎟
PP
//
1eosinY e
water e
eosinY
water
e
em (7)
Note that dn/dT, L, λP, and k were assumed to be the same forthe dilute eosin Y solution and for water. With theseparameters, the fluorescence quantum efficiency was calculatedand the results are presented in Figure 4b. The high value for ηat 21 °C, (0.70 ± 0.02), is within the range of reported valuesfor organic dyes,26,38,39 0.4−0.8.The parameters found for the eosin Y solution from the
regression of the data are related to the rate constant and theconcentrations of the species in the theoretical model. The rateconstant KT obtained from the fit of the eosin Y signals to themodel was found to have a linear dependence on the excitationpower Pe as KT = Km + Kpb(Pe). The same behavior is observedfor all the temperatures analyzed. From the linear regression ofKT versus Pe, plots of the linear Km and angular Kpb coefficientsof KT/Pe are shown in Figure 5a. Km increases from 0.82 ± 0.04
s−1 at 21 °C to 2.6 ± 0.1 s−1 at 41 °C, whereas Kpb decreasesfrom 3.2 ± 0.2 to 1.6 ± 0.1 J−1 in the same temperature range.A plot of ε with temperature is also shown in Figure 5b.Diffusion of the absorbing species should not depend on the
excitation power. This, in fact, corresponds to the linearparameter Km or the molecular diffusion rate constant, whichcan be thought of as being related to the molecular diffusiontime constant through τm = Km
−1. Consequently, τm relates tothe molecular diffusion coefficient, through Dm = ω0e
2/(4τm).At 21 °C, a value of Dm = (1.00 ± 0.05) × 10−9 m2 s−1 was
determined, which is within the range of values reported in theliterature for fluorescein solutions.40−43 The temperaturedependence of Dm is presented in Figure 5b. This behavior isalso observed in other organic dyes in water.42,43 In turn, Kpb isrelated to the photobleaching degradation process of eosin Y.Kpb decreases as temperature increases; this decrease indicates apossible reduction in the absorption cross section as thetemperature increases. In contrast, ε shows that the molarabsorptivity of the products in the illuminated area increases astemperature increases.It is important to note that a complete evaluation of the
photobleaching of a sensitizer is a complex problem, andidentification of the individual contributions to the thermal lenssignal is always challenging. Although complex, the problemcan be qualitatively and quantitatively investigated using thethermal lens spectroscopy.
■ CONCLUSIONSThe results show that the photobleaching of eosin Y has asignificant effect on the thermal lens signal. Considering thereaction kinetics and molecular diffusion, we have modeled theoptical bleaching. Molecular diffusion drives the photochemi-cally modified species to a steady state, and the transient signalchanges accordingly. The model provided quantitative valuesfor the molecular diffusion properties, photobleaching reactionrate, and fluorescence quantum efficiency. The temperaturedependences of the physical parameters were found to be inagreement with literature data for organic dyes. Although themodel was developed specifically for a first-order or pseudo-first-order relaxation process, it should be suitable fordescribing more complex systems. The results presented heredemonstrate that time-resolved thermal lens spectroscopy canbe used as a very sensitive analytical tool for quantitativemeasurement of relaxation processes in aqueous solutions.
■ AUTHOR INFORMATIONCorresponding Author*E-mail: [email protected] (L.S.H.); [email protected] (N.G.C.A.).NotesThe authors declare no competing financial interest.
■ ACKNOWLEDGMENTSWe acknowledge financial support for this work from theBrazilian agencies CAPES, CNPq, and Fundacao Araucaria.
■ REFERENCES(1) Fleming, G. R.; Knight, A. W. E.; Morris, J. M.; Morrison, R. J. S.;Robinson, G. W. Picosecond Fluorescence Studies of Xanthene Dyes.J. Am. Chem. Soc. 1977, 99, 4306−4311.(2) Chakraborty, M.; Panda, A. K. Spectral Behaviour of Eosin Y inDifferent Solvents and Aqueous Surfactant Media. Spectrochim. Acta,Part A 2011, 81, 458−465.(3) del Valle, J. C.; Catalan, J.; Amat-Guerri, F. ComparativePhotophysical Study of Rose Bengal, Eosin Y and Their Monomethyland Dimethyl Derivatives. J. Photochem. Photobiol., A 1993, 72, 49−53.(4) Meallier, P.; Guittonneau, S.; Emmelin, C.; Konstantinova, T.Photochemistry of Fluorescein and Eosin Derivatives. Dyes Pigm.1999, 40, 95−98.(5) Grossweiner, L. I.; Zwicker, E. F. Primary Processes in ThePhotochemistry of Eosin. J. Chem. Phys. 1959, 31, 1141−1142.(6) Waheed, A. A.; Gupta, P. D. Estimation of SubmicrogramQuantities of Protein Using the Dye Eosin Y. J. Biochem. Biophys.Methods 2000, 42, 125−132.
Figure 5. Temperature dependence of (a) Km and Kpb and (b) ε andDm. The dashed and dotted lines are guides to the eye.
The Journal of Physical Chemistry B Article
dx.doi.org/10.1021/jp3119296 | J. Phys. Chem. B 2013, 117, 1932−19371936
(7) Waheed, A. A.; Rao, K. S.; Gupta, P. D. Mechanism of DyeBinding in The Protein Assay Using Eosin Dyes. Anal. Biochem. 2000,287, 73−79.(8) Kim, S.-S.; Yum, J.-H.; Sung, Y.-E. Improved Performance of aDye-Sensitized Solar Cell Using a TiO2/ZnO/Eosin Y Electrode. Sol.Energy Mater. Sol. Cells 2003, 79, 495−505.(9) Tai, W.-P.; Inoue, K. Eosin Y-Sensitized Nanostructured SnO2/TiO2 Solar Cells. Mater. Lett. 2003, 57, 1508−1513.(10) Mali, S. S.; Betty, C. A.; Bhosale, P. N.; Patil, P. S. Eosin-Y andN3-Dye Sensitized Solar Cells (DSSCs) Based on Novel NanocoralTiO2: A Comparative Study. Electrochim. Acta 2012, 59, 113−120.(11) Hazebroucq, S.; Labat, F.; Lincot, D.; Adamo, C. TheoreticalInsights on the Electronic Properties of Eosin Y, An Organic Dye forPhotovoltaic Applications. J. Phys. Chem. A 2008, 112, 7264−7270.(12) Lapidoth, M.; Ben, A. D.; Bhandarkar, S.; Fried, L.; Arbiser, J. L.Efficacy of Topical Application of Eosin for Ulcerated Hemangiomas.J. Am. Acad. Dermatol. 2009, 60, 350−351.(13) Wilkinson, F.; Helman, W. P.; Ross, A. B. Quantum Yields forthe Photosensitized Formation of the Lowest Electronically ExcitedSinglet-State of Molecular-Oxygen in Solution. J. Phys. Chem. Ref. Data1993, 22, 113−262.(14) Niedre, M.; Patterson, M. S.; Wilson, C. Direct Near-InfraredLuminescence Detection of Singlet Oxygen Generated by Photo-dynamic Therapy in Cells in Vitro and Tissues in Vivo. J. Photochem.Photobiol. 2002, 75, 382−391.(15) Gerola, A. P.; Semensato, J.; Pellosi, D. S.; Batistela, V. R.;Rabello, B. R.; Hioka, N.; Caetano, W. Chemical Determination ofSinglet Oxygen From Photosensitizers Illuminated With LED: NewCalculation Methodology Considering the Influence of Photobleach-ing. J. Photochem. Photobiol., A 2012, 232, 14−21.(16) Knox, J. P.; Dodge, A. D. The Photodynamic-Action of Eosin, ASinglet-Oxygen Generator - The Inhibition of PhotosyntheticElectron-Transport. Planta 1985, 164, 30−34.(17) Amat-Guerri, F.; Lopez-Gonzalez, M. M. C.; Martínez-Utrilla, R.S. Singlet Oxygen Photogeneration by Ionized and Un-IonizedDerivatives of Rose-Bengal and Eosin Y in Diluted Solutions. J.Photochem. Photobiol., A 1990, 53, 199−210.(18) DeRosa, M. C.; Crutchley, R. J. Photosensitized Singlet Oxygenand Its Applications. Coord. Chem. Rev. 2002, 233−234, 351−371.(19) Martínez, G.; Bonnett, R. Photobleaching of Sensitisers Used inPhotodynamic Therapy. Tetrahedron 2001, 57, 9513−9547.(20) Kearns, D. R. Physical and Chemical Properties of SingletMolecular Oxygen. Chem. Rev. 1971, 71, 395−427.(21) Chin, K. K.; Trevithick-Sutton, C. C.; McCallum, J.; Jockusch,S.; Turro, N. J.; Scaiano, J. C.; Foote, C. S.; Garcia-Garibay, M. A.Quantitative Determination of Singlet Oxygen Generated by ExcitedState Aromatic Amino acids, Proteins, and Immunoglobulins. J. Am.Chem. Soc. 2008, 130, 6912−6913.(22) Arakane, K.; Ryu, A.; Takarada, K.; Masunaga, T.; Shinmoto, K.;Kobayashi, R.; Mashiko, S.; Nagano, T.; Hirobe, M. Measurement of1268 nm Emission for Comparison of Singlet Oxygen 1Δg ProductionEfficiency of Various Dyes. Chem. Pharm. Bull. 1996, 44, 1−4.(23) Brennetot, R.; Georges, J. Transient Absorption of the ProbeBeam by the Erythrosine Triplet in Pulsed-Laser Thermal LensSpectrometry: The Influence of the Solvent, Oxygen and DyeConcentration. Chem. Phys. Lett. 1998, 289, 19−24.(24) Fuke, K.; Ueda, M.; Itoh, M. Thermal Lensing Study of SingletOxygen Reactions. J. Am. Chem. Soc. 1983, 105, 1091−1096.(25) Braslavsky, S. E.; Heibel, G. E. Time-Resolved Photothermaland Photoacoustic Methods Applied to Photoinduced Processes inSolution. Chem. Rev. 1992, 92, 1381−1410.(26) Chartier, A.; Georges, J.; Mermet, J. M. Limitation of theThermal-Lens Method in Fluorescence Quantum-Yield Measure-ments. Chem. Phys. Lett. 1990, 171, 347−352.(27) Chartier, A.; Bialkowski, S. E. Optical Bleaching in ContinuousLaser-Excited Photothermal Lens Spectrometry. Appl. Spectrosc. 2001,55, 84−91.(28) Bialkowski, S. E. Steady-State Absorption Rate Models for Usein Relaxation Rate Studies With Continuous Laser Excited Photo-
thermal Lens Spectrometry. Photochem. Photobiol. Sci. 2003, 2, 779−787.(29) Terazima, M.; Hirota, N.; Shinohara, H.; Saito, Y. PhotothermalInvestigation of the Triplet-State of C6O. J. Phys. Chem. 1991, 95,9080−9085.(30) Pedreira, P. R. B.; Hirsch, L. R.; Pereira, J. R. D.; Medina, A. N.;Bento, A. C.; Baesso, M. L.; Rollemberg, M. C. E.; Franko, M.Observation of Laser Induced Photochemical Reaction of Cr(VI)Species in Water During Thermal Lens Measurements. Chem. Phys.Lett. 2004, 396, 221−225.(31) Astrath, N. G. C.; Astrath, F. B. G.; Shen, J.; Zhou, J.;Michaelian, K. H.; Fairbridge, C.; Malacarne, L. C.; Pedreira, P. R. B.;Medina, A. N.; Baesso, M. L. Thermal-Lens Study of PhotochemicalReaction Kinetics. Opt. Lett. 2009, 34, 3460−3462.(32) Herculano, L. S.; Astrath, N. G. C.; Malacarne, L. C.; Rohling, J.H.; Tanimoto, S. T.; Baesso, M. L. Laser-Induced Chemical ReactionCharacterization in Photosensitive Aqueous Solutions. J. Phys. Chem. B2011, 115, 9417−9420.(33) Malacarne, L. C.; Astrath, N. G. C.; Medina, A. N.; Herculano,L. S.; Baesso, M. L.; Pedreira, P. R. B.; Shen, J.; Wen, Q.; Michaelian,K. H.; Fairbridge, C. Soret Effect and Photochemical Reaction inLiquids With Laser-Induced Local Heating. Opt. Express 2011, 19,4047−4058.(34) Astrath, N. G. C.; Astrath, F. B. G.; Shen, J.; Zhou, J.;Michaelian, K. H.; Fairbridge, C.; Malacarne, L. C.; Pedreira, P. R. B.;Santoro, P. A.; Baesso, M. L. Arrhenius Behavior of Hydrocarbon FuelPhotochemical Reaction Rates by Thermal Lens Spectroscopy. Appl.Phys. Lett. 2009, 95, 191902-1−191902-3.(35) Shen, J.; Snook, R. D. Thermal Lens Measurement of AbsoluteQuantum Yields Using Quenched Fluorescent Samples as References.Chem. Phys. Lett. 1989, 155, 583−586.(36) Steimacher, A.; Medina, A. N.; Bento, A. C.; Rohling, J. H.;Baesso, M. L.; Reynoso, V. C. S.; Lima, S. M.; Petrovich, M. N.;Hewak, D. W. The Temperature Coefficient of the Optical PathLength as a Function of the Temperature in Different Optical Glasses.J. Non-Cryst. Solids 2004, 348, 240−244.(37) Lide, D. R. CRC Handbook of Chemistry and Physics, 88th ed.;CRC Press: Cleveland, OH, 1977.(38) Martin, M. M. Hydrogen-Bond Effects on RadiationlessElectronic-Transitions in Xanthene Dyes. Chem. Phys. Lett. 1975, 35,105−111.(39) Olmstead, J., III. Calorimetric Determinations of AbsoluteFluorescence Quantum Yields. J. Phys. Chem. 1979, 83, 2581−2584.(40) Culbertson, C. T; Jacobson, S. C.; Ramsey, J. M. DiffusionCoefficient Measurements in Microfluidic Devices. Talanta 2002, 56,365−373.(41) Gendron, P.-O.; Avaltroni, F.; Wilkinson, K. J. DiffusionCoefficients of Several Rhodamine Derivatives as Determined byPulsed Field Gradient-Nuclear Magnetic Resonance and FluorescenceCorrelation Spectroscopy. J. Fluoresc. 2008, 18, 1093−1101.(42) Delgado, J. M. P. Q. Molecular Diffusion Coefficients ofOrganic Compounds in Water at Different Temperatures. J. PhaseEquilib. Diffus. 2007, 28, 427−432.(43) Holz, M.; Heil, S. R.; Sacco, A. Temperature-Dependent Self-Diffusion Coefficients of Water and Six Selected Molecular Liquids forCalibration in Accurate 1H NMR PFG Measurements. Phys. Chem.Chem. Phys. 2000, 2, 4740−4742.
The Journal of Physical Chemistry B Article
dx.doi.org/10.1021/jp3119296 | J. Phys. Chem. B 2013, 117, 1932−19371937