Effect of Temperature and Moisture Content on Thermal Properties of Four Types of Meat Part Two:...
12
Determination of Thermal Conductivities of Some Fish Types Ali I. Hobani, Atef M. Elansari and Khaled A. Al-Yahya Department of Agricultural Engineering, College of Food and Agricultural Sciences, King Saud University, P.O. Box 2460, Riyadh 11451, Saudi Arabia. ABSTRACT: Thermal conductivities of four fish types were measured and presented as functions of tempera- tures and moisture contents which ranged from 5-40°C and 30 to 75% (wet basis, wb), respectively. Transient techniques using a commercially constructed line source probe was followed. Fish types included Hamam (yel- low-Spotted Trevally), Kanad (Spanish Macherel), Shaoor (Emperor) and Hamour (Grouper). The obtained val- ues for thermal conductivities varied from 0.17±0.01 W/m.°C (for Hamour at 5°C and 30% moisture content) to 0.617±0.03 W/m.°C (for Hamam at 40°C and 75% moisture content). These results agreed well with those in the literature for other types. Based on statistical analysis, mathematical models relating thermal conductivity with temperature and moisture content were proposed using a multiple regression analysis fitting procedure. The sta- tistical analysis results indicated that the effect of temperature and moisture content were significant with regard to the ranges studied and proved that the relationships obtained may represent the behavior for the prediction of the thermal conductivities in the measured ranges. Keywords: Thermal conductivity, Temperature, Moisture content, Line source probe. ___________________________________________________________________________ INTRODUCTION Information on the thermal properties of food materials are highly needed by food researchers and engineers for optimizing the design and operation of various thermal processes, during which foods are exposed to heating, cooling, drying or freezing. It is also essential for the development of mathematical models where it acts as a di- rect input leading to accurate numerical re- sults. Moisture content (MC) is an impor- tant factor affecting thermal properties of biological materials (Mohsenin, 1980). Thermal conductivity (k) is determined ex- perimentally by various steady state (guarded hot plate, concentric cylinder, concentric sphere (Woodams et al. 1968)), and unsteady state methods (line source probe, thermal comparator, thermistor probe etc.). Reidy and Rippen (1971) and Singh (1982) presented an extensive review of methods used for experimental determi- nation of thermal conductivity values. Each method has several advantages and disad- vantages. Reidy (1968) and Qashou (1973) each listed in detail the sources of error in ther- mal property measurements of the various methods. Based on experimental data, many empirical and semi-empirical models for predicting both properties have been sug- gested (Hobani and Elansari, 2002). Ther- mal conductivity greatly depends on the physical characteristics of food such as temperature, size, shape, state (frozen or unfrozen), compositional parameters, (moisture content, fat content, protein, and ash) and fiber orientation. Moisture content
Transcript of Effect of Temperature and Moisture Content on Thermal Properties of Four Types of Meat Part Two:...
Determination of Thermal Conductivities of Some Fish Types
Ali I. Hobani, Atef M. Elansari and Khaled A. Al-Yahya Department of Agricultural Engineering, College of Food and Agricultural Sciences,
King Saud University, P.O. Box 2460, Riyadh 11451, Saudi Arabia.
ABSTRACT: Thermal conductivities of four fish types were measured and presented as functions of tempera-tures and moisture contents which ranged from 5-40°C and 30 to 75% (wet basis, wb), respectively. Transient techniques using a commercially constructed line source probe was followed. Fish types included Hamam (yel-low-Spotted Trevally), Kanad (Spanish Macherel), Shaoor (Emperor) and Hamour (Grouper). The obtained val-ues for thermal conductivities varied from 0.17±0.01 W/m.°C (for Hamour at 5°C and 30% moisture content) to 0.617±0.03 W/m.°C (for Hamam at 40°C and 75% moisture content). These results agreed well with those in the literature for other types. Based on statistical analysis, mathematical models relating thermal conductivity with temperature and moisture content were proposed using a multiple regression analysis fitting procedure. The sta-tistical analysis results indicated that the effect of temperature and moisture content were significant with regard to the ranges studied and proved that the relationships obtained may represent the behavior for the prediction of the thermal conductivities in the measured ranges. Keywords: Thermal conductivity, Temperature, Moisture content, Line source probe.
___________________________________________________________________________
INTRODUCTION Information on the thermal properties
of food materials are highly needed by food researchers and engineers for optimizing the design and operation of various thermal processes, during which foods are exposed to heating, cooling, drying or freezing. It is also essential for the development of mathematical models where it acts as a di-rect input leading to accurate numerical re-sults.
Moisture content (MC) is an impor-tant factor affecting thermal properties of biological materials (Mohsenin, 1980). Thermal conductivity (k) is determined ex-perimentally by various steady state (guarded hot plate, concentric cylinder, concentric sphere (Woodams et al. 1968)), and unsteady state methods (line source
probe, thermal comparator, thermistor probe etc.). Reidy and Rippen (1971) and Singh (1982) presented an extensive review of methods used for experimental determi-nation of thermal conductivity values. Each method has several advantages and disad-vantages.
Reidy (1968) and Qashou (1973) each listed in detail the sources of error in ther-mal property measurements of the various methods. Based on experimental data, many empirical and semi-empirical models for predicting both properties have been sug-gested (Hobani and Elansari, 2002). Ther-mal conductivity greatly depends on the physical characteristics of food such as temperature, size, shape, state (frozen or unfrozen), compositional parameters, (moisture content, fat content, protein, and ash) and fiber orientation. Moisture content
Ali I. Hobani, Atef M. Elansari and Khalid A. Al-Yahya 24
affects the thermal conductivity of a mate-rial. During heating of a material, moisture migration occurs if the material is moist and permeable or porous. Moisture migration involves evaporation in the warm region, transmission of the vapor by diffusion to the cooler region and condensation in the cooler region. During processing, fish products are heated, cooled and frozen. In order to analyze accurately the rate and amount of heat transfer involved, thermal properties of products being processed must be known.
Owing to the hot and harsh environ-mental conditions in the country as well as the absence of proper cooling and freezing installations, the shelf life of different fish types are likely to be very short (Al-Sheddy et al, 1999). The efficient design of fish processing operations requires knowledge of the thermal properties of the fish utilized for the manufacturing of the various value-added products. Thermal properties of a wide range of biological materials are available in the literature (Rahman 1995), however they are not documented for the selected Saudi fish cultivars covered by this study.
Therefore, our objective was to de-termine the moisture and temperature de-pendant thermal conductivity of four fish types utilized for the manufacturing of the various value-added products namely Hamam (yellow-Spotted Trevally), Kanad (Spanish Macherel), Shaoor (Emperor) and Hamour (Grouper).
MATERIALS AND METHODS
For each trial. fresh fish types were purchased from the local fish market. The
fish were headed and gutted, and the re-mainder washed with tap water. Each fish was made into fillets parallel to the back-bone. Then the fillets were grounded using an ordinary household mincer/mixer. Both the mincing and mixing processes helped to render homogeneous minced meat with the least voids when filling into the test cylin-ders. To avoid and thermal deterioration effect, procedures outlined (Nesvadba and Eunson, 1985) to obtain variable moisture content was followed. For each trial, an amount of 0.5kg were spread out in 1-cm thick layers on several trays and dried in a wind tunnel at an air temperature 24-25°C, wind speed 1.2 m/s and ambient humidity 55%. The mince was stirred at intervals to ensure uniform drying. After drying to the required moisture content (monitored by weighing the trays) the mince was either used immediately or sealed in polyethylene bags and frozen for later use. Before the thermal conductivity measurements, sam-ples were thawed by air at room tempera-ture.
The apparatus: A line source probe com-mercially constructed (KD2, Decagon De-vices Incorporation, Pullman, WA 99163, USA) was used to measure thermal conduc-tivity. The device is based on the line source probe theory as it uses a simple yet precise heating and monitoring system to measure the slope and intercept of the sam-ple specific temperature rise vs. time curve. From this data, thermal conductivity is de-rived. The basic theory behind the use of line source probe has been discussed previ-ously by Hooper and Lepper (1950) and Nix et al., (1967).
The length and diameter of the needle are 60 and 0.9 mm, respectively. The ratio
Determination of Thermal Conductivities of Some Fish Types 25
of the probe length to diameter is more than 60 giving an axial flow error of less than 0.035% (Murakami et al., 1996). The probe is heated at a constant rate and the change in temperature at the center of the food sample is noted at a short distance. The value of thermal conductivity (k) is calcu-lated by monitoring the dissipation of heat from a line heat source given a known volt-age. Hobani and Elansari (2002) have dis-cussed the equations used for the calcula-tion of this property. The probe was cali-brated using 99.5% pure glycerol (WINLAB, Leicestershire, LE16 9EJ. U.K) as a reference material.
Measurement of Moisture Content: The moisture content was measured by the dry oven standard procedure described in the AOAC official methods of analysis (1990) for meat and meat products.
Experimental Procedure: Fish samples were packed in stainless steel sample hold-ers (65 mm height and 50 mm diameter). The sample holders were then placed inside a thermally controlled chamber. Tempera-ture selected ranged from 5 to 40°C with 5°C increment while the moisture content values were 30, 45, 60 and 75% (wb). After reaching equilibrium, the probe was in-serted into the middle of samples inside the holder and the test began. The probe was calibrated using 99.5% pure glycerol (WINLAB, Leicestershire, LE16 9EJ, UK) as a reference material. All experiments were in triplicates.
RESULTS AND DISCUSSION
The measured thermal conductivity values as a function of temperature for dif-
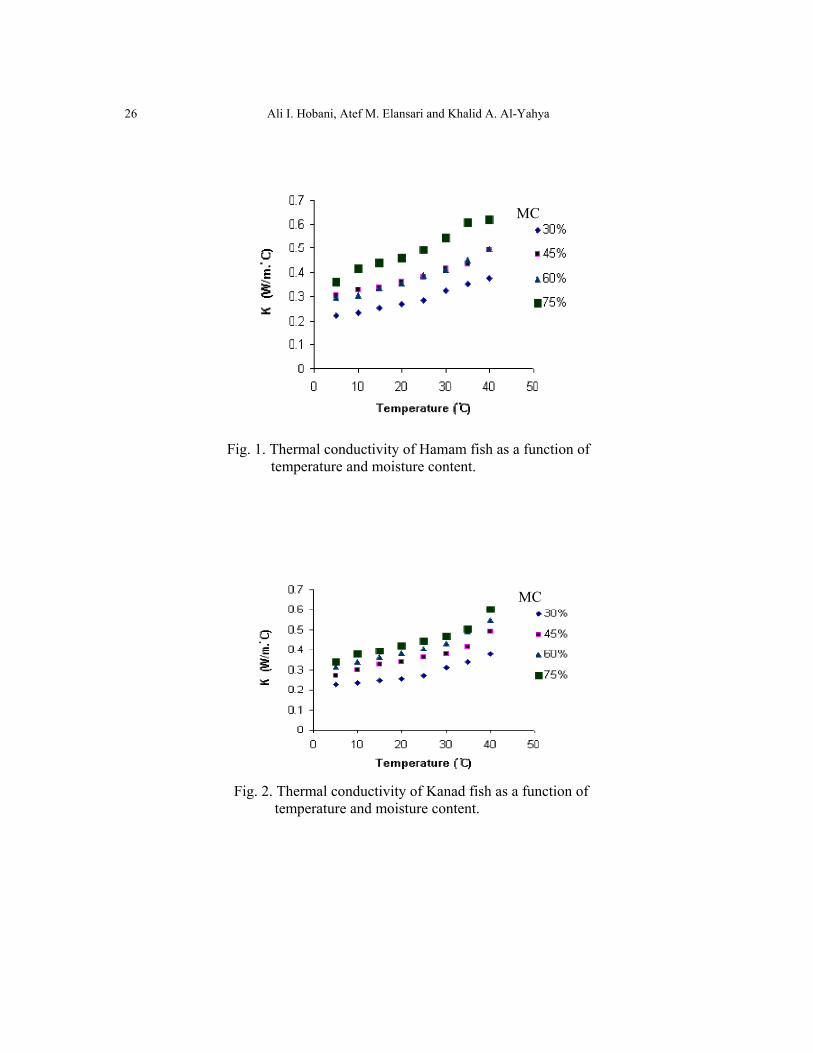
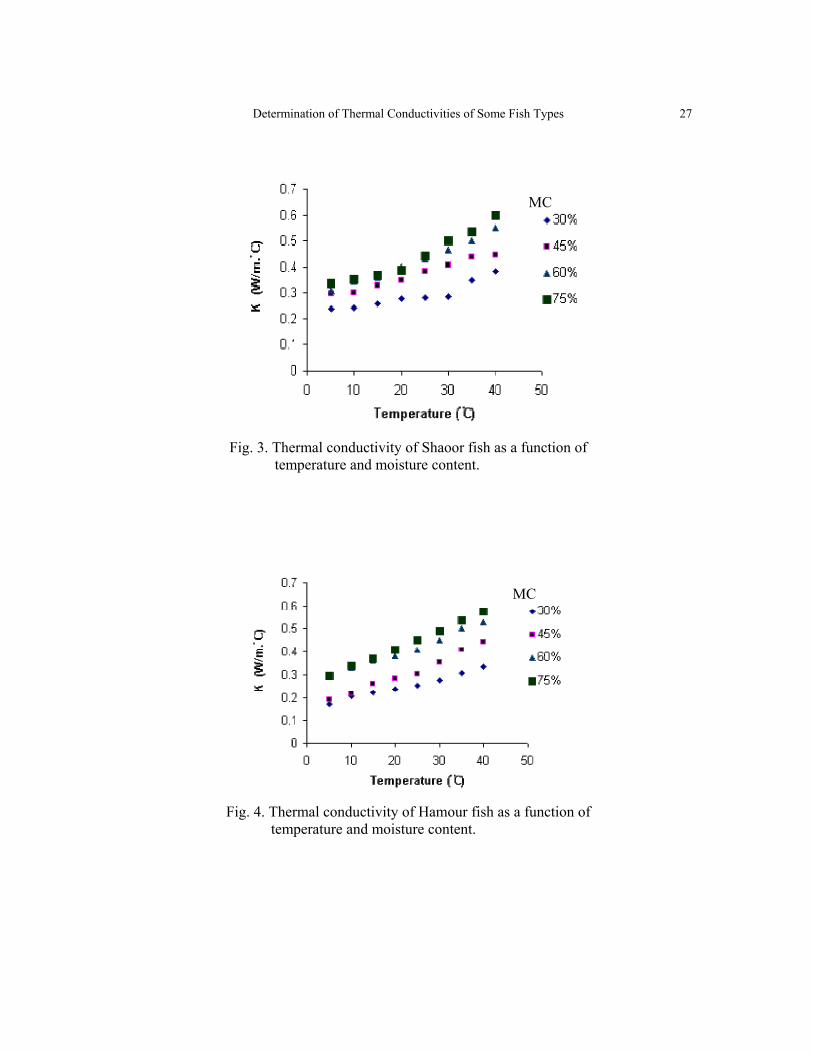
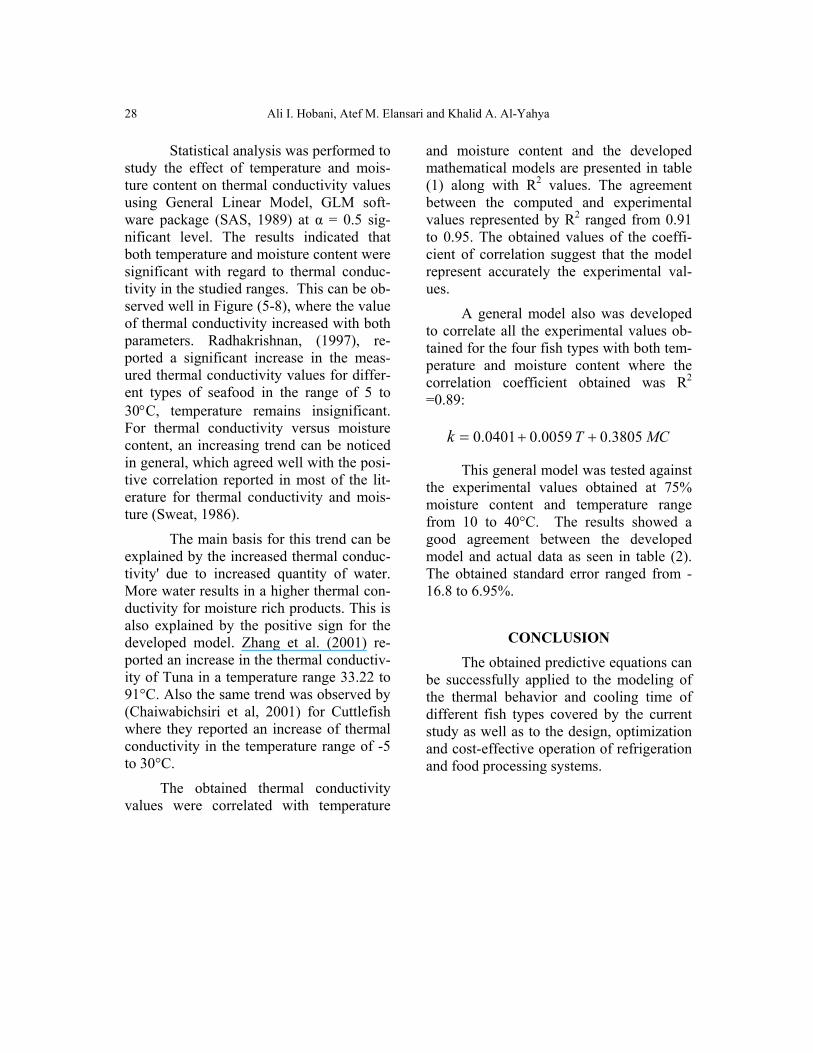
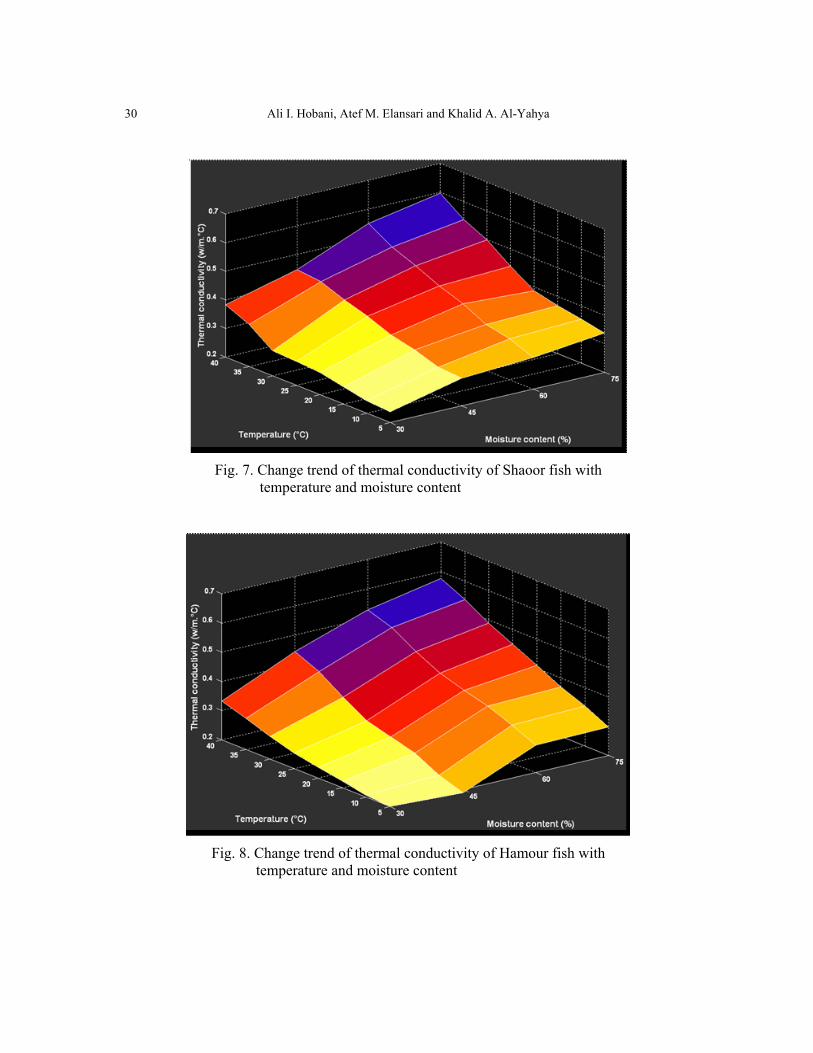
ferent fish types at different moisture con-tents are presented in Figs. 1 to 4. For Hamam type (yellow-Spotted Trevally) thermal conductivity values ranged from 0.223±0.012 W/m.°C at 5°C and 30% mois-ture content to 0.617±0.006 W/m.°C at 40°C and 75% moisture content. For Kanad (Spanish Macherel) the values ranged from 0.227±0.006 W/m.°C at 5°C and 30% mois-ture content to 0.603± 0.015 W/m.°C at 40°C and 75% moisture content. For Shaour (Emperor) the values ranged from 0237±0.006 at 5°C and 30% moisture con-tent to 0.597± 0.015 W/m.°C at 40°C and 75% moisture content. For Hamour (Grou-per) the values ranged from 0.17±0.01 W/m.°C at 5°C and 30% moisture content to 0.577±0.006 W/m.°C at 40°C and 75% moisture content. For all fish types, thermal conductivity values increased linearly with temperature and moisture content.
Several values are reported in the lit-erature but for other types of fish. Kumbhar et al. (1981) had reported values ranging from 0.415 to 0.459 W/m.°C for Mackerel, while Lentz, (1961) reported a value of 0.502 W/m.°C for Salmon at a temperature of 4ºC. Radhakrishnan, (1997) reported values for bluefish ranged from to 0.424 to 0.628 W/m.°C with a temperature range of 6.7 to 29.47ºC and for tilapia the values ranged from 0.442 to 0.548 W/m.°C. Also (Zhang et al, 2001) reported a measured value for thermal conductivity of Tuna (Ka-tsuwonus Pelamis) of 0.57±0.01 W/m.K at ambient temperature and 71.6% moisture content. In general it can be concluded that the resulting thermal conductivities agreed well with the values found in the literature for seafood.
Ali I. Hobani, Atef M. Elansari and Khalid A. Al-Yahya 26
MC
Fig. 1. Thermal conductivity of Hamam fish as a function of temperature and moisture content.
MC
Fig. 2. Thermal conductivity of Kanad fish as a function of temperature and moisture content.
Determination of Thermal Conductivities of Some Fish Types 27
MC
Fig. 3. Thermal conductivity of Shaoor fish as a function of temperature and moisture content.
MC
Fig. 4. Thermal conductivity of Hamour fish as a function of temperature and moisture content.
Ali I. Hobani, Atef M. Elansari and Khalid A. Al-Yahya 28
Statistical analysis was performed to study the effect of temperature and mois-ture content on thermal conductivity values using General Linear Model, GLM soft-ware package (SAS, 1989) at α = 0.5 sig-nificant level. The results indicated that both temperature and moisture content were significant with regard to thermal conduc-tivity in the studied ranges. This can be ob-served well in Figure (5-8), where the value of thermal conductivity increased with both parameters. Radhakrishnan, (1997), re-ported a significant increase in the meas-ured thermal conductivity values for differ-ent types of seafood in the range of 5 to 30°C, temperature remains insignificant. For thermal conductivity versus moisture content, an increasing trend can be noticed in general, which agreed well with the posi-tive correlation reported in most of the lit-erature for thermal conductivity and mois-ture (Sweat, 1986).
The main basis for this trend can be explained by the increased thermal conduc-tivity' due to increased quantity of water. More water results in a higher thermal con-ductivity for moisture rich products. This is also explained by the positive sign for the developed model. Zhang et al. (2001) re-ported an increase in the thermal conductiv-ity of Tuna in a temperature range 33.22 to 91°C. Also the same trend was observed by (Chaiwabichsiri et al, 2001) for Cuttlefish where they reported an increase of thermal conductivity in the temperature range of -5 to 30°C.
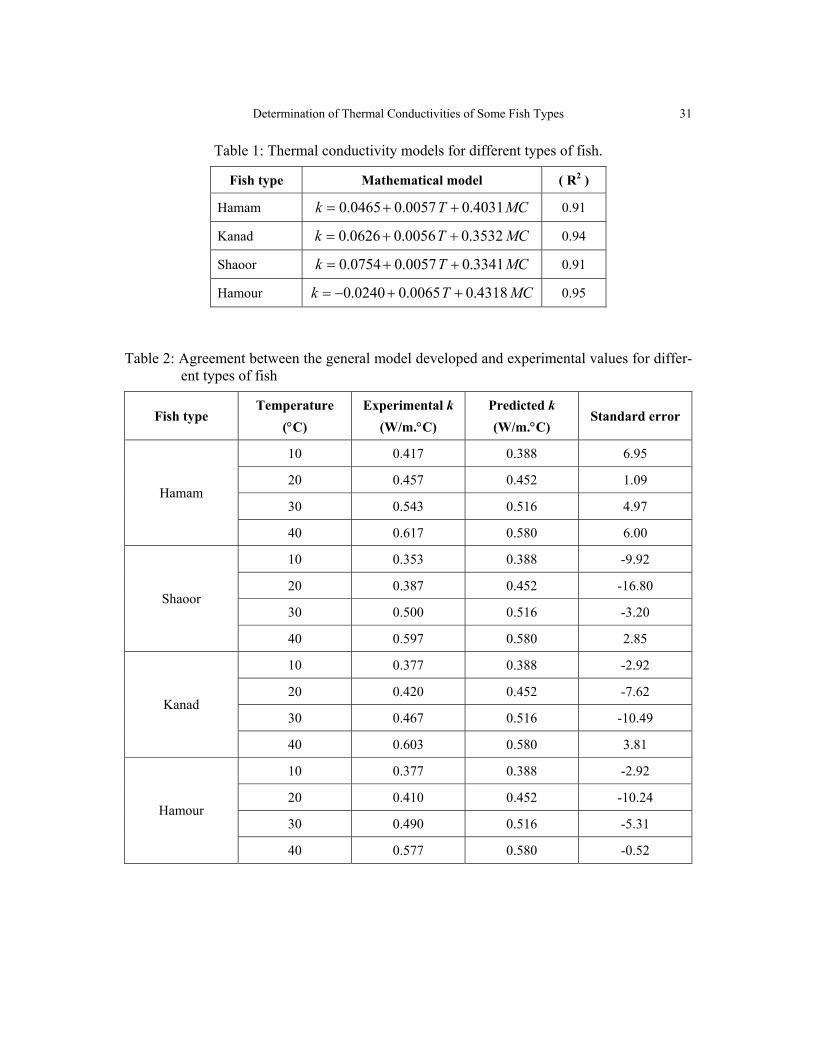
The obtained thermal conductivity values were correlated with temperature
and moisture content and the developed mathematical models are presented in table (1) along with R2 values. The agreement between the computed and experimental values represented by R2 ranged from 0.91 to 0.95. The obtained values of the coeffi-cient of correlation suggest that the model represent accurately the experimental val-ues.
A general model also was developed to correlate all the experimental values ob-tained for the four fish types with both tem-perature and moisture content where the correlation coefficient obtained was R2 =0.89:
MCTk 3805.0 0059.00401.0 ++= This general model was tested against
the experimental values obtained at 75% moisture content and temperature range from 10 to 40°C. The results showed a good agreement between the developed model and actual data as seen in table (2). The obtained standard error ranged from -16.8 to 6.95%.
CONCLUSION The obtained predictive equations can
be successfully applied to the modeling of the thermal behavior and cooling time of different fish types covered by the current study as well as to the design, optimization and cost-effective operation of refrigeration and food processing systems.

Determination of Thermal Conductivities of Some Fish Types 29
Fig. 5. Change trend of thermal conductivity of Hamam fish with temperature and moisture content
Fig. 6. Change trend of thermal conductivity of Kanad fish with temperature and moisture content
Ali I. Hobani, Atef M. Elansari and Khalid A. Al-Yahya 30
Fig. 7. Change trend of thermal conductivity of Shaoor fish with
temperature and moisture content
Fig. 8. Change trend of thermal conductivity of Hamour fish with temperature and moisture content
Determination of Thermal Conductivities of Some Fish Types 31
Table 1: Thermal conductivity models for different types of fish.
)R2( Mathematical model Fish type
0.91 MCTk 4031.0 0057.00465.0 ++= Hamam
0.94 MCTk 3532.0 0056.00626.0 ++= Kanad
0.91 MCTk 3341.0 0057.00754.0 ++= Shaoor
0.95 MCTk 4318.0 0065.00240.0 ++−=Hamour
Table 2: Agreement between the general model developed and experimental values for differ-
ent types of fish
Fish type Temperature
(°C) Experimental k
(W/m.°C) Predicted k (W/m.°C)
Standard error
10 0.417 0.388 6.95
20 0.457 0.452 1.09
30 0.543 0.516 4.97 Hamam
40 0.617 0.580 6.00
10 0.353 0.388 -9.92
20 0.387 0.452 -16.80
30 0.500 0.516 -3.20 Shaoor
40 0.597 0.580 2.85
10 0.377 0.388 -2.92
20 0.420 0.452 -7.62
30 0.467 0.516 -10.49 Kanad
40 0.603 0.580 3.81
10 0.377 0.388 -2.92
20 0.410 0.452 -10.24
30 0.490 0.516 -5.31 Hamour
40 0.577 0.580 -0.52
Ali I. Hobani, Atef M. Elansari and Khalid A. Al-Yahya 32
REFERENCES
Al-Sheddy, I., Al-Dagal, M. and Bazaraa, W.A. 1999. "Microbial and Sensory Quality of Fresh Camel Meat Treated with Organic Acid Salts and/or Bifi-dobacteria". Journal of Food Science, 64, No. 2 (1999), 336-339.
AOAC. 1990. Official methods of analysis of the association of official analyti-cal chemist. Washington.
Chaiwanichsiri, S., Kalaya Lao-hasongkram., and Ommee Koon-Aree. 2001. Freezing Time Prediction for Cuttlefish. ScienceAsia 27:221-226.
Hobani, Ali I. and Elansari, Atef M. 2002. Thermal properties of fresh grouper (Hammour fish). Misr J. Agric. Engng. 19(3): 668-676.
Hooper, F. C. and Lepper, F. R. 1950. Transient heat flow apparatus for the determination of thermal conductivi-ties. Transactions of ASHVE, 56: 309-322.
Kumbhar, B. K., Agarwal, R. S., and Das, K. 1981. Thermal properties of fresh and frozen fish. International Journal of Refrigeration, 4(3):143-146.
Lentz, C. P. 1961. Thermal conductivity of meats, fats, gelatin gel, and ice. Food Technology, 15: 243- 247.
Mohsenin, N. N. 1980. Thermal properties of foods and agricultural materials. Gordon and Breach Science Publish-ers, Inc. New York.
Murakami, E. G., Sweat, V. E., Sastry, S. K., Kolbe, E., Hayakawa, K. and
Datta, A. 1996. Recommended design parameters for thermal conductivity probe for nonfrozen food materials. Journal of Food Engineering, 27: 109-123.
Nesvadba, P. and Eunson, C. "Moisture and Temperature Dependence of Thermal Diffusivity of Cod Minces". Journal of Food Technology, 19 (1984), 585-592.
Nix, G. H., Lowery, F. W., Vachon, R. I. and Tanger, G. E. 1967. Direct de-termination of thermal diffusivity and conductivity with a refined line source technique. Progress in Aero-nautics and Astronautics: Thermo-physics of Spacecraft and Planetary Bodies. 20:865. Academic Press, New York.
Qashou, M.S. 1973. Compilation of thermal conductivity of foods. Unpublished M.S. Thesis, Auburn University.
Rahman, M. S. 1995. Food Properties Handbook. CR Press, Inc., New York.
Radhakrishnan, S. 1997. Measurement of thermal properties of seafood. M.Sc. Thesis, Virginia Polytechnic Institute and State University, Blacksburg, Virginia.
Reidy, G. A. 1968. Methods for determin-ing thermal conductivity and diffusiv-ity of foods. 2.Value for thermal properties of foods gathered from the literature. Food science Department, Michigan State University, East Lans-ing, Michigan.
Reidy, G. A. and Rippen, A. L. 1971. Method for determining thermal con-
Determination of Thermal Conductivities of Some Fish Types 33
ductivity in foods. Transactions of the ASAE, 14 (2): 248-254.
Singh, R. P. 1982. Thermal diffusivity in food processing. Food Technology, 36:87-91.
Sweat, V.E.1986. Thermal properties of foods. in "Engineering properties of foods", Rhao, M. and S.S.H. Rizvi (ed.), Marcel Dekker, New York.
Woodams, E. E. and Nowrey, J. E. 1968. Literature values of thermal conduc-tivities of foods. Food Technology. 22:494-502.
Zhang, Jianrong., Brain E. Fraks., and S. Andrew Hale. 2001. Thermal Proper-ties of Skipjack Tuna (Katsuwonus Pelamis). International Journal of Food Properties, 4 (1): 81-90.
Ali I. Hobani, Atef M. Elansari and Khalid A. Al-Yahya 34
- -
. 2460- 11451-
: ) ( .
5° 40° 30 75 % . . 0.03 ± 0.17 /.° )
5° 75 % ( 0.03 ± 0.617 /.° ) 40° 75% ( . .
. .