
Influence of reaction enthalpy - Archive ouverte HAL
26
HAL Id: hal-02962135 https://hal.archives-ouvertes.fr/hal-02962135 Submitted on 9 Oct 2020 HAL is a multi-disciplinary open access archive for the deposit and dissemination of sci- entific research documents, whether they are pub- lished or not. The documents may come from teaching and research institutions in France or abroad, or from public or private research centers. L’archive ouverte pluridisciplinaire HAL, est destinée au dépôt et à la diffusion de documents scientifiques de niveau recherche, publiés ou non, émanant des établissements d’enseignement et de recherche français ou étrangers, des laboratoires publics ou privés. Biobased bitumen analogue formation during hydrothermal treatment of microalgae residues, part 1: Influence of reaction enthalpy on the process Antoine Rolland, Alain Sarda, Gael Colomines, Yannick Madec, Emmanuel Chailleux, Eric Leroy To cite this version: Antoine Rolland, Alain Sarda, Gael Colomines, Yannick Madec, Emmanuel Chailleux, et al.. Biobased bitumen analogue formation during hydrothermal treatment of microalgae residues, part 1: Influence of reaction enthalpy on the process. Journal of Analytical and Applied Pyrolysis, Elsevier, 2020, 151, pp.104921. 10.1016/j.jaap.2020.104921. hal-02962135
-
Upload
khangminh22 -
Category
Documents
-
view
3 -
download
0
Transcript of Influence of reaction enthalpy - Archive ouverte HAL

HAL Id: hal-02962135https://hal.archives-ouvertes.fr/hal-02962135
Submitted on 9 Oct 2020
HAL is a multi-disciplinary open accessarchive for the deposit and dissemination of sci-entific research documents, whether they are pub-lished or not. The documents may come fromteaching and research institutions in France orabroad, or from public or private research centers.
L’archive ouverte pluridisciplinaire HAL, estdestinée au dépôt et à la diffusion de documentsscientifiques de niveau recherche, publiés ou non,émanant des établissements d’enseignement et derecherche français ou étrangers, des laboratoirespublics ou privés.
Biobased bitumen analogue formation duringhydrothermal treatment of microalgae residues, part 1:
Influence of reaction enthalpy on the processAntoine Rolland, Alain Sarda, Gael Colomines, Yannick Madec, Emmanuel
Chailleux, Eric Leroy
To cite this version:Antoine Rolland, Alain Sarda, Gael Colomines, Yannick Madec, Emmanuel Chailleux, et al.. Biobasedbitumen analogue formation during hydrothermal treatment of microalgae residues, part 1: Influenceof reaction enthalpy on the process. Journal of Analytical and Applied Pyrolysis, Elsevier, 2020, 151,pp.104921. �10.1016/j.jaap.2020.104921�. �hal-02962135�

Biobased bitumen analogue formation during hydrothermal treatment of microalgae
residues, part 1: influence of reaction enthalpy on the process.
Antoine Rolland1, Alain Sarda1, Gaël Colomines1, Yannick Madec1, Emmanuel Chailleux2 and
Eric Leroy3.*
1) Université de Nantes. Oniris. CNRS. GEPEA. UMR 6144. F- 44470 Carquefou. France.
2) Université Gustave Eiffel / Ifsttar / Centre de Nantes. Département MAST/ Laboratoire
Matériaux pour les Infrastructures de Transports. Route de Bouaye CS4. 44344
Bouguenais. France.
3) Université de Nantes. Oniris. CNRS. GEPEA. UMR 6144. F- 44600 Saint Nazaire.
France.
* corresponding author: [email protected]

Abstract: The hydrothermal conversion process of industrial Spirulina sp. residues into
bitumen analogue is studied with an instrumented reactor heated at 260 °C under autogenous
pressure. During hydrothermal conversion experiments, an exothermic reaction starts during
the heating ramp above 200 °C and perturbs the thermal regulation of the process. The end of
the reaction is detected from recorded pressure and temperature signals. Thermal insulation of
the reactor and monitoring of the electrical energy input for thermal regulation allows
estimating a total reaction enthalpy Hr ≈ - 1.7 MJ/kg of dry biomass by performing two
successive heating-isotherm experiments: First with biomass until complete reaction and again
with reaction products after cooling. This second run is used as a reference for energy balance
calculations.
Keywords: hydrothermal liquefaction. hydrothermal carbonization. microalgae. bitumen. heat
of reaction.
Highlights:
- Hydrothermal conversion of Spirulina residues to bio-bitumen is exothermic.
- Thermic of the hydrothermal reactor is affected by reaction heat release.
- End of the reaction is detected by pressure and temperature signals.
- A reaction enthalpy Hr ≈ - 1.7 MJ/kg of dry biomass is estimated.

1 Introduction
High pressure hydrothermal treatment of biomass has been widely investigated for the fossil
carbon feedstock analogues production [1]. Both most studied processes: hydrothermal
carbonization (HTC) and hydrothermal liquefaction (HTL. sometimes also called
thermochemical liquefaction) differ by their operating temperature and pressure range. They
also allow targeting different fossil carbon products. On one hand HTC was developed for the
production of solid coal like products initially from lignocellulosic biomass [1]. It typically
involves temperatures ranging from 180 °C to 250 °C and autogenous pressures of
approximately 2-3 MPa with residence times of 3-6 hours. On the other hand HTL is generally
used to produce bio-crude oil [1] and it involves shorter treatment (few minutes to 1-2 hours),
higher temperatures (280 °C to 370 °C) and pressures (10-22 MPa) taking advantage of the
water subcritical properties (which becomes a solvent and a reaction media).
HTL was first applied to microalgae biomass in the 90’s [2] [2]. Since this pioneering work,
HTL has been widely studied for the conversion of microalgae or microalgae residues into bio
oil. In a recent review, it appears that about one third of the papers dedicated to HTL treatment
of biomass concern microalgae [3]. From a nature inspired point of view, HTL mimics the
geological process of petroleum formation (involving lower temperatures and pressures. but
over millions of years is seducing, [4] especially for microalgae which is probably the closest
biomass to kerogen precursors). Besides, from an engineering and energy point of view HTL
has the advantage of allowing the direct treatment of wet biomass (containing up to typically
80% moisture). In the case of microalgae that are currently produced at concentration well
below 10 g/L, this avoids unreasonable energy consuming for drying before conversion [5].
Some results even suggest that for dried microalgae, HTL is more efficient than pyrolysis for
bio-oil production in terms of yield and oil energy density [6].

HTC was also investigated for microalgae biomass treatment [7], allowing the production of
bituminous coal like products for temperatures close to 200 °C at less than 2 MPa during less
than 1 hour.
More recently, the investigation of the 240 °C to 280 °C temperature range (in between typical
HTC < 250 °C and HTL > 280 °C) operating conditions for a fixed residence time of 60 min
lead to the production of bitumen like products from two microalgae strain residues [8] [9].
This concept which is potentially of great interest in the context of forecast shortages of
petroleum bitumen in the coming decades has been patented [10]. For both microalgae
biomasses, an optimal temperature close to 260 °C leading to autogenous pressures of 5 MPa,
allowed obtaining a hydrophobic phase with rheological properties mimicking those of
elastomeric bio-binders, with a yield of approximately 50% compared to initial biomass. The
other reaction products were mostly CO2 in the gas phase and water soluble organic compounds
[8].
These recent results suggest the scheme presented in Figure 1, where the temperature/pressure
range between typical HTC and HTL boundaries allows targeting bio-bitumen products, instead
of bio-char or bio-crude for the more conventional processing conditions of HTC and HTL,
respectively. However, the thermokinetics of the process in this domain need further
investigation. The purpose of the present work is to better understand these issues: The first
part of the study is dedicated to the investigation of the influence of the exothermal reaction on
the thermic of the process.
According to a recent review article on enthalpy change during HTC [11], it can be evaluated
by three different techniques : i) using the Hess law to make a balance between the energetic
content of the initial biomass and the hydrothermal reaction products ii) performing DSC
measurements mimicking HTC in high pressure capsules containing water and a few milligrams

of biomass [12,13] iii) making energy balance on an ad hoc thermally insulated and
instrumented HTC reactor [14].
Each method has advantages and drawbacks: while not needing thermal measurements, the
application of the Hess Law requires a detailed characterization of the products (gases, liquid
and solid, which are highly complex in HTC/HTL) and often leads to an overestimation of the
enthalpy [11]. DSC measurements are particularly efficient for biomasses that are homogeneous
such has pure cellulose [13] but lead to high standard deviation for more complex biomasses
(35% for wood [13] though recently proposed experimental procedures seem to allow reducing
this measurement uncertainty [12]). For complex and non-homogeneous biomasses, the authors
of the review article [11] suggest that measurements on an ad hoc HTC/HTL reactor is a better
solution but that heat loss and thermal inertia issues have to be considered cautiously.
In the present work, given the complexity and composition of the spirulina biomass, this last
technique will be used. For this purpose, a reactor will be equipped with an array of
thermocouples to monitor the thermal field during hydrothermal conversion experiments. Then,
in order to evaluate the reaction enthalpy, the reactor will be thermally insulated and the electric
energy supply to the heating system will be monitored in order to allow energy balance
calculations.

Figure 1 : Typical hydrothermal treatment conditions for the production of bio-char (HTC), bio-crude
(HTL) and bio- bitumen (crossover region between HTC and HTL).
0
20
40
60
80
100
120
140
160
180
200
0 50 100 150 200 250 300 350 400
Pre
ssu
re (
bar
)
Temperature ( C)
Water vapor pressure
HTC
HTL
Bio-bitumen
Bio-crude
Bio-char

2 Materials and methods
2.1 Materials
Spirulina sp. biomass residues similar to those previously used to produce bio-bitumen [9] were
supplied by AlgoSource (Alpha-Biotech. Asserac. France). This company grows Spirulina sp.
and markets phycocyanin rich extracts. Depending on the season, and the harvest conditions,
the algae’s composition can vary. After freezing and reheating to 25 °C, the biomass is
centrifuged, leading to two fractions: On one hand, an aqueous supernatant which is further
purified to obtain a drinkable solution with a guaranteed phycocyanin content (0.08 wt.%); and
on the other hand a solid by-product. This Spirulina sp. biomass residue was freeze dried and
ball milled before hydrothermal conversion. The composition of the batch used in the present
work is given in Table 1. The moisture content was obtained by measuring the weight loss of
a 1 g sample placed in an oven at 105 °C for 1 hour. The ash content was measured by thermo-
gravimetric analysis: A TGA apparatus (STA 449. Netzsch) was used to heat a 25 mg sample
from 25 °C to 600 °C at 10 °C/min. under nitrogen atmosphere. The sample was then
maintained at 600 °C during 1 hour under oxygen atmosphere, leading to a stable final mass
corresponding to ashes residues. Procedures described in literature were used to determine the
lipid [11];[12], protein [17] and carbohydrate [18] contents in the biomass. The carbon (C),
hydrogen (H), nitrogen (N), and sulfur (S) content were measured using a ThermoScientific
FLASH 2000 Series CHNS Analyzer (samples were heated until 980°C). The effective C. H.
N and S contents in the organic phase were then calculated taking into account the ash
(inorganic) content. The oxygen (O) content was estimated as the remaining fraction to reach
100% (O =100 - C – H -N -S) (Table 1). The heat capacity of the biomass was measured
between 25°C to 80°C using a Differential Scanning calorimeter (Mettler Toledo DSC 1,
TOPEM). A constant value Cp ≈ 1800 J/K/Kg. was obtained.

Table 1: Chemical composition of the Spirulina sp. residues used in this work. (Measured on freeze
dried samples. (a) values in dry weight % obtained for moisture-free samples).
Component Content (%)
Moisture 5 ±0.4
Asha 8.0 ± 2.1
Proteina 39.1 ± 1.2
Lipida 9.3 ± 1.5
Carbohydratea 7.9 ± 1.2
Elemental analysis
(organic phase)
C 51.5
N 11.1
S 1.7
H 7.2
O 28.5

2.2 Experiments with instrumented hydrothermal reactor
The HTL experiments were performed using a 300 mL stirred reactor with fixed head (4561
model from Parr Instrument Company. USA). For each hydrothermal conversion experiment,
45 g of Spirulina residues (dry mass 42.7 g) and 180 mL of osmosed water were introduced in
the reactor at 25 °C. This corresponds to a biomass to water ratio of 0.25 (20 wt% of wet
biomass). In order to remove the air still present in the reactor, nitrogen overpressure was
applied 3 times and then flushed away. Then 1 bar nitrogen pressure was applied. A constant
stirring rate of 100 rpm was applied during all experiments.
The experiments consisted in heating from 25 °C to 260 °C and an isotherm plateau during 400
min, followed by slow cooling. Note that such a residence time at 260°C is much longer than
the 60 min. optimal conditions for bio-bitumen production described in literature [9]. Indeed,
this isothermal reaction time was chosen to ensure a “complete reaction” in terms of heat
released (see results and discussion sections).
Two different heating systems and thermal insulation setup were used:
- First a “standard” reactor setup (Figure 2 (a)) with a vessel rigid mantle heater, fitting the
reactor was used for the investigation of the evolution of the temperature field in the
reactor
- For the evaluation of the reaction enthalpy, a thermally insulated reactor setup (Figure 2
(b)) was used: a heating collar was fixed on the cylindrical surface of the reactor. In order
to limit thermal losses, the bottom and cylindrical surfaces of the reactor were insulated
by 5 cm thick mineral wool. Only the upper surface of the reactor steel head was left in
contact with air.

Two kinds of experiments were conducted with the two setups: i) blank experiments, with the
reactor containing water but no biomass. ii) real hydrothermal conversion experiments with
water and Spirulina sp. biomass residues.
Additional experiments were conducted on the setup designed for reaction enthalpy evaluation:
after a complete hydrothermal conversion reaction experiment, the reactor containing water and
reaction products was cooled down without opening. After reaching 25 °C inside the unopened
reactor, a second heating/isotherm cycle at 260 °C was performed.
In all experiments, the temperature inside the reactor was controlled using a regulation
thermocouple T-R located at approximately 14.8 mm from the bottom of the reactor (Figure
2). During experiments, the evolution of the pressure and temperature field inside the reactor
was recorded using a numerical pressure sensor (Murrelektronik. 0-200 bar) and an array of
thermocouples : 8 type K stainless steel sheath ( 1 mm) thermocouples (T-1. T-2. T-3. T-4.
T-5. T-6. T-7 and T-8) respectively located at different heights (approximately 11.8. 31.3. 44.3.
50.3. 67.3. 71.8. 81.8 and 94.8 mm from the bottom of the reactor) all on a vertical at
approximately 2-3 mm. from the axis of the reactor (photo on Figure 3).
For the thermally insulated reactor setup, an additional thermocouple ((T-SH for “Steel Head”)
was used to record the temperature of the head of the reactor (upper red part on Figure 2(b))
which cannot be fully insulated. In addition, the electrical energy supply (EES) to the reactor
heating system was recorded: amperometric clamps (Pico Technology. France) were used to
measure the electrical current intensity I(t) input into the heating collar. The electrical energy
supply is thus given by:
𝐸𝐸𝑆(𝑡) = ∫ 𝑈 × 𝐼(𝑡)𝑑𝑡𝑡
0 Eq. (1)
Where: U is the measured electrical tension.
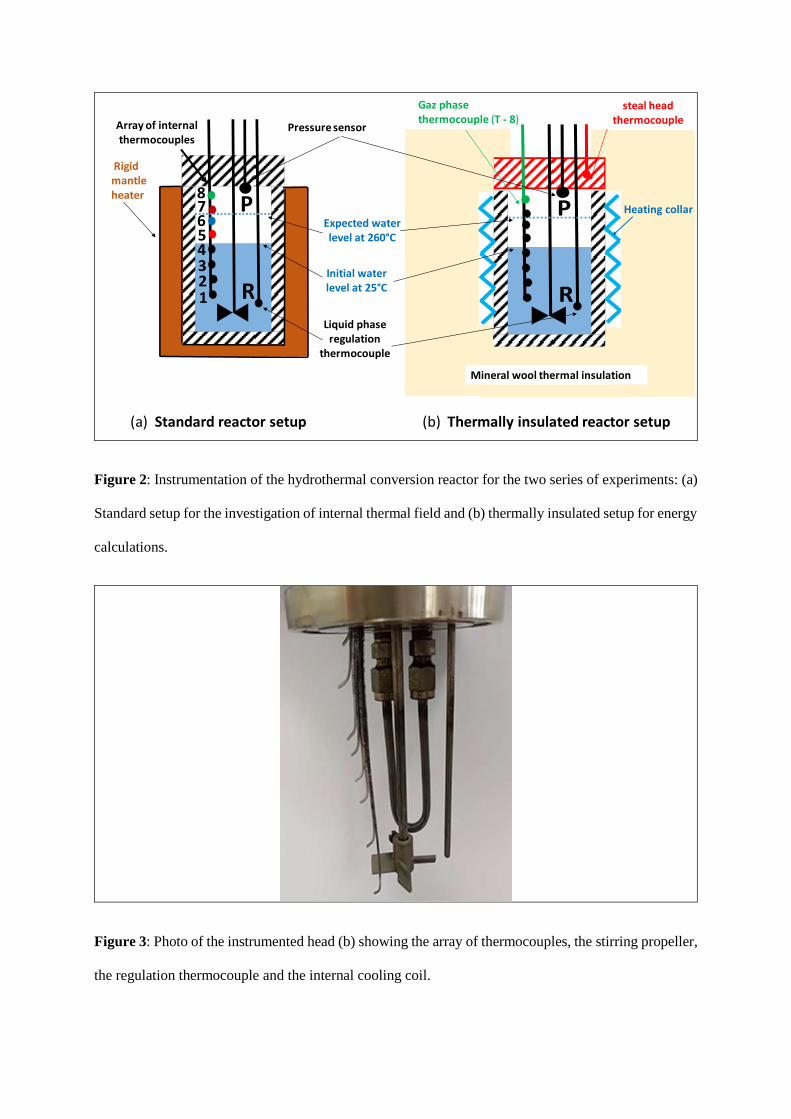
Figure 2: Instrumentation of the hydrothermal conversion reactor for the two series of experiments: (a)
Standard setup for the investigation of internal thermal field and (b) thermally insulated setup for energy
calculations.
Figure 3: Photo of the instrumented head (b) showing the array of thermocouples, the stirring propeller,
the regulation thermocouple and the internal cooling coil.
R
P
12
7
3
6
45
8
Liquid phaseregulation
thermocouple
Rigidmantleheater
Array of internalthermocouples
Pressure sensor
Initial water level at 25°C
Expected waterlevel at 260°C
R
P
steal headthermocouple
Mineral wool thermal insulation
Heating collar
Gaz phase thermocouple (T - 8)
(a) Standard reactor setup (b) Thermally insulated reactor setup

3 Results
3.1) Temperature field inside the reactor (non-thermally insulated experiments)
Figure 4 shows the internal temperature and pressure measurements in the standard reactor setup
(non-thermally insulated as shown on Figure 2 (a)) during experiments with only water
(referred as water-only experiments in the following) and real biomass hydrothermal
conversion experiments. The temperatures recorded by the thermocouples T-1, T-2, T-3 and T-
4 that are below the initial water level at 25 °C were almost identical to that of the regulation
thermocouple T-R indicating a homogeneous temperature of the liquid phase during the
experiments. Consequently, for the sake of clarity, only one temperature T-R.1.2.3.4 was
plotted on Figure 4 (Note that the color code of the thermocouples signals is the same as in
Figure 2 (a))
When the reactor only contains water, the regulation thermocouple of the reactor reaches the
isothermal reaction temperature of 260 °C after 60 minutes (Figure 4(a)). This heating time is
reduced to 40 minutes in presence of the biomass (Figure 4(b)), with a 10 °C overshoot. This
indicates the thermal regulation of the process is strongly influenced by the exothermal reaction.
The temperatures recorded by the thermocouples initially above the water level at 25 °C (T-5,
T-6, T-7 and T-8) show other differences between the two experiments:
- For the water-only experiment, during the heating step, these temperatures are initially
lower than that of the liquid phase (T-R.1.2.3.4). Then they successively become equal to
it. For T-5 and T-6, this may be ascribed to the thermal expansion of the liquid phase in
which they are immersed at 260 °C. Indeed, as a first approximation, the limit between
the two phases can be estimated by considering the thermal expansion of the initial water
volume:
ℎ260°𝐶 = ℎ25°𝐶 ×𝑑25°𝐶
𝑑260°𝐶 Eq. (2)

Where : h260°C and h25°C are the height of water level in the reactor, and d260°C and d25°C
are the densities of liquid water, equal to 1 at 25 °C and to 0.783 at 260 °C [19].
This leads to an aqueous phase level at h260°C = 73 mm that is to say between T-6 and T-
7. For T-7 and T-8, the fact that they become equal to T-R above 200 °C indicates that
for water only, the temperature field inside the reactor is uniform. That is to say that the
liquid and gas phases have the same temperature.
- On the contrary a heterogeneous temperature field is detected in the reactor in the presence
of biomass. While the temperatures measured by the thermocouples T-5 and T-6 more or
less follow T-R and become equal to it above 200 °C. T-7 and T-8 always remain
significantly lower than T-R and even decrease during the isothermal reaction plateau.
The theoretical vapour pressure Pwater was calculated using the Antoine equation:
𝑃𝑤𝑎𝑡𝑒𝑟 = 10𝐴−𝐵
𝐶+𝑇 Eq. (3)
Where: A = 8.14019; B = 1810.94 and C = 244.485 are constants [20]. In this equation, T is in
°C and Pwater in Torr (1 Torr = 133.322 Pa).
The plot of Pwater as a function of time on Figure 3 assumes that T = T-R, the temperature of the
liquid phase. For the water-only experiment (Figure 4(a)) the measured pressure signal is very
close to the theoretical Pwater curve. This indicates that the Antoine equation is a good
approximation to estimate the pressure increase as a function of T-R despite the presence of
nitrogen is neglected. During the isotherm, the pressure remains constant around 47 bars, the
vapor pressure of water at 260 °C.

(a)
(b)
Figure 4: Temperature and pressure measurements inside the standard reactor setup during
hydrothermal conversion experiments: blank experiment with water only (a) and hydrothermal
conversion of industrial Spirulina sp. biomass residues (b). The color code for measured temperature
and pressure signals is given on (a) and corresponds to that on Figure 2 (a). The theoretical vapor
pressure Pwater curve is calculated using Eq (11).
0
10
20
30
40
50
60
0
50
100
150
200
250
300
0 10 20 30 40 50 60 70 80 90 100
Pre
ssu
re (
bar
)
Tem
per
atu
re ( C
)
Time (min.)
T-R,1,2,3,4
T 5
T-6
T-7
T-8
P exp
P water
0
10
20
30
40
50
60
70
0
50
100
150
200
250
300
0 10 20 30 40 50 60 70 80 90 100
Pre
ssu
re (
bar
)
Tem
per
atu
re ( C
)
Time (min.)

When biomass is present (Figure 4(b)), the pressure inside the reactor is very close to the vapor
pressure of water predicted by the Antoine equation during the heating step. However, when
the isotherm is nearly reached, the measured pressure starts to increase compared to the
predicted water vapor pressure. Even after the stabilisation of the regulation thermocouple’s
temperature (i.e. a long time after the temperature’s overshoot) at 80min, it is noticeable that
the pressure increases due to the release of gas products. This suggest that the pressure signal
can be used to detect the end of the reaction.
3.2) Reaction Enthalpy evaluations
The measurements performed on the thermally insulated reactor setup (Figure 2 (b)) are shown
on Figure 5. The data obtained for the three kinds of experiments described in the materials
and methods section are plotted: i) an experiment with only water. ii) a hydrothermal conversion
experiment with water and spirulina biomass; and iii) an experiment conducted on the unopened
reactor after hydrothermal conversion and cooling to 25 °C: the reactor thus contains water and
hydrothermal conversion products. Note that the same colour code as in Figure 2 (b) is used.
Figure 5 (a) focuses on the evolution of the internal thermal field in relation with the energy
input by the heating collar: For the sake of clarity, not all temperature signals recorded inside
the reactor are plotted: Only the temperature of the liquid phase (T-R in black) and the gas
phase (T-8 in green) are shown. The electrical energy supply curves are plotted in blue. Figure
5 (b) Focuses on the internal pressure signal P (plotted in black) and the temperature of the non-
thermally insulated steel head T-SH (plotted in red).
For the three experiments, the evolutions of T-R are similar; indicating that thermal regulation
of the aqueous phase is the same. On the contrary, the evolutions of all the other signals are
very different for the three experiments.

(a)
(b)
Figure 5: Temperature, pressure and energy measurements with the thermally insulated reactor setup
(colour code is the same as in Figure 2(b)). Data for 3 experiments is plotted: i) with WATER only
(dotted line). ii) with WATER + BIOMASS (dashed lines) and iii) WATER + CONVERSION
PRODUCTS (solid lines).
0
50
100
150
200
250
0
100
200
300
400
500
600
700
0 50 100 150 200 250
Tem
per
ature
s (
C)
Ele
ctri
cal
Ene
rgy
Supply
(W
h)
Time (min.)
Energy Supply (WATER)
Energy Supply (WATER + BIOMASS)
Energy Supply (WATER + PRODUCTS)
T-R (WATER)
T-R (WATER + BIOMASS)
T-R (WATER + PRODUCTS)
T-8 (WATER)
T-8 (WATER + BIOMASS)
T-8 (WATER + PRODUCTS)
0
50
100
150
200
250
0
20
40
60
80
100
0 50 100 150 200 250
Tem
per
ature
s (
C)
Pre
ssure
(bar
)
Time (min.)
P (WATER)
P (WATER + BIOMASS)
P (WATER +PRODUCTS)
T-SH (WATER)
T-SH (WATER + BIOMASS)
T-SH (WATER + PRODUCTS)

Let’s first consider the electrical energy input curves: During the heating step (from 25 °C to
260 °C), these three curves follow a similar linear trend with a slope of ≈ 475 W. This
corresponds to the electrical power required for heating the reactor and its content.
Less electrical power is needed to maintain the temperature of the liquid phase at 260 °C during
the isothermal step, and so lower slopes are observed. However, the fact that these slopes are
positive can be ascribed to the thermal losses.
The two experiments for which no reactions are occurring show perfectly linear behaviour from
50 min till the end (420 min): The highest slope/power supply is observed for the experiment
with water only with ≈ 92 W while a slope/power supply of ≈ 77 W is observed for the
experiment with water and hydrothermal conversion products. These two slopes are associated
to different constant values of the non-insulated steel head (T-SH = 255 °C with water and T-
SH = 220 °C with water + products.) These results are consistent with a rule of thumb: the
higher the temperature of the non-insulated reactor steel head, the higher the thermal loss (and
so the higher the slope/power supply to maintain the isotherm). It should be pointed out that
these required power supply values are much smaller than that observed for water (≈ 240 W)
in the work of Merzari et al [14] on a similar ad hoc reactor for enthalpy measurements. This
suggests that the thermal insulation of our experimental setup is quite efficient despite the
absence of thermal insulation of the steel head.
For the hydrothermal conversion experiment with water and biomass, the behaviour of the
energy supply curve during the isotherm is not linear until approximately 150 min due to the
exothermal reaction. After 150 min, a linear asymptote is observed with a slope/power supply
≈ 75 W which is very close to that observed during the reheating experiment with water and
hydrothermal conversion products.

These first observations suggest that the reaction’s exotherm starts when the temperature
reaches 260°C and ends at a certain time after 150 min. The consideration of the other signals
recorded inside the reactor (Figure 5) allow a better estimation of this ending of the reaction:
- The gas phase temperature (T-8): As previously observed on Figure 4, it is lower than the
liquid phase temperature (T-R) in presence of biomass. This is also the case during the
reheating experiment of the reactor containing water et reaction products, for which a
plateau is observed at T-8 ≈ 240°C. A similar plateau is reached during the hydrothermal
conversion reaction after 200 min.
- The pressure signal (P): As previously observed on Figure 4, while a plateau at P ≈ 48 bar
is observed during the isotherm in presence of water only, the pressure increases during
the hydrothermal conversion experiment due to the production of gaseous products
(mainly CO2 according to previous studies [8]), until reaching a plateau at P ≈ 87 bar after
220 min. It is striking that the level of pressure P ≈ 87 bar is observed during the reheating
experiment. It suggests that no additional gas products are formed and that the reaction
ends after 220 min.
A similar trend is observed for the temperature of the reactor steel head: The T-SH curves in
presence of biomass or reactions products show plateau values that are significantly lower
than for the water only experiment (T-SH ≈ 255 °C). This may explain the associated lower
temperature of the neighbouring gas phase, due to lower convective heat transfers from the
metallic internal surfaces of the reactor. During the reactive experiment T-SH follows a three
step behaviour during the T-R isotherm at 260 °C: until 150 min a roughly constant value T-
SH ≈ 210 C is observed. Then it increases to reach a second plateau after 220 min. at T-SH
≈ 224 C (which is close to the constant value observed for the reheating experiment with
water and reaction products).

Anyhow, all these observations lead to the conclusion that the reaction ends at 220 min. This
information is useful for estimating the reaction enthalpy.
4) Discussion
In their recent work Merzari et al. [14] estimate the reaction enthalpy considering the
experiment with water only as a baseline, assuming similar heat losses. This assumption is not
true in our case, since the different slopes prove the contrary. Consequently, it necessary leads
to a significant overestimation of the heat of reaction. However, we can first try applying the
calculation method of Merzari et al. [14]. It is summarized by the following equation:
∆H𝑟𝑀 =𝐸(𝑤𝑎𝑡𝑒𝑟+𝑏𝑖𝑜𝑚𝑎𝑠𝑠)(𝑡𝑓)−𝐸(𝑤𝑎𝑡𝑒𝑟)(𝑡𝑓)−∫ (𝑚𝑏𝑖𝑜𝑚𝑎𝑠𝑠×𝐶𝑝 𝑏𝑖𝑜𝑚𝑎𝑠𝑠)×𝑑𝑇
26025
𝑚𝑑𝑟𝑦 𝑏𝑖𝑜𝑚𝑎𝑠𝑠 Eq. (4)
Where:
tf is the time of the end of the reaction. Note that in the work of Merzari et al. [14] an
arbitrary shut down of power supply is imposed after 3 hours, regardless of any
information about the end of the reaction. In our case tf =220 min. will be used, since it
was detected as the end of the reaction from pressure, temperature and energy supply
signals.
E(water)(tf) and E(water + biomass )(tf) are the values of the cumulative electrical energy supply
measure at tf =220 min. for the water only experiment and for the hydrothermal
conversion experiment (water + biomass), respectively.
m biomass is the mass of wet biomass introduced in the reactor (45 g)
Cp biomass is the heat capacity of wet biomass introduced in the reactor (assumed equal to
the value of 1800 J.K-1.kg-1 measured between 25°C and 80°C)
m dry biomass is the mass of dry biomass introduced in the reactor (42.75 g)

This leads to a total reaction enthalpy of ∆H𝑟𝑀 = -7.3 MJ/kg of dry biomass. Such an
overestimated value (due to the evidence of higher heat losses for the water only experiment)
is actually very close to that obtained by Merzari et al. [14] for the hydrothermal conversion of
an organic fraction of municipal solid waste (OFMSW) which has a rather close elemental
composition (with only a lower nitrogen and ash contents).
In order to refine the estimation of the reaction enthalpy, we propose to use the re-heating
experiment curve as a baseline. This assumption seems more reasonable since we have observed
that during the isotherm, the slopes corresponding to power supply are very close after the end
of the reaction, indicating similar heat losses. We thus propose the following equation:
∆H𝑟 =
𝐸(𝑤𝑎𝑡𝑒𝑟+𝑏𝑖𝑜𝑚𝑎𝑠𝑠)(𝑡𝑓)−𝐸(𝑤𝑎𝑡𝑒𝑟+𝑝𝑟𝑜𝑑𝑢𝑐𝑡𝑠)(𝑡𝑓)−∫ (𝑚𝑏𝑖𝑜𝑚𝑎𝑠𝑠×𝐶𝑝 𝑏𝑖𝑜𝑚𝑎𝑠𝑠)×𝑑𝑇+∫ (𝑚𝑝𝑟𝑜𝑑𝑢𝑐𝑡𝑠×𝐶𝑝 𝑝𝑟𝑜𝑑𝑢𝑐𝑡𝑠)×𝑑𝑇260
25260
25
𝑚𝑑𝑟𝑦 𝑏𝑖𝑜𝑚𝑎𝑠𝑠
Eq. (5)
In this equation, new parameters appear:
E(water + products)(tf) is the value of the cumulative electrical energy supply at 220 min. for
the re-heating experiment.
m products is the mass of the reaction products present in the reactor
Cp products is the heat capacity of the reaction products.
As a first approximation, we assume that the difference of mass and heat capacity between
initial biomass and final reaction products can be neglected:
𝑚𝑏𝑖𝑜𝑚𝑎𝑠𝑠 × 𝐶𝑝 𝑏𝑖𝑜𝑚𝑎𝑠𝑠 ≈ 𝑚𝑝𝑟𝑜𝑑𝑢𝑐𝑡𝑠 × 𝐶𝑝 𝑝𝑟𝑜𝑑𝑢𝑐𝑡𝑠 Eq. (6)
This assumption may lead to slight underestimation of the reaction enthalpy. Indeed, recent
work on DSC measurements mimicking HTC in high pressure capsules by Pecchi et al. [11]
suggest that such a heat capacity change between initial biomass and reaction products is not

negligible. We also neglect possible additional thermal effects related to the presence of the
CO2, which modifies internal pressure and/or may be partially water soluble at lower
temperatures.
However, this leads to the following simplified expression of the reaction enthalpy:
∆H𝑟 ≈𝐸(𝑤𝑎𝑡𝑒𝑟+𝑏𝑖𝑜𝑚𝑎𝑠𝑠)(𝑡𝑓)−𝐸(𝑤𝑎𝑡𝑒𝑟+𝑝𝑟𝑜𝑑𝑢𝑐𝑡𝑠)(𝑡𝑓)
𝑚𝑑𝑟𝑦 𝑏𝑖𝑜𝑚𝑎𝑠𝑠 Eq. (7)
This equation leads to a hydrothermal reaction enthalpy Hr ≈ -1.7 MJ/kg. This value is closer
to literature values obtained by DSC measurements for various biomass [11] [13] than that
obtained with the method of Merzari et al. [14]. It is however slightly higher than for
lignocellulosic biomass which is typically closer to -1 MJ/kg or lower [13]. The higher value
for spirulina biomass may be ascribed to the presence of lipids and proteins which have more
energetic content than carbohydrates.
Coming back, to the heating-isotherm experiments performed with the reactor using a vessel
rigid mantle heater without thermal insulation clearly showed that this rather small enthalpy of
reaction strongly affects the thermic of the process. However, this perturbation of the thermal
regulation was significantly lower in the case of the thermally insulated reactor experiments.
This supports the conclusion of a recent review article [11] that for the upscaling of such
hydrothermal treatment, the heat recovery approach recently described [21] is probably more
important than the small reaction exothermicity.

5 Conclusions
The hydrothermal conversion of industrial Spirulina sp. residues to bio-bitumen at 260 °C was
studied with a thermally instrumented reactor (45 g of biomass scale). Experiments lead to the
conclusion that the exothermic reaction enthalpy above 200 °C has a strong influence on heating
and isothermal regulation of the process when the reactor is not thermally insulated. The
reaction enthalpy Hr ≈ - 1.7 MJ/kg estimated by energetic measurements on the reactor in
thermally insulated conditions of dry Spirulina biomass is slightly higher than the scarce values
available in literature for other biomass, but may be ascribed to the composition of the Spirulina
residues used.
Acknowledgments
The authors acknowledge financial support of the French National Agency for Research ANR
(Algoroute project. grant ANR-16-CE08-0017) and would like to thank Mme Laurence
Lavenant Ing. and Delphine Drouin for their help in biomass characterization.
Declaration of interest
None

References
[1] V. Grönberg, H. Wikberg, J. Jermakka, K. Kemppainen, M. Kleen, C. Laine, V.
Paasikallio, A. Oasmaa, Hydrothermal refining of biomass: An overview and future
perspectives, Tappi J. 14 (2015) 195–207.
[2] Y. Dote, S. Sawayama, S. Inoue, T. Minowa, S. Yokoyama, Recovery of liquid fuel
from hydrocarbon-rich microalgae by thermochemical liquefaction, Fuel. 73(1994) 1855-1857.
https://doi.org/10.1016/0016-2361(94)90211-9.
[3] A.R.K. Gollakota, A review on hydrothermal liquefaction of biomass, Renew. Sustain.
Energy Rev. 81 (2018) 1378–1392. https://doi.org/10.1016/j.rser.2017.05.178.
[4] R. Bounaceur, Modélisation cinétique de l’évolution thermique des pétroles dans les
gisements, PhD Thesis (in french), Vandoeuvre-les-Nancy, INPL, 2001.
http://www.theses.fr/2001INPL002N (accessed September 5, 2019).
[5] L. Xu, Assessment of a dry and a wet route for the production of biofuels from
microalgae: Energy balance analysis, Bioresour. Technol. 102 (2011) 5113–5122.
https://doi.org/10.1016/j.biortech.2011.01.066.
[6] U. Jena, K.C. Das, Comparative Evaluation of Thermochemical Liquefaction and
Pyrolysis for Bio-Oil Production from Microalgae, Energy Fuels. 25 (2011) 5472–5482.
https://doi.org/10.1021/ef201373m.
[7] S.M. Heilmann, H.T. Davis, L.R. Jader, P.A. Lefebvre, M.J. Sadowsky, F.J. Schendel,
M.G. von Keitz, K.J. Valentas, Hydrothermal carbonization of microalgae, Biomass Bioenergy.
34 (2010) 875–882. https://doi.org/10.1016/j.biombioe.2010.01.032.
[8] M. Audo, M. Paraschiv, C. Queffélec, I. Louvet, J. Hémez, F. Fayon, O. Lépine, J.
Legrand, M. Tazerout, E. Chailleux, B. Bujoli, Subcritical Hydrothermal Liquefaction of

Microalgae Residues as a Green Route to Alternative Road Binders, ACS Sustain. Chem. Eng.
3 (2015) 583–590. https://doi.org/10.1021/acssuschemeng.5b00088.
[9] I. Borghol, C. Queffélec, P. Bolle, J. Descamps, C. Lombard, O. Lépine, D. Kucma, C.
Lorentz, D. Laurenti, V. Montouillout, E. Chailleux, B. Bujoli, Biosourced analogs of
elastomer-containing bitumen through hydrothermal liquefaction of Spirulina sp. microalgae
residues, Green Chem. 20 (2018) 2337–2344. https://doi.org/10.1039/C8GC00094H.
[10] E. Chailleux, M. Audo, B. Bujoli, C. Queffelec, J. Legrand, M. Paraschiv, M. Tazerout,
O. Lepine, Viscoelastic Material Produced by hydrothermal liquefaction of microalgae, Patent
WO2015044891.https://patentscope.wipo.int/search/en/detail.jsf?docId=WO2015044891
(accessed February 19, 2020).
[11] M. Pecchi, F. Patuzzi, D. Basso, M. Baratieri, Enthalpy change during hydrothermal
carbonization of biomass: a critical review, J. Therm. Anal. Calorim. (2019).
https://doi.org/10.1007/s10973-019-09117-4.
[12] M. Pecchi, F. Patuzzi, V. Benedetti, R. Di Maggio, M. Baratieri, Thermodynamics of
hydrothermal carbonization: Assessment of the heat release profile and process enthalpy
change, Fuel Process. Technol. 197 (2020) 106206.
https://doi.org/10.1016/j.fuproc.2019.106206.
[13] A. Funke, F. Ziegler, Heat of reaction measurements for hydrothermal carbonization of
biomass., Bioresour. Technol. 102 (2011) 7595–7598.
https://doi.org/10.1016/j.biortech.2011.05.016.
[14] F. Merzari, Hydrothermal Carbonization of Biomass Design of a Bench-Scale Reactor
for Evaluating the Heat of Reaction.pdf, (2018).

[15] E.G. Bligh, W.J. Dyer, A Rapid Method of Total Lipid Extraction and Purification, Can.
J. Biochem. Physiol. 37 (1959) 911–917. https://doi.org/10.1139/o59-099.
[16] J. Folch, M. Lees, G.H. Sloane Stanley, A simple method for the isolation and
purification of total lipides from animal tissues, J. Biol. Chem. 226 (1957) 497–509.
[17] O.H. Lowry, N.J. Rosebrough, A.L. Farr, R.J. Randall, Protein measurement with the
Folin phenol reagent, J. Biol. Chem. 193 (1951) 265–275.
[18] M. DuBois, K. A. Gilles, J. K. Hamilton, P. A. Rebers, and F. Smith, Colorimetric
Method for Determination of Sugars and Related Substances, Analytical Chemistry. 28 (1956)
350-356. https://doi.org/10.1021/ac60111a017.
[19] ThermExcel Tables Physical characteristics of boiling water, Boiling water, Density,
Specific enthalpy, sensible heat, absolute, atmospheric, gauge pression, point, (n.d.).
https://www.thermexcel.com/english/tables/eaubou1.htm (accessed September 18, 2019).
[20] Dortmund Data Bank, Vapor Pressure Calculation by Antoine Equation (Water).
http://ddbonline.ddbst.de/AntoineCalculation/AntoineCalculationCGI.exe?component=Water
(accessed September 18, 2019).
[21] K. Anastasakis, P. Biller, R.B. Madsen, M. Glasius, I. Johannsen, Continuous
Hydrothermal Liquefaction of Biomass in a Novel Pilot Plant with Heat Recovery and
Hydraulic Oscillation, Energies. 11 (2018) 2695. https://doi.org/10.3390/en11102695.