Evaluated kinetic and photochemical ... - Archive ouverte HAL
423
HAL Id: hal-00301101 https://hal.archives-ouvertes.fr/hal-00301101 Submitted on 7 Apr 2006 HAL is a multi-disciplinary open access archive for the deposit and dissemination of sci- entific research documents, whether they are pub- lished or not. The documents may come from teaching and research institutions in France or abroad, or from public or private research centers. L’archive ouverte pluridisciplinaire HAL, est destinée au dépôt et à la diffusion de documents scientifiques de niveau recherche, publiés ou non, émanant des établissements d’enseignement et de recherche français ou étrangers, des laboratoires publics ou privés. Evaluated kinetic and photochemical data for atmospheric chemistry: Volume III ? reactions of inorganic halogens R. Atkinson, D. L. Baulch, R. A. Cox, J. N. Crowley, R. F. Hampson, R. G. Hynes, M. E. Jenkin, M. J. Rossi, J. Troe To cite this version: R. Atkinson, D. L. Baulch, R. A. Cox, J. N. Crowley, R. F. Hampson, et al.. Evaluated kinetic and photochemical data for atmospheric chemistry: Volume III ? reactions of inorganic halogens. Atmospheric Chemistry and Physics Discussions, European Geosciences Union, 2006, 6 (2), pp.2281- 2702. hal-00301101
-
Upload
khangminh22 -
Category
Documents
-
view
1 -
download
0
Transcript of Evaluated kinetic and photochemical ... - Archive ouverte HAL

HAL Id: hal-00301101https://hal.archives-ouvertes.fr/hal-00301101
Submitted on 7 Apr 2006
HAL is a multi-disciplinary open accessarchive for the deposit and dissemination of sci-entific research documents, whether they are pub-lished or not. The documents may come fromteaching and research institutions in France orabroad, or from public or private research centers.
L’archive ouverte pluridisciplinaire HAL, estdestinée au dépôt et à la diffusion de documentsscientifiques de niveau recherche, publiés ou non,émanant des établissements d’enseignement et derecherche français ou étrangers, des laboratoirespublics ou privés.
Evaluated kinetic and photochemical data foratmospheric chemistry: Volume III ? reactions of
inorganic halogensR. Atkinson, D. L. Baulch, R. A. Cox, J. N. Crowley, R. F. Hampson, R. G.
Hynes, M. E. Jenkin, M. J. Rossi, J. Troe
To cite this version:R. Atkinson, D. L. Baulch, R. A. Cox, J. N. Crowley, R. F. Hampson, et al.. Evaluated kineticand photochemical data for atmospheric chemistry: Volume III ? reactions of inorganic halogens.Atmospheric Chemistry and Physics Discussions, European Geosciences Union, 2006, 6 (2), pp.2281-2702. �hal-00301101�
ACPD6, 2281–2702, 2006
Evaluated kinetic andphotochemical data
for atmosphericchemistry
R. Atkinson et al.
Title Page
Abstract Introduction
Conclusions References
Tables Figures
J I
J I
Back Close
Full Screen / Esc
Printer-friendly Version
Interactive Discussion
EGU
Atmos. Chem. Phys. Discuss., 6, 2281–2702, 2006www.atmos-chem-phys-discuss.net/6/2281/2006/© Author(s) 2006. This work is licensedunder a Creative Commons License.
AtmosphericChemistry
and PhysicsDiscussions
Evaluated kinetic and photochemical datafor atmospheric chemistry: Volume III –reactions of inorganic halogens
R. Atkinson1, D. L. Baulch2, R. A. Cox3, J. N. Crowley4, R. F. Hampson5,R. G. Hynes6, M. E. Jenkin7, M. J. Rossi8, and J. Troe9
1Air Pollution Research Center, University of California, Riverside, California 92521, USA2School of Chemistry, University of Leeds, Leeds LS2 9JT, UK3Centre for Atmospheric Science, Dept. of Chemistry, University of Cambridge, LensfieldRoad Cambridge CB2 1EP, UK4Max-Planck-Institut fur Chemie, Division of Atmospheric Chemistry, Postfach 3060, 55020Mainz, Germany5U.S. Dept. of Commerce, National Institute of Standards and Technology, Bldg. 221, RmA111, Gaithersburg, MD 20899, USA6Urban and Industrial Air Quality Group, CSIRO Energy Technology, East Entrance, RiversideCorporate Park, Delhi Road, North Ryde, Sydney, 2113, P.O. Box 136, North Ryde, NSW1670, Australia
2281

ACPD6, 2281–2702, 2006
Evaluated kinetic andphotochemical data
for atmosphericchemistry
R. Atkinson et al.
Title Page
Abstract Introduction
Conclusions References
Tables Figures
J I
J I
Back Close
Full Screen / Esc
Printer-friendly Version
Interactive Discussion
EGU
7 Dept. of Environmental Science and Technology, Imperial College London, Silwood Park,Ascot, Berkshire SL5 7PY UK8 Environment Naturel, Architectural et Construit, Pollution Atmospherique et Sol(LPAS/ENAC),EPFL CH 1015 Lausanne, Switzerland9 Institute of Physical Chemistry, University of Gottingen, Tammannstr. 6, 37077 Gottingen,Germany
∗ (The IUPAC Subcommittee on Gas Kinetic Data Evaluation for Atmospheric Chemistry)
Received: 18 October 2005 – Accepted: 3 November 2005 – Published: 7 April 2006
Correspondence to: R. A. Cox ([email protected])
2282

ACPD6, 2281–2702, 2006
Evaluated kinetic andphotochemical data
for atmosphericchemistry
R. Atkinson et al.
Title Page
Abstract Introduction
Conclusions References
Tables Figures
J I
J I
Back Close
Full Screen / Esc
Printer-friendly Version
Interactive Discussion
EGU
Abstract
This article, the third in the series, presents kinetic and photochemical data evalu-ated by the IUPAC Subcommittee on Gas Kinetic Data Evaluation for AtmosphericChemistry. It covers the gas phase and photochemical reactions of inorganic halogenspecies, which were last published in J. Phys. Chem. Ref. Data in 2000 (Atkinson et5
al., 2000), and were updated on the IUPAC website in 2003. The article consists ofa summary sheet, containing the recommended kinetic parameters for the evaluatedreactions, and five appendices containing the data sheets, which provide informationupon which the recommendations are made.
1 Introduction10
In the mid 1970s it was appreciated that there was a need for the establishment of aninternational panel to produce a set of critically evaluated rate parameters for reactionsof interest for atmospheric chemistry. To this end the CODATA Task Group on ChemicalKinetics, under the auspices of the International Council of Scientific Unions (ICSU),was constituted in 1977 and tasked to produce an evaluation of relevant, available ki-15
netic and photochemical data. The first evaluation by this international committee waspublished in J. Phys. Chem. Ref. Data in 1980 (Baulch et al., 1980), followed by Supple-ments in 1982 (Baulch et al., 1982) and 1984 (Baulch et al., 1984). In 1986 the IUPACSubcommittee on Data Evaluation superseded the original CODATA Task Group forAtmospheric Chemistry, and the Subcommittee has continued its data evaluation pro-20
gram with Supplements published in 1989 (Atkinson et al., 1989), 1992 (Atkinson etal., 1992), 1997 (Atkinson et al., 1997a), 1997 (Atkinson et al., 1997b), 1999 (Atkin-son et al., 1999) and 2000 (Atkinson et al., 2000). Following the last of these reports,Supplement VIII (Atkinson et al., 2000), the evaluation has continued to be updatedand published on the worldwide web (http://www.iupac-kinetic.ch.cam.ac.uk/). The IU-25
PAC website hosts an interactive data base with a search facility and implemented
2283

ACPD6, 2281–2702, 2006
Evaluated kinetic andphotochemical data
for atmosphericchemistry
R. Atkinson et al.
Title Page
Abstract Introduction
Conclusions References
Tables Figures
J I
J I
Back Close
Full Screen / Esc
Printer-friendly Version
Interactive Discussion
EGU
hyperlinks between the summary table and the data sheets, both of which can bedownloaded as individual PDF files. In order to further enhance the accessibility ofthis updated material to the scientific community, the evaluation is being published asa series of articles in Atmospheric Chemistry and Physics. This article is the third ofthe series, Volume III.5
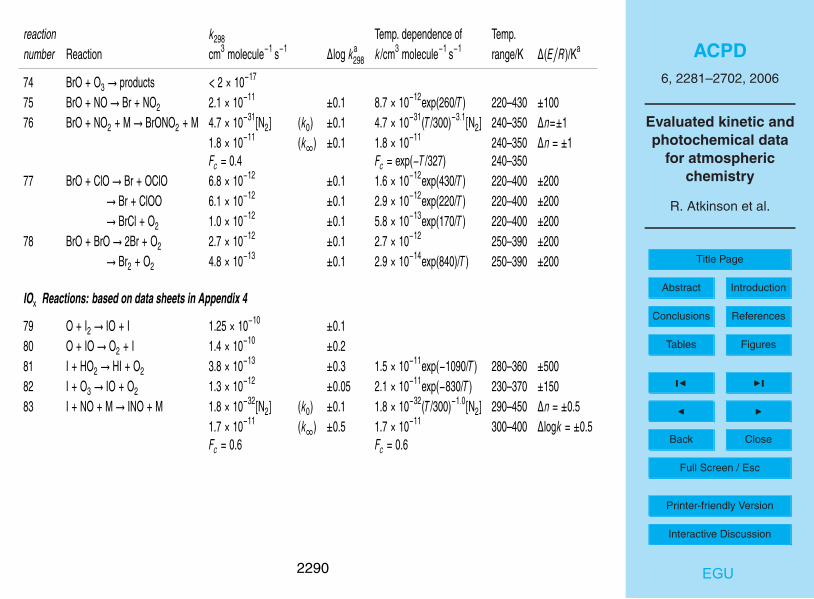
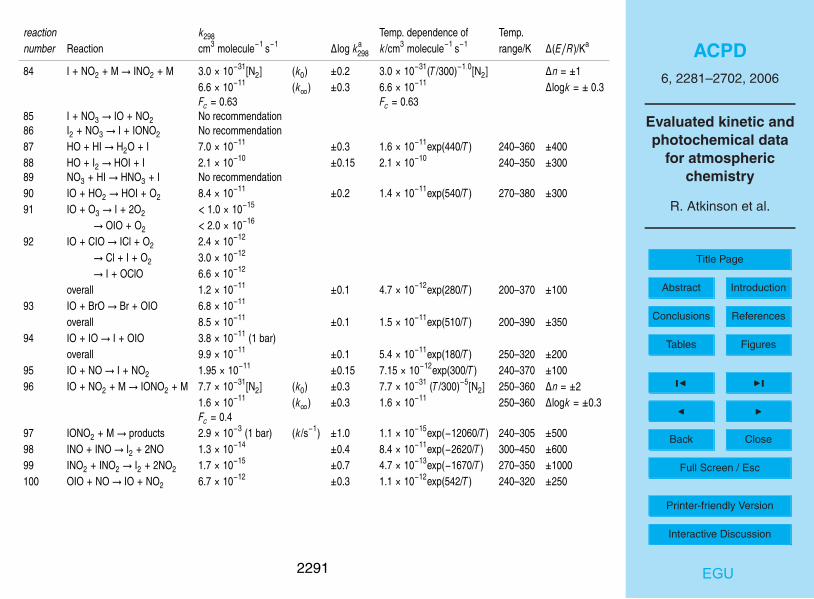
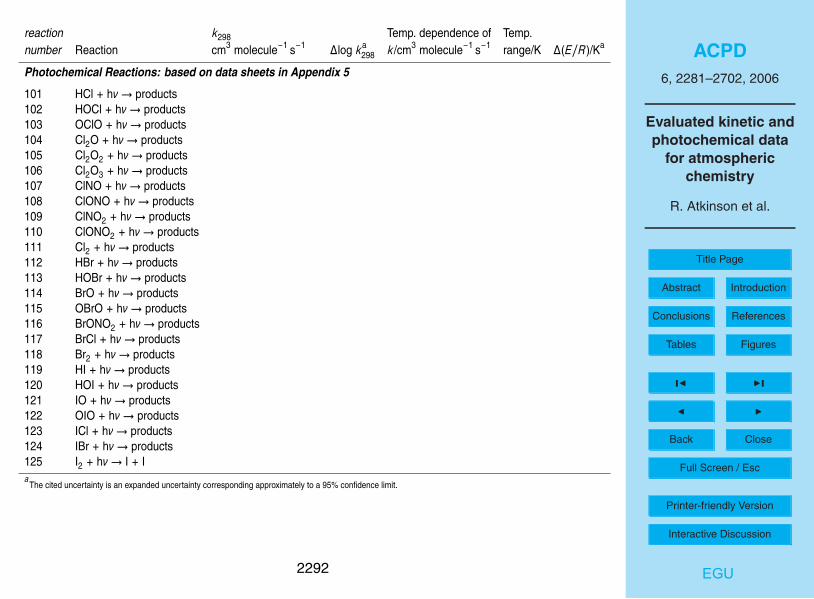
2 Summary of recommended rate coefficients for inorganic reactions
The ordering of families in the Summary Table is: FOx (Appendix 1), ClOx (Appendix 2),BrOx (Appendix 3) and IOx (Appendix 4). Photochemical reactions are listed in Ap-pendix 5. The reactions are numbered sequentially for the whole Volume. Within eachfamily, reactions are listed in the order: O(3P), O(1D), halogen atom, OH radical, NO310
radical and halogen oxide reactions. Chemical reactions are listed as first reactant(usually an atom or radical) + second reactant (usually a molecule). Each datasheethas a unique identifier: ‘Volume: Appendix: reaction number’. For example, the firstreaction in the summary sheet below refers to Datasheet ‘III.A1.1’.
2284

ACPD6, 2281–2702, 2006
Evaluated kinetic andphotochemical data
for atmosphericchemistry
R. Atkinson et al.
Title Page
Abstract Introduction
Conclusions References
Tables Figures
J I
J I
Back Close
Full Screen / Esc
Printer-friendly Version
Interactive Discussion
EGU
3 Table 1. Summary of recommended rate coefficients for inorganic reactions
reaction k298 Temp. dependence of Temp.number Reaction cm3 molecule−1 s−1 ∆log ka
298 k/cm3 molecule−1 s−1 range/K ∆(E/R)/Ka
FOx Reactions: based on data sheets in Appendix 1
1 O + FO→ O2 + F 2.7 × 10⁻¹¹ ±0.32 O + FO2 → O2 + FO 5 × 10⁻¹¹ ±0.73 O(1D) + HF→ HO + F 1.5 × 10⁻¹¹ ±0.1
→ O(3P) + HF 3.6 × 10⁻¹¹ ±0.1overall 5.1 × 10⁻¹¹ ±0.2
4 F + H2 → HF + H 2.4 × 10⁻¹¹ ±0.1 1.1 × 10⁻¹⁰exp(−450/T ) 190–380 ±1005 F + H2O→ HF + HO 1.4 × 10⁻¹¹ ±0.1 1.4 × 10⁻¹¹ 240–380 ±2006 F + O2 + M→ FO2 + M 5.8 × 10⁻³³[N2] (k0) ±0.3 5.8 × 10⁻³³(T /300)−1.7[N2] 100–380 ∆n = ±0.5
1.2 × 10⁻¹⁰ (k∞) ±0.3 1.2 × 10⁻¹⁰ 100–380 ∆k∞ = ±0.3Fc ≈ 0.5 Fc ≈ 0.5 100–380
7 FO2 + M→ F + O2 + M 1.5 × 10⁻¹⁷[N2] (k0/s−1) ±0.3 8.4 × 10⁻⁹(T /300)−1.25 × 310–420 ±500exp(−5990/T )[N2] ∆n = ± 0.5
3.1 × 10⁵ (k∞/s−1) ±0.3 1.7 × 10¹⁴(T /300)0.45 × 310–420 ±500exp(−5990/T ) ∆n = ±0.5
Fc ≈ 0.5 Fc ≈ 0.5 310–4208 F + O3 → FO + O2 1.0 × 10⁻¹¹ ±0.25 2.2 × 10⁻¹¹exp(−230/T ) 250–370 ±2009 F + HONO2 → HF + NO3 2.3 × 10⁻¹¹ ±0.1 6.0 × 10⁻¹²exp(400/T ) 260–320 ±20010 FO + O3 → products < 1 × 10⁻¹⁴
11 FO + NO→ F + NO2 2.2 × 10⁻¹¹ ±0.15 8.2 × 10⁻¹²exp(300/T ) 290–850 ±20012 FO + FO→ products 1.0 × 10⁻¹¹ ±0.2 1.0 × 10⁻¹¹ 290–440 ±25013 FO2 + O3 → products < 4 × 10⁻¹⁶
14 FO2 + NO→ FNO + O2 7.5 × 10⁻¹³ ±0.3 7.5 × 10⁻¹²exp(−690/T ) 190–300 ±40015 FO2 + NO2 → products 4.0 × 10⁻¹⁴ ±0.3 3.8 × 10⁻¹¹exp(−2040/T ) 260–320 ±500
2285

ACPD6, 2281–2702, 2006
Evaluated kinetic andphotochemical data
for atmosphericchemistry
R. Atkinson et al.
Title Page
Abstract Introduction
Conclusions References
Tables Figures
J I
J I
Back Close
Full Screen / Esc
Printer-friendly Version
Interactive Discussion
EGU
reaction k298 Temp. dependence of Temp.number Reaction cm3 molecule−1 s−1 ∆log ka
298 k/cm3 molecule−1 s−1 range/K ∆(E/R)/Ka
ClOx Reactions: based on data sheets in Appendix 2
16 O + HOCl→ HO + ClO 1.7 × 10⁻¹³ ±0.5 1.7 × 10⁻¹³ 210–300 ±30017 O + ClO→ Cl + O2 3.7 × 10⁻¹¹ ±0.6 2.5 × 10⁻¹¹exp(110/T ) 220–390 ±5018 O + OClO→ O2 + ClO 1.0 × 10⁻¹³ ±0.3 2.4 × 10⁻¹²exp(−960/T ) 240–400 ±30019 O + OClO + M→ ClO3 + M 1.8 × 10⁻³¹[N2] (k0) ±0.3 1.8 × 10⁻³¹(T /298)−1[N2] 240–320 ∆n = ± 0.5
2.8 × 10⁻¹¹ (k∞) ±0.3 2.8 × 10⁻¹¹ 240–320 ∆n = ±1Fc = 0.5
20 O + Cl2O→ ClO + ClO 4.5 × 10⁻¹² ±0.15 2.7 × 10⁻¹¹exp(−530/T ) 230–380 ±20021 O + ClONO2 → products 2.2 × 10⁻¹³ ±0.08 4.5 × 10⁻¹²exp(−900/T ) 200–330 ±15022 Cl + H2 → HCl + H 1.7 × 10⁻¹⁴ ±0.1 3.9 × 10⁻¹¹exp(−2310/T ) 200–310 ±20023 Cl + HO2 → HCl + O2 3.4 × 10⁻¹¹ ±0.2
→ ClO + O2 9.3 × 10⁻¹² ±0.2 6.3 × 10⁻¹¹exp(−570/T ) 230–420 ±200→ products 4.3 × 10⁻¹¹ 4.3 × 10⁻¹¹ 230–420
24 Cl + H2O2 → HCl + HO2 4.1 × 10⁻¹³ ±0.2 1.1 × 10⁻¹¹exp(−980/T ) 260–430 ±50025 Cl + O2 + M→ ClOO + M 1.4 × 10⁻³³[N2] (k0) ±0.2 1.4 × 10⁻³³(T /300)−3.9[N2] 160–300 ∆n = ±1
1.6 × 10⁻³³[O2] (k0) ±0.2 1.6 × 10⁻³³(T /300)−2.9[O2] 160–300 ∆n = ±126 ClOO + M→ Cl + O2 + M 6.2 × 10⁻¹³[N2] (k0/s−1) ±0.3 2.8 × 10⁻¹⁰exp(−1820/T )[N2] 160–300 ±20027 Cl + CO + M→ ClCO + M 1.3 × 10⁻³³[N2] (k0) ±0.3 1.3 × 10⁻³³(T /300)−3.8[N2] 180–300 ∆n = ±128 ClCO + M→ Cl + CO + M 2.0 × 10⁻¹⁴[N2] (k0/s−1) ±0.4 4.1 × 10⁻¹⁰exp(−2960/T )[N2] 180–300 ±20029 Cl + O3 → ClO + O2 1.2 × 10⁻¹¹ ±0.06 2.8 × 10⁻¹¹exp(−250/T ) 180–300 +100
−150
30 Cl + HONO2 → HCl + NO3 < 2 × 10⁻¹⁶
31 Cl + NO3 → ClO + NO2 2.4 × 10⁻¹¹ ±0.2 2.4 × 10⁻¹¹ 200–300 ±40032 Cl + OClO→ ClO + ClO 5.7 × 10⁻¹¹ ±0.1 3.2 × 10⁻¹¹exp(170)T ) 220–430 ±20033 Cl + Cl2O→ Cl2 + ClO 9.6 × 10⁻¹¹ ±0.1 6.2 × 10⁻¹¹exp(130/T ) 230–380 ±13034 Cl + Cl2O2 → Cl2 + ClOO 1.0 × 10⁻¹⁰ ±0.3 1.0 × 10⁻¹⁰ 230–300 ±30035 Cl + ClONO2 → Cl2 + NO3 1.0 × 10⁻¹¹ ±0.1 6.2 × 10⁻¹²exp(145/T ) 190–360 ±50
2286

ACPD6, 2281–2702, 2006
Evaluated kinetic andphotochemical data
for atmosphericchemistry
R. Atkinson et al.
Title Page
Abstract Introduction
Conclusions References
Tables Figures
J I
J I
Back Close
Full Screen / Esc
Printer-friendly Version
Interactive Discussion
EGU
reaction k298 Temp. dependence of Temp.number Reaction cm3 molecule−1 s−1 ∆log ka
298 k/cm3 molecule−1 s−1 range/K ∆(E/R)/Ka
36 HO + Cl2 → HOCl + Cl 6.5 × 10⁻¹⁴ ±0.08 3.6 × 10⁻¹²exp(−1200/T ) 230–360 ±30037 HO + HCl→ H2O + Cl 8.0 × 10⁻¹³ ±0.06 1.8 × 10⁻¹²exp(−240/T ) 200–300 ±10038 HO + HOCl→ ClO + H2O 5.0 × 10⁻¹³ ±0.539 HO + ClO→ HO2 + Cl 1.9 × 10⁻¹¹
→ HCl + O2 1.2 × 10⁻¹²
overall 2.0 × 10⁻¹¹ ±0.15 7.3 × 10⁻¹²exp(300/T ) 200–380 ±10040 HO + OClO→ HOCl + O2 6.6 × 10⁻¹² ±0.3 4.5 × 10⁻¹³exp(800/T ) 290–480 ±20041 HO + ClNO2 → HOCl + NO2 3.6 × 10⁻¹⁴ ±0.3 2.4 × 10⁻¹²exp(−1250/T ) 260–350 ±30042 HO + ClONO2 → products 4.0 × 10⁻¹³ ±0.2 1.2 × 10⁻¹²exp(−330/T ) 240–390 ±20043 NO3 + HCl→ HNO3 + Cl < 5 × 10⁻¹⁷
44 ClO + HO2 → HOCl + O2→ HCl + O3
overall 6.9 × 10⁻¹² ±0.20 2.2 × 10⁻¹²exp(340/T ) 230–300 ±35045 ClO + O3 → ClOO + O2 < 1.5 × 10⁻¹⁷
→ OClO + O2 < 1 × 10⁻¹⁸
46 ClO + NO→ Cl + NO2 1.7 × 10⁻¹¹ ±0.1 6.2 × 10⁻¹²exp(295/T ) 200–420 ±100
2287

ACPD6, 2281–2702, 2006
Evaluated kinetic andphotochemical data
for atmosphericchemistry
R. Atkinson et al.
Title Page
Abstract Introduction
Conclusions References
Tables Figures
J I
J I
Back Close
Full Screen / Esc
Printer-friendly Version
Interactive Discussion
EGU
reaction k298 Temp. dependence of Temp.number Reaction cm3 molecule−1 s−1 ∆log ka
298 k/cm3 molecule−1 s−1 range/K ∆(E/R)/Ka
47 ClO + NO2 + M→ ClONO2 + M 1.6 × 10⁻³¹[N2] (k0) ±0.1 1.6 × 10⁻³¹(T /300)−3.4[N2] 250–350 ∆n = ±17.0 × 10⁻¹¹ (k∞) ±0.3 7.0 × 10⁻¹¹ 250–350 ∆log k = ±0.3Fc = 0.5 Fc = exp(−T /430) 250–350
48 ClO + NO3 → ClOO + NO2
→ OClO + NO2 1.2 × 10⁻¹³ ±0.3overall 4.6 × 10⁻¹³ ±0.2 4.6 × 10⁻¹³ 210–360 ±400
49 ClO + ClO→ Cl2 + O2 4.8 × 10⁻¹⁵ ±0.2 1.0 × 10⁻¹²exp(−1590/T ) 260–390 ±300→ Cl + ClOO 8.0 × 10⁻¹⁵ ±0.2 3.0 × 10⁻¹¹exp(−2450/T ) 260–390 ±500→ Cl + OClO 3.5 × 10⁻¹⁵ ±0.2 3.5 × 10⁻¹³exp(−1370/T ) 260–390 ±300
50 ClO + ClO + M→ Cl2O2 + M 2.0 × 10⁻³²[N2] (k0) ±0.1 2.0 × 10⁻³²(T /300)−4[N2] 190–390 ∆n = ±1.51.0 × 10−11 (k∞) ±0.3 1.0 × 10⁻¹¹ 190–390 ∆log k = ±0.3Fc = 0.45 Fc = 0.45 190–390
51 Cl2O2 + M→ ClO + ClO + M 2.3 × 10⁻¹⁸[N2] (k0/s−1) ±0.3 3.7 × 10⁻⁷exp(−7690/T )[N2](s−1) 260–310 ±9001.1 × 103 (k∞/s−1) ±0.3 1.8 × 10¹⁴exp(−7690/T )(k0/s−1) 260–310 ±500Fc = 0.45 Fc = 0.45 260–310
52 ClO + OClO + M→ Cl2O3 + M 6.2 × 10⁻³²[N2] (k0) ±0.3 6.2 × 10⁻³²(T /300)−4.7[N2] 200–300 ∆n = ±12.4 × 10⁻¹¹ (k∞) ±0.3 2.4 × 10⁻¹¹ 200–300 ∆log k∞ = ±0.3Fc = 0.6 Fc = 0.6 200–300
53 Cl2O3 + M→ ClO + OClO + M 4.1 × 10⁻¹⁶ [N2] (k0/s−1) ±0.5 1.4 × 10⁻¹⁰ exp(−3810/T )[N2] 200–300 ±5001.6 × 105 (k∞/s−1) ±0.5 2.5 × 10¹² exp(−4940/T ) 200–300 ±500
54 OClO + O3 → ClO3 + O2 3.0 × 10⁻¹⁹ ±0.4 2.1 × 10⁻¹²exp(−4700)/T ) 260–300 ±100055 OClO + NO→ NO2 + ClO 3.6 × 10⁻¹³ ±0.15 1.1 × 10⁻¹³exp(350)/T ) 220–370 ±20056 OClO + NO3 + M→ products see datasheet57 Cl2O2 + O3 → ClO + ClOO + O2 < 1 × 10⁻¹⁹ (200 K)
2288

ACPD6, 2281–2702, 2006
Evaluated kinetic andphotochemical data
for atmosphericchemistry
R. Atkinson et al.
Title Page
Abstract Introduction
Conclusions References
Tables Figures
J I
J I
Back Close
Full Screen / Esc
Printer-friendly Version
Interactive Discussion
EGU
reaction k298 Temp. dependence of Temp.number Reaction cm3 molecule−1 s−1 ∆log ka
298 k/cm3 molecule−1 s−1 range/K ∆(E/R)/Ka
BrOx Reactions: based on data sheets in Appendix 3
58 O + HOBr→ HO + BrO 2.8 × 10⁻¹¹ ±0.2 1.2 × 10⁻¹⁰exp(−430/T ) 230–430 ± 30059 O + BrO→ HO + BrO 4.1 × 10⁻¹¹ ±0.2 1.9 × 10⁻¹¹exp(230)/T ) 230–330 ±15060 Br + HO2 → HBr + O2 1.7 × 10⁻¹² ±0.2 7.7 × 10⁻¹²exp(−450)/T ) 230–390 ±20061 Br + H2O2 → HBr + HO2
→ HOBr + HOOverall < 5 × 10⁻¹⁶
62 Br + O3 → BrO + O2 1.2 × 10⁻¹² ±0.08 1.7 × 10⁻¹¹exp(−800)/T ) 190–430 ±20063 Br + NO2 + M→ BrNO2 + M 4.2 × 10⁻³¹[N2] (k0) ±0.3 4.2 × 10⁻³¹(T /300)−2.4[N2] 250–350 ∆n = ±1
2.7 × 10⁻¹¹ (k∞) ±0.4 2.7 × 10⁻¹¹ 250–350 ∆log k = ±0.4Fc = 0.55
64 Br + OClO→ BrO + ClO 3.5 × 10⁻¹³ ±0.3 2.7 × 10⁻¹¹exp(−1300/T ) 260–430 ±30065 Br + Cl2O→ BrCl + ClO 4.3 × 10⁻¹² ±0.1 2.1 × 10⁻¹¹exp(−470/T ) 220–410 ±20066 Br + Cl2O2 → BrCl + ClOO 3.0 × 10⁻¹² ±0.367 HO + HBr→ H2O + Br 1.1 × 10⁻¹¹ ±0.1 5.5 × 10⁻¹²exp(205/T ) 180–360 ±25068 HO + Br2 → HOBr + Br 4.5 × 10⁻¹¹ ±0.1 2.0 × 10⁻¹¹exp(240/T ) 230–360 ±15069 HO + BrO→ products 4.1 × 10⁻¹¹ ±0.3 1.8 × 10⁻¹¹exp(250/T ) 230–350 ±30070 Br + NO3 → BrO + NO2 1.6 × 10⁻¹¹ ±0.371 BrO + NO3 → BrOO + NO2 1.0 × 10⁻¹² ±0.572 NO3 + HBr→ HNO3 + Br < 1 × 10⁻¹⁶
73 BrO + HO2 → HOBr + O2→ HBr + O3
Overall 2.4 × 10⁻¹¹ ±0.3 4.5 × 10⁻¹²exp(500/T ) 210–360 ±200
2289
ACPD6, 2281–2702, 2006
Evaluated kinetic andphotochemical data
for atmosphericchemistry
R. Atkinson et al.
Title Page
Abstract Introduction
Conclusions References
Tables Figures
J I
J I
Back Close
Full Screen / Esc
Printer-friendly Version
Interactive Discussion
EGU
reaction k298 Temp. dependence of Temp.number Reaction cm3 molecule−1 s−1 ∆log ka
298 k/cm3 molecule−1 s−1 range/K ∆(E/R)/Ka
74 BrO + O3 → products < 2 × 10⁻¹⁷
75 BrO + NO→ Br + NO2 2.1 × 10⁻¹¹ ±0.1 8.7 × 10⁻¹²exp(260/T ) 220–430 ±10076 BrO + NO2 + M→ BrONO2 + M 4.7 × 10⁻³¹[N2] (k0) ±0.1 4.7 × 10⁻³¹(T /300)−3.1[N2] 240–350 ∆n=±1
1.8 × 10⁻¹¹ (k∞) ±0.1 1.8 × 10⁻¹¹ 240–350 ∆n = ±1Fc = 0.4 Fc = exp(−T /327) 240–350
77 BrO + ClO→ Br + OClO 6.8 × 10⁻¹² ±0.1 1.6 × 10⁻¹²exp(430/T ) 220–400 ±200→ Br + ClOO 6.1 × 10⁻¹² ±0.1 2.9 × 10⁻¹²exp(220/T ) 220–400 ±200→ BrCl + O2 1.0 × 10⁻¹² ±0.1 5.8 × 10⁻¹³exp(170/T ) 220–400 ±200
78 BrO + BrO→ 2Br + O2 2.7 × 10⁻¹² ±0.1 2.7 × 10⁻¹² 250–390 ±200→ Br2 + O2 4.8 × 10⁻¹³ ±0.1 2.9 × 10⁻¹⁴exp(840)/T ) 250–390 ±200
IOx Reactions: based on data sheets in Appendix 4
79 O + I2 → IO + I 1.25 × 10⁻¹⁰ ±0.180 O + IO→ O2 + I 1.4 × 10⁻¹⁰ ±0.281 I + HO2 → HI + O2 3.8 × 10⁻¹³ ±0.3 1.5 × 10⁻¹¹exp(−1090/T ) 280–360 ±50082 I + O3 → IO + O2 1.3 × 10⁻¹² ±0.05 2.1 × 10⁻¹¹exp(−830/T ) 230–370 ±15083 I + NO + M→ INO + M 1.8 × 10⁻³²[N2] (k0) ±0.1 1.8 × 10⁻³²(T /300)−1.0[N2] 290–450 ∆n = ±0.5
1.7 × 10⁻¹¹ (k∞) ±0.5 1.7 × 10⁻¹¹ 300–400 ∆logk = ±0.5Fc = 0.6 Fc = 0.6
2290
ACPD6, 2281–2702, 2006
Evaluated kinetic andphotochemical data
for atmosphericchemistry
R. Atkinson et al.
Title Page
Abstract Introduction
Conclusions References
Tables Figures
J I
J I
Back Close
Full Screen / Esc
Printer-friendly Version
Interactive Discussion
EGU
reaction k298 Temp. dependence of Temp.number Reaction cm3 molecule−1 s−1 ∆log ka
298 k/cm3 molecule−1 s−1 range/K ∆(E/R)/Ka
84 I + NO2 + M→ INO2 + M 3.0 × 10⁻³¹[N2] (k0) ±0.2 3.0 × 10⁻³¹(T /300)−1.0[N2] ∆n = ±16.6 × 10⁻¹¹ (k∞) ±0.3 6.6 × 10⁻¹¹ ∆logk = ± 0.3Fc = 0.63 Fc = 0.63
85 I + NO3 → IO + NO2 No recommendation86 I2 + NO3 → I + IONO2 No recommendation87 HO + HI→ H2O + I 7.0 × 10⁻¹¹ ±0.3 1.6 × 10⁻¹¹exp(440/T ) 240–360 ±40088 HO + I2 → HOI + I 2.1 × 10⁻¹⁰ ±0.15 2.1 × 10⁻¹⁰ 240–350 ±30089 NO3 + HI→ HNO3 + I No recommendation90 IO + HO2 → HOI + O2 8.4 × 10⁻¹¹ ±0.2 1.4 × 10⁻¹¹exp(540/T ) 270–380 ±30091 IO + O3 → I + 2O2 < 1.0 × 10⁻¹⁵
→ OIO + O2 < 2.0 × 10⁻¹⁶
92 IO + CIO→ ICl + O2 2.4 × 10⁻¹²
→ Cl + I + O2 3.0 × 10⁻¹²
→ I + OClO 6.6 × 10⁻¹²
overall 1.2 × 10⁻¹¹ ±0.1 4.7 × 10⁻¹²exp(280/T ) 200–370 ±10093 IO + BrO→ Br + OIO 6.8 × 10⁻¹¹
overall 8.5 × 10⁻¹¹ ±0.1 1.5 × 10⁻¹¹exp(510/T ) 200–390 ±35094 IO + IO→ I + OIO 3.8 × 10⁻¹¹ (1 bar)
overall 9.9 × 10⁻¹¹ ±0.1 5.4 × 10⁻¹¹exp(180/T ) 250–320 ±20095 IO + NO→ I + NO2 1.95 × 10⁻¹¹ ±0.15 7.15 × 10⁻¹²exp(300/T ) 240–370 ±10096 IO + NO2 + M→ IONO2 + M 7.7 × 10⁻³¹[N2] (k0) ±0.3 7.7 × 10⁻³¹ (T /300)−5[N2] 250–360 ∆n = ±2
1.6 × 10⁻¹¹ (k∞) ±0.3 1.6 × 10⁻¹¹ 250–360 ∆logk = ±0.3Fc = 0.4
97 IONO2 + M→ products 2.9 × 10⁻³ (1 bar) (k/s−1) ±1.0 1.1 × 10⁻¹⁵exp(−12060/T ) 240–305 ±50098 INO + INO→ I2 + 2NO 1.3 × 10⁻¹⁴ ±0.4 8.4 × 10⁻¹¹exp(−2620/T ) 300–450 ±60099 INO2 + INO2 → I2 + 2NO2 1.7 × 10⁻¹⁵ ±0.7 4.7 × 10⁻¹³exp(−1670/T ) 270–350 ±1000100 OIO + NO→ IO + NO2 6.7 × 10⁻¹² ±0.3 1.1 × 10⁻¹²exp(542/T ) 240–320 ±250
2291
ACPD6, 2281–2702, 2006
Evaluated kinetic andphotochemical data
for atmosphericchemistry
R. Atkinson et al.
Title Page
Abstract Introduction
Conclusions References
Tables Figures
J I
J I
Back Close
Full Screen / Esc
Printer-friendly Version
Interactive Discussion
EGU
reaction k298 Temp. dependence of Temp.number Reaction cm3 molecule−1 s−1 ∆log ka
298 k/cm3 molecule−1 s−1 range/K ∆(E/R)/Ka
Photochemical Reactions: based on data sheets in Appendix 5
101 HCl + hν→ products102 HOCl + hν→ products103 OClO + hν→ products104 Cl2O + hν→ products105 Cl2O2 + hν→ products106 Cl2O3 + hν→ products107 ClNO + hν→ products108 ClONO + hν→ products109 ClNO2 + hν→ products110 ClONO2 + hν→ products111 Cl2 + hν→ products112 HBr + hν→ products113 HOBr + hν→ products114 BrO + hν→ products115 OBrO + hν→ products116 BrONO2 + hν→ products117 BrCl + hν→ products118 Br2 + hν→ products119 HI + hν→ products120 HOI + hν→ products121 IO + hν→ products122 OIO + hν→ products123 ICl + hν→ products124 IBr + hν→ products125 I2 + hν→ I + Ia
The cited uncertainty is an expanded uncertainty corresponding approximately to a 95% confidence limit.
2292

ACPD6, 2281–2702, 2006
Evaluated kinetic andphotochemical data
for atmosphericchemistry
R. Atkinson et al.
Title Page
Abstract Introduction
Conclusions References
Tables Figures
J I
J I
Back Close
Full Screen / Esc
Printer-friendly Version
Interactive Discussion
EGU
4 Guide to the data sheets
The data sheets are principally of two types: (i) those for individual thermal reactionsand (ii) those for the individual photochemical reactions.
4.1 Thermal reactions
The data sheets begin with a statement of the reactions including all pathways which5
are considered feasible. This is followed by the corresponding enthalpy changes at298 K, calculated from the enthalpies of formation summarized in the ThermodynamicsData summary.
The available kinetic data on the reactions are summarized under two headings: (i)Absolute Rate Coefficients, and (ii) Relative Rate Coefficients. Under these headings,10
we include new data which have been published since the last published IUPAC eval-uation as well as the data used in deriving the preferred values. Under both of theheadings above, the data are presented as absolute rate coefficients. If the tempera-ture coefficient has been measured, the results are given in a temperature dependentform over a stated temperature range. For bimolecular reactions, the temperature de-15
pendence is usually expressed in the normal Arrhenius form, k=A exp(−B/T ), whereB=E/R. For a few bimolecular reactions, we have listed temperature dependencesin the alternative form, k=A′T−n or CT n exp(−D/T ), where the original authors havefound this to give a better fit to the data. For pressure dependent combination anddissociation reactions, the non-Arrhenius temperature dependence is used. This is20
discussed more fully in a subsequent section of this Introduction.Single temperature data are presented as such and wherever possible the rate coef-
ficient at, or close to, 298 K is quoted directly as measured by the original authors. Thismeans that the listed rate coefficient at 298 K may differ slightly from that calculatedfrom the Arrhenius parameters determined by the same authors. Rate coefficients at25
298 K marked with an asterisk indicate that the value was calculated by extrapolationof a measured temperature range which did not include 298 K. The tables of data are
2293

ACPD6, 2281–2702, 2006
Evaluated kinetic andphotochemical data
for atmosphericchemistry
R. Atkinson et al.
Title Page
Abstract Introduction
Conclusions References
Tables Figures
J I
J I
Back Close
Full Screen / Esc
Printer-friendly Version
Interactive Discussion
EGU
supplemented by a series of comments summarizing the experimental details. Thefollowing list of abbreviations, relating to experimental techniques, is used in the Tech-niques and Comments sections:
A – absorptionAS – absorption spectroscopy5
CCD – charge coupled detectorCIMS – chemical ionization mass spectroscopy/spectrometricCL – chemiluminescenceCRDS – cavity ring-down spectroscopyDF – discharge flow10
EPR – electron paramagnetic resonanceF – flow systemFP – flash photolysisFTIR – Fourier transform infraredFTS – Fourier transform spectroscopy15
GC – gas chromatography/gas chromatographicHPLC – high-performance liquid chromatographyIR – infraredLIF – laser induced fluorescenceLMR – laser magnetic resonance20
LP – laser photolysisMM – molecular modulationMS – mass spectrometry/mass spectrometricP – steady state photolysisPLP – pulsed laser photolysis25
PR – pulse radiolysisRA – resonance absorptionRF – resonance fluorescenceRR – relative rate
2294

ACPD6, 2281–2702, 2006
Evaluated kinetic andphotochemical data
for atmosphericchemistry
R. Atkinson et al.
Title Page
Abstract Introduction
Conclusions References
Tables Figures
J I
J I
Back Close
Full Screen / Esc
Printer-friendly Version
Interactive Discussion
EGU
S – static systemTDLS – tunable diode laser spectroscopyUV – ultravioletUVA – ultraviolet absorptionVUVA – vacuum ultraviolet absorption5
For measurements of relative rate coefficients, wherever possible the commentscontain the actual measured ratio of rate coefficients together with the rate coefficientof the reference reaction used to calculate the absolute rate coefficient listed in thedata table. The absolute value of the rate coefficient given in the table may be different10
from that reported by the original author owing to a different choice of rate coefficient ofthe reference reaction. Whenever possible the reference rate data are those preferredin the present evaluation.
The preferred rate coefficients are presented (i) at a temperature of 298 K and (ii)in temperature dependent form over a stated temperature range. This is followed by15
a statement of the uncertainty limits in log k at 298 K and the uncertainty limits eitherin (E/R) or in n, for the mean temperature in the range. Some comments on theassignment of uncertainties are given later in this Introduction.
The “Comments on Preferred Values” describe how the selection was made andgive any other relevant information. The extent of the comments depends upon the20
present state of our knowledge of the particular reaction in question. The data sheetsare concluded with a list of the relevant references.
4.2 Conventions concerning rate coefficients
All of the reactions in the table are elementary processes. Thus the rate expression isderived from a statement of the reaction, e.g.25
A + A→ B + C
2295

ACPD6, 2281–2702, 2006
Evaluated kinetic andphotochemical data
for atmosphericchemistry
R. Atkinson et al.
Title Page
Abstract Introduction
Conclusions References
Tables Figures
J I
J I
Back Close
Full Screen / Esc
Printer-friendly Version
Interactive Discussion
EGU
−12
d[A]
dt=
d[B]
dt=
d[C]
dt= k[A]2.
Note that the stoichiometric coefficient for A, i.e. 2, appears in the denominator beforethe rate of change of [A] (which is equal to 2k[A]2) and as a power on the righthandside.
Representations of k as a function of temperature characterize simple “direct” bi-5
molecular reactions. Sometimes it is found that k also depends on the pressure andthe nature of the bath gas. This may be an indication of complex formation during thecourse of the bimolecular reaction, which is always the case in combination reactions.In the following sections the representations of k which are adopted in these cases areexplained.10
4.3 Treatment of combination and dissociation reactions
Unlike simple bimolecular reactions such as those considered in Sect. 1.2, combinationreactions
A + B + M→ AB + M
and the reverse dissociation reactions15
AB + M→ A + B + M
are composed of sequences of different types of physical and chemical elementaryprocesses. Their rate coefficients reflect the more complicated sequential mechanismand depend on the temperature, T , and the nature and concentration of the third body,[M]. In this evaluation, the combination reactions are described by a formal second20
order rate law:
d[AB]
dt= k[A][B]
2296
ACPD6, 2281–2702, 2006
Evaluated kinetic andphotochemical data
for atmosphericchemistry
R. Atkinson et al.
Title Page
Abstract Introduction
Conclusions References
Tables Figures
J I
J I
Back Close
Full Screen / Esc
Printer-friendly Version
Interactive Discussion
EGU
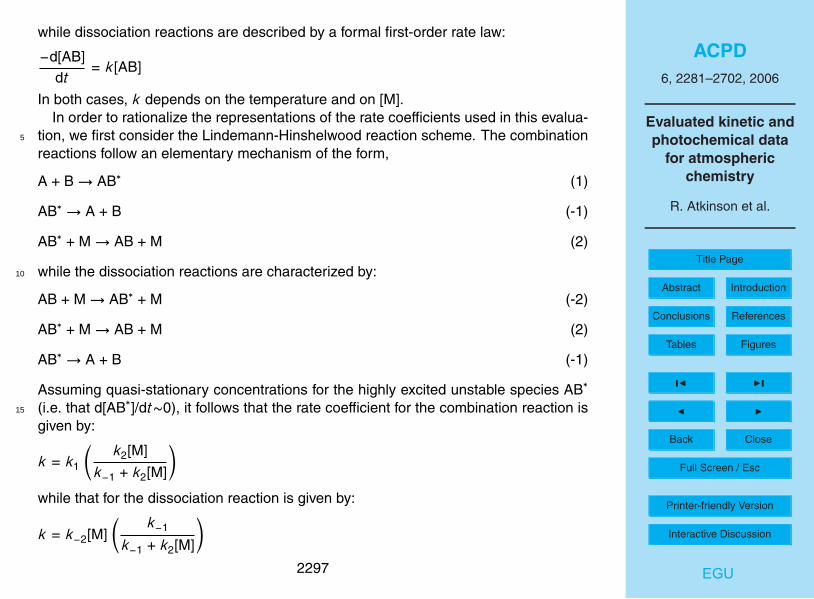
while dissociation reactions are described by a formal first-order rate law:
−d[AB]
dt= k[AB]
In both cases, k depends on the temperature and on [M].In order to rationalize the representations of the rate coefficients used in this evalua-
tion, we first consider the Lindemann-Hinshelwood reaction scheme. The combination5
reactions follow an elementary mechanism of the form,
A + B→ AB∗ (1)
AB∗ → A + B (-1)
AB∗ + M→ AB + M (2)
while the dissociation reactions are characterized by:10
AB + M→ AB∗ + M (-2)
AB∗ + M→ AB + M (2)
AB∗ → A + B (-1)
Assuming quasi-stationary concentrations for the highly excited unstable species AB∗
(i.e. that d[AB∗]/dt∼0), it follows that the rate coefficient for the combination reaction is15
given by:
k = k1
(k2[M]
k−1 + k2[M]
)while that for the dissociation reaction is given by:
k = k−2[M]( k−1
k−1 + k2[M]
)2297

ACPD6, 2281–2702, 2006
Evaluated kinetic andphotochemical data
for atmosphericchemistry
R. Atkinson et al.
Title Page
Abstract Introduction
Conclusions References
Tables Figures
J I
J I
Back Close
Full Screen / Esc
Printer-friendly Version
Interactive Discussion
EGU
In these equations the expressions before the parentheses represent the rate coeffi-cients of the process initiating the reaction, whereas the expressions within the paren-theses denote the fraction of reaction events which, after initiation, complete the reac-tion to products.
In the low pressure limit ([M]→ 0) the rate coefficients are proportional to [M]; in the5
high pressure limit ([M]→ ∞) they are independent of [M]. It is useful to express k interms of the limiting low pressure and high pressure rate coefficients,
k0 = limk([M])
[M]→ 0and,
k∞ = limk([M])
[M]→∞respectively. From this convention, the Lindemann-Hinshelwood equation is obtained
k =kok∞
ko + k∞10
It follows that for combination reactions, k0=k1k2[M]/k−1 and k∞=k1, while for disso-ciation reactions, k0=k−2[M] and k∞=k−1k−2/k2. Since detailed balancing applies, theratio of the rate coefficients for combination and dissociation at a fixed T and [M] isgiven by the equilibrium constant Kc=k1k2/k−1k−2.
Starting from the high-pressure limit, the rate coefficients fall-off with decreasing15
third body concentration [M] and the corresponding representation of k as a functionof [M] is termed the “falloff curve” of the reaction. In practice, the above Lindemann-Hinshelwood expressions do not suffice to characterize the falloff curves completely.Because of the multistep character of the collisional deactivation (k2[M]) and activation(k−2[M]) processes, and energy- and angular momentum-dependencies of the associ-20
ation (k1) and dissociation (k−1) steps, as well as other phenomena, the falloff expres-sions have to be modified. This can be done by including a broadening factor F to theLindemann-Hinshelwood expression (Troe, 1979):
k =kok∞
ko + k∞F = ko
1
1 + kok∞
F = k∞
kok∞
1 + kok∞
F
2298

ACPD6, 2281–2702, 2006
Evaluated kinetic andphotochemical data
for atmosphericchemistry
R. Atkinson et al.
Title Page
Abstract Introduction
Conclusions References
Tables Figures
J I
J I
Back Close
Full Screen / Esc
Printer-friendly Version
Interactive Discussion
EGU
The broadening factor F depends on the ratio k0/k∞, which is proportional to [M], andcan be used as a measure of “reduced pressure”. The first factors on the right-handside represent the Lindemann-Hinshelwood expression and the additional broadeningfactor F , at not too high temperatures, is approximately given by (Troe, 1979):
log F ∼=log Fc
1 + [log(k0/k∞)/N]25
where log=log10 and N=[0.75−1.27 log Fc]. In this way the three quantities k0, k∞, andFc characterise the falloff curve for the present application.
The given approximate expression for the broadening factor F was obtained fromstatistical unimolecular rate theory in its simplest form (Troe, 1979). More rigorousrepresentations require detailed information on the potential energy surfaces and on10
the collisional energy transfer step of the reaction. If this information is not available,one may assume typical behaviour and rely on the theoretical analysis given by Cobosand Troe (2003). For T=200–300 K and the collider M=N2 (with a collision efficiencyβc≈0.3), this treatment predicts Fc≈0.49, 0.44, 0.39, and 0.35, if the reactants A and Bin total have r=3, 4, 5, or 6 rotational degrees of freedom, respectively (e.g. for the re-15
action HO+NO2, one would have r=5 and hence Fc≈0.39). It is also predicted that Fc,for the present applications, should be nearly temperature independent. Finally, morerigorous expressions for the broadening factors F are given in Cobos and Troe (2003)which, in general do not differ from the above formula by more than about 10 percent.Since the special properties of each reaction system may lead to some deviations from20
the given values of Fc, these should only be used for a first orientation. Larger devia-tions of experimentally fitted Fc-values from the given “standard values”, however, maybe an indication for inadequate falloff extrapolations to k0 and k∞. In this case, theapparent values for Fc, k0, and k∞ obtained by fitting still can provide a satisfactoryrepresentation of the considered experimental data, in spite of the fact that inadequate25
values of k0 and k∞ are obtained by extrapolation.If a given falloff curve is fitted in different ways, changes in Fc require changes in
the limiting k0 and k∞ values. For the purpose of this evaluation, this is irrelevant if2299

ACPD6, 2281–2702, 2006
Evaluated kinetic andphotochemical data
for atmosphericchemistry
R. Atkinson et al.
Title Page
Abstract Introduction
Conclusions References
Tables Figures
J I
J I
Back Close
Full Screen / Esc
Printer-friendly Version
Interactive Discussion
EGU
the preferred k0 and k∞ are used consistently together with the preferred Fc values.If the selected Fc value is too large, the values of k0 and k∞ obtained by fitting thefalloff expression to the experimental data are underestimated. If Fc is too small, k0and k∞ are overestimated. However uncertainties in Fc influence the fitted k0 and k∞in different ways. A simpler policy of fitting falloff was chosen by the NASA/JPL panel5
(Sander et al., 2003) in putting F=0.6 and N=1. This generally leads to different valuesof the fitted k0 and k∞ and their temperature dependencies than derived here, althoughexperimental data over the range of atmospheric interest can generally be reproducedequally well. However the derived k0 and k∞ may differ from the true limiting ratecoefficients and thus should be interpreted by theory only with caution.10
In the present evaluation, we generally follow the experimentally fitted values for Fc,k0, and k∞, provided Fc does not differ too much from the values given above. If largedeviations are encountered, the experimental data are re-evaluated using the givenFc-values given above.
Besides the energy-transfer mechanism, i.e. Reactions (1), (-1), and (2), a second15
mechanism appears to be relevant for some reactions considered here. This is theradical-complex (or chaperon) mechanism
A + M→ AM (3)
AM→ A + M (-3)
B + AM→ AB + M (4)20
which, in the low pressure range, leads to
k0 = (k3/k−3)k4[M].
For some tri- and tetra-atomic adducts AB, this value of k0 may exceed that from theenergy-transfer mechanism and show stronger temperature dependencies. This mech-anism may also influence high pressure experiments when k0 from the radical-complex25
mechanism exceeds k∞ from the energy-transfer mechanism (Oum et al., 2003). In2300

ACPD6, 2281–2702, 2006
Evaluated kinetic andphotochemical data
for atmosphericchemistry
R. Atkinson et al.
Title Page
Abstract Introduction
Conclusions References
Tables Figures
J I
J I
Back Close
Full Screen / Esc
Printer-friendly Version
Interactive Discussion
EGU
this case falloff over wide pressure ranges cannot be represented by contributions fromthe energy-transfer mechanism alone, in particular when measurements at pressuresabove about 10 bar are taken into consideration.
The dependence of k0 and k∞ on the temperature T is represented in the formk∝T−n except for cases with an established energy barrier in the potential. We have5
used this form of temperature dependence because it usually gives a better fit to thedata over a wider range of temperature than does the Arrhenius expression. It shouldbe emphasised that the chosen form of the temperature dependence is often onlyadequate over limited temperature ranges such as 200–300 K. Obviously, the relevantvalues of n are different for k0 and k∞. In this evaluation, values of k0 are given for10
selected examples of third bodies M, and if possible for M=N2, O2 or air.
4.4 Treatment of complex-forming bimolecular reactions
Bimolecular reactions may follow the “direct” pathway
A + B→ C + D
and/or involve complex formation,15
A + B⇔ AB∗ → C + D↓ MAB
We designate the rate coefficients of the individual steps as in Sect. 1.3, above:
A + B→ AB∗ (1)
AB∗ → A + B (-1)
AB∗ + M→ AB + M (2)20
AB∗ → C + D (3)
2301

ACPD6, 2281–2702, 2006
Evaluated kinetic andphotochemical data
for atmosphericchemistry
R. Atkinson et al.
Title Page
Abstract Introduction
Conclusions References
Tables Figures
J I
J I
Back Close
Full Screen / Esc
Printer-friendly Version
Interactive Discussion
EGU
Assuming quasi-stationary concentrations of AB∗ (i.e. d[AB∗]/dt∼0), a Lindemann-Hinshelwood type of analysis leads to,
d[AB]
dt= kS [A][B]
d[C]
dt= kD[A][B]
d[A]
dt= (kS + kD)[A][B]5
where
kS = k1
(k2
k−1 + k2 + k3
)
kD = k1
(k3
k−1 + k2 + k3
)Note that since k2 is proportional to [M], kS and kD are dependent on the nature andconcentration of the third body M, in addition to their temperature dependence. In10
reality, as for the combination and dissociation reactions, the given expressions for kSand kD have to be extended by suitable broadening factors F in order to account forthe multistep character of process (2) and the energy dependencies of processes (1),(-1) and (3). These broadening factors, however, differ from those for combination anddissociation reactions. For simplicity, they are ignored in this evaluation such that kD at15
high pressure approaches
kD → k1k3/k2
which is inversely proportional to [M]. kD may also be expressed by
kD ≈ kD0kS/kS0
2302
ACPD6, 2281–2702, 2006
Evaluated kinetic andphotochemical data
for atmosphericchemistry
R. Atkinson et al.
Title Page
Abstract Introduction
Conclusions References
Tables Figures
J I
J I
Back Close
Full Screen / Esc
Printer-friendly Version
Interactive Discussion
EGU
where kD0 and kS0 are the respective limiting low-pressure rate coefficients for theformation of C+D or A+B at the considered [M]. When it is established that complex-formation is involved, this equation is used to characterize the increasing suppressionof C+D formation with increasing [M].
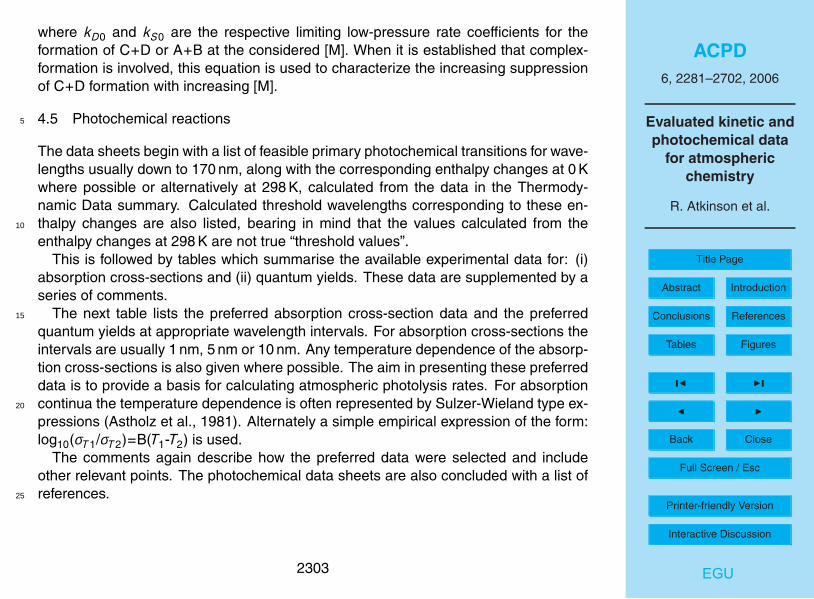
4.5 Photochemical reactions5
The data sheets begin with a list of feasible primary photochemical transitions for wave-lengths usually down to 170 nm, along with the corresponding enthalpy changes at 0 Kwhere possible or alternatively at 298 K, calculated from the data in the Thermody-namic Data summary. Calculated threshold wavelengths corresponding to these en-thalpy changes are also listed, bearing in mind that the values calculated from the10
enthalpy changes at 298 K are not true “threshold values”.This is followed by tables which summarise the available experimental data for: (i)
absorption cross-sections and (ii) quantum yields. These data are supplemented by aseries of comments.
The next table lists the preferred absorption cross-section data and the preferred15
quantum yields at appropriate wavelength intervals. For absorption cross-sections theintervals are usually 1 nm, 5 nm or 10 nm. Any temperature dependence of the absorp-tion cross-sections is also given where possible. The aim in presenting these preferreddata is to provide a basis for calculating atmospheric photolysis rates. For absorptioncontinua the temperature dependence is often represented by Sulzer-Wieland type ex-20
pressions (Astholz et al., 1981). Alternately a simple empirical expression of the form:log10(σT1/σT2)=B(T1-T2) is used.
The comments again describe how the preferred data were selected and includeother relevant points. The photochemical data sheets are also concluded with a list ofreferences.25
2303

ACPD6, 2281–2702, 2006
Evaluated kinetic andphotochemical data
for atmosphericchemistry
R. Atkinson et al.
Title Page
Abstract Introduction
Conclusions References
Tables Figures
J I
J I
Back Close
Full Screen / Esc
Printer-friendly Version
Interactive Discussion
EGU
4.6 Conventions concerning absorption cross-sections
These are presented in the data sheets as “absorption cross-sections per molecule,base e.” They are defined according to the equations:
I/I0=exp(−σ[N]l ),
σ = {1/([N]l )} ln(I0/I),5
where I0 and I are the incident and transmitted light intensities, σ is the absorptioncross-section per molecule (expressed in this paper in units of cm2), [N] is the num-ber concentration of absorber (expressed in molecule cm−3), and l is the path length(expressed in cm). Other definitions and units are frequently quoted. The closely re-lated quantities “absorption coefficient” and “extinction coefficient” are often used, but10
care must be taken to avoid confusion in their definition. It is always necessary toknow the units of concentration and of path length and the type of logarithm (base e orbase 10) corresponding to the definition. To convert an absorption cross-section to theequivalent Naperian (base e) absorption coefficient (expressed in cm−1) of a gas at apressure of one standard atmosphere and temperature of 273 K, multiply the value of15
σ in cm2 by 2.69×1019.
4.7 Assignment of uncertainties
Under the heading “reliability,” estimates have been made of the absolute accuracies ofthe preferred values of k at 298 K and of the preferred values of E/R over the quotedtemperature range. The accuracy of the preferred rate coefficient at 298 K is quoted as20
the term ∆log k, where ∆log k=D and D is defined by the equation, log10k=C±D. Thisis equivalent to the statement that k is uncertain to a factor of F , where D=log10F . Theaccuracy of the preferred value of E/R is quoted as the term ∆(E/R), where ∆(E/R)=Gand G is defined by the equation E/R=H±G. D and G are expanded uncertaintiescorresponding approximately to a 95% confidence limit.25
2304

ACPD6, 2281–2702, 2006
Evaluated kinetic andphotochemical data
for atmosphericchemistry
R. Atkinson et al.
Title Page
Abstract Introduction
Conclusions References
Tables Figures
J I
J I
Back Close
Full Screen / Esc
Printer-friendly Version
Interactive Discussion
EGU
For second-order rate coefficients listed in this evaluation, an estimate of the uncer-tainty at any given temperature within the recommended temperature range may beobtained from the equation:
∆ logk(T ) = ∆ logk(298 K) + 0.4343{∆E/R(1/T − 1/298)}
The assignment of these absolute uncertainties in k and E/R is a subjective assess-5
ment of the evaluators. They are not determined by a rigorous, statistical analysis ofthe database, which is generally too limited to permit such an analysis. Rather, theuncertainties are based on a knowledge of the techniques, the difficulties of the exper-imental measurements, the potential for systematic errors, and the number of studiesconducted and their agreement or lack thereof. Experience shows that for rate mea-10
surements of atomic and free radical reactions in the gas phase, the precision of themeasurement, i.e. the reproducibility, is usually good. Thus, for single studies of aparticular reaction involving one technique, standard deviations, or even 90% confi-dence limits, of ±10% or less are frequently reported in the literature. Unfortunately,when evaluators come to compare data for the same reaction studied by more than15
one group of investigators and involving different techniques, the rate coefficients oftendiffer by a factor of 2 or even more. This can only mean that one or more of the studieshas involved large systematic uncertainty which is difficult to detect. This is hardly sur-prising since, unlike molecular reactions, it is not always possible to study atomic andfree radical reactions in isolation, and consequently mechanistic and other difficulties20
frequently arise.The arbitrary assignment of uncertainties made here is based mainly on our state of
knowledge of a particular reaction which is dependent upon factors such as the numberof independent investigations carried out and the number of different techniques used.On the whole, our assessment of uncertainty limits tends towards the cautious side.25
Thus, in the case where a rate coefficient has been measured by a single investigationusing one particular technique and is unconfirmed by independent work, we suggestthat minimum uncertainty limits of a factor of 2 are appropriate.
2305

ACPD6, 2281–2702, 2006
Evaluated kinetic andphotochemical data
for atmosphericchemistry
R. Atkinson et al.
Title Page
Abstract Introduction
Conclusions References
Tables Figures
J I
J I
Back Close
Full Screen / Esc
Printer-friendly Version
Interactive Discussion
EGU
In contrast to the usual situation for the rate coefficients of thermal reactions, whereintercomparison of results of a number of independent studies permits a realistic as-sessment of reliability, for many photochemical processes there is a scarcity of appar-ently reliable data. Thus, we do not feel justified at present in assigning uncertaintylimits to the parameters reported for the photochemical reactions.5
Acknowledgements. The Chairman and members of the Committee wish to express their ap-preciation to I.U.P.A.C. for the financial help which facilitated the preparation of this evaluation.We also acknowledge financial support from the following organisations: EU Framework Pro-gram 6, ACCENT network of excellence; University of California Agricultural Experiment Sta-tion; the UK Natural Environmental Research Council; the Standard Reference Data Program10
(N.I.S.T); the Fonds National Suisse de la Recherche Scientifique (F.N.S.R.S.) and the OfficeFederal de l’Education et de la Science, and the Deutsche Forschungsgemeinschaft (SFB 357).
References
Astholz, D. C., Brouwer, L., and Troe, J.: High-Temperature Ultraviolet-Absorption Spectra ofPolyatomic Molecules in Shock Waves, Ber. Bunsenges. Phys. Chem., 85, 559–564, 1981.15
Atkinson, R., Baulch, D. L., Cox, R. A., Hampson Jr., R. F., Kerr, J. A., and Troe, J.: EvaluatedKinetic and Photochemical Data for Atmospheric Chemistry: Supplement III, IUPAC Sub-committee on Gas Kinetic Data Evaluation for Atmospheric Chemistry, J. Phys. Chem. Ref.Data, 18, 881–1097, 1989.
Atkinson, R., Baulch, D. L., Cox, R. A., Hampson Jr., R. F., Kerr, J. A., and Troe, J.: Evaluated20
Kinetic and Photochemical Data for Atmospheric Chemistry: Supplement IV, IUPAC Sub-committee on Gas Kinetic Data Evaluation for Atmospheric Chemistry, J. Phys. Chem. Ref.Data, 21, 1125–1568, 1992.
Atkinson, R., Baulch, D. L., Cox, R. A., Hampson Jr., R. F., Kerr, J. A., Rossi, M., and Troe,J.: Evaluated Kinetic, Photochemical, and Heterogeneous Data for Atmospheric Chemistry:25
Supplement V, IUPAC Subcommittee on Gas Kinetic Data Evaluation for Atmospheric Chem-istry, J. Phys. Chem. Ref. Data, 26, 521–1011, 1997a.
Atkinson, R., Baulch, D. L., Cox, R. A., Hampson Jr., R. F., Kerr, J. A., Rossi, M. J., and Troe,J.: Evaluated Kinetic and Photochemical Data for Atmospheric Chemistry: Supplement VI,
2306
ACPD6, 2281–2702, 2006
Evaluated kinetic andphotochemical data
for atmosphericchemistry
R. Atkinson et al.
Title Page
Abstract Introduction
Conclusions References
Tables Figures
J I
J I
Back Close
Full Screen / Esc
Printer-friendly Version
Interactive Discussion
EGU
IUPAC Subcommittee on Gas Kinetic Data Evaluation for Atmospheric Chemistry, J. Phys.Chem. Ref. Data, 26, 1329–1499, 1997b.
Atkinson, R., Baulch, D. L., Cox, R. A., Hampson Jr., R. F., Kerr, J. A., Rossi, M. J., and Troe,J.: Evaluated Kinetic and Photochemical Data for Atmospheric Chemistry: Supplement VII,IUPAC Subcommittee on Gas Kinetic Data Evaluation for Atmospheric Chemistry, J. Phys.5
Chem. Ref. Data, 28, 191–393, 1999.Atkinson, R., Baulch, D. L., Cox, R. A., Hampson Jr., R. F., Kerr, J. A., Rossi, M. J., and Troe,
J.: Evaluated Kinetic and Photochemical Data for Atmospheric Chemistry, Supplement VIII,IUPAC Subcommittee on Gas Kinetic Data Evaluation for Atmospheric Chemistry, J. Phys.Chem. Ref. Data, J. Phys. Chem. Ref. Data, 29, 167–266, 2000.10
Baulch, D. L., Cox, R. A., Hampson Jr., R. F., Kerr, J. A., Troe, J., and Watson, R. T.: Evalu-ated Kinetic and Photochemical Data for Atmospheric Chemistry, CODATA Task Group onChemical Kinetics, J. Phys. Chem. Ref. Data, 9, 295–471, 1980.
Baulch, D. L., Cox, R. A., Crutzen, P. J., Hampson Jr., R. F., Kerr, J. A., Troe, J., and Watson,R. T.: Evaluated Kinetic and Photochemical Data for Atmospheric Chemistry: Supplement I,15
CODATA Task Group on Chemical Kinetics, J. Phys. Chem. Ref. Data, 11, 327–496, 1982.Baulch, D. L., Cox, R. A., Hampson Jr., R. F., Kerr, J. A., Troe, J., and Watson, R. T.: Evaluated
Kinetic and Photochemical Data for Atmospheric Chemistry: Supplement II, CODATA TaskGroup on Gas Phase Chemical Kinetics, J. Phys. Chem. Ref. Data, 13, 1259–1380, 1984.
Cobos, C. J. and Troe, J.: Prediction of Reduced Falloff Curves for Recombination, Reactions20
at Low Temperatures, Z. Phys. Chem., 217, 1–14, 2003.Sander, S. P., Friedl, R. R., Golden, D. M., Kurylo, M. J., Huie, R. E., Orkin, V. L., Moortgat,
G. K., Ravishankara, A. R., Kolb, C. E., Molina, M. J., and Finlayson-Pitts, B. J.: ChemicalKinetics and Photochemical Data for Use in Atmospheric Studies. NASA Panel for DataEvaluation, Evaluation Number 14., JPL Publication 02-25, 2003.25
Oum, K., Sekiguchi, K., Luther, K., and Troe, J.: Observation of Unique Pressure Effects inthe Combination Reaction of Benzyl Radicals in the Gas to Liquid Transition Region, Phys.Chem. Chem. Phys., 5, 2931–2933, 2003.
Troe, J.: Predictive Possibilities of Unimolecular Rate Theory, J. Phys. Chem., 83, 114–126,1979.30
2307
ACPD6, 2281–2702, 2006
Evaluated kinetic andphotochemical data
for atmosphericchemistry
R. Atkinson et al.
Title Page
Abstract Introduction
Conclusions References
Tables Figures
J I
J I
Back Close
Full Screen / Esc
Printer-friendly Version
Interactive Discussion
EGU
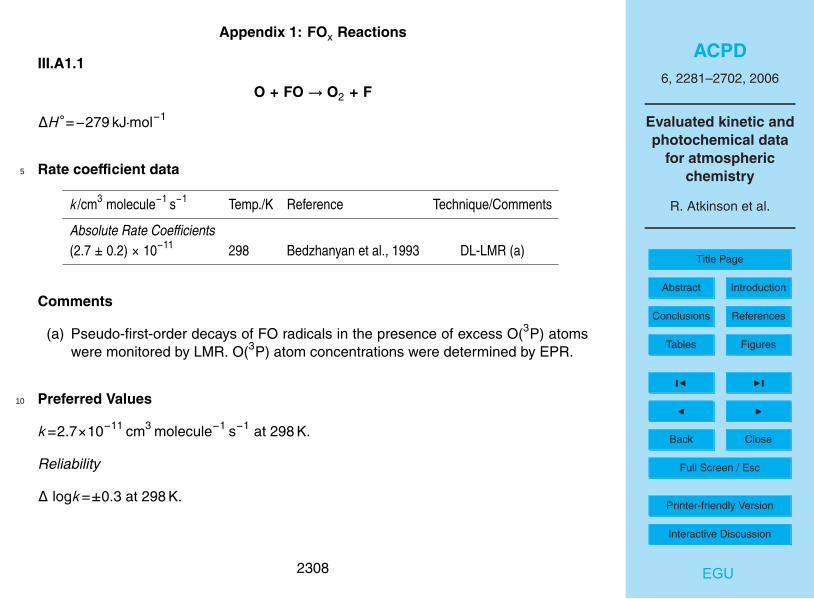
Appendix 1: FOx Reactions
III.A1.1
O + FO→ O2 + F
∆H◦=−279 kJ·mol−1
Rate coefficient data5
k/cm3 molecule−1 s−1 Temp./K Reference Technique/Comments
Absolute Rate Coefficients(2.7 ± 0.2) × 10−11 298 Bedzhanyan et al., 1993 DL-LMR (a)
Comments
(a) Pseudo-first-order decays of FO radicals in the presence of excess O(3P) atomswere monitored by LMR. O(3P) atom concentrations were determined by EPR.
Preferred Values10
k=2.7×10⁻¹¹ cm3 molecule−1 s−1 at 298 K.
Reliability
∆ logk=±0.3 at 298 K.
2308

ACPD6, 2281–2702, 2006
Evaluated kinetic andphotochemical data
for atmosphericchemistry
R. Atkinson et al.
Title Page
Abstract Introduction
Conclusions References
Tables Figures
J I
J I
Back Close
Full Screen / Esc
Printer-friendly Version
Interactive Discussion
EGU
Comments on Preferred Values
The preferred value is based on the results of the study of Bedzhanyan et al. (1993),the sole study of this reaction. The temperature dependence of the rate constant isexpected to be small for such an atom-radical process, as for the analogous ClO radicalreaction.5
References
Bedzhanyan, Y. R., Markin, E. M., Politenkova, G. G., and Gershenzon, Y. M.: Kinet.Catal., 33, 797, 1993; original pages 998–1003, 1992.
2309

ACPD6, 2281–2702, 2006
Evaluated kinetic andphotochemical data
for atmosphericchemistry
R. Atkinson et al.
Title Page
Abstract Introduction
Conclusions References
Tables Figures
J I
J I
Back Close
Full Screen / Esc
Printer-friendly Version
Interactive Discussion
EGU
III.A1.2
O+FO2→ O2+FO
∆H◦=−166 kJ·mol−1
Rate coefficient data: no available experimental data.5
Preferred Values
k=5×10⁻¹¹ cm3 molecule−1 s−1 at 298 K.
Reliability
∆ log k = ± 0.7 at 298 K.
Comments on Preferred Values10
There are no experimental data for this reaction. The rate constant for such aradical-atom process is expected to approach the gas collision frequency and is notexpected to exhibit a strong temperature dependence.
2310

ACPD6, 2281–2702, 2006
Evaluated kinetic andphotochemical data
for atmosphericchemistry
R. Atkinson et al.
Title Page
Abstract Introduction
Conclusions References
Tables Figures
J I
J I
Back Close
Full Screen / Esc
Printer-friendly Version
Interactive Discussion
EGU
III.A1.3
O(1D) + HF → HO + F (1)→ O(3P) + HF (2)
∆H◦(1) = −49 kJ·mol−1
∆H◦(2) = −189.7 kJ·mol−1
Rate coefficient data (k=k1+k2)5
k/cm3 molecule−1 s−1 Temp./K Reference Technique/Comments
Relative Rate Coefficients(5.1 ± 1.0) × 10−11 298 Sorokin et al., 1998, 1999 PLP-LMR (a)
Branching Ratiosk1/k = 0.30 ± 0.02 298 Sorokin et al., 1998, 1999 PLP-LMR (a)k2/k = 0.70 ± 0.02 298
Comments
(a) Measured rate coefficient ratio of k(O(1D)+HF)/k(O(1D)+NF3) was placed onan absolute basis by use of the rate coefficient for the reference reactionk(O(1D)+NF3)=1.15 × 10⁻¹¹ cm3 molecule−1 s−1 at 298 K (Sorokin et al., 1998,10
1999). Pressure in the reactor was ∼13 mbar.
2311

ACPD6, 2281–2702, 2006
Evaluated kinetic andphotochemical data
for atmosphericchemistry
R. Atkinson et al.
Title Page
Abstract Introduction
Conclusions References
Tables Figures
J I
J I
Back Close
Full Screen / Esc
Printer-friendly Version
Interactive Discussion
EGU
Preferred Values
k = 5.1 × 10⁻¹¹ cm3 molecule−1 s−1 at 298 K.k1/k = 0.30 at 298 K.k2/k = 0.70 at 298 K.
Reliability5
∆ log k = ± 0.2 at 298 K.∆ (k1/k) = ∆ (k2/k) = ± 0.1
Comments on Preferred Values
The preferred values of k, k1/k and k2/k are based on the results reported bySorokin et al. (1998, 1999). These results are given in the only published journal10
articles presenting a systematic study of this system. In a published paper on the reac-tions of O(1D) with HCl and HBr, Wine et al. (1986), because of uncertainties in the HFconcentration, report for the reaction O(1D)+HF only a highly uncertain rate constantin the range (6–24)×10−11 cm3 molecule−1 s−1 at room temperature.
References15
Sorokin, V. I., Gritsan, N. P., and Chichinin, A. I.: J. Chem. Phys., 108, 8995, 1998.Sorokin, V. I., Gritsan, N. P., and Chichinin, A. I.: Chem. Phys. Reports 17, 2217,1999.Wine, P. H., Wells, J. R., and Ravishankara, A. R.: J. Chem. Phys., 84, 1349, 1986.
20
2312

ACPD6, 2281–2702, 2006
Evaluated kinetic andphotochemical data
for atmosphericchemistry
R. Atkinson et al.
Title Page
Abstract Introduction
Conclusions References
Tables Figures
J I
J I
Back Close
Full Screen / Esc
Printer-friendly Version
Interactive Discussion
EGU
III.A1.4
F+H2 → HF+H
∆H◦ = −134.7 kJ·mol−1
Rate coefficient data
k/cm3 molecule−1 s−1 Temp./K Reference Technique/Comments
Absolute Rate Coefficients1.0 × 10−10exp[-(433 ± 51)/T ] 190–359 Wurzberg and Houston, 1980 PLP-CL(2.27 ± 0.18) × 10−11 297(2.55 ± 0.11) × 10−11 298 Clyne and Hodgson, 1985 DF-LIF (a)1.2 × 10⁻¹⁰ exp[-(470 ± 30)/T ] 221–376 Stevens et al., 1989 DF-RF (b)(2.48 ± 0.09) × 10−11 2985
Comments
(a) F atoms were reacted with Br2 to form BrF which was detected by LIF.
(b) Discharge flow system. F atoms were converted to D atoms by reaction withD2 downstream of the reaction zone, and the D atoms monitored by resonancefluorescence.10
Preferred Values
k = 2.4 × 10⁻¹¹ cm3 molecule−1 s−1 at 298 K.k = 1.1 × 10⁻¹⁰ exp(−450/T ) cm3 molecule−1 s−1 over the temperature range 190–380 K.
2313

ACPD6, 2281–2702, 2006
Evaluated kinetic andphotochemical data
for atmosphericchemistry
R. Atkinson et al.
Title Page
Abstract Introduction
Conclusions References
Tables Figures
J I
J I
Back Close
Full Screen / Esc
Printer-friendly Version
Interactive Discussion
EGU
Reliability
∆ logk = ± 0.1 at 298 K.∆ (E/R) = ± 100 K.
Comments on Preferred Values
This evaluation accepts the recommended values given in the critical review of Per-5
sky and Kornweitz (1997) of the literature data for this reaction. The preferred valuesare based on the results of Wurzberg and Houston (1980), Clyne and Hodgson (1985)and Stevens et al. (1989).
References
Clyne, M. A. A. and Hodgson, A.: J. Chem. Soc. Faraday Trans., 2, 81, 443, 1985.10
Persky, A. and Kornweitz, H.: Int. J. Chem. Kinet., 29, 67, 1997.Stevens, P. S., Brune, W. H., and Anderson, J. G.: J. Phys. Chem., 93, 4068, 1989.Wurzberg, E. and Houston, P. L.: J. Chem. Phys., 72, 4811, 1980.
2314
ACPD6, 2281–2702, 2006
Evaluated kinetic andphotochemical data
for atmosphericchemistry
R. Atkinson et al.
Title Page
Abstract Introduction
Conclusions References
Tables Figures
J I
J I
Back Close
Full Screen / Esc
Printer-friendly Version
Interactive Discussion
EGU
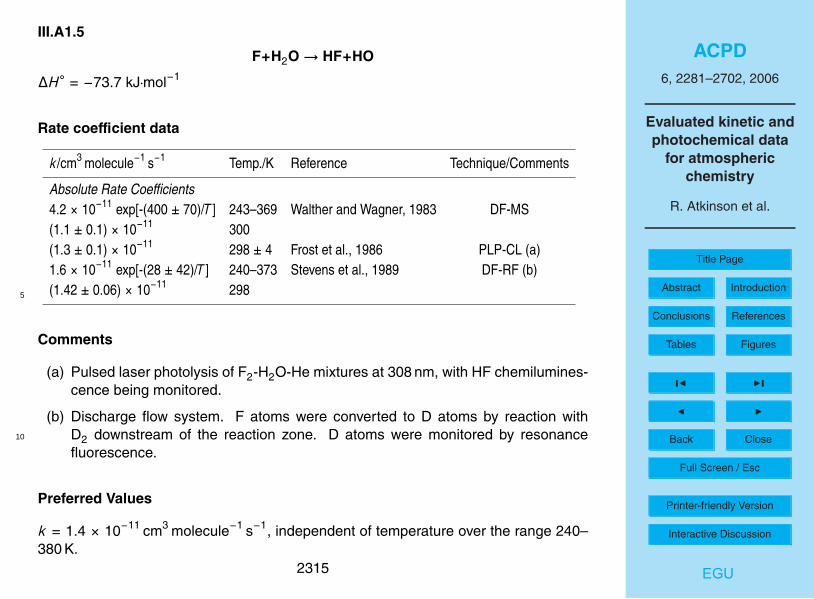
III.A1.5
F+H2O→ HF+HO
∆H◦ = −73.7 kJ·mol−1
Rate coefficient data
k/cm3 molecule−1 s−1 Temp./K Reference Technique/Comments
Absolute Rate Coefficients4.2 × 10−11 exp[-(400 ± 70)/T ] 243–369 Walther and Wagner, 1983 DF-MS(1.1 ± 0.1) × 10−11 300(1.3 ± 0.1) × 10−11 298 ± 4 Frost et al., 1986 PLP-CL (a)1.6 × 10⁻¹¹ exp[-(28 ± 42)/T ] 240–373 Stevens et al., 1989 DF-RF (b)(1.42 ± 0.06) × 10−11 2985
Comments
(a) Pulsed laser photolysis of F2-H2O-He mixtures at 308 nm, with HF chemilumines-cence being monitored.
(b) Discharge flow system. F atoms were converted to D atoms by reaction withD2 downstream of the reaction zone. D atoms were monitored by resonance10
fluorescence.
Preferred Values
k = 1.4 × 10⁻¹¹ cm3 molecule−1 s−1, independent of temperature over the range 240–380 K.
2315
ACPD6, 2281–2702, 2006
Evaluated kinetic andphotochemical data
for atmosphericchemistry
R. Atkinson et al.
Title Page
Abstract Introduction
Conclusions References
Tables Figures
J I
J I
Back Close
Full Screen / Esc
Printer-friendly Version
Interactive Discussion
EGU
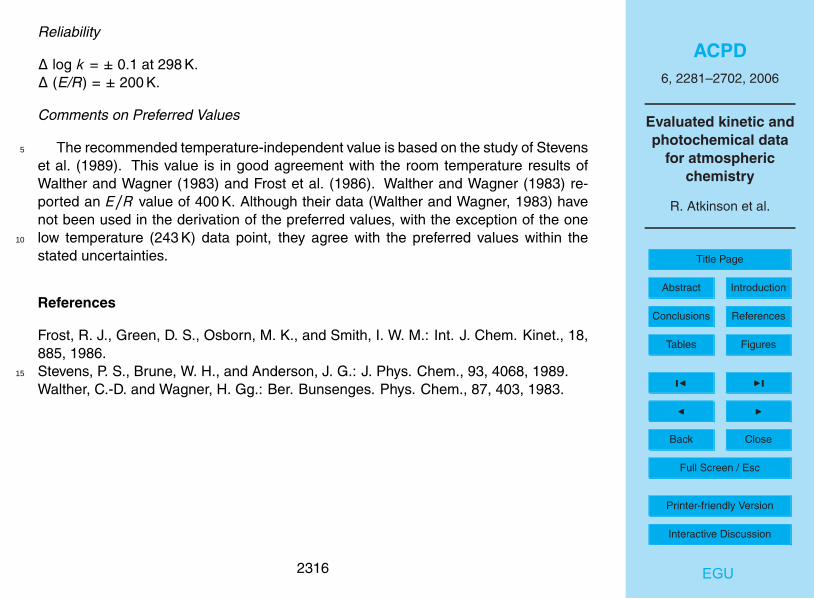
Reliability
∆ log k = ± 0.1 at 298 K.∆ (E/R) = ± 200 K.
Comments on Preferred Values
The recommended temperature-independent value is based on the study of Stevens5
et al. (1989). This value is in good agreement with the room temperature results ofWalther and Wagner (1983) and Frost et al. (1986). Walther and Wagner (1983) re-ported an E/R value of 400 K. Although their data (Walther and Wagner, 1983) havenot been used in the derivation of the preferred values, with the exception of the onelow temperature (243 K) data point, they agree with the preferred values within the10
stated uncertainties.
References
Frost, R. J., Green, D. S., Osborn, M. K., and Smith, I. W. M.: Int. J. Chem. Kinet., 18,885, 1986.Stevens, P. S., Brune, W. H., and Anderson, J. G.: J. Phys. Chem., 93, 4068, 1989.15
Walther, C.-D. and Wagner, H. Gg.: Ber. Bunsenges. Phys. Chem., 87, 403, 1983.
2316

ACPD6, 2281–2702, 2006
Evaluated kinetic andphotochemical data
for atmosphericchemistry
R. Atkinson et al.
Title Page
Abstract Introduction
Conclusions References
Tables Figures
J I
J I
Back Close
Full Screen / Esc
Printer-friendly Version
Interactive Discussion
EGU
III.A1.6
F + O2 + M→ FO2 + M
∆H◦ = −54.0 kJ·mol−1
2317

ACPD6, 2281–2702, 2006
Evaluated kinetic andphotochemical data
for atmosphericchemistry
R. Atkinson et al.
Title Page
Abstract Introduction
Conclusions References
Tables Figures
J I
J I
Back Close
Full Screen / Esc
Printer-friendly Version
Interactive Discussion
EGU
Low-pressure rate coefficients
Rate coefficient data
k0/cm3 molecule−1 s−1 Temp./K Reference Technique/Comments
Absolute Rate Coefficients5.2 × 10−34 exp(656/T )[He] 272–362 Zetzsch, 1973 DF-MS (a)4.7 × 10⁻³³ [He] 298(7 ± 2) × 10−33 [He] 293 Arutyunov et al., 1976 DF-EPR(1.4 ± 0.4) × 10−32 [N2] 293 (b)(6 ± 2) × 10−33 [Ar] 293(5.4 ± 0.6) × 10−33 [He] 298 Chen et al., 1977 FP (c)(1.5 ± 0.3) × 10−32 [O2] 298(5.0 ± 0.6) × 10−33 [F2] 298(8.4 ± 0.9) × 10−33 [Ar] 2982.8 × 10−34 exp(906/T )[Ar] 223–293 Shamonima and Kotov, 1979 DF-EPR(6.1 ± 1.8) × 10−33 [Ar] 293 (d)(1.0 ± 0.3) × 10−32 [O2] 298 Chebotarev, 1979 PLP (e)(3.2 ± 2.1) × 10−33 [Ar] 298 Smith and Wrigley, 1980 (f)(3.7 ± 2.4) × 10−33 [Ar] 298 Smith and Wrigley, 1981 (f)(4.3 ± 0.4) × 10−33 (T /300)−1.6 [Ar] 295–359 Pagsberg et al., 1987 PR (g)(2.8 ± 0.2) × 10−33 [He] 298 Lyman and Holland, 1988 PLP(h)(3.1 ± 0.2) × 10−33 [Ar] 2981.4 × 10−32 [SF6] 295 Ellermann et al., 1994 PR (i)5.8 × 10⁻³³ (T /300)−1.7 [N2] 100–373 Campuzano-Jost et al., 1995 PLP (j)
2318
ACPD6, 2281–2702, 2006
Evaluated kinetic andphotochemical data
for atmosphericchemistry
R. Atkinson et al.
Title Page
Abstract Introduction
Conclusions References
Tables Figures
J I
J I
Back Close
Full Screen / Esc
Printer-friendly Version
Interactive Discussion
EGU
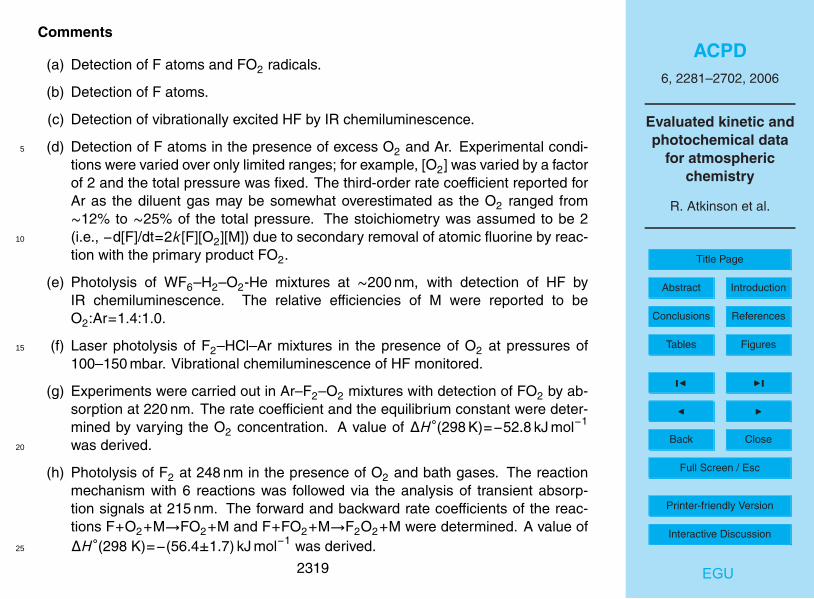
Comments
(a) Detection of F atoms and FO2 radicals.
(b) Detection of F atoms.
(c) Detection of vibrationally excited HF by IR chemiluminescence.
(d) Detection of F atoms in the presence of excess O2 and Ar. Experimental condi-5
tions were varied over only limited ranges; for example, [O2] was varied by a factorof 2 and the total pressure was fixed. The third-order rate coefficient reported forAr as the diluent gas may be somewhat overestimated as the O2 ranged from∼12% to ∼25% of the total pressure. The stoichiometry was assumed to be 2(i.e., −d[F]/dt=2k[F][O2][M]) due to secondary removal of atomic fluorine by reac-10
tion with the primary product FO2.
(e) Photolysis of WF6–H2–O2-He mixtures at ∼200 nm, with detection of HF byIR chemiluminescence. The relative efficiencies of M were reported to beO2:Ar=1.4:1.0.
(f) Laser photolysis of F2–HCl–Ar mixtures in the presence of O2 at pressures of15
100–150 mbar. Vibrational chemiluminescence of HF monitored.
(g) Experiments were carried out in Ar–F2–O2 mixtures with detection of FO2 by ab-sorption at 220 nm. The rate coefficient and the equilibrium constant were deter-mined by varying the O2 concentration. A value of ∆H◦(298 K)=−52.8 kJ mol−1
was derived.20
(h) Photolysis of F2 at 248 nm in the presence of O2 and bath gases. The reactionmechanism with 6 reactions was followed via the analysis of transient absorp-tion signals at 215 nm. The forward and backward rate coefficients of the reac-tions F+O2+M→FO2+M and F+FO2+M→F2O2+M were determined. A value of∆H◦(298 K)=−(56.4±1.7) kJ mol−1 was derived.25
2319

ACPD6, 2281–2702, 2006
Evaluated kinetic andphotochemical data
for atmosphericchemistry
R. Atkinson et al.
Title Page
Abstract Introduction
Conclusions References
Tables Figures
J I
J I
Back Close
Full Screen / Esc
Printer-friendly Version
Interactive Discussion
EGU
(i) Experiments with SF6-O2 mixtures at 0.20–1.0 bar total pressure with kinetic UVspectroscopic detection of FO2 radicals between 215 and 254 nm. Falloff extrap-olations were made with Fc=0.6.
(j) FO2 radicals were detected by UV absorption. Experiments were carried out attotal pressures up to 1000 bar of the bath gases He, Ar, and N2. Measurements of5
the equilibrium constant lead to ∆H◦(0 K)=−49.8 kJ mol−1. Falloff extrapolationswere made with Fc near 0.5.
Preferred Values
k0 = 5.8 × 10⁻³³ (T /300)−1.7 [N2] cm3 molecule−1 s−1 over the temperature range 100–380 K.10
Reliability
∆ log k0 = ± 0.3 at 298 K.∆ n = ± 0.5
Comments on Preferred Values
Because of the large data-base from the study of Campuzano-Jost et al. (1995),15
their rate coefficients values are preferred and are in reasonable agreement with earlierwork. Falloff curves were constructed with Fc near 0.5.
2320

ACPD6, 2281–2702, 2006
Evaluated kinetic andphotochemical data
for atmosphericchemistry
R. Atkinson et al.
Title Page
Abstract Introduction
Conclusions References
Tables Figures
J I
J I
Back Close
Full Screen / Esc
Printer-friendly Version
Interactive Discussion
EGU
High-pressure rate coefficients
Rate coefficient data
k∞/cm3 molecule−1 s−1 Temp./K Reference Technique/Comments
Absolute Rate Coefficients2.0 × 10−12 295 Ellermann et al., 1994 PR (a)1.2 × 10⁻¹⁰ 100–373 Campuzano-Jost et al., 1995 PLP (b)
Comments
(a) See comment (i) for k0.5
(b) See comment (j) for k0.
Preferred Values
k∞ = 1.2 × 10⁻¹⁰ cm3 molecule−1 s−1, independent of temperature over the range 100–380 K.
Reliability10
∆ log k∞ = ± 0.3 over the temperature range 100–380 K.
Comments on Preferred Values
Because of the large pressure range studied by Campuzano-Jost et al. (1995), areliable falloff extrapolation towards k∞ was possible. The data of Campuzano-Jost etal. (1995) are therefore preferred together with values of Fc near 0.5.15
2321

ACPD6, 2281–2702, 2006
Evaluated kinetic andphotochemical data
for atmosphericchemistry
R. Atkinson et al.
Title Page
Abstract Introduction
Conclusions References
Tables Figures
J I
J I
Back Close
Full Screen / Esc
Printer-friendly Version
Interactive Discussion
EGU
Intermediate Falloff Range
Rate coefficient data
k/cm3 molecule−1 s−1 P/Torr M Temp./K Reference Technique/Comments
Absolute Rate Coefficients2.4 × 10−13 600 mbar SF6 298 Wallington and Nielsen, 1991 PR (a)(2.35 ± 0.2) × 10−13 600 mbar SF6 298 Wallington et al., 1992 PR (b)
Comments
(a) Experiments were carried out in mixtures of SF6 and O2 (6.1–20 mbar). FO25
radicals were monitored by UV absorption at 220 nm.
(b) Experiments were carried out in mixtures of SF6 and O2 (2.5–15 mbar). FO2radicals were monitored by UV absorption at 220 nm. The results were analyzedtogether with those of Lyman and Holland (1988).
References10
Arutyunov, V. S., Popov, L. S., and Chaikin, A. M.: Kinet. Catal., 17, 251, 1976.Campuzano-Jost, P., Croce, A. E., Hippler, H., Siefke, M. and Troe, J.: J. Chem. Phys.,102, 5317, 1995.Chebotarev, N. F.: Kinet. Catal., 20, 1141, 1979.Chen, H.-L., Trainor, D. W., Center, R. E., and Fyfe, W. L.: J. Chem. Phys., 66, 5513,15
1977.Ellermann, T., Sehested, J., Nielsen, O. J., Pagsberg, P., and Wallington, T. J.: Chem.Phys. Lett., 218, 287, 1994.
2322
ACPD6, 2281–2702, 2006
Evaluated kinetic andphotochemical data
for atmosphericchemistry
R. Atkinson et al.
Title Page
Abstract Introduction
Conclusions References
Tables Figures
J I
J I
Back Close
Full Screen / Esc
Printer-friendly Version
Interactive Discussion
EGU
Lyman, J. L. and Holland, R.: J. Phys. Chem., 92, 7232, 1988.Pagsberg, P., Ratajczak, E., Sillesen, A., and Jodkowski, J. T.: Chem. Phys. Lett.,141, 88, 1987.Shamonima, N. F. and Kotov, A. G.: Kinet. Catal., 20, 187, 1979.Smith, I. W. M. and Wrigley, D. J.: Chem. Phys. Lett., 70, 481, 1980.5
Smith, I. W. M. and Wrigley, D. J.: Chem. Phys., 63, 321, 1981.Wallington, T. J. and Nielsen, O. J.: Int. J. Chem. Kinet., 23, 785, 1991.Wallington, T. J., Maricq, M. M., Ellermann, T., and Nielsen, O. J.: J. Phys. Chem., 96,982, 1992.Zetzsch, C.: First European Symposium on Combustion, edited by: Weinberg, F. S.,10
Academic press, London, p. 35, 1973.
2323
ACPD6, 2281–2702, 2006
Evaluated kinetic andphotochemical data
for atmosphericchemistry
R. Atkinson et al.
Title Page
Abstract Introduction
Conclusions References
Tables Figures
J I
J I
Back Close
Full Screen / Esc
Printer-friendly Version
Interactive Discussion
EGU
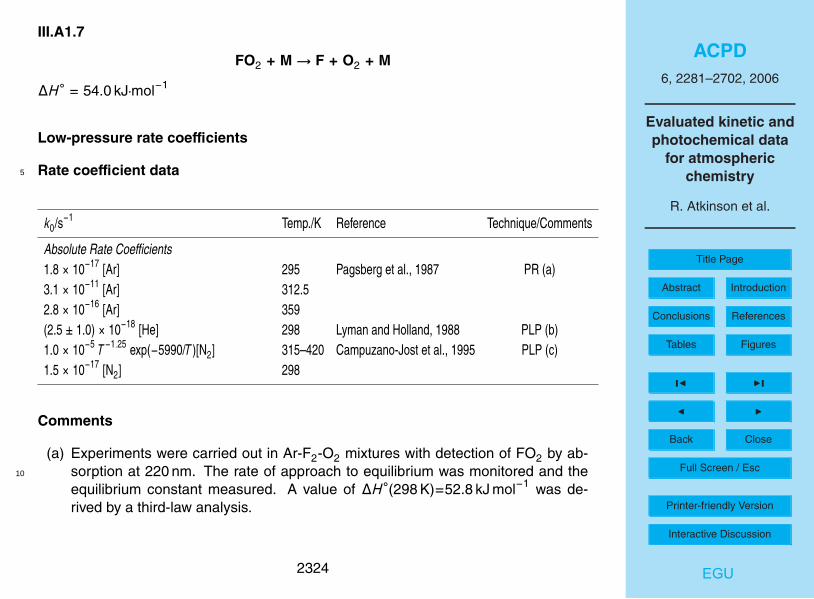
III.A1.7
FO2 + M→ F + O2 + M
∆H◦ = 54.0 kJ·mol−1
Low-pressure rate coefficients
Rate coefficient data5
k0/s−1 Temp./K Reference Technique/Comments
Absolute Rate Coefficients1.8 × 10−17 [Ar] 295 Pagsberg et al., 1987 PR (a)3.1 × 10⁻¹¹ [Ar] 312.52.8 × 10−16 [Ar] 359(2.5 ± 1.0) × 10−18 [He] 298 Lyman and Holland, 1988 PLP (b)1.0 × 10⁻⁵ T−1.25 exp(−5990/T )[N2] 315–420 Campuzano-Jost et al., 1995 PLP (c)1.5 × 10⁻¹⁷ [N2] 298
Comments
(a) Experiments were carried out in Ar-F2-O2 mixtures with detection of FO2 by ab-sorption at 220 nm. The rate of approach to equilibrium was monitored and the10
equilibrium constant measured. A value of ∆H◦(298 K)=52.8 kJ mol−1 was de-rived by a third-law analysis.
2324
ACPD6, 2281–2702, 2006
Evaluated kinetic andphotochemical data
for atmosphericchemistry
R. Atkinson et al.
Title Page
Abstract Introduction
Conclusions References
Tables Figures
J I
J I
Back Close
Full Screen / Esc
Printer-friendly Version
Interactive Discussion
EGU
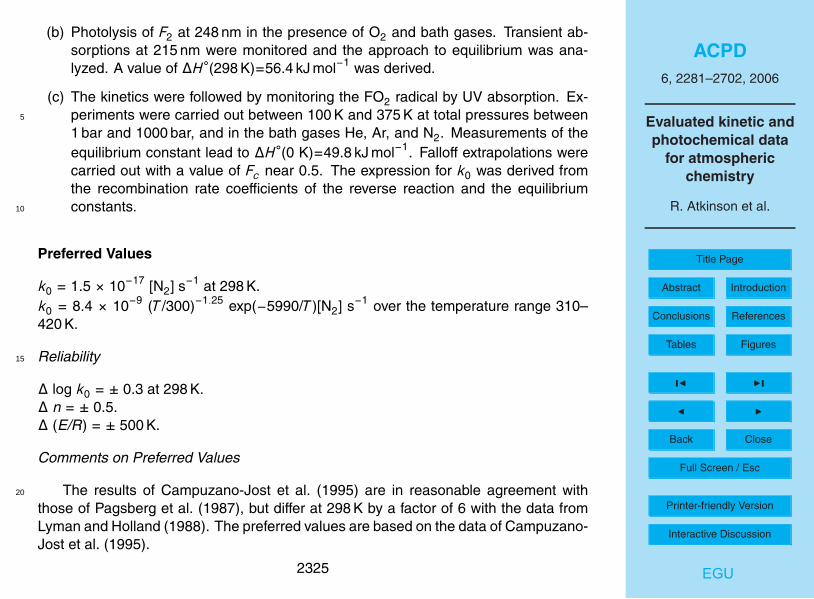
(b) Photolysis of F2 at 248 nm in the presence of O2 and bath gases. Transient ab-sorptions at 215 nm were monitored and the approach to equilibrium was ana-lyzed. A value of ∆H◦(298 K)=56.4 kJ mol−1 was derived.
(c) The kinetics were followed by monitoring the FO2 radical by UV absorption. Ex-periments were carried out between 100 K and 375 K at total pressures between5
1 bar and 1000 bar, and in the bath gases He, Ar, and N2. Measurements of theequilibrium constant lead to ∆H◦(0 K)=49.8 kJ mol−1. Falloff extrapolations werecarried out with a value of Fc near 0.5. The expression for k0 was derived fromthe recombination rate coefficients of the reverse reaction and the equilibriumconstants.10
Preferred Values
k0 = 1.5 × 10⁻¹⁷ [N2] s−1 at 298 K.k0 = 8.4 × 10⁻⁹ (T /300)−1.25 exp(−5990/T )[N2] s−1 over the temperature range 310–420 K.
Reliability15
∆ log k0 = ± 0.3 at 298 K.∆ n = ± 0.5.∆ (E/R) = ± 500 K.
Comments on Preferred Values
The results of Campuzano-Jost et al. (1995) are in reasonable agreement with20
those of Pagsberg et al. (1987), but differ at 298 K by a factor of 6 with the data fromLyman and Holland (1988). The preferred values are based on the data of Campuzano-Jost et al. (1995).
2325

ACPD6, 2281–2702, 2006
Evaluated kinetic andphotochemical data
for atmosphericchemistry
R. Atkinson et al.
Title Page
Abstract Introduction
Conclusions References
Tables Figures
J I
J I
Back Close
Full Screen / Esc
Printer-friendly Version
Interactive Discussion
EGU
High-pressure rate coefficients
Rate coefficient data
k∞/s−1 Temp./K Reference Technique/Comments
Absolute Rate Coefficients1.3 × 1013 T 0.45 exp(−5990/T ) 315–420 Campuzano-Jost et al., 1995 PLP (a)
Comments
(a) See comment (c) for k0.5
Preferred Values
k∞ = 3.1 × 10⁵ s−1 at 298 K.k∞ = 1.7 × 10¹⁴ (T /300) 0.45 exp(−5990/T ) s−1 over the temperature range 310–420 K.
Reliability
∆ log k∞ = ± 0.3 at 298 K.10
∆ n = ± 0.5 K.∆ (E/R) = ± 500 K.
Comments on Preferred Values
Because of the large pressure range studied by Campuzano-Jost et al. (1995), areliable falloff extrapolation towards k∞ was possible. The data of Campuzano-Jost et15
al. (1995) are therefore preferred, together with Fc values near 0.5.
2326

ACPD6, 2281–2702, 2006
Evaluated kinetic andphotochemical data
for atmosphericchemistry
R. Atkinson et al.
Title Page
Abstract Introduction
Conclusions References
Tables Figures
J I
J I
Back Close
Full Screen / Esc
Printer-friendly Version
Interactive Discussion
EGU
References
Campuzano-Jost, P., Croce, A. E., Hippler, H., Siefke, M., and Troe, J.: J. Chem.Phys., 102, 5317, 1995.Lyman, J. L. and Holland, R.: J. Phys. Chem., 92, 7232, 1988.Pagsberg, P., Ratajczak, E., Sillesen, A., and Jodkowski, J. T.: Chem. Phys. Lett.,5
141, 88, 1987.
2327

ACPD6, 2281–2702, 2006
Evaluated kinetic andphotochemical data
for atmosphericchemistry
R. Atkinson et al.
Title Page
Abstract Introduction
Conclusions References
Tables Figures
J I
J I
Back Close
Full Screen / Esc
Printer-friendly Version
Interactive Discussion
EGU
III.A1.8
F + O3 → FO + O2
∆H◦ = −113 kJ·mol−1
Rate coefficient data
k/cm3 molecule−1 s−1 Temp./K Reference Technique/Comments
Absolute Rate Coefficients2.8 × 10−11 exp[-(226 ± 200)/T ] 253–365 Wagner et al., 1972 DF-MS (a)1.3 × 10⁻¹¹ 298(6.2 ± 0.3) × 10−12 298 Bedzhanyan et al., 1993 DF-LMR (b)5
Comments
(a) MS detection of O3 decay in the presence of an excess of F atoms. The temporalprofiles of F, FO and O3 were monitored by MS.
(b) Discharge flow system with excess of O3 over F atoms. Rate of formation of FOradicals was monitored by LMR.10
Preferred Values
k = 1.0 × 10⁻¹¹ cm3 molecule−1 s−1 at 298 K.k = 2.2 × 10⁻¹¹ exp(−230/T ) cm3 molecule−1 s−1 over the temperature range 250–370 K.
2328
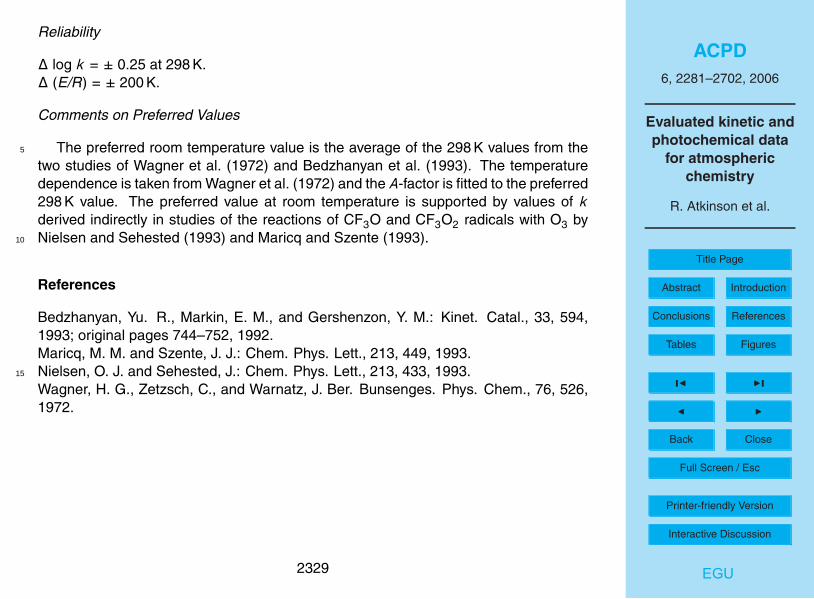
ACPD6, 2281–2702, 2006
Evaluated kinetic andphotochemical data
for atmosphericchemistry
R. Atkinson et al.
Title Page
Abstract Introduction
Conclusions References
Tables Figures
J I
J I
Back Close
Full Screen / Esc
Printer-friendly Version
Interactive Discussion
EGU
Reliability
∆ log k = ± 0.25 at 298 K.∆ (E/R) = ± 200 K.
Comments on Preferred Values
The preferred room temperature value is the average of the 298 K values from the5
two studies of Wagner et al. (1972) and Bedzhanyan et al. (1993). The temperaturedependence is taken from Wagner et al. (1972) and the A-factor is fitted to the preferred298 K value. The preferred value at room temperature is supported by values of kderived indirectly in studies of the reactions of CF3O and CF3O2 radicals with O3 byNielsen and Sehested (1993) and Maricq and Szente (1993).10
References
Bedzhanyan, Yu. R., Markin, E. M., and Gershenzon, Y. M.: Kinet. Catal., 33, 594,1993; original pages 744–752, 1992.Maricq, M. M. and Szente, J. J.: Chem. Phys. Lett., 213, 449, 1993.Nielsen, O. J. and Sehested, J.: Chem. Phys. Lett., 213, 433, 1993.15
Wagner, H. G., Zetzsch, C., and Warnatz, J. Ber. Bunsenges. Phys. Chem., 76, 526,1972.
2329

ACPD6, 2281–2702, 2006
Evaluated kinetic andphotochemical data
for atmosphericchemistry
R. Atkinson et al.
Title Page
Abstract Introduction
Conclusions References
Tables Figures
J I
J I
Back Close
Full Screen / Esc
Printer-friendly Version
Interactive Discussion
EGU
III.A1.9
F + HONO2 → HF + NO3
∆H◦ = −143.9 kJ·mol−1
Rate coefficient data
5
k/cm3 molecule−1 s−1 Temp./K Reference Technique/Comments
Absolute Rate Coefficients(2.7 ± 0.5) × 10−11 298 Mellouki et al., 1987 DF-EPR(2.1 ± 1.0) × 10−11 298 Rahman et al., 1988 DF-MS6.0 × 10−12 exp[(400 ± 120)/T ] 260–320 Wine et al., 1988 PLP-A (a)(2.3 ± 0.3) × 10−11 298(2.2 ± 0.2) × 10−11 298 Becker et al., 1991 DF-MS(2.3 ± 0.2) × 10−11 298 Becker et al., 1991 DF-EPR
Comments
(a) Pulsed laser photolysis of F2-HONO2-He mixtures at 351 nm, with detection ofNO3 radicals by long-path laser absorption at 662 nm. At higher temperatures(335–373 K) the rate coefficient was observed to be independent of temperature10
with a value of (2.0±0.3)×10−11 cm3 molecule−1 s−1.
2330

ACPD6, 2281–2702, 2006
Evaluated kinetic andphotochemical data
for atmosphericchemistry
R. Atkinson et al.
Title Page
Abstract Introduction
Conclusions References
Tables Figures
J I
J I
Back Close
Full Screen / Esc
Printer-friendly Version
Interactive Discussion
EGU
Preferred Values
k = 2.3 × 10⁻¹¹ cm3 molecule−1 s−1 at 298 K.k = 6.0 × 10⁻¹² exp(400/T ) cm3 molecule−1 s−1 over the temperature range 260–320 K.
Reliability
∆ log k = ± 0.1 at 298 K.5
∆ (E/R) = ± 200 K.
Comments on Preferred Values
The recommendation is based on the results of the temperature-dependent study ofWine et al. (1988) and the room temperature results of Mellouki et al. (1987), Rahmanet al. (1988) and Becker et al. (1991). The values at room temperature are in good10
agreement. The study of Wine et al. (1988) was over the temperature range 260–373 K;below 320 K the authors fitted their data with the Arrhenius expression recommendedhere, whereas at higher temperatures a temperature-independent value was found,suggesting the occurrence of different mechanisms in the two temperature regimes.
References15
Becker, E., Benter, T., Kampf, R., Schindler, R. N., and Wille, U.: Ber. Bunsenges.Phys. Chem., 95, 1168, 1991.Mellouki, A., Le Bras, G., and Poulet, G.: J. Phys. Chem., 91, 5760, 1987.Rahman, M. M., Becker, E., Benter, T., and Schindler, R. N.: Ber. Bunsenges. Phys.Chem., 92, 91, 1988.20
Wine, P. H., Wells, J. R., and Nicovich, J. M.: J. Phys. Chem., 92, 2223, 1988.
2331

ACPD6, 2281–2702, 2006
Evaluated kinetic andphotochemical data
for atmosphericchemistry
R. Atkinson et al.
Title Page
Abstract Introduction
Conclusions References
Tables Figures
J I
J I
Back Close
Full Screen / Esc
Printer-friendly Version
Interactive Discussion
EGU
III.A1.10
FO + O3 → F + 2O2 (1)→ FO2 + O2 (2)
∆H◦(1) = −172 kJ·mol−1
∆H◦(2) = −226 kJ·mol−1
Rate coefficient data (k=k1+k2)5
k/cm3 molecule−1 s−1 Temp./K Reference Technique/Comments
Absolute Rate Coefficients< 1.2 × 10⁻¹² 298 Sehested et al., 1994 PR-UVA (a)< 1 × 10⁻¹⁴ 298 Li et al., 1995 DF-MS (b)
Comments
(a) Pulse radiolysis-UV absorption spectroscopy technique at 18 bar total pressure.FO2 radicals and O3 were monitored in absorption at 220 nm and 288 nm, respec-tively.10
(b) Discharge flow-mass spectrometric technique at 1 mbar total pressure. FO rad-icals were produced in the reaction of F atoms with excess O3. No appreciabledecay of FO radicals was observed, only a small increase in FO2 radical concen-trations was detected, and the concentration of O3 was unchanged, allowing theuppper limit to k tabulated above to be derived.15
2332
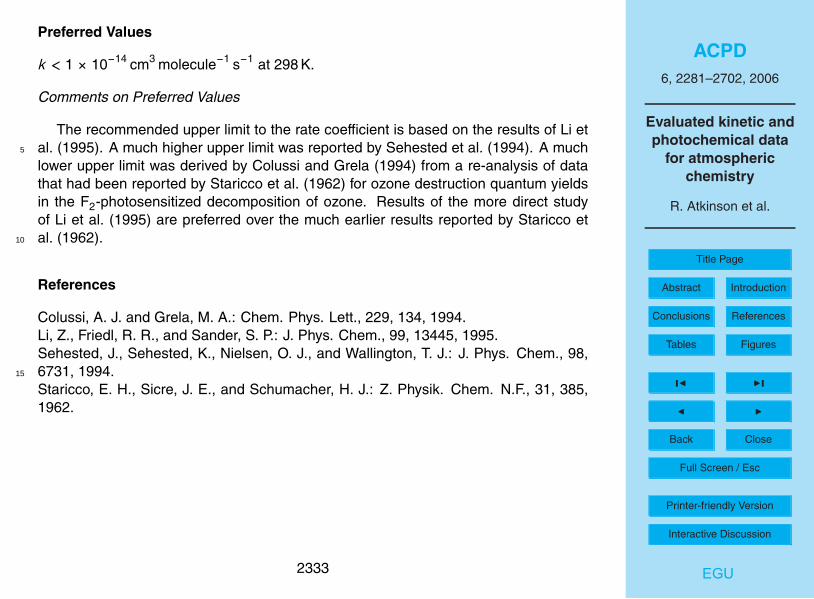
ACPD6, 2281–2702, 2006
Evaluated kinetic andphotochemical data
for atmosphericchemistry
R. Atkinson et al.
Title Page
Abstract Introduction
Conclusions References
Tables Figures
J I
J I
Back Close
Full Screen / Esc
Printer-friendly Version
Interactive Discussion
EGU
Preferred Values
k < 1 × 10⁻¹⁴ cm3 molecule−1 s−1 at 298 K.
Comments on Preferred Values
The recommended upper limit to the rate coefficient is based on the results of Li etal. (1995). A much higher upper limit was reported by Sehested et al. (1994). A much5
lower upper limit was derived by Colussi and Grela (1994) from a re-analysis of datathat had been reported by Staricco et al. (1962) for ozone destruction quantum yieldsin the F2-photosensitized decomposition of ozone. Results of the more direct studyof Li et al. (1995) are preferred over the much earlier results reported by Staricco etal. (1962).10
References
Colussi, A. J. and Grela, M. A.: Chem. Phys. Lett., 229, 134, 1994.Li, Z., Friedl, R. R., and Sander, S. P.: J. Phys. Chem., 99, 13445, 1995.Sehested, J., Sehested, K., Nielsen, O. J., and Wallington, T. J.: J. Phys. Chem., 98,6731, 1994.15
Staricco, E. H., Sicre, J. E., and Schumacher, H. J.: Z. Physik. Chem. N.F., 31, 385,1962.
2333

ACPD6, 2281–2702, 2006
Evaluated kinetic andphotochemical data
for atmosphericchemistry
R. Atkinson et al.
Title Page
Abstract Introduction
Conclusions References
Tables Figures
J I
J I
Back Close
Full Screen / Esc
Printer-friendly Version
Interactive Discussion
EGU
III.A1.11
FO + NO→ F + NO2
∆H◦ = −87 kJ·mol−1
Rate coefficient data
k/cm3 molecule−1 s−1 Temp./K Reference Technique/Comments
Absolute Rate Coefficients(2.6 ± 0.5) × 10−11 298 Ray and Watson, 1981 DF-MS1.86 × 10−11(T /300)−(0.66±0.13) 300–845 Bedzhanyan et al., 1993 DF-LMR(1.9 ± 0.4) × 10−11 3005
Preferred Values
k = 2.2 × 10⁻¹¹ cm3 molecule−1 s−1 at 298 K.k = 8.2 × 10⁻¹² exp(300/T ) cm3 molecule−1 s−1 over the temperature range 290–850 K.
Reliability
∆ log k = ± 0.15 at 298 K.10
∆ (E/R) = ± 200 K.
Comments on Preferred Values
The preferred room temperature value is the average of the room temperature val-ues from the only two studies of Ray and Watson (1981) and Bedzhanyan et al. (1993).The temperature dependence is derived from a fit to the data of Bedzhanyan et15
2334

ACPD6, 2281–2702, 2006
Evaluated kinetic andphotochemical data
for atmosphericchemistry
R. Atkinson et al.
Title Page
Abstract Introduction
Conclusions References
Tables Figures
J I
J I
Back Close
Full Screen / Esc
Printer-friendly Version
Interactive Discussion
EGU
al. (1993) and the A-factor is fitted to the preferred 298 K value. The temperaturedependence is similar to those for the analogous ClO and BrO radical reactions.
References
Bedzhanyan, Y. R., Markin, E. M., and Gershenzon, Y. M.: Kinet. Catal., 34, 1, 1993;original pages 7–10, 1993.5
Ray, G. W. and Watson, R. T.: J. Phys. Chem., 85, 2955, 1981.
2335

ACPD6, 2281–2702, 2006
Evaluated kinetic andphotochemical data
for atmosphericchemistry
R. Atkinson et al.
Title Page
Abstract Introduction
Conclusions References
Tables Figures
J I
J I
Back Close
Full Screen / Esc
Printer-friendly Version
Interactive Discussion
EGU
III.A1.12
FO + FO → 2F + O2 (1)→ FO2 + F (2)→ F2 + O2 (3)
∆H◦(1) = −59 kJ·mol−1
∆H◦(2) = −113 kJ·mol−1
∆H◦(3) = −218 kJ·mol−15
Rate coefficient data (k=k1+k2+k3)
k/cm3 molecule−1 s−1 Temp./K Reference Technique/Comments
Absolute Rate Coefficients(8.5 ± 2.8) × 10−12 298 Clyne and Watson, 1974 DF-MS1.0 × 10−11 (T /300)(0.85±0.5) 300–435 Bedzhanyan et al., 1993 DF-LMR
Preferred Values
k = 1.0 × 10⁻¹¹ cm3 molecule−1 s−1, independent of temperature over the range 290–440 K.10
Reliability
∆ log k = ± 0.2 at 298 K.∆ (E/R) = ± 250 K.
2336

ACPD6, 2281–2702, 2006
Evaluated kinetic andphotochemical data
for atmosphericchemistry
R. Atkinson et al.
Title Page
Abstract Introduction
Conclusions References
Tables Figures
J I
J I
Back Close
Full Screen / Esc
Printer-friendly Version
Interactive Discussion
EGU
Comments on Preferred Values
The recommended value is based on the results of Clyne and Watson (1974) andBedzhanyan et al. (1993). In a less direct study, Wagner et al. (1972) reported a factorof 3 higher value. Although Bedzhanyan et al. (1993) reported a weak temperaturedependence, a temperature-independent rate coefficient fits their data equally well and5
is recommended in this evaluation. The study of Bedzhanyan et al. (1993) showed thatthe predominant reaction channel is that to produce 2F+O2.
References
Bedzhanyan, Y. R., Markin, E. M., and Gershenzon, Y. M.: Kinet. Catal., 33, 601,1993; original pages 753–759 , 1992.10
Clyne, M. A. A. and Watson, R. T.: J. Chem. Soc. Faraday Trans., 1, 70, 1109, 1974.Wagner, H. G., Zetzsch, C., and Warnatz, J.: Ber. Bunsenges. Phys. Chem., 76, 526,1972.
2337

ACPD6, 2281–2702, 2006
Evaluated kinetic andphotochemical data
for atmosphericchemistry
R. Atkinson et al.
Title Page
Abstract Introduction
Conclusions References
Tables Figures
J I
J I
Back Close
Full Screen / Esc
Printer-friendly Version
Interactive Discussion
EGU
III.A1.13
FO2 + O3 → products
Rate coefficient data
k/cm3 molecule−1 s−1 Temp./K Reference Technique/Comments
Absolute Rate Coefficients< 3.4 × 10⁻¹⁶ 298 Sehested et al., 1994 PR-UVA (a)< 3 × 10⁻¹⁵ 298 Li et al., 1995 DF-MS (b)
Comments5
(a) Pulse radiolysis of O3-O2-SF6 mixtures in a high pressure cell at 18 bar of SF6.The decay of FO2 radicals was monitored in absorption at 220 nm.
(b) First-order decay rate of FO2 in presence of excess O3 at 1.3 mbar (1 Torr) totalpressure was monitored by mass spectrometry.
Preferred Values10
k < 4 × 10⁻¹⁶ cm3 molecule−1 s−1 at 298 K.
Comments on Preferred Values
The preferred room temperature upper limit to the rate coefficient is based on resultsof the pulse radiolysis-UV absorption study of Sehested et al. (1994). A higher upperlimit was reported by Li et al. (1995).15
2338
ACPD6, 2281–2702, 2006
Evaluated kinetic andphotochemical data
for atmosphericchemistry
R. Atkinson et al.
Title Page
Abstract Introduction
Conclusions References
Tables Figures
J I
J I
Back Close
Full Screen / Esc
Printer-friendly Version
Interactive Discussion
EGU
References
Li, Z., Friedl, R. R., and Sander, S. P.: J. Phys. Chem., 99, 13445, 1995.Sehested, J., Sehested, K., Nielsen, O. J., and Wallington, T. J.: J. Phys. Chem., 98,6731, 1994.
5
2339

ACPD6, 2281–2702, 2006
Evaluated kinetic andphotochemical data
for atmosphericchemistry
R. Atkinson et al.
Title Page
Abstract Introduction
Conclusions References
Tables Figures
J I
J I
Back Close
Full Screen / Esc
Printer-friendly Version
Interactive Discussion
EGU
III.A1.14
FO2 + NO→ FNO + O2
∆H◦ = −182 kJ·mol−1
Rate coefficient data
k/cm3 molecule−1 s−1 Temp./K Reference Technique/Comments
Absolute Rate Coefficients(1.5 ± 0.5) × 10−12 298 Sehested et al., 1994 PR-UVA (a)7.5 × 10⁻¹² exp[-(688 ± 377)/T ] 190–298 Li et al., 1995 DF-MS (b)(8.5 ± 1.3) × 10−13 2985
Comments
(a) Pulse radiolysis of NO-O2-SF6 mixtures at 1 bar SF6. The formation of FNO wasmonitored in absorption at 310.5 nm. The yield of FNO was determined to be100±14%.
(b) First-order decay rates of FO2 in the presence of excess NO were monitored by10
mass spectrometry at a total pressure of 1.3 mbar He. The yield of FNO wasfound to be nearly 100%.
Preferred Values
k = 7.5 × 10⁻¹³ cm3 molecule−1 s−1 at 298 K.k = 7.5 × 10⁻¹² exp(−690/T ) cm3 molecule−1 s−1 over the temperature range 190–15
300 K.2340
ACPD6, 2281–2702, 2006
Evaluated kinetic andphotochemical data
for atmosphericchemistry
R. Atkinson et al.
Title Page
Abstract Introduction
Conclusions References
Tables Figures
J I
J I
Back Close
Full Screen / Esc
Printer-friendly Version
Interactive Discussion
EGU
Reliability
∆ log k = ± 0.3 at 298 K.∆ (E/R) = ± 400 K.
Comments on Preferred Values
The preferred values are based on results of the temperature-dependent study of Li5
et al. (1995). The higher room temperature rate coefficient of Sehested et al. (1994)is encompassed within the assigned uncertainty limits. The low barrier to form FNOmay indicate that the reaction proceeds via formation of a short lived FOONO complex(Dibble and Francisco, 1997).
References10
Dibble, T. S. and Francisco, J. S.: J. Am Chem. Soc., 119, 2894, 1997.Li, Z., Friedl, R. R., and Sander, S. P.: J. Phys. Chem., 99, 13445, 1995.Sehested, J., Sehested, K., Nielsen, O. J., and Wallington, T. J.: J. Phys. Chem., 98,6731, 1994.
15
2341

ACPD6, 2281–2702, 2006
Evaluated kinetic andphotochemical data
for atmosphericchemistry
R. Atkinson et al.
Title Page
Abstract Introduction
Conclusions References
Tables Figures
J I
J I
Back Close
Full Screen / Esc
Printer-friendly Version
Interactive Discussion
EGU
III.A1.15
FO2 + NO2 → products
Rate coefficient data
k/cm3 molecule−1 s−1 Temp./K Reference Technique/Comments
Absolute Rate Coefficients(1.05 ± 0.15) × 10−13 298 Sehested et al., 1994 PR-UVA (a)3.8 × 10⁻¹¹ exp[-(2042 ± 456)/T ] 260–315 Li et al., 1995 DF-MS (b)(4.2 ± 0.8) × 10−14 298
Comments5
(a) Pulse radiolysis of NO2-O2-SF6 mixtures. The decay of NO2 was monitored inabsorption at 400 nm, and that of FO2 radicals at 220 nm. The rate coefficientshowed no dependence on pressure over the pressure range 1–18 bar of SF6.
(b) First-order decay rate of FO2 radicals in the presence of excess NO2 was moni-tored by mass spectrometry at a total presssure of 1.3 mbar He.10
Preferred Values
k = 4.0 × 10⁻¹⁴ cm3 molecule−1 s−1 at 298 K.k = 3.8 × 10⁻¹¹ exp(−2040/T ) cm3 molecule−1 s−1 over the temperature range 260–320 K.
2342

ACPD6, 2281–2702, 2006
Evaluated kinetic andphotochemical data
for atmosphericchemistry
R. Atkinson et al.
Title Page
Abstract Introduction
Conclusions References
Tables Figures
J I
J I
Back Close
Full Screen / Esc
Printer-friendly Version
Interactive Discussion
EGU
Reliability
∆ log k = ± 0.3 at 298 K.∆ (E/R) = ± 500 K.
Comments on Preferred Values
The preferred values are based on results of the temperature-dependent study of Li5
et al. (1995). The higher room temperature result of Sehested et al. (1994) might beattributable to a small NO impurity in the NO2 sample used. The observed positive tem-perature dependence suggests that reaction occurs primarily by a simple bimolecularmechanism yielding FNO2+O2.
References10
Li, Z., Friedl, R. R., and Sander, S. P.: J. Phys. Chem., 99, 13445, 1995.Sehested, J., Sehested, K., Nielsen, O. J., and Wallington, T. J.: J. Phys. Chem., 98,6731, 1994.
2343

ACPD6, 2281–2702, 2006
Evaluated kinetic andphotochemical data
for atmosphericchemistry
R. Atkinson et al.
Title Page
Abstract Introduction
Conclusions References
Tables Figures
J I
J I
Back Close
Full Screen / Esc
Printer-friendly Version
Interactive Discussion
EGU
Appendix 2: ClOx Reactions
III.A2.16
O + HOCl→ HO + ClO
∆H◦ = −32 kJ·mol−1
Rate coefficient data5
k/cm3 molecule−1 s−1 Temp./K Reference Technique/Comments
Absolute Rate Coefficients(1.3 ± 0.2) × 10−13 298 Vogt and Schindler, 1992 DF-MS(1.7 ± 0.3) × 10−13 213–298 Schindler et al., 1996 DF-MS
Preferred Values
k = 1.7 × 10⁻¹³ cm3 molecule−1 s−1 at 298 K, independent of temperature over therange 210–300 K.
Reliability10
∆ log k = ± 0.5 at 298 K.∆ (E/R) = ± 300 K.
Comments on Preferred Values
The preferred values are based on the results of the study of Schindler et al. (1996)in which k was found to be independent of temperature over the range 213–298 K.15
These results are preferred over those of the previous study of Vogt and Schindler2344

ACPD6, 2281–2702, 2006
Evaluated kinetic andphotochemical data
for atmosphericchemistry
R. Atkinson et al.
Title Page
Abstract Introduction
Conclusions References
Tables Figures
J I
J I
Back Close
Full Screen / Esc
Printer-friendly Version
Interactive Discussion
EGU
(1992) from the same laboratory, which was only at room temperature. In the mostrecent study (Schindler et al., 1996), product analysis using 18O atoms and ab-initiomodel calculations indicate that Cl atom abstraction is the predominant primary reac-tion channel.
References5
Schindler, R. N., Dethlefs, J., and Schmidt, M.: Ber. Bunsenges. Phys. Chem., 100,1242, 1996.Vogt, R. and Schindler, R. N.: Geophys. Res. Lett., 19, 1935, 1992.
2345

ACPD6, 2281–2702, 2006
Evaluated kinetic andphotochemical data
for atmosphericchemistry
R. Atkinson et al.
Title Page
Abstract Introduction
Conclusions References
Tables Figures
J I
J I
Back Close
Full Screen / Esc
Printer-friendly Version
Interactive Discussion
EGU
III.A2.17
O + ClO→ Cl + O2
∆H◦ = −229.5 kJ·mol−1
2346

ACPD6, 2281–2702, 2006
Evaluated kinetic andphotochemical data
for atmosphericchemistry
R. Atkinson et al.
Title Page
Abstract Introduction
Conclusions References
Tables Figures
J I
J I
Back Close
Full Screen / Esc
Printer-friendly Version
Interactive Discussion
EGU
Rate coefficient data
k/cm3 molecule−1 s−1 Temp./K Reference Technique/Comments
Absolute Rate Coefficients(5.3 ± 0.8) × 10−11 298 Bemand et al., 1973 DF-RF(5.7 ± 2.3) × 10−11 298 Bemand et al., 1973 DF-MS1.07 × 10−10 exp[-(224 ± 76)/T ] 220–426 Clyne and Nip, 1976 DF-RF(5.2 ± 1.6) × 10−11 2985.2 × 10−11 exp[-(96 ± 20)/T ] 236–422 Leu, 1984 DF-RF(3.6 ± 0.7) × 10−11 296(4.2 ± 0.8) × 10−11 241–298 Margitan, 1984 PLP-RF(3.5 ± 0.5) × 10−11 252–347 Schwab et al., 1984 DF-RF/RA/LMR (a)1.55 × 10⁻¹¹ exp[(263 ± 60)/T ] 231–367 Nicovich et al., 1988 PLP-RF (b)(3.8 ± 0.6) × 10−11 2983.0 × 10−11 exp[(75 ± 40)/T ] 227–362 Goldfarb et al., 2001 PLP-RF (e)(3.9 ± 0.6) × 10−11 298
Relative Rate Coefficients4.3 × 10−11 exp[-(4 ± 30)/T ] 218–295 Zahniser and Kaufman, 1977 RR (c)(4.3 ± 0.7) × 10−11 2952.6 × 10−11 exp[(97 ± 64)/T ] 220–387 Ongstad and Birks, 1986 RR (d)(3.8 ± 0.6) × 10−11 298
2347

ACPD6, 2281–2702, 2006
Evaluated kinetic andphotochemical data
for atmosphericchemistry
R. Atkinson et al.
Title Page
Abstract Introduction
Conclusions References
Tables Figures
J I
J I
Back Close
Full Screen / Esc
Printer-friendly Version
Interactive Discussion
EGU
Comments
(a) Discharge flow system with LMR detection of ClO radicals and resonance fluores-cence detection of O(3P) and Cl atoms. Pseudo-first order decay of O(3P) atomsin the presence of excess ClO and decay of ClO in the presence of excess O(3P)gave good agreement for the rate coefficent k. There was no discernable tem-5
perature dependence over the range studied. The total pressure was in the range1.1–2.7 mbar.
(b) Dual pulsed laser photolysis system with resonance fluorescence detection inslow flow reactor. ClO radicals were produced by reaction of excess Cl, producedby 351 nm excimer laser photolysis of Cl2, with known concentrations of O3. O(3P)10
atoms were produced by 266 nm laser photolysis of ClO after appropriate delaytime, and were monitored by resonance fluorescence. The measured O(3P) atomdecay rate was corrected for losses due to reaction with Cl2 and other routes. Thetotal pressure was in the range 33 mbar to 667 mbar, and no effect of pressure onthe rate coefficient k was observed.15
(c) The rate coefficient k was measured relative to k(Cl+O3) using the discharge flowtechnique in conjunction with resonance fluorescence monitoring of Cl atom con-centrations and resonance absorption monitoring of O(3P) atom concentrations ina system where O(3P), Cl, ClO and O3 had reached a steady-state condition. Thetabulated Arrhenius expression was obtained by combining the experimentally de-20
termined ratio of k(O+ClO)/k(Cl+O3)=1.55 exp[(246±30)/T ] with the rate coeffi-cient of k(Cl+O3)=2.8×10⁻¹¹ exp(−250/T ) cm3 molecule−1 s−1 (IUPAC, 2005).
(d) Discharge flow system with detection of O(3P) atoms by O+NO+M chemi-luminescence in the presence of excess ClO. The ClO radical concentra-tions were determined indirectly by in situ conversion to NO2 by addition25
of NO and k measured relative to k(O+NO2→NO+O2)=6.58×10⁻¹² exp[(-
2348

ACPD6, 2281–2702, 2006
Evaluated kinetic andphotochemical data
for atmosphericchemistry
R. Atkinson et al.
Title Page
Abstract Introduction
Conclusions References
Tables Figures
J I
J I
Back Close
Full Screen / Esc
Printer-friendly Version
Interactive Discussion
EGU
142±23)/T ] cm3 molecule−1 s−1, determined concurrently in the same system.The total pressure was 3.1 mbar. No effect of O2 was observed at 230 K.
(e) Discharge flow tube coupled to a pulsed laser photolysis-resonance fluorescenceapparatus. O atoms were produced by PLP of ClO at 308 nm, and their pseudo-first-order decay in excess ClO was monitored by RF. ClO radicals were produced5
by reaction of excess Cl atoms with O3 or Cl2O. Cl atoms were produced in themicrowave discharge of a Cl2-He mixture. The total pressure was in the range 7–29 mbar. In this paper the authors, on the basis of a careful analysis of their dataand the existing literature data on this reaction (see Comments on Preferred Val-ues), proposed a temperature-dependent expression to be used for atmospheric10
calculations.
Preferred Values
k = 3.7 × 10⁻¹¹ cm3 molecule−1 s−1 at 298 K.k = 2.5 × 10⁻¹¹ exp(110/T ) cm3 molecule−1 s−1 over the temperature range 220–390 K.
Reliability15
∆ log k = ± 0.06 at 298 K.∆ (E/R) = ± 50 K.
Comments on Preferred Values
The preferred value accepts the recommendation of Goldfarb et al. (2001) basedon a careful analysis of their data and data published in previous studies. The data20
used in the analysis were those published in Zahniser and Kaufman (1977), Margitan(1984), Schwab et al. (1984), Ongstad and Birks (1986), Nicovich et al. (1988) andGoldfarb et al. (2001). On the basis of newer information, the rate coefficients reported
2349
ACPD6, 2281–2702, 2006
Evaluated kinetic andphotochemical data
for atmosphericchemistry
R. Atkinson et al.
Title Page
Abstract Introduction
Conclusions References
Tables Figures
J I
J I
Back Close
Full Screen / Esc
Printer-friendly Version
Interactive Discussion
EGU
by Zahniser and Kaufman (1977), Margitan (1984) and Ongstad and Birks (1986) wereadjusted (Goldfarb et al., 2001). Leu and Yung (1987) have shown that the yields ofO2(1∆) and O2(1Σ) in the reaction are <2×10⁻² and (4.4±1.1)×10−4, respectively.
References
Bemand, P. P., Clyne, M. A. A., and Watson, R. T.: J. Chem. Soc. Faraday Trans., 1,5
69, 1356, 1973.Clyne, M. A. A. and Nip, W. S.: J. Chem. Soc. Faraday Trans., 1, 72, 2211, 1976.Goldfarb, L., Burkholder, J. B., and Ravishankara, A. R.: J. Phys. Chem. A, 105, 5402,2001.IUPAC: http://www.iupac-kinetic.ch.cam.ac.uk/, 2005.10
Leu, M.-T.: J. Phys. Chem., 88, 1394, 1984.Leu, M.-T. and Yung, Y. L.: Geophys. Res. Lett., 14, 949, 1987.Margitan, J. J.: J. Phys. Chem., 88, 3638, 1984.Nicovich, J. M., Wine, P. H., and Ravishankara, A. R.: J. Chem. Phys., 89, 5670, 1988.Ongstad, A. P. and Birks, J. W.: J. Chem. Phys., 85, 3359, 1986.15
Schwab, J. J., Toohey, D. W., Brune, W. H., and Anderson, J. G.: J. Geophys. Res.,89, 9581, 1984.Zahniser, M. S. and Kaufman, F.: J. Chem. Phys., 66, 3673, 1977.
2350

ACPD6, 2281–2702, 2006
Evaluated kinetic andphotochemical data
for atmosphericchemistry
R. Atkinson et al.
Title Page
Abstract Introduction
Conclusions References
Tables Figures
J I
J I
Back Close
Full Screen / Esc
Printer-friendly Version
Interactive Discussion
EGU
III.A2.18
O + OClO→ O2 + ClO
∆H◦ = −242.2 kJ·mol−1
Rate coefficient data
k/cm3 molecule−1 s−1 Temp./K Reference Technique/Comments
Absolute Rate Coefficients(5 ± 2) × 10−13 298 Bemand et al., 1973 DF-RF/MS (a)(1.6 ± 0.4) × 10−13 298 Colussi, 1990 PLP-RF (b)See Comment 248–312 Colussi et al., 1992 PLP-RF (c)2.4 × 10⁻¹² exp[-(960 ± 120)/T ] 243–400 Gleason et al., 1994 DF-RF (d)(1.0 ± 0.3) × 10−13 2985
Comments
(a) Discharge flow system. Two independent methods were used: O(3P) atom de-cay in excess OClO monitored by resonance fluorescence, and OClO decay inexcess O(3P) determined by MS. There was only fair agreement between the twomethods.10
(b) Pulsed laser photolysis of OClO at 308 nm, with the O(3P) atom decay beingdetermined by resonance fluorescence. The results were extrapolated to zerolaser pulse intensity. Measurements were made over the pressure range 13 mbarto 1040 mbar of Ar. The observed rate coefficients were pressure dependent,indicating the presence of a termolecular association reaction. The value reported15
2351

ACPD6, 2281–2702, 2006
Evaluated kinetic andphotochemical data
for atmosphericchemistry
R. Atkinson et al.
Title Page
Abstract Introduction
Conclusions References
Tables Figures
J I
J I
Back Close
Full Screen / Esc
Printer-friendly Version
Interactive Discussion
EGU
for the bimolecular component was not directly measured but was derived fromfitting a falloff curve to the experimental data over the entire pressure range.
(c) Pulsed laser photolysis of OClO at 308 nm, with the O(3P) atom decay being de-termined by resonance fluorescence. The observed rate coefficients were pres-sure dependent, indicating the presence of a termolecular association reaction.5
A negative temperature dependence was observed for the bimolecular compo-nent, with the reported values of k increasing from 1.5×10⁻¹³ cm3 molecule−1 s−1
at 312 K to 4.0×10⁻¹³ cm3 molecule−1 s−1 at 248 K. These values for the bimolec-ular component were not directly measured but were derived quantities whichare consistent with falloff curves fitted to the experimental data over the pressure10
range 26 mbar to 800 mbar of Ar.
(d) Discharge flow system with resonance fluorescence detection of O(3P) atoms.The total pressure was 1 mbar to 7 mbar. Measurements were made over thetemperature range 200 K to 400 K. The data for the temperature range 243 K to400 K were fitted with the Arrhenius expression given in the table. Data at lower15
temperatures showed a negative temperature dependence.
Preferred Values
k = 1.0 × 10⁻¹³ cm3 molecule−1 s−1 at 298 K.k = 2.4 × 10⁻¹² exp(−960/T ) cm3 molecule−1 s−1 over the temperature range 240–400 K.20
Reliability
∆ log k = ± 0.3 at 298 K.∆ (E/R) = ± 300 K.
2352

ACPD6, 2281–2702, 2006
Evaluated kinetic andphotochemical data
for atmosphericchemistry
R. Atkinson et al.
Title Page
Abstract Introduction
Conclusions References
Tables Figures
J I
J I
Back Close
Full Screen / Esc
Printer-friendly Version
Interactive Discussion
EGU
Comments on Preferred Values
The preferred values are based on the results of the discharge flow-resonance fluo-rescence study of Gleason et al. (1994). Over the temperature range of the recommen-dation (240 K to 400 K), the data of Gleason et al. (1994) were well fit by the Arrheniusexpression given, but at lower temperatures down to 200 K there was an abrupt change5
to a negative temperature dependence (Gleason et al., 1994). It appears that the ex-periments of Bemand et al. (1973) were complicated by secondary chemistry. Theexperiments of Colussi (1990) and Colussi et al. (1992) over an extended pressurerange demonstrate the importance of the termolecular reaction (see separate datasheet on O+OClO+M). However, the extrapolated low pressure rate coefficients of Co-10
lussi (1990) and Colussi et al. (1992) show a negative temperature dependence overthe range 248 K to 312 K, in contrast to the data of Gleason et al. (1994). Mauldin etal. (1997) have studied the mechanism and products of this system at 260 K and a totalpressure of 430 mbar of N2. Under these conditions the value of the rate coefficient forthe reaction O+OClO → products was reported to be 1.9×10⁻¹² cm3 molecule−1 s−1
15
(Mauldin et al., 1997). Combining this overall rate coefficient with the observation thatthe yield of ClO radicals under these conditions is <5% (Mauldin et al., 1997), leads toan upper limit of k(O+OClO → O2+ClO)<1×10⁻¹³ cm3 molecule−1 s−1 at 260 K. Thisupper limit to the rate coefficient is consistent with the value of Gleason et al. (1994),but not with the extrapolated values of Colussi et al. (1992).20
References
Bemand, P. P., Clyne, M. A. A., and Watson, R. T.: J. Chem. Soc. Faraday Trans., 1,69, 1356, 1973.Colussi, A. J.: J. Phys. Chem., 94, 8922, 1990.Colussi, A. J., Sander, S. P., and Friedl, R. R.: J. Phys. Chem., 96, 4442, 1992.25
Gleason, J. F., Nesbitt, F. L., and Stief, L. J.: J. Phys. Chem., 98, 126, 1994.
2353

ACPD6, 2281–2702, 2006
Evaluated kinetic andphotochemical data
for atmosphericchemistry
R. Atkinson et al.
Title Page
Abstract Introduction
Conclusions References
Tables Figures
J I
J I
Back Close
Full Screen / Esc
Printer-friendly Version
Interactive Discussion
EGU
Mauldin III, R. L., Burkholder, J. B., and Ravishankara, A. R.: Int. J. Chem. Kinet., 29,139, 1997.
2354
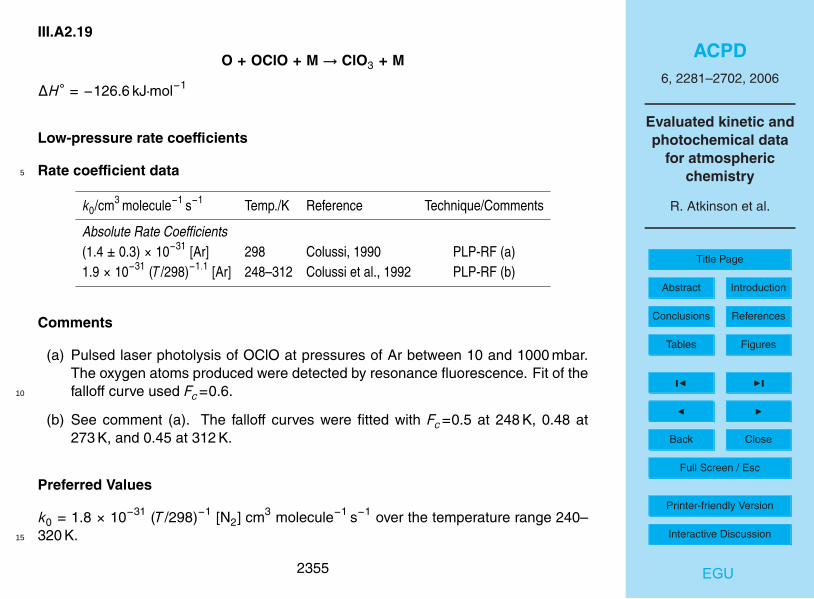
ACPD6, 2281–2702, 2006
Evaluated kinetic andphotochemical data
for atmosphericchemistry
R. Atkinson et al.
Title Page
Abstract Introduction
Conclusions References
Tables Figures
J I
J I
Back Close
Full Screen / Esc
Printer-friendly Version
Interactive Discussion
EGU
III.A2.19
O + OClO + M→ ClO3 + M
∆H◦ = −126.6 kJ·mol−1
Low-pressure rate coefficients
Rate coefficient data5
k0/cm3 molecule−1 s−1 Temp./K Reference Technique/Comments
Absolute Rate Coefficients(1.4 ± 0.3) × 10−31 [Ar] 298 Colussi, 1990 PLP-RF (a)1.9 × 10⁻³¹ (T /298)−1.1 [Ar] 248–312 Colussi et al., 1992 PLP-RF (b)
Comments
(a) Pulsed laser photolysis of OClO at pressures of Ar between 10 and 1000 mbar.The oxygen atoms produced were detected by resonance fluorescence. Fit of thefalloff curve used Fc=0.6.10
(b) See comment (a). The falloff curves were fitted with Fc=0.5 at 248 K, 0.48 at273 K, and 0.45 at 312 K.
Preferred Values
k0 = 1.8 × 10⁻³¹ (T /298)−1 [N2] cm3 molecule−1 s−1 over the temperature range 240–320 K.15
2355

ACPD6, 2281–2702, 2006
Evaluated kinetic andphotochemical data
for atmosphericchemistry
R. Atkinson et al.
Title Page
Abstract Introduction
Conclusions References
Tables Figures
J I
J I
Back Close
Full Screen / Esc
Printer-friendly Version
Interactive Discussion
EGU
Reliability
∆ log k0 = ± 0.3 at 298 K.∆ n = ± 0.5
Comments on Preferred Values
The preferred values are based on the data of Colussi et al. (1992) using falloff5
extrapolations with a fitted value of Fc=0.5 at 298 K. Low pressure experiments byGleason et al. (1994) (1.3–7 mbar) indicate the presence of the reaction O+OClO →ClO+O2.
High-pressure rate coefficients
Rate coefficient data10
k∞/cm3 molecule−1 s−1 Temp./K Reference Technique/Comments
Absolute Rate Coefficients(3.1 ± 0.8) × 10−11 298 Colussi, 1990 PLP-RF (a)2.8 × 10⁻¹¹ 248–312 Colussi et al., 1992 PLP-RF (b)
Comments
(a) See comment (a) for k0.
(b) See comment (b) for k0.
2356

ACPD6, 2281–2702, 2006
Evaluated kinetic andphotochemical data
for atmosphericchemistry
R. Atkinson et al.
Title Page
Abstract Introduction
Conclusions References
Tables Figures
J I
J I
Back Close
Full Screen / Esc
Printer-friendly Version
Interactive Discussion
EGU
Preferred Values
k∞ = 2.8 × 10⁻¹¹ cm3 molecule−1 s−1, independent of temperature over the range 240–320 K.
Reliability
∆ log k∞ = ± 0.3 at 298 K.5
∆ n = ± 1.
Comments on Preferred Values
See comments on k0. The rate coefficients of Colussi et al. (1992) were confirmedby measurements carried out by Mauldin et al. (1997) at 260 K and 430 mbar of N2.Under these conditions (260 K and 430 mbar of N2), Mauldin et al. (1997) observed10
that the reaction led to the formation of ClO radicals with a yield of <5%. Mauldinet al. (1997) concluded that the combination reaction may involve the intermediateformation of a species such as OOClO which is different from ClO3 and which does notrearrange to give O2+ClO.
Theoretical modelling of the reaction by Zhu and Lin (2002) led to values of k∞15
which were a factor of 5–7 higher than obtained from the measurements. As the mea-surements of Colussi et al. (1992) look well-behaved, they are preferred to the model-ing. There is also still some dispute about the heat of reaction, see the calculations bySicre and Cobos (2003).
References20
Colussi, A. J.: J. Phys. Chem., 94, 8922, 1990.Colussi, A. J., Sander, S. P., and Friedl, R. R.: J. Phys. Chem., 96, 4442, 1992.Gleason, J. F., Nesbitt, F. L., and Stief, L. J.: J. Phys. Chem., 98, 126, 1994.
2357
ACPD6, 2281–2702, 2006
Evaluated kinetic andphotochemical data
for atmosphericchemistry
R. Atkinson et al.
Title Page
Abstract Introduction
Conclusions References
Tables Figures
J I
J I
Back Close
Full Screen / Esc
Printer-friendly Version
Interactive Discussion
EGU
Mauldin III, R. L., Burkholder, J. B., and Ravishankara, A. R.: Int. J. Chem. Kinet., 29,139, 1997.Sicre, J. E. and Cobos, C. J.: J. Mol. Struct. (Theochem), 620, 215, 2003.Zhu, R. S. and Lin, M. C.: J. Phys. Chem., A 106, 8386, 2002.
5
2358

ACPD6, 2281–2702, 2006
Evaluated kinetic andphotochemical data
for atmosphericchemistry
R. Atkinson et al.
Title Page
Abstract Introduction
Conclusions References
Tables Figures
J I
J I
Back Close
Full Screen / Esc
Printer-friendly Version
Interactive Discussion
EGU
III.A2.20
O + Cl2O→ ClO + ClO
∆H◦ = −123 kJ·mol−1
Rate coefficient data
5
k/cm3 molecule−1 s−1 Temp./K Reference Technique/Comments
Absolute Rate Coefficients2.7 × 10−11 exp[-(560 ± 80)/T ] 236–295 Miziolek and Molina, 1978 DF-CL(4.1 ± 0.5) × 10−12 2953.3 × 10−11 exp[-(700 ± 150)/T ] 237–297 Wecker et al., 1982 DF-EPR(3.1 ± 0.5) × 10−12 2972.7 × 10−11 exp[-(510 ± 30)/T ] 230–380 Stevens and Anderson, 1992 DF-RF(4.7 ± 0.2) × 10−12 298
Preferred Values
k = 4.5 × 10⁻¹² cm3 molecule−1 s−1 at 298 K.k = 2.7 × 10⁻¹¹ exp(−530/T ) cm3 molecule−1 s−1 over the temperature range 230–380 K.10
Reliability
∆ log k = ± 0.15 at 298 K.∆ (E/R) = ± 200 K.
2359

ACPD6, 2281–2702, 2006
Evaluated kinetic andphotochemical data
for atmosphericchemistry
R. Atkinson et al.
Title Page
Abstract Introduction
Conclusions References
Tables Figures
J I
J I
Back Close
Full Screen / Esc
Printer-friendly Version
Interactive Discussion
EGU
Comments on Preferred Values
The preferred value at 298 K is based on the results of Stevens and Anderson (1992)and Miziolek and Molina (1978), which are in good agreement. The significantly lowervalues of Wecker et al. (1982) are not included, nor are earlier, higher results of Free-man and Phillips (1968) and Basco and Dogra (1971) due to data analysis difficulties5
in both studies (Freeman and Phillips, 1968; Basco and Dogra, 1971).
References
Basco, N. and Dogra, S. K.: Proc. Roy. Soc. London A, 323, 29, 1971.Freeman, C. G. and Phillips, L. F.: J. Phys. Chem., 72, 3025, 1968.Miziolek, A. W. and Molina, M. J.: J. Phys. Chem., 82, 1769, 1978.10
Stevens, P. S. and Anderson, J. G.: J. Phys. Chem., 96, 1708, 1992.Wecker, D., Johanssen, R., and Schindler, R. N.: Ber. Bunsenges. Phys. Chem., 86,532, 1982.
2360

ACPD6, 2281–2702, 2006
Evaluated kinetic andphotochemical data
for atmosphericchemistry
R. Atkinson et al.
Title Page
Abstract Introduction
Conclusions References
Tables Figures
J I
J I
Back Close
Full Screen / Esc
Printer-friendly Version
Interactive Discussion
EGU
III.A2.21
O + ClONO2 → ClO + NO3 (1)→ OClO + NO2 (2)→ O2 + ClONO (3)
∆H◦(1) = −96.7 kJ·mol−1
∆H◦(2) = −144.3 kJ·mol−1
∆H◦(3) = −216 kJ·mol−15
Rate coefficient data (k=k1+k2+k3)
k/cm3 molecule−1 s−1 Temp./K Reference Technique/Comments
Absolute Rate Coefficients(2.0 ± 0.2) × 10−13 245 Ravishankara et al., 1977 FP-RF3.4 × 10−12 exp[-(840 ± 60)/T ] 213–295 Molina et al., 1977 DF-CL(2.0 ± 0.4) × 10−13 2951.9 × 10−12 exp[-(692 ± 167)/T ] 225–273 Kurylo, 1977 FP-RF1.8 × 10−13 298∗
(2.3 ± 0.6) × 10−13 298 Adler-Golden and Wiesenfeld, 1981 FP-RA(2.4 ± 0.4) × 10−13 298 Tyndall et al., 1997 PLP-RF4.5 × 10−12 exp[-(900 ± 80)/T ] 202–325 Goldfarb et al., 1998 PLP-RF/A(2.2 ± 0.2) × 10−13 298 (a)
2361
ACPD6, 2281–2702, 2006
Evaluated kinetic andphotochemical data
for atmosphericchemistry
R. Atkinson et al.
Title Page
Abstract Introduction
Conclusions References
Tables Figures
J I
J I
Back Close
Full Screen / Esc
Printer-friendly Version
Interactive Discussion
EGU
Comments
(a) k was measured by two independent techniques: (1) pulsed laser photolysis withtime-resolved resonance fluorescence detection of O-atom decay, and (2) pulsedlaser photolysis with time-resolved long-path absorption at 662 nm by the prod-uct NO3 radical. The yield of NO3 radicals produced in the reaction was also5
measured in the long-path absorption apparatus.
Preferred Values
k = 2.2 × 10⁻¹³ cm3 molecule−1 s−1 at 298 K.k = 4.5 × 10⁻¹² exp(−900/T ) cm3 molecule−1 s−1 over the temperature range 200–330 K.10
Reliability
∆ logk = ± 0.08 at 298 K.∆ (E/R) = ± 150 K.
Comments on Preferred Values
The preferred values are based on the results of the study of Goldfarb et al. (1998).15
This study encompassed the broadest range of experimental conditions and used twocompletely different techniques. Results obtained by these two techniques were incomplete agreement. Results of the earlier temperature dependent studies of Molinaet al. (1977) and Kurylo (1977) and the room temperature studies of Adler-Golden andWiesenfeld (1981) and Tyndall et al. (1997) are in good agreement with the preferred20
values.Using the long-path absorption apparatus to monitor NO3 radicals, Goldfarb et
al. (1998) measured the yield of the NO3 radical produced in this reaction to be ap-
2362

ACPD6, 2281–2702, 2006
Evaluated kinetic andphotochemical data
for atmosphericchemistry
R. Atkinson et al.
Title Page
Abstract Introduction
Conclusions References
Tables Figures
J I
J I
Back Close
Full Screen / Esc
Printer-friendly Version
Interactive Discussion
EGU
proximately unity. Allowing for uncertainties in the measurements Goldfarb et al. (1998)concluded that NO3 and ClO radicals are the primary products of this reaction and ac-count for at least 70% of the reaction over the temperature range studied (248 K to298 K).
References5
Adler-Golden, S. M. and Wiesenfeld, J. R.: Chem. Phys. Lett., 82, 281, 1981.Goldfarb, L., Harwood, M. H., Burkholder, J. B., and Ravishankara, A. R.: J. Phys.Chem. A, 102, 8556, 1998.Kurylo, M. J.: Chem. Phys. Lett., 49, 467, 1977.Molina, L. T., Spencer, J. E., and Molina, M. J.: Chem. Phys. Lett., 45, 158, 1977.10
Ravishankara, A. R., Davis, D. D., Smith, G., Tesi, G., and Spencer, J.: Geophys. Res.Lett., 4, 7, 1977.Tyndall, G. S., Kegley-Owen, C. S., Orlando, J. J., and Calvert, J. G.: J. Chem. Soc.Faraday Trans., 93, 2675, 1997.
15
2363

ACPD6, 2281–2702, 2006
Evaluated kinetic andphotochemical data
for atmosphericchemistry
R. Atkinson et al.
Title Page
Abstract Introduction
Conclusions References
Tables Figures
J I
J I
Back Close
Full Screen / Esc
Printer-friendly Version
Interactive Discussion
EGU
III.A2.22
Cl + H2 → HCl + H
∆H◦ = 4.4 kJ·mol−1
Rate coefficient data
5
k/cm3 molecule−1 s−1 Temp./K Reference Technique/Comments
Absolute Rate Coefficients2.0 × 10−11 exp[-(2164 ± 101)/T ] 251–456 Westenberg and de Haas, 1968 DF-EPR(1.35 ± 0.07) × 10−14 297(1.26 ± 0.10) × 10−14 298 Davis et al., 1970 FP-RF (a)5.5 × 10⁻¹¹ exp[-(2391 ± 50)/T ] 213–350 Watson et al., 1975 FP-RF(1.80 ± 0.2) × 10−14 2982.66 × 10−11 exp[-(2230 ± 60)/T ] 200–500 Lee et al., 1977 FP-RF(1.77 ± 0.13) × 10−14 3023.65 × 10−11 exp[-(2310 ± 20)/T ] 199–499 Miller and Gordon, 1981 FP-RF(1.49 ± 0.07) × 10−14 298.1±0.56.00 × 10−11 exp[-(2470 ± 100)/T ] 297–425 Kita and Stedman, 1982 DF-RF(1.46 ± 0.22) × 10−14 2974.4 × 10−11 exp(−2568/T ) 291–1283 Adusei and Fontijn, 1994, FP/PLP-RF8.1 × 10−15 291(1.68 ± 0.22) × 10−14 296 Kumaran et al., 1994 PLP-RA (b)
2364
ACPD6, 2281–2702, 2006
Evaluated kinetic andphotochemical data
for atmosphericchemistry
R. Atkinson et al.
Title Page
Abstract Introduction
Conclusions References
Tables Figures
J I
J I
Back Close
Full Screen / Esc
Printer-friendly Version
Interactive Discussion
EGU
Comments
(a) Rate coefficient has been decreased by 10%, as recommended by the NASAevaluation panel (NASA, 1997).
(b) Rate coefficients also measured over the temperature range 699–2939 K, anda combination of the 296 K and 699–2939 K rate coefficients resulted in k=5
4.78×10⁻¹⁶ T 1.58 exp(−1610/T ) cm3 molecule−1 s−1.
Preferred Values
k = 1.7 × 10⁻¹⁴ cm3 molecule−1 s−1 at 298 K.k = 3.9 × 10⁻¹¹ exp(−2310/T ) cm3 molecule−1 s−1 over the temperature range 200–10
310 K.
Reliability
∆ log k = ± 0.1 at 298 K.∆ (E/R) = ± 200 K.
Comments on Preferred Values15
The preferred values are derived from a least-squares fit to the rate coefficientsmeasured at ≤302 K by Watson et al. (1975), Lee et al. (1977), Miller and Gordon(1981), Kita and Stedman (1982) and Kumaran et al. (1994). The results of these stud-ies are in excellent agreement below ∼300 K; at higher temperatures the data are inpoorer agreement. The two studies of Miller and Gordon (1981) and Kita and Stedman20
(1982) have measured both the forward and reverse rates and have shown that the rate
2365
ACPD6, 2281–2702, 2006
Evaluated kinetic andphotochemical data
for atmosphericchemistry
R. Atkinson et al.
Title Page
Abstract Introduction
Conclusions References
Tables Figures
J I
J I
Back Close
Full Screen / Esc
Printer-friendly Version
Interactive Discussion
EGU
coefficient ratio agrees with equilibrium constant data. The room temperature rate co-efficients of Adusei and Fontijn (1994) are in reasonable agreement with the preferredvalues.
References
Adusei, G. Y. and Fontijn, A.: 25th International Symposium on Combustion, 1994; The5
Combustion Institute, Pittsburgh, PA, pp. 801–808, 1994.Davis, D. D., Braun, W., and Bass, A. M.: Int. J. Chem. Kinet., 2, 101, 1970.Kita, D. and Stedman, D. H.: J. Chem. Soc. Faraday Trans., 2 78, 1249, 1982.Kumaran, S. S., Lim, K. P., and Michael, J. V.: J. Chem. Phys., 101, 9487, 1994.Lee, J. H., Michael, W. A., Payne, Stief, L. J., and Whytock, D. A.: J. Chem. Soc.10
Faraday Trans. 1, 73, 1530, 1977.Miller, J. C. and Gordon, R. J.: J. Chem. Phys., 75, 5305, 1981.NASA: Evaluation No. 12, 1997 (see references in Introduction).Watson, R. T., Machado, E. S., Schiff, R. L., Fischer, S., and Davis, D. D.: Proceedingsof the 4th CIAP Conference, DOT-OST-75, 1975.15
Westenberg, A. A. and de Haas, N.: J. Chem. Phys., 48, 4405, 1968.
2366

ACPD6, 2281–2702, 2006
Evaluated kinetic andphotochemical data
for atmosphericchemistry
R. Atkinson et al.
Title Page
Abstract Introduction
Conclusions References
Tables Figures
J I
J I
Back Close
Full Screen / Esc
Printer-friendly Version
Interactive Discussion
EGU
III.A2.23
Cl + HO2 → HCl + O2 (1)→ ClO + HO (2)
∆H◦(1) = −228.2 kJ·mol−1
∆H◦(2) = 2.9 kJ·mol−1
5
Rate coefficient data (k=k1+k2)
k/cm3 molecule−1 s−1 Temp./K Reference Technique/Comments
Absolute Rate Coefficients(4.23 ± 0.07) × 10−11 250–414 Lee and Howard, 1982 DF-LMR (a)k1 = (4.4 ± 1.5) × 10−11 308 Cattell and Cox, 1986 MM(b)k2 = (9.4 ± 1.9) × 10−12 3083.8 × 10−11 exp[(40 ± 90)/T ] 230–360 Riffault et al., 2001 DF-MS (c)(4.4 ± 0.5) × 10−11 300k2 = 8.6 × 10⁻¹¹ exp[-(660 ± 100)/T ] 230–360k2 = (9.9 ± 2.8) × 10−12 295
Branching Ratiok2/k = 1.09 exp(−478/T ) 250–414 Lee and Howard, 1982 DF-LMR (a)
Comments
(a) On the basis of the temperature independent overall rate coefficient andthe temperature dependent branching ratio, the authors derived the rate10
2367

ACPD6, 2281–2702, 2006
Evaluated kinetic andphotochemical data
for atmosphericchemistry
R. Atkinson et al.
Title Page
Abstract Introduction
Conclusions References
Tables Figures
J I
J I
Back Close
Full Screen / Esc
Printer-friendly Version
Interactive Discussion
EGU
coefficient expressions k1=1.8× 10⁻¹¹ exp[(170±80)/T ] cm3 molecule−1 s−1 andk2=4.1×10⁻¹¹ exp[-(450±60)/T ] cm3 molecule−1 s−1.
(b) Rate coefficients were derived from the observed time-concentration behavior ofHO2 and ClO radicals using computer simulations and a 25-step reaction mecha-nism. Because of uncertainties in the Cl atom concentrations, the rate coefficients5
k1 and k2 cited above (for 1 bar total pressure) may be low by a factor of 2 andhigh by a factor of 2, respectively (Cattell and Cox, 1986). The reaction was alsostudied over the pressure range 67 mbar to 1013 mbar, and no pressure depen-dence of either k1 or k2 over this range was evident.
(c) k was determined under pseudo-first order conditions with either HO2 or10
Cl in excess. Because the reported weak temperature dependence is notsignificantly different from zero, a temperature independent rate coefficientk=(4.4±0.6)×10−11 cm3 molecule−1 s−1, was also reported for the temperaturerange 230–360 K. k2 was determined from the formation kinetics of both OH andClO.15
Preferred Values
k1 = 3.4 × 10⁻¹¹ cm3 molecule−1 s−1 at 298 K.k2 = 9.3 × 10⁻¹² cm3 molecule−1 s−1 at 298 K.k = 4.3 × 10⁻¹¹ cm3 molecule−1 s−1, over the temperature range 230–420 K.k2 = 6.3 × 10⁻¹¹ exp(−570/T ) cm3 molecule−1 s−1, independent of temperature over20
the range 230–420 K.
Reliability
∆ log k1 = ± 0.2 at 298 K.∆ log k2 = ± 0.2 at 298 K.
2368

ACPD6, 2281–2702, 2006
Evaluated kinetic andphotochemical data
for atmosphericchemistry
R. Atkinson et al.
Title Page
Abstract Introduction
Conclusions References
Tables Figures
J I
J I
Back Close
Full Screen / Esc
Printer-friendly Version
Interactive Discussion
EGU
∆ (E2/R) = ± 200 K.
Comments on Preferred Values
The preferred values for k1 and k2 are based on results of the direct studies ofLee and Howard (1982) and Riffault et al. (2001) which are in very good agreement.The total rate coefficient is temperature independent over the range 230 K to 420 K5
with a value of 4.3×10⁻¹¹ cm3 molecule−1 s−1, and the room temperature results ofCattell and Cox (1986) are in agreement with this recommendation. Based on thecombined results of these studies, neither channel shows any pressure dependencebetween 1 mbar and 1 bar showing that stabilization of the HOOCl∗ intermediate doesnot occur, the two bimolecular channels making up the entire reaction pathway. The10
preferred Arrhenius expression for k2 is based on the mean of the E/R values from thetemperature dependence studies of Lee and Howard (1982) and Riffault et al. (2001),combined with a pre-exponential factor adjusted to give the preferred value of k2 at298 K. Dobis and Benson (1993) report a total rate coefficient in good agreement withthis recommendation but a significantly lower value of the branching ratio k2/k. Results15
of earlier indirect studies (Leu and DeMore, 1976; Poulet et al., 1978; Burrows et al.,1979; Cox, 1980) were not used in the evaluation of the preferred values.
References
Burrows, J. P., Cliff, D. I., Harris, G. W., Thrush, B. A., and Wilkinson, J. P. T. : Proc.Roy. Soc. (London) A368, 463, 1979.20
Cattell, F. C. and Cox, R. A.: J. Chem. Soc. Faraday Trans. 2, 82, 1413, 1986.Cox, R. A.: Int. J. Chem. Kinet., 12, 649, 1980.Dobis, O. and Benson, S. W.: J. Am. Chem. Soc., 115, 8798, 1993.Lee, Y.-P. and Howard, C. J.: J. Chem. Phys., 77, 756, 1982.Leu, M.-T. and DeMore, W. B.: Chem. Phys. Lett., 41, 121, 1976.25
2369

ACPD6, 2281–2702, 2006
Evaluated kinetic andphotochemical data
for atmosphericchemistry
R. Atkinson et al.
Title Page
Abstract Introduction
Conclusions References
Tables Figures
J I
J I
Back Close
Full Screen / Esc
Printer-friendly Version
Interactive Discussion
EGU
Poulet, G., Le Bras, G., and Combourieu, J.: J. Chem. Phys., 69, 767, 1978.Riffault, V., Bedjanian, Y., and Le Bras, G.: Int. J. Chem. Kinet., 33, 317, 2001.
2370
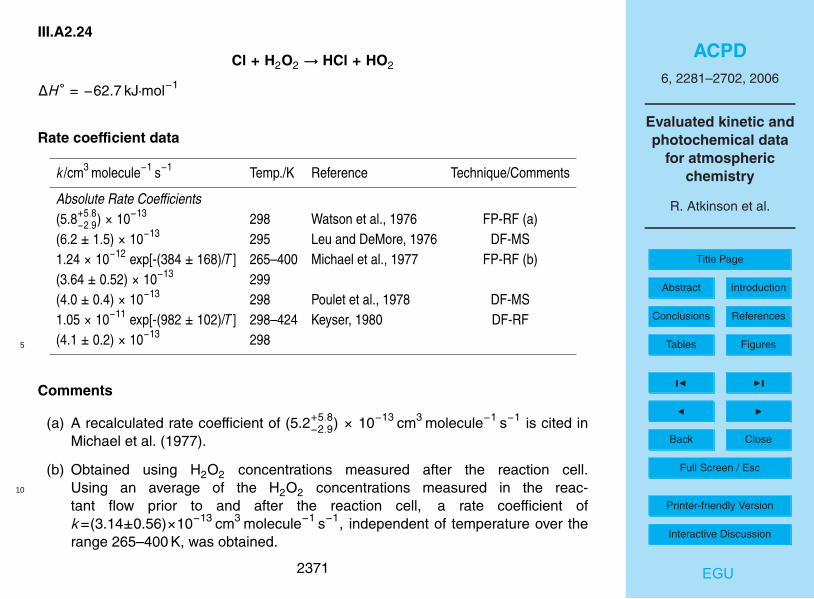
ACPD6, 2281–2702, 2006
Evaluated kinetic andphotochemical data
for atmosphericchemistry
R. Atkinson et al.
Title Page
Abstract Introduction
Conclusions References
Tables Figures
J I
J I
Back Close
Full Screen / Esc
Printer-friendly Version
Interactive Discussion
EGU
III.A2.24
Cl + H2O2 → HCl + HO2
∆H◦ = −62.7 kJ·mol−1
Rate coefficient data
k/cm3 molecule−1 s−1 Temp./K Reference Technique/Comments
Absolute Rate Coefficients(5.8+5.8
−2.9) × 10−13 298 Watson et al., 1976 FP-RF (a)(6.2 ± 1.5) × 10−13 295 Leu and DeMore, 1976 DF-MS1.24 × 10−12 exp[-(384 ± 168)/T ] 265–400 Michael et al., 1977 FP-RF (b)(3.64 ± 0.52) × 10−13 299(4.0 ± 0.4) × 10−13 298 Poulet et al., 1978 DF-MS1.05 × 10−11 exp[-(982 ± 102)/T ] 298–424 Keyser, 1980 DF-RF(4.1 ± 0.2) × 10−13 2985
Comments
(a) A recalculated rate coefficient of (5.2+5.8−2.9) × 10−13 cm3 molecule−1 s−1 is cited in
Michael et al. (1977).
(b) Obtained using H2O2 concentrations measured after the reaction cell.Using an average of the H2O2 concentrations measured in the reac-10
tant flow prior to and after the reaction cell, a rate coefficient ofk=(3.14±0.56)×10−13 cm3 molecule−1 s−1, independent of temperature over therange 265–400 K, was obtained.
2371
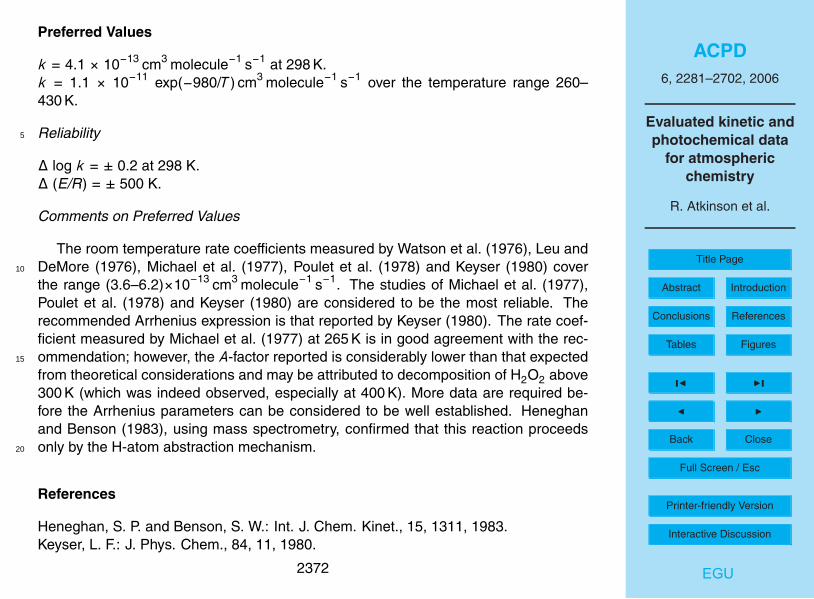
ACPD6, 2281–2702, 2006
Evaluated kinetic andphotochemical data
for atmosphericchemistry
R. Atkinson et al.
Title Page
Abstract Introduction
Conclusions References
Tables Figures
J I
J I
Back Close
Full Screen / Esc
Printer-friendly Version
Interactive Discussion
EGU
Preferred Values
k = 4.1 × 10⁻¹³ cm3 molecule−1 s−1 at 298 K.k = 1.1 × 10⁻¹¹ exp(−980/T ) cm3 molecule−1 s−1 over the temperature range 260–430 K.
Reliability5
∆ log k = ± 0.2 at 298 K.∆ (E/R) = ± 500 K.
Comments on Preferred Values
The room temperature rate coefficients measured by Watson et al. (1976), Leu andDeMore (1976), Michael et al. (1977), Poulet et al. (1978) and Keyser (1980) cover10
the range (3.6–6.2)×10−13 cm3 molecule−1 s−1. The studies of Michael et al. (1977),Poulet et al. (1978) and Keyser (1980) are considered to be the most reliable. Therecommended Arrhenius expression is that reported by Keyser (1980). The rate coef-ficient measured by Michael et al. (1977) at 265 K is in good agreement with the rec-ommendation; however, the A-factor reported is considerably lower than that expected15
from theoretical considerations and may be attributed to decomposition of H2O2 above300 K (which was indeed observed, especially at 400 K). More data are required be-fore the Arrhenius parameters can be considered to be well established. Heneghanand Benson (1983), using mass spectrometry, confirmed that this reaction proceedsonly by the H-atom abstraction mechanism.20
References
Heneghan, S. P. and Benson, S. W.: Int. J. Chem. Kinet., 15, 1311, 1983.Keyser, L. F.: J. Phys. Chem., 84, 11, 1980.
2372

ACPD6, 2281–2702, 2006
Evaluated kinetic andphotochemical data
for atmosphericchemistry
R. Atkinson et al.
Title Page
Abstract Introduction
Conclusions References
Tables Figures
J I
J I
Back Close
Full Screen / Esc
Printer-friendly Version
Interactive Discussion
EGU
Leu, M.-T. and DeMore, W. B. : Chem. Phys. Lett., 41, 121, 1976.Michael, J. V., Whytock, D. A., Lee, J. H., Payne, W. A., and Stief, L. J. : J. Chem.Phys., 67, 3533, 1977.Poulet, G., Le Bras, G., and Combourieu, J.: Chem. Phys., 69, 767, 1978.Watson, R., Machado, G., Fischer, S., and Davis, D. D.: J. Chem. Phys., 65, 2126,5
1976.
2373
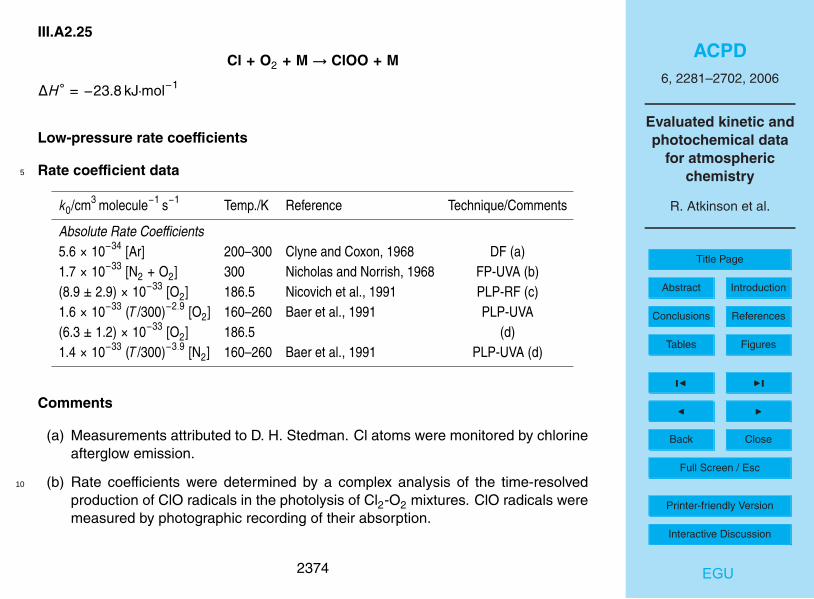
ACPD6, 2281–2702, 2006
Evaluated kinetic andphotochemical data
for atmosphericchemistry
R. Atkinson et al.
Title Page
Abstract Introduction
Conclusions References
Tables Figures
J I
J I
Back Close
Full Screen / Esc
Printer-friendly Version
Interactive Discussion
EGU
III.A2.25
Cl + O2 + M→ ClOO + M
∆H◦ = −23.8 kJ·mol−1
Low-pressure rate coefficients
Rate coefficient data5
k0/cm3 molecule−1 s−1 Temp./K Reference Technique/Comments
Absolute Rate Coefficients5.6 × 10−34 [Ar] 200–300 Clyne and Coxon, 1968 DF (a)1.7 × 10⁻³³ [N2 + O2] 300 Nicholas and Norrish, 1968 FP-UVA (b)(8.9 ± 2.9) × 10−33 [O2] 186.5 Nicovich et al., 1991 PLP-RF (c)1.6 × 10⁻³³ (T /300)−2.9 [O2] 160–260 Baer et al., 1991 PLP-UVA(6.3 ± 1.2) × 10−33 [O2] 186.5 (d)1.4 × 10⁻³³ (T /300)−3.9 [N2] 160–260 Baer et al., 1991 PLP-UVA (d)
Comments
(a) Measurements attributed to D. H. Stedman. Cl atoms were monitored by chlorineafterglow emission.
(b) Rate coefficients were determined by a complex analysis of the time-resolved10
production of ClO radicals in the photolysis of Cl2-O2 mixtures. ClO radicals weremeasured by photographic recording of their absorption.
2374

ACPD6, 2281–2702, 2006
Evaluated kinetic andphotochemical data
for atmosphericchemistry
R. Atkinson et al.
Title Page
Abstract Introduction
Conclusions References
Tables Figures
J I
J I
Back Close
Full Screen / Esc
Printer-friendly Version
Interactive Discussion
EGU
(c) Photolysis of Cl2-O2 mixtures at 181–200 K and with O2 pressures of 20–53 mbar. Detection of Cl(2P3/2) atoms. An equilibrium constant for the reaction of
Kp=18.9 bar−1 was determined at 185.4 K.
(d) Photolysis of Cl2-O2-M mixtures with M=He, Ar, O2 and N2, with detection ofClOO radicals. Redetermination of the ClOO radical absorption cross-sections5
gave σ(248 nm)=3.4×10⁻¹⁷ cm2 molecule−1. Measurements over the tempera-ture range 160–260 K and the pressure range 1–1000 bar were in agreement withthe data of Mauldin et al. (1992). Negligible deviations from third-order behaviorwere observed at pressures below 10 bar. At higher pressures, an anomaloustransition to a high pressure plateau was observed. This and the anomalously10
strong temperature dependence suggest that the reaction proceeds on a radical-complex instead of the usual energy transfer mechanism. An equilibrium constantof Kp=5.3×10⁻⁶ exp(23.4 kJ mol−1/RT ) bar−1 was determined over the tempera-ture range 180 K to 300 K.
Preferred Values15
k0 = 1.4 × 10⁻³³ (T /300)−3.9 [N2] cm3 molecule−1 s−1 over the temperature range 160–300 K.k0 = 1.6 × 10⁻³³ (T /300)−2.9 [O2] cm3 molecule−1 s−1 over the temperature range 160–300 K.
Reliability20
∆ log k0 = ± 0.2 at 200 K.∆ n = ± 1.
2375
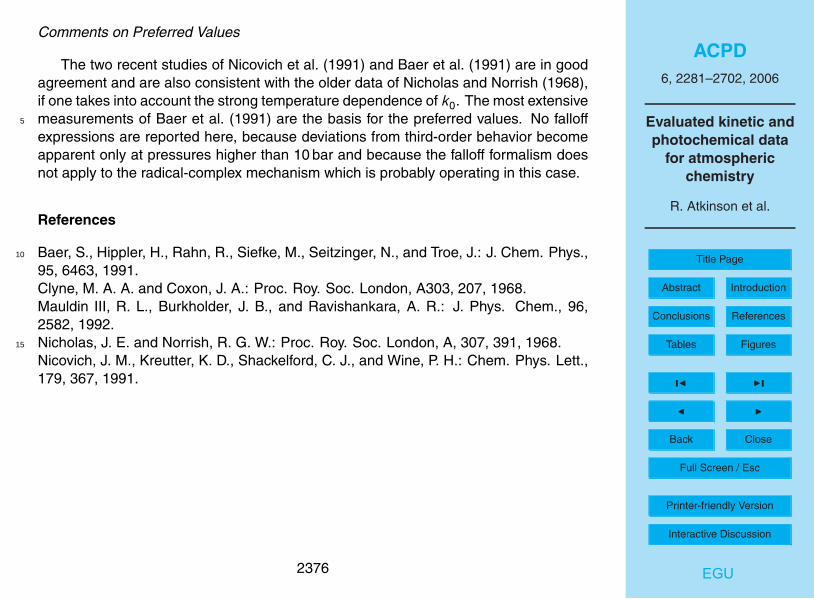
ACPD6, 2281–2702, 2006
Evaluated kinetic andphotochemical data
for atmosphericchemistry
R. Atkinson et al.
Title Page
Abstract Introduction
Conclusions References
Tables Figures
J I
J I
Back Close
Full Screen / Esc
Printer-friendly Version
Interactive Discussion
EGU
Comments on Preferred Values
The two recent studies of Nicovich et al. (1991) and Baer et al. (1991) are in goodagreement and are also consistent with the older data of Nicholas and Norrish (1968),if one takes into account the strong temperature dependence of k0. The most extensivemeasurements of Baer et al. (1991) are the basis for the preferred values. No falloff5
expressions are reported here, because deviations from third-order behavior becomeapparent only at pressures higher than 10 bar and because the falloff formalism doesnot apply to the radical-complex mechanism which is probably operating in this case.
References
Baer, S., Hippler, H., Rahn, R., Siefke, M., Seitzinger, N., and Troe, J.: J. Chem. Phys.,10
95, 6463, 1991.Clyne, M. A. A. and Coxon, J. A.: Proc. Roy. Soc. London, A303, 207, 1968.Mauldin III, R. L., Burkholder, J. B., and Ravishankara, A. R.: J. Phys. Chem., 96,2582, 1992.Nicholas, J. E. and Norrish, R. G. W.: Proc. Roy. Soc. London, A, 307, 391, 1968.15
Nicovich, J. M., Kreutter, K. D., Shackelford, C. J., and Wine, P. H.: Chem. Phys. Lett.,179, 367, 1991.
2376

ACPD6, 2281–2702, 2006
Evaluated kinetic andphotochemical data
for atmosphericchemistry
R. Atkinson et al.
Title Page
Abstract Introduction
Conclusions References
Tables Figures
J I
J I
Back Close
Full Screen / Esc
Printer-friendly Version
Interactive Discussion
EGU
III.A2.26
ClOO + M→ Cl + O2 + M
∆H◦ = 23.8 kJ·mol−1
Low-pressure rate coefficients
Rate coefficient data5
k0/s−1 Temp./K Reference Technique/Comments
Absolute Rate Coefficients1.9 × 10−14 [O2] 185.4 Nicovich et al., 1991 PLP-RF (a)2.8 × 10⁻¹⁰ exp(−1820/T ) [N2] 160–260 Baer et al., 1991 PLP-UVA6.2 × 10−13 [N2] 298∗ (a)6.3 × 10⁻¹⁰ exp(−2030/T ) [O2] 160–260 Baer et al., 1991 PLP-UVA1.1 × 10−14 [O2] 185.4 (a)
Comments
(a) From measurements of the reverse reaction and the equilibrium constant.
Preferred Values
k0 = 6.2 × 10⁻¹³ [N2] s−1 at 298 K.10
k0 = 2.8 × 10⁻¹⁰ exp(−1820/T ) [N2] s−1 over the temperature range 160–300 K.
2377

ACPD6, 2281–2702, 2006
Evaluated kinetic andphotochemical data
for atmosphericchemistry
R. Atkinson et al.
Title Page
Abstract Introduction
Conclusions References
Tables Figures
J I
J I
Back Close
Full Screen / Esc
Printer-friendly Version
Interactive Discussion
EGU
Reliability
∆ log k0 = ± 0.3 at 298 K.∆ (E/R) = ± 200 K.
Comments on Preferred Values
The preferred values are based on the extensive data of Baer et al. (1991). No devi-5
ations from third-order behavior were observed at pressures below 1 bar. The reactionprobably does not proceed via an energy-transfer mechanism (see comments on thereverse reaction Cl+O2+M→ ClOO+M), but rather by a radical-complex mechanism.
References
Baer, S., Hippler, H., Rahn, R., Siefke, M., Seitzinger, N., and Troe, J.: J. Chem. Phys.,10
95, 6463, 1991.Nicovich, J. M., Kreutter, K. D., Shackelford, C. J., and Wine, P. H.: Chem. Phys. Lett.,179, 367, 1991.
2378

ACPD6, 2281–2702, 2006
Evaluated kinetic andphotochemical data
for atmosphericchemistry
R. Atkinson et al.
Title Page
Abstract Introduction
Conclusions References
Tables Figures
J I
J I
Back Close
Full Screen / Esc
Printer-friendly Version
Interactive Discussion
EGU
III.A2.27
Cl + CO + M→ ClCO + M
∆H◦ = 32.6 kJ·mol−1
Low-pressure rate coefficients
Rate coefficient data5
k0/cm3 molecule−1 s−1 Temp./K Reference Technique/Comments
Absolute Rate Coefficients(9.1 ± 3.0) × 10−34 [Ar] 300 Clark et al., 1966 DF (a)1.05 × 10⁻³⁴ exp[(810 ± 70)/T ] [N2] 185–260 Nicovich et al., 1990 PLP-RF (b)1.6 × 10⁻³³ [N2] 298
Relative Rate Coefficients(1.4 ± 0.3) × 10−33 [N2] 298 Hewitt et al., 1996 (c)
Comments
(a) Cl atoms were generated from the photolysis of Cl2-He mixtures and were mea-sured by titration with nitrosyl chloride using the red chlorine afterglow spectrum.The total pressure was 2.7–5.3 mbar. From additional experiments carried out at10
195 K, an activation energy of about −8.4 kJ mol−1 was obtained.
(b) Pulsed laser photolysis of Cl2-CO-M (M=N2, CO, Ar and CO2) mixtures at355 nm. The pressure was 19–267 mbar. By second- and third-law analy-ses of the temperature dependence of the equilibrium constant, a value of∆H◦(298 K)=−(32.2±2.5) kJ mol−1 was derived. The relative collision efficiencies15
were βc(CO2) : βc(CO/N2) : βc(Ar)=3.2 : 1.0 : 0.8.
2379

ACPD6, 2281–2702, 2006
Evaluated kinetic andphotochemical data
for atmosphericchemistry
R. Atkinson et al.
Title Page
Abstract Introduction
Conclusions References
Tables Figures
J I
J I
Back Close
Full Screen / Esc
Printer-friendly Version
Interactive Discussion
EGU
(c) Steady state photolysis of Cl2 in the presence of CO and a reference gas (CH4 orCHCl3). Long-path FTIR spectroscopy of CO and CO2. Measurements of k0 in1 bar of air at 298 K relative to k(Cl+CH4)=1.0×10⁻¹³ cm3 molecule−1 s−1.
Preferred Values
k0 = 1.3 × 10⁻³³ (T /300)−3.8 [N2] cm3 molecule−1 s−1 over the temperature range 180–5
300 K.
Reliability
∆ log k0 = ± 0.3 at 298 K.∆ n = ± 1.
Comments on Preferred Values10
The recommended rate coefficients are based on the measurements of Nicovichet al. (1990) which agree well with the relative rate measurements from Hewitt etal. (1996). No signs of deviations from third-order behavior were detected.
References
Clark, T. C., Clyne, M. A. A., and Stedman, D. H.: Trans. Faraday Soc., 62, 3354,15
1966.Hewitt, A. D., Brahan, K. M., Boone, G. D., and Hewitt, S. A.: Int. J. Chem. Kinet., 28,765, 1996.Nicovich, J. M., Kreutter, K. D., and Wine, P. H.: J. Chem. Phys., 92, 3539, 1990.
20
2380

ACPD6, 2281–2702, 2006
Evaluated kinetic andphotochemical data
for atmosphericchemistry
R. Atkinson et al.
Title Page
Abstract Introduction
Conclusions References
Tables Figures
J I
J I
Back Close
Full Screen / Esc
Printer-friendly Version
Interactive Discussion
EGU
III.A2.28
ClCO + M→ Cl + CO + M
∆H◦ = 32.6 kJ·mol−1
Low-pressure rate coefficients
Rate coefficient data5
k0/s−1 Temp./K Reference Technique/Comments
Absolute Rate Coefficients4.1 × 10−10 exp[-(2960 ± 160)/T ] [N2] 185–260 Nicovich et al., 1990 PLP-RF (a)
Comments
(a) Pulsed laser photolysis of Cl2-CO-M (M=N2, CO, Ar and CO2) mixtures at355 nm. The pressure was 19–267 mbar. By second- and third-law analy-ses of the temperature dependence of the equilibrium constant, a value of10
∆H◦(298 K)=(32.2±2.5) kJ mol−1 was derived. The relative collision efficiencieswere βc(CO2) : βc(CO/N2) : βc(Ar) = 3.2 : 1.0 : 0.8.
Preferred Values
k0 = 2.0 × 10⁻¹⁴ [N2] s−1 at 298 K.k0 = 4.1 × 10⁻¹⁰ exp(−2960/T ) [N2] s−1 over the temperature range 180–300 K.15
2381

ACPD6, 2281–2702, 2006
Evaluated kinetic andphotochemical data
for atmosphericchemistry
R. Atkinson et al.
Title Page
Abstract Introduction
Conclusions References
Tables Figures
J I
J I
Back Close
Full Screen / Esc
Printer-friendly Version
Interactive Discussion
EGU
Reliability
∆ log k0 = ± 0.4 at 298 K.∆ (E/R) = ± 200 K.
Comments on Preferred Values
The preferred rate coefficients are based on the study of Nicovich et al. (1990).5
References
Nicovich, J. M., Kreutter, K. D., and Wine, P. H.: J. Chem. Phys., 92, 3539, 1990.
2382

ACPD6, 2281–2702, 2006
Evaluated kinetic andphotochemical data
for atmosphericchemistry
R. Atkinson et al.
Title Page
Abstract Introduction
Conclusions References
Tables Figures
J I
J I
Back Close
Full Screen / Esc
Printer-friendly Version
Interactive Discussion
EGU
III.A2.29
Cl + O3 → ClO + O2
∆H◦ = −162.4 kJ·mol−1
2383
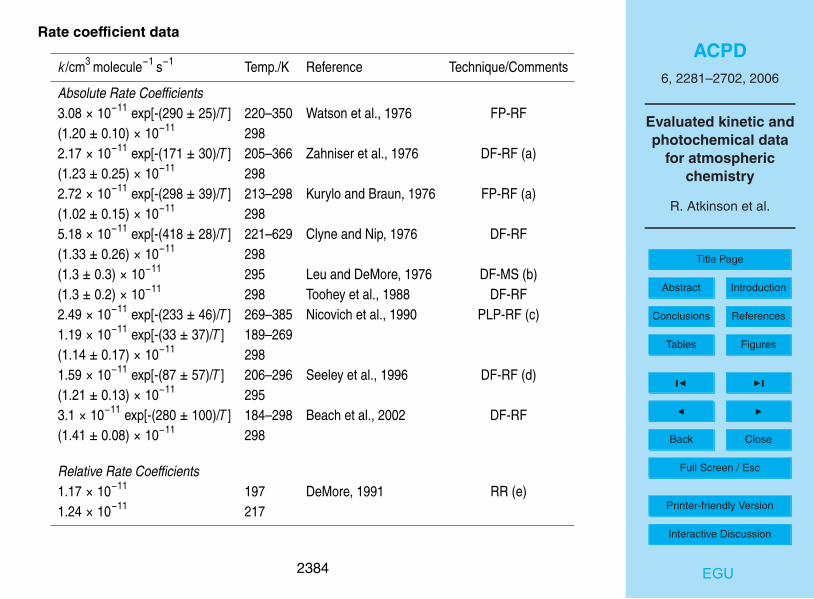
ACPD6, 2281–2702, 2006
Evaluated kinetic andphotochemical data
for atmosphericchemistry
R. Atkinson et al.
Title Page
Abstract Introduction
Conclusions References
Tables Figures
J I
J I
Back Close
Full Screen / Esc
Printer-friendly Version
Interactive Discussion
EGU
Rate coefficient data
k/cm3 molecule−1 s−1 Temp./K Reference Technique/Comments
Absolute Rate Coefficients3.08 × 10−11 exp[-(290 ± 25)/T ] 220–350 Watson et al., 1976 FP-RF(1.20 ± 0.10) × 10−11 2982.17 × 10−11 exp[-(171 ± 30)/T ] 205–366 Zahniser et al., 1976 DF-RF (a)(1.23 ± 0.25) × 10−11 2982.72 × 10−11 exp[-(298 ± 39)/T ] 213–298 Kurylo and Braun, 1976 FP-RF (a)(1.02 ± 0.15) × 10−11 2985.18 × 10−11 exp[-(418 ± 28)/T ] 221–629 Clyne and Nip, 1976 DF-RF(1.33 ± 0.26) × 10−11 298(1.3 ± 0.3) × 10−11 295 Leu and DeMore, 1976 DF-MS (b)(1.3 ± 0.2) × 10−11 298 Toohey et al., 1988 DF-RF2.49 × 10−11 exp[-(233 ± 46)/T ] 269–385 Nicovich et al., 1990 PLP-RF (c)1.19 × 10⁻¹¹ exp[-(33 ± 37)/T ] 189–269(1.14 ± 0.17) × 10−11 2981.59 × 10−11 exp[-(87 ± 57)/T ] 206–296 Seeley et al., 1996 DF-RF (d)(1.21 ± 0.13) × 10−11 2953.1 × 10−11 exp[-(280 ± 100)/T ] 184–298 Beach et al., 2002 DF-RF(1.41 ± 0.08) × 10−11 298
Relative Rate Coefficients1.17 × 10−11 197 DeMore, 1991 RR (e)1.24 × 10⁻¹¹ 217
2384

ACPD6, 2281–2702, 2006
Evaluated kinetic andphotochemical data
for atmosphericchemistry
R. Atkinson et al.
Title Page
Abstract Introduction
Conclusions References
Tables Figures
J I
J I
Back Close
Full Screen / Esc
Printer-friendly Version
Interactive Discussion
EGU
Comments
(a) The A-factors tabulated are ∼8% lower than those originally reported due to arevision of the value used for the O3 absorption cross-sections.
(b) Discharge flow system with MS detection of O3.
(c) A change in slope of the Arrhenius plot was observed at ∼270 K. The data were5
fitted to two separate Arrhenius expressions over the temperature ranges 189–269 K and 269–385 K.
(d) Turbulent flow conditions were used with total pressures in the range 66 mbar to330 mbar.
(e) Competitive chlorination of O3-CH4 mixtures. Cl atoms were produced by the10
photolysis of Cl2 at 300 nm to 400 nm. The measured rate coefficient ratiosk(Cl+O3)/k(Cl+CH4) are placed on an absolute basis using a rate coefficientof k(Cl+CH4)=6.6×10⁻¹² exp(−1240/T ) cm3 molecule−1 s−1 (Vanderzanden andBirks, 1982).
Preferred Values15
k = 1.2 × 10⁻¹¹ cm3 molecule−1 s−1 at 298 K.k = 2.8 × 10⁻¹¹ exp(−250/T ) cm3 molecule−1 s−1 over the temperature range 180–300 K.
Reliability
∆ log k = ± 0.06 at 298 K.20
∆ (E/R) = +100−150 K.
2385

ACPD6, 2281–2702, 2006
Evaluated kinetic andphotochemical data
for atmosphericchemistry
R. Atkinson et al.
Title Page
Abstract Introduction
Conclusions References
Tables Figures
J I
J I
Back Close
Full Screen / Esc
Printer-friendly Version
Interactive Discussion
EGU
Comments on Preferred Values
The majority of the rate coefficients for this reaction have been obtained at temper-atures at and below 298 K, and our evaluation is restricted to that temperature regime.The preferred value of k at 298 K is the mean of the absolute room temperature ratecoefficients of Watson et al. (1976), Zahniser et al. (1976), Kurylo and Braun (1976),5
Clyne and Nip (1976), Leu and DeMore (1976), Toohey et al. (1988), Nicovich etal. (1990) and Seeley et al. (1996), all of which are in excellent agreement. In therecent study of Beach et al. (2002) a slightly but significantly higher value was obtainedat 298 K, but the Arrhenius expression for k derived by Beach et al. (2002) from theresults over the whole temperature range covered gives a value of k(298 K) in excellent10
agreement with the recommended value. The Arrhenius temperature dependence ofk is obtained from a least-squares fit to all of the data at and below 298 K from thestudies of Watson et al. (1976), Zahniser et al. (1976), Kurylo and Braun (1976), Clyneand Nip (1976), Leu and DeMore (1976), Toohey et al. (1988) and Beach et al. (2002).This temperature dependence is combined with a pre-exponential factor adjusted to fit15
the value of k at 298 K.Nicovich et al. (1990) observed non-Arrhenius behavior in the temperature range
studied (189 K to 385 K). The data of Nicovich et al. (1990) are in excellent agreementwith the present recommendation above ∼250 K; at lower temperatures their data arehigher than the recommendation although still within the stated uncertainty down to20
∼220 K.Vanderzanden and Birks (1982) have interpreted their observation of oxygen
atoms in this system as evidence for some production (0.1% to 0.5%) of O2(1Σg) inthis reaction. The possible production of singlet molecular oxygen in this reaction hasalso been discussed by DeMore (1981) in connection with the Cl2 photosensitized de-25
composition of ozone. However, Choo and Leu (1985) were unable to detect O2 (1Σ)or O2 (1∆) in the Cl+O3 system and set upper limits to the branching ratios for theirproduction of 5×10⁻⁴ and 2.5×10⁻², respectively. A crossed molecular beam study
2386
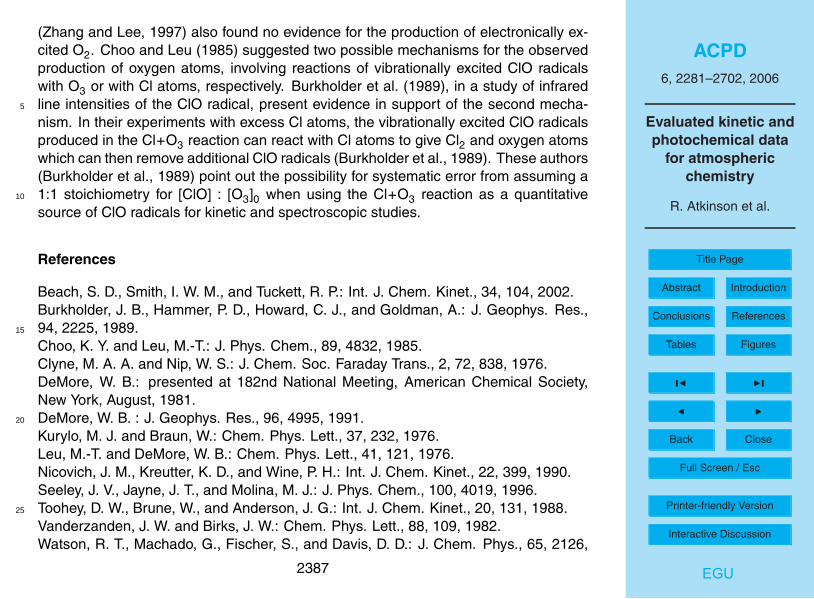
ACPD6, 2281–2702, 2006
Evaluated kinetic andphotochemical data
for atmosphericchemistry
R. Atkinson et al.
Title Page
Abstract Introduction
Conclusions References
Tables Figures
J I
J I
Back Close
Full Screen / Esc
Printer-friendly Version
Interactive Discussion
EGU
(Zhang and Lee, 1997) also found no evidence for the production of electronically ex-cited O2. Choo and Leu (1985) suggested two possible mechanisms for the observedproduction of oxygen atoms, involving reactions of vibrationally excited ClO radicalswith O3 or with Cl atoms, respectively. Burkholder et al. (1989), in a study of infraredline intensities of the ClO radical, present evidence in support of the second mecha-5
nism. In their experiments with excess Cl atoms, the vibrationally excited ClO radicalsproduced in the Cl+O3 reaction can react with Cl atoms to give Cl2 and oxygen atomswhich can then remove additional ClO radicals (Burkholder et al., 1989). These authors(Burkholder et al., 1989) point out the possibility for systematic error from assuming a1:1 stoichiometry for [ClO] : [O3]0 when using the Cl+O3 reaction as a quantitative10
source of ClO radicals for kinetic and spectroscopic studies.
References
Beach, S. D., Smith, I. W. M., and Tuckett, R. P.: Int. J. Chem. Kinet., 34, 104, 2002.Burkholder, J. B., Hammer, P. D., Howard, C. J., and Goldman, A.: J. Geophys. Res.,94, 2225, 1989.15
Choo, K. Y. and Leu, M.-T.: J. Phys. Chem., 89, 4832, 1985.Clyne, M. A. A. and Nip, W. S.: J. Chem. Soc. Faraday Trans., 2, 72, 838, 1976.DeMore, W. B.: presented at 182nd National Meeting, American Chemical Society,New York, August, 1981.DeMore, W. B. : J. Geophys. Res., 96, 4995, 1991.20
Kurylo, M. J. and Braun, W.: Chem. Phys. Lett., 37, 232, 1976.Leu, M.-T. and DeMore, W. B.: Chem. Phys. Lett., 41, 121, 1976.Nicovich, J. M., Kreutter, K. D., and Wine, P. H.: Int. J. Chem. Kinet., 22, 399, 1990.Seeley, J. V., Jayne, J. T., and Molina, M. J.: J. Phys. Chem., 100, 4019, 1996.Toohey, D. W., Brune, W., and Anderson, J. G.: Int. J. Chem. Kinet., 20, 131, 1988.25
Vanderzanden, J. W. and Birks, J. W.: Chem. Phys. Lett., 88, 109, 1982.Watson, R. T., Machado, G., Fischer, S., and Davis, D. D.: J. Chem. Phys., 65, 2126,
2387

ACPD6, 2281–2702, 2006
Evaluated kinetic andphotochemical data
for atmosphericchemistry
R. Atkinson et al.
Title Page
Abstract Introduction
Conclusions References
Tables Figures
J I
J I
Back Close
Full Screen / Esc
Printer-friendly Version
Interactive Discussion
EGU
1976.Zahniser, M. S., Kaufman, F., and Anderson, J. G.: Chem. Phys. Lett., 37, 226, 1976.Zhang, J. and Lee, Y. T.: J. Phys. Chem. A, 101, 6485, 1997.
2388

ACPD6, 2281–2702, 2006
Evaluated kinetic andphotochemical data
for atmosphericchemistry
R. Atkinson et al.
Title Page
Abstract Introduction
Conclusions References
Tables Figures
J I
J I
Back Close
Full Screen / Esc
Printer-friendly Version
Interactive Discussion
EGU
III.A2.30
Cl + HONO2 → HCl + NO3
∆H◦ = −4.8 kJ·mol−1
Rate coefficient data
k/cm3 molecule−1 s−1 Temp./K Reference Technique/Comments
Absolute Rate Coefficients<5.0 × 10⁻¹⁶ 293 Zagogianni et al., 1987 DF-EPR<2.0 × 10⁻¹⁶ 298 Wine et al., 1988 PLP-AS (a)5
Comments
(a) Pulsed laser photolysis of Cl2-HNO3-He mixtures at 351 nm. NO3 radical concen-trations were monitored using long-path absorption spectroscopy. Experiments inwhich Cl atom concentrations were measured by resonance fluorescence werealso carried out, but were less sensitive and resulted in higher upper limits to10
the rate coefficient, of k<1.3×10⁻¹⁵ cm3 molecule−1 s−1 at 298 K and k<1.0×10⁻¹⁵ cm3 molecule−1 s−1 at 400 K.
Preferred Values
k < 2 × 10⁻¹⁶ cm3 molecule−1 s−1 at 298 K.
2389

ACPD6, 2281–2702, 2006
Evaluated kinetic andphotochemical data
for atmosphericchemistry
R. Atkinson et al.
Title Page
Abstract Introduction
Conclusions References
Tables Figures
J I
J I
Back Close
Full Screen / Esc
Printer-friendly Version
Interactive Discussion
EGU
Comments on Preferred Values
The preferred upper limit to the rate coefficient is that obtained by Wine et al. (1988),which receives support from the slightly higher value obtained by Zagogianni etal. (1987). Values from earlier studies (Leu and DeMore, 1976; Clark et al., 1982;Kurylo et al., 1983) are well above the preferred upper limit to the rate coefficient k.5
References
Clark, R. H., Husain, D., and Jezequel, J. Y.: J. Photochem., 18, 39, 1982.Kurylo, M. J., Murphy, J. L., and Knable, G. L.: Chem. Phys. Lett., 94, 281, 1983.Leu, M.-T. and DeMore, W. B.: Chem. Phys. Lett., 41, 121,1976.Wine, P. H., Wells, J. R., and Nicovich, J. M.: J. Phys. Chem., 92, 2223, 1988.10
Zagogianni, H., Mellouki, A., and Poulet, G.: C. R. Acad. Sci., Series 2, 304, 573, 1987.
2390

ACPD6, 2281–2702, 2006
Evaluated kinetic andphotochemical data
for atmosphericchemistry
R. Atkinson et al.
Title Page
Abstract Introduction
Conclusions References
Tables Figures
J I
J I
Back Close
Full Screen / Esc
Printer-friendly Version
Interactive Discussion
EGU
III.A2.31
Cl + NO3 → ClO + NO2
∆H◦ = −60.2 kJ·mol−1
Rate coefficient data
k/cm3 molecule−1 s−1 Temp./K Reference Technique/Comments
Absolute Rate Coefficients(2.6 ± 0.5) × 10−11 298 Mellouki et al., 1987 DF-EPR/MS(2.26 ± 0.17) × 10−11 298 Becker et al., 1991 DF-MS5
Preferred Values
k = 2.4 × 10⁻¹¹ cm3 molecule−1 s−1, independent of temperature over the range 200–300 K.
Reliability10
∆ log k = ± 0.2 at 298 K.∆ (E/R) = ± 400 K.
Comments on Preferred Values
The preferred value at room temperature is based on the studies of Mellouki etal. (1987) and Becker et al. (1991). The results of these direct absolute rate studies15
are preferred over those of earlier relative rate studies (Cox et al., 1984; Burrows et al.,
2391

ACPD6, 2281–2702, 2006
Evaluated kinetic andphotochemical data
for atmosphericchemistry
R. Atkinson et al.
Title Page
Abstract Introduction
Conclusions References
Tables Figures
J I
J I
Back Close
Full Screen / Esc
Printer-friendly Version
Interactive Discussion
EGU
1985; Cox et al., 1987) in which NO3 was monitored in the photolysis of Cl2-ClONO2-N2 mixtures. The agreement among these earlier studies (Cox et al., 1984; Burrowset al., 1985; Cox et al., 1987) is not good and probably arises from complications inthe chemistry of the systems used. This radical-radical reaction is expected to havea negligible temperature dependence, which is consistent with the results of Cox et5
al. (1987) over the temperature range 278 K to 338 K.
References
Becker, E., Wille, U., Rahman, M. M., and Schindler, R. N.: Ber. Bunsenges. Phys.Chem., 95, 1173, 1991.Burrows, J. P., Tyndall, G. S., and Moortgat, G. K. : J. Phys. Chem., 89, 4848, 1985.10
Cox, R. A., Barton, R. A., Ljungstrøm, E., and Stocker, D. W.: Chem. Phys. Lett., 108,228, 1984.Cox, R. A., Fowles, M., Moulton, D., and Wayne, R. P.: J. Phys. Chem., 91, 3361,1987.Mellouki, A., Le Bras, G., and Poulet, G.: J. Phys. Chem., 91, 5760, 1987.15
2392

ACPD6, 2281–2702, 2006
Evaluated kinetic andphotochemical data
for atmosphericchemistry
R. Atkinson et al.
Title Page
Abstract Introduction
Conclusions References
Tables Figures
J I
J I
Back Close
Full Screen / Esc
Printer-friendly Version
Interactive Discussion
EGU
III.A2.32
Cl + OClO→ ClO + ClO
∆H◦ = −12.6 kJ·mol−1
Rate coefficient data
k/cm3 molecule−1 s−1 Temp./K Reference Technique/Comments
Absolute Rate Coefficients>8.3 × 10⁻¹³ 298 Clyne and Coxon, 1968 DF-UVA(8.5 ± 1.2) × 10−12 ∼298 Basco and Dogra, 1971 FP-UVA(5.9 ± 0.9) × 10−11 298–588 Bemand et al., 1973 DF-RF/MS (a)3.0 × 10⁻¹¹ exp(174/T ) 229–428 Toohey, 1988 DF-RF (b)(5.44 ± 0.09) × 10−11 298
Relative Rate Coefficients3.7 × 10−10 exp[-(3020 ± 101)/T ] 338–365 Gritsan et al., 1975 (c)5
Comments
(a) Discharge flow system with resonance fluorescence detection of Cl atom decayin excess OClO and MS measurement of OClO decay in excess Cl.
(b) The measured rate coefficients (cm3 molecule−1 s−1) were: 229 K,(6.28±0.21)×10−11; 247 K, (6.12±0.20)×10−11; 268 K, (5.6±0.30) ×10−11;10
298 K, (5.44±0.09)×10−11; 367 K, (4.84±0.24)×10−11; and 428 K, (4.40±0.17)×10−11. A unit-weighted least-squares analysis of these data, using the Arrheniusexpression, leads to k=3.0×10⁻¹¹ exp(174/T ) cm3 molecule−1 s−1.
2393

ACPD6, 2281–2702, 2006
Evaluated kinetic andphotochemical data
for atmosphericchemistry
R. Atkinson et al.
Title Page
Abstract Introduction
Conclusions References
Tables Figures
J I
J I
Back Close
Full Screen / Esc
Printer-friendly Version
Interactive Discussion
EGU
(c) Thermal decomposition of OClO. Complex chemical system.
Preferred Values
k = 5.7 × 10⁻¹¹ cm3 molecule−1 s−1 at 298 K.k = 3.2 × 10⁻¹¹ exp(170/T ) cm3 molecule−1 s−1 over the temperature range 220–430 K.
Reliability5
∆ log k = ± 0.1 at 298 K.∆ (E/R) = ± 200 K.
Comments on Preferred Values
The data of Toohey (1988) agree well with the earlier study of Bemand et al. (1973)at 298 K, but show a small negative temperature dependence over a similar tempera-10
ture range to that over which Bemand et al. (1973) saw little change in k. The preferredvalue is the average of the 298 K values from the two studies of Bemand et al. (1973)and Toohey (1988) and the temperature dependence of Toohey (1988) is accepted butwith error limits covering the possibility that k is independent of temperature. The ear-lier data of Clyne and Coxon (1968) and Basco and Dogra (1971) are rejected following15
the recommendation of Bemand et al. (1973).
References
Basco, N. and Dogra, S. K.: Proc. Roy. Soc. (London), A323, 417, 1971.Bemand, P. P., Clyne, M. A. A., and Watson, R. T.: J. Chem. Soc. Faraday Trans., 1,69, 1356, 1973.20
Clyne, M. A. A. and Coxon, J. A.: Proc. Roy. Soc. (London), A303, 207, 1968.
2394
ACPD6, 2281–2702, 2006
Evaluated kinetic andphotochemical data
for atmosphericchemistry
R. Atkinson et al.
Title Page
Abstract Introduction
Conclusions References
Tables Figures
J I
J I
Back Close
Full Screen / Esc
Printer-friendly Version
Interactive Discussion
EGU
Gritsan, V. I., Panfilov, V. N., and Sukhanov, I. L.: Reaction Kinetics and CatalysisLetters, 2, 265, 1975.Toohey, D. W.: Kinetic and Mechanistic Studies of Reactions of Bromine and ChlorineSpecies Important in the Earth’s Stratosphere, Ph.D. Thesis, Harvard University,Cambridge, MA, 1988.5
2395
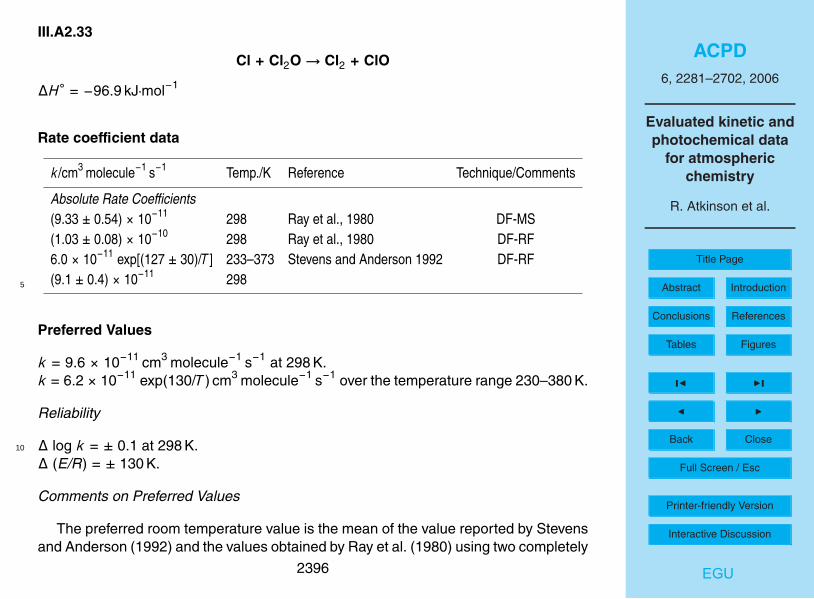
ACPD6, 2281–2702, 2006
Evaluated kinetic andphotochemical data
for atmosphericchemistry
R. Atkinson et al.
Title Page
Abstract Introduction
Conclusions References
Tables Figures
J I
J I
Back Close
Full Screen / Esc
Printer-friendly Version
Interactive Discussion
EGU
III.A2.33
Cl + Cl2O→ Cl2 + ClO
∆H◦ = −96.9 kJ·mol−1
Rate coefficient data
k/cm3 molecule−1 s−1 Temp./K Reference Technique/Comments
Absolute Rate Coefficients(9.33 ± 0.54) × 10−11 298 Ray et al., 1980 DF-MS(1.03 ± 0.08) × 10−10 298 Ray et al., 1980 DF-RF6.0 × 10−11 exp[(127 ± 30)/T ] 233–373 Stevens and Anderson 1992 DF-RF(9.1 ± 0.4) × 10−11 2985
Preferred Values
k = 9.6 × 10⁻¹¹ cm3 molecule−1 s−1 at 298 K.k = 6.2 × 10⁻¹¹ exp(130/T ) cm3 molecule−1 s−1 over the temperature range 230–380 K.
Reliability
∆ log k = ± 0.1 at 298 K.10
∆ (E/R) = ± 130 K.
Comments on Preferred Values
The preferred room temperature value is the mean of the value reported by Stevensand Anderson (1992) and the values obtained by Ray et al. (1980) using two completely
2396

ACPD6, 2281–2702, 2006
Evaluated kinetic andphotochemical data
for atmosphericchemistry
R. Atkinson et al.
Title Page
Abstract Introduction
Conclusions References
Tables Figures
J I
J I
Back Close
Full Screen / Esc
Printer-friendly Version
Interactive Discussion
EGU
independent techniques. This value is confirmed by the relative rate study of Burrowsand Cox (1981). The much lower value reported earlier by Basco and Dogra (1971)has been rejected. The recommended temperature dependence is from Stevens andAnderson (1992). There is apparently no pressure dependence over the range 1 mbarto 1 bar (Ray et al., 1980; Stevens and Anderson, 1992; Burrows and Cox, 1981).5
References
Basco, N. and Dogra, S. K.: Proc. Roy. Soc. London A, 323, 401, 1971.Burrows, J. P. and Cox, R. A.: J. Chem. Soc. Faraday Trans., 1, 77, 2465, 1981.Ray, G. W., Keyser, L. F., and Watson, R. T.: J. Phys. Chem., 84, 1674, 1980.Stevens, P. S. and Anderson, J. G.: J. Phys. Chem., 96, 1708, 1992.10
2397

ACPD6, 2281–2702, 2006
Evaluated kinetic andphotochemical data
for atmosphericchemistry
R. Atkinson et al.
Title Page
Abstract Introduction
Conclusions References
Tables Figures
J I
J I
Back Close
Full Screen / Esc
Printer-friendly Version
Interactive Discussion
EGU
III.A2.34
Cl + Cl2O2 → Cl2 + ClOO
∆H◦ = −151.4 kJ·mol−1
Rate coefficient data
k/cm3 molecule−1 s−1 Temp./K Reference Technique/Comments
Absolute Rate Coefficients(1.00 ± 0.02) × 10−10 233 Cox and Hayman, 1988 (a)5
Comments
(a) Static photolysis of Cl2-Cl2O-N2 mixtures at 350 nm. The time depen-dence of [Cl2O2] and [Cl2O] were monitored by photodiode array UV spec-troscopy, yielding k(Cl+Cl2O)/2k=0.54±0.01 at 233 K. This rate coefficientratio is placed on an absolute basis by use of a rate coefficient of10
k(Cl+Cl2O)=1.08×10⁻¹⁰ cm3 molecule−1 s−1 at 233 K (this evaluation).
Preferred Values
k = 1.0 × 10⁻¹⁰ cm3 molecule−1 s−1 independent of temperature over the range 230–300 K.
Reliability15
∆ log k = ± 0.3 at 298 K.∆ (E/R) = ± 300 K.
2398

ACPD6, 2281–2702, 2006
Evaluated kinetic andphotochemical data
for atmosphericchemistry
R. Atkinson et al.
Title Page
Abstract Introduction
Conclusions References
Tables Figures
J I
J I
Back Close
Full Screen / Esc
Printer-friendly Version
Interactive Discussion
EGU
Comments on Preferred Values
The preferred values are based on the relative rate study of Cox and Hayman(1988) which is supported by the unpublished rate coefficient of Friedl (1991) of(1.0±0.4)×10−10 cm3 molecule−1 s−1 at 298 K. The agreement of the room tempera-ture value and that at 233 K along with the high value of k precludes a significant5
temperature dependence.
References
Cox, R. A. and Hayman, G. D.: Nature, 332, 796, 1988.Friedl, R. R.: unpublished data, 1991.
10
2399

ACPD6, 2281–2702, 2006
Evaluated kinetic andphotochemical data
for atmosphericchemistry
R. Atkinson et al.
Title Page
Abstract Introduction
Conclusions References
Tables Figures
J I
J I
Back Close
Full Screen / Esc
Printer-friendly Version
Interactive Discussion
EGU
III.A2.35
Cl + ClONO2 → Cl2 + NO3
∆H◦ = −70.5 kJ·mol−1
Rate coefficient data
k/cm3 molecule−1 s−1 Temp./K Reference Technique/Comments
Absolute Rate Coefficients6.3 × 10−12 exp(150/T ) 219–298 Margitan, 1983 FP-RF (a)(1.04 ± 0.16) × 10−11 2987.3 × 10−12 exp(165/T ) 220–296 Kurylo et al., 1983 FP-RF (b)(1.20 ± 0.24) × 10−11 2966.0 × 10−12 exp[(140 ± 30)/T ] 195–298 Yokelson et al., 1995 PLP-RF/TDLS (c)(9.6 ± 1.0) × 10−12 298(9.1 ± 1.2) × 10−12 298 Tyndall et al., 1997 PLP-RF5
Comments
(a) The O(3P) atom abstraction channel to give ClO+ClONO was shown to be unim-portant based on results of experiments with added NO, in which Cl was notregenerated by the fast reaction ClO+NO→ Cl+NO2.
(b) Supersedes earlier results from the same laboratory (Kurylo and Manning, 1977).10
(c) Decays of Cl atoms were measured by RF over the temperature range 195–354 K(k=6.5×10⁻¹² exp[(120±20)/T ] cm3 molecule−1 s−1) and formation of NO3 radi-cals were measured by tunable diode laser spectroscopy (TDLS) over the temper-
2400

ACPD6, 2281–2702, 2006
Evaluated kinetic andphotochemical data
for atmosphericchemistry
R. Atkinson et al.
Title Page
Abstract Introduction
Conclusions References
Tables Figures
J I
J I
Back Close
Full Screen / Esc
Printer-friendly Version
Interactive Discussion
EGU
ature range 200–298 K (k=6.0×10⁻¹² exp[(140±30)/T ] cm3 molecule−1 s−1). Thevalues cited in the table are the combined results of experiments using both de-tection systems for the temperature range 195–298 K.
Preferred Values
k = 1.0 × 10⁻¹¹ cm3 molecule−1 s−1 at 298 K.5
k = 6.2 × 10⁻¹² exp(145/T ) cm3 molecule−1 s−1 over the temperature range 190–360 K.
Reliability
∆ log k = ± 0.1 at 298 K.∆ (E/R) = ± 50 K.
Comments on Preferred Values10
The recommended Arrhenius equation is derived from the studies of Margitan(1983) and Yokelson et al. (1995), which are in excellent agreement. The data of Kuryloet al. (1983) and Tyndall et al. (1997) agree with the preferred values within the rec-ommended uncertainty limits. Margitan (1983) has shown that the reaction proceedsby Cl-atom abstraction rather than by O-atom abstraction and this was confirmed by15
Yokelson et al. (1995), who determined that more than 95% of the reaction formed Cl2and NO3 at 298 K.
References
Kurylo, M. J. and Manning, R. G.: Chem. Phys. Lett., 48, 279, 1977.Kurylo, M. J., Knable, G. L., and Murphy, J. L.: Chem. Phys. Lett., 95, 9, 1983.20
Margitan, J. J.: J. Phys. Chem., 87, 674, 1983.
2401
ACPD6, 2281–2702, 2006
Evaluated kinetic andphotochemical data
for atmosphericchemistry
R. Atkinson et al.
Title Page
Abstract Introduction
Conclusions References
Tables Figures
J I
J I
Back Close
Full Screen / Esc
Printer-friendly Version
Interactive Discussion
EGU
Tyndall, G. S., Kegley-Owen, C. S., Orlando, J. J., and Calvert, J. G.: J. Chem. Soc.Faraday Trans., 93, 2675, 1997.Yokelson, R. J., Burkholder, J. B., Goldfarb, L., Fox, R. W., Gilles, M. K., and Ravis-hankara, A. R.: J. Phys. Chem., 99, 13 976, 1995.
5
2402
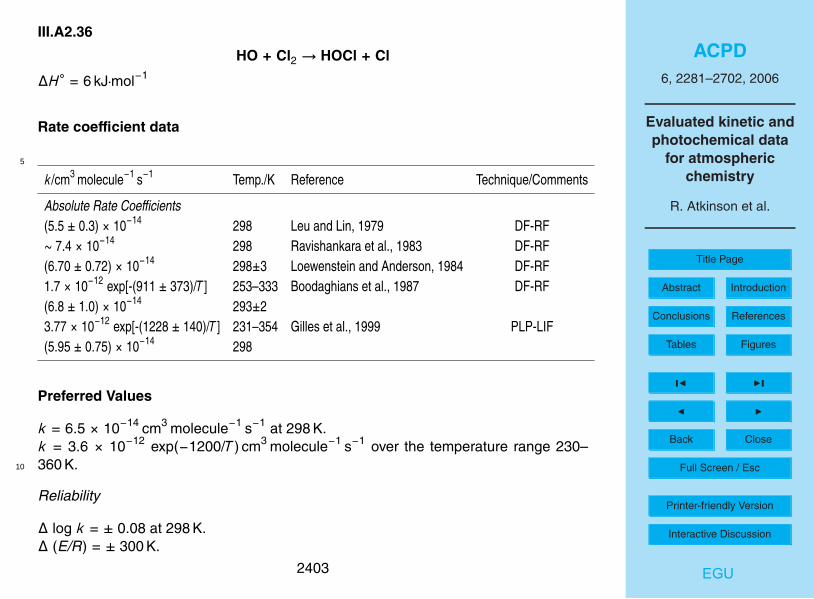
ACPD6, 2281–2702, 2006
Evaluated kinetic andphotochemical data
for atmosphericchemistry
R. Atkinson et al.
Title Page
Abstract Introduction
Conclusions References
Tables Figures
J I
J I
Back Close
Full Screen / Esc
Printer-friendly Version
Interactive Discussion
EGU
III.A2.36
HO + Cl2 → HOCl + Cl
∆H◦ = 6 kJ·mol−1
Rate coefficient data
5
k/cm3 molecule−1 s−1 Temp./K Reference Technique/Comments
Absolute Rate Coefficients(5.5 ± 0.3) × 10−14 298 Leu and Lin, 1979 DF-RF∼ 7.4 × 10⁻¹⁴ 298 Ravishankara et al., 1983 DF-RF(6.70 ± 0.72) × 10−14 298±3 Loewenstein and Anderson, 1984 DF-RF1.7 × 10−12 exp[-(911 ± 373)/T ] 253–333 Boodaghians et al., 1987 DF-RF(6.8 ± 1.0) × 10−14 293±23.77 × 10⁻¹² exp[-(1228 ± 140)/T ] 231–354 Gilles et al., 1999 PLP-LIF(5.95 ± 0.75) × 10−14 298
Preferred Values
k = 6.5 × 10⁻¹⁴ cm3 molecule−1 s−1 at 298 K.k = 3.6 × 10⁻¹² exp(−1200/T ) cm3 molecule−1 s−1 over the temperature range 230–360 K.10
Reliability
∆ log k = ± 0.08 at 298 K.∆ (E/R) = ± 300 K.
2403

ACPD6, 2281–2702, 2006
Evaluated kinetic andphotochemical data
for atmosphericchemistry
R. Atkinson et al.
Title Page
Abstract Introduction
Conclusions References
Tables Figures
J I
J I
Back Close
Full Screen / Esc
Printer-friendly Version
Interactive Discussion
EGU
Comments on Preferred Values
The preferred values are based on the data of Loewenstein and Anderson (1984),Boodaghians et al. (1987) and Gilles et al. (1999), which are in good agreement con-cerning the room temperature rate coefficient. Because of the wider temperature rangecovered and more extensive study conducted, the preferred temperature dependence5
is that reported by Gilles et al. (1999) with the pre-exponential factor, A, being adjustedto fit the preferred 298 K rate coefficient. Loewenstein and Anderson (1984) determinedthat the exclusive products are HOCl+Cl.
References
Boodaghians, R. B., Hall, I. W., and Wayne, R. P.: J. Chem. Soc. Faraday Trans., 2 83,10
529, 1987.Gilles, M. K., Burkholder, J. B., and Ravishankara, A. R.: Int. J. Chem. Kinet., 31, 417,1999.Leu, M. T. and Lin, C. L.: Geophys. Res. Lett., 6, 425, 1979.Loewenstein, L. M. and Anderson, J. G.: J. Phys. Chem., 88, 6277, 1984.15
Ravishankara, A. R., Eisele, F. L., and Wine, P. H.: J. Chem. Phys., 78, 1140, 1983.
2404
ACPD6, 2281–2702, 2006
Evaluated kinetic andphotochemical data
for atmosphericchemistry
R. Atkinson et al.
Title Page
Abstract Introduction
Conclusions References
Tables Figures
J I
J I
Back Close
Full Screen / Esc
Printer-friendly Version
Interactive Discussion
EGU
III.A2.37
HO + HCl→ H2O + Cl
∆H◦ = −65.4 kJ·mol−1
2405

ACPD6, 2281–2702, 2006
Evaluated kinetic andphotochemical data
for atmosphericchemistry
R. Atkinson et al.
Title Page
Abstract Introduction
Conclusions References
Tables Figures
J I
J I
Back Close
Full Screen / Esc
Printer-friendly Version
Interactive Discussion
EGU
Rate coefficient data
k/cm3 molecule−1 s−1 Temp./K Reference Technique/Comments
Absolute Rate Coefficients(6.4 ± 0.7) × 10−13 295 Takacs and Glass, 1973 DF-EPR4.1 × 10−12 exp[-(529 ± 24)/T ] 220–480 Smith and Zellner, 1974 FP-RA(6.9 ± 1) × 10−13 2982.0 × 10−12 exp[-(312 ± 10)/T ] 224–440 Zahniser et al., 1974 DF-RF(6.7 ± 0.4) × 10−13 297(6.6 ± 1.7) × 10−13 293 Hack et al., 1977 DF-EPR (a)3.3 × 10⁻¹² exp[-(472 ± 40)/T ] 250–402 Ravishankara et al., 1977 FP-RF(6.6 ± 0.4) × 10−13 298(6.66 ± 0.52) × 10−13 300 Husain et al., 1981 FP-RF(6.8 ± 0.25) × 10−13 298±4 Cannon et al., 1984 FP-LIF2.1 × 10−12 exp[-(285 ± 40)/T ] 258–334 Keyser, 1984 DF-RF(7.9 ± 0.4) × 10−13 295±24.6 × 10⁻¹² exp[-(500 ± 60)/T ] 240–295 Molina et al., 1984 PLP/FP-RF(8.5 ± 1.5) × 10−13 2952.94 × 10−12 exp[-(446 ± 32)/T ] 300–700 Husain et al., 1984 FP-RF(6.7 ± 0.46) × 10−13 3002.4 × 10−12 exp[-(327 ± 28)/T ] 240–363 Ravishankara et al., 1985 FP-RF/PLP-RF/(8.01 ± 0.44) × 10−13 298 PLP-LIF (b)(7.8 ± 0.3) × 10−13 298 Sharkey and Smith, 1993 PLP-LIF(5.4 ± 0.25) × 10−13 216(5.6 ± 0.45) × 10−13 178(5.2 ± 0.3) × 10−13 1383.28 × 10−17 T 1.66 exp(184/T ) 200–400 Battin-Leclerc et al., 1999 PLP-LIF (c)(7.96 ± 0.60) × 10−13 298
2406

ACPD6, 2281–2702, 2006
Evaluated kinetic andphotochemical data
for atmosphericchemistry
R. Atkinson et al.
Title Page
Abstract Introduction
Conclusions References
Tables Figures
J I
J I
Back Close
Full Screen / Esc
Printer-friendly Version
Interactive Discussion
EGU
Comments
(a) Rate coefficients also measured at 435 K and 567 K of 8.1×10⁻¹³ cm3 molecule−1 s−1 and 1.25×10⁻¹² cm3 molecule−1 s−1, respectively.
(b) Rate coefficients measured over the temperature range 240–1055 K. The Arrhe-nius plot of the rate coefficients measured over this extended temperature range5
is curved, with k=4.5×10⁻¹⁷ T 1.65 exp(112/T ) cm3 molecule−1 s−1 (Ravishankaraet al., 1985).
(c) Over the limited temperature range 200–298 K, the data were also fit to the Ar-rhenius expression, with k=1.7×10⁻¹² exp[-(225±20)/T ] cm3 molecule−1 s−1 (notethat the publication (Battin-Leclerc et al., 1999) gives a pre-exponential factor10
in the Arrhenius expression of 1.7×10⁻¹¹ cm3 molecule−1 s−1). Rate coefficientswere also measured for the reactions of the HO radical with DCl (252–387 K) andfor the reactions of the DO radical with HCl (213–372 K) and DCl (213–401 K).
Preferred Values
k = 8.0 × 10⁻¹³ cm3 molecule−1 s−1 at 298 K.15
k = 1.8 × 10⁻¹² exp(−240/T ) cm3 molecule−1 s−1 over the temperature range 200–300 K.
Reliability
∆ log k = ± 0.06 at 298 K.∆ (E/R) = ± 100 K.20
2407

ACPD6, 2281–2702, 2006
Evaluated kinetic andphotochemical data
for atmosphericchemistry
R. Atkinson et al.
Title Page
Abstract Introduction
Conclusions References
Tables Figures
J I
J I
Back Close
Full Screen / Esc
Printer-friendly Version
Interactive Discussion
EGU
Comments on Preferred Values
The studies of Keyser (1984), Molina et al. (1984), Ravishankara et al. (1985) andBattin-Leclerc et al. (1999), which paid careful attention to the HCl present in the ex-periments, all show room temperature values higher by about 20% to 25% than mostother studies (Takacs and Glass, 1973; Smith and Zellner, 1974; Zahniser et al., 1974;5
Hack et al., 1977; Ravishankara et al., 1977; Husain et al., 1981, 1984; Cannon et al.,1984). Ravishankara et al. (1985) showed that HCl losses can be a problem, leading toerroneously low measured rate coefficients, and this is a plausible cause of these dis-crepancies. The rate coefficients obtained in the recent and extensive study of Battin-Leclerc et al. (1999) are in good agreement with the data of Keyser (1984), Molina et10
al. (1984) and Ravishankara et al. (1985). The rate coefficients measured by Battin-Leclerc et al. (1999) at temperatures <240 K lead to a curved Arrhenius plot, in agree-ment with the previous study of Ravishankara et al. (1985) which extended to 1055 Kand in which non-Arrhenius behavior was also observed. The preferred temperature-dependent expression for the range 200–300 K is obtained by a linear least-squares15
fit to the ≤299 K data from the studies of Keyser (1984), Molina et al. (1984), Ravis-hankara et al. (1985) and Battin-Leclerc et al. (1999). Over more extended temperatureranges the three-parameter expression obtained by Battin-Leclerc et al. (1999) shouldbe used. Results of the low temperature study of Sharkey and Smith (1993) are in goodagreement with the recommended Arrhenius expression down to 216 K, but are (as ex-20
pected due to the non-Arrhenius behavior) significantly higher at 178 K and 138 K.
References
Battin-Leclerc, F., Kim, I. K., Talukdar, R. K., Portmann, R. W., Ravishankara, A. R.,Steckler, R., and Brown, D.: J. Phys. Chem. A, 103, 3237, 1999.Cannon, B. D., Robertshaw, J. S., Smith, I. W. M., and Williams, M. D.: Chem. Phys.25
Lett., 105, 380, 1984.
2408

ACPD6, 2281–2702, 2006
Evaluated kinetic andphotochemical data
for atmosphericchemistry
R. Atkinson et al.
Title Page
Abstract Introduction
Conclusions References
Tables Figures
J I
J I
Back Close
Full Screen / Esc
Printer-friendly Version
Interactive Discussion
EGU
Hack, W., Mex, G., and Wagner, H. G.: Ber. Bunsenges. Phys. Chem., 81, 677, 1977.Husain, D., Plane, J. M. C., and Slater, N. K. H.: J. Chem. Soc. Faraday Trans., 2 77,1949, 1981.Husain, D., Plane, J. M. C., and Xiang, C. C.: J. Chem. Soc. Faraday Trans., 2 80,713, 1984.5
Keyser, L. F.: J. Phys. Chem., 88, 4750, 1984.Molina, M. J., Molina, L. T., and Smith, C. A.: Int. J. Chem. Kinet., 16, 1151, 1984.Sharkey, P. and Smith, I. W. M.: J. Chem. Soc. Faraday Trans., 89, 631, 1993.Ravishankara, A. R., Smith, G., Watson, R. T., and Davis, D. D.: J. Phys. Chem., 81,2220, 1977.10
Ravishankara, A. R., Wine, P. H., Wells, J. R., and Thompson, R. L.: Int. J. Chem.Kinet., 17, 1281, 1985.Smith, I. W. M. and Zellner, R.: J. Chem. Soc. Faraday Trans., 2 70, 1045, 1974.Smith, I. W. M and Williams, M. D.: J. Chem. Soc. Faraday Trans., 2 82, 1043, 1986.Takacs, G. A. and Glass, G. P.: J. Phys. Chem., 77, 1948, 1973.15
Zahniser, M. S., Kaufman, F., and Anderson, J. G.: Chem. Phys. Lett., 27, 507, 1974.
2409

ACPD6, 2281–2702, 2006
Evaluated kinetic andphotochemical data
for atmosphericchemistry
R. Atkinson et al.
Title Page
Abstract Introduction
Conclusions References
Tables Figures
J I
J I
Back Close
Full Screen / Esc
Printer-friendly Version
Interactive Discussion
EGU
III.A2.38
HO + HOCl→ H2O + ClO
∆H◦ = −99.4 kJ·mol−1
Rate coefficient data
k/cm3 molecule−1 s−1 Temp./K Reference Technique/Comments
Absolute Rate Coefficients(1.7–9.5) × 10−13 298 Ennis and Birks, 1988 DF-RF/MS (a)5
Comments
(a) HO radical decays in the presence of excess HOCl were monitored by resonancefluorescence. HOCl concentrations were measured by MS. The effects of thepresence of Cl2O and Cl2 impurities in the HOCl and the occurrence of secondaryreactions were investigated through computer modeling, and the lower and upper10
limits to the rate coefficient k cited in the table obtained.
Preferred Values
k = 5.0 × 10⁻¹³ cm3 molecule−1 s−1 at 298 K.
Reliability
∆ log k = ± 0.5 at 298 K.15
2410

ACPD6, 2281–2702, 2006
Evaluated kinetic andphotochemical data
for atmosphericchemistry
R. Atkinson et al.
Title Page
Abstract Introduction
Conclusions References
Tables Figures
J I
J I
Back Close
Full Screen / Esc
Printer-friendly Version
Interactive Discussion
EGU
Comments on Preferred Values
The only reported experimental value (Ennis and Birks, 1988) has a largeuncertainty, and the preferred value is based on the mid-range value of5×10−13 cm3 molecule−1 s−1 at 298 K from this study.
References5
Ennis, C. A. and Birks, J. W.: J. Phys. Chem., 92, 1119, 1988.
2411

ACPD6, 2281–2702, 2006
Evaluated kinetic andphotochemical data
for atmosphericchemistry
R. Atkinson et al.
Title Page
Abstract Introduction
Conclusions References
Tables Figures
J I
J I
Back Close
Full Screen / Esc
Printer-friendly Version
Interactive Discussion
EGU
III.A2.39
HO + ClO → HO2 + Cl (1)→ HCl + O2 (2)
∆H◦(1) = −2.9 kJ·mol−1
∆H◦(2) = −231 kJ·mol−1
2412

ACPD6, 2281–2702, 2006
Evaluated kinetic andphotochemical data
for atmosphericchemistry
R. Atkinson et al.
Title Page
Abstract Introduction
Conclusions References
Tables Figures
J I
J I
Back Close
Full Screen / Esc
Printer-friendly Version
Interactive Discussion
EGU
Rate coefficient data (k=k1+k2)
k/cm3 molecule−1 s−1 Temp./K Reference Technique/Comments
Absolute Rate Coefficients(9.1 ± 1.3) × 10−12 298 Leu and Lin, 1979 DF-RF(1.17 ± 0.33) × 10−11 248–335 Ravishankara et al., 1983 DF-RF(1.19 ± 0.09) × 10−11 243–298 Burrows et al., 1984 DF-RF (a)8.0 × 10⁻¹² exp[(235 ± 46)/T ] 219–373 Hills and Howard, 1984 DF-LMR (b)(1.75 ± 0.31) × 10−11 298(1.94 ± 0.38) × 10−11 298 Poulet et al., 1986 DF-LIF (c) )5.5 × 10⁻¹² exp[(292 ± 72)/T ] 205–298 Lipson et al., 1997 DF-CIMS(1.46 ± 0.23) × 10−11 298k2 = 1.7 × 10⁻¹³ exp[(363 ± 50)/T ] 210–298 Lipson et al., 1997 DF-CIMS (d)k2 = 5.7 × 10⁻¹³ 2988.9 × 10−12 exp[(295 ± 95)/T ] 234–356 Kegley-Owen et al., 1999 DF (e)(2.44 ± 0.63) × 10−11 298k2 = 3.2 × 10⁻¹³ exp[(325 ± 60)/T ] 207–298 Lipson et al., 1999 F-CIMS (f)k2 = (9.5 ± 1.6) × 10−13 2986.7 × 10−12 exp[(360 ± 90)/T ] 230–360 Bedjanian et al., 2001 DF-MS (g)(2.2 ± 0.4) × 10−11 298k2 = 9.7 × 10⁻¹⁴ exp[(600 ± 120)/T ] 230–320k2 = (7.3 ± 2.2) × 10−13 2987.2 × 10−12 exp[(333 ± 70)/T ] 218–298 Wang and Keyser, 2001 DF-RF/UVA (h)(2.22 ± 0.33) × 10−11 298k2 = (1.25 ± 0.45) × 10−12 298 Tyndall et al., 2002 FP-IR (i)
Branching Ratiosk2/k = 0.05 ± 0.02 298 Lipson et al., 1997 DF-CIMS (j)k2/k = 0.06 ± 0.02 210k2/k = 0.090 ± 0.048 218–298 Wang and Keyser, 2001 DF-RF/IR/UVA (h,k)
2413

ACPD6, 2281–2702, 2006
Evaluated kinetic andphotochemical data
for atmosphericchemistry
R. Atkinson et al.
Title Page
Abstract Introduction
Conclusions References
Tables Figures
J I
J I
Back Close
Full Screen / Esc
Printer-friendly Version
Interactive Discussion
EGU
Comments
(a) Rate coefficient ratio of k1/k=0.85±0.07, independent of temperature over therange 243–298 K, was determined from measurement of HO2 radical concentra-tions (after conversion to HO radicals by reaction with NO).
(b) The rate coefficient ratio, k1/k, was measured to be k1/k=0.86±0.14 at 293 K5
from measurement of the HO2 radical concentrations by LMR.
(c) The rate coefficient ratio, k1/k, was measured to be 0.98±0.12 at 298 K from MSdetection of HCl.
(d) Measurements of the DCl product by CIMS in experiments using DO radicals. Theoverall rate coefficient measured for reaction of DO radicals with ClO radicals was10
k=4.2×10⁻¹² exp[(280±114)/T ] cm3 molecule−1 s−1 over the temperature range200 K to 298 K, a factor of 1.35–1.4 lower than the rate coefficient for the HOradical reaction.
(e) HO radicals were generated by pulsed laser photolysis of O3 (or ClO) at 248 nmand monitored by LIF. ClO radicals were generated by reaction of Cl atoms (pro-15
duced by a microwave discharge in Cl2-He mixtures) with O3, and monitored byUV/visible absorption.
(f) Turbulent flow reactor operated at total pressures of 125 mbar to 270 mbar. Themeasurements of the rate coefficients k2 were combined with the overall rate co-efficient k=5.5×10⁻¹² exp(292/T ) cm3 molecule−1 s−1 previously determined by20
the same research group (Lipson et al., 1997) to derive the branching ratiok2/k=0.07±0.03, independent of temperature (207–298 K) and total pressure(125–270 mbar).
(g) ClO generated from Cl+O3 (following discharge of Cl2 or F+Cl2). HO was gener-ated from H+NO2 (following discharge of H2). ClO concentrations were measured25
2414

ACPD6, 2281–2702, 2006
Evaluated kinetic andphotochemical data
for atmosphericchemistry
R. Atkinson et al.
Title Page
Abstract Introduction
Conclusions References
Tables Figures
J I
J I
Back Close
Full Screen / Esc
Printer-friendly Version
Interactive Discussion
EGU
directly at the parent peak. HO measured as HOBr+, following titration with Br2.Experiments carried out at 1 Torr under pseudo-first order conditions with ClO inexcess. Direct measurement of k2 from observed HCl formation is consistent withk2/k=0.035±0.010 over the temperature range 230–320 K.
(h) ClO generated from Cl+O3 (following discharge of Cl2). HO was generated either5
from F+H2O (following discharge of F2) or from H+NO2 (following discharge ofH2). ClO and HO concentrations measured by UV absorption and RF, respec-tively. Experiments carried out at 1.3 mbar under pseudo-first order conditionswith ClO in excess.
(i) ClO and HO generated from the 308 nm laser photolysis of Cl2-O3-H2O-He mix-10
tures at ∼40–55 mbar. Initial concentrations of ClO and HO calculated from laserfluence and precursor concentrations. HCl production determined using time-resolved tunable diode laser spectroscopy. k2 determined from simulation of theresults of experiments performed with a range of starting conditions.
(j) From the rate coefficients k2 and k for the DO radical reaction.15
(k) HCl measured using long-path tunable diode laser spectroscopy.
Preferred Values
k = 2.0 × 10⁻¹¹ cm3 molecule−1 s−1 at 298 K.k = 7.3 × 10⁻¹² exp(300/T ) cm3 molecule−1 s−1 over the temperature range 200–380 K.k2/k = 0.06, independent of temperature over the range 200–300 K.20
Reliability
∆ log k = ± 0.15 at 298 K.∆ (E/R) = ± 100 K.
2415

ACPD6, 2281–2702, 2006
Evaluated kinetic andphotochemical data
for atmosphericchemistry
R. Atkinson et al.
Title Page
Abstract Introduction
Conclusions References
Tables Figures
J I
J I
Back Close
Full Screen / Esc
Printer-friendly Version
Interactive Discussion
EGU
∆(k2/k) = ± 0.04 over the temperature range 200–300 K.
Comments on Preferred Values
The preferred value of k at 298 K is an average of the values reported by Hills andHoward (1984), Poulet et al. (1986), Lipson et al. (1997), Kegley-Owen et al. (1999),Bedjanian et al. (2001) and Wang and Keyser (2001). The preferred Arrhenius ex-5
pression is based on the mean of the E/R values from the temperature dependencestudies of Hills and Howard (1984), Lipson et al. (1997), Kegley-Owen et al. (1999),Bedjanian et al. (2001) and Wang and Keyser (2001), combined with a pre-exponentialfactor adjusted to give the preferred value of k at 298 K. These studies are generallyin good agreement, as reflected in the uncertainties assigned to k and E/R. Values of10
the branching ratio, k2/k, derived from both direct measurements of k2 and k (Lipson etal., 1997; Bedjanian et al., 2001) and from measurements of the branching ratio itself(Wang and Keyser, 2001), yield values lying in the range 0.035–0.09. The temperatureindependent preferred value of k2/k is based on the mean of these values, with theassigned uncertainty encompassing the extremes of the reported measurements.15
References
Bedjanian, Y., Riffault, V., and Le Bras, G.: Int. J. Chem. Kinet., 33, 587, 2001.Burrows, J. P., Wallington, T. J., and Wayne, R. P.: J. Chem. Soc. Faraday, 2, 80, 957,1984.Hills, A. J. and Howard, C. J.: J. Chem. Phys., 81, 4458, 1984.20
Kegley-Owen, C. S., Gilles, M. K., Burkholder, J. B., and Ravishankara, A. R.: J. Phys.Chem. A, 103, 5040, 1999.Leu, M. T. and Lin, C. L.: Geophys. Res. Lett., 6, 425, 1979.Lipson, J. B., Elrod, M. J., Beiderhase, T. W., Molina, L. T., and Molina, M. J.: J. Chem.Soc. Faraday Trans., 93, 2665, 1997.25
2416
ACPD6, 2281–2702, 2006
Evaluated kinetic andphotochemical data
for atmosphericchemistry
R. Atkinson et al.
Title Page
Abstract Introduction
Conclusions References
Tables Figures
J I
J I
Back Close
Full Screen / Esc
Printer-friendly Version
Interactive Discussion
EGU
Lipson, J. B., Beiderhase, T. W., Molina, L. T., Molina, M. J., and Olzmann, M.: J. Phys.Chem. A, 103, 6540, 1999.Poulet, G. Laverdet, G., and Le Bras, G.: J. Phys. Chem., 90, 159, 1986.Ravishankara, A. R., Eisele, F. L., and Wine, P. H.: J. Chem. Phys., 78, 1140, 1983.Tyndall, G. S., Kegley-Owen, C. S., Orlando, J. J., and Fried, A.: J. Phys. Chem. A,5
106, 1567, 2002.Wang, J. J. and Keyser, L. F.: J. Phys. Chem. A, 105, 6479, 2001.Wang, J. J. and Keyser, L. F.: J. Phys. Chem. A, 105, 10 544, 2001.
2417

ACPD6, 2281–2702, 2006
Evaluated kinetic andphotochemical data
for atmosphericchemistry
R. Atkinson et al.
Title Page
Abstract Introduction
Conclusions References
Tables Figures
J I
J I
Back Close
Full Screen / Esc
Printer-friendly Version
Interactive Discussion
EGU
III.A2.40
HO + OClO → HOCl + O2 (1)→ HO2 + ClO (2)
∆H◦(1) = −210 kJ·mol−1
∆H◦(2) = −15.6 kJ·mol−1
Rate coefficient data (k=k1+k2)5
k/cm3 molecule−1 s−1 Temp./K Reference Technique/Comments
Absolute Rate Coefficients4.50 × 10−13 exp[(804 ± 114)/T ] 293–473 Poulet et al., 1986 DF-LIF/EPR (a)(7.2 ± 0.5) × 10−12 293
Comments
(a) HOCl was observed as a reaction product, using MS, and its concentration deter-mined using the HO+Cl2 → HOCl+Cl reaction as a calibration source of HOCl.Computer simulation of the reaction system indicated that HOCl is formed pri-10
marily in the HO+OClO reaction [channel (1)] and not as a result of secondaryreactions of the HO2 radical with ClO, with k1/k≥0.80 at room temperature.
Preferred Values
k = 6.6 × 10⁻¹² cm3 molecule−1 s−1 at 298 K.k = 4.5 × 10⁻¹³ exp(800/T ) cm3 molecule−1 s−1 over the temperature range 290–480 K.15
k1/k = 1.0
2418

ACPD6, 2281–2702, 2006
Evaluated kinetic andphotochemical data
for atmosphericchemistry
R. Atkinson et al.
Title Page
Abstract Introduction
Conclusions References
Tables Figures
J I
J I
Back Close
Full Screen / Esc
Printer-friendly Version
Interactive Discussion
EGU
Reliability
∆ log k1 = ± 0.3 at 298 K.∆ (E/R) = ± 200 K.∆ log (k1/k) = ± 0.2 at 298 K.
Comments on Preferred Values5
The preferred values are based on the only experimental study of Poulet et al. (1986)using a discharge flow system at ∼1.3 mbar, with EPR and LIF detection of HO radicaldecay and molecular beam mass spectrometry detection of the product HOCl. Indi-cation of curvature in the Arrhenius plot dictates caution in extrapolation beyond theexperimental range.10
Xu et al. (2003) have recently reported ab initio molecular orbital and variationalRRKM theory calculations of the rate coefficient and product channels. The resultsprovide support for both the magnitude of the rate coefficient, and the dominance ofchannel (1), as reported by Poulet et al. (1986) at 1.3 mbar. Channel (2) is predictedto gain importance at elevated temperatures, and a pressure-dependent association15
channel to form HOClO2 is predicted to account for ∼20% of the reaction at 100 Torrand 300 K, and to be the major channel at atmospheric pressure. Experimental studiesat higher pressures are required to investigate this.
References
Poulet, G., Zagogianni, H., and Le Bras, G.: Int. J. Chem. Kinet., 18, 847, 1986.20
Xu, Z-F., Xu, R., and Lin, M. C.: J. Phys. Chem. A., 107, 1040, 2003.
2419

ACPD6, 2281–2702, 2006
Evaluated kinetic andphotochemical data
for atmosphericchemistry
R. Atkinson et al.
Title Page
Abstract Introduction
Conclusions References
Tables Figures
J I
J I
Back Close
Full Screen / Esc
Printer-friendly Version
Interactive Discussion
EGU
III.A2.41
HO + ClNO2 → HOCl + NO2
∆H◦ = −94 kJ·mol−1
Rate coefficient data
k/cm3 molecule−1 s−1 Temp./K Reference Technique/Comments
Absolute Rate Coefficients(3.5 ± 0.7) × 10−14 298 Ganske et al., 1991 DF-RF (a)2.4 × 10⁻¹² exp[-(1250 ± 155)/T ] 259–348 Ganske et al., 1992 DF-RF/MS (a)(3.6 ± 0.2) × 10−14 2985
Comments
(a) Flow tube at 1.35 mbar. HO formed from H+NO2 and detected by resonancefluorescence. Product analysis using mass spectrometry revealed HOCl to bethe solechlorine-containing product.
Preferred Values10
k = 3.6 × 10⁻¹⁴ cm3 molecule−1 s−1 at 298 K.k = 2.4 × 10⁻¹² exp(−1250/T ) cm3 molecule−1 s−1 over the temperature range 260–350 K.
2420

ACPD6, 2281–2702, 2006
Evaluated kinetic andphotochemical data
for atmosphericchemistry
R. Atkinson et al.
Title Page
Abstract Introduction
Conclusions References
Tables Figures
J I
J I
Back Close
Full Screen / Esc
Printer-friendly Version
Interactive Discussion
EGU
Reliability
∆ log k = ± 0.3 at 298 K.∆ (E/R) = ± 300 K.
Comments on Preferred Values
The preferred values are based on the results of the temperature-dependent study5
of Ganske et al. (1992). Mass spectrometric measurements (Ganske et al., 1991,1992) showed HOCl to be the sole chlorine-containing product, with no evidence forproduction of HONO2 or Cl2, thereby showing that the only reaction pathway is thatyielding HOCl+NO2.
References10
Ganske, J. A., Ezell, M. J., Berko, H. N., and Finlayson-Pitts, B. J.: Chem. Phys. Lett.,179, 204, 1991.Ganske, J. A., Berko, H. N., Ezell, M. J., and Finlayson-Pitts, B. J.: J. Phys. Chem., 96,2568, 1992.
15
2421

ACPD6, 2281–2702, 2006
Evaluated kinetic andphotochemical data
for atmosphericchemistry
R. Atkinson et al.
Title Page
Abstract Introduction
Conclusions References
Tables Figures
J I
J I
Back Close
Full Screen / Esc
Printer-friendly Version
Interactive Discussion
EGU
III.A2.42
HO + ClONO2 → HOCl + NO3 (1)→ HO2 + ClONO (2)→ HONO2 + ClO (3)
∆H◦(1) = −64 kJ·mol−1
∆H◦(2) = 10 kJ·mol−1
∆H◦(3) = −93.6 kJ·mol−15
Rate coefficient data (k=k1+k2+k3)
k/cm3 molecule−1 s−1 Temp./K Reference Technique/Comments
Absolute Rate Coefficients(3.7 ± 0.2) × 10−13 245 Ravishankara et al., 1977 FP-RF1.19 × 10−12 exp[-(333 ± 22)/T ] 246–387 Zahniser et al., 1977 DF-RF(3.93 ± 0.11) × 10−13 295
Preferred Values
k = 4.0 × 10⁻¹³ cm3 molecule−1 s−1 at 298 K.k = 1.2 × 10⁻¹² exp(−330/T ) cm3 molecule−1 s−1 over the temperature range 240–10
390 K.
Reliability
∆ log k = ± 0.2 at 298 K.∆ (E/R) = ± 200 K.
2422

ACPD6, 2281–2702, 2006
Evaluated kinetic andphotochemical data
for atmosphericchemistry
R. Atkinson et al.
Title Page
Abstract Introduction
Conclusions References
Tables Figures
J I
J I
Back Close
Full Screen / Esc
Printer-friendly Version
Interactive Discussion
EGU
Comments on Preferred Values
The results of the only two reported studies of Ravishankara et al. (1977) andZahniser et al. (1977) are in good agreement at 245 K (within 25%), considering thedifficulties associated with handling ClONO2. The preferred value is based on thetemperature-dependent study of Zahniser et al. (1977). Neither study reported any5
data concerning the reaction products.
References
Ravishankara, A. R., Davis, D. D., Smith, G., Tesi, G., and Spencer, J.: Geophys. Res.Lett., 4, 7, 1977.Zahniser, M. S., Chang, J. S., and Kaufman, F.: J. Chem. Phys., 67, 997, 1977.10
2423

ACPD6, 2281–2702, 2006
Evaluated kinetic andphotochemical data
for atmosphericchemistry
R. Atkinson et al.
Title Page
Abstract Introduction
Conclusions References
Tables Figures
J I
J I
Back Close
Full Screen / Esc
Printer-friendly Version
Interactive Discussion
EGU
III.A2.43
NO3 + HCl→ HNO3 + Cl
∆H◦ = 4.8 kJ·mol−1
Rate coefficient data
k/cm3 molecule−1 s−1 Temp./K Reference Technique/Comments
Absolute Rate Coefficients<7 × 10⁻¹⁸ 298 Cantrell et al., 1987 (a)≤5 × 10⁻¹⁷ 298 Mellouki et al., 1989 DF-EPR (b)<2.4 × 10⁻¹⁷ 298 Canosa-Mas et al., 1989 DF-A (c)5
Comments
(a) NO3 radical concentrations were derived from the measured NO2 and N2O5 con-centrations in N2O5-NO2-NO3-HCl-air mixtures, using the equilibrium constant ofGraham and Johnston (1978). The upper limit to the rate coefficient cited above-was derived from computer fits of the time-concentration data for reactants and10
products monitored by FTIR absorption spectrometry.
(b) The upper limit to the rate coefficient cited above was derived from fitting themeasured upper limit to the ClO radical concentration (determined by EPR afterconversion to Cl atoms) to a complex mechanism.
(c) No reaction was observed at room temperature, leading to the upper limit to the15
rate coefficient cited above. At higher temperatures (333 K to 473 K), rate coeffi-cients derived from fitting to a complex mechanism yielded the Arrhenius expres-sion of k=4×10⁻¹² exp(−3330/T ) cm3 molecule−1 s−1
2424

ACPD6, 2281–2702, 2006
Evaluated kinetic andphotochemical data
for atmosphericchemistry
R. Atkinson et al.
Title Page
Abstract Introduction
Conclusions References
Tables Figures
J I
J I
Back Close
Full Screen / Esc
Printer-friendly Version
Interactive Discussion
EGU
Preferred Values
k < 5 × 10⁻¹⁷ cm3 molecule−1 s−1 at 298 K
Comments on Preferred Values
The preferred value is the upper limit to the rate coefficient reported by Mellouki etal. (1989) in a study using the discharge flow-EPR technique. Somewhat lower upper5
limits have been reported by Cantrell et al. (1987) and by Canosa-Mas et al. (1989).Canosa-Mas et al. (1989) also reported Arrhenius parameters at higher temperatures(over the range 333 K to 473 K). The preferred value indicates that this reaction is notimportant in the chemistry of the atmosphere.
References10
Canosa-Mas, C. E., Smith, S. J., Toby, S., and Wayne, R. P.: J. Chem. Soc. FaradayTrans., 2, 85, 709, 1989.Cantrell, C. A., Davidson, J. A., Shetter, R. E., Anderson, B. A., and Calvert, J. G.: J.Phys. Chem., 91, 6017, 1987.Graham, R. A. and Johnston, H. S.: J. Phys. Chem., 82, 254, 1978.15
Mellouki, A., Poulet, G., Le Bras, G., Singer, R., Burrows, J. P., and Moortgat, G. K.: J.Phys. Chem., 93, 8017, 1989.
2425
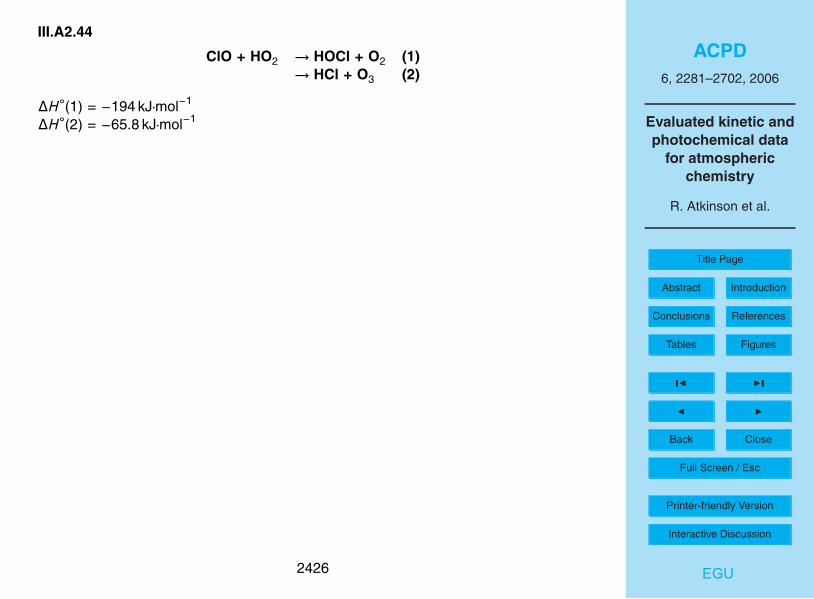
ACPD6, 2281–2702, 2006
Evaluated kinetic andphotochemical data
for atmosphericchemistry
R. Atkinson et al.
Title Page
Abstract Introduction
Conclusions References
Tables Figures
J I
J I
Back Close
Full Screen / Esc
Printer-friendly Version
Interactive Discussion
EGU
III.A2.44
ClO + HO2 → HOCl + O2 (1)→ HCl + O3 (2)
∆H◦(1) = −194 kJ·mol−1
∆H◦(2) = −65.8 kJ·mol−1
2426

ACPD6, 2281–2702, 2006
Evaluated kinetic andphotochemical data
for atmosphericchemistry
R. Atkinson et al.
Title Page
Abstract Introduction
Conclusions References
Tables Figures
J I
J I
Back Close
Full Screen / Esc
Printer-friendly Version
Interactive Discussion
EGU
Rate coefficient data (k=k1+k2)
k/cm3 molecule−1 s−1 Temp./K Reference Technique/Comments
Absolute Rate Coefficients(3.8 ± 0.7) × 10−12 298 Reimann and Kaufman, 1978 DF-RF3.3 × 10−11 exp(850/T ) + 235–393 Stimpfle et al., 1979 DF-LMR4.5 × 10−12 (T /300)−3.7
(6.43 ± 0.96) × 10−12 298(4.5 ± 0.9) × 10−12 298 Leck et al., 1980 DF-MS(5.4+4
−2) × 10−12 300 Burrows and Cox, 1981 MM-UVA(6.2 ± 1.5) × 10−12 308 Cattell and Cox, 1986 MM-UVA (a)2.84 × 10⁻¹² exp[(312 ± 60)/T ] 203–364 Nickolaisen et al., 2000 FP-UVA (b)(7.79 ± 0.83) × 10−12 299 (c)(8.26 ± 1.38) × 10−12 299 (d)7.1 × 10⁻¹² exp[(-16 ± 17)/T ] 215–298 Knight et al., 2000 DF-MS (e)(7.1 ± 1.8) × 10−12 294
Branching Ratiosk2/k ≤ 0.02 298 Leck et al., 2000 (f)k2/k ≤ 0.015 298 Leu, 1980 (f)k2/k ≤ 0.03 248k2/k ≤ 0.003 298 Burrows and Cox, 1981 (g)k1/k ≥ 0.95 210–300 Finkbeiner et al., 1995 (h)k2/k = 0.05 ± 0.02 210k2/k = 0.02 ± 0.01 240k2/k ≤ 0.01 215–298 Knight et al., 2000 (f)
2427

ACPD6, 2281–2702, 2006
Evaluated kinetic andphotochemical data
for atmosphericchemistry
R. Atkinson et al.
Title Page
Abstract Introduction
Conclusions References
Tables Figures
J I
J I
Back Close
Full Screen / Esc
Printer-friendly Version
Interactive Discussion
EGU
Comments
(a) k independent of pressure over the range 65–1000 mbar.
(b) k independent of pressure over the range 65–930 mbar. Two chemical systemsemployed to generate ClO and HO2: (i) the photolysis of Cl2-Cl2O-CH3OH-O2-N2 mixtures, and (ii) the photolysis of F2-H2-O2-Cl2O-N2 mixtures. The latter5
system consistently yielded slightly higher values of k, although differences arewell within error limits of each system. Unpublished results (Laszlo et al.) fromthe same laboratory using DF-MS at 1 Torr are also cited. The results give anear-zero temperature dependence over the range 233–380 K (E/R=72±42 K),and a value of k about a factor of 2 lower at 298 K compared with the FP-UVA10
measurement.
(c) Cl2-Cl2O-CH3OH-O2-N2 system.
(d) Fl2-H2-O2-Cl2O-N2 system.
(e) k measured in 1.4–2.2 mbar He. ClO and HO2 generated from five combina-tions of precursor reagents: (i) CH3OH-Cl2O, (ii) CH3OH-OClO, (iii) HCHO-Cl2O,15
(iv) HCHO-OClO, and (v) H2O2-OClO. Systems yielded consistent results. Addi-tional experiments performed with related chemical systems involving presence ofO3, generated higher values of k, described by the expression (6.6±0.8)×10−12
exp[(85±18)/T ] cm3 molecule−1 s−1, over the temperature range 223–333 K. Thiswas attributed to inefficient quenching at 1.3 mbar of the vibrationally excited ClO20
generated from the Cl+O3 reaction.
(f) DF-MS detection of O3.
(g) MM-CL detection of O3.
2428

ACPD6, 2281–2702, 2006
Evaluated kinetic andphotochemical data
for atmosphericchemistry
R. Atkinson et al.
Title Page
Abstract Introduction
Conclusions References
Tables Figures
J I
J I
Back Close
Full Screen / Esc
Printer-friendly Version
Interactive Discussion
EGU
(h) Flow system with steady-state photolysis (310 nm to 400 nm) of Cl2-H2-Cl2O-O2-Ar mixtures at a total pressure of 910 mbar. HOCl and O3 products were moni-tored by matrix-isolation FTIR spectroscopy.
Preferred Values
k = 6.9 × 10⁻¹² cm3 molecule−1 s−1 at 298 K.5
k = 2.2 × 10⁻¹² exp(340/T ) cm3 molecule−1 s−1 over the temperature range 230–300 K.
Reliability
∆ log k = ± 0.2 at 298 K.∆ (E/R) = ± 350 K.
Comments on Preferred Values10
The reported studies have been carried out over a range of temperatures and pres-sures, using a variety of techniques. The room temperature values of k cover a rangeof more than a factor of two. Systematic studies of the pressure dependence (Cattelland Cox, 1986; Nickolaisen et al., 2000) show no significant variation above 65 mbar,although the average of the published low pressure discharge flow measurements is15
slightly lower than the average of the higher pressure measurements. The recent stud-ies of the temperature dependence (Nickolaisen et al., 2000; Knight et al., 2000) dis-agree with the previously reported (Stimpfle et al., 1979) strong negative temperaturedependence at temperatures below 298 K, and the associated non-linear Arrhenius be-haviour. However, there is also substantial disagreement between the recent studies,20
which yield values of E/R of −312 K (Nickolaisen et al., 2000) and 16 K (Knight et al.,2000).
The preferred value at 298 K is based on the average of the room temperaturedata of Stimpfle et al. (1979), Cattell and Cox (1986), Nickolaisen et al. (2000) and
2429
ACPD6, 2281–2702, 2006
Evaluated kinetic andphotochemical data
for atmosphericchemistry
R. Atkinson et al.
Title Page
Abstract Introduction
Conclusions References
Tables Figures
J I
J I
Back Close
Full Screen / Esc
Printer-friendly Version
Interactive Discussion
EGU
Knight et al. (2000). The preferred value of E/R is based on the average of the threetemperature dependence studies, using Stimpfle et al. (1979) data for T≤298 K (forwhich E/R=−709 K). The uncertainties in k at 298 K and E/R reflect the range ofreported values.
All of the available data suggest that channel (1) is the dominant, if not sole,5
pathway over the temperature range of the preferred values With the exception of thematrix-isolation results of Finkbeiner et al. (1995) no evidence for channel (2) has beenreported. Recent theoretical studies (Nickolaisen et al., 2000; Kaltsoyannis and Row-ley, 2002) conclude that the contribution of channel (2) is essentially zero.
References10
Burrows, J. P. and Cox, R. A.: J. Chem. Soc. Faraday Trans., 1, 77, 2465, 1981.Cattell, F. C. and Cox, R. A.: J. Chem. Soc. Faraday Trans., 2, 82, 1413, 1986.Finkbeiner, M., Crowley, J. N., Horie, O., Muller, R., Moortgat, G. K., and Crutzen, P.J.: J. Phys. Chem., 99, 16264, 1995.Kaltsoyannis, N. and Rowley, D. M.: Phys. Chem. Chem. Phys., 4, 419, 2002.15
Knight, G. P., Beiderhase, T., Helleis, F., Moortgat, G. K., and Crowley, J. N.: J. Phys.Chem. A, 104, 1674, 2000.Laszlo, B., Friedl, R. R., and Sander, S. P.: unpublished results.Leck, T. J., Cook, J.-E. L., and Birks, J. W.: J. Chem. Phys., 72, 2364, 1980.Nickolaisen, S. L., Roehl, C. M., Blakeley, L. K., Friedl, R. R., Francisco, J. S., Liu, R.,20
and Sander, S. P. J.: Phys. Chem. A, 104, 308, 2000.Reimann, B. and Kaufman, F.: J. Chem. Phys., 69, 2925, 1978.Stimpfle, R. M., Perry, R. A., and Howard, C. J.: J. Chem. Phys., 71, 5183, 1979.
2430

ACPD6, 2281–2702, 2006
Evaluated kinetic andphotochemical data
for atmosphericchemistry
R. Atkinson et al.
Title Page
Abstract Introduction
Conclusions References
Tables Figures
J I
J I
Back Close
Full Screen / Esc
Printer-friendly Version
Interactive Discussion
EGU
III.A2.45
ClO + O3 → ClOO + O2 (1)→ OClO + O2 (2)
∆H◦(1) = −146.8 kJ·mol−1
∆H◦(2) = −149.7 kJ·mol−1
Rate coefficient data (k=k1+k2)5
k/cm3 molecule−1 s−1 Temp./K Reference Technique/Comments
Absolute Rate Coefficientsk2 < 1 × 10⁻¹⁸ 298 DeMore et al., 1975 DF-MSk2 < 1 × 10⁻¹⁸ 298 Wongdontri-Stuper et al., 1979 FP-UVA (a)k1 < 1.3 × 10⁻¹⁷ 233 Stevens and Anderson, 1990 (b)k1 < 1.4 × 10⁻¹⁷ 298k1 = (4.0 ± 2.0) × 10−16 413
Comments
(a) Flash photolysis of Cl2-O3 mixtures. Upper limit to the rate coefficient obtainedexpected to really refer to k2 (Stevens and Anderson, 1990).
(a) Discharge flow system. Reaction channel (1) was followed by monitoring ClO10
produced from the thermal decomposition of the product ClOO in the presenceof O3. The product ClO was distinguished from the reactant ClO through isotopiclabelling.
2431

ACPD6, 2281–2702, 2006
Evaluated kinetic andphotochemical data
for atmosphericchemistry
R. Atkinson et al.
Title Page
Abstract Introduction
Conclusions References
Tables Figures
J I
J I
Back Close
Full Screen / Esc
Printer-friendly Version
Interactive Discussion
EGU
Preferred Values
k1 < 1.5 × 10⁻¹⁷ cm3 molecule−1 s−1 at 298 K.k2 <1 × 10⁻¹⁸ cm3 molecule−1 s−1 at 298 K.
Comments on Preferred Values
The preferred upper limit for k1 is based on the results of the study of Stevens and5
Anderson (1990). The preferred upper limit for k2 is based on the data of DeMore etal. (1975) and Wongdontri-Stuper et al. (1979). The upper limit of Stevens and Ander-son (1990) at room temperature can be combined with their measured rate coefficientat 413 K to derive A1=2×10⁻¹² cm3 molecule−1 s−1 and E1/R>3600 K. For k2 one canestimate A2=1×10⁻¹² cm3 molecule−1 s−1 and derive E2/R>4000 K.10
References
DeMore, W. B., Lin, C. L., and Jaffe, S.: presented at ACS National Meeting, Philadel-phia, PA, 1975.Stevens, P. S. and Anderson, J. G.: Geophys. Res. Lett., 17, 1287, 1990.Wongdontri-Stuper, W., Jayanty, R. K. M., Simonaitis, R., and Heicklen, J.: J. Pho-15
tochem., 10, 163, 1979.
2432

ACPD6, 2281–2702, 2006
Evaluated kinetic andphotochemical data
for atmosphericchemistry
R. Atkinson et al.
Title Page
Abstract Introduction
Conclusions References
Tables Figures
J I
J I
Back Close
Full Screen / Esc
Printer-friendly Version
Interactive Discussion
EGU
III.A2.46
ClO + NO→ Cl + NO2
∆H◦ = −37.4 kJ·mol−1
Rate coefficient data
k/cm3 molecule−1 s−1 Temp./K Reference Technique/Comments
Absolute Rate Coefficients(1.7 ± 0.2) × 10−11 298 Clyne and Watson, 1974 DF-MS5.72 × 10−12 exp[(296 ± 20)/T ] 227–415 Leu and DeMore, 1978 DF-MS(1.53 ± 0.11) × 10−11 299(1.61 ± 0.16) × 10−11 295 Clyne and MacRobert, 1980 DF-MS(1.72 ± 0.20) × 10−11 298 Ray and Watson, 1981 DF-MS7.1 × 10−12 exp[(270 ± 50)/T ] 202–393 Lee et al., 1982 DF-LMR(1.84 ± 0.03) × 10−11 2975
Preferred Values
k = 1.7 × 10⁻¹¹ cm3 molecule−1 s−1 at 298 K.k = 6.2 × 10⁻¹² exp(295/T ) cm3 molecule−1 s−1 over the temperature range 200–420 K.
Reliability
∆ log k = ± 0.1 at 298 K.10
∆ (E/R) = ± 100 K.
2433

ACPD6, 2281–2702, 2006
Evaluated kinetic andphotochemical data
for atmosphericchemistry
R. Atkinson et al.
Title Page
Abstract Introduction
Conclusions References
Tables Figures
J I
J I
Back Close
Full Screen / Esc
Printer-friendly Version
Interactive Discussion
EGU
Comments on Preferred Values
The room temperature rate coefficients reported by Clyne and Watson (1974), Leuand DeMore (1978), Clyne and MacRobert (1980), Ray and Watson (1981) and Leeet al. (1982) are in good agreement and are ∼30% lower than the value reported byZahniser and Kaufman (1977) from a competitive study. The preferred values are5
derived from a least-squares fit to the data reported by Clyne and Watson (1974), Leuand DeMore (1978), Clyne and MacRobert (1980), Ray and Watson (1981) and Lee etal. (1982).
References
Clyne, M. A. A. and Watson, R. T.: J. Chem. Soc. Faraday Trans., 1, 70, 2250, 1974.10
Clyne, M. A. A. and MacRobert, A. J.: Int. J. Chem. Kinet., 12, 79, 1980.Lee, Y. P., Stimpfle, R. M., Perry, R. A., Mucha, J. A., Evenson, K. M., Jennings, D. A.,and Howard, C. J.: Int. J. Chem. Kinet., 14, 711, 1982.Leu, M. T. and DeMore, W. B. : J. Phys. Chem., 82, 2049, 1978.Ray, G. W. and Watson, R. T.: J. Phys. Chem., 85, 2955, 1981.15
Zahniser, M. S. and Kaufman, F.: J. Chem. Phys., 66, 3673, 1977.
2434

ACPD6, 2281–2702, 2006
Evaluated kinetic andphotochemical data
for atmosphericchemistry
R. Atkinson et al.
Title Page
Abstract Introduction
Conclusions References
Tables Figures
J I
J I
Back Close
Full Screen / Esc
Printer-friendly Version
Interactive Discussion
EGU
III.A2.47
ClO + NO2 + M→ ClONO2 + M
∆H◦ = −111.9 kJ·mol−1
Low-pressure rate coefficients5
Rate coefficient data
k0/cm3 molecule−1 s−1 Temp./K Reference Technique/Comments
Absolute Rate Coefficients(4.40 ± 0.66) × 10−33 exp(1087/T ) [N2] 250–356 Birks et al., 1977 DF-MS (a)(1.52 ± 0.23) × 10−31 (T /300)−3.15 [N2] 251–365 Zahniser et al., 1977 DF-RF (b)(3.69 ± 0.24) × 10−33 exp(1150/T ) [N2] Leu et al., 1977 DF-MS (c)4.3 × 10⁻³³ exp[(1085 ± 86)/T ] [N2] 274–339 Cox and Lewis, 1979 (d)(1.5 ± 0.12) × 10−31 [N2] 298 Molina et al., 1980 PLP-UVA (e)(1.5 ± 0.2) × 10−31 [N2] 298 Dasch et al., 1981 PLP-UVA (f)2.8 × 10⁻³³ exp(1090/T ) [He] 250–387 Lee et al., 1982 DF-LMR3.5 × 10−33 exp(1180/T ) [O2] 250–416 (g)2.09 × 10⁻³¹ [N2] 297(1.8 ± 0.4) × 10−31 [N2] 270–295 Cox et al., 1984 (h)(1.6 ± 0.2) × 10−31 (T /300)−3.0 [N2] 264–343 Handwerk and Zellner, 1984 FP-UVA (i)(1.40 ± 0.07) × 10−31 [N2] 298 Wallington and Cox, 1986 (j)(1.8 ± 0.3) × 10−31 (T /300)−3.4 [air] 213–298 Percival et al., 1997 (k)
2435

ACPD6, 2281–2702, 2006
Evaluated kinetic andphotochemical data
for atmosphericchemistry
R. Atkinson et al.
Title Page
Abstract Introduction
Conclusions References
Tables Figures
J I
J I
Back Close
Full Screen / Esc
Printer-friendly Version
Interactive Discussion
EGU
Comments
(a) Pressure range 1.3–7 mbar.
(b) Resonance fluorescence of Cl after conversion of ClO into Cl. Pressure range1.4–9 mbar. Measurement in N2 only at 300 K, temperature coefficient taken frommeasurements in He.5
(c) Pressure range 1.3–8 mbar.
(d) Modulated photolysis with UV absorption detection of ClO radicals. The pressurerange studied was 33–815 mbar. Small deviations from third-order kinetics wereobserved near 1 bar.
(e) The ClO radical decay was monitored. FTIR spectroscopy was also used to mon-10
itor the reaction products.
(f) ClO radicals were generated from Cl2O and monitored at 258.2 nm. The pressurerange was 27–800 mbar.
(g) Detection of ClO(X2Π3/2, ν=0) with an optically pumped spectrometer. Measure-ments were carried out at pressures over the range 0.8–8.8 mbar.15
(h) Modulated photolysis of Cl2-Cl2O-NO2-N2 mixtures. ClONO2 formation was fol-lowed by diode laser spectroscopy. This study ruled out the formation of isomersother than ClONO2.
(i) The pressure range was 23–1052 mbar, with experiments being conducted at264 K, 298 K and 343 K.20
(j) Modulated photolysis of OClO-NO2-N2 mixtures with detection of ClO radicals byUV absorption.
2436
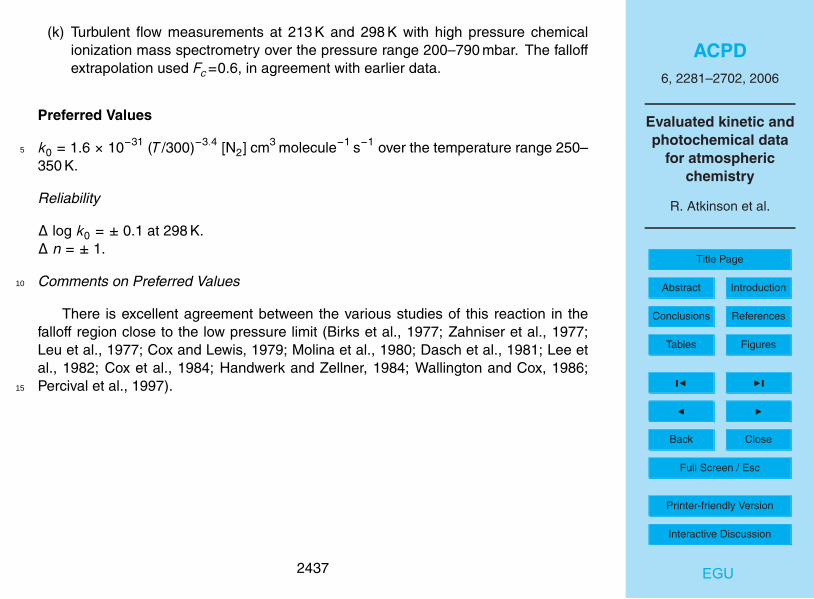
ACPD6, 2281–2702, 2006
Evaluated kinetic andphotochemical data
for atmosphericchemistry
R. Atkinson et al.
Title Page
Abstract Introduction
Conclusions References
Tables Figures
J I
J I
Back Close
Full Screen / Esc
Printer-friendly Version
Interactive Discussion
EGU
(k) Turbulent flow measurements at 213 K and 298 K with high pressure chemicalionization mass spectrometry over the pressure range 200–790 mbar. The falloffextrapolation used Fc=0.6, in agreement with earlier data.
Preferred Values
k0 = 1.6 × 10⁻³¹ (T /300)−3.4 [N2] cm3 molecule−1 s−1 over the temperature range 250–5
350 K.
Reliability
∆ log k0 = ± 0.1 at 298 K.∆ n = ± 1.
Comments on Preferred Values10
There is excellent agreement between the various studies of this reaction in thefalloff region close to the low pressure limit (Birks et al., 1977; Zahniser et al., 1977;Leu et al., 1977; Cox and Lewis, 1979; Molina et al., 1980; Dasch et al., 1981; Lee etal., 1982; Cox et al., 1984; Handwerk and Zellner, 1984; Wallington and Cox, 1986;Percival et al., 1997).15
2437
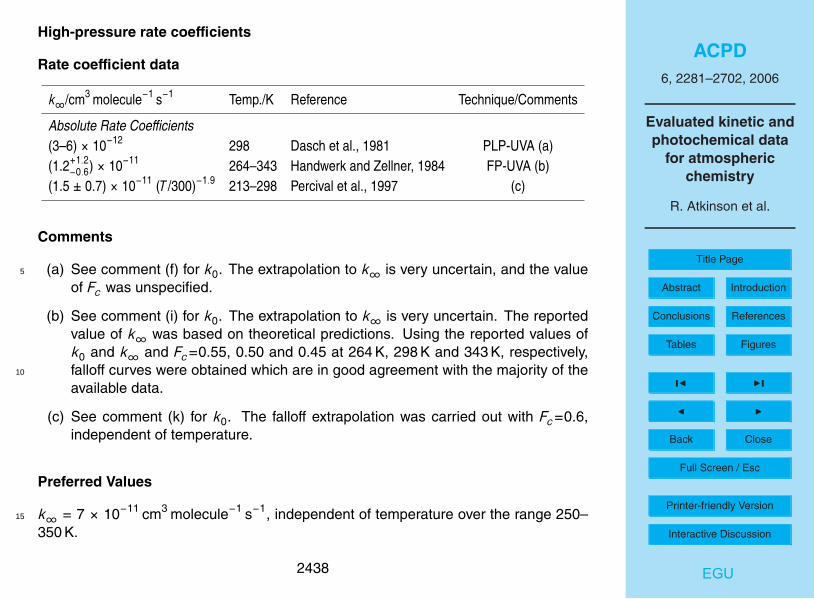
ACPD6, 2281–2702, 2006
Evaluated kinetic andphotochemical data
for atmosphericchemistry
R. Atkinson et al.
Title Page
Abstract Introduction
Conclusions References
Tables Figures
J I
J I
Back Close
Full Screen / Esc
Printer-friendly Version
Interactive Discussion
EGU
High-pressure rate coefficients
Rate coefficient data
k∞/cm3 molecule−1 s−1 Temp./K Reference Technique/Comments
Absolute Rate Coefficients(3–6) × 10−12 298 Dasch et al., 1981 PLP-UVA (a)(1.2+1.2
−0.6) × 10−11 264–343 Handwerk and Zellner, 1984 FP-UVA (b)(1.5 ± 0.7) × 10−11 (T /300)−1.9 213–298 Percival et al., 1997 (c)
Comments
(a) See comment (f) for k0. The extrapolation to k∞ is very uncertain, and the value5
of Fc was unspecified.
(b) See comment (i) for k0. The extrapolation to k∞ is very uncertain. The reportedvalue of k∞ was based on theoretical predictions. Using the reported values ofk0 and k∞ and Fc=0.55, 0.50 and 0.45 at 264 K, 298 K and 343 K, respectively,falloff curves were obtained which are in good agreement with the majority of the10
available data.
(c) See comment (k) for k0. The falloff extrapolation was carried out with Fc=0.6,independent of temperature.
Preferred Values
k∞ = 7 × 10⁻¹¹ cm3 molecule−1 s−1, independent of temperature over the range 250–15
350 K.
2438
ACPD6, 2281–2702, 2006
Evaluated kinetic andphotochemical data
for atmosphericchemistry
R. Atkinson et al.
Title Page
Abstract Introduction
Conclusions References
Tables Figures
J I
J I
Back Close
Full Screen / Esc
Printer-friendly Version
Interactive Discussion
EGU
Reliability
∆ log k∞ = ± 0.3 over the temperature range 250–350 K.
Comments on Preferred Values
Because there are no direct measurements of k at pressures much above 1 bar,k∞ cannot be established with certainty. There are two alternatives for a represen-5
tation of the rate data at pressures up to 1 bar. One may use the values chosen byPercival et al. (1997) with Fc=0.6 and a temperature dependent k∞ such as given inthe table. Alternatively, one may follow our policy of choosing a more reasonable Fcsuch as recommended by Cobos and Troe (2003) and then fit k∞. Using Fc=0.4 suchas recommended also for HO+NO2 (+M) → HONO2 (+M), the rate data in the falloff10
range below 1 bar from Percival et al. (1997) are well reproduced with a temperature in-dependent k∞=(7±2)×10−11 cm3 molecule−1 s−1. Because a value for Fc smaller than0.6 appears theoretically much more justified, we here adopt the second alternative.However, we emphasize that the two alternatives work equally well for the representa-tion of data below 1 bar.15
References
Birks, J. W., Shoemaker, B., Leck, T. J., Borders, R. A., and Hart, L. J.: J. Chem.Phys., 66, 4591, 1977.Cobos, C. J. and Troe, J.: Z. Phys. Chem., 217, 1031, 2003.Cox, R. A. and Lewis, R.: J. Chem. Soc. Faraday Trans. 1, 75, 2649, 1979.20
Cox, R. A., Burrows, J. P., and Coker, G. B.: Int. J. Chem. Kinet., 16, 445, 1984.Dasch, W., Sternberg, K.-H., and Schindler, R. N.: Ber. Bunsenges. Phys. Chem., 85,611, 1981.Handwerk, V. and Zellner, R.: Ber. Bunsenges. Phys. Chem., 88, 405, 1984.Lee, Y.-P., Stimpfle, R. M., Perry, R. A., Mucha, J. A., Evenson, K. M., Jennings, D. A.,25
2439

ACPD6, 2281–2702, 2006
Evaluated kinetic andphotochemical data
for atmosphericchemistry
R. Atkinson et al.
Title Page
Abstract Introduction
Conclusions References
Tables Figures
J I
J I
Back Close
Full Screen / Esc
Printer-friendly Version
Interactive Discussion
EGU
and Howard, C. J.: Int. J. Chem. Kinet., 14, 711, 1982.Leu, M. T., Lin, C. L., and DeMore, W. B.: J. Phys. Chem., 81, 190, 1977.Molina, M. J., Molina, M. T., and Ishiwata, T.: J. Phys. Chem., 84, 3100, 1980.Percival, C. J., Smith, G. D., Molina, L. T., and Molina, M. J.: J. Phys. Chem. A, 101,8830, 1997.5
Wallington, T. J. and Cox, R. A.: J. Chem. Soc. Faraday Trans., 2, 82, 275, 1986.Zahniser, M. S., Chang, J. S., and Kaufman, F.: J. Chem. Phys., 67, 977, 1977.
2440
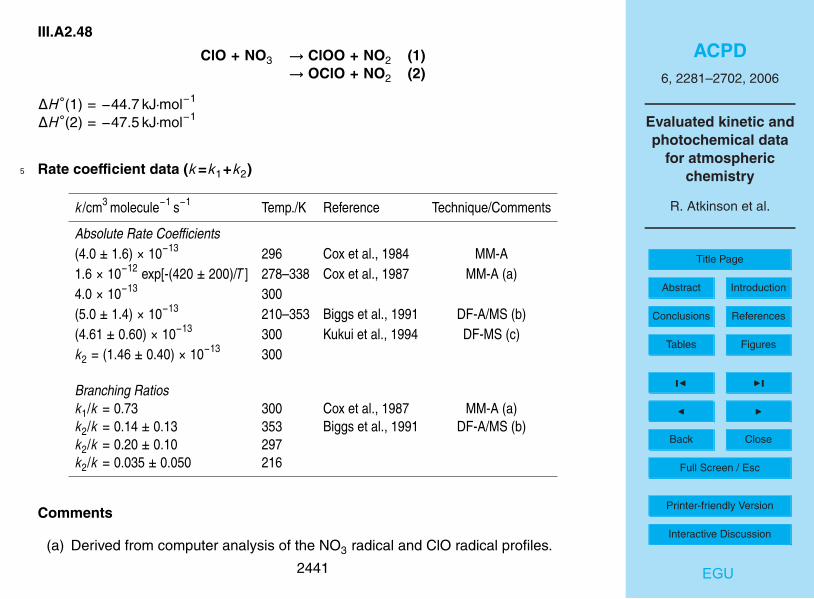
ACPD6, 2281–2702, 2006
Evaluated kinetic andphotochemical data
for atmosphericchemistry
R. Atkinson et al.
Title Page
Abstract Introduction
Conclusions References
Tables Figures
J I
J I
Back Close
Full Screen / Esc
Printer-friendly Version
Interactive Discussion
EGU
III.A2.48
ClO + NO3 → ClOO + NO2 (1)→ OClO + NO2 (2)
∆H◦(1) = −44.7 kJ·mol−1
∆H◦(2) = −47.5 kJ·mol−1
Rate coefficient data (k=k1+k2)5
k/cm3 molecule−1 s−1 Temp./K Reference Technique/Comments
Absolute Rate Coefficients(4.0 ± 1.6) × 10−13 296 Cox et al., 1984 MM-A1.6 × 10−12 exp[-(420 ± 200)/T ] 278–338 Cox et al., 1987 MM-A (a)4.0 × 10⁻¹³ 300(5.0 ± 1.4) × 10−13 210–353 Biggs et al., 1991 DF-A/MS (b)(4.61 ± 0.60) × 10−13 300 Kukui et al., 1994 DF-MS (c)k2 = (1.46 ± 0.40) × 10−13 300
Branching Ratiosk1/k = 0.73 300 Cox et al., 1987 MM-A (a)k2/k = 0.14 ± 0.13 353 Biggs et al., 1991 DF-A/MS (b)k2/k = 0.20 ± 0.10 297k2/k = 0.035 ± 0.050 216
Comments
(a) Derived from computer analysis of the NO3 radical and ClO radical profiles.
2441

ACPD6, 2281–2702, 2006
Evaluated kinetic andphotochemical data
for atmosphericchemistry
R. Atkinson et al.
Title Page
Abstract Introduction
Conclusions References
Tables Figures
J I
J I
Back Close
Full Screen / Esc
Printer-friendly Version
Interactive Discussion
EGU
(b) Pseudo-first-order decay of NO3 in excess ClO was determined by optical ab-sorption at 662 nm, using a cross-section of 1.7×10⁻¹⁷ cm2 molecule−1. Productbranching ratios were measured with a quadrupole mass spectrometer.
(c) Rate coefficients k were obtained from the first-order NO3 radical decays in thepresence of excess ClO radicals and O3. Rate coefficients k2 were obtained from5
the decays of ClO radicals in the presence of excess NO3 radicals, with ClOOradicals formed in channel (1) reforming ClO radicals by the reactions ClOO →Cl+O2 and Cl+NO3 → ClO+NO2. This study (Kukui et al., 1994) supersedes theearlier study of Becker et al. (1991) from the same laboratory.
Preferred Values10
k = 4.6 × 10⁻¹³ cm3 molecule−1 s−1, independent of temperature over the range 210–360 K.k2 = 1.2 × 10⁻¹³ cm3 molecule−1 s−1 at 298 K.
Reliability
∆ log k = ± 0.2 at 298 K.15
∆ log k2 = ± 0.3 at 298 K.∆ (E/R) = ± 400 K.
Comments on Preferred Values
The preferred 298 K value is based on the results of Kukui et al. (1994) which are inagreement with the data of Cox et al. (1984, 1987) and Biggs et al. (1991). The results20
of Cox et al. (1987) are consistent with those of Biggs et al. (1991) who reported thatthe rate coefficient is independent of temperature over the range 210 K to 353 K. Thetwo direct measurements of the branching ratio k2/k, of 0.20±0.10 at 297 K (Biggs et
2442

ACPD6, 2281–2702, 2006
Evaluated kinetic andphotochemical data
for atmosphericchemistry
R. Atkinson et al.
Title Page
Abstract Introduction
Conclusions References
Tables Figures
J I
J I
Back Close
Full Screen / Esc
Printer-friendly Version
Interactive Discussion
EGU
al., 1991) and 0.32±0.1 at 300 K (Kukui et al., 1994), are in agreement that channel (1)dominates, and the preferred value of k2 is based on the results of these two studies(Biggs et al., 1991; Kukui et al., 1994). From a study of the OClO-NO3 system, Friedl etal. (1992) conclude that at 220 K and 298 K the major reaction channel is channel (1),in agreement with the conclusions of Cox et al. (1987), Biggs et al. (1991) and Kukui et5
al. (1994).
References
Becker, E., Wille, U., Rahman, M. M., and Schindler, R. N.: Ber. Bunsenges. Phys.Chem., 95, 1173, 1991.Biggs, P., Harwood, M. H., Parr, A. D., and Wayne, R. P.: J. Phys. Chem., 95, 7746,10
1991.Cox, R. A., Barton, R. A., Ljungstrøm, E., and Stocker, D. W.: Chem. Phys. Lett., 108,228, 1984.Cox, R. A., Fowles, M., Moulton, D., and Wayne, R. P.: J. Phys. Chem., 91, 3361,1987.15
Friedl, R. R., Sander, S. P., and Yung, Y. L : J. Phys. Chem., 96, 7490, 1992.Kukui, A., Jungkamp, T. P. W., and Schindler, R. N.: Ber. Bunsenges. Phys. Chem.,98, 1619, 1994.
2443

ACPD6, 2281–2702, 2006
Evaluated kinetic andphotochemical data
for atmosphericchemistry
R. Atkinson et al.
Title Page
Abstract Introduction
Conclusions References
Tables Figures
J I
J I
Back Close
Full Screen / Esc
Printer-friendly Version
Interactive Discussion
EGU
III.A2.49
ClO + ClO → Cl2 + O2 (1)→ Cl + ClOO (2)→ Cl + OClO (3)
∆H◦(1) = −203.2 kJ·mol−1
∆H◦(2) = 15.6 kJ·mol−1
∆H◦(2) = 12.7 kJ·mol−15
Rate coefficient data (k=k1+k2+k3)
k/cm3 molecule−1 s−1 Temp./K Reference Technique/Comments
Absolute Rate Coefficientsk1 = 1.01 × 10⁻¹² exp[-(1590 ± 100)/T ] 260–390 Nickolaisen et al., 1994 (a)k2 = 2.98 × 10⁻¹¹ exp[-(2450 ± 330)/T ] 260–390k3 = 3.50 × 10⁻¹³ exp[-(1370 ± 150)/T ] 260–390
Branching Ratiosk1/k = 0.39 ± 0.06 298 Horowitz et al., 1994 (b)k2/k = 0.41 ± 0.06 298k3/k = 0.20 ± 0.03 298k3/k2 = 0.27 exp[(220 ± 100)/T ] 285–331
Comments
(a) Flash photolysis-long pathlength UV absorption technique. Cl2-Cl2O mixtures10
were photolyzed at wavelengths longer than 300 nm. The UV absorption of ClO2444

ACPD6, 2281–2702, 2006
Evaluated kinetic andphotochemical data
for atmosphericchemistry
R. Atkinson et al.
Title Page
Abstract Introduction
Conclusions References
Tables Figures
J I
J I
Back Close
Full Screen / Esc
Printer-friendly Version
Interactive Discussion
EGU
and OClO were monitored with an optical multichannel analyzer. The reactionwas studied over a wide range of temperature, pressure, and initial reactant stoi-chiometry.
(a) Cl2-sensitized continuous photolysis of Cl2-O3 mixtures in excess O2. Decay ofO3 and formation of OClO monitored by UV absorption.5
Preferred Values
k1 = 4.8 × 10⁻¹⁵ cm3 molecule−1 s−1 at 298 K.k2 = 8.0 × 10⁻¹⁵ cm3 molecule−1 s−1 at 298 K.k3 = 3.5 × 10⁻¹⁵ cm3 molecule−1 s−1 at 298 K.k1 = 1.0 × 10⁻¹² exp(−1590/T ) cm3 molecule−1 s−1 over the temperature range 260–10
390 K.k2 = 3.0 × 10⁻¹¹ exp(−2450/T ) cm3 molecule−1 s−1 over the temperature range 260–390 K.k3 = 3.5 × 10⁻¹³ exp(−1370/T ) cm3 molecule−1 s−1 over the temperature range 260–390 K.15
Reliability
∆ log k1 = ∆ log k2 = ∆ log k3 = ± 0.2 at 298 K.∆ (E1/R) = ∆ (E3/R) = ± 300 K.∆ (E2/R) = ± 500 K.
20
Comments on Preferred Values
The ClO+ClO reaction exhibits both bimolecular and termolecular reaction chan-nels. The termolecular reaction, which leads to the formation of the ClOOCl dimer,
2445
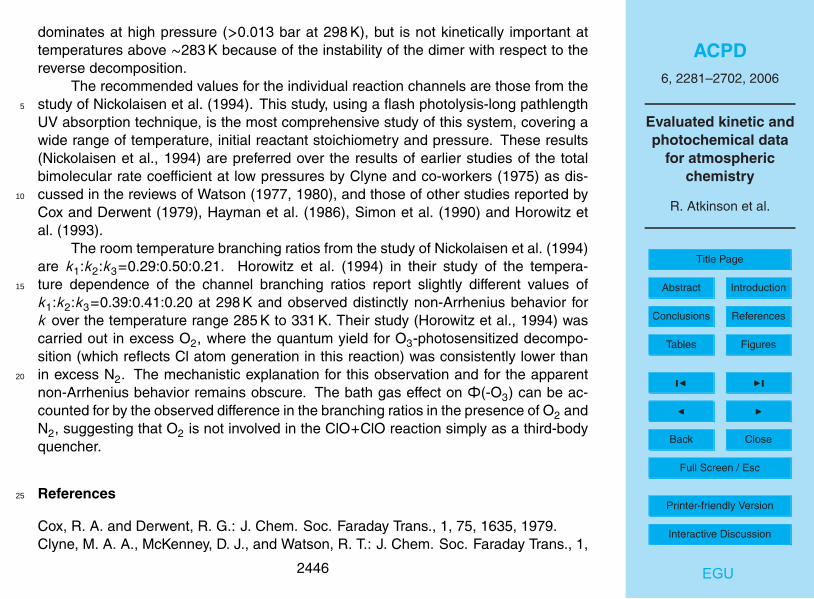
ACPD6, 2281–2702, 2006
Evaluated kinetic andphotochemical data
for atmosphericchemistry
R. Atkinson et al.
Title Page
Abstract Introduction
Conclusions References
Tables Figures
J I
J I
Back Close
Full Screen / Esc
Printer-friendly Version
Interactive Discussion
EGU
dominates at high pressure (>0.013 bar at 298 K), but is not kinetically important attemperatures above ∼283 K because of the instability of the dimer with respect to thereverse decomposition.
The recommended values for the individual reaction channels are those from thestudy of Nickolaisen et al. (1994). This study, using a flash photolysis-long pathlength5
UV absorption technique, is the most comprehensive study of this system, covering awide range of temperature, initial reactant stoichiometry and pressure. These results(Nickolaisen et al., 1994) are preferred over the results of earlier studies of the totalbimolecular rate coefficient at low pressures by Clyne and co-workers (1975) as dis-cussed in the reviews of Watson (1977, 1980), and those of other studies reported by10
Cox and Derwent (1979), Hayman et al. (1986), Simon et al. (1990) and Horowitz etal. (1993).
The room temperature branching ratios from the study of Nickolaisen et al. (1994)are k1:k2:k3=0.29:0.50:0.21. Horowitz et al. (1994) in their study of the tempera-ture dependence of the channel branching ratios report slightly different values of15
k1:k2:k3=0.39:0.41:0.20 at 298 K and observed distinctly non-Arrhenius behavior fork over the temperature range 285 K to 331 K. Their study (Horowitz et al., 1994) wascarried out in excess O2, where the quantum yield for O3-photosensitized decompo-sition (which reflects Cl atom generation in this reaction) was consistently lower thanin excess N2. The mechanistic explanation for this observation and for the apparent20
non-Arrhenius behavior remains obscure. The bath gas effect on Φ(-O3) can be ac-counted for by the observed difference in the branching ratios in the presence of O2 andN2, suggesting that O2 is not involved in the ClO+ClO reaction simply as a third-bodyquencher.
References25
Cox, R. A. and Derwent, R. G.: J. Chem. Soc. Faraday Trans., 1, 75, 1635, 1979.Clyne, M. A. A., McKenney, D. J., and Watson, R. T.: J. Chem. Soc. Faraday Trans., 1,
2446

ACPD6, 2281–2702, 2006
Evaluated kinetic andphotochemical data
for atmosphericchemistry
R. Atkinson et al.
Title Page
Abstract Introduction
Conclusions References
Tables Figures
J I
J I
Back Close
Full Screen / Esc
Printer-friendly Version
Interactive Discussion
EGU
71, 322, 1975.Hayman, G. D., Davies, J. M., and Cox, R. A.: Geophys. Res. Lett., 13, 1347, 1986.Horowitz, A., Bauer, D., Crowley, J. N., and Moortgat, G. K.: Geophys. Res. Lett., 20,1423, 1993.Horowitz, A., Crowley, J. N., and Moortgat, G. K.: J. Phys. Chem., 98, 11 924, 1994.5
Nickolaisen, S. L., Friedl, R. R., and Sander, S. P.: J. Phys. Chem., 98, 155, 1994.Simon, F. G., Schneider, W., Moortgat, G. K., and Burrows, J. P.: J. Photochem.Photobiol. A, 55, 1, 1990.Watson, R. T. : J. Phys. Chem. Ref. Data, 6, 871, 1977.Watson, R. T.: Proceedings of the NATO Advanced Study Institute on Atmospheric10
Ozone, Report FAA-EE-80-20, FAA, Washington, DC, 1980.
2447

ACPD6, 2281–2702, 2006
Evaluated kinetic andphotochemical data
for atmosphericchemistry
R. Atkinson et al.
Title Page
Abstract Introduction
Conclusions References
Tables Figures
J I
J I
Back Close
Full Screen / Esc
Printer-friendly Version
Interactive Discussion
EGU
III.A2.50
ClO + ClO + M→ Cl2O2 + M
∆H◦ = −75.7 kJ·mol−1
Low-pressure rate coefficients
Rate coefficient data5
k0/cm3 molecule−1 s−1 Temp./K Reference Technique/Comments
Absolute Rate Coefficients5.0 × 10−32 [O2] 298 Johnston et al., 1969 MM (a)2.0 × 10⁻³² [Ar] 298 Walker, 1972 DF-UVA (b)1.1 × 10⁻³² [O2] 300 Basco and Hunt, 1979 FP-UVA (c)3.0 × 10⁻³² [N2] 298 Cox et al., 1979 MM (d)6.0 × 10⁻³²(T /300)−2.1 [O2] 268–338 Hayman et al., 1986 MM (e)(1.8 ± 0.5) × 10−32(T /300)−3.6 [N2] 194–247 Sander et al., 1989 FP-UVA (f)(1.64 ± 0.9) × 10−32(T /300)−4.4 [N2] 200–263 Trolier et al., 1990 FP-UVA (g)(1.32 ± 0.08) × 10−32(T /300)−4.4 [O2] 200–2631.22 × 10−33 exp[(833 ± 34)/T ] [N2] 195–390 Nickolaisen et al., 1994 FP-UVA (h)(1.96 ± 0.24) × 10−32 [N2] 300(1.24 ± 0.09) × 10−32 [O2] 300(2.5 ± 0.4) × 10−32 [N2] 300 Bloss, 1999 FP-UVA (i)1.7 × 10⁻³² [N2] 300 Stark, 1999 PLP-UVA (j)1.1 × 10⁻³¹ [N2] 200(1.56 ± 0.60) × 10−32 (T /300)−4.5 [N2] 183–245 Bloss et al., 2001 FP-UVA (k)
2448

ACPD6, 2281–2702, 2006
Evaluated kinetic andphotochemical data
for atmosphericchemistry
R. Atkinson et al.
Title Page
Abstract Introduction
Conclusions References
Tables Figures
J I
J I
Back Close
Full Screen / Esc
Printer-friendly Version
Interactive Discussion
EGU
Comments
(a) Photolysis of Cl2-O2 mixtures in the pressure range 0.07–1 bar.
(b) Pressure range 1.3–10 mbar.
(c) Pressure range 70–930 mbar.
(d) Photolysis of Cl2–O2 mixtures at 50–400 mbar.5
(e) Measurements in Cl2–O2 mixtures in the ratio 2:3, pressure range 7–30 mbar.
(f) ClO radicals generated from Cl2-Cl2O or Cl2-O3 mixtures with concentra-tions of bath gases N2, Ar or O2 in the range of 1018 molecule cm−3 to3×10−19 molecule cm−3. Falloff extrapolations to k0 and k∞ used a value ofFc=0.6.10
(g) ClO radicals generated from Cl2-O3 mixtures in the presence of 33 mbar to800 mbar of He, N2, O2 or SF6, ClO radicals and Cl2O2 monitored by long-pathUV absorption. Falloff curves extrapolated with Fc=0.6.
(h) Pulsed laser photolysis of Cl2 at λ>300 nm in the presence of Cl2O. ClO radi-cals generated by the reaction Cl+Cl2O→ClO+Cl2 and monitored by UV absorp-15
tion spectroscopy using either a photomultiplier for detection at 275.5 nm or anoptical multichannel analyzer for detection over the wavelength range 270 nmto 280 nm. Meaurements at 20–600 mbar. From a third-law analysis, a valueof ∆H◦=−(75.7±0.9) kJ mol−1 was derived. Third-body efficiencies for the bathgases He, Ar, CF4, SF6 and Cl2 were also determined.20
(i) ClO radicals generated by flash photolysis of Cl2-Cl2O-N2 mixtures and detectedby UV absorption. The bath gas pressure was varied between 0.25 bar and 1 bar.Falloff extrapolation used Fc=0.6. Small discrepancies between the various stud-ies were attributed to the slightly different absorption cross-sections used.
2449

ACPD6, 2281–2702, 2006
Evaluated kinetic andphotochemical data
for atmosphericchemistry
R. Atkinson et al.
Title Page
Abstract Introduction
Conclusions References
Tables Figures
J I
J I
Back Close
Full Screen / Esc
Printer-friendly Version
Interactive Discussion
EGU
(j) ClO radicals generated by pulsed laser photolysis of Cl2O between 0.1 bar and1000 bar pressure of He and N2. The observed pressure dependences differ fromconventional falloff expressions, suggesting overlapping contributions from theenergy transfer and radical-complex mechanism, as well as diffusion control atthe highest pressures. The cited rate coefficients correspond to a representation5
of the falloff curve at pressures below 1 bar using Fc=0.6.
(k) See comment (i). Pressure range 30–930 mbar. Falloff extrapolation with Fc=0.6and k∞=(1.36±0.2)×10−12 (T /300)−3.09 cm3 molecule−1 s−1.
Preferred Values
k0 = 2.0 × 10⁻³² (T /300)−4 [N2] cm3 molecule−1 s−1 over the temperature range 190–10
390 K.
Reliability
∆ log k0 = ± 0.1 at 298 K.∆ n = ± 1.5.
Comments on Preferred Values15
The preferred values are based on the studies of Trolier et al. (1999) and Bloss etal. (2001) accounting for some falloff, see coments on high-pressure rate coefficients.
2450

ACPD6, 2281–2702, 2006
Evaluated kinetic andphotochemical data
for atmosphericchemistry
R. Atkinson et al.
Title Page
Abstract Introduction
Conclusions References
Tables Figures
J I
J I
Back Close
Full Screen / Esc
Printer-friendly Version
Interactive Discussion
EGU
High-pressure rate coefficients
Rate coefficient data
k∞/cm3 molecule−1 s−1 Temp./K Reference Technique/Comments
Absolute Rate Coefficients(6 ± 2) × 10−12 194–247 Sander et al., 1989 FP-UVA (a)(4.8 ± 1.3) × 10−12 200–263 Trolier et al., 1990 FP-UVA (b)(6 ± 2) × 10−12 195–390 Nickolaisen et al., 1994 FP-UVA (c)(5 ± 3) × 10−12 300 Bloss, 1999 FP-UVA (d)4.5 × 10⁻¹² 300 Stark, 1999 PLP-UVA (e)7 × 10⁻¹² 200(1.36 ± 0.22) × 10−12 (T /300)−3.09 183–245 Bloss et al., 2001 FP-UVA (f)
Comments
(a) See comment (a) for k0.5
(b) See comment (g) for k0.
(c) See comment (h) for k0. The k∞ value was obtained from falloff data measuredbelow 250 K.
(d) See comment (i) for k0.
(e) See comment (j) for k0. The cited rate coefficients are given for the energy-10
transfer mechanism only, such that the falloff curves below 1 bar are fit-ted. Above 1 bar pressure additional contributions from the radical-complexmechanism become increasingly important such that maximum values of k of
2451

ACPD6, 2281–2702, 2006
Evaluated kinetic andphotochemical data
for atmosphericchemistry
R. Atkinson et al.
Title Page
Abstract Introduction
Conclusions References
Tables Figures
J I
J I
Back Close
Full Screen / Esc
Printer-friendly Version
Interactive Discussion
EGU
4.5×10⁻¹² cm3 molecule−1 s−1 at 300 K and 8×10⁻¹² cm3 molecule−1 s−1 at 200 Kare reached near 200 bar, before they decrease because of diffusional control.
(f) See comment (i) and (k) for k0.
Preferred Values
k∞ = 1.0 × 10⁻¹¹ cm3 molecule−1 s−1, independent of temperature over the range 190–5
300 K.
Reliability
∆ log k∞ = ± 0.3 over the temperature range 190 K to 300 K.
Comments on Preferred Values
It is difficult to provide a reasonable representation of k0, k∞ and Fc, because there10
is ample evidence that this reaction is governed by a superposition of the energy trans-fer and the radical-complex mechanism. The pressure dependence at P >1 bar looksanomalous (Stark, 1999). Likewise, the absolute value and the temperature coefficientof k0 appear unusual. Neglecting these aspects, one may use the representation givenby Bloss et al. (2001) with Fc=0.6 and k0 and k∞ as given in the table. We here choose15
a different representation with Fc=0.45 and the preferred values given above which rep-resent the data equally well at P <1 bar. However, we keep in mind that the mechanisticcomplications of this system ask for different treatments. Difficulties in the theoreticalanalysis of the rate coefficients were also encountered by Bloss et al. (2001), Golden(2003) and Zhu and Lin (2003).20
2452

ACPD6, 2281–2702, 2006
Evaluated kinetic andphotochemical data
for atmosphericchemistry
R. Atkinson et al.
Title Page
Abstract Introduction
Conclusions References
Tables Figures
J I
J I
Back Close
Full Screen / Esc
Printer-friendly Version
Interactive Discussion
EGU
References
Basco, N. and Hunt, J. K.: Int. J. Chem. Kinet., 11, 649, 1979.Bloss, W.: Ph.D. Thesis, University of Cambridge, Cambridge, UK, 1999.Bloss, W. J., Nickolaisen, S. L., Salawitch, R. J., Friedl, R. R., and Sander, S. P.: J.Phys. Chem. A, 105, 11226, 2001.5
Cox, R. A., Derwent, R. G., Eggleton, A. E. J., and Reid, H. J.: J. Chem. Soc. FaradayTrans., 1, 75, 1648, 1979.Golden, D. M.: Int. J. Kinet., 35, 206, 2003.Hayman, G. D., Davies, J. M., and Cox, R. A.: Geophys. Res. Lett., 13, 1347, 1986.Johnston, H. S., Morris, E. D., and Van de Bogaerde, J.: J. Am. Chem. Soc., 91, 7712,10
1969.Nickolaisen, S. L., Friedl, R. R., and Sander, S. P.: J. Phys. Chem., 98, 155, 1994.Sander, S. P., Friedl, R. R., and Yung, Y. L.: Science, 245, 1095, 1989.Stark, H.: Ph.D. Thesis, University of Gottingen, Gottingen, Germany, 1999.Trolier, M., Mauldin III, R. L., and Ravishankara, A. R.: J. Phys. Chem., 94, 4896,15
1990.Walker, R. W.: Ph.D. Thesis, University of London, London, UK, 1972.Zhu, R. S. and Lin, M. C.: J. Chem. Phys., 118, 3094, 2003.
2453

ACPD6, 2281–2702, 2006
Evaluated kinetic andphotochemical data
for atmosphericchemistry
R. Atkinson et al.
Title Page
Abstract Introduction
Conclusions References
Tables Figures
J I
J I
Back Close
Full Screen / Esc
Printer-friendly Version
Interactive Discussion
EGU
III.A2.51
Cl2O2 + M→ ClO + ClO + M
∆H◦ = 75.7 kJ·mol−1
Low-pressure rate coefficients
Rate coefficient data5
k0/s−1 Temp./K Reference Technique/Comments
Absolute Rate Coefficients9.81 × 10−7 exp[-(7980 ± 320)/T ] [N2] 260–310 Nickolaisen et al., 1994 FP-UVA (a)2.30 × 10⁻¹⁸ [N2] 298
Comments
(a) Photolysis of Cl2 at λ>300 nm in the presence of Cl2O. ClO radicals were mon-itored with an optical multichannel analyzer at 270 nm to 280 nm. The pressure10
range used was 33 mbar to 400 mbar. Dissociation rate coefficients and equi-librium constants determined from analysis of two stages of ClO decay. Froma third-law analysis, a value of ∆H◦=(75.7±0.9) kJ mol−1 was derived. A valueof the equilibrium constant Kc=(1.24±0.18)×10−27 exp{8820/T } cm3 molecule−1
was obtained in good agreement with a determination by Cox and Hayman (1988).15
2454

ACPD6, 2281–2702, 2006
Evaluated kinetic andphotochemical data
for atmosphericchemistry
R. Atkinson et al.
Title Page
Abstract Introduction
Conclusions References
Tables Figures
J I
J I
Back Close
Full Screen / Esc
Printer-friendly Version
Interactive Discussion
EGU
Preferred Values
k0 = 2.3 × 10⁻¹⁸ [N2] s−1 at 298 K.k0 = 3.7 × 10⁻⁷ exp(−7690/T ) [N2] s−1 over the temperature range 260–310 K.
Reliability
∆ log k0 = ± 0.3 at 298 K.5
∆ E/R = ± 900 K.
Comments on Preferred Values
The preferred values are based on the preferred values for the reverse reaction andthe equilibrium constant from Nickolaisen et al. (1994) which agrees very well with theresults of Cox and Hayman (1988).10
High-pressure rate coefficients
Rate coefficient data
k∞/s−1 Temp./K Reference Technique/Comments
Absolute Rate Coefficients4.8 × 1015 exp(−8820/T ) 260–310 Nickolaisen et al., 1994 FP-UVA (a)6.7 × 10² 298
Comments
(a) See comment (a) for k0. Falloff curve constructed with Fc=0.6.15
2455

ACPD6, 2281–2702, 2006
Evaluated kinetic andphotochemical data
for atmosphericchemistry
R. Atkinson et al.
Title Page
Abstract Introduction
Conclusions References
Tables Figures
J I
J I
Back Close
Full Screen / Esc
Printer-friendly Version
Interactive Discussion
EGU
Preferred Values
k∞ = 1.1 × 10³ s−1 at 298 K.k∞ = 1.8 × 10¹⁴ exp(−7690/T ) s−1 over the temperature range 260–310 K.
Reliability
∆ log k∞ = ± 0.3 at 298 K.5
∆ (E/R) = ± 500 K.
Comments on Preferred Values
The preferred values are based on the preferred values for the reverse reaction andthe equilibrium constant from Nickolaisen et al. (1994). Falloff curves are constructedwith Fc=0.45 like for the reverse reaction. One should keep in mind, however, that only10
data at P <1 bar are represented. There is ample evidence that the reaction is governedby a superposition of the energy transfer and the radical-complex mechanism such thatthe chosen simple representation of the falloff curve does not apply rigorously.
References
Cox, R. A. and Hayman, G. D.: Nature, 332, 796, 1988.15
Nickolaisen, S. L., Friedl, R. R., and Sander, S. P.: J. Phys. Chem., 98, 155, 1994.
2456

ACPD6, 2281–2702, 2006
Evaluated kinetic andphotochemical data
for atmosphericchemistry
R. Atkinson et al.
Title Page
Abstract Introduction
Conclusions References
Tables Figures
J I
J I
Back Close
Full Screen / Esc
Printer-friendly Version
Interactive Discussion
EGU
III.A2.52
ClO + OClO + M→ Cl2O3 + M
∆H◦ = −43.2 kJ·mol−1
Low-pressure rate coefficients
Rate coefficient data5
k0/cm3 molecule−1 s−1 Temp./K Reference Technique/Comments
Absolute Rate Coefficients2.8 × 10−31 [N2] 226 Parr et al., 1990 MM-UVA (a)(6.2 ± 1.0) × 10−32(T /300)−4.7 [N2] 200–260 Burkholder et al., 1993 PLP-UVA (b)
Comments
(a) Experiments carried out with Cl2-OClO-N2 mixtures in the pressure range 6.4–39 mbar. ClO monitored at 277.2 nm. The reaction was apparently close to thelow pressure limit.10
(b) Pulsed laser photolysis of mixtures of N2O-Cl2-OClO-He or CF2Cl2-OClO-N2 at193 nm. From the first mixture, rate data were obtained while from the sec-ond mixture equilibrium constants and the absorption spectra of Cl2O3 between220 nm and 320 nm were derived. From a second-law analysis of the data, to-gether with those of Hayman and Cox (1989), ∆H◦=−(46.4±5.1) kJ mol−1 and15
∆S◦=−(88.7±18.9) J mol−1 K−1 were derived. The kinetic data were obtainedfrom a fit of the falloff curves between 33 mbar and 333 mbar total pressure usingFc=0.6.
2457

ACPD6, 2281–2702, 2006
Evaluated kinetic andphotochemical data
for atmosphericchemistry
R. Atkinson et al.
Title Page
Abstract Introduction
Conclusions References
Tables Figures
J I
J I
Back Close
Full Screen / Esc
Printer-friendly Version
Interactive Discussion
EGU
Preferred Values
k0 = 6.2 × 10⁻³² (T /300)−4.7[N2] cm3 molecule−1 s−1 over the temperature range 200–300 K.
Reliability
∆ log k0 = ± 0.3 at 298 K.5
∆ (n) = ± 1.
Comments on Preferred Values
The values of the extensive study of Burkholder et al. (1993) are adopted here.At 226 K the rate coefficient of Parr et al. (1990) is in reasonable agreement with ourpreferred value (and therefore with the data of Burkholder et al., 1993). Ab-initio cal-10
culations from Clark and Francisco (1997) predict the more stable structure of Cl2O3to be ClOCl(O)O and result in a value of the enthalpy of the recombination reaction of−45.6 kJ mol−1.
High-pressure rate coefficients
Rate coefficient data15
k∞/cm3 molecule−1 s−1 Temp./K Reference Technique/Comments
Absolute Rate Coefficients(2.4 ± 1.2) × 10−11 200–260 Burkholder et al., 1993 (a)
2458
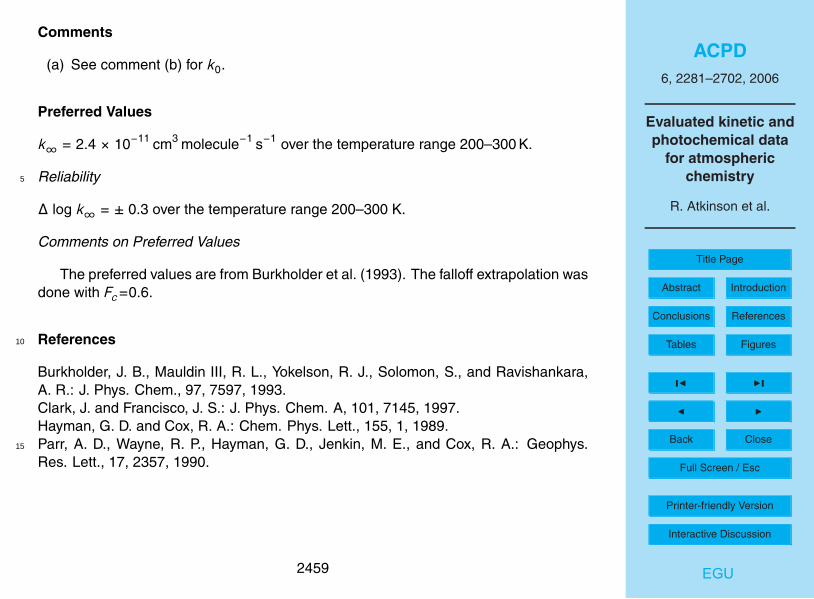
ACPD6, 2281–2702, 2006
Evaluated kinetic andphotochemical data
for atmosphericchemistry
R. Atkinson et al.
Title Page
Abstract Introduction
Conclusions References
Tables Figures
J I
J I
Back Close
Full Screen / Esc
Printer-friendly Version
Interactive Discussion
EGU
Comments
(a) See comment (b) for k0.
Preferred Values
k∞ = 2.4 × 10⁻¹¹ cm3 molecule−1 s−1 over the temperature range 200–300 K.
Reliability5
∆ log k∞ = ± 0.3 over the temperature range 200–300 K.
Comments on Preferred Values
The preferred values are from Burkholder et al. (1993). The falloff extrapolation wasdone with Fc=0.6.
References10
Burkholder, J. B., Mauldin III, R. L., Yokelson, R. J., Solomon, S., and Ravishankara,A. R.: J. Phys. Chem., 97, 7597, 1993.Clark, J. and Francisco, J. S.: J. Phys. Chem. A, 101, 7145, 1997.Hayman, G. D. and Cox, R. A.: Chem. Phys. Lett., 155, 1, 1989.Parr, A. D., Wayne, R. P., Hayman, G. D., Jenkin, M. E., and Cox, R. A.: Geophys.15
Res. Lett., 17, 2357, 1990.
2459

ACPD6, 2281–2702, 2006
Evaluated kinetic andphotochemical data
for atmosphericchemistry
R. Atkinson et al.
Title Page
Abstract Introduction
Conclusions References
Tables Figures
J I
J I
Back Close
Full Screen / Esc
Printer-friendly Version
Interactive Discussion
EGU
III.A2.53
Cl2O3 + M→ ClO + OClO + M
∆H◦ = 43.2 kJ·mol−1
Low-pressure rate coefficients
Rate coefficient data5
No direct measurements are available.
Preferred Values
k0 = 1.4 × 10⁻¹⁰ exp(−3810/T ) [N2] s−1 over the temperature range 200–300 K.
Reliability
∆ log k0 = ± 0.5 at 240 K.10
∆ E/R = ± 500 K.
Comments on Preferred Values
The preferred values are from the preferred values for the reverse reactionk0=6.2×10⁻³² (T /300)−4.7 [N2] cm3 molecule−1 s−1 , which were based on the mea-surements by Parr et al. (1990) and Burkholder et al. (1993), and the equilibrium con-15
stant Kc=9.7×10⁻²⁴ exp(4940/T ) cm3 molecule−1 from Burkholder et al. (1993) andHayman and Cox (1989).
2460

ACPD6, 2281–2702, 2006
Evaluated kinetic andphotochemical data
for atmosphericchemistry
R. Atkinson et al.
Title Page
Abstract Introduction
Conclusions References
Tables Figures
J I
J I
Back Close
Full Screen / Esc
Printer-friendly Version
Interactive Discussion
EGU
High-pressure rate coefficients
Rate coefficient data
No direct measurements are available.
Preferred Values
k∞ = 2.5 × 10¹² exp(−4940/T ) [N2] s−1 over the temperature range 200–300 K.5
Reliability
∆ log k∞ = ± 0.5 at 240 K.∆ E/R = ± 500 K.
Comments on Preferred Values
See comments on Preferred Values for k0. Based on k∞ for the reverse reaction of10
k∞=2.4×10⁻¹¹ cm3 molecule−1 s−1. Falloff curves constructed with Fc=0.6.
References
Burkholder, J. B., Mauldin III, R. L., Yokelson, R. J., Solomon, S., and Ravishankara,A. R.: J. Phys. Chem., 97, 7597, 1993.Hayman, G. D. and Cox, R. A.: Chem. Phys. Lett., 155, 1, 1989.15
Parr, A. D., Wayne, R. P., Hayman, G. D., Jenkin, M. E., and Cox, R. A.: Geophys.Res. Lett., 17, 2357, 1990.
2461

ACPD6, 2281–2702, 2006
Evaluated kinetic andphotochemical data
for atmosphericchemistry
R. Atkinson et al.
Title Page
Abstract Introduction
Conclusions References
Tables Figures
J I
J I
Back Close
Full Screen / Esc
Printer-friendly Version
Interactive Discussion
EGU
III.A2.54
OClO + O3 → ClO3 + O2
∆H◦ = −20 kJ·mol−1
Rate coefficient data
5
k/cm3 molecule−1 s−1 Temp./K Reference Technique/Comments
Absolute Rate Coefficients(1.20 ± 0.15) × 10−19 298 Birks et al., 1977 (a)2.3 × 10⁻¹² exp[-(4730 ± 630)/T ] 262–298 Wongdontri-Stuper et al., 1979 PLP-UVA (b)3.0 × 10⁻¹⁹ 298
Comments
(a) Static system, rate coefficient determined by monitoring the loss of O3 in excessOClO and also loss of OClO in excess O3. Both species were measured by UVA;O3 at 254 nm and OClO at 366 nm.10
(b) The decay of OClO in excess O3 was monitored by UVA at 400 nm. The reactionrate was also determined by the pulsed photolysis of Cl2-O2 mixtures at 366 nmto produce OClO, followed by monitoring OClO decay.
Preferred Values
k = 3.0 × 10⁻¹⁹ cm3 molecule−1 s−1 at 298 K.15
k = 2.1 × 10⁻¹² exp(−4700/T ) cm3 molecule−1 s−1 over the temperature range 260–2462

ACPD6, 2281–2702, 2006
Evaluated kinetic andphotochemical data
for atmosphericchemistry
R. Atkinson et al.
Title Page
Abstract Introduction
Conclusions References
Tables Figures
J I
J I
Back Close
Full Screen / Esc
Printer-friendly Version
Interactive Discussion
EGU
300 K.
Reliability
∆ log k = ± 0.4 at 298 K.∆ (E/R) = ± 1000 K.
Comments on Preferred Values5
The preferred values are based on the results reported in the study of Wongdontri-Stuper et al. (1979). Within the indicated uncertainty limits, the preferred values en-compass the lower room temperature value reported by Birks et al. (1977).
References
Birks, J. W., Shoemaker, B., Leck, T. J., Borders, R. A., and Hart, L. J.: J. Chem.10
Phys., 66, 4591, 1977.Wongdontri-Stuper, W., Jayanty, R. K. M., Simonaitis, R., and Heicklen, J.: J. Pho-tochem., 10, 163, 1979.
2463

ACPD6, 2281–2702, 2006
Evaluated kinetic andphotochemical data
for atmosphericchemistry
R. Atkinson et al.
Title Page
Abstract Introduction
Conclusions References
Tables Figures
J I
J I
Back Close
Full Screen / Esc
Printer-friendly Version
Interactive Discussion
EGU
III.A2.55
OClO + NO→ ClO + NO2
∆H◦ = −50.0 kJ·mol−1
Rate coefficient data
k/cm3 molecule−1 s−1 Temp./K Reference Technique/Comments
Absolute Rate Coefficients(3.4 ± 0.5) × 10−13 298 Bemand et al., 1973 DF-MS1.04 × 10−13 exp[(347 ± 58)/T ] 220–367 Li et al., 2002 DF-MS(3.55 ± 0.30) × 10−13 2985
Preferred Values
k = 3.6 × 10⁻¹³ cm3 molecule−1 s−1 at 298 K.k = 1.1 × 10⁻¹³ exp(350/T ) cm3 molecule−1 s−1 over the temperature range 220–370 K.
Reliability
∆ log k = ± 0.15 at 298 K.10
∆ (E/R) = ± 200 K.
Comments on Preferred Values
The two available studies of this reaction (Bemand et al., 1973; Li et al., 2002), bothusing the same method, show good agreement at the common temperature, 298 K,and the recommendation at this temperature is the average result. The recommended15
2464

ACPD6, 2281–2702, 2006
Evaluated kinetic andphotochemical data
for atmosphericchemistry
R. Atkinson et al.
Title Page
Abstract Introduction
Conclusions References
Tables Figures
J I
J I
Back Close
Full Screen / Esc
Printer-friendly Version
Interactive Discussion
EGU
temperature dependence is provided by the study of Li et al. (2002), with a slight cor-rection to the pre-exponential factor to match the preferred value at 298 K.
References
Bemand, P. P., Clyne, M. A. A., and Watson, R. T.: J. Chem. Soc. Faraday Trans., 1,69, 1356, 1973.5
Li, Z., Wuebbles, D., and Pylawka, N. J.: Chem. Lett., 354, 491, 2002.
2465

ACPD6, 2281–2702, 2006
Evaluated kinetic andphotochemical data
for atmosphericchemistry
R. Atkinson et al.
Title Page
Abstract Introduction
Conclusions References
Tables Figures
J I
J I
Back Close
Full Screen / Esc
Printer-friendly Version
Interactive Discussion
EGU
III.A2.56
OClO + NO3 → products
Rate coefficient data
k/cm3 molecule−1 s−1 Temp./K Reference Technique/Comments
Absolute Rate Coefficients< 1 × 10⁻¹⁵ 300 Biggs et al., 1991 DF-UV2 × 10−14 298 Friedl et al., 1992 (a)2 × 10⁻¹⁴ 220< 6 × 10⁻¹⁷ 298–300 Boyd et al., 1996 (b)
Comments5
(a) The experiments were carried out in a long-path absorption flow reactor. NO3radicals were generated by the reaction of F atoms with HNO3 or of Cl atomswith ClONO2. The products were analysed by IR and UV absorption measure-ments. Rate constant at 298 K derived by computer simulation of NO3, OClO andClO profiles, and assuming NO2+O2+ClO are products. At 220 K and 5.3 mbar10
He, formation of chlorylnitrate (O2ClONO2) in a termolecular reaction channelwas observed, with an apparent rate constant of 2×10⁻¹⁴ cm3 molecule−1 s−1. Atthis temperature the rate constant for the bimolecular channel was derived to be2×10−15 cm3 molecule−1 s−1.
(b) Room temperature studies at low pressure in discharge stopped flow (typi-15
cally 10.7 mbar), slow flow (typically 8 mbar) and discharge flow (2.7 mbar) ex-periments. Detection of both NO3 and OClO was achieved using absorption
2466

ACPD6, 2281–2702, 2006
Evaluated kinetic andphotochemical data
for atmosphericchemistry
R. Atkinson et al.
Title Page
Abstract Introduction
Conclusions References
Tables Figures
J I
J I
Back Close
Full Screen / Esc
Printer-friendly Version
Interactive Discussion
EGU
spectroscopy. The slow flow experiments are comparable to those of Friedl etal. (1992).
Preferred Values
No recommendation is given.
Comments on Preferred Values5
The available results of the studies of this reaction are very divergent. In their laterstudy, Boyd et al. (1996) were unable to interpret their observations, obtained in threedifferent set ups, in terms of a gas-phase reaction between NO3 and OClO, and sug-gest that heterogeneous processes play an important role in their study, and potentiallytherefore also in the similar study of Friedl et al. (1992). Further work is clearly needed10
to resolve these discrepancies, and until this is available no recommendation is given,other than to note that the reaction is slow.
References
Biggs, P., Harwood, M. H., Parr, A. D., and Wayne, R. P.: J. Phys. Chem., 95, 7746,1991.15
Boyd, A. A., Marston, G., and Wayne, R. P.: J. Phys. Chem., 100, 130, 1996.Friedl, R. R., Sander, S. P., and Yung, Y. L.: J. Phys. Chem., 96, 7490, 1992.
2467

ACPD6, 2281–2702, 2006
Evaluated kinetic andphotochemical data
for atmosphericchemistry
R. Atkinson et al.
Title Page
Abstract Introduction
Conclusions References
Tables Figures
J I
J I
Back Close
Full Screen / Esc
Printer-friendly Version
Interactive Discussion
EGU
III.A2.57
Cl2O2 + O3 → ClO + ClOO + O2
∆H◦ = −71.2 kJ·mol−1
Rate coefficient data
5
k/cm3 molecule−1 s−1 Temp./K Reference Technique/Comments
Absolute Rate Coefficients< 1 × 10⁻¹⁹ 195–217 DeMore and Tschuikow-Roux, 1990 (a)
Comments
(a) Photolysis (λ>300 nm) of Cl2-O3 or Cl2-Cl2O mixtures, both in the gas phase andin the cryogenic solvents CF4, CO2 and N2O. The quantum yield of O3 loss wasmeasured.10
Preferred Values
k < 1 × 10⁻¹⁹ cm3 molecule−1 s−1 at 200 K.
Comments on Preferred Values
The recommended upper limit to the rate coefficient is that determined by DeMoreand Tschuikow-Roux (1990) from measurements of the quantum yield of O3 loss in15
the photolysis of Cl2-O3 mixtures at λ>300 nm. The experiments were very sensitive
2468

ACPD6, 2281–2702, 2006
Evaluated kinetic andphotochemical data
for atmosphericchemistry
R. Atkinson et al.
Title Page
Abstract Introduction
Conclusions References
Tables Figures
J I
J I
Back Close
Full Screen / Esc
Printer-friendly Version
Interactive Discussion
EGU
to this reaction. Reaction at a rate greater than this upper limit would have had amarked effect on the quantum yield of ozone loss and also would have resulted in adependence of the quantum yield on the ozone concentration; however, neither effectwas observed (DeMore and Tschuikow-Roux, 1990). These measurements refer to atemperature of about 200 K; the value of this rate coefficient at higher temperatures5
would be of no atmospheric significance because of the thermal decomposition of theCl2O2 dimer.
References
DeMore, W. B. and Tschuikow-Roux, E.: J. Phys. Chem., 94, 5856, 1990.10
2469
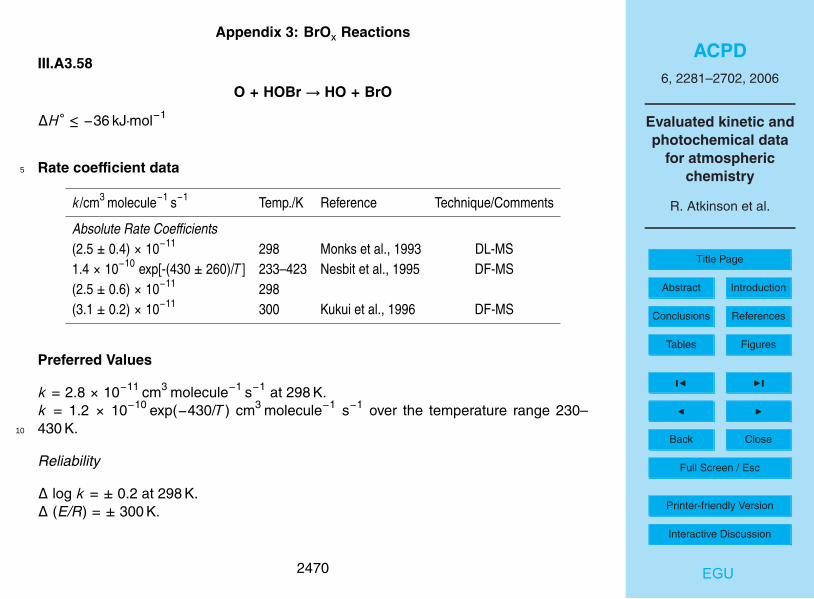
ACPD6, 2281–2702, 2006
Evaluated kinetic andphotochemical data
for atmosphericchemistry
R. Atkinson et al.
Title Page
Abstract Introduction
Conclusions References
Tables Figures
J I
J I
Back Close
Full Screen / Esc
Printer-friendly Version
Interactive Discussion
EGU
Appendix 3: BrOx Reactions
III.A3.58
O + HOBr→ HO + BrO
∆H◦ ≤ −36 kJ·mol−1
Rate coefficient data5
k/cm3 molecule−1 s−1 Temp./K Reference Technique/Comments
Absolute Rate Coefficients(2.5 ± 0.4) × 10−11 298 Monks et al., 1993 DL-MS1.4 × 10−10 exp[-(430 ± 260)/T ] 233–423 Nesbit et al., 1995 DF-MS(2.5 ± 0.6) × 10−11 298(3.1 ± 0.2) × 10−11 300 Kukui et al., 1996 DF-MS
Preferred Values
k = 2.8 × 10⁻¹¹ cm3 molecule−1 s−1 at 298 K.k = 1.2 × 10⁻¹⁰ exp(−430/T ) cm3 molecule−1 s−1 over the temperature range 230–430 K.10
Reliability
∆ log k = ± 0.2 at 298 K.∆ (E/R) = ± 300 K.
2470

ACPD6, 2281–2702, 2006
Evaluated kinetic andphotochemical data
for atmosphericchemistry
R. Atkinson et al.
Title Page
Abstract Introduction
Conclusions References
Tables Figures
J I
J I
Back Close
Full Screen / Esc
Printer-friendly Version
Interactive Discussion
EGU
Comments on Preferred Values
The preferred rate coefficient at 298 K is the mean of the values of Nesbitt etal. (1995) and Kukui et al. (1996) and the temperature dependence is that of Nesbittet al. (1995) with the A-factor adjusted to yield the preferred rate coefficient at 298 K.Note that the rate coefficient for this reaction is almost a factor of 200 greater than that5
for the corresponding reaction of O(3P) atoms with HOCl (IUPAC, 2005).
References
IUPAC: http://www.iupac-kinetic.ch-cam.ac.uk/, 2005.Kukui, A., Kirchner, U., Benter, T., and Schindler, R. N.: Ber. Bunsenges. Phys.Chem., 100, 455, 1996.10
Monks, P. S., Nesbitt, F. L., Scanlon, M., and Stief, L. J.: J. Phys. Chem., 97, 11 699,1993.Nesbitt, F. L., Monks, P. S., Payne, W. A., Stief, L. J., and Toumi, R.: Geophys. Res.Lett., 22, 827, 1995.
15
2471

ACPD6, 2281–2702, 2006
Evaluated kinetic andphotochemical data
for atmosphericchemistry
R. Atkinson et al.
Title Page
Abstract Introduction
Conclusions References
Tables Figures
J I
J I
Back Close
Full Screen / Esc
Printer-friendly Version
Interactive Discussion
EGU
III.A3.59
O + BrO→ O2 + Br
∆H◦ = −257 kJ·mol−1
Rate coefficient data
k/cm3 molecule−1 s−1 Temp./K Reference Technique/Comments
Absolute Rate Coefficients(2.5+2.5
−1.5) × 10−11 298 Clyne et al., 1976 DF-RF (a)1.9 × 10⁻¹¹ exp[(230 ± 150)/T ] 231–328 Thorn et al., 1995 PLP-A/RF (b)(4.1 ± 0.6) × 10−11 2985
Comments
(a) Measurements of O atom consumption rates and Br atom production rates in theO+Br2 reaction were interpreted to give an estimate of k(O+BrO→ O2+Br).
(b) Pulsed laser flash photolysis system with detection of BrO radicals by long pathabsorption and of O(3P) atoms by resonance fluorescence.10
Preferred Values
k = 4.1 × 10⁻¹¹ cm3 molecule−1 s−1 at 298 K.k = 1.9 × 10⁻¹¹ exp(230/T ) cm3 molecule−1 s−1 over the temperature range 230–330 K.
2472

ACPD6, 2281–2702, 2006
Evaluated kinetic andphotochemical data
for atmosphericchemistry
R. Atkinson et al.
Title Page
Abstract Introduction
Conclusions References
Tables Figures
J I
J I
Back Close
Full Screen / Esc
Printer-friendly Version
Interactive Discussion
EGU
Reliability
∆ log k = ± 0.2 at 298 K.∆ (E/R) = ± 150 K.
Comments on Preferred Values
The preferred value is based on the direct study of Thorn et al. (1995) in which5
the decay of O(3P) in the presence of excess BrO was monitored. Clyne et al. (1976)derived an indirect estimate of the room temperature value which was approximately40% lower than the preferred value given above.
References
Clyne, M. A. A., Monkhouse, P. B., and Townsend, L. W.: Int. J. Chem. Kinet., 8, 425,10
1976.Thorn, R. P., Cronkhite, J. M., Nicovich, J. M., and Wine, P. H.: J. Chem. Phys., 102,4131, 1995.
2473

ACPD6, 2281–2702, 2006
Evaluated kinetic andphotochemical data
for atmosphericchemistry
R. Atkinson et al.
Title Page
Abstract Introduction
Conclusions References
Tables Figures
J I
J I
Back Close
Full Screen / Esc
Printer-friendly Version
Interactive Discussion
EGU
III.A3.60
Br + HO2 → HBr + O2
∆H◦ = −162.8 kJ·mol−1
Rate coefficient data
k/cm3 molecule−1 s−1 Temp./K Reference Technique/Comments
Absolute Rate Coefficients1.4 × 10−11 exp[-(590 ± 140)/T ] 260–390 Toohey et al., 1987 DF-LMR/RF (a)(2.0 ± 0.3) × 10−12 298(1.5 ± 0.2) × 10−12 298 Laverdet et al., 1990 DF-EPR (b)4.9 × 10⁻¹² exp[-(310 ± 40)/T ] 230–355 Bedjanian et al., 2001 DF-MS (c)(1.71 ± 0.20) × 10−12 2975
Comments
(a) Br atoms generated either directly by discharge of Br2, or from the addition ofdiluted Br2 to an excess of O(3P) atoms. HO2 radicals were generated by theF+H2O2 reaction. HO2 radicals and Br atoms were monitored by laser magneticresonance and resonance fluorescence, respectively. k was determined from10
pseudo-first order decay of HO2 in the presence of excess Br.
(b) Br atoms generated either directly by discharge of Br2, or from the Cl+CH2=CHBrreaction. HO2 radicals were generated from the reaction of Cl with CH3OH inthe presence of O2. k was determined from pseudo-first order decay of HO2 inthe presence of excess Br. A reinterpretation of previous indirect measurements15
2474
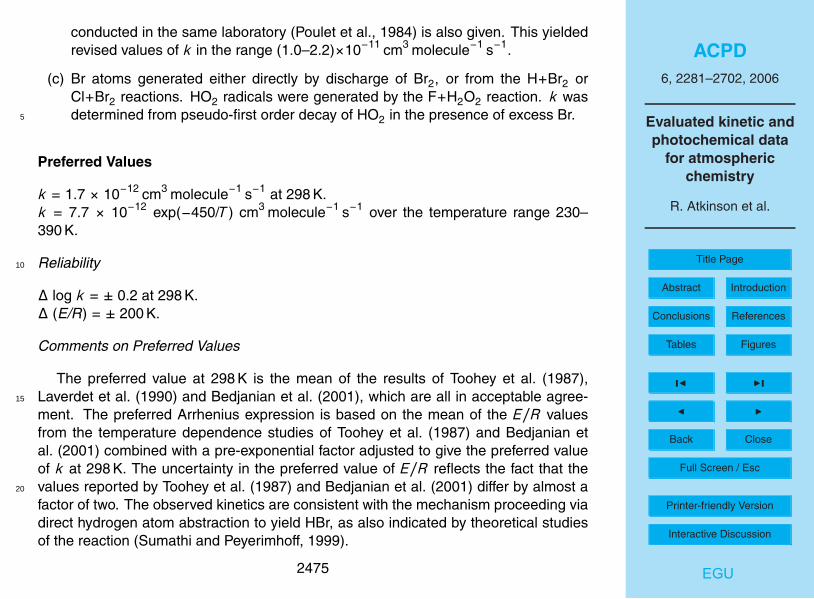
ACPD6, 2281–2702, 2006
Evaluated kinetic andphotochemical data
for atmosphericchemistry
R. Atkinson et al.
Title Page
Abstract Introduction
Conclusions References
Tables Figures
J I
J I
Back Close
Full Screen / Esc
Printer-friendly Version
Interactive Discussion
EGU
conducted in the same laboratory (Poulet et al., 1984) is also given. This yieldedrevised values of k in the range (1.0–2.2)×10−11 cm3 molecule−1 s−1.
(c) Br atoms generated either directly by discharge of Br2, or from the H+Br2 orCl+Br2 reactions. HO2 radicals were generated by the F+H2O2 reaction. k wasdetermined from pseudo-first order decay of HO2 in the presence of excess Br.5
Preferred Values
k = 1.7 × 10⁻¹² cm3 molecule−1 s−1 at 298 K.k = 7.7 × 10⁻¹² exp(−450/T ) cm3 molecule−1 s−1 over the temperature range 230–390 K.
Reliability10
∆ log k = ± 0.2 at 298 K.∆ (E/R) = ± 200 K.
Comments on Preferred Values
The preferred value at 298 K is the mean of the results of Toohey et al. (1987),Laverdet et al. (1990) and Bedjanian et al. (2001), which are all in acceptable agree-15
ment. The preferred Arrhenius expression is based on the mean of the E/R valuesfrom the temperature dependence studies of Toohey et al. (1987) and Bedjanian etal. (2001) combined with a pre-exponential factor adjusted to give the preferred valueof k at 298 K. The uncertainty in the preferred value of E/R reflects the fact that thevalues reported by Toohey et al. (1987) and Bedjanian et al. (2001) differ by almost a20
factor of two. The observed kinetics are consistent with the mechanism proceeding viadirect hydrogen atom abstraction to yield HBr, as also indicated by theoretical studiesof the reaction (Sumathi and Peyerimhoff, 1999).
2475

ACPD6, 2281–2702, 2006
Evaluated kinetic andphotochemical data
for atmosphericchemistry
R. Atkinson et al.
Title Page
Abstract Introduction
Conclusions References
Tables Figures
J I
J I
Back Close
Full Screen / Esc
Printer-friendly Version
Interactive Discussion
EGU
References
Bedjanian, Y., Riffault, V., Le Bras, G., and Poulet, G.: J. Phys. Chem. A, 105, 573,2001.Laverdet, G., Le Bras, G., Mellouki, A., and Poulet, G.: Chem. Phys. Lett., 172, 430,1990.5
Poulet, G., Laverdet, G., and Le Bras, G.: J. Chem. Phys., 80, 1922, 1984.Sumathi, R. and Peyerimhoff, S. D.: Phys. Chem. Chem. Phys., 1, 3973, 1999.Toohey, D. W., Brune, W. H., and Anderson, J. G.: J. Phys. Chem., 91, 1215, 1987.
2476

ACPD6, 2281–2702, 2006
Evaluated kinetic andphotochemical data
for atmosphericchemistry
R. Atkinson et al.
Title Page
Abstract Introduction
Conclusions References
Tables Figures
J I
J I
Back Close
Full Screen / Esc
Printer-friendly Version
Interactive Discussion
EGU
III.A3.61
Br + H2O2 → HBr + HO2 (1)→ HOBr + HO (2)
∆H◦(1) = 2.8 kJ·mol−1
∆H◦(2) ≤ 6 kJ·mol−1
Rate coefficient data (k=k1+k2)5
k/cm3 molecule−1 s−1 Temp./K Reference Technique/Comments
Absolute Rate Coefficients< 1.5 × 10⁻¹⁵ 298 Leu, 1980 DF-MS< 3.0 × 10⁻¹⁵ 417< 2.0 × 10⁻¹⁵ ∼ 298 Posy et al., 1981 DF-MS< 5 × 10⁻¹⁶ 298 Toohey et al., 1987 DF-RF (a)< 5 × 10⁻¹⁶ 378
Comments
(a) Decays of Br radicals were monitored in the presence of excess H2O2. Mea-surement of HO2 and HO radical products by LMR allowed upper limits of5×10−16 cm3 molecule−1 s−1 to be derived for both channel (1) and channel (2).10
Preferred Values
k < 5 × 10⁻¹⁶ cm3 molecule−1 s−1 at 298 K.
2477

ACPD6, 2281–2702, 2006
Evaluated kinetic andphotochemical data
for atmosphericchemistry
R. Atkinson et al.
Title Page
Abstract Introduction
Conclusions References
Tables Figures
J I
J I
Back Close
Full Screen / Esc
Printer-friendly Version
Interactive Discussion
EGU
Comments on Preferred Values
The upper limit to the preferred value is based on the data of Toohey et al. (1987)who also obtained the same upper limit at 378 K. The upper limits to the rate constant ofToohey et al. (1987) are consistent with the previous higher upper limits of Leu (1980)and Posey et al. (1981).5
References
Leu, M.-T.: Chem. Phys. Lett., 69, 37, 1980.Posey, J., Sherwell, J., and Kaufman, M.: Chem. Phys. Lett., 77, 476, 1981.Toohey, D. W., Brune, W. H., and Anderson, J. G.: J. Phys. Chem., 91, 1215, 1987.
10
2478

ACPD6, 2281–2702, 2006
Evaluated kinetic andphotochemical data
for atmosphericchemistry
R. Atkinson et al.
Title Page
Abstract Introduction
Conclusions References
Tables Figures
J I
J I
Back Close
Full Screen / Esc
Printer-friendly Version
Interactive Discussion
EGU
III.A3.62
Br + O3 → BrO + O2
∆H◦ = −135 kJ·mol−1
Rate coefficient data
k/cm3 molecule−1 s−1 Temp./K Reference Technique/Comments
Absolute Rate Coefficients(1.2 ± 0.2) × 10−12 298 Clyne and Watson, 1975 DF-MS3.34 × 10−11 exp[-(978 ± 36)/T ] 224–422 Leu and DeMore, 1977 DF-MS(1.16 ± 0.16) × 10−12 2987.74 × 10−12 exp[-(603 ± 16)/T ] 200–360 Michael et al., 1978 FP-RF(1.01 ± 0.18) × 10−12 2989.45 × 10−12 exp[-(659 ± 64)/T ] 234–360 Michael and Payne, 1979 DF-RF(1.12 ± 0.07) × 10−12 2983.28 × 10−11 exp[-(944 ± 30)/T ] 248–418 Toohey et al., 1988 DF-RF1.42 ± 0.03) × 10−12 2981.50 × 10−11 exp[-(775 ± 30)/T ] 195–392 Nicovich et al., 1990 PLP-RF(1.11 ± 0.07) × 10−12 298(1.2 ± 0.1) × 10−12 298 Ninomiya et al., 2000 PLP-CRDS (a)5
Comments
(a) BrO formation was monitored by cavity ring down spectroscopy at 338.5 nm. Thebackground signal was monitored at 338.1 nm.
2479
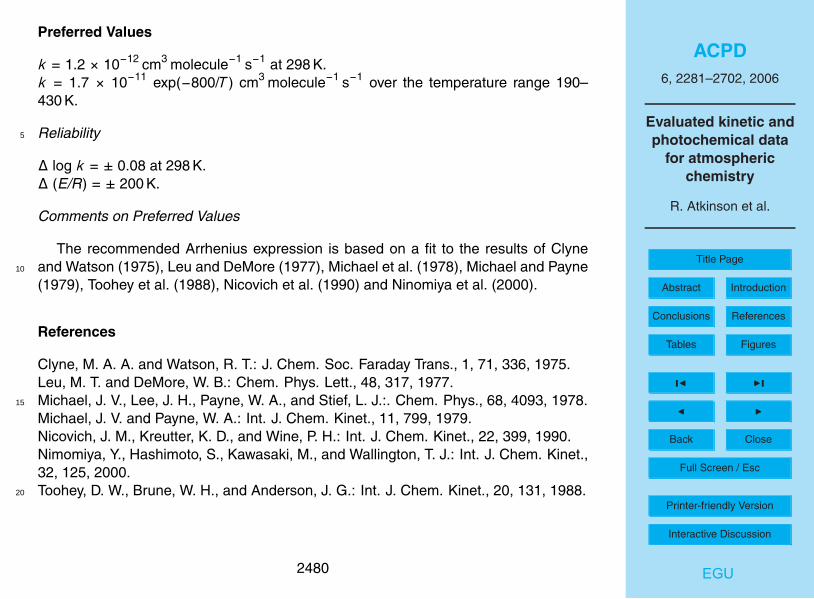
ACPD6, 2281–2702, 2006
Evaluated kinetic andphotochemical data
for atmosphericchemistry
R. Atkinson et al.
Title Page
Abstract Introduction
Conclusions References
Tables Figures
J I
J I
Back Close
Full Screen / Esc
Printer-friendly Version
Interactive Discussion
EGU
Preferred Values
k = 1.2 × 10⁻¹² cm3 molecule−1 s−1 at 298 K.k = 1.7 × 10⁻¹¹ exp(−800/T ) cm3 molecule−1 s−1 over the temperature range 190–430 K.
Reliability5
∆ log k = ± 0.08 at 298 K.∆ (E/R) = ± 200 K.
Comments on Preferred Values
The recommended Arrhenius expression is based on a fit to the results of Clyneand Watson (1975), Leu and DeMore (1977), Michael et al. (1978), Michael and Payne10
(1979), Toohey et al. (1988), Nicovich et al. (1990) and Ninomiya et al. (2000).
References
Clyne, M. A. A. and Watson, R. T.: J. Chem. Soc. Faraday Trans., 1, 71, 336, 1975.Leu, M. T. and DeMore, W. B.: Chem. Phys. Lett., 48, 317, 1977.Michael, J. V., Lee, J. H., Payne, W. A., and Stief, L. J.:. Chem. Phys., 68, 4093, 1978.15
Michael, J. V. and Payne, W. A.: Int. J. Chem. Kinet., 11, 799, 1979.Nicovich, J. M., Kreutter, K. D., and Wine, P. H.: Int. J. Chem. Kinet., 22, 399, 1990.Nimomiya, Y., Hashimoto, S., Kawasaki, M., and Wallington, T. J.: Int. J. Chem. Kinet.,32, 125, 2000.Toohey, D. W., Brune, W. H., and Anderson, J. G.: Int. J. Chem. Kinet., 20, 131, 1988.20
2480

ACPD6, 2281–2702, 2006
Evaluated kinetic andphotochemical data
for atmosphericchemistry
R. Atkinson et al.
Title Page
Abstract Introduction
Conclusions References
Tables Figures
J I
J I
Back Close
Full Screen / Esc
Printer-friendly Version
Interactive Discussion
EGU
III.A3.63
Br + NO2 + M→ BrONO + M
∆H◦ = −81 kJ·mol−1
Low-pressure rate coefficients
Rate coefficient data5
k0/cm3 molecule−1 s−1 Temp./K Reference Technique/Comments
Absolute Rate Coefficients(3.7 ± 0.7) × 10−31 [He] 298 Mellouki et al., 1989 DF-EPR/MS (a)(2.75 ± 0.55) × 10−31 [He] 298 Kreutter et al., 1991 PLP-RF (b)4.24 × 10⁻³¹ (T /300)−2.4 [N2] 259–346
Comments
(a) Pressure range 0.8–2.8 mbar.
(b) Pressure range 16.7–933 mbar; measurements in the bath gases He, Ar, H2, N2,CO2, CF4 and SF6. Falloff curves were analyzed with Fc=0.59 at 259 K, 0.55 at10
298 K, and 0.50 at 346 K.
Preferred Values
k0 = 4.2 × 10⁻³¹ (T /300)−2.4 [N2] cm3 molecule−1 s−1 over the temperature range 250–350 K.
2481

ACPD6, 2281–2702, 2006
Evaluated kinetic andphotochemical data
for atmosphericchemistry
R. Atkinson et al.
Title Page
Abstract Introduction
Conclusions References
Tables Figures
J I
J I
Back Close
Full Screen / Esc
Printer-friendly Version
Interactive Discussion
EGU
Reliability
∆ log k0 = ± 0.3 at 298 K.∆ n = ± 1.
Comments on Preferred Values
The preferred values are based on the results of the study of Kreutter et al. (1991).5
The falloff curves are represented with Fc=0.55. Broske and Zabel (1998) as wellas Orlando and Burkholder (2000) identified BrONO to be the major product of thereaction and reevaluated the thermochemistry data from Kreutter et al. (1991).
High-pressure rate coefficients
Rate coefficient data10
k∞/cm3 molecule−1 s−1 Temp./K Reference Technique/Comments
Absolute Rate Coefficients2.66 × 10−1 259–346 Kreutter et al., 1991 PLP-RF (a)
Comments
(a) See comment (b) for k0.
Preferred Values
k∞ = 2.7 × 10⁻¹¹ cm3 molecule−1 s−1, independent of temperature over the range 250–15
350 K.
2482

ACPD6, 2281–2702, 2006
Evaluated kinetic andphotochemical data
for atmosphericchemistry
R. Atkinson et al.
Title Page
Abstract Introduction
Conclusions References
Tables Figures
J I
J I
Back Close
Full Screen / Esc
Printer-friendly Version
Interactive Discussion
EGU
Reliability
∆ log k∞ = ± 0.4 over the range 250–350 K.
Comments on Preferred Values
See comments on k0. There is only a single determination of k∞, but the measuredfalloff curve appears well behaved with rate coefficients close to those of the reactions5
I+NO+M and I+NO2+M.
References
Broske, R. and Zabel, F.: J. Phys. Chem. A, 102, 8626, 1998.Kreutter, K. D., Nicovich, J. M., and Wine, P. H.: J. Phys. Chem., 95, 4020, 1991.Mellouki, A., Laverdet, G., Jourdain, J. L., and Poulet, G.: Int. J. Chem. Kinet., 21,10
1161, 1989.Orlando, J. J. and Burkholder, J. B.: J. Phys. Chem. A, 104, 2048, 2000.
2483

ACPD6, 2281–2702, 2006
Evaluated kinetic andphotochemical data
for atmosphericchemistry
R. Atkinson et al.
Title Page
Abstract Introduction
Conclusions References
Tables Figures
J I
J I
Back Close
Full Screen / Esc
Printer-friendly Version
Interactive Discussion
EGU
III.A3.64
Br + OClO→ BrO + ClO
∆H◦ = 15 kJ·mol−1
Rate coefficient data
k/cm3 molecule−1 s−1 Temp./K Reference Technique/Comments
Absolute Rate Coefficients4.2 × 10−13 298 Clyne and Watson, 1977 DF-MS (a)2.5 × 10⁻¹¹ exp(−1336/T ) 267–423 Toohey, 1988 DF-RF (b)(2.82 ± 0.03) × 10−13 2995
Comments
(a) MS detection of OClO in an excess of Br atoms. The observed decays were first-order, but computer modeling was used to correct for the effects of the reversereaction.
(b) The measured rate coeficients (cm3 molecule−1 s−1 units) were: 267 K,10
(1.70±0.03)×10−13; 294 K, (2.63±0.04)×10−13; 299 K, (2.82±0.03)×10−13; 325 K,(4.03±0.07)×10−13; 351 K, (5.45±0.22)×10−13; 385 K, (7.88±0.24)×10−13; and423 K, (1.06±0.04)×10−12. A unit-weighted least-squares fit of these data to theArrhenius expression results in k=2.5×10⁻¹¹ exp(−1336/T ) cm3 molecule−1 s−1
over the temperature range 267–423 K.15
2484
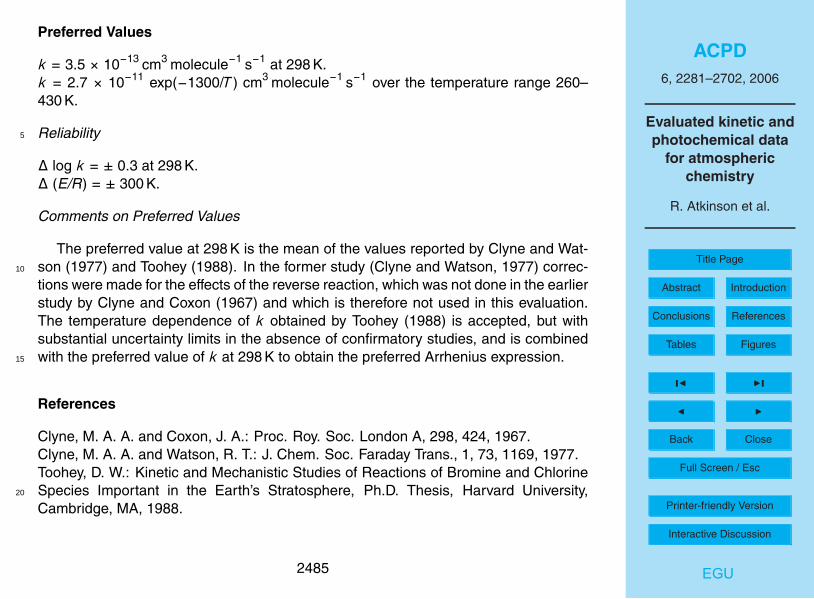
ACPD6, 2281–2702, 2006
Evaluated kinetic andphotochemical data
for atmosphericchemistry
R. Atkinson et al.
Title Page
Abstract Introduction
Conclusions References
Tables Figures
J I
J I
Back Close
Full Screen / Esc
Printer-friendly Version
Interactive Discussion
EGU
Preferred Values
k = 3.5 × 10⁻¹³ cm3 molecule−1 s−1 at 298 K.k = 2.7 × 10⁻¹¹ exp(−1300/T ) cm3 molecule−1 s−1 over the temperature range 260–430 K.
Reliability5
∆ log k = ± 0.3 at 298 K.∆ (E/R) = ± 300 K.
Comments on Preferred Values
The preferred value at 298 K is the mean of the values reported by Clyne and Wat-son (1977) and Toohey (1988). In the former study (Clyne and Watson, 1977) correc-10
tions were made for the effects of the reverse reaction, which was not done in the earlierstudy by Clyne and Coxon (1967) and which is therefore not used in this evaluation.The temperature dependence of k obtained by Toohey (1988) is accepted, but withsubstantial uncertainty limits in the absence of confirmatory studies, and is combinedwith the preferred value of k at 298 K to obtain the preferred Arrhenius expression.15
References
Clyne, M. A. A. and Coxon, J. A.: Proc. Roy. Soc. London A, 298, 424, 1967.Clyne, M. A. A. and Watson, R. T.: J. Chem. Soc. Faraday Trans., 1, 73, 1169, 1977.Toohey, D. W.: Kinetic and Mechanistic Studies of Reactions of Bromine and ChlorineSpecies Important in the Earth’s Stratosphere, Ph.D. Thesis, Harvard University,20
Cambridge, MA, 1988.
2485

ACPD6, 2281–2702, 2006
Evaluated kinetic andphotochemical data
for atmosphericchemistry
R. Atkinson et al.
Title Page
Abstract Introduction
Conclusions References
Tables Figures
J I
J I
Back Close
Full Screen / Esc
Printer-friendly Version
Interactive Discussion
EGU
III.A3.65
Br + Cl2O→ BrCl + ClO
∆H◦ = −72.8 kJ·mol−1
Rate coefficient data
5
k/cm3 molecule−1 s−1 Temp./K Reference Technique/Comments
Absolute Rate Coefficients2.1 × 10−11 exp[-(520 ± 260)/T ] 220–298 Sander and Friedl, 1989 FP-AS (a)(3.79 ± 0.38) × 10−12 2982.1 × 10−11 exp[-(435 ± 30)/T ] 233–402 Stevens and Anderson, 1992 DF-RF(4.8 ± 0.2) × 10−12 298
Comments
(a) Flash photolysis (λ>300 nm) of Br2 in the presence of an excess of Cl2O at130 mbar pressure of Ar. ClO radical concentrations were monitored by long-pathUV absorption at 275.2 nm.10
Preferred Values
k = 4.3 × 10⁻¹² cm3 molecule−1 s−1 at 298 K.k = 2.1 × 10⁻¹¹ exp(−470/T ) cm3 molecule−1 s−1 over the temperature range 220–410 K.
2486
ACPD6, 2281–2702, 2006
Evaluated kinetic andphotochemical data
for atmosphericchemistry
R. Atkinson et al.
Title Page
Abstract Introduction
Conclusions References
Tables Figures
J I
J I
Back Close
Full Screen / Esc
Printer-friendly Version
Interactive Discussion
EGU
Reliability
∆ log k = ± 0.1 at 298 K.∆ (E/R) = ± 200 K.
Comments on Preferred Values
The studies of Sander and Friedl (1989) and Stevens and Anderson (1992), which5
used totally different techniques, are in excellent agreement. The preferred valuesare based on the results of these two studies (Sander and Friedl, 1989; Stevens andAnderson, 1992). The significantly lower value (by a factor of 4) reported earlier byBasco and Dogra (1971) is not used in the evaluation. In the same study, Basco andDogra (1971) reported a value for k(Cl+Cl2O) more than two orders of magnitude less10
than that recommended in the present evaluation, suggesting errors in their method ofdetermining the ClO radical concentration which was used to monitor the progress ofthe reaction.
References
Basco, N. and Dogra, S. K.: Proc. Roy. Soc. London, A323, 401, 1971.15
Sander, S. P. and Friedl, R. R.: J. Phys. Chem., 93, 4764, 1989.Stevens, P. S. and Anderson, J. G.: J. Phys. Chem., 96, 1708, 1992.
2487
ACPD6, 2281–2702, 2006
Evaluated kinetic andphotochemical data
for atmosphericchemistry
R. Atkinson et al.
Title Page
Abstract Introduction
Conclusions References
Tables Figures
J I
J I
Back Close
Full Screen / Esc
Printer-friendly Version
Interactive Discussion
EGU
III.A3.66
Br + Cl2O2 → BrCl + ClOO
∆H◦ = −127.4 kJ·mol−1
There are no published measurements of this rate coefficient.5
Preferred Values
k = 3.0 × 10⁻¹² cm3 molecule−1 s−1 at 298 K.
Reliability
∆ log k = ± 0.3 at 298 K.
Comments on Preferred Values10
The preferred value is based on the results of an unpublished discharge flow studyof R. R. Friedl (1991). Substantial uncertainties are suggested in the absence of con-firmatory studies.
2488

ACPD6, 2281–2702, 2006
Evaluated kinetic andphotochemical data
for atmosphericchemistry
R. Atkinson et al.
Title Page
Abstract Introduction
Conclusions References
Tables Figures
J I
J I
Back Close
Full Screen / Esc
Printer-friendly Version
Interactive Discussion
EGU
III.A3.67
HO + HBr→ H2O + Br
∆H◦ = −130.9 kJ·mol−1
Rate coefficient data
k/cm3 molecule−1 s−1 Temp./K Reference Technique/Comments
Absolute Rate Coefficients(5.1 ± 1.0) × 10−12 295 Takacs and Glass, 1973 DF-EPR (a)(1.19 ± 0.14) × 10−11 249–416 Ravishankara et al., 1979 PLP-RF(6.01 ± 0.32) × 10−12 300 Husain et al., 1981 FP-RF(9.2 ± 0.7) × 10−12 ∼ 298 Jourdain et al., 1981 DF-EPR(1.12 ± 0.045) × 10−11 298 ± 4 Cannon et al., 1984 FP-LIF(1.1 ± 0.1) × 10−11 298 Ravishankara et al., 1985 PLP-RF/LIF(2.97 ± 0.46) × 10−11 170 Sims et al., 1994 PLP-LIF (b,c)(1.16 ± 0.04) × 10−11 295(8 ± 1) × 10−12 173 Atkinson et al., 1997 FP-LIF (b,d)(1.5 ± 0.4) × 10−11 194(1.0 ± 0.3) × 10−11 194(1.3 ± 0.2) × 10−11 222(1.1 ± 0.1) × 10−11 2425.5 × 10−12 exp[(204 ± 45)/T ] 230–360 Bedjanian et al., 1999 DF-MS (e)(1.11 ± 0.12) × 10−11 298(1.72 ± 0.40) × 10−11 185 Jaramillo amd Smith, 2001; FP-LIF (b,d)(1.31 ± 0.35) × 10−11 224 Jaramillo et al., 20025
2489

ACPD6, 2281–2702, 2006
Evaluated kinetic andphotochemical data
for atmosphericchemistry
R. Atkinson et al.
Title Page
Abstract Introduction
Conclusions References
Tables Figures
J I
J I
Back Close
Full Screen / Esc
Printer-friendly Version
Interactive Discussion
EGU
Comments
(a) Rate coefficient obtained from a computer simulation of 4 reactions.
(b) Expansion of gas through a Laval nozzle to provide a collimated flow of cold gasat a uniform temperature, density and velocity.
(c) Experiments were carried out over the temperature range 23–5
295 K, with the measured rate coefficient decreasing with increas-ing temperature from (1.07±0.04)×10−10 cm3 molecule−1 s−1 at 23 K to(1.16±0.04)×10−11 cm3 molecule−1 s−1 at 295 K. Combined with the rate co-efficients of Ravishankara et al. (1979) the temperature-dependent expressionk=(1.26±0.24)×10−11 (T /298)−(0.86±0.10) cm3 molecule−1 s−1 was derived.10
(d) Rate coefficients were measured over the temperature range 76–242 K, withthe rate coefficient decreasing from (3.0±0.5)×10−11 cm3 molecule−1 s−1
at 92 K and (2.9±0.9)×10−11 cm3 molecule−1 s−1 at 76 K to(1.1±0.1)×10−11 cm3 molecule−1 s−1 at 242 K. Above 150 K the rate coeffi-cient was independent of temperature, within the experimental uncertainties.15
(e) The cited Arrhenius expression is obtained from a unit-weighted least-squaresanalysis of the measured rate coefficients. The cited uncertainty is one least-squares standard deviation.
(f) Rate coefficients were obtained over the temperature range 120–224 K forHO+HBr, DO+HBr, HO+DBr and DO+DBr (Jaramillo and Smith, 2001), and20
over the temperature range 48–224 K for HO+HBr (Jaramillo et al., 2002). Themeasured rate coefficients decreased with increasing temperature (Jaramillo andSmith, 2001; Jaramillo et al., 2002). The available database (Takacs and Glass,1973; Smith and Zellner, 1974; Ravishankara et al., 1979, 1985; Husain et al.,1981; Jourdain et al., 1981; Cannon et al., 1984; Sims et al., 1994; Atkin-25
son et al., 1997; Bedjanian et al., 1999; Jaramillo and Smith, 2001; Jaramillo2490

ACPD6, 2281–2702, 2006
Evaluated kinetic andphotochemical data
for atmosphericchemistry
R. Atkinson et al.
Title Page
Abstract Introduction
Conclusions References
Tables Figures
J I
J I
Back Close
Full Screen / Esc
Printer-friendly Version
Interactive Discussion
EGU
et al., 2002) (23–416 K) was fit (Jaramillo et al., 2002) about equally well bythe expressions k=1.11×10⁻¹¹ (T /298)−0.91 cm3 molecule−1 s−1 or k=1.06×10⁻¹¹
(T /298)−1.09 exp(−10.5/T ) cm3 molecule−1 s−1.
Preferred Values
k = 1.1 × 10⁻¹¹ cm3 molecule−1 s−1 at 298 K.5
k = 5.5 × 10⁻¹² exp(205/T ) cm3 molecule−1 s−1 over the temperature range 180–360 K.
Reliability
∆ log k = ± 0.10 at 298 K.∆ (E/R) = ± 250 K.
Comments on Preferred Values10
The studies of Sims et al. (1994), Atkinson et al. (1997), Jaramillo and Smith (2001)and Jaramillo et al. (2002), carried out using expansions through a Laval nozzle toachieve temperatures down to 23 K (Sims et al., 1994), show reaction rate coefficientswhich increase with decreasing temperature, as does the 230–360 K study of Bedja-nian et al. (1999). The rate coefficients measured by Bedjanian et al. (1999) at 230 K15
and by Jaramillo and Smith (2001, 2002) at 224 K are in good agreement. The Jaramilloand Smith (2001, 2002) data are assumed to supersede the earlier data of Atkinsonet al. (1997). The preferred values are obtained from a least-squares analysis of therate coefficients of Ravishankara et al. (1985) and Bedjanian et al. (1999) and the 185and 224 K rate coefficients of Jaramillo and Smith (2001, 2002). The preferred 298 K20
rate coefficient is in good agreement with the measured values of Ravishankara etal. (1979), Jourdain et al. (1981), Cannon et al. (1984) and Sims et al. (1994) andthe recommended Arrhenius expression yields predicted rate coefficients which are
2491

ACPD6, 2281–2702, 2006
Evaluated kinetic andphotochemical data
for atmosphericchemistry
R. Atkinson et al.
Title Page
Abstract Introduction
Conclusions References
Tables Figures
J I
J I
Back Close
Full Screen / Esc
Printer-friendly Version
Interactive Discussion
EGU
in good agreement (within 15%) with those measured by Ravishankara et al. (1979)except at 416 K where the discrepancy is 35%.
References
Atkinson, D. B., Jaramillo, V. I., and Smith, M. A.: J. Phys. Chem. A, 101, 3356, 1997.Bedjanian, Y., Riffault, V., Le Bras, G., and Poulet, G.: J. Photochem. Photobiol. A.5
Chem., 128, 15, 1999.Cannon, B. D., Robertshaw, J. S., Smith, I. W. M., and Williams, M. D.: Chem. Phys.Lett., 105, 380, 1984.Husain, D., Plane, J. M. C., and Slater, N. K. H.: J. Chem. Soc. Faraday Trans., 2 77,1949, 1981.10
Jaramillo, V. I. and Smith, M. A.: J. Phys. Chem. A, 105, 5854, 2001.Jaramillo, V. I., Gougeon, S., Le Picard, S. D., Canosa, A., Smith, M. A., and Rowe, B.R.: Int. J. Chem. Kinet., 34, 339, 2002.Jourdain, J. L., Le Bras, G., and Combourieu, J.: Chem. Phys. Lett., 78, 483, 1981.Ravishankara, A. R., Wine, P. H., and Langford, A. O.: Chem. Phys. Lett., 63, 479,15
1979.Ravishankara, A. R., Wine, P. H., and Wells, J. R.: J. Chem. Phys., 83, 447, 1985.Sims, I. R., Smith, I. W. M., Clary, D. C., Bocherel, P., and Rowe, B. R.: J. Chem.Phys., 101, 1748, 1994.Smith, I. W. M. and Zellner, R.: J. Chem. Soc. Faraday Trans., 2 70, 1045, 1974.20
Takacs, G. A. and Glass, G. P.: J. Phys. Chem., 77, 1060, 1973.
2492

ACPD6, 2281–2702, 2006
Evaluated kinetic andphotochemical data
for atmosphericchemistry
R. Atkinson et al.
Title Page
Abstract Introduction
Conclusions References
Tables Figures
J I
J I
Back Close
Full Screen / Esc
Printer-friendly Version
Interactive Discussion
EGU
III.A3.68
HO + Br2 → HOBr + Br
∆H◦ ≥ −12 kJ·mol−1
Rate coefficient data
5
k/cm3 molecule−1 s−1 Temp./K Reference Technique/Comments
Absolute Rate Coefficients(4.2 ± 0.7) × 10−11 298 ± 2 Poulet et al., 1983 DF-LIF/EPR(5.28 ± 0.63) × 10−11 298 ± 3 Loewenstein and Anderson, 1984 DF-RF(2.8 ± 1.2) × 10−11 262–303 Boodaghians et al., 1987 DF-RF (a)(3.4 ± 1.2) × 10−11 2931.98 × 10−11 exp[(238 ± 70)/T ] 235–357 Gilles et al., 1999 PLP-LIF(4.80 ± 0.70) × 10−11 2981.8 × 10−11 exp[(235 ± 50)/T ] 230–360 Bedjanian et al., 1999 DF-MS3.96 × 10−11 298
Comments
(a) A least-squares fit of the measured rate coefficients results in k=5.8×10⁻¹⁰ exp[-(866±1107)/T ] cm3 molecule−1 s−1 , consistent with a temperature-independentrate coefficient over the small temperature range studied.10
2493

ACPD6, 2281–2702, 2006
Evaluated kinetic andphotochemical data
for atmosphericchemistry
R. Atkinson et al.
Title Page
Abstract Introduction
Conclusions References
Tables Figures
J I
J I
Back Close
Full Screen / Esc
Printer-friendly Version
Interactive Discussion
EGU
Preferred Values
k = 4.5 × 10⁻¹¹ cm3 molecule−1 s−1 at 298 K.k = 2.0 × 10⁻¹¹ exp(240/T ) cm3 molecule−1 s−1 over the temperature range 230–360 K.
Reliability
∆ log k = ± 0.10 at 298 K.5
∆ (E/R) = ± 150 K.
Comments on Preferred Values
The rate coefficient is reasonably well determined at room temperature, and therecommended value is the mean of those reported by Poulet et al. (1983), Loewen-stein and Anderson (1984), Gilles et al. (1999) and Bedjanian et al. (1999). The rate10
coefficients of Boodaghians et al. (1987) have large uncertainties and are consistentwith a zero temperature dependence over the range 262–303 K. Gilles et al. (1999)and Bedjanian et al. (1999) measured a small negative temperature dependence overthe significantly wider temperature range of 230–360 K. Accordingly, the temperaturedependence of Gilles et al. (1999) and Bedjanian et al. (1999) is preferred, and the15
pre-exponential factor, A, is adjusted to fit the preferred 298 K rate coefficient. Pouletet al. (1983), Loewenstein and Anderson (1984) and Bedjanian et al. (1999) deter-mined that the products are Br+HOBr, with the alternative reaction pathway leading toHBr+BrO accounting for <1% of the overall reaction at 298 K (Loewenstein and Ander-son, 1984).20
References
Bedjanian, Y., Le Bras, G., and Poulet, G.: Int. J. Chem. Kinet., 31, 698, 1999.Boodaghians, R. B., Hall, I. W., and Wayne, R. P.: J. Chem. Soc. Faraday Trans., 2,
2494

ACPD6, 2281–2702, 2006
Evaluated kinetic andphotochemical data
for atmosphericchemistry
R. Atkinson et al.
Title Page
Abstract Introduction
Conclusions References
Tables Figures
J I
J I
Back Close
Full Screen / Esc
Printer-friendly Version
Interactive Discussion
EGU
83, 529, 1987.Gilles, M. K., Burkholder, J. B., and Ravishankara, A. R.: Int. J. Chem. Kinet., 31, 417,1999.Loewenstein, L. M. and Anderson, J. G.: J. Phys. Chem., 88, 6277, 1984.Poulet, G., Laverdet, G., and Le Bras, G.: Chem. Phys. Lett., 94, 129, 1983.5
2495

ACPD6, 2281–2702, 2006
Evaluated kinetic andphotochemical data
for atmosphericchemistry
R. Atkinson et al.
Title Page
Abstract Introduction
Conclusions References
Tables Figures
J I
J I
Back Close
Full Screen / Esc
Printer-friendly Version
Interactive Discussion
EGU
III.A3.69
HO + BrO → HO2 + Br (1)→ HBr + O2 (2)
∆H◦(1) = −30 kJ·mol−1
∆H◦(2) = −193 kJ·mol−1
Rate coefficient data (k=k1+k2)5
k/cm3 molecule−1 s−1 Temp./K Reference Technique/Comments
Absolute Rate Coefficients(7.5 ± 4.2) × 10−11 300 Bogan et al., 1996 DF-MS (a)(4.5 ± 1.8) × 10−11 298 ± 3 Gilles et al., 2001 DF (b)1.65 × 10⁻¹¹ exp[(250 ± 50)/T ] 230–355 Bedjanian et al., 2001 DF-MS (c)(3.6 ± 0.9) × 10−11 300 (d)(3.9 ± 1.0) × 10−11 298 (e)(3.85 ± 0.70) × 10−11 299 (f)
Branching ratiosk2/k ≤ 0.03 298 Bedjanian et al., 2001 DF-MS (g)
Comments
(a) BrO radicals generated by passing a O2-Br2-He mixture through a microwavedischarge. HO radicals generated by the reaction of F atoms (generated in a sec-ond microwave discharge) with H2O. BrO radical concentrations were obtained by10
2496
ACPD6, 2281–2702, 2006
Evaluated kinetic andphotochemical data
for atmosphericchemistry
R. Atkinson et al.
Title Page
Abstract Introduction
Conclusions References
Tables Figures
J I
J I
Back Close
Full Screen / Esc
Printer-friendly Version
Interactive Discussion
EGU
titration with NO and measurement of the resulting NO2 by MS. HO radical con-centrations were obtained by titration with Br2 and measurement of the depletionof Br2 by MS. The rate coefficient was derived from modelling using a chemicalmechanism involving 18 reactions.
(b) BrO radicals generated from Br+O3 reaction (following discharge of Br2). HO5
radicals generated from pulsed 248 nm laser photolysis of O3 in the presenceof H2O. BrO and HO were measured by UV absorption and LIF, respectively.Experiments carried out under pseudo-first order conditions with HO in excess.
(c) BrO generated from either from O(3P)+Br2 (following discharge of O2), or fromBr+O3 (following discharge of Br2). Br was also generated by F+HBr (following10
discharge of F2) for mechanistic studies. HO was generated from either H+NO2(following discharge of H2 or F+H2), or F+H2O (following discharge of F2). BrOand HO concentrations were measured directly at their parent peaks. Experi-ments carried out under pseudo-first order conditions with HO in excess. k alsodetermined relative to k(HO+Br2) in a separate series of experiments. Results of15
the two methods are in good agreement and the reported rate coefficient is basedon the combined dataset.
(d) HO generated by H+NO2.
(e) HO generated by F+H2O.
(f) Relative rate measurement.20
(g) Based on detection of HBr.
Preferred Values
k = 4.1 × 10⁻¹¹ cm3 molecule−1 s−1 at 298 K.k = 1.8 × 10⁻¹¹ exp(250/T ) cm3 molecule−1 s−1 over the temperature range 230–350 K.
2497

ACPD6, 2281–2702, 2006
Evaluated kinetic andphotochemical data
for atmosphericchemistry
R. Atkinson et al.
Title Page
Abstract Introduction
Conclusions References
Tables Figures
J I
J I
Back Close
Full Screen / Esc
Printer-friendly Version
Interactive Discussion
EGU
Reliability
∆ log k = ± 0.3 at 298 K.∆ (E/R) = ± 300 K.
Comments on Preferred Values
The preferred value at 298 K is based on the room temperature data of Gilles et5
al. (2001) and Bedjanian et al. (2001). The previous study of Bogan et al. (1996) isalso consistent with this recommendation. The preferred Arrhenius expression is basedon the E/R value from the temperature dependence study of Bedjanian et al. (2001)combined with a pre-exponential factor adjusted to give the preferred value of k at298 K. The results of Bedjanian et al. (2001) are consistent with channel (a) being the10
dominant, if not sole, pathway. This conclusion is supported by the theoretical study ofSumathi and Peyerimhoff (1999).
References
Bedjanian, Y., Riffault, V., Le Bras, G., and Poulet, G.: J. Phys. Chem. A, 105, 6154,2001.15
Bogan, D. J., Thorn, R. P., Nesbitt, F. L., and Stief, L. J.: J. Phys. Chem., 100, 14 383,1996.Gilles, M. K., McCabe, D. C., Burkholder, J. B., and Ravishankara, A. R.: J. Phys.Chem. A, 105, 5849, 2001.Sumathi, R. and Peyerimhoff, S. D.: Phys. Chem. Chem. Phys., 1, 3973, 1999.20
2498

ACPD6, 2281–2702, 2006
Evaluated kinetic andphotochemical data
for atmosphericchemistry
R. Atkinson et al.
Title Page
Abstract Introduction
Conclusions References
Tables Figures
J I
J I
Back Close
Full Screen / Esc
Printer-friendly Version
Interactive Discussion
EGU
III.A3.70
Br + NO3 → BrO + NO2
∆H◦ = −33 kJ·mol−1
Rate coefficient data
k/cm3 molecule−1 s−1 Temp./K Reference Technique/Comments
Absolute Rate Coefficients(1.6 ± 0.7) × 10−11 298 Mellouki et al., 1989 DF-EPR (a)5
Comments
(a) The decays of Br atoms in excess concentrations of the NO3 radical were moni-tored by EPR. Computer simulations of the decays were carried out with a mech-anism consisting of five reactions.
Preferred Values10
k = 1.6 × 10⁻¹¹ cm3 molecule−1 s−1 at 298 K.
Reliability
∆ log k = ± 0.3 at 298 K.
Comments on Preferred Values
The preferred value is based on the sole study of Mellouki et al. (1989).15
2499

ACPD6, 2281–2702, 2006
Evaluated kinetic andphotochemical data
for atmosphericchemistry
R. Atkinson et al.
Title Page
Abstract Introduction
Conclusions References
Tables Figures
J I
J I
Back Close
Full Screen / Esc
Printer-friendly Version
Interactive Discussion
EGU
References
Mellouki, A., Poulet, G., Le Bras, G., Singer, R., Burrows, J. P., and Moortgat, G. K.: J.Phys. Chem., 93, 8017, 1989.
2500
ACPD6, 2281–2702, 2006
Evaluated kinetic andphotochemical data
for atmosphericchemistry
R. Atkinson et al.
Title Page
Abstract Introduction
Conclusions References
Tables Figures
J I
J I
Back Close
Full Screen / Esc
Printer-friendly Version
Interactive Discussion
EGU
III.A3.71
BrO + NO3 → BrOO + NO2
∆H◦ = −52 kJ·mol−1
Rate coefficient data
k/cm3 molecule−1 s−1 Temp./K Reference Technique/Comments
Absolute Rate Coefficients(0.3–3.0) × 10−12 298 Mellouki et al., 1989 DF-EPR (a)5
Comments
(a) The decays of Br atoms and BrO radicals were monitored by EPR. Computersimulations of the results were carried out with a mechanism consisting of fivereactions.
Preferred Values10
k = 1.0 × 10⁻¹² cm3 molecule−1 s−1 at 298 K.
Reliability
∆ log k = ± 0.5 at 298 K.
2501

ACPD6, 2281–2702, 2006
Evaluated kinetic andphotochemical data
for atmosphericchemistry
R. Atkinson et al.
Title Page
Abstract Introduction
Conclusions References
Tables Figures
J I
J I
Back Close
Full Screen / Esc
Printer-friendly Version
Interactive Discussion
EGU
Comments on Preferred Values
The preferred value is based on the room temperature results of Mellouki etal. (1989). This study (Mellouki et al., 1989), using the discharge flow-EPR tech-nique, is the only experimental study of this reaction to date. The preferred value isthe geometric mean of the upper and lower limits (Mellouki et al.,1989), which are en-5
compassed within the stated uncertainty factor. The Br-O2 bond is very weak and thebond energy has been estimated by Blake et al. (1970) to be 4 kJ mol−1. The productBrOO will therefore quickly decompose to yield Br+O2.
References
Blake, J. A., Browne, R. J., and Burns, G.: J. Chem. Phys., 53, 3320, 1970.10
Mellouki, A., Poulet, G., Le Bras, G., Singer, R., Burrows, J. P., and Moortgat, G. K.: J.Phys. Chem., 93, 8017, 1989.
2502

ACPD6, 2281–2702, 2006
Evaluated kinetic andphotochemical data
for atmosphericchemistry
R. Atkinson et al.
Title Page
Abstract Introduction
Conclusions References
Tables Figures
J I
J I
Back Close
Full Screen / Esc
Printer-friendly Version
Interactive Discussion
EGU
III.A3.72
NO3 + HBr→ HNO3 + Br
∆H◦ = −60.6 kJ·mol−1
Rate coefficient data
k/cm3 molecule−1 s−1 Temp./K Reference Technique/Comments
Absolute Rate Coefficients≤ 1 × 10⁻¹⁶ 298 Mellouki et al., 1989 DF-EPR (a)(1.3 ± 1.1) × 10−16 298 Canosa-Mas et al., 1989 DF-A (b)5
Comments
(a) The rate coefficient was derived from fitting the measured data to a complexmechanism.
(b) Discharge flow system with multipath absorption of NO3. The rate coefficient wasderived from fitting the measured data to a complex mechanism.10
Preferred Values
k < 1 × 10⁻¹⁶ cm3 molecule−1 s−1 at 298 K.
Comments on Preferred Values
The preferred value is the upper limit reported by Mellouki et al. (1989) in a studyusing the discharge flow-EPR technique. Canosa-Mas et al. (1989) reported a rate15
2503
ACPD6, 2281–2702, 2006
Evaluated kinetic andphotochemical data
for atmosphericchemistry
R. Atkinson et al.
Title Page
Abstract Introduction
Conclusions References
Tables Figures
J I
J I
Back Close
Full Screen / Esc
Printer-friendly Version
Interactive Discussion
EGU
coefficient derived from fitting their data to a complex mechanism which, within thestated uncertainty limits, is consistent with the upper limit to the rate coefficient reportedby Mellouki et al. (1989).
References
Canosa-Mas, C. E., Smith, S. J., Toby, S., and Wayne, R. P.: J. Chem. Soc. Faraday5
Trans., 2, 85, 709, 1989.Mellouki, A., Poulet, G., Le Bras, G., Singer, R., Burrows, J. P., and Moortgat, G. K.: J.Phys. Chem., 93, 8017, 1989.
2504

ACPD6, 2281–2702, 2006
Evaluated kinetic andphotochemical data
for atmosphericchemistry
R. Atkinson et al.
Title Page
Abstract Introduction
Conclusions References
Tables Figures
J I
J I
Back Close
Full Screen / Esc
Printer-friendly Version
Interactive Discussion
EGU
III.A3.73
BrO + HO2 →HOBr + O2 (1)→ HBr + O3 (2)
∆H◦(1) ≥ −190 kJ·mol−1
∆H◦(2) = −28 kJ·mol−1
Rate coefficient data (k=k1+k2)5
k/cm3 molecule−1 s−1 Temp./K Reference Technique/Comments
Absolute Rate Coefficients(3.4 ± 1.0) × 10−11 300 Bridier et al., 1993 FP-UVA (a)4.77 × 10⁻¹² exp[(580 ± 100)/T ] 233–344 Larichev et al., 1995 DF-MS (b)(3.4 ± 0.6) × 10−11 3032.5 × 10−12 exp[(520 ± 80)/T ] 210–298 Elrod et al., 1996 DF-MS (c)(1.4 ± 0.3) × 10−11 2983.13 × 10−12 exp[(536 ± 206)/T ] 233–348 Li et al., 1997 DF-MS (d)(1.73 ± 0.61) × 10−11 298 (e)(2.05 ± 0.64) × 10−11 298 (f)(2.0 ± 0.6) × 10−11 298 Cronkhite et al., 1998 PLP-IR/UVA (g)9.4 × 10⁻¹² exp[(345 ± 60)/T ] 230–360 Bedjanian et al., 2001 DF-MS (h)(3.1 ± 0.8) × 10−11 298(2.35 ± 0.82) × 10−11 298 Bloss et al., 2002 FP-UVA (a)
2505

ACPD6, 2281–2702, 2006
Evaluated kinetic andphotochemical data
for atmosphericchemistry
R. Atkinson et al.
Title Page
Abstract Introduction
Conclusions References
Tables Figures
J I
J I
Back Close
Full Screen / Esc
Printer-friendly Version
Interactive Discussion
EGU
Comments
(a) Photolysis of Br2-O3-Cl2-CH3OH-O2-He mixtures. HO2 and BrO radical concen-trations were monitored by UV absorption spectroscopy under conditions wherethe HO2 radical and BrO radical concentrations were of a similar magnitude.
(b) BrO radicals were generated by the O(3P)+Br2 reaction, and their concentrations5
were monitored by MS in an excess of HO2 radicals. A preliminary report of thisstudy was noted in Poulet et al. (1992).
(c) Turbulent flow system at 130 mbar total pressure. Reactant and product specieswere monitored by CIMS. BrO radicals were produced by the O(3P)+Br2 reactionand HO2 radicals by the H+O2+M reaction. k was determined by monitoring the10
BrO radical concentrations in an excess of HO2.
(d) BrO and HO2 were monitored by MS. BrO radicals were produced by the Br+O3
or O(3P)+Br2 reactions and HO2 radicals by the F+H2O2 or Cl+CH3OH reac-tions. Experiments were carried out under conditions of both [BrO]�[HO2] and[HO2]�[BrO]. A similar temperature dependence of k was observed in each case,15
but values of k determined with excess BrO were systematically ∼20% to 25%higher than those in excess HO2.
(e) HO2 in excess.
(f) BrO in excess.
(g) Photolysis of Cl2-CH3OH-O2-Br2-O3-N2 mixtures. HO2 and BrO radical concen-20
trations were monitored simultaneously by infrared tunable diode laser absorptionspectroscopy and UV absorption spectroscopy, respectively. Rate coefficients kwere determined with [HO2]�[BrO].
(h) BrO radicals were produced by the Br+O3 or O(3P)+Br2 reactions and HO2 rad-icals by the F+H2O2 reaction. Experiments were carried out under conditions25
2506
ACPD6, 2281–2702, 2006
Evaluated kinetic andphotochemical data
for atmosphericchemistry
R. Atkinson et al.
Title Page
Abstract Introduction
Conclusions References
Tables Figures
J I
J I
Back Close
Full Screen / Esc
Printer-friendly Version
Interactive Discussion
EGU
of both [BrO]�[HO2] and [HO2]�[BrO]. No systematic difference in the deter-mined values of k was observed. Consistent values of k, measured relative tok(Br+HO2), were also reported.
Preferred Values
k = 2.4 × 10⁻¹¹ cm3 molecule−1 s−1 at 298 K.5
k = 4.5 × 10⁻¹² exp(500/T ) cm3 molecule−1 s−1 over the temperature range 210–360 K.
Reliability
∆ log k = ± 0.3 at 298 K.∆ (E/R) = ± 200 K.
Comments on Preferred Values10
Disregarding the early study of Cox and Sheppard (1982) which gave a very lowvalue for k, the reported rate coefficients at 298 K cover a range of just over a fac-tor of two. This is despite the use of very similar techniques in some of the studies.The temperature dependence of k has generally provided values of E/R which are ingood agreement, although that from the most recent temperature dependence study15
of Bedjanian et al. (2001) is substantially lower than three previous determinations.The preferred value at 298 K is the mean of the rate coefficients of Bridier et
al. (1993), Larichev et al. (1995), Elrod et al. (1996), Li et al. (1997), Cronkhite etal. (1998), Bedjanian et al. (2001) and Bloss et al. (2002) with substantial uncertaintylimits. The preferred Arrhenius expression for k is obtained by taking the mean of the20
E/R values from the studies of Larichev et al. (1995), Elrod et al. (1996), Li et al. (1997)and Bedjanian et al. (2001), and combining it with a pre-exponential factor adjusted togive the preferred value of k at 298 K. The uncertainty in the preferred E/R value hasbeen increased to encompass the recent result of Bedjanian et al. (2001).
2507

ACPD6, 2281–2702, 2006
Evaluated kinetic andphotochemical data
for atmosphericchemistry
R. Atkinson et al.
Title Page
Abstract Introduction
Conclusions References
Tables Figures
J I
J I
Back Close
Full Screen / Esc
Printer-friendly Version
Interactive Discussion
EGU
Several studies (Larichev et al., 1995; Elrod et al., 1996; Li et al., 1997; Bedjanianet al., 2001) have shown that the major product is HOBr. Larichev et al. (1995) andBedjanian et al. (2001) were unable to obtain evidence for O3 formation in their massspectrometric studies of the reaction and set upper limits for the branching ratio ofk2/k<0.015 and <0.004, respectively. From a study of the reverse reaction at above5
room temperature, Mellouki et al. (1994) have determined, by extrapolation, that theyield of HBr+O3 is negligible (<0.01%) down to 200 K. Furthermore, k appears to beindependent of pressure over the range covered by the studies to date of 1 mbar to1 bar (Bridier et al., 1993; Larichev et al., 1995; Elrod et al., 1996; Li et al., 1997;Cronkhite et al., 2002) and there is no evidence for stable adduct formation. Thus all10
of the available data suggeststhat channel (1) is the sole pathway over the tempera-ture range of the preferred values. This is supported by two recent theoretical studies(Guha and Francisco, 1992; Kaltsoyannis and Rowley, 2002) which conclude that thecontribution of channel (2) is essentially zero.
References15
Bedjanian, Y., Riffault, V, and Poulet, G.: J. Phys. Chem. A, 105, 3167, 2001.Bloss, W. J., Rowley, D. M., Cox, R. A., and Jones, R. L..: Phys. Chem. Chem. Phys.,4, 3639, 2002.Bridier, I., Veyret, B., and Lesclaux, R.: Chem. Phys. Lett., 201, 563, 1993.Cox, R. A. and Sheppard, D. W.: J. Chem. Soc. Faraday Trans., 2, 78, 1383, 1982.20
Cronkhite, J. M., Stickel, R. E., Nicovich, J. M., and Wine, P. H.: J. Phys. Chem. A,102, 6651, 1998.Elrod, M. J., Meads, R. F., Lipson, J. B., Seeley, J. V., and Molina, M. J.: J. Phys.Chem., 100, 5808, 1996.Guha, S. and Franciso, J. S.: J. Phys. Chem. A, 103, 8000, 1999.25
Kaltsoyannis, N. and Rowley, D. M.: Phys. Chem. Chem. Phys., 4, 419, 2002.Larichev, M., Maguin, F., Le Bras, G., and Poulet, D.: J. Phys. Chem., 99, 15 911,
2508

ACPD6, 2281–2702, 2006
Evaluated kinetic andphotochemical data
for atmosphericchemistry
R. Atkinson et al.
Title Page
Abstract Introduction
Conclusions References
Tables Figures
J I
J I
Back Close
Full Screen / Esc
Printer-friendly Version
Interactive Discussion
EGU
1995.Li, Z., Friedl, R. R., and Sander, S. P.: J. Chem. Soc. Faraday Trans., 93, 2683, 1997.Mellouki, A., Talukdar, R. K., and Howard, C. J.: J. Geophys. Res., 99, 22 949, 1994.Poulet, G., Pirre, M., Maguin, F., Ramarosen, R., and Le Bras, G.: Geophys. Res.Lett., 19, 2305, 1992.5
2509

ACPD6, 2281–2702, 2006
Evaluated kinetic andphotochemical data
for atmosphericchemistry
R. Atkinson et al.
Title Page
Abstract Introduction
Conclusions References
Tables Figures
J I
J I
Back Close
Full Screen / Esc
Printer-friendly Version
Interactive Discussion
EGU
III.A3.74
BrO + O3 → Br + 2O2 (1)→ OBrO + O2 (2)
∆H◦(1) = −151 kJ·mol−1
∆H◦(2) = −99 kJ·mol−1
Rate coefficient data (k=k1+k2)5
k/cm3 molecule−1 s−1 Temp./K Reference Technique/Comments
Absolute Rate Coefficients∼ 10−17 318–343 Rattigan et al., 1995 P-AS (a)k2 = 7 × 10⁻¹⁴ exp[-(3100 ± 350)/T ] 318–343k2 = 2.1 × 10⁻¹⁸ 298∗
< (2.1 ± 0.7) × 10−17 298 Rowley et al., 1996 FP-AS (b)k2 = (1.66 ± 0.11) × 10−18 298
Comments
(a) Photolysis of Br2-O3 mixtures at 380 nm to 480 nm in N2 or O3 bath gas at to-tal pressures in the range 16 mbar to 1000 mbar. Time-resolved UV absorptionspectroscopy was used to monitor the concentrations of O3, Br2 and BrO radicals10
before, during, and after irradiation. OBrO was also detected in absorption in thewavelength range 400 nm to 600 nm.
(b) Flash photolysis-longpath UV absorption technique. BrO radicals were producedby photolysis at ∼400 nm of Br2 in an excess of O3. Time-resolved UV/visible
2510

ACPD6, 2281–2702, 2006
Evaluated kinetic andphotochemical data
for atmosphericchemistry
R. Atkinson et al.
Title Page
Abstract Introduction
Conclusions References
Tables Figures
J I
J I
Back Close
Full Screen / Esc
Printer-friendly Version
Interactive Discussion
EGU
absorption spectra of BrO were recorded over the range 234 nm to 367 nm andof OBrO over the range 425 nm to 558 nm. The BrO decay was largely due to theBrO+BrO reaction but deviations from second-order behavior were observed athigh O3 concentrations, and attributed to the BrO+O3 reaction. The upper limitwas derived from an analysis of the [BrO] temporal profiles at high O3 concentra-5
tions.
Preferred Values
k < 2 × 10⁻¹⁷ cm3 molecule−1 s−1 at 298 K.
Comments on Preferred Values
The two most recent studies of Rattigan et al. (1995) and Rowley et al. (1996) are in10
good agreement and set a lower upper limit to the rate coefficient for this reaction thandid previous studies (Sander and Watson, 1981; Mauldin et al., 1993). The preferredupper limit to k at 298 K is therefore based on the results reported by Rattigan etal. (1995) and Rowley et al. (1996).
Previously, the reaction of BrO with O3 had been assumed to occur exclusively by15
channel (1), but the positive identification of OBrO as a reaction product indicates thatchannel (2) is likely to be significant. The existing determinations of k2 are in goodagreement (Rattigan et al., 1995; Rowley et al., 1996) but involve significant uncertain-ties. Further studies are necessary before a branching ratio can be recommended.
References20
Mauldin III, R. L., Wahner, A., and Ravishankara, A. R.: J. Phys. Chem., 97, 7585,1993.Rattigan. O. V., Cox, R. A., and Jones, R. L.: J. Chem. Soc. Faraday Trans., 91, 4189,
2511

ACPD6, 2281–2702, 2006
Evaluated kinetic andphotochemical data
for atmosphericchemistry
R. Atkinson et al.
Title Page
Abstract Introduction
Conclusions References
Tables Figures
J I
J I
Back Close
Full Screen / Esc
Printer-friendly Version
Interactive Discussion
EGU
1995.Rowley, D. M., Harwood, M. H., Freshwater, R. A., and Jones, R. L.: J. Phys. Chem.,100, 3020, 1996Sander, S. P. and Watson, R. T.: J. Phys. Chem., 85, 4000, 1981.
5
2512

ACPD6, 2281–2702, 2006
Evaluated kinetic andphotochemical data
for atmosphericchemistry
R. Atkinson et al.
Title Page
Abstract Introduction
Conclusions References
Tables Figures
J I
J I
Back Close
Full Screen / Esc
Printer-friendly Version
Interactive Discussion
EGU
III.A3.75
BrO + NO→ Br + NO2
∆H◦ = −65 kJ·mol−1
Rate coefficient data
k/cm3 molecule−1 s−1 Temp./K Reference Technique/Comments
Absolute Rate Coefficients(2.2 ± 0.4) × 10−11 298 Clyne and Watson, 1975 DF-MS (a)7.11 × 10⁻¹² exp[(296 ± 10)/T ] 230–425 Leu, 1979 DF-MS (a)(1.89 ± 0.16) × 10−11 2981.28 × 10−11 exp[(181 ± 46)/T ] 224–398 Watson et al., 1979 FP-UVA (b)(2.15 ± 0.25) × 10−11 298(2.15 ± 0.18) × 10−11 298 Ray and Watson, 1981 DF-MS (a)5
Comments
(a) BrO radicals were produced by the O+Br2 reaction and monitored by MS in anexcess of NO.
(b) BrO radicals were produced by the flash photolysis of Br2-O2 mixtures in thepresence of an excess of NO. BrO radical concentrations were monitored by UV10
absorption at 339 nm. k was observed to be independent of pressure over therange 130 mbar to 930 mbar of He or N2.
2513

ACPD6, 2281–2702, 2006
Evaluated kinetic andphotochemical data
for atmosphericchemistry
R. Atkinson et al.
Title Page
Abstract Introduction
Conclusions References
Tables Figures
J I
J I
Back Close
Full Screen / Esc
Printer-friendly Version
Interactive Discussion
EGU
Preferred Values
k = 2.1 × 10⁻¹¹ cm3 molecule−1 s−1 at 298 K.k = 8.7 × 10⁻¹² exp(260/T ) cm3 molecule−1 s−1 over the temperature range 220–430 K.
Reliability
∆ log k = ± 0.1 at 298 K.5
∆ (E/R) = ± 100 K.
Comments on Preferred Values
The results of the three low pressure mass spectrometric studies of Clyne and Wat-son (1975), Leu (1979) and Ray and Watson (1981) and the high pressure UV ab-sorption study of Watson et al. (1979), all of which used pseudo-first order conditions,10
are in excellent agreement at 298 K and are considered to be more reliable than theearlier low pressure UV absorption study of Clyne and Cruse (1970). The results ofthe two temperature dependence studies (Leu, 1979; Watson et al., 1979) are in goodagreement. The preferred Arrhenius expression is derived from a least-squares fit toall the data of Clyne and Watson (1975), Leu (1979), Watson et al. (1979) and Ray15
and Watson (1981). By combining the data reported in the high pressure UV absorp-tion study (Watson et al., 1979) with those from the mass spectrometric studies (Clyneand Watson, 1975; Leu, 1979; Ray and Watson, 1981), this reaction does not exhibitany observable pressure dependence between 1 mbar and 1 bar total pressure. Thetemperature dependencies of the rate coefficients for the analogous ClO and HO2 re-20
actions are also negative and similar in magnitude.
2514

ACPD6, 2281–2702, 2006
Evaluated kinetic andphotochemical data
for atmosphericchemistry
R. Atkinson et al.
Title Page
Abstract Introduction
Conclusions References
Tables Figures
J I
J I
Back Close
Full Screen / Esc
Printer-friendly Version
Interactive Discussion
EGU
References
Clyne, M. A. A. and Cruse, H. W.: Trans. Faraday Soc., 66, 2227, 1970.Clyne, M. A. A. and Watson, R. T.: J. Chem. Soc. Faraday Trans., 1, 71, 336, 1975.Leu, M.-T.: Chem. Phys. Lett., 61, 275, 1979.Ray, G. W. and Watson, R. T.: J. Phys. Chem., 85, 2955,1981.5
Watson, R. T., Sander, S. P., and Yung, Y. L.: J. Phys. Chem., 83, 2936, 1979.
2515

ACPD6, 2281–2702, 2006
Evaluated kinetic andphotochemical data
for atmosphericchemistry
R. Atkinson et al.
Title Page
Abstract Introduction
Conclusions References
Tables Figures
J I
J I
Back Close
Full Screen / Esc
Printer-friendly Version
Interactive Discussion
EGU
III.A3.76
BrO + NO2 + M→ BrONO2 + M
∆H◦ = −106 kJ·mol−1
Low-pressure rate coefficients
Rate coefficient data5
k0/cm3 molecule−1 s−1 Temp./K Reference Technique/Comments
Absolute Rate Coefficients(5.0 ± 1.0) × 10−31[N2] 298 Sander et al., 1981 DF-MS/FP-UVA (a)(4.2 ± 0.8) × 10−31 (T /300)−2.0[O2] 263–343 Danis et al., 1990 PLP-MS (b)5.4 × 10⁻³¹ (T /298)−3.2 [N2] 248–346 Thorn et al., 1993 PLP-UVA (c)
Comments
(a) DF-MS study over the pressure range 1.3–8 mbar, and FP-UVA study from 57–933 mbar. In the DF-MS study, BrO radicals were produced by the reactionBr+O3→BrO+O2, and in the FP-UVA study BrO radicals were formed by the re-10
action of O(3P) atoms (from the photolysis of O2) with Br2. A major portion of thefalloff curve was observed and analyzed with a fitted value of Fc=0.4 at 298 K.
(b) BrO radicals were produced by the photolysis of O3 at 248 nm in the presence ofBr2. Rate coefficients were measured at total pressures below 16 mbar. Falloffcurves were extrapolated using Fc=exp(−T /325).15
2516

ACPD6, 2281–2702, 2006
Evaluated kinetic andphotochemical data
for atmosphericchemistry
R. Atkinson et al.
Title Page
Abstract Introduction
Conclusions References
Tables Figures
J I
J I
Back Close
Full Screen / Esc
Printer-friendly Version
Interactive Discussion
EGU
(c) BrO radicals were generated by the photolysis of Br2-NO2-N2 mixtures at 351 nm,and were monitored by long-path (550 cm) absorption at 338.3 nm. The total pres-sure was varied over the range 21–1060 mbar. The data were analyzed withFc=exp(−T /327), based on the fitted value of Fc=0.4 of Sander et al. (1981).If a value of Fc=0.6 is used, a rate coefficient of k0=5.2×10⁻³¹ (T /300)−3.2
5
[N2] cm3 molecule−1 s−1 is obtained.
Preferred Values
k0 = 4.7 × 10⁻³¹ (T /300)−3.1 [N2] cm3 molecule−1 s−1 over the temperature range 240–350 K.
Reliability10
∆ log k0 = ± 0.1 at 298 K.∆ n = ± 1.
Comments on Preferred Values
The preferred values are based on the data of Sander et al. (1981), Da-nis et al. (1990) and Thorn et al. (1993). The reverse dissociation reaction15
BrONO2+M→BrO+NO2+M was measured by Orlando and Tyndall (1996) over thetemperature range 320–340 K and at pressures of 133–1330 mbar. Their rate datawere combined with the present preferred values for the reverse reaction leading to∆H◦=−118 kJ·mol−1. Ab initio calculations of the bond strength have also been re-ported by Rayez and Destriau (1993) and Parthiban and Lee (1998).20
2517

ACPD6, 2281–2702, 2006
Evaluated kinetic andphotochemical data
for atmosphericchemistry
R. Atkinson et al.
Title Page
Abstract Introduction
Conclusions References
Tables Figures
J I
J I
Back Close
Full Screen / Esc
Printer-friendly Version
Interactive Discussion
EGU
High-pressure rate coefficients
Rate coefficient data
k∞/cm3 molecule−1 s−1 Temp./K Reference Technique/Comments
Absolute Rate Coefficients(2.0 ± 0.5) × 10−11 298 Sander et al., 1981 DF-MS/FP-UVA (a)1.4 × 10⁻¹¹ (T /300)−1.2 248–346 Thorn et al., 1993 PLP-UVA (b)
Comments
(a) See comment (a) for k0. Extrapolation of falloff curve with a fitted value of Fc=0.4.5
(a) See comment (c) for k0. Evaluated with Fc=exp(−T /327). If Fc=0.6 is employed,k∞=6.9×10⁻¹² (T /300)−2.9 cm3 molecule−1 s−1 is fitted.
Preferred Values
k∞ = 1.8 × 10⁻¹¹ cm3 molecule−1 s−1 independent of temperature over the range 240–350 K.10
Reliability
∆ log k∞ = ± 0.1 at 298 K.∆ n = ± 1.
2518
ACPD6, 2281–2702, 2006
Evaluated kinetic andphotochemical data
for atmosphericchemistry
R. Atkinson et al.
Title Page
Abstract Introduction
Conclusions References
Tables Figures
J I
J I
Back Close
Full Screen / Esc
Printer-friendly Version
Interactive Discussion
EGU
Comments on Preferred Values
The preferred values are based on the data of Thorn et al. (1993) which are in goodagreement with the data of Sander et al. (1981) at 298 K. A temperature-independentFc=0.4 is used for representing the falloff curve which leads to the given practicallytemperature-independent k∞.5
References
Danis, R., Caralp, F., Masanet, J., and Lesclaux, R.: Chem. Phys. Lett., 167, 450,1990.Orlando, J. J. and Tyndall, G. S.: J. Phys. Chem., 100, 19 398, 1996.Parthiban, S. and Lee, T. J.: J. Chem. Phys., 109, 525, 1998.10
Rayez, M. T. and Destriau, M.: Chem. Phys. Lett., 206, 278, 1993.Sander, S. P., Ray, G. W., and Watson, R. T.: J. Phys. Chem., 85, 199. 1981.Thorn, R. P., Daykin, E. P., and Wine, P. H.: Int. J. Chem. Kinet., 25, 521, 1993.
2519

ACPD6, 2281–2702, 2006
Evaluated kinetic andphotochemical data
for atmosphericchemistry
R. Atkinson et al.
Title Page
Abstract Introduction
Conclusions References
Tables Figures
J I
J I
Back Close
Full Screen / Esc
Printer-friendly Version
Interactive Discussion
EGU
III.A3.77
BrO + ClO → Br + OClO (1)→ Br + ClOO (2)→ BrCl + O2 (3)→ Cl + OBrO (4)
BrO + ClO + M → BrOOCl + M (5)
∆H◦(1) = −14 kJ·mol−1
∆H◦(2) = −12 kJ·mol−1
∆H◦(3) = −207 kJ·mol−15
∆H◦(4) = 52 kJ·mol−1
Rate coefficient data (k=k1+k2+k3+k4+k5)
k/cm3 molecule−1 s−1 Temp./K Reference Technique/Comments
Absolute Rate Coefficients6.1 × 10−12 exp[(240 ± 60)/T ] 220–400 Sander and Friedl, 1988 FP-UVA (a)(1.29 ± 0.18) × 10−11 2984.7 × 10−12 exp[(320 ± 60)/T ] 220–400 Friedl and Sander, 1988 DF-MS (b)(1.29 ± 0.19) × 10−11 2982.59 × 10−12 exp[(445 ± 84)/T ] 234–406 Turnipseed et al., 1991 DF-MS (c)(1.08 ± 0.20) × 10−11 304k1 = 6.7 × 10⁻¹³ exp[(622 ± 94)/T ] 234–406k2 = 2.1 × 10⁻¹² exp[(258 ± 56)/T ] 234–406k3 = 1.9 × 10⁻¹³ exp[(513 ± 86)/T ] 234–406
2520

ACPD6, 2281–2702, 2006
Evaluated kinetic andphotochemical data
for atmosphericchemistry
R. Atkinson et al.
Title Page
Abstract Introduction
Conclusions References
Tables Figures
J I
J I
Back Close
Full Screen / Esc
Printer-friendly Version
Interactive Discussion
EGU
k/cm3 molecule−1 s−1 Temp./K Reference Technique/Comments
Branching Ratiosk1/k = 0.68 ± 0.10 220 Sander and Friedl, 1988 (a)k1/k = 0.59 ± 0.10 298k1/k = 0.55 ± 0.07 220 Friedl and Sander, 1988 (b)k1/k = 0.48 ± 0.07 298k1/k = 0.44 ± 0.07 400k2/k = 0.39 ± 0.10 220 Friedl and Sander, 1988 (b)k2/k = 0.40 ± 0.10 298k2/k = 0.44 ± 0.10 400k3/k = 0.06 ± 0.03 220 Friedl and Sander, 1988 (b)k3/k = 0.08 ± 0.03 298k3/k = 0.08 ± 0.03 400k1/k = 0.51 ± 0.09 250 Turnipseed et al., 1991 (c)k1/k = 0.48 ± 0.07 304k1/k = 0.39 ± 0.07 406(k2 + k3)/k = 0.46 ± 0.7 250 Turnipseed et al., 1991 (c)(k2 + k3)/k = 0.55 ± 0.9 304(k2 + k3)/k = 0.61 ± 0.11 406k3/k = 0.10 ± 0.02 250 Turnipseed et al., 1991 (c)k3/k = 0.09 ± 0.02 304k3/k = 0.09 ± 0.02 406k1/k = 0.53 ± 0.05 295 Bloss, 1999 (d)k4/k < 0.02 295
2521

ACPD6, 2281–2702, 2006
Evaluated kinetic andphotochemical data
for atmosphericchemistry
R. Atkinson et al.
Title Page
Abstract Introduction
Conclusions References
Tables Figures
J I
J I
Back Close
Full Screen / Esc
Printer-friendly Version
Interactive Discussion
EGU
Comments
(a) BrO, ClO and OClO were detected using the temperature-dependent absorptioncross-sections measured in the same study. BrO radical decays were monitoredwith [ClO]>[BrO]. Measurement of the rate coefficient ratio k1/k was based on∆[OClO]/∆[BrO] as a function of time.5
(b) BrO, ClO, OClO and BrCl were detected. BrO radical decays were measured inexcess ClO. The branching ratios were based on the yields of OClO, Cl (afterconversion to BrCl) and BrCl compared to the amounts of BrO and ClO reacted.
(c) Dischage flow system with MS detection of BrO, ClO, OClO and BrCl. BrO radicaldecays were monitored in the presence of a 10- to 60-fold excess of ClO radicals.10
Branching ratios were based on the yields of OClO, ClO and BrCl in the presenceof the Cl atom scavengers HBr and C2H3Br.
(d) Flash photolysis system with UV absorption detection (using a charge coupleddetector) of BrO, ClO, OClO and OBrO using differential absorption spectroscopy.The branching ratio k4/k was based on the absence of characteristic OBrO ab-15
sorption in the region 400 nm to 500 nm during the BrO and ClO decays.
Preferred Values
k1 = 6.8 × 10⁻¹² cm3 molecule−1 s−1 at 298 K.k2 = 6.1 × 10⁻¹² cm3 molecule−1 s−1 at 298 K.k3 = 1.0 × 10⁻¹² cm3 molecule−1 s−1 at 298 K.20
k1 = 1.6 × 10⁻¹² exp(430/T ) cm3 molecule−1 s−1 over the temperature range 220–400 K.k2 = 2.9 × 10⁻¹² exp(220/T ) cm3 molecule−1 s−1 over the temperature range 220–400 K.
2522
ACPD6, 2281–2702, 2006
Evaluated kinetic andphotochemical data
for atmosphericchemistry
R. Atkinson et al.
Title Page
Abstract Introduction
Conclusions References
Tables Figures
J I
J I
Back Close
Full Screen / Esc
Printer-friendly Version
Interactive Discussion
EGU
k3 = 5.8 × 10⁻¹³ exp(170/T ) cm3 molecule−1 s−1 over the temperature range 220–400 K.
Reliability
∆log k1 = ∆log k2 = ∆log k3 = ± 0.1 at 298 K.∆(E1/R) = ∆(E2/R) = ∆(E3/R) = ± 200 K.5
Comments on Preferred Values
The data base for this reaction is now extensive. Friedl and Sander (1989), using adischarge flow-mass spectrometry system, measured the overall rate coefficient overthe temperature range 220–400 K and also over this temperature range determineddirectly the branching ratios for the reaction channels producing BrCl and OClO. In a10
separate study, the same authors (Sander and Friedl, 1989), using flash photolysis-ultraviolet absorption techniques, measured the overall rate coefficient over the tem-perature range 220–400 K and pressure range 67 mbar to 1000 mbar, and also deter-mined the branching ratio for OClO production at 220 K and 298 K. The results by thesetwo independent techniques (Friedl and Sander, 1989; Sander and Friedl, 1989) are in15
excellent agreement, with the overall rate coefficient showing a negative temperaturedependence. The study of Turnipseed et al. (1991) also resulted in a comprehen-sive set of rate coefficient and branching ratio data. The overall rate coefficients fromthese three studies (Friedl and Sander, 1989; Sander and Friedl, 1989; Turnipseedet al., 1991) are in good agreement at room temperature (within 20%) and are in ex-20
cellent agreement at stratospheric temperatures. Toohey and Anderson (1988), usingdischarge flow-resonance fluorescence/LMR techniques, reported room temperaturevalues of the overall rate coefficient and the branching ratio for OClO production. Theyalso found evidence for the direct production of BrCl in a vibrationally excited π state(Toohey and Anderson, 1988). Poulet et al. (1990), using discharge flow-mass spec-25
trometry techniques, reported room temperature values of the overall rate coefficient
2523

ACPD6, 2281–2702, 2006
Evaluated kinetic andphotochemical data
for atmosphericchemistry
R. Atkinson et al.
Title Page
Abstract Introduction
Conclusions References
Tables Figures
J I
J I
Back Close
Full Screen / Esc
Printer-friendly Version
Interactive Discussion
EGU
and branching ratios for OClO and BrCl production. Clyne and Watson (1977) alsostudied this reaction using a discharge flow-MS system.
The results of the studies of Toohey and Anderson (1988), Sander and Friedl (1989),Friedl and Sander 1989), Poulet et al. (1990), Turnipseed et al. (1991) and Bloss (1999)are in reasonably good agreement. The rate coefficients of Hills et al. (1988), using a5
discharge flow-mass spectrometry technique, were independent of temperature overthe range 241 K to 308 K and the room temperature rate coefficient was substantiallylower than the average value from the above-mentioned studies (Friedl and Sander,1989; Sander and Friedl, 1989; Turnipseed et al., 1991; Toohey and Anderson, 1988;Poulet et al., 1990). Hills et al. (1988) also reported no BrCl formation. In the flash10
photolysis study of Basco and Dogra (1971) a different interpretation of the reactionmechanism was used; the reported rate coefficients were low and are not used in theevaluation of the rate coefficient for this reaction.
The recommended Arrhenius expressions for the individual reaction channels aretaken from the studies of Friedl and Sander (1989) and Turnipseed et al. (1991), which15
contain the most comprehensive sets of rate coefficient and branching ratio data. Bothof these studies (Sander and Friedl, 1989; Turnipseed et al., 1991), as well as that ofSander and Friedl (1989), show that OClO production by channel (1) becomes domi-nant at very low temperature. Both studies show an ∼8% yield of BrCl by channel (3).The recommended expressions are consistent with the body of data from all studies20
except those of Hills et al. (1988) and Basco and Dogra (1971). Quantum mechanicalcalculations of the transition state configurations and energy minima on the P.E. sur-face for this reaction confirm the mechanism involving a BrOOCl peroxide intermediate(Papayannis et al., 2001).
References25
Basco, N. and Dogra, S. K.: Proc. Roy. Soc. London, A, 323, 417, 1971.Bloss, W.: Ph.D. Thesis, University of Cambridge, Cambridge, UK, 1999.
2524
ACPD6, 2281–2702, 2006
Evaluated kinetic andphotochemical data
for atmosphericchemistry
R. Atkinson et al.
Title Page
Abstract Introduction
Conclusions References
Tables Figures
J I
J I
Back Close
Full Screen / Esc
Printer-friendly Version
Interactive Discussion
EGU
Clyne, M. A. A. and Watson, R. T.: J. Chem. Soc. Faraday Trans., 1, 73, 1169, 1977.Friedl , R. R. and Sander, S. P.: J. Phys. Chem., 93, 4756, 1989.Hills, A. J., Cicerone, R. J., Calvert, J. G., and Birks, J. W.: J. Phys. Chem., 92, 1853,1988.Papayannis, D. K., Cosmas, A. M., and Melissas, V. S.: J. Phys. Chem. A, 105, 2209,5
2001.Poulet, G., Lancar, I. T., Laverdet, G., and Le Bras, G.: J. Phys. Chem., 94, 278, 1990.Sander, S. P. and Friedl, R. R.: J. Phys. Chem., 93, 4764, 1989.Toohey, D. W. and Anderson, J. G.: J. Phys. Chem., 92, 1705, 1988.Turnipseed, A. A., Birks, J. W., and Calvert, J. G.: J. Phys. Chem., 95, 4356, 1991.10
2525
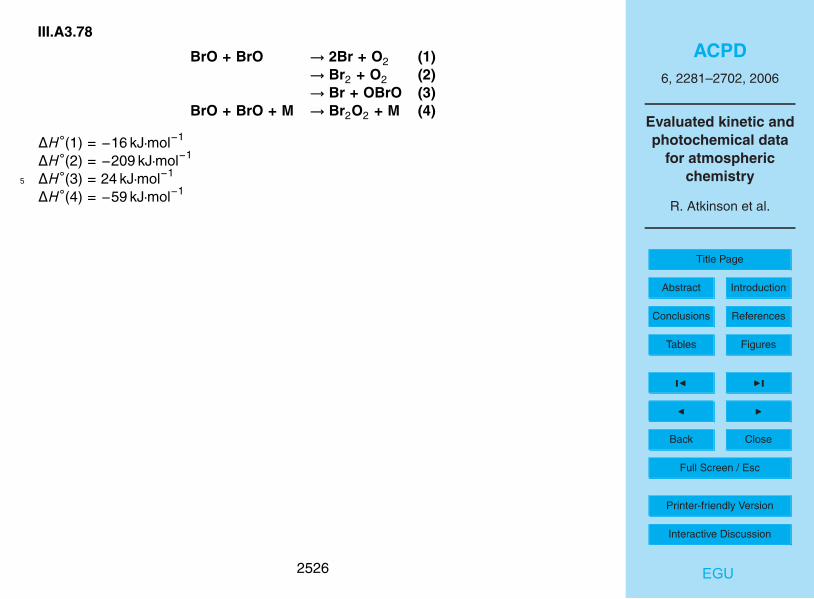
ACPD6, 2281–2702, 2006
Evaluated kinetic andphotochemical data
for atmosphericchemistry
R. Atkinson et al.
Title Page
Abstract Introduction
Conclusions References
Tables Figures
J I
J I
Back Close
Full Screen / Esc
Printer-friendly Version
Interactive Discussion
EGU
III.A3.78
BrO + BrO → 2Br + O2 (1)→ Br2 + O2 (2)→ Br + OBrO (3)
BrO + BrO + M → Br2O2 + M (4)
∆H◦(1) = −16 kJ·mol−1
∆H◦(2) = −209 kJ·mol−1
∆H◦(3) = 24 kJ·mol−15
∆H◦(4) = −59 kJ·mol−1
2526

ACPD6, 2281–2702, 2006
Evaluated kinetic andphotochemical data
for atmosphericchemistry
R. Atkinson et al.
Title Page
Abstract Introduction
Conclusions References
Tables Figures
J I
J I
Back Close
Full Screen / Esc
Printer-friendly Version
Interactive Discussion
EGU
Rate coefficient data (k=k1+k2+k3+k4)
k/cm3 molecule−1 s−1 Temp./K Reference Technique/Comments
Absolute Rate Coefficients(3.17 ± 0.67) × 10−12 298 Clyne and Watson, 1975 DF-MS9.58 × 10−13 exp[(255 ± 195)/T ] 223–388 Sander and Watson, 1981 (a)(2.17 ± 0.68) × 10−12 298(3.2 ± 0.5) × 10−12 298 Lancar et al., 1991 (b)k2 = (4.7 ± 1.5) × 10−13 298(2.75 ± 0.57) × 10−12 298 Mauldin et al., 1993 (c)k2 = (4.45 ± 0.82) × 10−13 298k1 = (2.49 ± 0.42) × 10−12 298 Rowley et al.,1996 (d)k2 = (4.69 ± 0.68) × 10−13 298(2.8 ± 0.5) × 10−12 298 Laszlo et al., 1997 (e)1.70 × 10⁻¹² exp[(215 ± 50)/T ] 204–388 Gilles et al., 1997 (f)(3.51 ± 0.35) × 10−12 298k1 = 5.31 × 10⁻¹² exp[-(211 ± 59)/T ] 250–298 Harwood et al., 1998 (g)k2 = 1.13 × 10⁻¹⁴ exp[(983 ± 111)/T ] 250–298k4 = (8.2 ± 1.1) × 10−32[M] 222
Branching Ratiosk1/k = 0.84 ± 0.03 298 Sander and Watson, 1981 (a)k1/k = 0.84 ± 0.01 298 Mauldin et al., 1993 (c)k1/k = 0.68 ± 0.05 220k1/k = 0.85 ± 0.02 298 Rowley et al., 1996 (d)
2527
ACPD6, 2281–2702, 2006
Evaluated kinetic andphotochemical data
for atmosphericchemistry
R. Atkinson et al.
Title Page
Abstract Introduction
Conclusions References
Tables Figures
J I
J I
Back Close
Full Screen / Esc
Printer-friendly Version
Interactive Discussion
EGU
Comments
(a) Flash photolysis study with absorption spectroscopic detection of BrO radicalsusing the 7-0 band of the A-X system at 339 nm, for which a cross-sectionof (1.14±0.14)×10−17 cm2 molecule−1 was measured. The total pressure was65 mbar to 789 mbar of N2. The branching ratio was determined from measure-5
ments with and without excess O3 present, using two methods which gave thesame result.
(b) Discharge flow-mass spectrometry study, in which rate coefficients were deter-mined from measurements with and without excess O3 present. The rate coeffi-cient, k2 was obtained from BrO radical decays and Br2 formation.10
(c) Flash photolysis-long path absorption technique. Measurements were madeat 298 K and 220 K over a pressure range of 100 mbar to 800 mbar of He,N2 and SF6. The overall rate coefficient was found to be independent ofpressure at 298 K, but at 220 K to increase from 2.0×10⁻¹² cm3 molecule−1 s−1
at 133 mbar to 3.1×10⁻¹² cm3 molecule−1 s−1 at 530 mbar. The branching ra-15
tio was found to be independent of pressure at 298 K and 220 K. An ad-ditional transient absorption feature was observed at 220 K and was tenta-tively attributed to Br2O2. BrO concentrations were determined using the ab-sorption cross-sections of Wahner et al. (1988) the cross-section at 338.5 nmwas 1.71×10⁻¹⁷ cm2 molecule−1 at 298 K and 2.21×10⁻¹⁷ cm2 molecule−1 at20
220 K (0.2 nm resolution). The following expressions were recommendedfor atmospheric modeling: k1=4.0×10⁻¹²exp(−190/T ) cm3 molecule−1 s−1 andk2=4.2×10⁻¹⁴ exp(660/T ) cm3 molecule−1 s−1.
(d) Flash photolysis-UV absorption technique, with detection of BrO radicals usingtime-resolved CCD detection in the A-X system at 400 nm to 470 nm. BrO radical25
concentrations were determined using the absorption cross-sections of Wahneret al. (1988) compensated for the change in resolution. Rate coefficients were
2528
ACPD6, 2281–2702, 2006
Evaluated kinetic andphotochemical data
for atmosphericchemistry
R. Atkinson et al.
Title Page
Abstract Introduction
Conclusions References
Tables Figures
J I
J I
Back Close
Full Screen / Esc
Printer-friendly Version
Interactive Discussion
EGU
obtained from measurements with and without excess O3 present. OBrO wasobserved in the presence of high concentrations of O3, apparently due to theBrO+O3 reaction and not to channel (3). The total pressure was 1000 mbar.
(e) Pulsed laser photolysis of N2O-Br2-N2 mixtures, with absorption spec-troscopic detection of BrO radicals. An absorption cross-section of5
(1.41±0.15)×10−17 cm2 molecule−1 at 338.5 nm was measured.
(f) Pulsed laser photolysis of N2O-Br2-N2 mixtures, with absorption spec-troscopic detection of BrO radicals. An absorption cross-section of1.63×10−17 cm2 molecule−1 at 338.5 nm (0.5 nm resolution) was measured at298 K. A similar temperature dependence of the absorption cross-section as ob-10
served by Wahner et al. (1988) was obtained.
(g) Flash photolysis-absorption spectroscopy technique with detection of BrO radi-cals using time-resolved CCD detection in the A-X system at 400 nm to 470 nm.BrO concentrations were determined using the absorption cross-sections of Wah-ner et al. (1988) compensated for change in resolution and for temperature de-15
pendence. Rate coefficients were obtained from measurements with and withoutexcess O3 present. The total pressure was in the range 130 mbar to 1000 mbar.In the presence of O3 and below 250 K, departure from second-order kinetics forBrO and a transient absorption attributed to Br2O2 was observed. The overallrate coefficient was pressure dependent in this temperature regime and the re-20
sults were analyzed to yield a value for the rate coefficient for dimer formation[channel (4)] at 222 K. The formation of the dimer apparently replaced the bi-molecular channels at low temperature, and the expressions for k1 and k2 onlyapply to temperatures >250 K.
2529
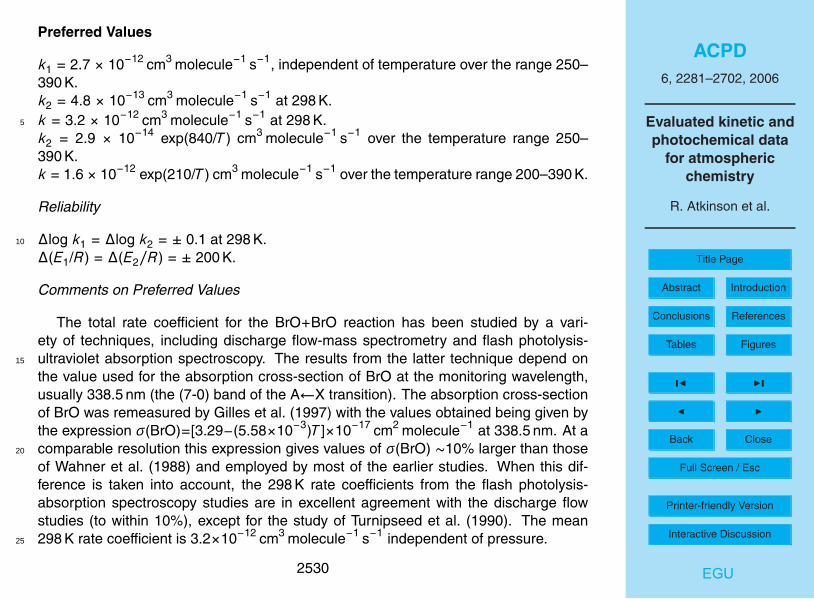
ACPD6, 2281–2702, 2006
Evaluated kinetic andphotochemical data
for atmosphericchemistry
R. Atkinson et al.
Title Page
Abstract Introduction
Conclusions References
Tables Figures
J I
J I
Back Close
Full Screen / Esc
Printer-friendly Version
Interactive Discussion
EGU
Preferred Values
k1 = 2.7 × 10⁻¹² cm3 molecule−1 s−1, independent of temperature over the range 250–390 K.k2 = 4.8 × 10⁻¹³ cm3 molecule−1 s−1 at 298 K.k = 3.2 × 10⁻¹² cm3 molecule−1 s−1 at 298 K.5
k2 = 2.9 × 10⁻¹⁴ exp(840/T ) cm3 molecule−1 s−1 over the temperature range 250–390 K.k = 1.6 × 10⁻¹² exp(210/T ) cm3 molecule−1 s−1 over the temperature range 200–390 K.
Reliability
∆log k1 = ∆log k2 = ± 0.1 at 298 K.10
∆(E1/R) = ∆(E2/R) = ± 200 K.
Comments on Preferred Values
The total rate coefficient for the BrO+BrO reaction has been studied by a vari-ety of techniques, including discharge flow-mass spectrometry and flash photolysis-ultraviolet absorption spectroscopy. The results from the latter technique depend on15
the value used for the absorption cross-section of BrO at the monitoring wavelength,usually 338.5 nm (the (7-0) band of the A←X transition). The absorption cross-sectionof BrO was remeasured by Gilles et al. (1997) with the values obtained being given bythe expression σ(BrO)=[3.29−(5.58×10⁻³)T ]×10−17 cm2 molecule−1 at 338.5 nm. At acomparable resolution this expression gives values of σ(BrO) ∼10% larger than those20
of Wahner et al. (1988) and employed by most of the earlier studies. When this dif-ference is taken into account, the 298 K rate coefficients from the flash photolysis-absorption spectroscopy studies are in excellent agreement with the discharge flowstudies (to within 10%), except for the study of Turnipseed et al. (1990). The mean298 K rate coefficient is 3.2×10⁻¹² cm3 molecule−1 s−1 independent of pressure.25
2530

ACPD6, 2281–2702, 2006
Evaluated kinetic andphotochemical data
for atmosphericchemistry
R. Atkinson et al.
Title Page
Abstract Introduction
Conclusions References
Tables Figures
J I
J I
Back Close
Full Screen / Esc
Printer-friendly Version
Interactive Discussion
EGU
The branching ratio between the bimolecular channels has been measured directlyin the studies cited (Clyne and Watson, 1975; Mauldin et al., 1993; Rowley et al., 1996)and by Turnipseed et al. (1990) and indirectly by Jaffe and Mainquist (1980) from 258 Kto 333 K, Cox et al. (1982) from 278 K to 348 K, and by Rattigan et al. (1995) at 298 K.All studies are in agreement that k1/k=0.85±0.03 at 298 K and that the termolecular5
channel increases in importance with decreasing temperature. Recent ab initio calcu-lations (Li and Jeong, 2001) have confirmed the existence of stable Br2O2 isomers andthe endothermicity of channel (3) forming OBrO.
The temperature dependence is complicated by a pressure dependence of therate coefficients at low temperatures (<250 K), as observed by Mauldin et al. (1993)10
and Harwood et al. (1998). The rate coefficients at <250 K increase with pressure,which Harwood et al. (1998) associated with the formation of an unstable Br2O2 dimerwhich was observed spectroscopically by both Mauldin et al. (1993) and Harwood etal. (1998). The study of Gilles et al. (1997), which covers the largest temperature rangeand was conducted at low total pressures, shows a small negative temperature depen-15
dence for the overall rate coefficient. The preferred values are based on the above298 K rate coefficient of k=3.2×10⁻¹² cm3 molecule−1 s−1 and an (E/R)=−210 K, re-sulting in k=1.6×10⁻¹² exp(210/T ) cm3 molecule−1 s−1. The recommended channel-specific rate coefficients are based on the values of k1/k=0.85 at 298 K and k1/k=0.68at 220 K.20
References
Clyne, M. A. A. and Watson, R. T.: J. Chem. Soc. Faraday Trans., 1, 71, 336, 1975.Cox, R. A., Sheppard, D. W., and Stevens, M. P.: J. Photochem., 19, 189, 1982.Gilles, M. K., Turnipseed, A. A., Burkholder, J. B., Ravishankara, A. R., and Solomon,S.: J. Phys. Chem. A, 101, 5526, 1997.25
Harwood, M. H., Rowley, D. M., Cox, R. A., and Jones, R. L.: J. Phys. Chem. A, 102,1790, 1998.
2531

ACPD6, 2281–2702, 2006
Evaluated kinetic andphotochemical data
for atmosphericchemistry
R. Atkinson et al.
Title Page
Abstract Introduction
Conclusions References
Tables Figures
J I
J I
Back Close
Full Screen / Esc
Printer-friendly Version
Interactive Discussion
EGU
Jaffe, S. and Mainquist, W. K.: J. Phys. Chem., 84, 3277, 1980.Lancar, I. T., Laverdet, G., Le Bras, G., and Poulet, G.: Int. J. Chem. Kinet., 23, 37,1991.Laszlo, B., Huie, R. E., Kurylo, M. J., and Miziolek, A. W.: J. Geophys. Res., 102,1523, 1997.5
Li, Z. and Jeong, G-R.: Chem. Phys. Lett., 340, 194, 2001.Mauldin III, R. L., Wahner, A., and Ravishankara, A. R.: J. Phys. Chem., 97, 7585,1993.Rattigan, O. V., Cox, R. A., and Jones, R. L.: J. Chem. Soc. Faraday Trans., 91, 4189,1995.10
Rowley, D. M., Harwood, M. H., Freshwater, R. A., and Jones, R. L.: J. Phys. Chem.,100, 3020, 1996.Sander, S. P. and Watson, R. T.: J. Phys. Chem., 85, 4000, 1981.Turnipseed, A. A., Birks, J. W., and Calvert, J. G.: J. Phys. Chem., 94, 7477, 1990.Wahner, A., Ravishankara, A. R., Sander, S. P., and Friedl, R. R.: Chem. Phys. Lett.,15
152, 507, 1988.
2532
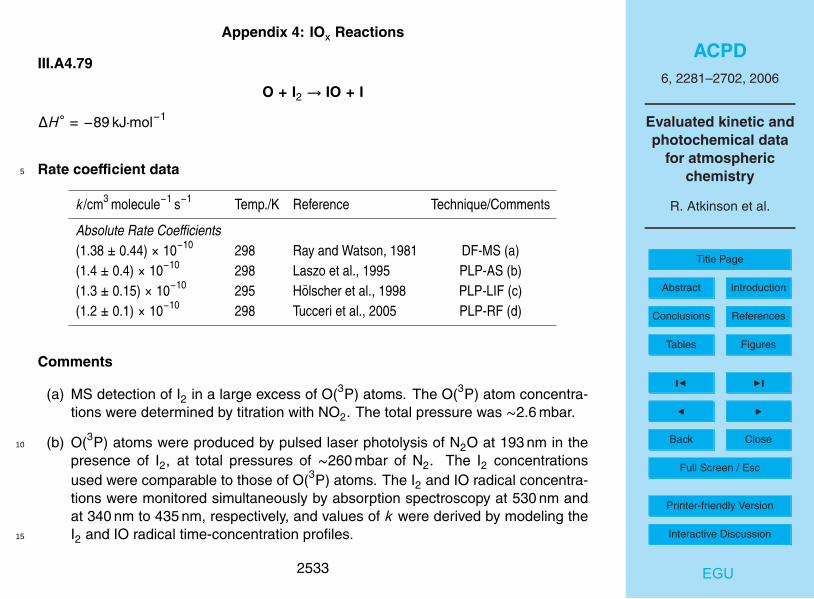
ACPD6, 2281–2702, 2006
Evaluated kinetic andphotochemical data
for atmosphericchemistry
R. Atkinson et al.
Title Page
Abstract Introduction
Conclusions References
Tables Figures
J I
J I
Back Close
Full Screen / Esc
Printer-friendly Version
Interactive Discussion
EGU
Appendix 4: IOx Reactions
III.A4.79
O + I2 → IO + I
∆H◦ = −89 kJ·mol−1
Rate coefficient data5
k/cm3 molecule−1 s−1 Temp./K Reference Technique/Comments
Absolute Rate Coefficients(1.38 ± 0.44) × 10−10 298 Ray and Watson, 1981 DF-MS (a)(1.4 ± 0.4) × 10−10 298 Laszo et al., 1995 PLP-AS (b)(1.3 ± 0.15) × 10−10 295 Holscher et al., 1998 PLP-LIF (c)(1.2 ± 0.1) × 10−10 298 Tucceri et al., 2005 PLP-RF (d)
Comments
(a) MS detection of I2 in a large excess of O(3P) atoms. The O(3P) atom concentra-tions were determined by titration with NO2. The total pressure was ∼2.6 mbar.
(b) O(3P) atoms were produced by pulsed laser photolysis of N2O at 193 nm in the10
presence of I2, at total pressures of ∼260 mbar of N2. The I2 concentrationsused were comparable to those of O(3P) atoms. The I2 and IO radical concentra-tions were monitored simultaneously by absorption spectroscopy at 530 nm andat 340 nm to 435 nm, respectively, and values of k were derived by modeling theI2 and IO radical time-concentration profiles.15
2533
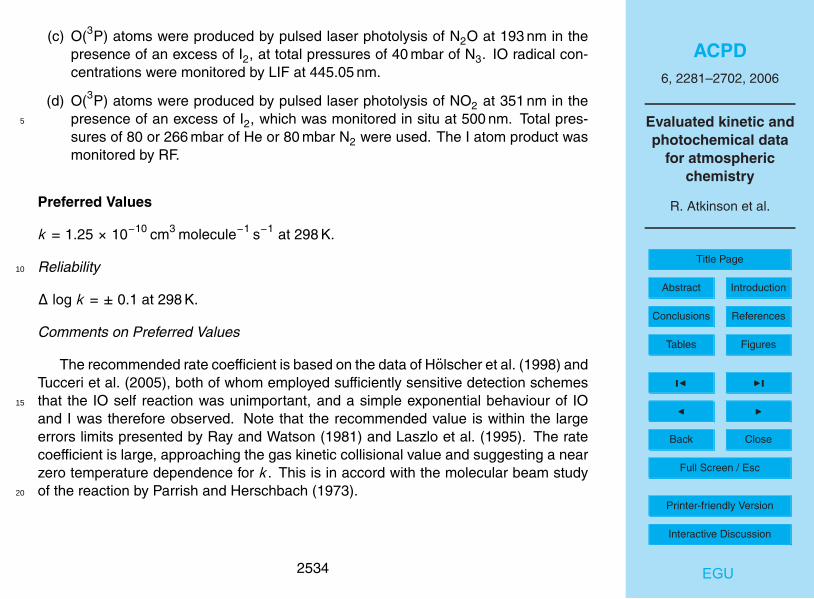
ACPD6, 2281–2702, 2006
Evaluated kinetic andphotochemical data
for atmosphericchemistry
R. Atkinson et al.
Title Page
Abstract Introduction
Conclusions References
Tables Figures
J I
J I
Back Close
Full Screen / Esc
Printer-friendly Version
Interactive Discussion
EGU
(c) O(3P) atoms were produced by pulsed laser photolysis of N2O at 193 nm in thepresence of an excess of I2, at total pressures of 40 mbar of N3. IO radical con-centrations were monitored by LIF at 445.05 nm.
(d) O(3P) atoms were produced by pulsed laser photolysis of NO2 at 351 nm in thepresence of an excess of I2, which was monitored in situ at 500 nm. Total pres-5
sures of 80 or 266 mbar of He or 80 mbar N2 were used. The I atom product wasmonitored by RF.
Preferred Values
k = 1.25 × 10⁻¹⁰ cm3 molecule−1 s−1 at 298 K.
Reliability10
∆ log k = ± 0.1 at 298 K.
Comments on Preferred Values
The recommended rate coefficient is based on the data of Holscher et al. (1998) andTucceri et al. (2005), both of whom employed sufficiently sensitive detection schemesthat the IO self reaction was unimportant, and a simple exponential behaviour of IO15
and I was therefore observed. Note that the recommended value is within the largeerrors limits presented by Ray and Watson (1981) and Laszlo et al. (1995). The ratecoefficient is large, approaching the gas kinetic collisional value and suggesting a nearzero temperature dependence for k. This is in accord with the molecular beam studyof the reaction by Parrish and Herschbach (1973).20
2534

ACPD6, 2281–2702, 2006
Evaluated kinetic andphotochemical data
for atmosphericchemistry
R. Atkinson et al.
Title Page
Abstract Introduction
Conclusions References
Tables Figures
J I
J I
Back Close
Full Screen / Esc
Printer-friendly Version
Interactive Discussion
EGU
References
Holscher, D., Fockenberg, C., and Zellner, R.: Ber. Bunsenges. Phys. Chem., 102,716, 1998.Laszlo, B., Kurylo, M. J., and Huie, R. E.: J. Phys. Chem., 99, 11 701, 1995.Parrish, D. D. and Herschbach, D. R.: J. Am. Chem. Soc., 95, 6133, 1973.5
Ray, G. W. and Watson, R. T.: J. Phys. Chem., 85, 2955, 1981.Tucceri, M. E., Dillon, T. J., and Crowley, J. N.: Phys. Chem. Chem. Phys., 7, 1657,2005.
2535
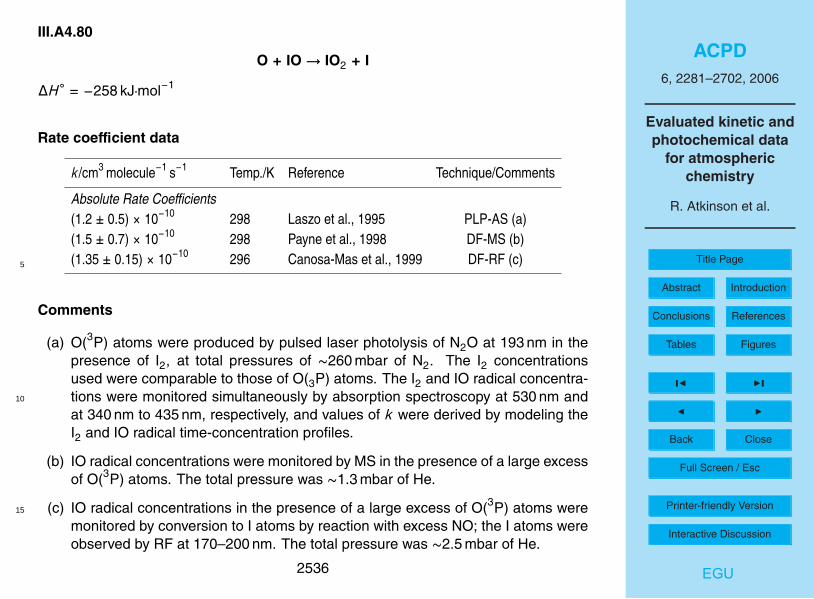
ACPD6, 2281–2702, 2006
Evaluated kinetic andphotochemical data
for atmosphericchemistry
R. Atkinson et al.
Title Page
Abstract Introduction
Conclusions References
Tables Figures
J I
J I
Back Close
Full Screen / Esc
Printer-friendly Version
Interactive Discussion
EGU
III.A4.80
O + IO→ IO2 + I
∆H◦ = −258 kJ·mol−1
Rate coefficient data
k/cm3 molecule−1 s−1 Temp./K Reference Technique/Comments
Absolute Rate Coefficients(1.2 ± 0.5) × 10−10 298 Laszo et al., 1995 PLP-AS (a)(1.5 ± 0.7) × 10−10 298 Payne et al., 1998 DF-MS (b)(1.35 ± 0.15) × 10−10 296 Canosa-Mas et al., 1999 DF-RF (c)5
Comments
(a) O(3P) atoms were produced by pulsed laser photolysis of N2O at 193 nm in thepresence of I2, at total pressures of ∼260 mbar of N2. The I2 concentrationsused were comparable to those of O(3P) atoms. The I2 and IO radical concentra-tions were monitored simultaneously by absorption spectroscopy at 530 nm and10
at 340 nm to 435 nm, respectively, and values of k were derived by modeling theI2 and IO radical time-concentration profiles.
(b) IO radical concentrations were monitored by MS in the presence of a large excessof O(3P) atoms. The total pressure was ∼1.3 mbar of He.
(c) IO radical concentrations in the presence of a large excess of O(3P) atoms were15
monitored by conversion to I atoms by reaction with excess NO; the I atoms wereobserved by RF at 170–200 nm. The total pressure was ∼2.5 mbar of He.
2536

ACPD6, 2281–2702, 2006
Evaluated kinetic andphotochemical data
for atmosphericchemistry
R. Atkinson et al.
Title Page
Abstract Introduction
Conclusions References
Tables Figures
J I
J I
Back Close
Full Screen / Esc
Printer-friendly Version
Interactive Discussion
EGU
Preferred Values
k = 1.4 × 10⁻¹⁰ cm3 molecule−1 s−1 at 298 K.
Reliability
∆ log k = ± 0.2 at 298 K.
Comments on Preferred Values5
Prior to the three studies cited in the table (Laszlo et al., 1995; Payne et al., 1998;Canosa-Mas et al., 1999) only estimates of the rate coefficient for this reaction wereavailable. The preferred value is the mean of the rate coefficients obtained by Laszlo etal. (1995), Payne et al. (1998) and Canosa-Mas et al. (1999), which are in good agree-ment and were obtained using quite different experimental techniques. The value of the10
rate coefficient is large, approaching the gas kinetic collisional value and suggesting anear zero temperature dependence of k.
References
Canosa-Mas, C. E., Flugge, M. L., Shah, D., Vipond, A., and Wayne, R. P.: J. Atmos.Chem., 34, 153, 1999.15
Laszlo, B., Kurylo, M. J., and Huie, R. E.: J. Phys. Chem., 99, 11701, 1995.Payne, W. A., Thorn Jr., R. P., Nesbitt, F. L., and Stief, L. J.: J. Phys. Chem. A, 102,6247, 1998.
2537

ACPD6, 2281–2702, 2006
Evaluated kinetic andphotochemical data
for atmosphericchemistry
R. Atkinson et al.
Title Page
Abstract Introduction
Conclusions References
Tables Figures
J I
J I
Back Close
Full Screen / Esc
Printer-friendly Version
Interactive Discussion
EGU
III.A4.81
I + HO2 → HI + O2
∆H◦ = −94.9 kJ·mol−1
Rate coefficient data
k/cm3 molecule−1 s−1 Temp./K Reference Technique/Comments
Absolute Rate Coefficients1.47 × 10−11 exp[-(1090 ± 130)/T ] 283–353 Jenkin et al., 1990 (a)(3.8 ± 1.0) × 10−13 2985
Comments
(a) Two experimental methods were used. The first technique involved a dis-charge flow system with EPR detection of I atoms (directly) and of HO2 radi-cals after conversion to HO radicals (by reaction with NO). The first-order de-cays of HO2 radicals in excess I atoms were measured, resulting in a rate co-10
efficient of k=(3.1±1.2)×10−13 cm3 molecule−1 s−1 at 298 K. The second tech-nique, which provided the temperature dependence, employed the molecularmodulation method with UV absorption detection of HO2 radicals, and with theI atom concentration being determined from the observed modulation of theI2 absorption at 500 nm. Excess I atoms were employed, and the HO2 rad-15
ical self-reaction competed with the I+HO2 reaction. The best analysis gavek=(4.17±0.4)×10−13 cm3 molecule−1 s−1 at 298 K. The Arrhenius expression was
2538

ACPD6, 2281–2702, 2006
Evaluated kinetic andphotochemical data
for atmosphericchemistry
R. Atkinson et al.
Title Page
Abstract Introduction
Conclusions References
Tables Figures
J I
J I
Back Close
Full Screen / Esc
Printer-friendly Version
Interactive Discussion
EGU
obtained from the mean of the discharge flow and molecular modulation determi-nations at 298 K and the E/R obtained from a least-squares fit to the temperature-dependent data.
Preferred Values
k = 3.8 × 10⁻¹³ cm3 molecule−1 s−1 at 298 K.5
k = 1.5 × 10⁻¹¹ exp(−1090/T ) cm3 molecule−1 s−1 over the temperature range 280–360 K.
Reliability
∆ log k = ± 0.3 at 298 K.∆ (E/R) = ± 500 K.10
Comments on Preferred Values
The preferred values are based on the two experimental studies reported by Jenkinet al. (1990) which are the only reported measurements for this reaction. The valuesof the rate coefficient at 298 K from the two studies agree quite well, although bothstudies exhibited significant experimental error. The Arrhenius expression suggested15
by Jenkin et al. (1990) is accepted for the temperature dependence.
References
Jenkin, M. E., Cox, R. A., Mellouki, A., Le Bras, G., and Poulet, G.: J. Phys. Chem.,94, 2927, 1990.
20
2539
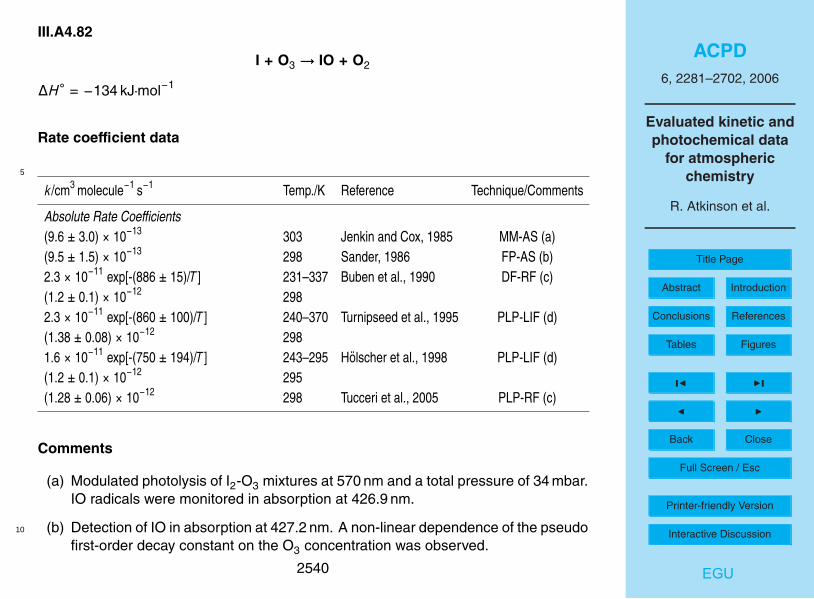
ACPD6, 2281–2702, 2006
Evaluated kinetic andphotochemical data
for atmosphericchemistry
R. Atkinson et al.
Title Page
Abstract Introduction
Conclusions References
Tables Figures
J I
J I
Back Close
Full Screen / Esc
Printer-friendly Version
Interactive Discussion
EGU
III.A4.82
I + O3 → IO + O2
∆H◦ = −134 kJ·mol−1
Rate coefficient data
5
k/cm3 molecule−1 s−1 Temp./K Reference Technique/Comments
Absolute Rate Coefficients(9.6 ± 3.0) × 10−13 303 Jenkin and Cox, 1985 MM-AS (a)(9.5 ± 1.5) × 10−13 298 Sander, 1986 FP-AS (b)2.3 × 10⁻¹¹ exp[-(886 ± 15)/T ] 231–337 Buben et al., 1990 DF-RF (c)(1.2 ± 0.1) × 10−12 2982.3 × 10−11 exp[-(860 ± 100)/T ] 240–370 Turnipseed et al., 1995 PLP-LIF (d)(1.38 ± 0.08) × 10−12 2981.6 × 10−11 exp[-(750 ± 194)/T ] 243–295 Holscher et al., 1998 PLP-LIF (d)(1.2 ± 0.1) × 10−12 295(1.28 ± 0.06) × 10−12 298 Tucceri et al., 2005 PLP-RF (c)
Comments
(a) Modulated photolysis of I2-O3 mixtures at 570 nm and a total pressure of 34 mbar.IO radicals were monitored in absorption at 426.9 nm.
(b) Detection of IO in absorption at 427.2 nm. A non-linear dependence of the pseudo10
first-order decay constant on the O3 concentration was observed.
2540

ACPD6, 2281–2702, 2006
Evaluated kinetic andphotochemical data
for atmosphericchemistry
R. Atkinson et al.
Title Page
Abstract Introduction
Conclusions References
Tables Figures
J I
J I
Back Close
Full Screen / Esc
Printer-friendly Version
Interactive Discussion
EGU
(c) Direct detection of I atom reactant in excess O3.
(d) Detection of IO product by LIF.
Preferred Values
k = 1.3 × 10⁻¹² cm3 molecule−1 s−1 at 298 K.k = 2.1 × 10⁻¹¹ exp(−830/T ) cm3 molecule−1 s−1 over the temperature range 230–5
370 K.
Reliability
∆ log k = ± 0.05 at 298 K.∆ (E/R) = ± 150 K.
Comments on Preferred Values10
The most recent studies of this reaction (Buben et al., 1990; Turnipseed et al., 1995;Holscher et al., 1998; Tucceri et al., 2005) are in excellent agreement and indicatesomewhat higher rate coefficients than those obtained previously. A weighted averagevalue of (1.28±0.08)×10−12 cm3 molecule−1 s−1 is derived from these four studies, andprovides the basis of the recommendation.15
The preferred Arrhenius expression for k is obtained by combining the mean ofthe values of E/R from the studies of Buben et al. (1990), Turnipseed et al. (1995) andHolscher et al. (1998) with a pre-exponential factor adjusted to give the preferred valueof k at 298 K.
2541

ACPD6, 2281–2702, 2006
Evaluated kinetic andphotochemical data
for atmosphericchemistry
R. Atkinson et al.
Title Page
Abstract Introduction
Conclusions References
Tables Figures
J I
J I
Back Close
Full Screen / Esc
Printer-friendly Version
Interactive Discussion
EGU
References
Buben, S. N., Larin, I. K., Messineva, N. A., and Trofimova, E. M.: Khim. Fiz., 9, 116,1990.Holscher, D., Fockenberg, C., and Zellner, R.: Ber. Bunsenges. Phys. Chem., 102,716, 1998.5
Jenkin, M. E. and Cox, R. A.: J. Phys. Chem., 89, 192, 1985.Sander, S. P.: J. Phys. Chem., 90, 2194, 1986.Tucceri, M. E., Dillon, T. J., and Crowley, J. N.: Phys. Chem. Chem. Phys, 7, 1657,2005.Turnipseed, A. A., Gilles, M. K., Burkholder, J. B., and Ravishankara, A. R.: Chem.10
Phys. Lett., 242, 427, 1995.
2542

ACPD6, 2281–2702, 2006
Evaluated kinetic andphotochemical data
for atmosphericchemistry
R. Atkinson et al.
Title Page
Abstract Introduction
Conclusions References
Tables Figures
J I
J I
Back Close
Full Screen / Esc
Printer-friendly Version
Interactive Discussion
EGU
III.A4.83
I + NO + M→ INO + M
∆H◦ = −75.7 kJ·mol−1
Low-pressure rate coefficients
Rate coefficient data5
k0/cm3 molecule−1 s−1 Temp./K Reference Technique/Comments
Absolute Rate Coefficients(6.0 ± 2.5) × 10−33 (T /300)−1.0 [He] 320–450 van den Bergh and Troe, 1976 PLP-UVA (a)(1.6 ± 0.5) × 10−32 [N2] 330 van den Bergh et al., 1977 PLP-UVA (b)(9.5 ± 3.0) × 10−33 [Ar] 330(1.05 ± 0.30) × 10−32 [Ar] 298(1.03 ± 0.06) × 10−32 (T /300)−1.1 [He] 298–328 Basco and Hunt, 1978 FP (c)
Comments
(a) Photolysis of I2 at 694 nm in the presence of NO and He. The pressure of He wasvaried between 1 and 200 bar. I2 and INO spectra were observed.10
(b) As in comment (a). The rate coefficient for M=Ar at 298 K was calculated from themeasured rate coefficient at 330 K and the temperature dependence reported byvan den Bergh and Troe (1976).
(c) Photolysis of I2 in the presence of NO and Ar.
2543

ACPD6, 2281–2702, 2006
Evaluated kinetic andphotochemical data
for atmosphericchemistry
R. Atkinson et al.
Title Page
Abstract Introduction
Conclusions References
Tables Figures
J I
J I
Back Close
Full Screen / Esc
Printer-friendly Version
Interactive Discussion
EGU
Preferred Values
k0 = 1.8 × 10⁻³² (T /300)−1.0 [N2] cm3 molecule−1 s−1 over the temperature range 290–450 K.
Reliability
∆ log k0 = ± 0.1 at 298 K.5
∆ n = ± 0.5 K.
Comments on Preferred Values
The preferred values are based on the rate coefficients for M=Ar determined by vanden Bergh et al. (1976) and Basco and Hunt (1978) which agree remarkably well.
2544

ACPD6, 2281–2702, 2006
Evaluated kinetic andphotochemical data
for atmosphericchemistry
R. Atkinson et al.
Title Page
Abstract Introduction
Conclusions References
Tables Figures
J I
J I
Back Close
Full Screen / Esc
Printer-friendly Version
Interactive Discussion
EGU
High-pressure rate coefficients
Rate coefficient data
k∞/cm3 molecule−1 s−1 Temp./K Reference Technique/Comments
Absolute Rate Coefficients≥ 1.7 × 10⁻¹¹ 330 van den Bergh and Troe, 1976 PLP-UVA (a)
Comments
(a) As for comment (a) for k0. Based on a falloff extrapolation with Fc=0.6.5
Preferred Values
k∞ = 1.7 × 10⁻¹¹ cm3 molecule−1 s−1 over the temperature range 300–400 K.
Reliability
∆ log k∞ = ± 0.5 over the temperature range 300–400 K.
Comments on Preferred Values10
The preferred values are based on the only measurement by van den Bergh andTroe (1976), extrapolated by using a value of Fc=0.6.
References
Basco, N. and Hunt, J. E.: Int. J. Chem. Kinet., 10, 733, 1978.van den Bergh, H. and Troe, J.: J. Chem. Phys., 64, 736, 1976.15
2545

ACPD6, 2281–2702, 2006
Evaluated kinetic andphotochemical data
for atmosphericchemistry
R. Atkinson et al.
Title Page
Abstract Introduction
Conclusions References
Tables Figures
J I
J I
Back Close
Full Screen / Esc
Printer-friendly Version
Interactive Discussion
EGU
van den Bergh, H., Benoit-Guyot, N., and Troe, J.: Int. J. Chem. Kinet., 9, 223, 1977.
2546
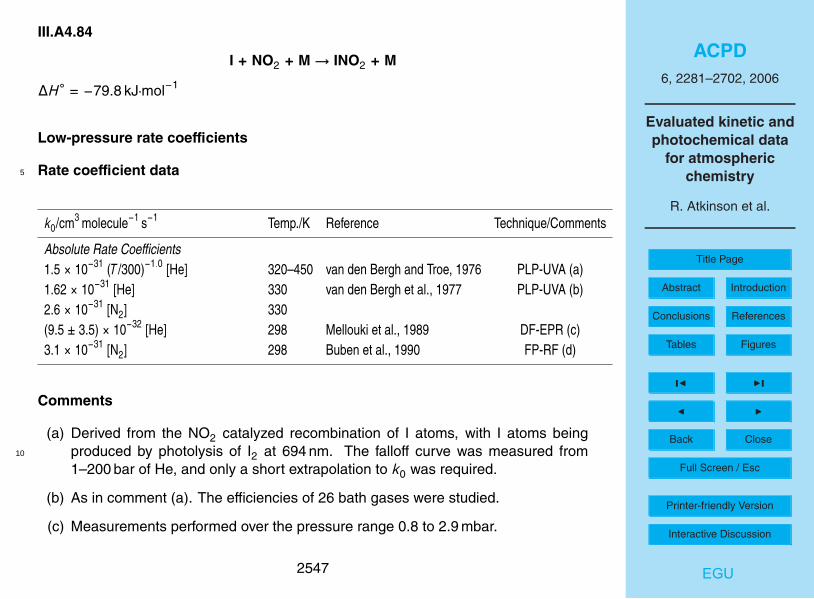
ACPD6, 2281–2702, 2006
Evaluated kinetic andphotochemical data
for atmosphericchemistry
R. Atkinson et al.
Title Page
Abstract Introduction
Conclusions References
Tables Figures
J I
J I
Back Close
Full Screen / Esc
Printer-friendly Version
Interactive Discussion
EGU
III.A4.84
I + NO2 + M→ INO2 + M
∆H◦ = −79.8 kJ·mol−1
Low-pressure rate coefficients
Rate coefficient data5
k0/cm3 molecule−1 s−1 Temp./K Reference Technique/Comments
Absolute Rate Coefficients1.5 × 10−31 (T /300)−1.0 [He] 320–450 van den Bergh and Troe, 1976 PLP-UVA (a)1.62 × 10⁻³¹ [He] 330 van den Bergh et al., 1977 PLP-UVA (b)2.6 × 10⁻³¹ [N2] 330(9.5 ± 3.5) × 10−32 [He] 298 Mellouki et al., 1989 DF-EPR (c)3.1 × 10⁻³¹ [N2] 298 Buben et al., 1990 FP-RF (d)
Comments
(a) Derived from the NO2 catalyzed recombination of I atoms, with I atoms beingproduced by photolysis of I2 at 694 nm. The falloff curve was measured from10
1–200 bar of He, and only a short extrapolation to k0 was required.
(b) As in comment (a). The efficiencies of 26 bath gases were studied.
(c) Measurements performed over the pressure range 0.8 to 2.9 mbar.
2547
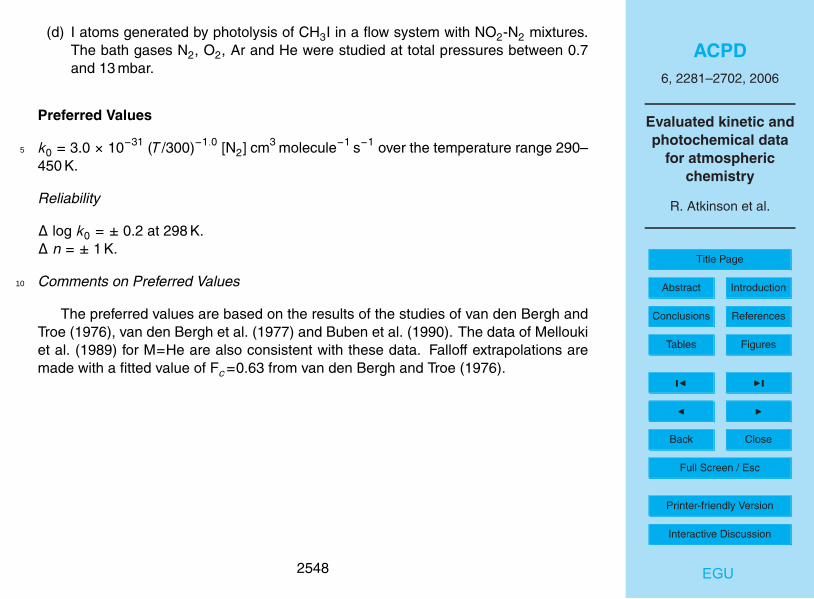
ACPD6, 2281–2702, 2006
Evaluated kinetic andphotochemical data
for atmosphericchemistry
R. Atkinson et al.
Title Page
Abstract Introduction
Conclusions References
Tables Figures
J I
J I
Back Close
Full Screen / Esc
Printer-friendly Version
Interactive Discussion
EGU
(d) I atoms generated by photolysis of CH3I in a flow system with NO2-N2 mixtures.The bath gases N2, O2, Ar and He were studied at total pressures between 0.7and 13 mbar.
Preferred Values
k0 = 3.0 × 10⁻³¹ (T /300)−1.0 [N2] cm3 molecule−1 s−1 over the temperature range 290–5
450 K.
Reliability
∆ log k0 = ± 0.2 at 298 K.∆ n = ± 1 K.
Comments on Preferred Values10
The preferred values are based on the results of the studies of van den Bergh andTroe (1976), van den Bergh et al. (1977) and Buben et al. (1990). The data of Melloukiet al. (1989) for M=He are also consistent with these data. Falloff extrapolations aremade with a fitted value of Fc=0.63 from van den Bergh and Troe (1976).
2548

ACPD6, 2281–2702, 2006
Evaluated kinetic andphotochemical data
for atmosphericchemistry
R. Atkinson et al.
Title Page
Abstract Introduction
Conclusions References
Tables Figures
J I
J I
Back Close
Full Screen / Esc
Printer-friendly Version
Interactive Discussion
EGU
High-pressure rate coefficients
Rate coefficient data
k∞/cm3 molecule−1 s−1 Temp./K Reference Technique/Comments
Absolute Rate Coefficients6.6 × 10−11 320–350 van den Bergh and Troe, 1976 PLP-UVA (a)
Comments5
(a) See comment (a) for k0. Extrapolation of the falloff curve towards the high pres-sure limit uses a fitted value of Fc=0.63.
Preferred Values
k∞ = 6.6 × 10⁻¹¹ cm3 molecule−1 s−1, independent of temperature over the range 290–450 K.10
Reliability
∆ log k∞ = ± 0.3 over the temperature range 300–400 K.
Comments on Preferred Values
The preferred values are based on the results of the study of van den Bergh andTroe (1976). Falloff curves are represented with Fc=0.63.15
2549
ACPD6, 2281–2702, 2006
Evaluated kinetic andphotochemical data
for atmosphericchemistry
R. Atkinson et al.
Title Page
Abstract Introduction
Conclusions References
Tables Figures
J I
J I
Back Close
Full Screen / Esc
Printer-friendly Version
Interactive Discussion
EGU
References
Buben, S. N., Larin, I. K., Messineva, N. A., and Trofimova, E. M.: Kinet. Catal., 31,854, 1990; original pages 973–977, 1990.Mellouki, A., Laverdet, G., Jourdain, J. L., and Poulet, G.: Int. J. Chem. Kinet., 21,1161, 1989.5
van den Bergh, H. and Troe, J.: J. Chem. Phys., 64, 736, 1976.van den Bergh, H., Benoit-Guyot, N., and Troe, J.: Int. J. Chem. Kinet., 9, 223, 1977.
2550

ACPD6, 2281–2702, 2006
Evaluated kinetic andphotochemical data
for atmosphericchemistry
R. Atkinson et al.
Title Page
Abstract Introduction
Conclusions References
Tables Figures
J I
J I
Back Close
Full Screen / Esc
Printer-friendly Version
Interactive Discussion
EGU
III.A4.85
I + NO3 → IO + NO2
∆H◦ = −31.4 kJ·mol−1
Rate coefficient data
k/cm3 molecule−1 s−1 Temp./K Reference Technique/Comments
Absolute Rate Coefficients(4.5 ± 1.9) × 10−10 298 Chambers et al., 1992 DF-RF (a)5
Comments
(a) Discharge flow system with resonance fluorescence detection of I atoms in thepresence of excess NO3 radicals. NO3 radicals and I atoms were produced bythe F+HNO3 and O+I2 reactions, respectively. NO3 radical concentrations weremeasured by visible absorption spectroscopy. Corrections of up to 33% were10
applied to compensate for diffusion effects.
Preferred Values
No recommendation.
Comments on Preferred Values
The only reported measurement of this rate constant was made using the discharge15
flow technique at room temperature (Chamber et al., 1992). Difficulties were encoun-
2551

ACPD6, 2281–2702, 2006
Evaluated kinetic andphotochemical data
for atmosphericchemistry
R. Atkinson et al.
Title Page
Abstract Introduction
Conclusions References
Tables Figures
J I
J I
Back Close
Full Screen / Esc
Printer-friendly Version
Interactive Discussion
EGU
tered due to wall reactions, and the pseudo first-order plots exhibited pronounced cur-vature at contact times longer than 3 ms. In their study of HI+NO3, Lancar et al. (1991)stated that they failed to observe a reaction between I atoms and NO3 radicals, butgave no details or an upper limit. In view of these uncertainties, no recommendation ismade for the rate coefficient at this time.5
References
Chambers, R. M., Heard, A. C., and Wayne, R. P.: J. Phys. Chem., 96, 3321, 1992.Lancar, I. T., Mellouki, A., and Poulet, G.: Chem. Phys. Lett., 177, 554, 1991.
10
2552

ACPD6, 2281–2702, 2006
Evaluated kinetic andphotochemical data
for atmosphericchemistry
R. Atkinson et al.
Title Page
Abstract Introduction
Conclusions References
Tables Figures
J I
J I
Back Close
Full Screen / Esc
Printer-friendly Version
Interactive Discussion
EGU
III.A4.86
I2 + NO3 → I + IONO2
Rate coefficient data
k/cm3 molecule−1 s−1 Temp./K Reference Technique/Comments
Absolute Rate Coefficients(1.5 ± 0.5) × 10−12 292–423 Chambers et al., 1992 (a)
Comments5
(a) Discharge flow system with simultaneous fluorescence detection of I2 and visi-ble absorption spectroscopic measurement of NO3 radicals. NO3 radicals wereproduced by the F+HNO3 reaction. Pseudo first-order conditions were used withNO3 radical concentrations in excess over I2. Experiments were performed tosubstantiate that I2 loss was due to reaction with NO3 radicals, and small correc-10
tions were made to compensate for diffusion effects; the overall error takes intoaccount the uncertainties in the NO3 radical concentrations (±26%).
Preferred Values
No recommendation.
Comments on Preferred Values15
There is only one reported measurement of this rate constant (Chambers et al.,1992) and the products of the reaction were not determined. Chambers et al. (1992)
2553
ACPD6, 2281–2702, 2006
Evaluated kinetic andphotochemical data
for atmosphericchemistry
R. Atkinson et al.
Title Page
Abstract Introduction
Conclusions References
Tables Figures
J I
J I
Back Close
Full Screen / Esc
Printer-friendly Version
Interactive Discussion
EGU
argue that product channels giving I+IO+NO2, I+O2+INO or IO+INO2 are all endother-mic and can be ruled out, and propose formation of I+IONO2. If this is correct, the highvalue of 1.5×10⁻¹² cm3 molecule−1 s−1 for the rate coefficient implies an exothermicprocess and thus an upper limit of ∼29 kJ mol−1 for ∆H◦(IONO2). The calculated (ab ini-tio) bond dissociation energy D0(IO-NO2)=132 kJ mol−1 of Rayez and Destriau (2002)5
can be combined with formation enthalpies of IO (116 kJmol−1) and NO2 (33 kJ mol−1)to give ∆H◦(IONO2)=17 kJ mol−1 which would make the reaction, as written, exother-mic. On the other hand, the RRKM analysis of the fall-off curves for IO+NO2/ab-initiocalculations of Allan and Plane (1993) indicate that ∆H◦(IONO2)=70±16 kJ mol−1. Thiswould render the reaction significantly endothermic. For this reason we make no rec-10
ommendation.
References
Allan, B. J. and Plane, J. M. C.: J. Phys. Chem. A., 106, 8634, 2002.Chambers, R. M., Heard, A. C., and Wayne, R. P.: J. Phys. Chem., 96, 3321, 1992.Rayez, M. T. and Destriau, M.: Chem. Phys. Lett., 206, 278, 1993.15
2554

ACPD6, 2281–2702, 2006
Evaluated kinetic andphotochemical data
for atmosphericchemistry
R. Atkinson et al.
Title Page
Abstract Introduction
Conclusions References
Tables Figures
J I
J I
Back Close
Full Screen / Esc
Printer-friendly Version
Interactive Discussion
EGU
III.A4.87
HO + HI→ H2O + I
∆H◦ = −198.8 kJ·mol−1
Rate coefficient data
5
k/cm3 molecule−1 s−1 Temp./K Reference Technique/Comments
Absolute Rate Coefficients(1.3 ± 0.5) × 10−11 295 Takacs and Glass, 1973 DF-EPR(2.7 ± 0.2) × 10−11 298 Mac Leod et al., 1990 PLP-RF(3.3 ± 0.2) × 10−11 298 Lancar et al., 1991 DF-EPR(7.0+1.9
−0.4 × 10⁻¹¹(T /298)−(1.5±0.5) 246–353 Campuzano-Jost and Crowley, 1999 PLP-RF(6.5+2.0
−0.4) × 10−11 294
Preferred Values
k = 7.0 × 10⁻¹¹ cm3 molecule−1 s−1 at 298 K.k = 1.6 × 10⁻¹¹ exp(440/T ) cm3 molecule−1 s−1 over the temperature range 240–360 K.
Reliability10
∆ log k = ± 0.3 at 298 K.∆ (E/R) = ± 400 K.
2555

ACPD6, 2281–2702, 2006
Evaluated kinetic andphotochemical data
for atmosphericchemistry
R. Atkinson et al.
Title Page
Abstract Introduction
Conclusions References
Tables Figures
J I
J I
Back Close
Full Screen / Esc
Printer-friendly Version
Interactive Discussion
EGU
Comments on Preferred Values
The preferred values are based on the most recent and extensive study ofCampuzano-Jost and Crowley (1999), in which, although the HI concentrations in thereaction cell were not monitored directly during the experiments, care was taken toremove potential impurities in the HI and a number of HO radical precursors were in-5
vestigated before choosing H2O2 photolysis at 248 nm as the optimum. Additionally,two analyses using ion chromatography showed that the HI concentrations in the reac-tion cell were within ∼20% to 25% of those expected (Campuzano-Jost and Crowley,1999). The lower room temperature rate coefficients obtained in the studies of MacLeod et al. (1990) and Lancar et al. (1991), which are more than a factor of two higher10
than the earlier results of Takacs and Glass (1973), may have suffered from unrec-ognized losses of HI due to reactions with the HO radical precursors used and/or (inthe study of Lancar et al., 1991) from generation of vibrationally-excited HO radicals(Campuzano-Jost and Crowley, 1999).
References15
Campuzano-Jost, P. and Crowley, J. N.: J. Phys. Chem. A, 103, 2712, 1999.Lancar, I. T., Mellouko, A., and Poulet, G.: Chem. Phys. Lett., 177, 554, 1991.Mac Leod, H., Balestra, C., Jourdain, J. L., Laverdet, G., and Le Bras, G.: Int. J.Chem. Kinet., 22, 1167, 1990.Takacs, G. A. and Glass, G. P.: J. Phys. Chem., 77, 1948, 1973.20
2556
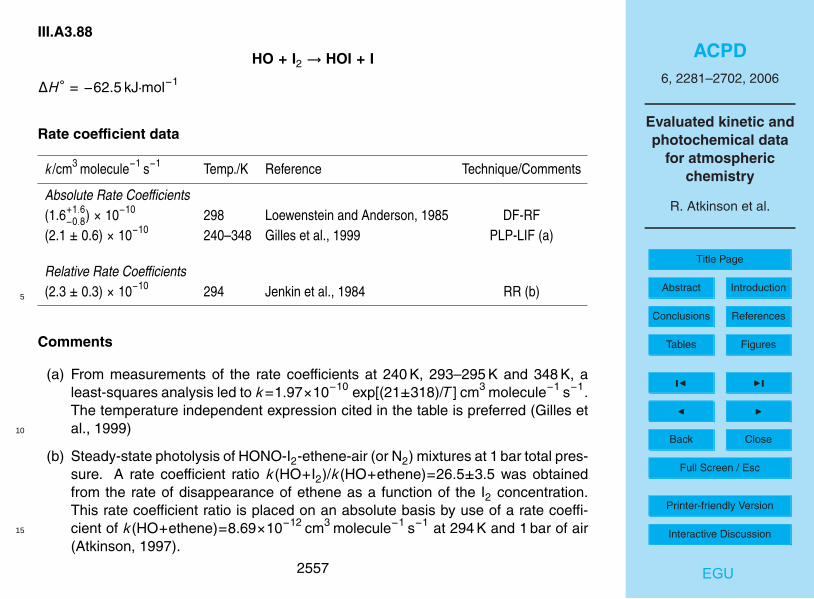
ACPD6, 2281–2702, 2006
Evaluated kinetic andphotochemical data
for atmosphericchemistry
R. Atkinson et al.
Title Page
Abstract Introduction
Conclusions References
Tables Figures
J I
J I
Back Close
Full Screen / Esc
Printer-friendly Version
Interactive Discussion
EGU
III.A3.88
HO + I2 → HOI + I
∆H◦ = −62.5 kJ·mol−1
Rate coefficient data
k/cm3 molecule−1 s−1 Temp./K Reference Technique/Comments
Absolute Rate Coefficients(1.6+1.6
−0.8) × 10−10 298 Loewenstein and Anderson, 1985 DF-RF(2.1 ± 0.6) × 10−10 240–348 Gilles et al., 1999 PLP-LIF (a)
Relative Rate Coefficients(2.3 ± 0.3) × 10−10 294 Jenkin et al., 1984 RR (b)5
Comments
(a) From measurements of the rate coefficients at 240 K, 293–295 K and 348 K, aleast-squares analysis led to k=1.97×10⁻¹⁰ exp[(21±318)/T ] cm3 molecule−1 s−1.The temperature independent expression cited in the table is preferred (Gilles etal., 1999)10
(b) Steady-state photolysis of HONO-I2-ethene-air (or N2) mixtures at 1 bar total pres-sure. A rate coefficient ratio k(HO+I2)/k(HO+ethene)=26.5±3.5 was obtainedfrom the rate of disappearance of ethene as a function of the I2 concentration.This rate coefficient ratio is placed on an absolute basis by use of a rate coeffi-cient of k(HO+ethene)=8.69×10⁻¹² cm3 molecule−1 s−1 at 294 K and 1 bar of air15
(Atkinson, 1997).
2557
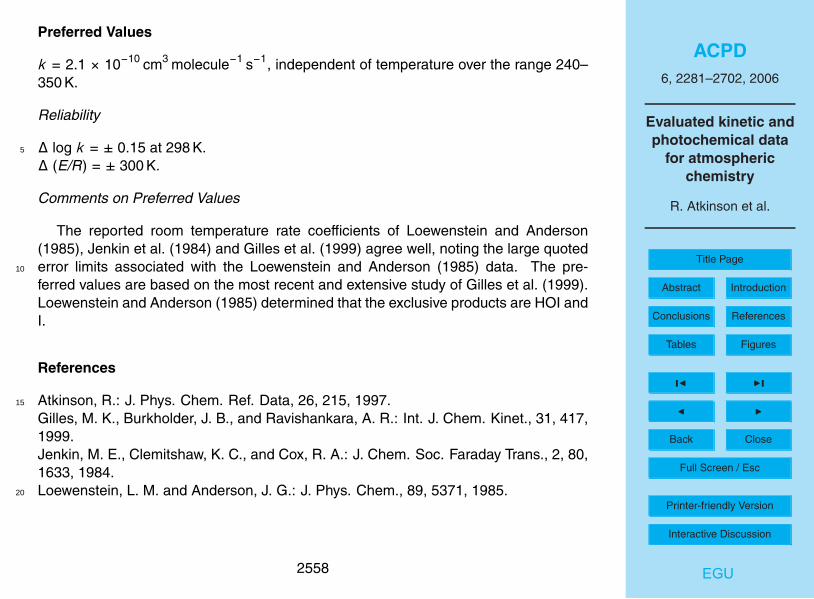
ACPD6, 2281–2702, 2006
Evaluated kinetic andphotochemical data
for atmosphericchemistry
R. Atkinson et al.
Title Page
Abstract Introduction
Conclusions References
Tables Figures
J I
J I
Back Close
Full Screen / Esc
Printer-friendly Version
Interactive Discussion
EGU
Preferred Values
k = 2.1 × 10⁻¹⁰ cm3 molecule−1 s−1, independent of temperature over the range 240–350 K.
Reliability
∆ log k = ± 0.15 at 298 K.5
∆ (E/R) = ± 300 K.
Comments on Preferred Values
The reported room temperature rate coefficients of Loewenstein and Anderson(1985), Jenkin et al. (1984) and Gilles et al. (1999) agree well, noting the large quotederror limits associated with the Loewenstein and Anderson (1985) data. The pre-10
ferred values are based on the most recent and extensive study of Gilles et al. (1999).Loewenstein and Anderson (1985) determined that the exclusive products are HOI andI.
References
Atkinson, R.: J. Phys. Chem. Ref. Data, 26, 215, 1997.15
Gilles, M. K., Burkholder, J. B., and Ravishankara, A. R.: Int. J. Chem. Kinet., 31, 417,1999.Jenkin, M. E., Clemitshaw, K. C., and Cox, R. A.: J. Chem. Soc. Faraday Trans., 2, 80,1633, 1984.Loewenstein, L. M. and Anderson, J. G.: J. Phys. Chem., 89, 5371, 1985.20
2558

ACPD6, 2281–2702, 2006
Evaluated kinetic andphotochemical data
for atmosphericchemistry
R. Atkinson et al.
Title Page
Abstract Introduction
Conclusions References
Tables Figures
J I
J I
Back Close
Full Screen / Esc
Printer-friendly Version
Interactive Discussion
EGU
III.A4.89
NO3 + HI→ HNO3 + I
∆H◦ = −128.5 kJ·mol−1
Rate coefficient data
k/cm3 molecule−1 s−1 Temp./K Reference Technique/Comments
Absolute Rate Coefficients1.3 × 10−12 exp[-(1830 ± 300)/T ] 298–373 Lancar et al., 1991 DF-EPR/MS (a)(2.5 ± 0.8) × 10−15 2985
Comments
(a) NO3 radicals were generated by the reaction of F atoms with HNO3. The ratecoefficient was determined by measuring the decay rate of NO3 radicals (by MS,correcting for the contribution of HNO3 to the m/z=62 ion signal) or by measuringthe formation rate of I atoms (by EPR).10
Preferred Values
No recommendation.
Comments on Preferred Values
Although the rate coefficients measured in the only study (Lancar et al., 1991)of this reaction from the decay of NO3 using MS and I atom production using15
2559

ACPD6, 2281–2702, 2006
Evaluated kinetic andphotochemical data
for atmosphericchemistry
R. Atkinson et al.
Title Page
Abstract Introduction
Conclusions References
Tables Figures
J I
J I
Back Close
Full Screen / Esc
Printer-friendly Version
Interactive Discussion
EGU
EPR spectrometry were in agreement (Lancar et al., 1991), there is a serious po-tential for secondary chemistry occurring in the system leading to an overestima-tion of the rate coefficient for the elementary process. Lancar et al. (1991) re-ported that the reaction of I+NO3→IO+NO2 does not occur, while Chambers etal. (1992) observed that the I+NO3 reaction is rapid, with a measured rate coefficient5
of k(I+NO3)=4.5×10⁻¹⁰ cm3 molecule−1 s−1 at 298 K, and that I atoms are regener-ated from subsequent reactions of IO radicals. Until this uncertainty is resolved, norecommendation can be made.
References
Chambers, R. M., Heard, A. C., and Wayne, R. P.: J. Phys. Chem., 96, 3321, 1992.10
Lancar, I. T., Mellouki, A., and Poulet, G.: Chem. Phys. Lett., 177, 554, 1991.
2560

ACPD6, 2281–2702, 2006
Evaluated kinetic andphotochemical data
for atmosphericchemistry
R. Atkinson et al.
Title Page
Abstract Introduction
Conclusions References
Tables Figures
J I
J I
Back Close
Full Screen / Esc
Printer-friendly Version
Interactive Discussion
EGU
III.A4.90
IO + HO2 → HOI + O2
∆H◦ = −200 kJ·mol−1
Rate coefficient data
k/cm3 molecule−1 s−1 Temp./K Reference Technique/Comments
Absolute Rate Coefficients(6.4 ± 0.7) × 10−11 298 Jenkin et al., 1991 MM (a)(1.03 ± 0.13) × 10−10 298 Maguin et al., 1992 DF-MS (b)9.3 × 10⁻¹² exp[(680 ± 110)/T ] 274–373 Cronkhite et al., 1999 FP-UVA/IR (c)(9.7 ± 2.9) × 10−11 298(7.1 ± 1.6) × 10−11 296 Canosa-Mas et al., 1999 DF-RF (d)2.2× 10⁻¹¹ exp[(400 ± 80)/T ] 273–353 Knight and Crowley, 2001 DF-MS (e)(8.9 ± 0.9) × 10−11 298 (f)(8.00 ± 0.15) × 10−11 298 (g)5
Comments
(a) Molecular modulation technique with UV absorption detection of HO2 radicalsat 220 nm and visible absorption detection of IO radicals at 427 nm. The radi-cals were produced by photolysis of O3-CH3OH-I2-O2 mixtures at 254 nm withHO2 in excess over IO. The rate coefficient, k, was derived from a non-linear10
least-squares analysis of absorption wave-forms. The error limits do not includepossible systematic errors.
2561

ACPD6, 2281–2702, 2006
Evaluated kinetic andphotochemical data
for atmosphericchemistry
R. Atkinson et al.
Title Page
Abstract Introduction
Conclusions References
Tables Figures
J I
J I
Back Close
Full Screen / Esc
Printer-friendly Version
Interactive Discussion
EGU
(b) Discharge flow system with MS detection of HO2 and IO radicals and HOI. IOand HO2 radicals were produced by the O(3P)+I2 and Cl+CH3OH+O2, reactions,respectively. Pseudo first-order decays of IO radicals were measured in the pres-ence of excess HO2. The cited value of k is the average of 25 experiments. HOIwas shown to be a major product. The uniqueness of the HOI+O2 forming chan-5
nel could not be established, although no evidence was found for O3 formation bythe alternative HI+O3 channel.
(c) Pulsed laser photolysis of Cl2-CH3OH-O2-I2-NO2-SF6-N2 mixtures at 308 nm withsimultaneous time-resolved detection of HO2 radicals (by infrared TDLS) and IOradicals (by visible absorption spectroscopy). HO2 radicals were generated by the10
reaction of Cl atoms (from photolysis of Cl2) with CH3OH in the presence of O2,and IO radicals were generated by the reaction of O(3P) atoms (from photolysisof NO2) with I2.
(d) IO generated from O(3P)+CF3I (following discharge of O2). HO2 generated fromCl+CH3OH in the presence of O2. IO and HO2 concentrations were monitored by15
titration to I and OH by the respective reactions with NO. Experiments carried outat 1.7–2 Torr.
(e) IO generated from O(3P)+CF3I or O(3P)+I2 (following discharge of O2). HO2generated from Cl+CH3OH in the presence of O2. IO and HO2 concentrationswere monitored directly at their parent peaks. Experiments carried out at 1.3–20
2.3 mbar.
(f) IO from O(3P)+CF3I.
(g) IO from O(3P)+I2.
2562

ACPD6, 2281–2702, 2006
Evaluated kinetic andphotochemical data
for atmosphericchemistry
R. Atkinson et al.
Title Page
Abstract Introduction
Conclusions References
Tables Figures
J I
J I
Back Close
Full Screen / Esc
Printer-friendly Version
Interactive Discussion
EGU
Preferred Values
k = 8.4 × 10⁻¹¹ cm3 molecule−1 s−1 at 298 K.k = 1.4 × 10⁻¹¹ exp(540/T ) cm3 molecule−1 s−1 over the temperature range 270–380 K.
Reliability
∆ log k = ± 0.2 at 298 K.5
∆ (E/R) = ± 300 K.
Comments on Preferred Values
The preferred value at 298 K is the average of the reported room temperature data(Jenkin et al., 1991; Maguin et al., 1992; Cronkhite et al., 1999; Canosa-Mas et al.,1999; Knight and Crowley, 2001). The preferred Arrhenius expression is based on the10
E/R values from the temperature dependence studies of Cronkhite et al. (1999) andKnight and Crowley (2001), combined with a pre-exponential factor adjusted to give thepreferred value of k at 298 K.
The studies of Maguin et al. (1992) and Knight and Crowley (2001) provide strongevidence that the formation of HOI and O2 is the dominant pathway. On the basis of15
current thermochemical data for the IO radical, the channel forming HI+O3 is endother-mic by ∼40 kJ mol−1, and a limit of ≤10% has been reported for this channel (Knightand Crowley, 2001), based on no detectable formation of O3. As pointed out by Knightand Crowley (2001), a channel forming OH+OIO is exothermic by 12 kJ mol−1, but nofirm evidence for this channel has been reported.20
References
Canosa-Mas, C. E., Flugge, M. L., Shah, D., Vipond, A., and Wayne, R. P.: J. Atmos.Chem., 34, 153, 1999.
2563

ACPD6, 2281–2702, 2006
Evaluated kinetic andphotochemical data
for atmosphericchemistry
R. Atkinson et al.
Title Page
Abstract Introduction
Conclusions References
Tables Figures
J I
J I
Back Close
Full Screen / Esc
Printer-friendly Version
Interactive Discussion
EGU
Cronkhite, J. M., Stickel, R. E., Nicovich, J. M., and Wine, P. H.: J. Phys. Chem. A,103, 3228, 1999.Jenkin, M. E., Cox, R. A., and Hayman, G. D.: Chem. Phys. Lett., 177, 272, 1991.Knight, G. P. and Crowley, J. N.: Phys. Chem. Chem. Phys., 3, 393, 2001.Maguin, F., Laverdet, G., Le Bras, G., and Poulet, G.: J. Phys. Chem., 96, 1775, 1992.5
2564

ACPD6, 2281–2702, 2006
Evaluated kinetic andphotochemical data
for atmosphericchemistry
R. Atkinson et al.
Title Page
Abstract Introduction
Conclusions References
Tables Figures
J I
J I
Back Close
Full Screen / Esc
Printer-friendly Version
Interactive Discussion
EGU
III.A4.91
IO + O3 → I + 2O2 (1)→ OIO + O2 (2)
∆H◦ = −151 kJ·mol−1
Rate coefficient data (k=k1+k2)
k/cm3 molecule−1 s−1 Temp./K Reference Technique/Comments
Absolute Rate Coefficientsk1 < 1.2 × 10⁻¹⁵ 292 Larin et al., 1999 F-RF (a)k2 < 2.3 × 10⁻¹⁶ 3235
Comments
(a) I atoms were generated by photolysis of CF3I at 253.7 nm in a fast flow systemusing He as the carrier gas. Channel (1) was investigated by direct monitoring ofI atom concentrations by resonance fluorescence and channel (2) was studied bymonitoring the IO concentration by addition of NO and detection of the I atoms10
generated.
Preferred Values
k1 < 1 × 10⁻¹⁵ cm3 molecule−1 s−1 at 298 K.k2 < 2 × 10⁻¹⁶ cm3 molecule−1 s−1 at 298 K.
2565

ACPD6, 2281–2702, 2006
Evaluated kinetic andphotochemical data
for atmosphericchemistry
R. Atkinson et al.
Title Page
Abstract Introduction
Conclusions References
Tables Figures
J I
J I
Back Close
Full Screen / Esc
Printer-friendly Version
Interactive Discussion
EGU
Comments on Preferred Values
The only experimental study of the reaction (Larin et al., 1999) gives upper limits forthe rate coefficients for the two channels which are substantially higher than the cor-responding rate coefficients for the analogous reactions of FO, ClO, and BrO radicals.It is likely that the rate coefficients are substantially smaller but the measured upper5
limits are provisionally accepted.
References
Larin, K., Nevozhai, D. V., Spasskii, A. I., Trofimova, E. F. M., and Turkin, L. E.: Kinet.Katal., 40, 487, 1999, Eng. Trans. p. 435.
10
2566

ACPD6, 2281–2702, 2006
Evaluated kinetic andphotochemical data
for atmosphericchemistry
R. Atkinson et al.
Title Page
Abstract Introduction
Conclusions References
Tables Figures
J I
J I
Back Close
Full Screen / Esc
Printer-friendly Version
Interactive Discussion
EGU
III.A4.92
IO + ClO → ICl + O2 (1)→ Cl + I + O2 (2)→ Cl + OIO (3)→ I + OClO (4)
IO + ClO + M → IOOCl + M (5)
∆H◦(1) = −200 kJ·mol−1
∆H◦(2) = 10 kJ·mol−1
∆H◦(3) = −19 kJ·mol−15
∆H◦(4) = −15 kJ·mol−1
Rate coefficient data (k=k1+k2+k3+k4+k5)
k/cm3 molecule−1 s−1 Temp./K Reference Technique/Comments
Absolute Rate Coefficients(1.1 ± 0.2) × 10−11 298 Bedjanian et al., 1997 DF-MS (a)5.1 × 10⁻¹² exp[(280 ± 80)/T ] 200–362 Turnipseed et al., 1997 (b)(1.29 ± 0.27) × 10−11 298
Branching Ratiok1/k = 0.20 ± 0.02 298 Bedjanian et al., 1997 (c)k2/k = 0.25 ± 0.02 298k4/k = 0.55 ± 0.03 298(k1 + k3)/k = 0.14 ± 0.04 298 Turnipseed et al., 1997 (d)
2567

ACPD6, 2281–2702, 2006
Evaluated kinetic andphotochemical data
for atmosphericchemistry
R. Atkinson et al.
Title Page
Abstract Introduction
Conclusions References
Tables Figures
J I
J I
Back Close
Full Screen / Esc
Printer-friendly Version
Interactive Discussion
EGU
Comments
(a) The rate coefficient k was determined from the decay of IO radicals in the pres-ence of excess ClO under pseudo-first order conditions. The total pressure was1.3 mbar He. k was measured in four different reaction mixtures using CF3I andI2 as sources of IO radicals, and OClO and Cl2O as sources of ClO radicals.5
(b) Coupled DF-PLP system with LIF detection of IO radicals. IO radicals were pho-tolytically generated in excess ClO, which was measured by UV absorption. Thetemporal profile of IO allowed accurate determination of k. I atoms were a majorproduct, with a yield of 0.8±0.2 at 298 K. Total pressure was 6.6 mbar to 21 mbarof N2-He. The quoted errors include estimates of systematic errors.10
(c) Quantitative detection of reaction products OClO, Cl and ICl, using both absoluteand relative rate approaches to determine the branching ratios. The errors quotedare two least-squares standard deviations.
(d) Based on the ratio of the overall bimolecular rate coefficient determined from thefirst-order decay of IO in excess ClO (giving k1+k3) with 4×10¹⁵ molecule cm−3 of15
O3 present, to the total rate coefficient k determined in a similar manner with noexcess O3 present. At 223 K the yield of I atoms was 0.78±0.25, suggesting thatthe I atom yield does not vary significantly with temperature over the range 223 Kto 298 K.
Preferred Values20
k = 1.2 × 10⁻¹¹ cm3 molecule−1 s−1 at 298 K.k = 4.7 × 10⁻¹² exp(280/T ) cm3 molecule−1 s−1 over the temperature range 200–370 K.k1/k = 0.20 at 298 K.k2/k = 0.25 at 298 K.k4/k = 0.55 at 298 K.25
2568

ACPD6, 2281–2702, 2006
Evaluated kinetic andphotochemical data
for atmosphericchemistry
R. Atkinson et al.
Title Page
Abstract Introduction
Conclusions References
Tables Figures
J I
J I
Back Close
Full Screen / Esc
Printer-friendly Version
Interactive Discussion
EGU
Reliability
∆ log k = ± 0.1 at 298 K.∆ (E/R) = ± 100 K.∆ (k1/k) = 0.10 at 298 K.∆ (k2/k) = 0.10 at 298 K.5
∆ (k4/k) = 0.10 at 298 K.
Comments on Preferred Values
The two experimental studies of Bedjanian et al. (1997) and Turnipseed et al. (1997),which used different techniques, give overall rate coefficients k which are in excellentagreement at 298 K. The recommended value is a simple mean of the two results10
(Bedjanian et al., 1997; Turnipseed et al., 1997). The temperature dependence fromTurnipseed et al. (1997) is consistent with those observed for other exothermic XO+YOreactions and is accepted for the recommendation.
The quantitative information from the two studies (Bedjanian et al., 1997;Turnipseed et al., 1997) concerning the product channels is consistent within the cited15
uncertainties, with the discharge flow study of Bedjanian et al. (1997) giving more de-tailed data and being used for the recommendation. The overall rate coefficient isaccounted for by Reactions (1)+(2)+(4) and it is concluded that Reaction (3) is neg-ligible. Provisionally, the branching ratios at 298 K can be applied to stratospherictemperatures since the I atom yield exhibits no significant temperature dependence20
(Turnipseed et al., 1997).
References
Bedjanian, Y., Le Bras, G., and Poulet, G.: J. Phys. Chem. A, 101, 4088, 1997.Turnipseed, A. A., Gilles, M. K., Burkholder, J. B., and Ravishankara, A. R.: J. Phys.
2569

ACPD6, 2281–2702, 2006
Evaluated kinetic andphotochemical data
for atmosphericchemistry
R. Atkinson et al.
Title Page
Abstract Introduction
Conclusions References
Tables Figures
J I
J I
Back Close
Full Screen / Esc
Printer-friendly Version
Interactive Discussion
EGU
Chem. A, 101, 5517, 1997.
2570

ACPD6, 2281–2702, 2006
Evaluated kinetic andphotochemical data
for atmosphericchemistry
R. Atkinson et al.
Title Page
Abstract Introduction
Conclusions References
Tables Figures
J I
J I
Back Close
Full Screen / Esc
Printer-friendly Version
Interactive Discussion
EGU
III.A4.93
IO + BrO → IBr + O2 (1)→ Br + I + O2 (2)→ Br + OIO (3)→ I + OBrO (4)
IO + BrO + M → IOOBr + M (5)
∆H◦(1) = −195 kJ·mol−1
∆H◦(2) = −17 kJ·mol−1
∆H◦(3) = −47 kJ·mol−15
∆H◦(4) = 23 kJ·mol−1
2571

ACPD6, 2281–2702, 2006
Evaluated kinetic andphotochemical data
for atmosphericchemistry
R. Atkinson et al.
Title Page
Abstract Introduction
Conclusions References
Tables Figures
J I
J I
Back Close
Full Screen / Esc
Printer-friendly Version
Interactive Discussion
EGU
Rate coefficient data (k=k1+k2+k3+k4+k5)
k/cm3 molecule−1 s−1 Temp./K Reference Technique/Comments
Absolute Rate Coefficients(6.9 ± 2.7) × 10−11 298 Laszlo et al., 1997 PLP-AS (a)k1 + k3 = 2.5 × 10⁻¹¹ exp[(260 ± 100)/T ] 204–388 Gilles et al., 1997 PLP-LIF (b)k1 + k3 = 6.0 × 10⁻¹¹ 298(8.5 ± 1.5) × 10−11 298 Bedjanian et al., 1998 DF-MS (c)k1 + k3 = (7.5 ± 1.0) × 10−11 2986.7 × 10−12 exp[(760 ± 30)/T ] 210–333 Rowley et al., 2001 (d)(8.5 ± 1.4) × 10−11 295
Branching Ratios(k2 + k4)/k < 0.35 298 Gilles et al., 1997 (b)k1/k < 0.05 298 Bedjanian et al., 1998 (e)k2/k < 0.3 298k3/k = 0.65–1.0 298k4/k < 0.2 298(k2 + k4)/k < 0.3 298k1/k < 0.2 298 Rowley et al., 2001 (f)k4/k < 0.15 298
Comments
(a) IO and BrO radicals were monitored at 427.2 nm and 338.5 nm, respectively, using5
resolutions of 0.3 nm and 0.6 nm and cross-sections of 2.8×10⁻¹⁷ cm2 molecule−1
2572

ACPD6, 2281–2702, 2006
Evaluated kinetic andphotochemical data
for atmosphericchemistry
R. Atkinson et al.
Title Page
Abstract Introduction
Conclusions References
Tables Figures
J I
J I
Back Close
Full Screen / Esc
Printer-friendly Version
Interactive Discussion
EGU
and 1.4×10⁻¹⁷ cm2 molecule−1, respectively. The rate coefficient k was deter-mined by a computer fit to complex kinetic decay curves. The total pressure was260 mbar.
(b) IO radicals were detected by LIF. Pseudo-first order decays of IO radicals weremeasured in the presence of excess BrO and O3. The reported rate coefficient5
applies only to the non-I-atom producing channels. An upper limit of 0.35 is sug-gested for the fraction of the overall reaction yielding I atoms at 298 K. Total pres-sure was 8 mbar to 20 mbar.
(c) IO radical decays were monitored in the presence of excess BrO and O3 to ob-tain the rate coefficient for the total non-I-atom forming channels. The total rate10
coeficient was obtained from simulations of the BrO, IO and IBr profiles. The totalpressure was 1 mbar.
(d) Pulsed laser photolysis with absorption spectroscopic detection of BrO and IOradicals using a time-resolved charge coupled detector (CCD) in the A-X sys-tems at 300 nm to 350 nm and 400 nm to 470 nm, respectively. The IO radical15
cross-section at 427.2 nm was measured to be (1.9±0.17)×10−17 cm2 molecule−1
(1.13 nm resolution) and the BrO radical differential cross-sections were based onthose measured by Wahner et al. (1988), but increased in magnitude by 9% asrecommended by Gilles et al. (1997) and adjusted for a resolution of 1.13 nm. Therate coefficient k was determined by computer simulation of IO decays in excess20
BrO2. The total pressure was 100 mbar to 1000 mbar.
(e) Several experiments under varying conditions in the discharge flow system wereused to establish the branching ratios. The major channel produces Br+OIO witha branching ratio in the range given. Only upper limits were obtained for I atomand IBr formation.25
(f) Based on the upper limits to the formation of the products IBr and OBrO, as mea-sured by absorption spectroscopy. OIO was shown to be the major product.
2573

ACPD6, 2281–2702, 2006
Evaluated kinetic andphotochemical data
for atmosphericchemistry
R. Atkinson et al.
Title Page
Abstract Introduction
Conclusions References
Tables Figures
J I
J I
Back Close
Full Screen / Esc
Printer-friendly Version
Interactive Discussion
EGU
Preferred Values
k = 8.5 × 10⁻¹¹ cm3 molecule−1 s−1 at 298 K.k = 1.5 × 10⁻¹¹ exp(510/T ) cm3 molecule−1 s−1 over the temperature range 200–390 K.k3/k = 0.80 at 298 K.
Reliability5
∆ log k = ± 0.1 at 298 K.∆ (E/R) = ± 350 K.∆ (k3/k) = 0.15 at 298 K.
Comments on Preferred Values
The kinetic studies of this reaction by Laszlo et al. (1997), Gilles et al. (1997),10
Bedjanian et al. (1998) and Rowley et al. (2001) are in remarkedly good agree-ment considering the experimental difficulties. Both Gilles et al. (1997) andBedjanian et al. (1998) observed first-order kinetics for IO radical decays inexcess BrO to obtain the rate coefficient for non-I-atom producing channels,(k1+k3)=(6.8±0.8)×10−12 cm3 molecule−1 s−1. The overall rate coefficients mea-15
sured by Bedjanian et al. (1998) and Rowley et al. (2001) which were measuredunder complex kinetic conditions, are nevertheless in excellent agreement, giv-ing k=(8.5±1.2)×10−12 cm3 molecule−1 s−1. These measurements give a value of(k1+k3)/k=0.80±0.15 which lies in the middle of the range suggested by Bedjanianet al. (1998) for the branching ratio k3/k. Considering that the IBr measurements of20
Bedjanian et al. (1998) give k1/k<0.05, we recommend that k3/k=0.80 and that the to-tal rate coefficient is that determined by Bedjanian et al. (1998) and Rowley et al. (2001)at 298 K. The rate coefficient measurement of Laszlo et al. (1997) is less precise butagrees within the experimental error limits with the recommendation.
The two studies of the temperature dependence (Gilles et al., 1997; Rowley et25
2574

ACPD6, 2281–2702, 2006
Evaluated kinetic andphotochemical data
for atmosphericchemistry
R. Atkinson et al.
Title Page
Abstract Introduction
Conclusions References
Tables Figures
J I
J I
Back Close
Full Screen / Esc
Printer-friendly Version
Interactive Discussion
EGU
al., 2001) both show a negative activation energy for this radical + radical reaction.Although the temperature dependence of Gilles et al. (1997) is derived from measure-ments of k1+k3 over a wider temperature range, their result may not reflect the tem-perature dependence of the overall reaction if the branching ratio changes with tem-perature. The recommended temperature dependence is the simple mean of the two5
determinations of Gilles et al. (1997) and Rowley et al. (2001) with the pre-exponentialfactor, A, being adjusted to fit the preferred 298 K rate coefficient. The data do not allowa precise recommendation for the remaining branching between channels (1), (2) and(4). However, OBrO formation is not favorable on thermochemical grounds.
References10
Bedjanian, Y., Le Bras, G., and Poulet, G.: J. Phys. Chem. A, 102, 10501, 1998.Gilles, M. K., Turnipseed, A. A., Burkholder, J. B., Ravishankara, A. R., and Solomon,S.: J. Phys. Chem. A, 101, 5526, 1997.Laszlo, B., Huie, R. E., Kurylo, M. J., and Miziolek, A. W.: J. Geophys. Res., 102,1523, 1997.15
Rowley, D. M., Bloss, W. J., Cox, R. A., and Jones, R. L.: J. Phys. Chem. A, 105,7885, 2001.Wahner, A., Ravishankara, A. R., Sander, S. P., and Friedl, R. R.: Chem. Phys. Lett.,152, 507, 1988.
20
2575

ACPD6, 2281–2702, 2006
Evaluated kinetic andphotochemical data
for atmosphericchemistry
R. Atkinson et al.
Title Page
Abstract Introduction
Conclusions References
Tables Figures
J I
J I
Back Close
Full Screen / Esc
Printer-friendly Version
Interactive Discussion
EGU
III.A4.94
IO + IO → I2 + O2 (1)→ 2I + O2 (2)→ I + OIO (3)
IO + IO + M → I2O2 + M (4)
∆H◦(1) = −170 kJ·mol−1
∆H◦(2) = −18 kJ·mol−1
∆H◦(3) = −48 kJ·mol−15
2576
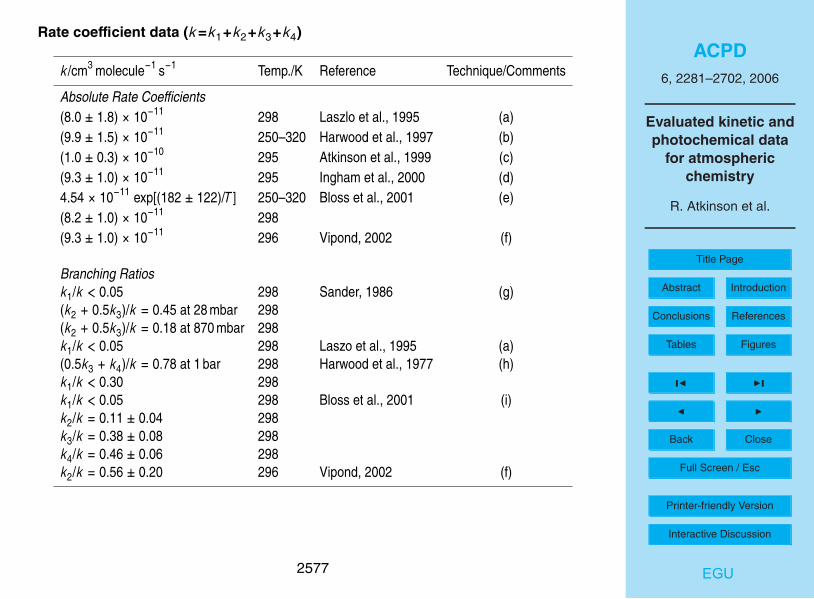
ACPD6, 2281–2702, 2006
Evaluated kinetic andphotochemical data
for atmosphericchemistry
R. Atkinson et al.
Title Page
Abstract Introduction
Conclusions References
Tables Figures
J I
J I
Back Close
Full Screen / Esc
Printer-friendly Version
Interactive Discussion
EGU
Rate coefficient data (k=k1+k2+k3+k4)
k/cm3 molecule−1 s−1 Temp./K Reference Technique/Comments
Absolute Rate Coefficients(8.0 ± 1.8) × 10−11 298 Laszlo et al., 1995 (a)(9.9 ± 1.5) × 10−11 250–320 Harwood et al., 1997 (b)(1.0 ± 0.3) × 10−10 295 Atkinson et al., 1999 (c)(9.3 ± 1.0) × 10−11 295 Ingham et al., 2000 (d)4.54 × 10⁻¹¹ exp[(182 ± 122)/T ] 250–320 Bloss et al., 2001 (e)(8.2 ± 1.0) × 10−11 298(9.3 ± 1.0) × 10−11 296 Vipond, 2002 (f)
Branching Ratiosk1/k < 0.05 298 Sander, 1986 (g)(k2 + 0.5k3)/k = 0.45 at 28 mbar 298(k2 + 0.5k3)/k = 0.18 at 870 mbar 298k1/k < 0.05 298 Laszo et al., 1995 (a)(0.5k3 + k4)/k = 0.78 at 1 bar 298 Harwood et al., 1977 (h)k1/k < 0.30 298k1/k < 0.05 298 Bloss et al., 2001 (i)k2/k = 0.11 ± 0.04 298k3/k = 0.38 ± 0.08 298k4/k = 0.46 ± 0.06 298k2/k = 0.56 ± 0.20 296 Vipond, 2002 (f)
2577

ACPD6, 2281–2702, 2006
Evaluated kinetic andphotochemical data
for atmosphericchemistry
R. Atkinson et al.
Title Page
Abstract Introduction
Conclusions References
Tables Figures
J I
J I
Back Close
Full Screen / Esc
Printer-friendly Version
Interactive Discussion
EGU
Comments
(a) Pulsed laser photolysis with detection of IO radicals by absorption spectroscopyusing the 4-0 band of the A-X system at 427.2 nm, for which a cross-section of(2.8±0.5)×10−17 cm2 molecule−1 was measured. The total pressure was 78 mbarto 789 mbar of N2. No prompt I2 formation from IO decay was observed.5
(b) Pulsed laser photolysis with detection of IO radicals by absorption spectroscopyusing the 4-0 band of the A-X system at 427.2 nm, for which a temperature-independent cross-section of (3.6±0.5)×10−17 cm2 molecule−1 was measured.The total pressure was 78 mbar to 789 mbar of N2. No statistically significant tem-perature dependence of either k or σ was observed over the temperature range10
studied.
(c) Pulsed laser photolysis with detection of IO radicals by cavity ring-down spec-troscopy using the 2-0 bandhead of the A-X system at 445.02 nm, for which anabsorption cross-section of (7.3±0.7)×10−17 cm2 molecule−1 was used. This wasdetermined relative to σ=(3.6±0.7)×10−17 cm2 molecule−1 measured by Harwood15
et al. (1997). The total pressure was 12.4 mbar to 40.2 mbar of Ar.
(d) Pulsed laser photolysis (248 nm) of O3-I2 mixtures, with detection of IO radi-cals by time-resolved absorption spectroscopy at 427.2 nm. A cross-section of(3.6±0.5)×10−17 cm2 molecule−1 was used to determine k. The total pressurewas 78 mbar N2. OIO product detected by absorption spectroscopy.20
(e) Pulsed laser photolysis with detection of IO radicals by absorption spec-troscopy using time-resolved charge-coupled detection (CCD) in the A-X sys-tem at 400 nm to 470 nm. The cross-section at 427.2 nm was measured tobe (1.9±0.17)×10−17 cm2 molecule−1 (1.13 nm resolution). The differential crosssection used to determine [IO] decreased by ∼45% on increasing the temperature25
from 220 K to 335 K. The total pressure was 130 mbar to 1000 mbar of N2.
2578

ACPD6, 2281–2702, 2006
Evaluated kinetic andphotochemical data
for atmosphericchemistry
R. Atkinson et al.
Title Page
Abstract Introduction
Conclusions References
Tables Figures
J I
J I
Back Close
Full Screen / Esc
Printer-friendly Version
Interactive Discussion
EGU
(f) Discharge flow system with RF detection of I atoms after titration of IO radicalswith NO. The total pressure was 2.5 mbar of He. Branching ratio k2/k from analy-sis of I atom measurements in the absence of NO.
(g) Flash photolysis system with detection by absorption spectroscopy. The pressuredependence of the branching ratio to produce I atoms was based on the pressure5
dependence of k in the presence of excess O3.
(h) Based on I2 formation at short reaction times, and on comparison of rate co-efficients measured in the presence and absence of O3, with k(presence ofO3)/k(absence of O3)=0.73 at 1 bar.
(i) Based on product absorptions due to I2, OIO and an unknown broad-band ab-10
sorption at λ≤400 nm assigned to I2O2. The value of σ(OIO) used was based onthe branching ratio for the reaction IO+BrO→Br+OIO determined by Bedjanianet al. (1998).
Preferred Values
k = 9.9 × 10⁻¹¹ cm3 molecule−1 s−1 at 298 K.15
k = 5.4 × 10⁻¹¹ exp(180/T ) cm3 molecule−1 s−1 over the temperature range 250–320 K.k1/k < 0.05 at 298 K.k3/k = 0.38 at 298 K and 1 bar.
Reliability
∆ log k = ± 0.1 at 298 K.20
∆ (E/R) = ± 200 K.∆ (k3/k) = ± 0.1 at 298 K and 1 bar.
2579

ACPD6, 2281–2702, 2006
Evaluated kinetic andphotochemical data
for atmosphericchemistry
R. Atkinson et al.
Title Page
Abstract Introduction
Conclusions References
Tables Figures
J I
J I
Back Close
Full Screen / Esc
Printer-friendly Version
Interactive Discussion
EGU
Comments on Preferred Values
The recently reported (Laszlo et al., 1995; Harwood et al., 1997; Atkinson et al.,1999; Ingham et al., 2000; Bloss et al., 2001; Vipond et al., 2002) values of k showgood agreement for the overall rate coefficient at room temperature, which is higherthan previously reported by Sander (1986), Jenkin and Cox (1985) and Barnes et5
al. (1991) (who used a discharge flow technique). When the different values of theabsorption cross-sections are taken into account, there is excellent agreement in thevalues of k/σ(427 nm) obtained by Laszlo et al. (1995), Harwood et al. (1997), Bloss etal. (2001) and Ingham et al. (2000). Using a value of σ(IO)=3.6×10⁻¹⁷ cm3 molecule−1
at 427 nm from the IUPAC evaluation (see data sheet on IO photolysis), and the mean10
value of k/σ(427 nm)=2.75×106 cm s−1 from these studies, gives the preferred valueat 298 K of k=9.9×10⁻¹¹ cm3 molecule−1 s−1. The results of Vipond et al. (2002) andAtkinson et al. (1999) are consistent with this value.
All studies agree that the overall rate coefficient in the absence of excess O3is independent of pressure over the range 1 mbar to 1000 mbar. The fraction of the15
IO+IO reaction leading to I atom production from studies at higher pressures (Har-wood et al., 1997; Atkinson et al., 1999; Sander, 1986) appears to be ∼20% to 30%,with (k2+0.5k3)/k ∼0.2–0.3 consistent with the quantum yield for I2-photosensitized de-composition of O3 (Jenkin et al., 1985). However, Jenkin and Cox (1985) and Sander(1986) observed a falloff in k with decreasing pressure in the presence of excess O3,20
i.e., when the I atom products are recycled to form IO, suggesting that the fractional Iatom yield increases as pressure decreases. This is consistent with the higher branch-ing ratio k2/k reported by Vipond et al. (2002). Bloss et al. (2001) observed OIOformation with a branching ratio of k3/k in the range 0.30 to 0.48, based on an OIO ab-sorption cross-section of σ(OIO)=1.07×10⁻¹⁷ cm2 molecule−1 at 524 nm deduced from25
the OIO yield in the IO+BrO reaction (Bedjanian et al., 1998; Rowley et al., 2001).All studies show that I2 formation is minor, with k1/k<0.05 (Sander, 1986; Laszlo
et al., 1995; Harwood et al., 1997; Bloss et al., 2001). Most authors have assumed
2580

ACPD6, 2281–2702, 2006
Evaluated kinetic andphotochemical data
for atmosphericchemistry
R. Atkinson et al.
Title Page
Abstract Introduction
Conclusions References
Tables Figures
J I
J I
Back Close
Full Screen / Esc
Printer-friendly Version
Interactive Discussion
EGU
that I2O2 is the other major product formed, although evidence for I2O2 formation is notunequivocal. Both Sander (1986) and Bloss et al. (2001) report products which absorbin the UV near 300 nm but no direct identification of the absorbing species has beenreported.
Temperature-dependent rate coefficients have been reported by Sander (1986),5
Harwood et al. (1997) and Bloss et al. (2001). The high value of E/R=−(1020±200) Kreported by Sander (1986) reflects the large temperature coefficient obtained for σ.When the much weaker changes in σ are used (see data sheet on IO photolysis), thetemperature dependence of k disappears. On balance the results of Bloss et al. (2001),which take into account the changes in the yield of IO radicals from the O+CF3I reaction10
used to calibrate the absorptions, are preferred. The temperature dependence of Blosset al. (2001) is used and the pre-exponential factor, A, is adjusted to fit the preferred298 K rate coefficient. The error reflects the possibility of a zero E/R.
References
Atkinson, D. B., Hudgens, J. W., and Orr-Ewing, A. J.: J. Phys. Chem. A, 103, 6173,15
1999.Barnes, I., Bastian, V., Becker, K. H., and Overath, R. D.: Int. J. Chem. Kinet., 23, 579,1991.Bedjanian, Y., Le Bras, G., and Poulet, G.: J. Phys. Chem. A, 102, 10 501, 1998.Bloss, W. J., Rowley, D. M., Cox, R. A., and Jones, R. L.: J. Phys. Chem. A, 105,20
7885, 2001.Harwood, M. H., Burkholder, J. B., Hunter, M., Fox, R. W., and Ravishankara, A. R.: J.Phys. Chem. A, 101, 853, 1997.Ingham, T., Cameron, M., and Crowley, J. N.: J. Phys. Chem. A, 104, 8001, 2000.Jenkin, M. E. and Cox, R. A.: J. Phys. Chem., 89, 192, 1985.25
Jenkin, M. E., Cox, R. A., and Candeland, D. E.: J. Atmos. Chem., 2, 359, 1985.Laszlo, B., Kurylo, M. J., and Huie, R. E.: J. Phys. Chem., 99, 11 701, 1995.
2581

ACPD6, 2281–2702, 2006
Evaluated kinetic andphotochemical data
for atmosphericchemistry
R. Atkinson et al.
Title Page
Abstract Introduction
Conclusions References
Tables Figures
J I
J I
Back Close
Full Screen / Esc
Printer-friendly Version
Interactive Discussion
EGU
Rowley, D. M., Bloss, W. J., Cox, R. A., and Jones, R. L.: J. Phys. Chem. A, 105,7885, 2001.Sander, S. P.: J. Phys. Chem., 90, 2194, 1986.Vipond, A., Canosa-Mas, C. E., Flugge, M. L., Gray, D. J., Shallcross, D. E., Shah, D.,and Wayne, R. P.: Phys. Chem. Chem. Phys., 4, 3648, 2002.5
2582
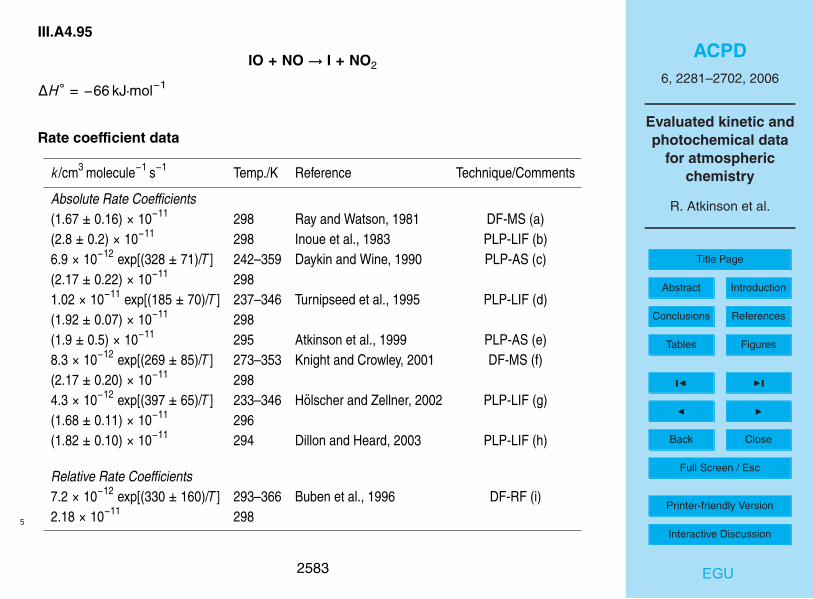
ACPD6, 2281–2702, 2006
Evaluated kinetic andphotochemical data
for atmosphericchemistry
R. Atkinson et al.
Title Page
Abstract Introduction
Conclusions References
Tables Figures
J I
J I
Back Close
Full Screen / Esc
Printer-friendly Version
Interactive Discussion
EGU
III.A4.95
IO + NO→ I + NO2
∆H◦ = −66 kJ·mol−1
Rate coefficient data
k/cm3 molecule−1 s−1 Temp./K Reference Technique/Comments
Absolute Rate Coefficients(1.67 ± 0.16) × 10−11 298 Ray and Watson, 1981 DF-MS (a)(2.8 ± 0.2) × 10−11 298 Inoue et al., 1983 PLP-LIF (b)6.9 × 10⁻¹² exp[(328 ± 71)/T ] 242–359 Daykin and Wine, 1990 PLP-AS (c)(2.17 ± 0.22) × 10−11 2981.02 × 10−11 exp[(185 ± 70)/T ] 237–346 Turnipseed et al., 1995 PLP-LIF (d)(1.92 ± 0.07) × 10−11 298(1.9 ± 0.5) × 10−11 295 Atkinson et al., 1999 PLP-AS (e)8.3 × 10⁻¹² exp[(269 ± 85)/T ] 273–353 Knight and Crowley, 2001 DF-MS (f)(2.17 ± 0.20) × 10−11 2984.3 × 10−12 exp[(397 ± 65)/T ] 233–346 Holscher and Zellner, 2002 PLP-LIF (g)(1.68 ± 0.11) × 10−11 296(1.82 ± 0.10) × 10−11 294 Dillon and Heard, 2003 PLP-LIF (h)
Relative Rate Coefficients7.2 × 10−12 exp[(330 ± 160)/T ] 293–366 Buben et al., 1996 DF-RF (i)2.18 × 10⁻¹¹ 2985
2583

ACPD6, 2281–2702, 2006
Evaluated kinetic andphotochemical data
for atmosphericchemistry
R. Atkinson et al.
Title Page
Abstract Introduction
Conclusions References
Tables Figures
J I
J I
Back Close
Full Screen / Esc
Printer-friendly Version
Interactive Discussion
EGU
Comments
(a) IO radicals were produced by the reaction I+O3 and monitored by MS in an excessof NO. Pressure varied between 1.33 and 2.8 mbar He.
(b) IO formed from laser photolysis of HI-N2O at 193 nm, or HI-O3 at 248 nm. Totalpressure was 1.33 mbar He.5
(c) Pulsed laser photolysis of NO2-I2 mixtures at 351 nm. IO radical concentrationswere monitored by longpath absorption spectroscopy in an excess of NO. k wasfound to be independent of pressure over the range 50 mbar to 260 mbar of N2.
(d) Pulsed laser photolysis of N2O-I2 mixtures at 193 nm. IO radical concentrationswere monitored by LIF in an excess of NO. k was found to be independent of10
pressure over the range 6.5 mbar to 130 mbar of N2.
(e) Pulsed laser photolysis of N2O-CF3I-NO-Ar mixtures at 193 nm. IO radicals weremonitored by cavity ring-down spectroscopy at 445.04 nm. k was found to beindependent of pressure over the range 12.5 mbar to 40 mbar of Ar.
(f) IO radicals made by O+I2 and detected by MS.15
(g) IO made by laser photolysis of N2O-CF3I at 193 nm. Pressure varied between 13and 130 mbar synthetic air.
(h) IO made by laser photolysis of N2O-CF3I at 193 nm. Pressure varied between 88and 173 mbar N2 or synthetic air.
(i) IO made in photolysis of CH3I-O2-O3 mixtures. Steady state I atom signals were20
monitored by resonance fluorescence and shown to depend on the relative con-centration of O3 and NO, and the relative rate coefficients for I+O3 and IO+NO,i.e. k/k(I+O3) was derived. The expression for k(T) was derived using the tem-perature dependent, recommended value for k(I+O3) (IUPAC, 2003).
2584

ACPD6, 2281–2702, 2006
Evaluated kinetic andphotochemical data
for atmosphericchemistry
R. Atkinson et al.
Title Page
Abstract Introduction
Conclusions References
Tables Figures
J I
J I
Back Close
Full Screen / Esc
Printer-friendly Version
Interactive Discussion
EGU
Preferred Values
k = 1.95 × 10⁻¹¹ cm3 molecule−1 s−1 at 298 K.k = 7.15 × 10⁻¹² exp(300/T ) cm3 molecule−1 s−1 over the temperature range 240–370 K.
Reliability5
∆ log k = ± 0.15 at 298 K.∆ (E/R) = ± 100 K.
Comments on Preferred Values
Most of the available rate coefficient data for this reaction (Ray and Watson, 1981;Inoue et al., 1983; Daykin and Wine, 1990; Turnipseed et al., 1995; Buben et al.,10
1996; Atkinson et al., 1999; Knight and Crowley, 2001; Holscher and Zellner, 2002;Dillon and Heard, 2003) are in good agreement, only the result of Inoue et al. (1983) isanomalously high. The preferred value of k=1.95×10⁻¹¹ cm3 molecule−1 s−1 at 298 Kis the mean of all other values.
The preferred expression for k(T) is obtained by taking the mean of the values of15
E/R of Daykin and Wine (1990), Turnipseed et al. (1995), Knight and Crowley (2001),Holscher and Zellner (2002) and Buben et al. (1996) and combining it with a pre-exponential factor adjusted to give the preferred value of k at 298 K.
References
Atkinson, D. B., Hudgens, J. W., and Orr-Ewing, A. J.: J. Phys. Chem. A, 103, 6173,20
1999.Buben, S. N., Larin, I. K., Messineva, N. A., and Trofimova, E. M.: Khim. Fiz., 15, 116,1996, available in English as: Chem. Phys. Reports, 15, 745, 1996.
2585

ACPD6, 2281–2702, 2006
Evaluated kinetic andphotochemical data
for atmosphericchemistry
R. Atkinson et al.
Title Page
Abstract Introduction
Conclusions References
Tables Figures
J I
J I
Back Close
Full Screen / Esc
Printer-friendly Version
Interactive Discussion
EGU
Daykin, E. P. and Wine, P. H.: J. Phys. Chem., 94, 4528, 1990.Dillon, T. J. and Heard, D. E.: J. Photochem. Photobiol. A. Chem., 157, 223, 2003.Holscher, D. and Zellner, R.: Phys. Chem. Chem. Phys., 4, 1839, 2002.Inoue, G., Suzuki, M., and Washida, N.: J. Chem. Phys., 79, 4730, 1983.IUPAC: http://www.iupac-kinetic.ch.cam.ac.uk/, 2003.5
Knight, G. P. and Crowley, J. N.: Phys. Chem. Chem. Phys., 3, 393, 2001.Ray, G. W. and Watson, R. T.: J. Phys. Chem., 85, 2955, 1981.Turnipseed, A. A., Gilles, M. K., Burkholder, J. B., and Ravishankara, A. R. : Chem.Phys. Lett., 242, 427, 1995.
10
2586

ACPD6, 2281–2702, 2006
Evaluated kinetic andphotochemical data
for atmosphericchemistry
R. Atkinson et al.
Title Page
Abstract Introduction
Conclusions References
Tables Figures
J I
J I
Back Close
Full Screen / Esc
Printer-friendly Version
Interactive Discussion
EGU
III.A4.96
IO + NO2 + M→ IONO2 + M
∆H◦ = −79 kJ·mol−1
Low-pressure rate coefficients
Rate coefficient data5
k0/cm3 molecule−1 s−1 Temp./K Reference Technique/Comments
Absolute Rate Coefficients(4.3 ± 2.0) × 10−31 [N2] 277 Jenkin and Cox, 1985 MM-A (a)7.7 × 10⁻³¹ (T /300)−5.0 [N2] 254–354 Daykin and Wine, 1990 PLP-A (b)(3.6 ± 1.0) × 10−31 [He] 298 Manguin et al., 1992 DF-MS (c)(7.9 ± 2.2) × 10−31 [N2] 298(1.80 ± 0.07) × 10−31 (T /300)−2.6[O2] 290–350 Larin et al., 1998 FR-F (d)4.1 × 10⁻³¹ (T /298)−6.3 [N2] 238–298 Holscher and Zellner, 2002 PLP-LIF (e)1.3 × 10⁻³⁰ (T /300)−4.5 [N2] 216–474 Allan and Plane, 2002 PLP-LIF (f)
Comments
(a) Photolysis of I2 in the presence of O3 producing IO radicals monitored by ab-sorption at 427 nm in the presence of an excess of NO2. The total pressure was10
varied over the range 47–537 mbar of N2. The falloff curve was analyzed usingFc=0.4 by analogy to the BrO+NO2+M reaction. A small correction was made fora second-order component to the IO radical kinetics at higher pressures.
2587

ACPD6, 2281–2702, 2006
Evaluated kinetic andphotochemical data
for atmosphericchemistry
R. Atkinson et al.
Title Page
Abstract Introduction
Conclusions References
Tables Figures
J I
J I
Back Close
Full Screen / Esc
Printer-friendly Version
Interactive Discussion
EGU
(b) IO radicals generated by pulsed laser photolysis of I2-NO2-N2 mixtures at 351 nm;IO radicals monitored by absorption at 427 nm. Pressure range 53–1000 mbar.The data were extrapolated to the low- and high-pressure rate coefficients usingFc=0.4.
(c) IO radicals and IONO2 detected by MS. IO radicals were generated by the re-5
action O+I2→IO+I. The pressure range was 1.6–2.8 mbar of He. Using a rel-ative third-body efficiency of N2 and He for the analogous BrO+NO2+M (ratiok0(N2)/k0(He)=2.2) from Sander et al. (1981), the value reported above was de-rived.
(d) I atoms generated by photolysis of a flow of CH3I at 254 nm; IO radicals formed10
by the reaction I+O3→IO+O2. Pressure range 1.3–8 mbar of O2. Assuminga ratio of βc(N2)/βc(O2)=1.4, the expression k0=2.50×10⁻³¹ (T /300)−2.6 [N2]cm3 molecule−1 s−1 over the temperature range 290 K to 350 K was derived.
(e) Laser flash photolysis of mixtures of O3, CF3I and NO2 in air with pulsed LIFdetection of IO. Pressure range 50–400 mbar. Evaluation of the falloff curve with15
Fc=0.6. Rate coefficients about 20% below those from Daykin and Wine (1990).
(f) Laser flash photolysis of NO2 in the presence of CF3I and N2 with LIF detectionof IO. Falloff extrapolation with Fc=0.57 obtained from RRKM theory. Rate coef-ficients about 20% above data from Daykin and Wine (1990). Preliminary resultsby Blitz et al. (2000) are cited which are close to the present results.20
Preferred Values
k = 7.7 × 10⁻³¹ (T /300)−5 [N2] cm3 molecule−1 s−1 over the temperature range 250–360 K.
2588

ACPD6, 2281–2702, 2006
Evaluated kinetic andphotochemical data
for atmosphericchemistry
R. Atkinson et al.
Title Page
Abstract Introduction
Conclusions References
Tables Figures
J I
J I
Back Close
Full Screen / Esc
Printer-friendly Version
Interactive Discussion
EGU
Reliability
∆ log k0 = ± 0.3 at 298 K.∆ n = ± 2.
Comments on Preferred Values
The preferred values for k0 are an average of the data of Daykin and Wine (1990),5
the value of Maguin et al. (1992) derived with the given ratio of efficiencies for N2 andHe, the data from Holscher and Zellner (2002), extrapolated with Fc=0.4 instead of 0.6,and the data from Allan and Plane (2002). The measurements of Larin et al. (1998)are a factor of 4 lower than the preferred values and need to be confirmed.
High-pressure rate coefficients10
Rate coefficient data
k∞/cm3 molecule−1 s−1 Temp./K Reference Technique/Comments
Absolute Rate Coefficients(1.6 ± 0.6) × 10−11 277 Jenkin and Cox, 1985 MM-A (a)1.55 × 10⁻¹¹ 254–354 Daykin and Wine, 1990 PLP-A (b)1.0 × 10⁻¹¹ 238–298 Holscher and Zellner, 2002 PLP-LIF (c)6.5 × 10⁻¹² (T /300)−1.3 216–474 Allan and Plane, 2002 PLP-LIF (d)
2589
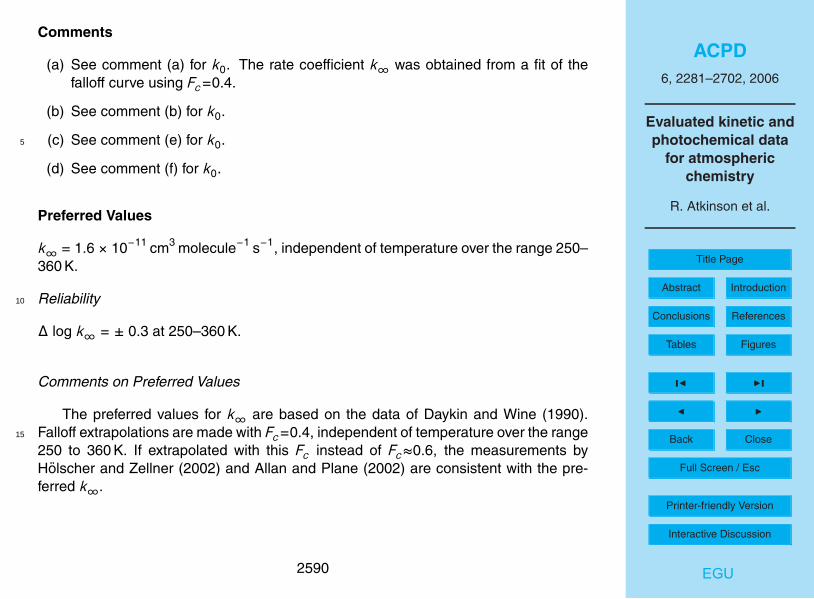
ACPD6, 2281–2702, 2006
Evaluated kinetic andphotochemical data
for atmosphericchemistry
R. Atkinson et al.
Title Page
Abstract Introduction
Conclusions References
Tables Figures
J I
J I
Back Close
Full Screen / Esc
Printer-friendly Version
Interactive Discussion
EGU
Comments
(a) See comment (a) for k0. The rate coefficient k∞ was obtained from a fit of thefalloff curve using Fc=0.4.
(b) See comment (b) for k0.
(c) See comment (e) for k0.5
(d) See comment (f) for k0.
Preferred Values
k∞ = 1.6 × 10⁻¹¹ cm3 molecule−1 s−1, independent of temperature over the range 250–360 K.
Reliability10
∆ log k∞ = ± 0.3 at 250–360 K.
Comments on Preferred Values
The preferred values for k∞ are based on the data of Daykin and Wine (1990).Falloff extrapolations are made with Fc=0.4, independent of temperature over the range15
250 to 360 K. If extrapolated with this Fc instead of Fc≈0.6, the measurements byHolscher and Zellner (2002) and Allan and Plane (2002) are consistent with the pre-ferred k∞.
2590

ACPD6, 2281–2702, 2006
Evaluated kinetic andphotochemical data
for atmosphericchemistry
R. Atkinson et al.
Title Page
Abstract Introduction
Conclusions References
Tables Figures
J I
J I
Back Close
Full Screen / Esc
Printer-friendly Version
Interactive Discussion
EGU
References
Allan, B. J. and Plane, J. M. C.: J. Phys. Chem. A, 106, 8634, 2002.Blitz, M. A., Dillon, T. J., and Heard, D. E.: 16th Int. Symp. on Gas Kinetics, Cambridge,UK, 2000.Daykin, E. P. and Wine, P. H.: J. Phys. Chem., 94, 4528, 1990.5
Holscher, D. and Zellner, R.: Phys. Chem. Chem. Phys., 4, 1839, 2002.Jenkin, M. E. and Cox, R. A.: J. Phys. Chem., 89, 192, 1985.Larin, I. K., Nevozhai, D. V., Sapasskii, A. I., and Trofimova, E. M.: Kinet. Catal., 39,666, 1998.Maguin, F., Laverdet, G., Le Bras, G., and Poulet, G.: J. Phys. Chem., 96, 1775, 1992.10
Sander, S. P., Ray, G. W., and Watson, R. T.: J. Phys. Chem., 85, 199, 1981.
2591

ACPD6, 2281–2702, 2006
Evaluated kinetic andphotochemical data
for atmosphericchemistry
R. Atkinson et al.
Title Page
Abstract Introduction
Conclusions References
Tables Figures
J I
J I
Back Close
Full Screen / Esc
Printer-friendly Version
Interactive Discussion
EGU
III.A4.97
IONO2 + M→ IO + NO2 + M
∆H◦ = 79 kJ·mol−1
Falloff range
No direct measurements are available.5
Preferred Values
k (1 bar of air) = 1.1 × 10¹⁵ exp (-12060/T ) s−1 over the temperature range 240–305 K.
Reliability
∆ log k = ± 1 at 300 K.10
∆ (E/R) = ± 500 K.
Comments on Preferred Values
The expression was obtained by Allan and Plane (2002) by inverting an RRKM fitof rate coefficient measurements of the reverse reaction. Measuements of IO profilesat 473 K and 300 Torr indicated the presence of IONO2 dissociation which is consistent15
with the proposed rate expression.
References
Allan, B. J. and Plane, J. M. C.: J. Phys. Chem. A, 106, 8634, 2002.
2592

ACPD6, 2281–2702, 2006
Evaluated kinetic andphotochemical data
for atmosphericchemistry
R. Atkinson et al.
Title Page
Abstract Introduction
Conclusions References
Tables Figures
J I
J I
Back Close
Full Screen / Esc
Printer-friendly Version
Interactive Discussion
EGU
III.A4.98
INO + INO→ I2 + 2NO
∆H◦ = 0.3 kJ·mol−1
Rate coefficient data
k/cm3 molecule−1 s−1 Temp./K Reference Technique/Comments
Absolute Rate Coefficients8.4 × 10−11 exp(−2620/T ) 320–450 van den Bergh and Troe, 1976 PLP-UVA1.3 × 10−14 298∗
2.9 × 10−12 exp(−1320/T ) 298–328 Basco and Hunt, 1978 FP-UVA3.4 × 10−14 2985
Preferred Values
k = 1.3 × 10⁻¹⁴ cm3 molecule−1 s−1 at 298 K.k = 8.4 × 10⁻¹¹ exp(−2620/T ) cm3 molecule−1 s−1 over the temperature range 300–450 K.
Reliability10
∆ log k = ± 0.4 at 298 K.∆ (E/R) = ± 600 K.
2593

ACPD6, 2281–2702, 2006
Evaluated kinetic andphotochemical data
for atmosphericchemistry
R. Atkinson et al.
Title Page
Abstract Introduction
Conclusions References
Tables Figures
J I
J I
Back Close
Full Screen / Esc
Printer-friendly Version
Interactive Discussion
EGU
Comments on Preferred Values
The results from the study of van den Bergh and Troe (1976) are preferred overthose from Basco and Hunt (1978) because of a much wider range of conditions stud-ied.
References5
Basco, N. and Hunt, J. E.: Int. J. Chem. Kinet., 10, 733, 1978.van den Bergh, H. and Troe, J.: J. Chem. Phys., 64, 736, 1976.
2594
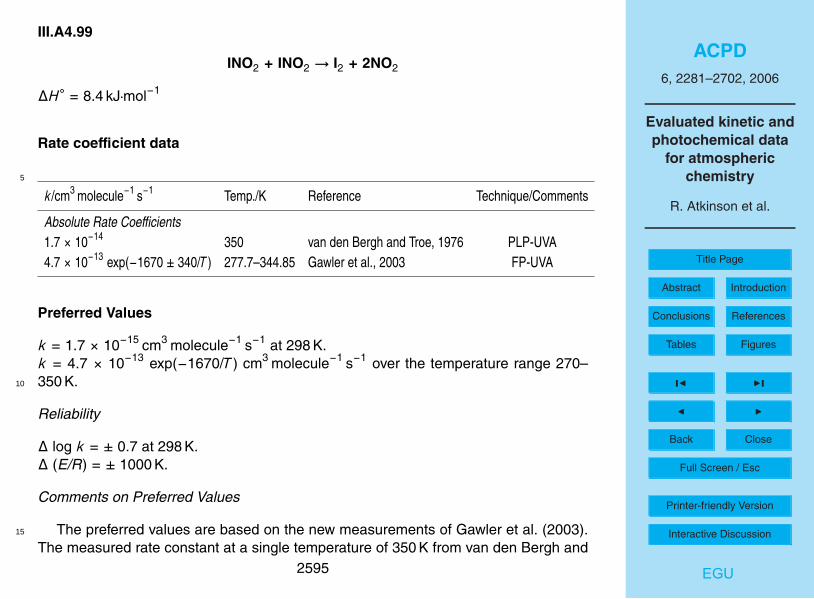
ACPD6, 2281–2702, 2006
Evaluated kinetic andphotochemical data
for atmosphericchemistry
R. Atkinson et al.
Title Page
Abstract Introduction
Conclusions References
Tables Figures
J I
J I
Back Close
Full Screen / Esc
Printer-friendly Version
Interactive Discussion
EGU
III.A4.99
INO2 + INO2 → I2 + 2NO2
∆H◦ = 8.4 kJ·mol−1
Rate coefficient data
5
k/cm3 molecule−1 s−1 Temp./K Reference Technique/Comments
Absolute Rate Coefficients1.7 × 10−14 350 van den Bergh and Troe, 1976 PLP-UVA4.7 × 10−13 exp(−1670 ± 340/T ) 277.7–344.85 Gawler et al., 2003 FP-UVA
Preferred Values
k = 1.7 × 10⁻¹⁵ cm3 molecule−1 s−1 at 298 K.k = 4.7 × 10⁻¹³ exp(−1670/T ) cm3 molecule−1 s−1 over the temperature range 270–350 K.10
Reliability
∆ log k = ± 0.7 at 298 K.∆ (E/R) = ± 1000 K.
Comments on Preferred Values
The preferred values are based on the new measurements of Gawler et al. (2003).15
The measured rate constant at a single temperature of 350 K from van den Bergh and2595

ACPD6, 2281–2702, 2006
Evaluated kinetic andphotochemical data
for atmosphericchemistry
R. Atkinson et al.
Title Page
Abstract Introduction
Conclusions References
Tables Figures
J I
J I
Back Close
Full Screen / Esc
Printer-friendly Version
Interactive Discussion
EGU
Troe (1976) is higher by a factor of 4, but uncertainties in both studies are large.
References
Gawler, K. S., Boakes, G., and Rowley, D. M.: Phys. Chem. Chem. Phys., 3632, 2003.van den Bergh, H. and Troe, J.: Chem. Phys., 64, 736, 1976.
5
2596

ACPD6, 2281–2702, 2006
Evaluated kinetic andphotochemical data
for atmosphericchemistry
R. Atkinson et al.
Title Page
Abstract Introduction
Conclusions References
Tables Figures
J I
J I
Back Close
Full Screen / Esc
Printer-friendly Version
Interactive Discussion
EGU
III.A4.100
OIO + NO→ IO + NO2
∆H◦ = −17.9 kJ·mol−1
Rate coefficient data
k/cm3 molecule−1 s−1 Temp./K Reference Technique/Comments
Absolute Rate Coefficients7.6 × 10−13exp[(607 ± 128)/T ] 235-320 Plane et al., 2006 PLP-CRDS (a)(6.0 ± 1.1) × 10−12 2985
Comments
(a) OIO formed in self-reaction of IO, was produced by 193 nm photolysis of N2O inthe presence of CF3I. The rate coefficient k was determined from the decay ofOIO in the presence of excess NO. [OIO] measured by time resolved cavity ring-down spectroscopy (CRDS) at 567.808 nm. k was independent of pressure in the10
range 27–96 mbar at 300 K.
Preferred Values
k = 6.7 × 10⁻¹² cm3 molecule−1 s−1 at 298 K.k = 1.1 × 10⁻¹² exp(542/T ) cm3 molecule−1 s−1 over the temperature range 240–320 K.
2597

ACPD6, 2281–2702, 2006
Evaluated kinetic andphotochemical data
for atmosphericchemistry
R. Atkinson et al.
Title Page
Abstract Introduction
Conclusions References
Tables Figures
J I
J I
Back Close
Full Screen / Esc
Printer-friendly Version
Interactive Discussion
EGU
Reliability
∆ log k = ± 0.3 at 298 K.∆ (E/R) = ± 250 K.
Comments on Preferred Values
The single experimental study provides well defined rate constants over the given5
pressure and temperature range, despite the complex source chemistry for the OIOradical. The observed rate constants and their temperature and pressure dependencewere well reproduced by quantum chemical and RRKM calcualtions using a poten-tial surface with a weakly bound OIONO intermediate which dissociates into IO+NO2products. Even at 1 bar pressure significant formation of OIONO is not predicted to10
occur. The authors recommend the expression: (1.1±0.4)×10−12exp[(542±130)/T ] fork (cm3 molecule−1 s−1) at 1 bar, taking account of experimental uncertainties and thetheoretical analysis, which is adopted for the preferred value for formation of IO+NO2all pressures.
References15
Plane, J. M. C., Joseph, D. M., Allan, B. J., Ashworth, S. H., and Francosco, J. S.: J.Phys. Chem. 110, 93, 2006.
2598

ACPD6, 2281–2702, 2006
Evaluated kinetic andphotochemical data
for atmosphericchemistry
R. Atkinson et al.
Title Page
Abstract Introduction
Conclusions References
Tables Figures
J I
J I
Back Close
Full Screen / Esc
Printer-friendly Version
Interactive Discussion
EGU
Appendix 5: Photochemical Reactions
III.A5.101
HCl + hν→ products
Primary photochemical processes
Reaction ∆H◦/kJ·mol−1 λthreshold/nm
HCl + hν→ H + Cl 432 2775
Preferred Values
Absorption cross-sections for HCl at 298 K
λ/nm 1020σ/cm2 λ/nm 1020σ/cm2
140 211 180 58.8145 281 185 31.3150 345 190 14.5155 382 195 6.18160 332 200 2.56165 248 205 0.983170 163 210 0.395175 109 215 0.137
220 0.048
2599

ACPD6, 2281–2702, 2006
Evaluated kinetic andphotochemical data
for atmosphericchemistry
R. Atkinson et al.
Title Page
Abstract Introduction
Conclusions References
Tables Figures
J I
J I
Back Close
Full Screen / Esc
Printer-friendly Version
Interactive Discussion
EGU
Comments on Preferred Values
The preferred values of the absorption cross-sections at 298 K are those reportedby Inn (1975). Photolysis is expected to occur with unit quantum efficiency.
References
Inn, E. C. Y.: J. Atmos. Sci., 32, 2375, 1975.5
2600

ACPD6, 2281–2702, 2006
Evaluated kinetic andphotochemical data
for atmosphericchemistry
R. Atkinson et al.
Title Page
Abstract Introduction
Conclusions References
Tables Figures
J I
J I
Back Close
Full Screen / Esc
Printer-friendly Version
Interactive Discussion
EGU
III.A5.102
HOCl + hν→ products
Primary photochemical processes
Reaction ∆H◦/kJ·mol−1 λthreshold/nm
HOCl + hν → HO + Cl (1) 239 500→ HCl + O(3P) (2) 432 277
2601

ACPD6, 2281–2702, 2006
Evaluated kinetic andphotochemical data
for atmosphericchemistry
R. Atkinson et al.
Title Page
Abstract Introduction
Conclusions References
Tables Figures
J I
J I
Back Close
Full Screen / Esc
Printer-friendly Version
Interactive Discussion
EGU
Preferred Values
Absorption cross-sections for HOCl at 298 K
λ/nm 1020σ/cm2 λ/nm 1020σ/cm2 λ/nm 1020σ/cm2
200 7.18 242 20.3 284 4.68202 6.39 244 19.8 286 4.79204 5.81 246 19.0 288 4.95206 5.46 248 18.1 290 5.13208 5.37 250 17.0 292 5.33210 5.54 252 15.8 294 5.52212 5.98 254 14.6 296 5.71214 6.68 256 13.3 298 5.86216 7.63 256 12.1 300 5.99218 8.81 260 10.9 302 6.08220 10.2 262 9.73 304 6.12222 11.6 264 8.68 306 6.12224 13.2 266 7.75 308 6.07226 14.7 268 6.94 310 5.97
2602

ACPD6, 2281–2702, 2006
Evaluated kinetic andphotochemical data
for atmosphericchemistry
R. Atkinson et al.
Title Page
Abstract Introduction
Conclusions References
Tables Figures
J I
J I
Back Close
Full Screen / Esc
Printer-friendly Version
Interactive Discussion
EGU
λ/nm 1020σ/cm2 λ/nm 1020σ/cm2 λ/nm 1020σ/cm2
228 16.2 270 6.25 312 5.84230 17.5 272 5.69 314 5.66232 18.7 274 5.29 316 5.45234 19.6 276 4.94 318 5.21236 20.2 278 4.74 320 4.95238 20.5 280 4.64 322 4.67240 20.6 282 4.62 324 4.38326 4.09 358 1.11 390 0.491328 3.79 360 1.06 392 0.447330 3.50 362 1.02 394 0.405332 3.21 364 0.985 396 0.364334 2.94 366 0.951 398 0.325336 2.68 368 0.919 400 0.288338 2.44 370 0.888 402 0.254340 2.22 372 0.855 404 0.222342 2.03 374 0.822 406 0.194344 1.84 376 0.786 408 0.168346 1.69 378 0.748 410 0.144348 1.55 380 0.708 412 0.124350 1.43 382 0.667 414 0.105352 1.33 384 0.624 416 0.089354 1.24 386 0.580 418 0.075356 1.17 388 0.535 420 0.063
2603

ACPD6, 2281–2702, 2006
Evaluated kinetic andphotochemical data
for atmosphericchemistry
R. Atkinson et al.
Title Page
Abstract Introduction
Conclusions References
Tables Figures
J I
J I
Back Close
Full Screen / Esc
Printer-friendly Version
Interactive Discussion
EGU
Quantum yield for HOCl photolysis at 298 K
Φ1 = 1.0 for λ > 200 nm
Comments on Preferred Values
The preferred values of the absorption cross-sections at 298 K are the values cal-culated with the recent expression given by Barnes et al. (1998) based on their data5
from the laser induced fluorescence of HO and on the data of Burkholder (1993). Inthe Barnes (1998) study a weak absorption centered at 380 nm that extends downto 480 nm was observed. The recommended values agree very well with the valuesreported by Jungkamp et al. (1988) measured in a long-path UV absorption flow cellbetween 230 and 392 nm. Earlier results are discussed in IUPAC, 1989 and IUPAC,10
1992 evaluations. Discrepancies between studies arise in correcting for spectral in-terference from Cl2O and Cl2. The preferred quantum yield values are based on theresults of Molina et al. (1980), Butler and Phillips (1983), Schindler et al. (1987) andVogt and Schindler (1992). An upper limit of Φ2<0.02 was determined by Butler andPhillips (1983) at 308 nm. Relative yields of HO (2Π3/2)/HO(2Π1/2) were found to be15
2.0 at 266 nm and 1.5 at 355 nm (Fujiwara and Ishiwata, 1998).
References
Barnes, R. J., Sinha, A., and Michelsen, H. A.: J. Phys. Chem. A, 102, 8855, 1998.Burkholder, J. B.: J. Geophys. Res., 98, 2963, 1993.Butler, P. J. D. and Phillips, L. F.: J. Phys. Chem., 87, 183, 1983.20
Fujiwara, H. and Ishiwata, T.: J. Phys. Chem. A, 102, 3856, 1998.IUPAC: Supplement III, 1989 (see references in Introduction).IUPAC: Supplement IV, 1992 (see references in Introduction).Molina, M. J., Ishiwata, T., and Molina, L. T.: J. Phys. Chem., 84, 821, 1980.
2604

ACPD6, 2281–2702, 2006
Evaluated kinetic andphotochemical data
for atmosphericchemistry
R. Atkinson et al.
Title Page
Abstract Introduction
Conclusions References
Tables Figures
J I
J I
Back Close
Full Screen / Esc
Printer-friendly Version
Interactive Discussion
EGU
Permien, T., Vogt, R., and Schindler, R. N.: In Mechanisms of Gas Phase and LiquidPhase Chemical Transformations, in: Tropospheric Chemistry, edited by: Cox, R. A.,Air Pollution Research Report No. 17, Environmental Research Program of the CEC,EUR 12035 EN, Brussels, Belgium, 1988.Schindler, R. N., Liesner, M., Schmidt, S., Kirchner, U., and Benter, T.: J. Photochem.5
Photobiol. A. Chem., 107, 9, 1987.Vogt, R. and Schindler, R. N.: J. Photochem. Photobiol. A. Chem., 66, 133, 1992.
2605

ACPD6, 2281–2702, 2006
Evaluated kinetic andphotochemical data
for atmosphericchemistry
R. Atkinson et al.
Title Page
Abstract Introduction
Conclusions References
Tables Figures
J I
J I
Back Close
Full Screen / Esc
Printer-friendly Version
Interactive Discussion
EGU
III.A5.103
OClO + hν→ products
Primary photochemical processes
Reaction ∆H◦/kJ·mol−1 λthreshold/nm
OClO + hν → ClO + O(3P) (1) 255 470→ Cl + O2 (2) 26 4540
2606

ACPD6, 2281–2702, 2006
Evaluated kinetic andphotochemical data
for atmosphericchemistry
R. Atkinson et al.
Title Page
Abstract Introduction
Conclusions References
Tables Figures
J I
J I
Back Close
Full Screen / Esc
Printer-friendly Version
Interactive Discussion
EGU
Preferred Values
Absorption cross-sections of OClO at the band peaks at 204 K, 296 K and 378 K
λ/nm 1020σ/cm2 1020σ/cm2 1020σ/cm2
204 K 296 K 378 K
475.53 13461.15 17 17 16446.41 94 69 57432.81 220 166 134420.58 393 304 250408.83 578 479 378397.76 821 670 547387.37 1046 844 698377.44 1212 992 808368.30 1365 1136 920359.73 1454 1219 984351.30 1531 1275 989
2607
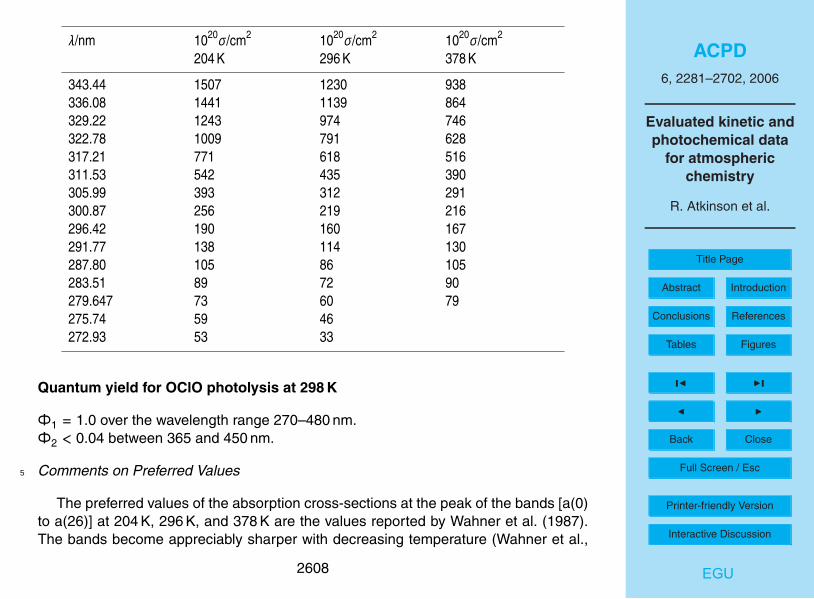
ACPD6, 2281–2702, 2006
Evaluated kinetic andphotochemical data
for atmosphericchemistry
R. Atkinson et al.
Title Page
Abstract Introduction
Conclusions References
Tables Figures
J I
J I
Back Close
Full Screen / Esc
Printer-friendly Version
Interactive Discussion
EGU
λ/nm 1020σ/cm2 1020σ/cm2 1020σ/cm2
204 K 296 K 378 K
343.44 1507 1230 938336.08 1441 1139 864329.22 1243 974 746322.78 1009 791 628317.21 771 618 516311.53 542 435 390305.99 393 312 291300.87 256 219 216296.42 190 160 167291.77 138 114 130287.80 105 86 105283.51 89 72 90279.647 73 60 79275.74 59 46272.93 53 33
Quantum yield for OClO photolysis at 298 K
Φ1 = 1.0 over the wavelength range 270–480 nm.Φ2 < 0.04 between 365 and 450 nm.
Comments on Preferred Values5
The preferred values of the absorption cross-sections at the peak of the bands [a(0)to a(26)] at 204 K, 296 K, and 378 K are the values reported by Wahner et al. (1987).The bands become appreciably sharper with decreasing temperature (Wahner et al.,
2608

ACPD6, 2281–2702, 2006
Evaluated kinetic andphotochemical data
for atmosphericchemistry
R. Atkinson et al.
Title Page
Abstract Introduction
Conclusions References
Tables Figures
J I
J I
Back Close
Full Screen / Esc
Printer-friendly Version
Interactive Discussion
EGU
1987). However, the integrated band intensities remain constant for all bands between204 K and 296 K, and, therefore, the solar photolysis rate is not expected to have asignificant temperature dependence. Photoabsorption measurements of OClO overthe wavelength range of 125 to 470 nm at 298 K have been carried out by Hubingerand Nee (1994). Absorption cross-sections as a function of vibrational excitation are5
reported. The recommended quantum yield of unity for O-atom production is basedon results reported by Colussi (1990), and results of earlier studies discussed by Wat-son (1977). Vaida and coworkers (1989, 1990) reported the detection of Cl atomsby resonance-enhanced multiphoton ionization (REMPI) in the photoisomerization ofOClO to ClOO followed by dissociation to Cl+O2. Bishenden et al. (1991), using REMPI10
detection of Cl atoms, report that the quantum yield for Cl atom formation near 360 nmis 0.15±0.10. In contrast, Lawrence et al. (1990) using a technique involving chargetransfer excitation of Cl-Xe collision pairs as a sensitive probe of Cl atoms, determinedthat the quantum yield for Cl atom production in the 359–368 nm region is <5×10⁻⁴. Ina molecular beam-photofragment study over the wavelength range 350–475 nm, Davis15
and Lee (1992) observed the dominant products to be ClO+O and also observed Clatom yields reaching a maximum of 3.9% near 404 nm, decreasing to <0.2% in thewavelength range 350–370 nm, in qualitative agreement with the results of Lawrenceet al. (1990). More recent experiments of Davis and Lee (1996) show that the quan-tum yield for Cl+O2 production is 3.9±0.8% at 404 decreases at longer and shorter20
wavelengths and the branching ratio between the channels (1) and (2) depends onthe OClO excited state vibrational mode. Delmdahl et al. (1998) observed nascent Clatom formation between 360 and 450 nm. A quantum yield less than 3.6% was deter-mined between 365 and 450 nm. Below 365 nm Cl atom formation resulting from thephotolysis of vibrationally excited ClO (ν≥4) radicals was observed.25
2609

ACPD6, 2281–2702, 2006
Evaluated kinetic andphotochemical data
for atmosphericchemistry
R. Atkinson et al.
Title Page
Abstract Introduction
Conclusions References
Tables Figures
J I
J I
Back Close
Full Screen / Esc
Printer-friendly Version
Interactive Discussion
EGU
References
Bishenden, E., Haddock, J., and Donaldson, D. J.: J. Phys. Chem., 95, 2113, 1991.Colussi, A. J.: J. Phys. Chem., 94, 8922, 1990.Davis, H. F. and Lee, Y. T.: J. Phys. Chem., 96, 5681, 1992.Davis, H. F. and Lee, Y. T.: J. Chem. Phys., 105, 8142, 1996.5
Delmdahl, R. F., Ullrich, S., and Gericke, K.-H.: J. Phys. Chem. A, 102, 7680, 1998.Hubinger, S. and Nee, J. B.: Chem. Phys., 181, 247, 1994.Lawrence, W. G., Clemitshaw, K. C., and Apkarian, V. A.: J. Geophys. Res., 95,18591, 1990.Ruehl, E., Jefferson, A., and Vaida, V.: J. Phys. Chem., 94, 2990, 1990.10
Vaida, V., Solomon, S., Richard, E. C., Ruhl, E., and Jefferson, A.: Nature, 342, 405,1989.Wahner, A., Tyndall, G. S., and Ravishankara, A. R.: J. Phys. Chem., 91, 2734, 1987.Watson, R. T.: J. Phys. Chem. Ref. Data, 6, 871, 1977.
15
2610

ACPD6, 2281–2702, 2006
Evaluated kinetic andphotochemical data
for atmosphericchemistry
R. Atkinson et al.
Title Page
Abstract Introduction
Conclusions References
Tables Figures
J I
J I
Back Close
Full Screen / Esc
Printer-friendly Version
Interactive Discussion
EGU
III.A5.104
Cl2O + hν→ products
Primary photochemical processes
Reaction ∆H◦/kJ·mol−1 λthreshold/nm
Cl2O + hν → Cl + ClO (1) 142 840→ O + Cl2 (2) 168 710→ O + 2Cl (3) 410 292
2611

ACPD6, 2281–2702, 2006
Evaluated kinetic andphotochemical data
for atmosphericchemistry
R. Atkinson et al.
Title Page
Abstract Introduction
Conclusions References
Tables Figures
J I
J I
Back Close
Full Screen / Esc
Printer-friendly Version
Interactive Discussion
EGU
Preferred Values
Absorption cross-sections of Cl2O at 298 K.
λ/nm 1020σ/cm2 λ/nm 1020σ/cm2
200 71.0 330 8.40210 23.8 340 3.58220 8.6 350 1.54230 28.1 360 0.73240 103 370 0.40250 191 380 0.36260 195 390 0.51270 151 400 0.79280 126 420 1.26290 103 440 1.11300 71.0 460 0.63310 40.3 480 0.32320 19.5 500 0.22
Comments on Preferred Values
The preferred values of the absorption cross-sections at 298 K are the values re-5
ported by Knauth et al. (1979). The preferred values are in excellent agreement withthe values reported by Molina and Molina (1978), except for the 330–400 nm rangewhere the values in Molina and Molina (1978) are higher, and they are in reasonableagreement with the values reported by Johnsson et al. (1995) (σ=186×10−20 cm2 at260 nm) and by Lin (1976) (σ=183×10−20 cm2 at 260 nm). Values for the 150–200 nm10
wavelength region have been reported by Nee (1991).Photolysis proceeds predominantly by breaking of the Cl-O bond to yield Cl+ClO.
2612

ACPD6, 2281–2702, 2006
Evaluated kinetic andphotochemical data
for atmosphericchemistry
R. Atkinson et al.
Title Page
Abstract Introduction
Conclusions References
Tables Figures
J I
J I
Back Close
Full Screen / Esc
Printer-friendly Version
Interactive Discussion
EGU
However, Sander and Friedl (1989) determined the quantum yield for formation of oxy-gen atoms from Cl2O photolysis to be 0.25±0.05, the main products being Cl+ClO.In these experiments a broad-band photolysis source with a spectral distribution ex-tending from the visible down to 180 nm was used, so that it was not possible to de-termine the wavelength dependence of the quantum yield. More recently, Nelson et5
al. (1994) have used photofragment translational energy spectroscopy in a molecularbeam to study the photodecomposition of Cl2O at 308, 248 and 193 nm. In all casesReaction (1) occurs. At 308 nm the only channel is Cl+ClO; this is the major channelat 248 nm and a minor channel at 193 nm. At 248 nm the ClO fragment dissociatesspontaneously. At 193 nm a concerted dissociation pathway leads to the formation of10
O+Cl2. Almost all of the primary Cl2O photoproducts dissociate. More recently, Nick-olaisen et al. (1996) studied the pressure dependence of Cl2O photodissociation. Theobserved pressure dependence of ClO formation was explained assuming that, afterCl2O excitation at λ>300 nm, a rapid intersystem crossing between two metastablestates operates. These states were assumed to undergo competitive dissociation to15
Cl+ClO and collisional relaxation to the ground state. However, this interpretation ap-pears to be in disagreement with lifetime estimates by Moore et al. (1997). A detailedinvestigation of the dynamics of the complicated photodissociation process using thephotoimaging technique was reported by Tanaka et al. (1998).
References20
Johnsson, K., Engdahl, A., and Nelander, B.: J. Phys. Chem., 99, 3965, 1995.Knauth, H. D., Alberti, H., and Clausen, H.: J. Phys. Chem., 83, 1604, 1979.Lin, C. L.: J. Chem. Eng. Data, 21, 411, 1976.Molina, L. T. and Molina, M. J.: J. Phys. Chem., 82, 2410, 1978.Moore, T. A., Okumura, M., and Minton, T. K.: J. Chem. Phys., 107, 3337, 1997.25
Nee, J. B.: J. Quant. Spectrosc. Radiat. Transfer, 46, 55, 1991.Nelson, C. M., Moore, T. R., and Okumara, T. K.: J. Chem. Phys., 107, 3337, 1997.
2613

ACPD6, 2281–2702, 2006
Evaluated kinetic andphotochemical data
for atmosphericchemistry
R. Atkinson et al.
Title Page
Abstract Introduction
Conclusions References
Tables Figures
J I
J I
Back Close
Full Screen / Esc
Printer-friendly Version
Interactive Discussion
EGU
Nickolaisen, S. L., Miller, C. E., Sander, S. P., Hard, M. R., Williams, I. H., andFrancisco, J. S.: J. Chem. Phys., 104, 2857, 1996.Sander, S. P. and Friedl, R. R.: J. Phys. Chem., 93, 4764, 1989.Tanaka, Y., Kawasaki, M., Matsumi, Y., Fujiwara, H., Ishiwata, T., Rogers, L. J., Dixon,R. N., and Ashfold, M. N. R.: J. Chem. Phys., 109, 1315, 1998.5
2614
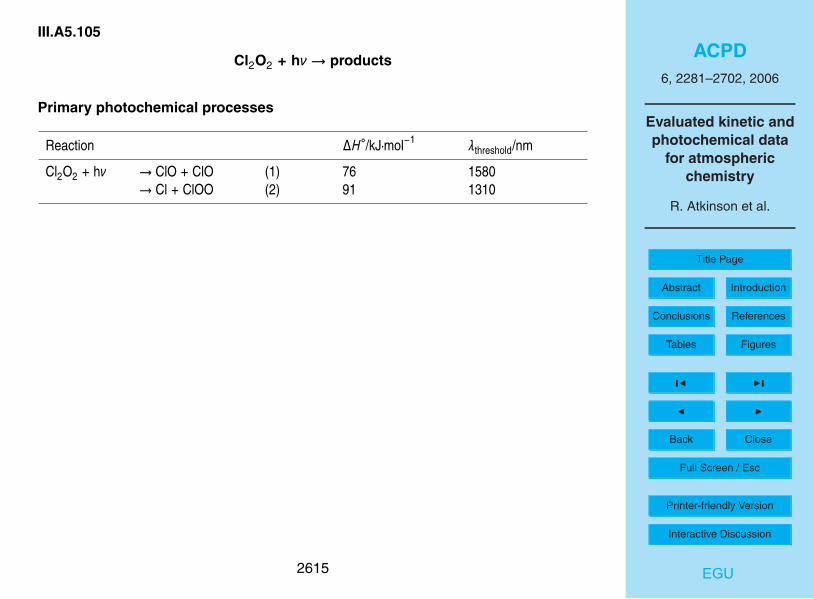
ACPD6, 2281–2702, 2006
Evaluated kinetic andphotochemical data
for atmosphericchemistry
R. Atkinson et al.
Title Page
Abstract Introduction
Conclusions References
Tables Figures
J I
J I
Back Close
Full Screen / Esc
Printer-friendly Version
Interactive Discussion
EGU
III.A5.105
Cl2O2 + hν→ products
Primary photochemical processes
Reaction ∆H◦/kJ·mol−1 λthreshold/nm
Cl2O2 + hν → ClO + ClO (1) 76 1580→ Cl + ClOO (2) 91 1310
2615
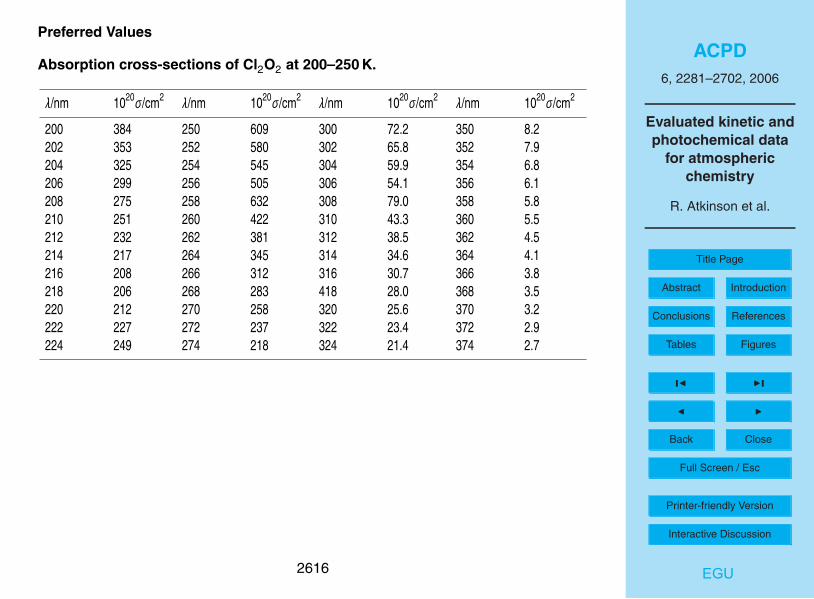
ACPD6, 2281–2702, 2006
Evaluated kinetic andphotochemical data
for atmosphericchemistry
R. Atkinson et al.
Title Page
Abstract Introduction
Conclusions References
Tables Figures
J I
J I
Back Close
Full Screen / Esc
Printer-friendly Version
Interactive Discussion
EGU
Preferred Values
Absorption cross-sections of Cl2O2 at 200–250 K.
λ/nm 1020σ/cm2 λ/nm 1020σ/cm2 λ/nm 1020σ/cm2 λ/nm 1020σ/cm2
200 384 250 609 300 72.2 350 8.2202 353 252 580 302 65.8 352 7.9204 325 254 545 304 59.9 354 6.8206 299 256 505 306 54.1 356 6.1208 275 258 632 308 79.0 358 5.8210 251 260 422 310 43.3 360 5.5212 232 262 381 312 38.5 362 4.5214 217 264 345 314 34.6 364 4.1216 208 266 312 316 30.7 366 3.8218 206 268 283 418 28.0 368 3.5220 212 270 258 320 25.6 370 3.2222 227 272 237 322 23.4 372 2.9224 249 274 218 324 21.4 374 2.7
2616
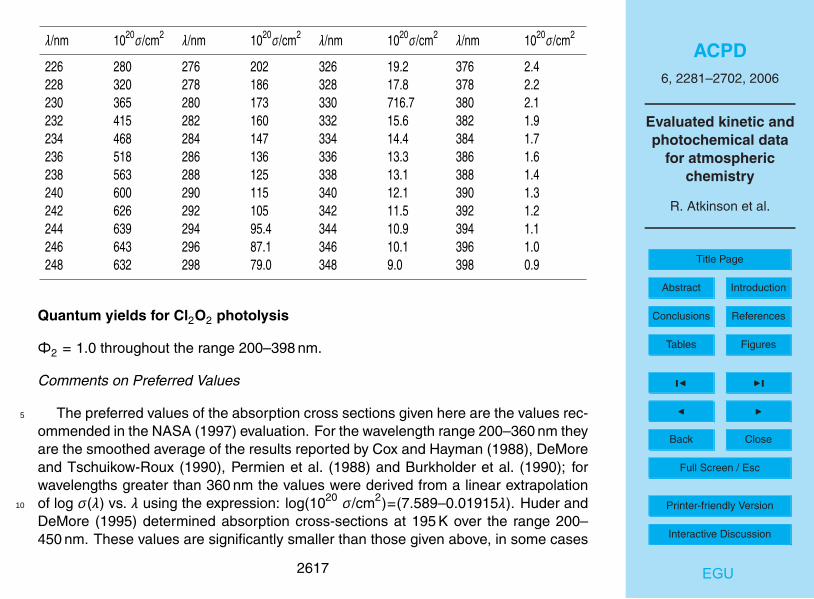
ACPD6, 2281–2702, 2006
Evaluated kinetic andphotochemical data
for atmosphericchemistry
R. Atkinson et al.
Title Page
Abstract Introduction
Conclusions References
Tables Figures
J I
J I
Back Close
Full Screen / Esc
Printer-friendly Version
Interactive Discussion
EGU
λ/nm 1020σ/cm2 λ/nm 1020σ/cm2 λ/nm 1020σ/cm2 λ/nm 1020σ/cm2
226 280 276 202 326 19.2 376 2.4228 320 278 186 328 17.8 378 2.2230 365 280 173 330 716.7 380 2.1232 415 282 160 332 15.6 382 1.9234 468 284 147 334 14.4 384 1.7236 518 286 136 336 13.3 386 1.6238 563 288 125 338 13.1 388 1.4240 600 290 115 340 12.1 390 1.3242 626 292 105 342 11.5 392 1.2244 639 294 95.4 344 10.9 394 1.1246 643 296 87.1 346 10.1 396 1.0248 632 298 79.0 348 9.0 398 0.9
Quantum yields for Cl2O2 photolysis
Φ2 = 1.0 throughout the range 200–398 nm.
Comments on Preferred Values
The preferred values of the absorption cross sections given here are the values rec-5
ommended in the NASA (1997) evaluation. For the wavelength range 200–360 nm theyare the smoothed average of the results reported by Cox and Hayman (1988), DeMoreand Tschuikow-Roux (1990), Permien et al. (1988) and Burkholder et al. (1990); forwavelengths greater than 360 nm the values were derived from a linear extrapolationof log σ(λ) vs. λ using the expression: log(1020 σ/cm2)=(7.589–0.01915λ). Huder and10
DeMore (1995) determined absorption cross-sections at 195 K over the range 200–450 nm. These values are significantly smaller than those given above, in some cases
2617
ACPD6, 2281–2702, 2006
Evaluated kinetic andphotochemical data
for atmosphericchemistry
R. Atkinson et al.
Title Page
Abstract Introduction
Conclusions References
Tables Figures
J I
J I
Back Close
Full Screen / Esc
Printer-friendly Version
Interactive Discussion
EGU
up to a factor of two. The differences could be due to the absorption of unwantedimpurities, such as Cl2O in the work of Huder and DeMore (1995). However, theseabsorption cross-sections should be confirmed by independent experiments. Thesestudies indicate that, in the recombination reaction ClO+ClO→products, the only stablespecies produced is ClOOCl. The structure of the recombination product has been es-5
tablished to be ClOOCl by the study of Birk et al. (1989) using submillimeter wave spec-troscopy. Theoretical studies (McGrath et al., 1988, 1990; Jensen and Oddershede,1990; Stanton et al., 1991, 1993) of thermochemical stabilities of Cl2O2 isomers are inagreement with these observations. The preferred quantum yield values are based onresults of the study by Molina et al. (1990) in which the production of Cl atoms in the10
laser flash photolysis of ClOOCl at 308 nm was directly determined by time-resolvedatomic resonance fluorescence. These results are in agreement with the interpretationof the steady-state photolysis experiments of Cox and Hayman (1988). More recently,laser flash photolysis/molecular beam experiments by Moore et al. (1999) performedat 248 and 308 nm give for the Cl+ClOO channel a quantum yield of 0.9±0.1 and for15
the complementary channel ClO+ClO a value of 0.1±0.1. These results support thestudy of Molina et al. (1990).
References
Birk, M., Friedl, R., Cohen, E., Pickett, H., and Sander, S. P.: J. Chem. Phys., 91,6588, 1989.20
Burkholder, J. B., Orlando, J. J., and Howard, C. J.: J. Phys. Chem., 94, 687, 1990.Cox, R. A. and Hayman, G. D.: Nature, 332, 796, 1988.DeMore, W. B. and Tschuikow-Roux, E.: J. Phys. Chem., 94, 5856, 1990.Huder, K. and DeMore, W. B.: J. Phys. Chem., 99, 3905, 1995.Jensen, F. and Oddershede, J.: J. Phys. Chem., 94, 2235, 1990.25
McGrath, M. P., Clemitshaw, K. C., Rowland, F. S., and Hehre, W. J.: Geophys. Res.Lett., 15, 883, 1988.
2618
ACPD6, 2281–2702, 2006
Evaluated kinetic andphotochemical data
for atmosphericchemistry
R. Atkinson et al.
Title Page
Abstract Introduction
Conclusions References
Tables Figures
J I
J I
Back Close
Full Screen / Esc
Printer-friendly Version
Interactive Discussion
EGU
McGrath, M. P., Clemitshaw, K. C., Rowland, F. S., and Hehre, W. J.: J. Phys. Chem.,94, 6126, 1990.Molina, M. J., Colussi, A. J., Molina, L. T., Schindler, R. N., and Tso, T. L.: Chem.Phys. Lett., 173, 310, 1990.Moore, T. A., Okumura, M., Seale, J. W., and Minton, T. K.: J. Phys. Chem. A, 103,5
1691, 1999.NASA: Evaluation No. 12, 1997 (see references in Introduction).Permien, T., Vogt, R., and Schindler, R. N.: In Mechanisms of Gas Phase and LiquidPhase Chemical Transformations, in: Tropospheric Chemistry, edited by: Cox, R. A.,Air Pollution Research No. 17, Environmental Research Program of the CEC, EUR10
12035 EN, Brussels, Belgium, 1988.Stanton, J. F., Rittby, C. M. L., Bartlett, R. J., and Toohey, D. W.: J. Phys. Chem., 95,2107, 1991.Stanton, J. F. and Bartlett, R. J.: J. Chem. Phys., 98, 9335, 1993.
15
2619

ACPD6, 2281–2702, 2006
Evaluated kinetic andphotochemical data
for atmosphericchemistry
R. Atkinson et al.
Title Page
Abstract Introduction
Conclusions References
Tables Figures
J I
J I
Back Close
Full Screen / Esc
Printer-friendly Version
Interactive Discussion
EGU
III.A5.106
Cl2O3 + hν→ products
Primary photochemical processes
Reaction ∆H◦/kJ·mol−1 λthreshold/nm
Cl2O3 + hν → ClO + OClO (1) 44 2720→ Cl + ClO3 (2) 201 595
Preferred Values5
Absorption cross-sections for Cl2O3 at 200–260 K.
λ/nm 1020σ/cm2 λ/nm 1020σ/cm2
220 968 280 1136225 930 285 890230 908 290 642235 883 295 435240 904 300 288245 989 305 176250 1154 310 107255 1352 315 56260 1512 320 36265 1594270 1544275 1376
2620

ACPD6, 2281–2702, 2006
Evaluated kinetic andphotochemical data
for atmosphericchemistry
R. Atkinson et al.
Title Page
Abstract Introduction
Conclusions References
Tables Figures
J I
J I
Back Close
Full Screen / Esc
Printer-friendly Version
Interactive Discussion
EGU
Comments on Preferred Values
The preferred values of the absorption cross-sections are those reported byBurkholder et al. (1993). They show no dependence on temperature over the range200–260 K. The results of this more direct study of Burkholder et al. (1993) are pre-ferred over those of Hayman and Cox (1989). These two studies (Hayman and Cox,5
1989; Burkholder et al., 1993) are in agreement on the shape of the spectrum, butthe values reported by Hayman and Cox (1989) are approximately 30–50% largerthan those from Burkholder et al. (1993). A later flash photolysis study of Harwoodet al. (1995) reports absorption cross-sections that below 310 nm are in betweenthe values of Hayman and Cox (1989) and Burkholder et al. (1993), while at longer10
wavelengths the values are higher than the values of Hayman and Cox (1989) andBurkholder et al. (1993). The authors claim that no other UV-absorbing species thanCl2O3 were present in their experiments (Harwood et al., 1995). This problem needsfurther experimental investigation. The mechanism and quantum yield for photodisso-ciation have not been determined.15
References
Burkholder, J. B., Mauldin, R. L., Yokelson, R. J., Solomon, S., and Ravishankara, A.R : J. Phys. Chem., 97, 7597, 1993.Harwood, M. H., Rowley, D. M., Freshwater, R. A., Cox, R. A., and Jones, R. L.: J.Chem. Soc. Faraday Trans., 91, 3027, 1995.20
Hayman, G. D. and Cox, R. A.: Chem. Phys. Lett., 155, 1, 1989.
2621

ACPD6, 2281–2702, 2006
Evaluated kinetic andphotochemical data
for atmosphericchemistry
R. Atkinson et al.
Title Page
Abstract Introduction
Conclusions References
Tables Figures
J I
J I
Back Close
Full Screen / Esc
Printer-friendly Version
Interactive Discussion
EGU
III.A5.107
ClNO + hν→ products
Primary photochemical processes
Reaction ∆H◦/kJ·mol−1 λthreshold/nm
ClNO + hν → Cl + NO 160 750
2622

ACPD6, 2281–2702, 2006
Evaluated kinetic andphotochemical data
for atmosphericchemistry
R. Atkinson et al.
Title Page
Abstract Introduction
Conclusions References
Tables Figures
J I
J I
Back Close
Full Screen / Esc
Printer-friendly Version
Interactive Discussion
EGU
Preferred Values
Absorption cross-sections for ClNO at 298 K.
λ/nm 1020σ/cm2 λ/nm 1020σ/cm2 λ/nm 1020σ/cm2 λ/nm 1020σ/cm2
190 4320 246 45.2 302 10.3 370 11.0192 5340 248 37.7 304 10.5 375 9.95194 6150 250 31.7 306 10.8 380 8.86196 6480 252 27.4 308 11.1 385 7.82198 6310 254 23.7 310 11.5 390 6.86200 5860 256 21.3 312 11.9 395 5.97202 5250 258 19.0 314 12.2 400 5.13204 4540 260 17.5 316 12.5 405 4.40206 3840 262 16.5 318 13.0 410 3.83208 3210 264 15.3 320 13.4 415 3.38210 2630 266 14.4 322 13.6 420 2.89212 2180 268 13.6 324 14.0 425 2.45214 1760 270 12.9 326 14.3 430 2.21216 1400 272 12.3 328 14.6 435 2.20
2623

ACPD6, 2281–2702, 2006
Evaluated kinetic andphotochemical data
for atmosphericchemistry
R. Atkinson et al.
Title Page
Abstract Introduction
Conclusions References
Tables Figures
J I
J I
Back Close
Full Screen / Esc
Printer-friendly Version
Interactive Discussion
EGU
λ/nm 1020σ/cm2 λ/nm 1020σ/cm2 λ/nm 1020σ/cm2 λ/nm 1020σ/cm2
218 1110 274 11.8 330 14.7 440 2.20220 896 276 11.3 332 14.9 445 2.07222 707 278 10.7 334 15.1 450 1.87224 552 280 10.6 336 15.3 455 1.79226 436 282 10.2 338 15.3 460 1.95228 339 284 9.99 340 15.2 465 2.25230 266 286 9.84 342 15.3 470 2.50232 212 288 9.71 344 15.1 475 2.61234 164 290 9.64 346 15.1 480 2.53236 128 292 9.63 348 14.9 485 2.33238 101 294 9.69 350 14.5 490 2.07240 82.5 296 9.71 355 13.6 495 1.78242 67.2 298 9.89 360 12.9 500 1.50244 55.1 300 10.0 365 12.0
Quantum yields for ClNO photolysis at 298 K
Φ = 1.0 over the entire wavelength range.
Comments on Preferred Values
The preferred values of the absorption cross sections at 298 K for the wavelength5
range 190–350 nm are the values reported by Tyndall et al. (1987) and for the longerwavelengths are the values reported by Roehl et al. (1992). Roehl et al. (1992) de-termined values over the wavelength range 350–650 nm and the temperature range223–343 K. Earlier results are discussed in NASA (1997). The preferred quantum yieldvaluesare taken from Calvert and Pitts (1966). Relative yields of the spin-orbit states10
2624

ACPD6, 2281–2702, 2006
Evaluated kinetic andphotochemical data
for atmosphericchemistry
R. Atkinson et al.
Title Page
Abstract Introduction
Conclusions References
Tables Figures
J I
J I
Back Close
Full Screen / Esc
Printer-friendly Version
Interactive Discussion
EGU
of Cl(2Π3/2) and Cl(2Π1/2) have been measured by Felder and Morley (1999) and Sko-rokhodov et al. (1996).
References
Calvert, J. G. and Pitts Jr., J. N.: Photochemistry, John Wiley & Sons Inc., New York,p. 230, 1966.5
Felder, P. and Morley, G. P.: Chem. Phys., 185, 145, 1999.NASA: Evaluation No. 12, 1997 (see references in Introduction).Roehl, C. M., Orlando, J. J., and Calvert, J. G.: J. Photochem. Photobiol. A: Chem.,69, 1, 1992.Skorokhodov, V., Sato, Y., Suto, K., Matsumi, Y., and Kawasaki, M.: J. Phys. Chem.,10
100, 12321, 1996.Tyndall, G. S., Stedman, K. M., Schneider, W., Burrows, J. P., and Moortgat, G. K.: J.Photochem., 36, 133, 1987.
2625

ACPD6, 2281–2702, 2006
Evaluated kinetic andphotochemical data
for atmosphericchemistry
R. Atkinson et al.
Title Page
Abstract Introduction
Conclusions References
Tables Figures
J I
J I
Back Close
Full Screen / Esc
Printer-friendly Version
Interactive Discussion
EGU
III.A5.108
ClONO + hν→ products
Primary photochemical processes
Reaction ∆H◦/kJ·mol−1 λthreshold/nm
ClONO + hν → Cl + NO2 (1) 98 1220→ ClO + NO (2) 136 880
2626
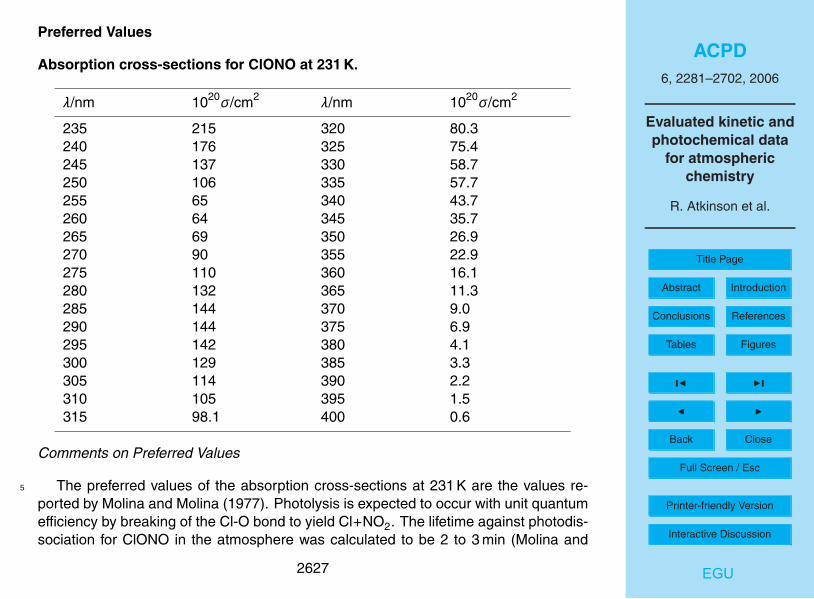
ACPD6, 2281–2702, 2006
Evaluated kinetic andphotochemical data
for atmosphericchemistry
R. Atkinson et al.
Title Page
Abstract Introduction
Conclusions References
Tables Figures
J I
J I
Back Close
Full Screen / Esc
Printer-friendly Version
Interactive Discussion
EGU
Preferred Values
Absorption cross-sections for ClONO at 231 K.
λ/nm 1020σ/cm2 λ/nm 1020σ/cm2
235 215 320 80.3240 176 325 75.4245 137 330 58.7250 106 335 57.7255 65 340 43.7260 64 345 35.7265 69 350 26.9270 90 355 22.9275 110 360 16.1280 132 365 11.3285 144 370 9.0290 144 375 6.9295 142 380 4.1300 129 385 3.3305 114 390 2.2310 105 395 1.5315 98.1 400 0.6
Comments on Preferred Values
The preferred values of the absorption cross-sections at 231 K are the values re-5
ported by Molina and Molina (1977). Photolysis is expected to occur with unit quantumefficiency by breaking of the Cl-O bond to yield Cl+NO2. The lifetime against photodis-sociation for ClONO in the atmosphere was calculated to be 2 to 3 min (Molina and
2627
ACPD6, 2281–2702, 2006
Evaluated kinetic andphotochemical data
for atmosphericchemistry
R. Atkinson et al.
Title Page
Abstract Introduction
Conclusions References
Tables Figures
J I
J I
Back Close
Full Screen / Esc
Printer-friendly Version
Interactive Discussion
EGU
Molina, 1977). Because of the instability of ClONO, Reaction (1) is the most probablephotolysis pathway in the band centered around 290 nm.
References
Molina, L. T. and Molina, M. J.: Geophys. Res. Lett., 4, 83, 1977.5
2628

ACPD6, 2281–2702, 2006
Evaluated kinetic andphotochemical data
for atmosphericchemistry
R. Atkinson et al.
Title Page
Abstract Introduction
Conclusions References
Tables Figures
J I
J I
Back Close
Full Screen / Esc
Printer-friendly Version
Interactive Discussion
EGU
III.A5.109
ClNO2 + hν→ products
Primary photochemical processes
Reaction ∆H◦/kJ·mol−1 λthreshold/nm
ClNO2 + hν → Cl + NO2 (1) 142 840→ ClNO + O(3P) (2) 288 415
Preferred Values5
Absorption cross-sections for ClNO2 at 298 K.
λ/nm 1020σ/cm2 λ/nm 1020σ/cm2
190 2690 290 17.3200 468 300 14.9210 320 310 12.1220 339 320 8.87230 226 330 5.84240 133 340 3.54250 90.6 350 2.04260 61.3 360 1.15270 35.3 370 0.69280 22.0
2629
ACPD6, 2281–2702, 2006
Evaluated kinetic andphotochemical data
for atmosphericchemistry
R. Atkinson et al.
Title Page
Abstract Introduction
Conclusions References
Tables Figures
J I
J I
Back Close
Full Screen / Esc
Printer-friendly Version
Interactive Discussion
EGU
Comments on Preferred Values
The preferred values of the absorption cross-sections are the values reported inthe recent study of Ganske et al. (1992). They are in good agreement with the val-ues reported by Illies and Takacs (1976/77) for 190–270 nm, the 270–370 nm valuesreported by Nelson and Johnston (1981), and the results by Hunter (1993). Nelson5
and Johnston (1981) determined that photolysis occurs with a quantum yield of unity(within experimental error) to produce Cl+NO2 (Φ1=0.93±0.15). They also reported anegligible production of oxygen atoms (Φ2<0.02). The product NO2 from Reaction (1)is formed both in the electronic ground state and in an excited electronic state (Millerand Johnston, 1993; Carter et al., 1999).10
References
Carter, R. T., Hallou, A., and Huber, J. R.: Chem. Phys. Lett., 310, 166, 1999.Ganske, J. A., Berko, H. N., and Finlayson-Pitts, B. J.: J. Geophys. Res., 97, 7651,1992.Hunter, P. L.: cited in: Miller and Johnston, 1993.15
Illies, A. J. and Takacs, G. A.: J. Photochem., 6, 35, 1976/77.Miller, C. E. and Johnston, H. S.: J. Phys. Chem., 97, 9924, 1993.Nelson, H. H. and Johnston, H. S.: J. Phys. Chem., 85, 3891, 1981.
2630

ACPD6, 2281–2702, 2006
Evaluated kinetic andphotochemical data
for atmosphericchemistry
R. Atkinson et al.
Title Page
Abstract Introduction
Conclusions References
Tables Figures
J I
J I
Back Close
Full Screen / Esc
Printer-friendly Version
Interactive Discussion
EGU
III.A5.110
ClONO2 + hν→ products
Primary photochemical processes
Reaction ∆H◦/kJ·mol−1 λthreshold/nm
ClONO2 + hν → ClO + NO2 (1) 112 1065→ Cl + NO3 (2) 163 735→ ClONO + O(3P) (3) 282 425
2631

ACPD6, 2281–2702, 2006
Evaluated kinetic andphotochemical data
for atmosphericchemistry
R. Atkinson et al.
Title Page
Abstract Introduction
Conclusions References
Tables Figures
J I
J I
Back Close
Full Screen / Esc
Printer-friendly Version
Interactive Discussion
EGU
Preferred Values
Absorption cross-sections for ClONO2 at 296 and 220 K
λ/nm 1020σ/cm2 1020σ/cm2 λ/nm 1020σ/cm2 1020σ/cm2
296 K 220 K 296 K 220 K
200 282 270 315 1.14205 284 320 0.831 0.578210 314 315 325 0.613215 342 330 0.466 0.329220 332 335 335 0.367225 278 340 0.302 0.230230 208 200 345 0.258235 148 350 0.229 0.186240 105 96.7 355 0.208245 76.4 360 0.200 0.169250 56.0 49.7 365 0.180
2632

ACPD6, 2281–2702, 2006
Evaluated kinetic andphotochemical data
for atmosphericchemistry
R. Atkinson et al.
Title Page
Abstract Introduction
Conclusions References
Tables Figures
J I
J I
Back Close
Full Screen / Esc
Printer-friendly Version
Interactive Discussion
EGU
λ/nm 1020σ/cm2 1020σ/cm2 λ/nm 1020σ/cm2 1020σ/cm2
296 K 220 K 296 K 220 K
245 76.4 360 0.200 0.169250 56.0 49.7 365 0.180255 43.2 370 0.159 0.136260 33.8 29.1 375 0.141265 26.5 380 0.121 0.104270 20.5 17.3 385 0.137275 15.7 390 0.091 0.077280 11.9 9.83 395 0.076285 8.80 400 0.064 0.052290 6.41 5.15 405 0.054295 4.38 410 0.044 0.034300 3.13 2.40 415 0.036305 2.24 420 0.032 0.023310 1.60 1.16 425 0.023
430 0.019 0.013
Quantum yields for ClONO2 photolysis
Φ2(λ) = 0.4 + 4 × 10⁻³ (λ/nm–220).Φ1 (λ) = 1 – Φ2(λ).5
Φ3 = 0.17 at 220 nm.Φ3 < 0.10 at 248 nm.Φ3 < 0.05 at 308 nm.
2633

ACPD6, 2281–2702, 2006
Evaluated kinetic andphotochemical data
for atmosphericchemistry
R. Atkinson et al.
Title Page
Abstract Introduction
Conclusions References
Tables Figures
J I
J I
Back Close
Full Screen / Esc
Printer-friendly Version
Interactive Discussion
EGU
Comments on Preferred Values
The preferred values of the absorption cross-sections are taken from Burkholder etal. (1994) who measured values over the wavelength range 195–430 nm and the tem-perature range 220–296 K. They report (Burkholder et al., 1994) every 2 nm, values ofσ at 296 K and values of the parameters A1 and A2 needed to compute the temperature5
dependence by the equation:
σ(λ, T )/σ(λ,296) = 1 + A1(T − 296) + A2(T − 296)2
In this data sheet, room temperature values at 5 nm intervals and values for 220 Kat 10 nm intervals are given. These values are in good agreement with those reportedin IUPAC (1992), which were based on the results of Molina and Molina (1979).10
Preferred values for quantum yields are changed from those used (Chang et al.,1979; Margitan, 1983; Knauth and Schindler, 1983) for the recommendation in our pre-vious IUPAC (1997) evaluation. A variety of experimental techniques such as atomicresonance fluorescence, tunable diode laser absorption and diode array spectroscopyhave been employed by Ravishankara (1995) while photofragment translational spec-15
troscopy was used by Moore et al. (1995) and Nelson et al. (1996). Broad band flashphotolysis coupled with long-path UV-visible absorption spectroscopy in experimentsby Nickolaisen et al. (1996), and laser flash photolysis coupled with resonance fluores-cence in experiments by Tyndall et al. (1997) and by Goldfarb et al. (1997) and withvisible absorption spectroscopy by Yokelson et al. (1997) extended the earlier work.20
The most recent studies (Ravishankara, 1995; Moore et al., 1995; Nelson et al., 1996;Nickolaisen et al., 1996; Tyndall et al., 1997; Goldfarb et al., 1997; Yokelson et al.,1997) approach a general agreement of the wavelength dependence of the quantumyields Φ1, Φ2, and Φ3, although some discrepancies, in particular pressure depen-dences, such as observed in Nickolaisen et al. (1996) were not reproduced in Tyndall25
et al. (1997), Goldfarb et al. (1997) and Yokelson et al. (1997), and remain unexplained.We here prefer the quantum yield results from Goldfarb et al. (1997) and Yokelson etal. (1997), which are consistent with the data from Ravishankara (1995), Moore et
2634
ACPD6, 2281–2702, 2006
Evaluated kinetic andphotochemical data
for atmosphericchemistry
R. Atkinson et al.
Title Page
Abstract Introduction
Conclusions References
Tables Figures
J I
J I
Back Close
Full Screen / Esc
Printer-friendly Version
Interactive Discussion
EGU
al. (1995), Nelson et al. (1996) and Tyndall et al. (1997). These results are Φ1=0.60,0.40, and 0.35 for λ=222, 248, and 308 nm respectively, Φ2=0.40, 0.60, 0.65, and0.93 for λ=222, 248, 308, and 352.5 nm, respectively, and Φ3=0.17, <0.10, <0.05 forλ=222, 248, and 308 nm, respectively. A linear representation of Φ2(λ) between 220and 370 nm is given by Φ2=0.4+4×10⁻³ (λ/nm–220).5
References
Burkholder, J. B., Talukdar, R. K., and Ravishankara, A. R.: Geophys. Res. Lett., 21,585, 1994.Burrows, J. P., Tyndall, G. S., and Moortgat, G. K.: J. Phys. Chem., 92, 4340, 1988.Chang, J. S., Barker, J. R., Davenport, J. E., and Golden, D. M.: Chem. Phys. Lett.,10
60, 385, 1979.Goldfarb, L., Schmoltner, A.-M., Gilles, M. K., Burkholder, J. B., and Ravishankara, A.R.: J. Phys. Chem. A, 101, 6658, 1997.IUPAC: Supplement IV, 1992 (see references in Introduction).IUPAC: Supplement V, 1997 (see references in Introduction).15
Knauth, H. D. and Schindler, R. N.: Z. Naturforsch., 38a, 393, 1983.Margitan, J. J.: J. Phys. Chem., 87, 674, 1983.Molina, L. T. and Molina, M. J.: J. Photochem., 11, 139, 1979.Moore, T. A., Okumura, M., Tagawa, M., and Minton, T. K.: Faraday Discuss., 100,295, 1995.20
Nelson, C. M., Moore, T. A., Okumura, M., and Minton, T. K.: Chem. Phys., 207, 287,1996.Nickolaisen, S. L., Sander, S. P., and Friedl, R. R.: J. Phys. Chem., 100, 10 165, 1996.Ravishankava, A. R.: Faraday Discuss., 100, 335, 1995.Tyndall, G. S., Kegley-Owen, C. S., Orlando, J. J., and Calvert, J. G.: J. Chem. Soc.25
Faraday Trans., 93, 2675, 1997.Yokelson, R. J.: Burkholder, J. B., Fox, R. W., and Ravishankara, A. R.: J. Phys.
2635

ACPD6, 2281–2702, 2006
Evaluated kinetic andphotochemical data
for atmosphericchemistry
R. Atkinson et al.
Title Page
Abstract Introduction
Conclusions References
Tables Figures
J I
J I
Back Close
Full Screen / Esc
Printer-friendly Version
Interactive Discussion
EGU
Chem. A, 101, 6667, 1997.
2636

ACPD6, 2281–2702, 2006
Evaluated kinetic andphotochemical data
for atmosphericchemistry
R. Atkinson et al.
Title Page
Abstract Introduction
Conclusions References
Tables Figures
J I
J I
Back Close
Full Screen / Esc
Printer-friendly Version
Interactive Discussion
EGU
III.A5.111
Cl2 + hν→ Cl + Cl
Primary photochemical processes
Reaction ∆H◦/kJ·mol−1 λthreshold/nm
Cl2 + hν → Cl(2P3/2) + Cl(2P3/2) 242 495
Preferred Values5
Absorption cross-sections for Cl2 at 298 K.
λ/nm 1020σ/cm2 λ/nm 1020σ/cm2
260 0.20 370 8.4270 0.82 380 5.0280 2.6 390 2.9290 6.2 400 1.8300 11.9 410 1.3310 18.5 420 0.96320 23.7 430 0.73330 25.5 440 0.54340 23.5 450 0.38350 18.8 460 0.26360 13.2 370 0.16
2637

ACPD6, 2281–2702, 2006
Evaluated kinetic andphotochemical data
for atmosphericchemistry
R. Atkinson et al.
Title Page
Abstract Introduction
Conclusions References
Tables Figures
J I
J I
Back Close
Full Screen / Esc
Printer-friendly Version
Interactive Discussion
EGU
Comments on Preferred Values
The preferred values of the absorption cross-sections at 298 K are the values re-ported by Maric et al. (1993), which are in excellent agreement with those of Ganskeet al. (1992). There is good agreement with earlier studies which are cited in IUPAC(1992). Maric et al. (1993) fitted the data for the wavelength region 250–550 nm with5
the following semi-empirical expression:
1020σ = α0.5 × 27.3 exp {−99.0 α [ln(329.5/λ)]2} + α0.5 × 0.932 exp {-91.5 α[ln(406.5/λ)]2}
where α=tanh (402.676/T )10
This expression combines the semi-empirical function originally proposed by John-ston et al. (1984) with the temperature dependence expressions proposed by Sulzerand Wieland (1952). The photodissociation occurs with a quantum yield of unity.
References
Ganske, J. A., Berko, H. N., and Finlayson-Pitts, B. J.: J. Geophys. Res., 97, 7651,15
1992.IUPAC: Supplement IV, 1992 (see references in Introduction).Johnston, H. S., Paige, M., and Yao, F.: J. Geophys. Res., 89, 11661, 1984.Maric, D., Burrows, J. P., Meller, R., and Moortgat, G. K.: J. Photochem. Photobiol. A.Chem., 70, 205, 1993.20
Sulzer, P. and Wieland, K.: Helv. Phys. Acta., 25, 653, 1952.
2638

ACPD6, 2281–2702, 2006
Evaluated kinetic andphotochemical data
for atmosphericchemistry
R. Atkinson et al.
Title Page
Abstract Introduction
Conclusions References
Tables Figures
J I
J I
Back Close
Full Screen / Esc
Printer-friendly Version
Interactive Discussion
EGU
III.A5.112
HBr + hν→ products
Primary photochemical processes
Reaction ∆H◦/kJ·mol−1 λthreshold/nm
HBr + hν → H + Br 366 327
Preferred Values5
Absorption cross-sections of HBr at 298 K.
λ/nm 1020σ/cm2
170 254175 265180 265185 242190 204195 164200 122205 87.4210 59.0215 38.9220 23.6225 11.4230 7.6
2639

ACPD6, 2281–2702, 2006
Evaluated kinetic andphotochemical data
for atmosphericchemistry
R. Atkinson et al.
Title Page
Abstract Introduction
Conclusions References
Tables Figures
J I
J I
Back Close
Full Screen / Esc
Printer-friendly Version
Interactive Discussion
EGU
Comments on Preferred Values
The preferred cross-section values are those determined by Huebert and Martin(1968) at temperatures near 298 K and measured with HBr pressures of 2.4–3.0 Torr.Previous measurements have been carried out by Goodeve and Taylor (1935) and Ro-mand (1949). A primary quantum yield of unity was obtained with an N2O actinometer5
(Martin and Willard, 1964). The branching ratio for photolysis forming Br(2P1/2) and
Br(2P3/2) was determined in Regan et al. (1999).
References
Goodeve, C. F. and Taylor, A. W. C.: Proc. Roy. Soc. A, 152, 221, 1935.Huebert, B. J. and Martin, R. M.: J. Phys. Chem., 72, 3046, 1968.10
Martin, R. M. and Willard, J. E.: J. Chem. Phys., 40, 2999, 1964.Regan, P. M., Langford, S. R., Orr-Ewing, A. J., and Ashfold, M. N. R.: J. Chem. Phys.,110, 281, 1999.Romand, J.: Ann. Phys. (Paris), 4, 527, 1949.
15
2640

ACPD6, 2281–2702, 2006
Evaluated kinetic andphotochemical data
for atmosphericchemistry
R. Atkinson et al.
Title Page
Abstract Introduction
Conclusions References
Tables Figures
J I
J I
Back Close
Full Screen / Esc
Printer-friendly Version
Interactive Discussion
EGU
III.A5.113
HOBr + hν→ products
Primary photochemical processes
Reaction ∆H◦/kJ·mol−1 λthreshold/nm
HOBr + hν → HO + Br (1) 207 578→ HBr + O(3P) (2) 267 445→ BrO + H (3) 394 304
Absorption cross-section data5
Wavelength range/nm Reference Comments
260–545 Ingham et al., 1998 (a)
Quantum yield data
See Comments on Preferred Values.
Comments
(a) HOBr was generated by pulsed laser photolysis of flowing H2O2-Br2 mixtures in10
an absorption cell through which the analysing beam could be passed twice togive an absorption path length of 2.6 m. Detection was achieved either by meansof time-resolved photomutiplier measurements or by a diode array which could be
2641

ACPD6, 2281–2702, 2006
Evaluated kinetic andphotochemical data
for atmosphericchemistry
R. Atkinson et al.
Title Page
Abstract Introduction
Conclusions References
Tables Figures
J I
J I
Back Close
Full Screen / Esc
Printer-friendly Version
Interactive Discussion
EGU
gated from 0.06 ms to 5.06 ms. The spectral resolutions for the two techniqueswere 2 nm and 1.2 nm, respectively.
2642
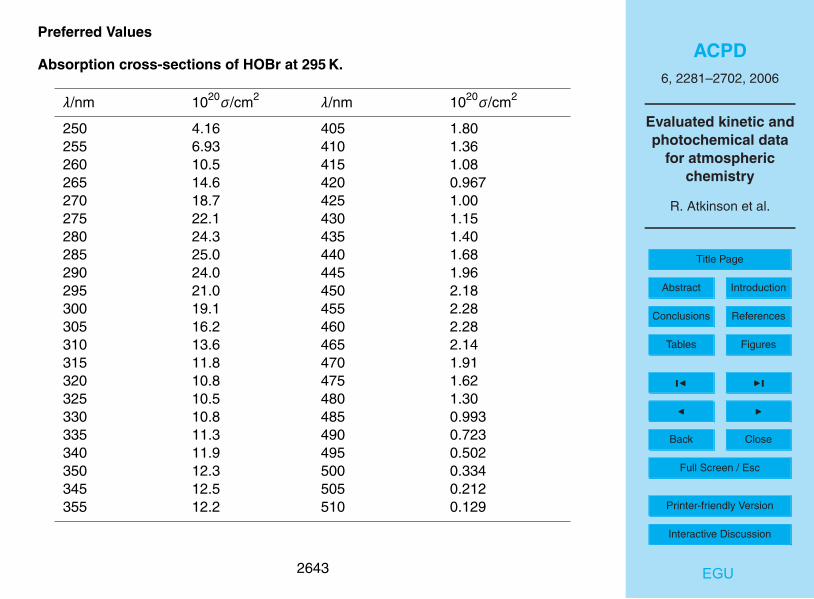
ACPD6, 2281–2702, 2006
Evaluated kinetic andphotochemical data
for atmosphericchemistry
R. Atkinson et al.
Title Page
Abstract Introduction
Conclusions References
Tables Figures
J I
J I
Back Close
Full Screen / Esc
Printer-friendly Version
Interactive Discussion
EGU
Preferred Values
Absorption cross-sections of HOBr at 295 K.
λ/nm 1020σ/cm2 λ/nm 1020σ/cm2
250 4.16 405 1.80255 6.93 410 1.36260 10.5 415 1.08265 14.6 420 0.967270 18.7 425 1.00275 22.1 430 1.15280 24.3 435 1.40285 25.0 440 1.68290 24.0 445 1.96295 21.0 450 2.18300 19.1 455 2.28305 16.2 460 2.28310 13.6 465 2.14315 11.8 470 1.91320 10.8 475 1.62325 10.5 480 1.30330 10.8 485 0.993335 11.3 490 0.723340 11.9 495 0.502350 12.3 500 0.334345 12.5 505 0.212355 12.2 510 0.129
2643

ACPD6, 2281–2702, 2006
Evaluated kinetic andphotochemical data
for atmosphericchemistry
R. Atkinson et al.
Title Page
Abstract Introduction
Conclusions References
Tables Figures
J I
J I
Back Close
Full Screen / Esc
Printer-friendly Version
Interactive Discussion
EGU
λ/nm 1020σ/cm2 λ/nm 1020σ/cm2
360 11.5 515 0.075365 10.5 520 0.042370 9.32 525 0.023375 8.00 530 0.012380 6.66 535 0.006385 5.38 540 0.003390 4.22 545 0.0001395 3.24400 2.43
Comments on Preferred Values
There remain significant uncertainties in the values of the absorption cross-sectionsdespite a number of recent studies (Orlando and Burkholder, 1995; Benter et al., 1995;Deters et al., 1996; Rattigan et al., 1996; Ingham et al., 1998). However, the shape of5
the spectrum has been clarified. Orlando and Burkholder (1995), Benters et al. (1995)and Deters et al. (1996) observe two absorption bands between 200 and 400 nm with arapid decline in the cross-sections beyond 400 nm. Rattigan et al. (1996) and Ingham etal. (1998) also observe these two bands but find another weak band with a maximum at∼460 nm as predicted by theoretical calculations (Francisco et al., 1996; Minaev et al.,10
1999). Further evidence for the long wavelength band comes from a laser photolysisstudy of Barnes et al. (1994) who observed HO production from HOBr photolysis overthe range 400–600 nm. It now seems clear that the spectrum consists of three broadbands with maxima at ∼284 nm, ∼351 nm, and ∼457 nm.
At the maximum of the short wavelength band the measured values of the cross-15
sections differ by ∼20%, whilst in the 350 nm region the differences become as muchas a factor of three. It is likely that this scatter, and the difficulty in detecting the longwavelength band, are largely due to the presence of impurities such as Br2O and Br2,
2644

ACPD6, 2281–2702, 2006
Evaluated kinetic andphotochemical data
for atmosphericchemistry
R. Atkinson et al.
Title Page
Abstract Introduction
Conclusions References
Tables Figures
J I
J I
Back Close
Full Screen / Esc
Printer-friendly Version
Interactive Discussion
EGU
which absorb strongly in the same spectral region as HOBr.In most of the studies (Orlando and Burkholder, 1995; Deters et al., 1996; Ratti-
gan et al., 1996) HOBr was generated by reaction of Br2O with H2O, leading to the pro-duction of equilibrium mixtures of Br2O, H2O and HOBr. Benter et al. (1995) achievedsmaller [Br2O]/[HOBr] ratios by generation and elution of HOBr from aqueous solution5
and Ingham et al. (1998) attempted to circumvent the problems of impurities by in situgeneration of the HOBr using pulsed laser photolysis of H2O2-Br2 mixtures, calibratingthe cross-sections relative to the better established cross-sections of Br2. The studyof Ingham et al. (1998) appears to have been the most successful in avoiding inter-ference from impurities and their values are adopted as our preferred values. Their10
measurements (Ingham et al., 1998) only went down to 260 nm but they fitted theirresults to an expression consisting of the sum of three Gaussian terms and the rangeof our preferred values have been extended slightly using calculated values from thisexpression.
HO quantum yields close to unity have been observed for photolysis of HOI and15
HOCl, and a similar value would be expected for HOBr. The only experimental studyis that of Benter et al. (1995) who obtained a value of >0.95 at 363 nm but this value isdependent on the cross-sections used. Confirmation of unit quantum yield is desirable.
Calculations of the atmospheric lifetime of HOBr by Ingham et al. (1998) usingtheir own cross-sections give values of ∼5 min in the lower stratosphere at a zenith20
angle of 40◦ and ∼30 min at the surface at high zenith angles.
References
Barnes, R. J., Lock, M., Coleman, J., and Sinha, M.: J. Phys. Chem., 100, 817, 1994.Benter, T., Feldman, Chr., Kirchner, U., Schmidt, M., Schmidt, S., and Schindler, R. N.:Ber. Bunsenges. Phys. Chem., 99, 1144, 1995.25
Deters, B., Burrows, J. P., Himmelman, S., and Blindauer, C.: Ann. Geophys., 14, 468,1996.
2645

ACPD6, 2281–2702, 2006
Evaluated kinetic andphotochemical data
for atmosphericchemistry
R. Atkinson et al.
Title Page
Abstract Introduction
Conclusions References
Tables Figures
J I
J I
Back Close
Full Screen / Esc
Printer-friendly Version
Interactive Discussion
EGU
Francisco, J., Hand, M. R., and Williams, I. H.: J. Phys. Chem., 100, 457, 1996.Ingham, T., Bauer, D., Landgraf, J., and Crowley, J. N.: J. Phys. Chem. A, 102, 3293,1998.Minaev, B. F.: J. Phys. Chem. A, 103, 7294, 1999.Orlando, J. J. and Burkholder, J. B.: J. Phys. Chem., 99, 1143, 1995.5
Rattigan, O. V., Lary, D. J., Jones, R. L., and Cox, R. A.: J. Geophys. Res., 101,23 021, 1996.
2646

ACPD6, 2281–2702, 2006
Evaluated kinetic andphotochemical data
for atmosphericchemistry
R. Atkinson et al.
Title Page
Abstract Introduction
Conclusions References
Tables Figures
J I
J I
Back Close
Full Screen / Esc
Printer-friendly Version
Interactive Discussion
EGU
III.A5.114
BrO + hν→ products
Primary photochemical processes
Reaction ∆H◦/kJ·mol−1 λthreshold/nm
BrO + hν → Br + O(3P) (1) 232 515→ Br + O(1D) (2) 422 2385
Absorption cross-section data
Wavelength range/nm Reference Comments
296–375 Cox et al., 1982 (a)312–385 Wahner et al., 1988 (b)338.5 Gilles et al., 1997 (c)
Quantum yield data
No experimental data are available.
Comments10
(a) BrO radicals were produced by square-wave modulated photolysis of Br2-O3 mix-tures and detected in absorption at 0.22 nm resolution by molecular modulation
2647

ACPD6, 2281–2702, 2006
Evaluated kinetic andphotochemical data
for atmosphericchemistry
R. Atkinson et al.
Title Page
Abstract Introduction
Conclusions References
Tables Figures
J I
J I
Back Close
Full Screen / Esc
Printer-friendly Version
Interactive Discussion
EGU
spectroscopy using a multichannel analyser to collect the signal. The absolutecross-section at 338.3 nm was determined by measuring the kinetics of BrO pro-duction and removal.
(b) BrO radicals were generated in a flowing He carrier gas by reacting Br atomswith O3 and passed into a 1 m long absorption cell coupled to a diode array spec-5
trometer. Spectra were recorded at 298 K and 223 K with a resolution of 0.4 nm.Absolute cross-sections were determined at 338.5 nm at both temperatures byphotolysis of Br-O3 or Br-O2 mixtures and monitoring the kinetics of the changesin [BrO].
(c) BrO radicals were produced by pulsed laser photolysis at 193 nm of N2O-Br210
mixtures in an absorption cell of 87 cm path length, and detected in time re-solved experiments by means of a monochromator-photomultiplier combination.Pulsed photolysis of N2O-O2 mixtures, detecting O3 production by absorption at253.7 nm, was carried out in “back-to-back” experiments in the same system. TheBrO absorption cross-sections were thus determined relative to the O3 cross-15
section at 253.7 nm. The absorption cross-section at the peak of the (7,0) bandwas measured over the temperature range 204–388 K.
2648

ACPD6, 2281–2702, 2006
Evaluated kinetic andphotochemical data
for atmosphericchemistry
R. Atkinson et al.
Title Page
Abstract Introduction
Conclusions References
Tables Figures
J I
J I
Back Close
Full Screen / Esc
Printer-friendly Version
Interactive Discussion
EGU
Preferred Values
Absorption cross-sections of BrO at 303 K.
λ/nm 1020σ/cm2 λ/nm 1020σ/cm2
300–305 200 340–345 515305–310 259 345–350 399310–315 454 350–355 228315–320 391 355–360 172320–325 600 360–365 161325–330 753 365–370 92330–335 628 370–375 51335–340 589
Comments on Preferred Values
The BrO radical has a banded absorption spectrum in the 290–380 nm range. The5
values of the absorption cross-sections at the band peaks are dependent on tempera-ture and spectral resolution. The band locations, vibrational level assignments, and thevalues of the absorption cross-sections at several spectral resolutions, are reported inthe paper by Wahner et al. (1988) which should be consulted for detailed information.The strongest absorption feature is the (7,0) band at 338.5 nm for which the cross-10
section at 0.5 nm resolution was determined to be (1.48±0.14)×10−17 cm2 at 298 K.More recently a study by Gilles et al. (1997) from the same laboratory gives a value of1.63×10−17 cm2. This latter value (Gilles et al., 1997) is preferred. In the same study,Gilles et al. (1997) investigated the temperature dependence of the absorption crosssection at the peak of the 338.5 nm band over the range 204–388 K and found that it15
could be represented by the relationship σ338/10−17 cm2=3.29−(5.58×10⁻³) T .The preferred values given in the Table are the values of the cross-section aver-
2649

ACPD6, 2281–2702, 2006
Evaluated kinetic andphotochemical data
for atmosphericchemistry
R. Atkinson et al.
Title Page
Abstract Introduction
Conclusions References
Tables Figures
J I
J I
Back Close
Full Screen / Esc
Printer-friendly Version
Interactive Discussion
EGU
aged over 5 nm intervals reported by Cox et al. (1982), which are in good agreementwith those of Wahner et al. (1988) and Gilles et al. (1997). Cox et al. (1982) used theirdata to calculate a lifetime against solar photoexcitation of 30 s for a solar zenith angleof 30 degrees. Earlier studies are discussed in previous evaluations (CODATA, 1980,1984) .5
References
Cox, R. A., Sheppard, D. W., and Stevens, M. P.: J. Photochem., 19, 189, 1982.CODATA: 1980 (see references in Introduction).CODATA: Supplement II, 1984 (see references in Introduction).Gilles, M. K., Turnipseed, A. A., Burkholder, J. B., Ravishankara, A. R., and Solomon,10
S.: J. Phys. Chem. A, 101, 5526, 1997.Wahner, A., Ravishankara, A. R., Sander, S. P., and Friedl, R. R.: Chem. Phys. Lett.,152, 507, 1988.
2650

ACPD6, 2281–2702, 2006
Evaluated kinetic andphotochemical data
for atmosphericchemistry
R. Atkinson et al.
Title Page
Abstract Introduction
Conclusions References
Tables Figures
J I
J I
Back Close
Full Screen / Esc
Printer-friendly Version
Interactive Discussion
EGU
III.A5.115
OBrO + hν→ products
Primary photochemical processes
Reaction ∆H◦/kJ·mol−1 λthreshold/nm
OBrO + hν → Br + O2 (1) −52 –→ BrO + O(3P) (2) 205 584
Absorption cross-section data5
Wavelength range/nm Reference Comments
400–600 Rattigan et al., 1994 (a)385–645 Miller et al., 1997 (b)390–630 Knight et al., 2000 (c)
Comments
(a) Bromine-sensitized photodecomposition of ozone at 380 nm to 480 nm. After sub-traction of absorbances due to O3 and Br2, the residual spectrum consisted ofabsorption bands from 400 nm to 600 nm superimposed on a continuum, with a10
maximum absorption near 505 nm. This spectrum was attributed to OBrO be-cause of its strong resemblance to the OClO absorption spectrum. Because ab-solute amounts of OBrO were not determined, absolute absorption cross-sectionvalues were not estimated. The spectral features show clear signs of broadening
2651

ACPD6, 2281–2702, 2006
Evaluated kinetic andphotochemical data
for atmosphericchemistry
R. Atkinson et al.
Title Page
Abstract Introduction
Conclusions References
Tables Figures
J I
J I
Back Close
Full Screen / Esc
Printer-friendly Version
Interactive Discussion
EGU
as T was increased from 273 K to 339 K, indicating temperature dependence ofcross sections in the bands.
(b) Molecular bromine and products of an O2–He discharge flowed through an ab-sorption cell at 250 K. Strong OBrO signals were observed after pumping on thecondensate collected on the cell walls. An experimental and theoretical analysis5
of the C(2A2)←X (2B1) absorption spectrum from 385 nm to 645 nm is presented,and a complete set of transition energies and assignments is given. Because ab-solute amounts of OBrO were not determined, absolute absorption cross-sectionvalues were not derived.
(c) Products of a Br2–O2–He discharge flow were collected in a cold trap followed10
by evaporation at warmer temperatures. OBrO concentrations were determinedby chemical titration with excess NO yielding NO2+BrO, with quantitative mea-surement of the NO2 product by UV absorption. Quantitative values of absorptioncross-sections are reported over the wavelength range 400 nm to 560 nm. Dur-ing this study another UV absorber, assumed to be an unspecified bromine oxide15
BrxOy, was observed to originate from this OBrO source.
2652

ACPD6, 2281–2702, 2006
Evaluated kinetic andphotochemical data
for atmosphericchemistry
R. Atkinson et al.
Title Page
Abstract Introduction
Conclusions References
Tables Figures
J I
J I
Back Close
Full Screen / Esc
Printer-friendly Version
Interactive Discussion
EGU
Preferred Values
Absorption cross-sections of OBrO at 298 K.
n (n,0,0)← (0,0,0) (n,1,0)← (0,0,0)λ/nm 1017σ/cm2 λ/nm 1017σ/cm2
0 630.4 – 622.0 –1 606.1 – 598.4 –2 583.8 – 576.8 –3 563.4 1.08 556.8 1.354 544.4 1.45 538.5 1.745 527.1 1.64 521.6 1.916 510.7 1.77 505.5 1.967 495.5 1.72 490.7 1.768 481.2 1.67 476.9 1.519 468.2 1.44 464.1 1.2610 455.8 1.21 452.2 0.9611 444.4 1.02 440.8 0.7212 433.7 0.79 430.4 0.4913 423.5 0.57 420.6 0.3114 414.1 0.40 411.0 0.2215 405.1 0.26 402.3 0.1316 396.4 – 394.0 –17 388.3 – – –
Comments on Preferred Values
The preferred cross-section values are taken from the study of Knight et al. (2000).5
This is the only study in which the concentration of OBrO was quantatively determined,
2653

ACPD6, 2281–2702, 2006
Evaluated kinetic andphotochemical data
for atmosphericchemistry
R. Atkinson et al.
Title Page
Abstract Introduction
Conclusions References
Tables Figures
J I
J I
Back Close
Full Screen / Esc
Printer-friendly Version
Interactive Discussion
EGU
thereby allowing the derivation of absolute absorption cross-section values. The uncer-tainty in these values is estimated to be ±30%. The transition assignments are thosereported by Miller et al. (1997). No quantum yield data are available. However, thethreshold for photodissociation to yield BrO+O(3P) lies well beyond the wavelength ofmaximum absorption in the C(2A2)←X (2B1) envelope. By analogy with OClO efficient5
photodissociation via Reaction (2) is expected to occur at λ<550 nm. The possibil-ity of dissociation via Reaction (1) at longer wavelengths cannot be ruled out, but itscontribution is expected to be minor if the analogy with OClO is used.
References
Knight, G., Ravishankara, A. R., and Burkholder, J. B.: J. Phys. Chem. A, 104, 11121,10
2000.Miller, C. E., Nickolaisen, S. L., Francisco, J. S., and Sander, S. P.: J. Chem. Phys.,107, 2300, 1997.Rattigan, O. V., Jones, R. L., and Cox, R. A.: Chem. Phys. Lett., 230, 121, 1994.
15
2654

ACPD6, 2281–2702, 2006
Evaluated kinetic andphotochemical data
for atmosphericchemistry
R. Atkinson et al.
Title Page
Abstract Introduction
Conclusions References
Tables Figures
J I
J I
Back Close
Full Screen / Esc
Printer-friendly Version
Interactive Discussion
EGU
III.A5.116
BrONO2 + hν→ products
Primary photochemical processes
Reaction ∆H◦/kJ·mol−1 λthreshold/nm
BrONO2 + hν → BrO + NO2 (1) 106 1129→ Br + NO3 (2) 139 861→ Br + NO + O2 (3) 155 772→ BrONO + O(3P) (4) 305 392→ Br + O(3P) + NO2 (5) 347 345→ BrO + NO + O(3P) (6) 412 290→ BrONO + O(1D) (7) 496 240
Absorption cross-section data5
Wavelengthrange/nm
Reference Comments
200–500 Burkholder et al., 1995 (a)208–500 Deters et al., 1998 (b)
2655

ACPD6, 2281–2702, 2006
Evaluated kinetic andphotochemical data
for atmosphericchemistry
R. Atkinson et al.
Title Page
Abstract Introduction
Conclusions References
Tables Figures
J I
J I
Back Close
Full Screen / Esc
Printer-friendly Version
Interactive Discussion
EGU
Quantum yield data
Measurement Wavelength /nm Reference Comments
Φ2 = 0.28 ± 0.09 248 Harwood et al., 1998 (c)Φ2 = 1.01 ± 0.35 308Φ2 = 0.92 ± 0.43 325.5
Comments
(a) Absorption spectra were measured at a resolution of ∼0.5 nm in a 100 cm pathlength cell, thermostatted to ±1 K. Relative cross-sections were obtained at 298,5
250, and 220 K and placed on an absolute basis by determinations of the abso-lute cross-section at 330 nm at temperatures of 298 K, 273 K, 250 K, and 235 K.The concentrations of BrONO2 were determined by pressure measurements andcorrections were made to the absorption and concentration measurements for anumber of impurities, particularly Br2.10
(b) Spectra were recorded at 0.23–0.46 nm resolution using a flowing system witha multipass absorption cell of 270 cm optical path length coupled to a spectro-graph and multichannel analyser. BrONO2 concentrations were determined byphotolysis of BrONO2-Br2 mixtures to completion, and measurement of the Br2concentrations by optical absorption at wavelengths >500 nm. Absorption cross-15
sections for BrONO2 were obtained at 298 K and 230 K.
(c) Excimer laser photolysis at 248 nm, 308 nm, and 325.5 nm of flowing mixtures ofBrONO2 and N2 or O2. [NO3] was monitored by time resolved diode laser ab-sorption at 661.9 nm. The laser fluence was calibrated by N2O5 photolysis andBrONO2 and N2O5 concentrations were determined by UV absorption. The mea-20
sured quantum yields were pressure independent over the range 200–790 mbar.
2656

ACPD6, 2281–2702, 2006
Evaluated kinetic andphotochemical data
for atmosphericchemistry
R. Atkinson et al.
Title Page
Abstract Introduction
Conclusions References
Tables Figures
J I
J I
Back Close
Full Screen / Esc
Printer-friendly Version
Interactive Discussion
EGU
Preferred Values
Absorption cross-sections of BrONO2 at 298 K and 230 K.
λ/nm 1020σ/cm2 1020σ/cm2 λ/nm 1020σ/cm2 1020σ/cm2
298 K 230 K 298 K 230 K
200 680 553 355 6.52 6.62205 520 447 360 5.99 6.07210 361 345 365 5.43 5.51215 292 294 370 4.89 4.94220 256 265 375 4.35 4.40225 230 241 380 3.85 3.84230 205 215 385 3.37 3.34235 175 182 390 2.97 2.91240 140 143 395 2.59 2.52245 106 106 400 2.28 2.21250 79.7 77.2 405 2.01 1.96255 60.0 57.0 410 1.81 1.76260 47.1 44.0 415 1.65 1.63265 38.9 36.1 420 1.50 1.51270 33.8 31.3 425 1.38 1.43275 30.5 28.3 430 1.29 1.36280 27.9 26.2 435 1.20 1.29285 25.6 24.3 440 1.11 1.20290 23.2 22.5 445 1.03 1.12295 20.8 20.6 450 0.928 1.01300 18.6 18.8 455 0.831 0.893
5
2657

ACPD6, 2281–2702, 2006
Evaluated kinetic andphotochemical data
for atmosphericchemistry
R. Atkinson et al.
Title Page
Abstract Introduction
Conclusions References
Tables Figures
J I
J I
Back Close
Full Screen / Esc
Printer-friendly Version
Interactive Discussion
EGU
λ/nm 1020σ/cm2 1020σ/cm2 λ/nm 1020σ/cm2 1020σ/cm2
298 K 230 K 298 K 230 K
305 16.5 17.0 460 0.742 0.785310 14.5 15.2 465 0.652 0.664315 12.7 13.4 470 0.566 0.492320 11.3 11.8 475 0.461 0.431325 10.2 10.4 480 0.392 0.329330 9.32 9.50 485 0.397 0.240335 8.62 8.79 490 0.249 0.167340 8.06 8.18 495 0.207 0.105345 7.57 7.66 500 0.150 0.062350 7.01 7.12
Quantum Yields at 298 K.
λ/nm φ2
248 0.28308 1.0325.5 0.92
Comments on Preferred Values
Our previous recommendations (IUPAC, 1997) for the absorption cross sections5
were taken from the study of Spencer and Rowland (1978) which were limited to thewavelength range 186–390 nm. The more recent studies of Burkholder et al. (1995)and Deters et al. (1998) extend the range to 500 nm and cover the temperature range220–298 K. At 298 K there is good agreement among the three studies; our preferredvalues are a mean of the values from Burkholder et al. (1995) and Deters et al. (1998).10
2658

ACPD6, 2281–2702, 2006
Evaluated kinetic andphotochemical data
for atmosphericchemistry
R. Atkinson et al.
Title Page
Abstract Introduction
Conclusions References
Tables Figures
J I
J I
Back Close
Full Screen / Esc
Printer-friendly Version
Interactive Discussion
EGU
There is less good agreement between the studies of Burkholder et al. (1995) andDeters et al. (1998) on the temperature dependence of the absorption coefficients. At230 K values of σ obtained in the two studies (Burkholder et al., 1995; Deters et al.,1998) agree in the range 200–300 nm but differ by up to 25% in the range 300–500 nm,and whereas Burkholder et al. (1995) find a small decrease in σ in going from 298 K to5
230 K, over most of the wavelength range, Deters et al. (1998) find an increase. Thepreferred values at 230 K are a mean of the values from Burkholder et al. (1995) andDeters et al. (1998).
The only quantum yield measurements are those of Harwood et al. (1998) whodetermined the NO3 quantum yield at 248, 308, and 325.5 nm, and also gave estimates10
of the Br and BrO quantum yields. Their values for the NO3 quantum yields are adoptedas our preferred values.
References
Burkholder, J. B., Ravishankara, A. R., and Solomon, S.: J. Geophys. Res., 100,16 793, 1995.15
Deters, B., Burrows, J. P., and Orphal, J.: J. Geophys. Res., 103, 3563, 1998.Harwood, M. H., Burkholder, J. B., and Ravishakara, A. R.: J. Phys. Chem. A, 102,1309, 1998.IUPAC: Supplement V, 1997 (see references in Introduction).Spencer, J. E. and Rowland, F. S.: J. Phys. Chem., 82, 7, 1978.20
2659

ACPD6, 2281–2702, 2006
Evaluated kinetic andphotochemical data
for atmosphericchemistry
R. Atkinson et al.
Title Page
Abstract Introduction
Conclusions References
Tables Figures
J I
J I
Back Close
Full Screen / Esc
Printer-friendly Version
Interactive Discussion
EGU
III.A5.117
BrCl + hν→ products
Primary photochemical transitions
Reaction ∆H /kJ·mol−1 λthreshold/nm
BrCl + hν → Cl + Br 219 546→ Cl(2P1/2) + Br 229 521→ Cl + Br(2P1/2) 263 454
Absorption cross-section data5
Wavelength range/nm Reference Comments
220–510 Seery and Britton, 1964 (a)200–600 Maric et al., 1994 (b)190–560 Hubinger and Nee, 1995 (c)
The two most recent spectra (see Comments b and c) may be conveniently com-pared in a data base coordinated by A. Nolle, (UV/VIS Spectra of Atmospheric Con-stituents, Version 1, 1999) and administered by DLR (Deutsches Zentrum fur Luft-undRaumfahrt e.V., ATMOS User Center DFD-AUC, http://auc.dfd.dlr.de/).10
Comments
(a) The authors used the same apparatus for the BrCl absorption cross sectionsat three different Cl2/Br2 mixing ratios as for the measurements of both the Cl2
2660
ACPD6, 2281–2702, 2006
Evaluated kinetic andphotochemical data
for atmosphericchemistry
R. Atkinson et al.
Title Page
Abstract Introduction
Conclusions References
Tables Figures
J I
J I
Back Close
Full Screen / Esc
Printer-friendly Version
Interactive Discussion
EGU
and Br2 cross sections and an equilibrium constant KBrCl=8.1 for the equilibriumCl2+Br2↔2BrCl (Evans et al., 1955). The resulting cross sections are slightlyhigher than the recommended value.
(b) The equilibrium constant KBrCl as well as the absorption spectrum of BrCl havebeen measured using twelve different Cl2/Br2 mixing ratios in nine overlapping5
spectral ranges of about 70 nm spectral width resulting in a spectral resolution of0.2 nm. At least ten independent spectra were recorded at different total pressures(Cl2, Br2 and BrCl). The interference from a pressure-dependent component ofthe Br2 vapor was negligible under the chosen experimental conditions. The valueof KBrCl was iteratively adjusted until minimum deviation occurred between the10
observed and calculated absorption spectrum of BrCl in all the regions of overlap:KBrCl=10.1±1.1 at 298 K leads to a third law value of ∆H◦f=14.31 kJ/mol.
(c) Mixtures of Cl2 and Br2 in 670 mbar of Ar were prepared in an evacuable gas flowline. The equilibrium concentrations have been obtained using KBrCl=6.4 (Mattrawet al., 1954). The low pressures used in the present study (0.2 to 12.0 mbar) min-15
imized the interference of Br2 dimers. The limit to the red at λ>500 nm is given byinstrument noise. Graphical comparison between the measured spectrum and theresults from the literature (Seery and Britton, 1964; Maric et al., 1994) shows onlyminor differences. The BrCl spectrum was deconvoluted using a semi-logarithmicgaussian distribution function into four components with maxima at 228.33 (UV20
band), 376.39 (C1Π1), 454.92 (B3Π+0 ) and 533.05 nm (A3Π1).
No Quantum Yield Data available.
2661

ACPD6, 2281–2702, 2006
Evaluated kinetic andphotochemical data
for atmosphericchemistry
R. Atkinson et al.
Title Page
Abstract Introduction
Conclusions References
Tables Figures
J I
J I
Back Close
Full Screen / Esc
Printer-friendly Version
Interactive Discussion
EGU
Absorption cross-sections of BrCl at 298 K.
λ/nm 1020σ/cm2 λ/nm 1020σ/cm2
200 2.95 410 22.39210 4.27 420 17.78220 6.31 430 14.45230 6.61 440 12.59240 5.62 450 10.72250 4.07 460 9.33260 5.50 470 7.94270 1.29 480 6.31280 0.66 490 5.01290 0.39 500 3.39300 0.56 510 2.63310 1.51 520 1.66320 4.07 530 1.10330 9.12 540 0.66340 17.00 550 0.41350 28.18 560 0.25360 34.67 570 0.144370 41.69 580 0.832380 39.81 590 0.0479390 33.88 600 0.0251400 28.18
Comments on Preferred Values
The data of Maric et al. (1994) are recommended because it is the most compre-hehsive data set to date available which is internally consistent using an equilibrium5
2662

ACPD6, 2281–2702, 2006
Evaluated kinetic andphotochemical data
for atmosphericchemistry
R. Atkinson et al.
Title Page
Abstract Introduction
Conclusions References
Tables Figures
J I
J I
Back Close
Full Screen / Esc
Printer-friendly Version
Interactive Discussion
EGU
constant KBrCl=10.1±1.1 at 298 K which is measured in the same study. The absorp-tion cross sections of BrCl agree in the regions of overlap between the spectral frag-ments to better than ±2%, and it is estimated that the accuracy is better than ±3%in the range λ=200–550 nm. In the range 550–600 nm the agreement between spec-tral fragments is better than ±15% for an overall accuracy in this range of better than5
±20%. Spectral deconvolution in terms of three contributing bands with maxima at227.6, 372.5 and 442.4 nm has been obtained. Combining the values of σBrCl with theresults of Sulzer and Wieland (1952) obtains the temperature and wavelength depen-dence of the UV/Vis absorption spectrum of BrCl. A quantum yield of unity for thedissociation of BrCl is expected.10
References
Evans, W. H., Munson, T. R., and Wagman, D. D.: J. Res. Natl. Bur. Std., 55, 147,1955.Hubinger, S. and Nee, J. B.: J. Photochem. Photobiol. A. Chem., 86, 1, 1995.Maric, D., Burrows, J. P., and Moortgat, G. K.: J. Photochem. Photobiol. A. Chem., 83,15
179, 1994.Mattraw, H. C., Packucki, C. F., and Hawkings, N. J.: J. Chem. Phys., 22, 1117, 1954.Seery, D. J. and Britton, D.: J. Phys. Chem., 68, 2263, 1964.Sulzer, P. and Wieland, K.: Helv. Phys. Acta, 25, 653, 1952.
20
2663
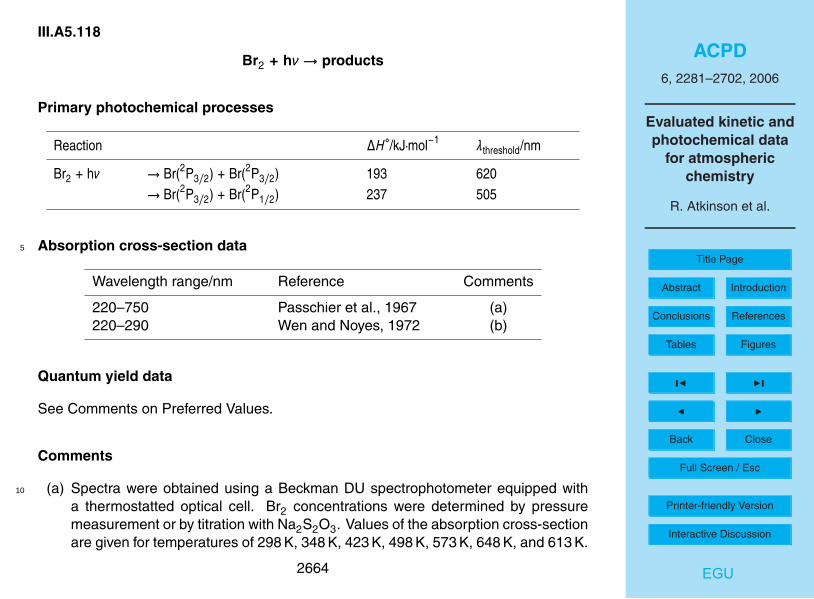
ACPD6, 2281–2702, 2006
Evaluated kinetic andphotochemical data
for atmosphericchemistry
R. Atkinson et al.
Title Page
Abstract Introduction
Conclusions References
Tables Figures
J I
J I
Back Close
Full Screen / Esc
Printer-friendly Version
Interactive Discussion
EGU
III.A5.118
Br2 + hν→ products
Primary photochemical processes
Reaction ∆H◦/kJ·mol−1 λthreshold/nm
Br2 + hν → Br(2P3/2) + Br(2P3/2) 193 620→ Br(2P3/2) + Br(2P1/2) 237 505
Absorption cross-section data5
Wavelength range/nm Reference Comments
220–750 Passchier et al., 1967 (a)220–290 Wen and Noyes, 1972 (b)
Quantum yield data
See Comments on Preferred Values.
Comments
(a) Spectra were obtained using a Beckman DU spectrophotometer equipped with10
a thermostatted optical cell. Br2 concentrations were determined by pressuremeasurement or by titration with Na2S2O3. Values of the absorption cross-sectionare given for temperatures of 298 K, 348 K, 423 K, 498 K, 573 K, 648 K, and 613 K.
2664

ACPD6, 2281–2702, 2006
Evaluated kinetic andphotochemical data
for atmosphericchemistry
R. Atkinson et al.
Title Page
Abstract Introduction
Conclusions References
Tables Figures
J I
J I
Back Close
Full Screen / Esc
Printer-friendly Version
Interactive Discussion
EGU
In the wavelength range 200–240 nm the measured cross sections are pressuredependent, attributed to Br4 formation. From the pressure dependences, valuesof the absorption cross sections for Br4 and Br2 were derived in the range 200–230 nm.
(b) Spectra were obtained with a Beckman DU spectrophotometer equipped with a5
cell of optical path length 9.8 cm and thermostatted to 303 K. Br2 concentrationswere derived by pressure measurements. Deviations from Beer’s Law which wereobserved, and attributed to Br4 formation, were used to study the equilibriumbetween Br2 and Br4 and to derive values of σ(Br2) corrected for Br4 absorption.
2665

ACPD6, 2281–2702, 2006
Evaluated kinetic andphotochemical data
for atmosphericchemistry
R. Atkinson et al.
Title Page
Abstract Introduction
Conclusions References
Tables Figures
J I
J I
Back Close
Full Screen / Esc
Printer-friendly Version
Interactive Discussion
EGU
Preferred Values
Absorption cross-sections of Br2 at 298 K.
λ/nm 1020σ/cm2 λ/nm 1020σ/cm2
200 0.562 350 3.48205 0.723 355 5.63210 0.870 360 8.65215 0.983 365 12.7220 1.04 370 17.8225 1.06 375 23.9230 1.01 380 30.7235 0.925 385 37.9240 0.808 390 45.1245 0.676 395 51.8250 0.543 400 57.4255 0.422 405 61.6260 0.316 410 64.2
2666

ACPD6, 2281–2702, 2006
Evaluated kinetic andphotochemical data
for atmosphericchemistry
R. Atkinson et al.
Title Page
Abstract Introduction
Conclusions References
Tables Figures
J I
J I
Back Close
Full Screen / Esc
Printer-friendly Version
Interactive Discussion
EGU
λ/nm 1020σ/cm2 λ/nm 1020σ/cm2
265 0.229 415 65.1270 0.161 420 67.7275 0.180 425 60.8280 0.0728 430 60.1285 0.0471 435 57.1290 0.02398 440 54.0295 0.0188 445 51.2300 0.0124 450 48.7305 0.0101 455 46.7310 0.0135 460 45.1315 0.0274 465 43.8320 0.0626 470 42.8325 0.141 475 41.7330 0.299 480 40.3335 0.602 485 38.6340 1.14 490 36.6345 2.05 495 34.3
500 31.8
Quantum yields
See Comments on Preferred Values.
Comments on Preferred Values
Maric et al. (1994) have evaluated the available absorption cross section data for5
Br2 and have fitted the most reliable data to an expression giving σ over the range
2667

ACPD6, 2281–2702, 2006
Evaluated kinetic andphotochemical data
for atmosphericchemistry
R. Atkinson et al.
Title Page
Abstract Introduction
Conclusions References
Tables Figures
J I
J I
Back Close
Full Screen / Esc
Printer-friendly Version
Interactive Discussion
EGU
200–600 nm as the sum of four terms each representing the contribution to σ of one ofthe separate overlapping absorption bands of the spectrum. The data sets selected byMaric et al. (1994) were those of Passchier et al. (1967) and of Wen and Noyes (1972),which cover the whole wavelength range, are in excellent agreement and make dueallowance for the deviations from Beer’s Law which are observed in the 200–300 nm5
region, attributed to Br4 formation. The findings of Maric et al. (1994) are accepted andour preferred values for the absorption cross-section at 298 K are calculated from theexpression which they derived. They have also derived an extension of their expressionfor use at other temperatures.
In a more recent study covering the range 190–600 nm, Hubinger and Nee (1995)10
have obtained values of σ in excellent agreement with the expression of Maric etal. (1994) except in the 270–330 nm region where absorption cross-sections are smalland only upper limits could be given.
At wavelengths longer than ∼510 nm the spectrum consists of a banded regionoverlapping a continuum. High resolution spectroscopic studies (Zaraga et al., 1976;15
Hemenway et al., 1979) indicate rather smaller values for the contribution of the con-tinuum absorption at long wavelengths than predicted by the expression of Maric etal. (1994).
Absorption of radiation in the range 200–510 nm is expected to lead tobond rupture with unit quantum efficiency, giving two ground state Br atoms or20
Br(2P3/2)+Br(2P1/2), as confirmed by photofragment spectroscopic studies (Busch etal., 1969; Lindeman and Wiesenfeld, 1979). There are no direct measurements of thequantum yield but in a study of the photoinitiated bromination of ethene Kistiakowskyand Sternberg (1953) showed that the quantum yield of Br production is approximatelyindependent of wavelength in the range 480–680 nm.25
2668
ACPD6, 2281–2702, 2006
Evaluated kinetic andphotochemical data
for atmosphericchemistry
R. Atkinson et al.
Title Page
Abstract Introduction
Conclusions References
Tables Figures
J I
J I
Back Close
Full Screen / Esc
Printer-friendly Version
Interactive Discussion
EGU
References
Busch, G. E., Mahoney, R. T., Morse, R. J., and Wilson, K. R.: J. Chem. Phys., 51,837, 1969.Hemenway, C. P., Lindeman, T. G., and Wiesenfeld, J. R.: J. Chem. Phys., 70, 3560,1979.5
Hubinger, S. and Nee, J. B.: J. Photochem. Photobiol. A. Chem., 86, 1, 1995.Kistiakowsky, G. B. and Sternberg, J. C.: J. Chem. Phys. 21, 2218, 1953.Lindeman, T. G. and Wiesenfeld, J. R.: J. Chem. Phys., 70, 2882, 1979.Maric, D., Burrows, J. P., and Moortgat, G. K.: J. Photochem. Photobiol A. Chem., 83,179, 1994.10
Passchier, A. A., Christian, J. D., and Gregory, N. W.: J. Phys. Chem., 71, 937, 1967.Wen, W. Y. and Noyes, R. M.: J. Phys. Chem., 76, 1017, 1972.Zaraga, F., Nogar, N. S., and Moore, C. B.: J. Mol. Spectrosc., 63, 564, 1976.
2669

ACPD6, 2281–2702, 2006
Evaluated kinetic andphotochemical data
for atmosphericchemistry
R. Atkinson et al.
Title Page
Abstract Introduction
Conclusions References
Tables Figures
J I
J I
Back Close
Full Screen / Esc
Printer-friendly Version
Interactive Discussion
EGU
III.A5.119
HI + hν→ products
Primary photochemical processes
Reaction ∆H◦/kJ·mol−1 λthreshold/nm
HI + hν → H + I 298 401
2670

ACPD6, 2281–2702, 2006
Evaluated kinetic andphotochemical data
for atmosphericchemistry
R. Atkinson et al.
Title Page
Abstract Introduction
Conclusions References
Tables Figures
J I
J I
Back Close
Full Screen / Esc
Printer-friendly Version
Interactive Discussion
EGU
Preferred Values
Absorption cross-sections for HI at 298 K
λ/nm 1019σ/cm2 λ/nm 1019σ/cm2
190 4.8 255 4.0195 5.7 260 3.2200 6.5 265 2.4205 7.3 270 1.8210 7.9 275 1.3215 8.2 280 0.93220 8.4 285 0.63225 8.3 290 0.42230 7.9 295 0.27235 7.3 300 0.17240 6.6245 5.8250 4.9
Comments on Preferred Values5
HI has a continuous absorption spectrum with an onset at about 327 nm. Earliermeasurements of absorption cross-sections were reported by Goodeve and Taylor(1935) and Romand (1949). The preferred values are based on more recent mea-surements of Huebert and Martin (1968) between 180 and 300 nm and Ogilvie (1971)between 192 and 313 nm. The preferred values were represented by the expression10
σ = 8.39 × 10⁻¹⁹ exp[−(λ − 220.29)2/1621.29]
2671

ACPD6, 2281–2702, 2006
Evaluated kinetic andphotochemical data
for atmosphericchemistry
R. Atkinson et al.
Title Page
Abstract Introduction
Conclusions References
Tables Figures
J I
J I
Back Close
Full Screen / Esc
Printer-friendly Version
Interactive Discussion
EGU
where λ is in units of nm and σ is in units of cm2.
Which fits very well the data of Huebert and Martin (1968) and Ogilvie (1971) over thewavelength range 190–300 nm in good agreement with determinations by Campuzano-Jost and Crowley (1999). The primary photochemical process forms H and I atoms5
with a quantum yield of about unity at 185 and 254 nm (Martin and Williard, 1964).The branching ratio for production of I(2P1/2) and I(2P3/2) was measured in Langfordet al. (1998) as a function of the wavelength between 190 and 305 nm.
References
Campuzano-Jost, P. and Crowley, J. N.: J. Phys. Chem. A, 103, 2712, 1999.10
Goodeve, C. F. and Taylor, A. W. C.: Proc. Roy. Soc. A, 152, 221, 1935.Huebert, B. J. and Martin, R. M.: J. Phys. Chem., 72, 3046, 1968.Langford, S. R., Regan, P. M., Orr-Ewing, A. J., and Ashfold, M. N. R.: Chem. Phys.,231, 245, 1998.Martin, R. M. and Williard, J. E.: J. Chem. Phys., 40, 2999, 1964.15
Ogilvie, J. F.: Trans. Faraday Soc., 67, 2205, 1971.Romand, J.: Ann. Phys. (Paris), 4, 527, 1949.
2672

ACPD6, 2281–2702, 2006
Evaluated kinetic andphotochemical data
for atmosphericchemistry
R. Atkinson et al.
Title Page
Abstract Introduction
Conclusions References
Tables Figures
J I
J I
Back Close
Full Screen / Esc
Printer-friendly Version
Interactive Discussion
EGU
III.A5.120
HOI + hν→ products
Primary photochemical processes
Reaction ∆H◦/kJ·mol−1 λthreshold/nm
HOI + hν → HO + I (1) 216 554→ HI + O(3P) (2) 345 347→ IO + H (3) 404 296→ HI + O(1D) (4) 535 224
Absorption cross-section data5
Wavelength range/nm Reference Comments
280–500 Bauer et al., 1998 (a)278–494 Rowley et al., 1999 (b)
Comments
(a) Laser photolysis of H2O at 248 nm was used to produce HO radicals in the pres-ence of I2, and hence to produce HOI in situ. Absorptions were measured by agated diode array, and at selected wavelengths by a photomultiplier. The HOI con-10
centration was determined from the instantaneous I2 loss. The spectrum consistsof two unstructured bands at 340.4 nm [σmax=(3.85±0.4)×10−19 cm2 molecule−1]and 406.4 nm [σmax=(3.30±0.3)×10−19 cm2 molecule−1].
2673

ACPD6, 2281–2702, 2006
Evaluated kinetic andphotochemical data
for atmosphericchemistry
R. Atkinson et al.
Title Page
Abstract Introduction
Conclusions References
Tables Figures
J I
J I
Back Close
Full Screen / Esc
Printer-friendly Version
Interactive Discussion
EGU
(b) Same technique as in comment (a). Some irreproducibility in the406 nm band was tentatively attributed to I2O formation. Crosssections of σmax=3.99×10⁻¹⁹ cm2 molecule−1 at 338.4 nm andσmax=2.85×10⁻¹⁹ cm2 molecule−1 at 404.8 nm were obtained.
Quantum yield data5
Quantum yield Wavelength/nm Reference Comments
φ (1) = 1.05 ± 0.13 355 Bauer et al., 1998 (a)
(a) HOI was produced by pulsed laser photolysis of HNO3 at 248 nm to produce HOradicals in the presence of I2. A second 355 nm laser pulse interrogated theHOI produced and the photofragment product HO was observed by resonancefluorescence. Fresh reactants were introduced at each laser pulse. The quantity10
{σHOIφ(HO)HOI} at 355 nm was determined which, with the measured value of σ(see above), gave the cited value of φ.
2674

ACPD6, 2281–2702, 2006
Evaluated kinetic andphotochemical data
for atmosphericchemistry
R. Atkinson et al.
Title Page
Abstract Introduction
Conclusions References
Tables Figures
J I
J I
Back Close
Full Screen / Esc
Printer-friendly Version
Interactive Discussion
EGU
Preferred Values
Absorption cross-sections of HOI at 295 K
λ/nm 1019σ/cm2 λ/nm 1019σ/cm2
280 0.0077 390 2.66285 0.0226 395 2.98290 0.0589 400 3.22295 0.137 405 3.32300 0.286 410 3.27305 0.541 415 3.07310 0.926 420 2.75315 1.45 425 2.35320 2.07 430 1.92325 2.72 435 1.50330 3.29 440 1.13335 3.70 445 0.813340 3.85 450 0.563345 3.77 455 0.376350 3.47 460 0.242355 3.04 465 0.150360 2.58 470 0.0904365 2.21 475 0.0525370 1.98 480 0.0296375 1.94 485 0.0161380 2.07 490 0.0086385 2.33
2675

ACPD6, 2281–2702, 2006
Evaluated kinetic andphotochemical data
for atmosphericchemistry
R. Atkinson et al.
Title Page
Abstract Introduction
Conclusions References
Tables Figures
J I
J I
Back Close
Full Screen / Esc
Printer-friendly Version
Interactive Discussion
EGU
Quantum Yields
φ(1) = 1.0 in the wavelength range 280–490 nm.
Comments on Preferred Values
The recommended values for the cross-sections are those given by Bauer et5
al. (1998). The data of Rowley et al. (1999) are in good agreement with the excep-tion of some systematically higher values in the 405 nm band.
References
Bauer, D., Ingham, T., Carl, S. A., Moortgat, G. K., and Crowley, J. N.: J. Phys. Chem.A., 102, 2857, 1998.10
Rowley, D. M., Mossinger, J. C., Cox, R. A., and Jones, R. L.: J. Atmos. Chem., 34,137, 1999.
2676

ACPD6, 2281–2702, 2006
Evaluated kinetic andphotochemical data
for atmosphericchemistry
R. Atkinson et al.
Title Page
Abstract Introduction
Conclusions References
Tables Figures
J I
J I
Back Close
Full Screen / Esc
Printer-friendly Version
Interactive Discussion
EGU
III.A5.121
IO + hν→ products
Primary photochemical processes
Reaction ∆H◦/kJ·mol−1 λthreshold/nm
IO + hν → I + O(3P) (1) 240 500→ I + O(1D) (2) 430 280
Absorption cross-section data5
Wavelength range/nm Reference Comments
427.2 Sander, 1986 (a)340–450 Laszlo et al., 1995 (b)340–480 Harwood et al., 1997 (c)345–465 Atkinson et al., 1999 (e)345–465 Bloss et al., 2001 (d)
Quantum yield data
Measurement Wavelength/nm Reference Comments
φ1 > 0.09±0.190.26 355 Ingham et al., 2000 (f)
2677
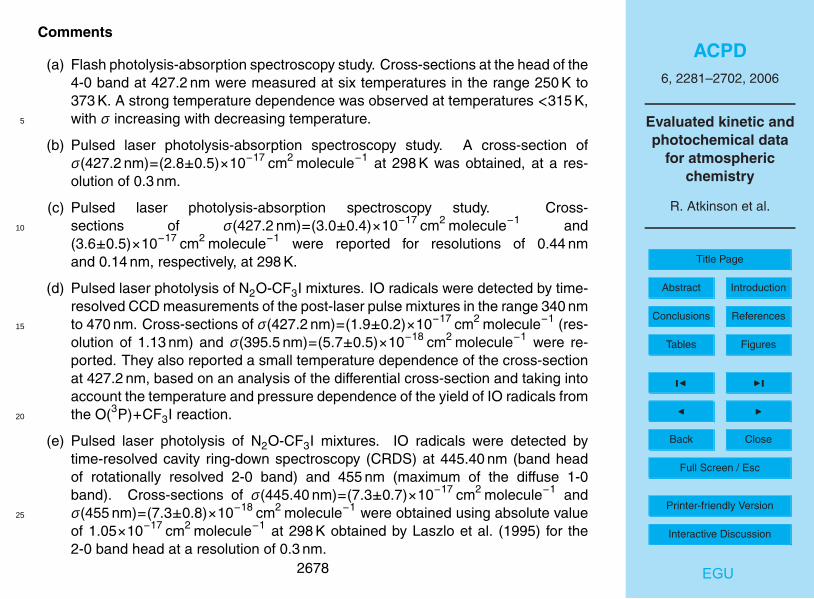
ACPD6, 2281–2702, 2006
Evaluated kinetic andphotochemical data
for atmosphericchemistry
R. Atkinson et al.
Title Page
Abstract Introduction
Conclusions References
Tables Figures
J I
J I
Back Close
Full Screen / Esc
Printer-friendly Version
Interactive Discussion
EGU
Comments
(a) Flash photolysis-absorption spectroscopy study. Cross-sections at the head of the4-0 band at 427.2 nm were measured at six temperatures in the range 250 K to373 K. A strong temperature dependence was observed at temperatures <315 K,with σ increasing with decreasing temperature.5
(b) Pulsed laser photolysis-absorption spectroscopy study. A cross-section ofσ(427.2 nm)=(2.8±0.5)×10−17 cm2 molecule−1 at 298 K was obtained, at a res-olution of 0.3 nm.
(c) Pulsed laser photolysis-absorption spectroscopy study. Cross-sections of σ(427.2 nm)=(3.0±0.4)×10−17 cm2 molecule−1 and10
(3.6±0.5)×10−17 cm2 molecule−1 were reported for resolutions of 0.44 nmand 0.14 nm, respectively, at 298 K.
(d) Pulsed laser photolysis of N2O-CF3I mixtures. IO radicals were detected by time-resolved CCD measurements of the post-laser pulse mixtures in the range 340 nmto 470 nm. Cross-sections of σ(427.2 nm)=(1.9±0.2)×10−17 cm2 molecule−1 (res-15
olution of 1.13 nm) and σ(395.5 nm)=(5.7±0.5)×10−18 cm2 molecule−1 were re-ported. They also reported a small temperature dependence of the cross-sectionat 427.2 nm, based on an analysis of the differential cross-section and taking intoaccount the temperature and pressure dependence of the yield of IO radicals fromthe O(3P)+CF3I reaction.20
(e) Pulsed laser photolysis of N2O-CF3I mixtures. IO radicals were detected bytime-resolved cavity ring-down spectroscopy (CRDS) at 445.40 nm (band headof rotationally resolved 2-0 band) and 455 nm (maximum of the diffuse 1-0band). Cross-sections of σ(445.40 nm)=(7.3±0.7)×10−17 cm2 molecule−1 andσ(455 nm)=(7.3±0.8)×10−18 cm2 molecule−1 were obtained using absolute value25
of 1.05×10⁻¹⁷ cm2 molecule−1 at 298 K obtained by Laszlo et al. (1995) for the2-0 band head at a resolution of 0.3 nm.
2678

ACPD6, 2281–2702, 2006
Evaluated kinetic andphotochemical data
for atmosphericchemistry
R. Atkinson et al.
Title Page
Abstract Introduction
Conclusions References
Tables Figures
J I
J I
Back Close
Full Screen / Esc
Printer-friendly Version
Interactive Discussion
EGU
(f) Pulsed laser photolysis (248 nm) of O3-I2 mixtures, with photolysis of IO radicalsby second laser pulse at 355 nm after a fixed time delay. O(3Pj ) detected by time-resolved RF. Quantum yield measured relative to NO2 photolysis at the samewavelength.
Preferred Values5
Absorption cross-sections for IO at 298 K.
λ/nm 1018σ/cm2 λ/nm 1018σ/cm2
345 0.78 410 7.53350 1.00 415 5.18355 1.36 420 9.04360 1.85 425 4.17365 2.25 430 6.11370 2.99 435 6.92375 3.57 440 1.61380 4.42 445 4.94385 4.63 450 1.02390 5.65 455 2.36395 6.55 460 0.90400 6.407 465 0.39405 7.09
2679

ACPD6, 2281–2702, 2006
Evaluated kinetic andphotochemical data
for atmosphericchemistry
R. Atkinson et al.
Title Page
Abstract Introduction
Conclusions References
Tables Figures
J I
J I
Back Close
Full Screen / Esc
Printer-friendly Version
Interactive Discussion
EGU
Quantum Yields
φ(1) = 1.0 throughout the wavelength range 345–465 nm.
Comments on Preferred Values
Absorption Cross-Sections. The measurements of the cross-sections at the band5
head of the 4-0 band at 427.2 nm by Laszlo et al. (1995), Harwood et al. (1997),Bloss et al. (2001) are in fairly good agreement when the effects of resolution aretaken into account. These data (Laszlo et al., 1995; Harwood et al., 1997; Atkin-son et al., 1999) suggest a slightly higher value than the earlier data of Sander(1986), Stickel et al. (1988) and Cox and Coker (1983). We recommend a value10
of σ(427.2 nm)=(3.6±0.3)×10−17 cm2 molecule−1 based on the measurements of Har-wood et al. (1997) for the 4-0 band at high resolution (0.14 nm). The information fromthe studies of Harwood et al. (1997) and also of Atkinson et al. (1999) at 298 K onthe IO band shape and cross section at high resolution can be used to calculate theexpected intensity and shape of the bands at lower resolution, which shows that the15
recent studies are consistent with this recommendation.The study of Laszlo et al. (1995) showed that the vibronic band structure is super-
imposed on a broad continuous absorption which maximizes at ∼400 nm. Other recentstudies (Harwood et al., 1997; Bloss et al., 2001) confirm the presence of the underly-ing continuum, which makes a significant contribution to atmospheric photolysis. Bloss20
et al. (2001) showed that IO absorption measurements in the 340 nm to 450 nm regioncan be influenced by the presence of an underlying absorption due to a product of theIO+IO reaction, and this was accounted for in their reported values for σ in the contin-uum region (Bloss et al., 2001). However Harwood et al. (1997) observed the samedecay kinetics when IO was monitored in the continuum region at 390 nm suggesting25
no interference due to product absorption. The agreement is good in the reported over-all shape of the IO absorption envelope in the continuum between 350–400 nm where
2680

ACPD6, 2281–2702, 2006
Evaluated kinetic andphotochemical data
for atmosphericchemistry
R. Atkinson et al.
Title Page
Abstract Introduction
Conclusions References
Tables Figures
J I
J I
Back Close
Full Screen / Esc
Printer-friendly Version
Interactive Discussion
EGU
resolution is unimportant, from the three studies. The absolute cross sections reportedby Bloss et al. (2001) in the continuum at 390 nm are a factor of 0.67 lower than thosefrom Laszlo et al. (1995) and Harwood et al. (1997). The preferred values for the IOcross-sections averaged over 5 nm intervals in the 345 nm to 465 nm are the valuesgiven by Bloss et al. (2001), scaled upwards by a factor of 1.5 to compensate for the5
lower resolution-independent value of σ(390 nm), obtained in this study.The temperature dependence of σ(427.2 nm) has been investigated by Sander
(1986), Harwood et al. (1997) and Bloss et al. (2001). The studies of Harwood etal. (1997) and Bloss et al. (2001) did not reproduce the large increase in σ with de-creasing temperature below 315 K observed by Sander (1986) although values of σ10
above 315 K are in good agreement (Sander, 1986; Harwood et al., 1997; Bloss et al.,2001). Bloss et al. (2001) found that the yield of IO from the O(3P)+CF3I reaction isapparently pressure and temperature dependent, and this was accounted for in deriv-ing their expression for the small temperature dependence of σ(427.2 nm). Harwood etal. (1997) assumed a constant yield of IO from the O(3P)+CF3I reaction which resulted15
in a temperature-independent cross-section σ at 427.2 nm. Since the temperature de-pendence is clearly quite small, cross-sections in the banded region at low resolutioncan be assumed to be temperature independent. Cross sections in the continuumregion are assumed to be temperature and resolution independent.
Quantum Yields. Turnipseed et al. (1995) observed LIF from the (0,0), (2,0), (3,0)20
and (2,1) bands of the A2Π3/2←X2Π3/2 transition of IO. The spectra are predissociatedand the dissociation lifetime is <10 ns (Inoue et al., 1983). The lifetime of the upperstate of IO formed in the A-X transition is thus so short that quenching, fluorescenceand processes other than dissociation by Reaction (1) must be negligible, and thereforethe predominant fate of IO following light absorption is dissociation to O+I. The mea-25
surement of Ingham et al. (2000) in the continuum at 355 nm confirms this conclusionfor that region.
2681

ACPD6, 2281–2702, 2006
Evaluated kinetic andphotochemical data
for atmosphericchemistry
R. Atkinson et al.
Title Page
Abstract Introduction
Conclusions References
Tables Figures
J I
J I
Back Close
Full Screen / Esc
Printer-friendly Version
Interactive Discussion
EGU
References
Atkinson, D . B., Hudgens, J. W., and Orr-Ewing, A. J.: J. Phys. Chem. A, 103, 6173,1999.Bloss, W. J., Rowley, D. M., Cox, R. A., and Jones, R. L.: J. Phys. Chem. A, 105,7840, 2001.5
Cox, R. A. and Coker, G. B.: J. Phys. Chem., 87, 4478, 1983.Harwood, M. H., Burkholder, J. B., Hunter, M., Fox, R. W., and Ravishankara, A. R.: J.Phys. Chem. A, 101, 853, 1997.Ingham, T., Cameron, M., and Crowley, J. N.: J. Phys. Chem. A, 104, 8001, 2000.Inoue, G., Suzuki, M., and Washida, N.: J. Chem. Phys., 79, 4730, 1983.10
Laszlo, B., Kurylo, M. J., and Huie, R. E.: J. Phys. Chem., 99, 11701, 1995.Sander, S. P.: J. Phys. Chem., 90, 2194, 1986.Stickel, R. E., Hynes, A. J., Bradshaw, J. D., Chameides, W. L., and Davis, D. D.: J.Phys. Chem., 92, 1862, 1988.Turnipseed, A. A., Gilles, M. K., Burkholder, J. B., and Ravishankara, A. R.: Chem.15
Phys. Lett., 242, 427, 1995.
2682

ACPD6, 2281–2702, 2006
Evaluated kinetic andphotochemical data
for atmosphericchemistry
R. Atkinson et al.
Title Page
Abstract Introduction
Conclusions References
Tables Figures
J I
J I
Back Close
Full Screen / Esc
Printer-friendly Version
Interactive Discussion
EGU
III.A5.122
OIO + hν→ products
Primary photochemical processes
Reaction ∆H◦/kJ·mol−1 λthreshold/nm
OIO + hν → I + O2 (1) 30 3987→ IO + O(3P) (2) 288 415
Absorption cross-section data5
Wavelength range/nm Reference Comments
465–667 Himmelmann et al., 1996 (a)549.1 Spietz et al., 1998 (b)548.6 Cox et al., 1999 (c)548.6 Ingham et al., 2000 (d)540–605 Ashworth et al., 2002 (e)
Quantum yield data (Φ = Φ1 + Φ1)
Measurement Wavelength/nm Reference Comments
Φ1 < 0.15 532 Ingham et al., 2000 (f)Φ2 < 0.007
2683
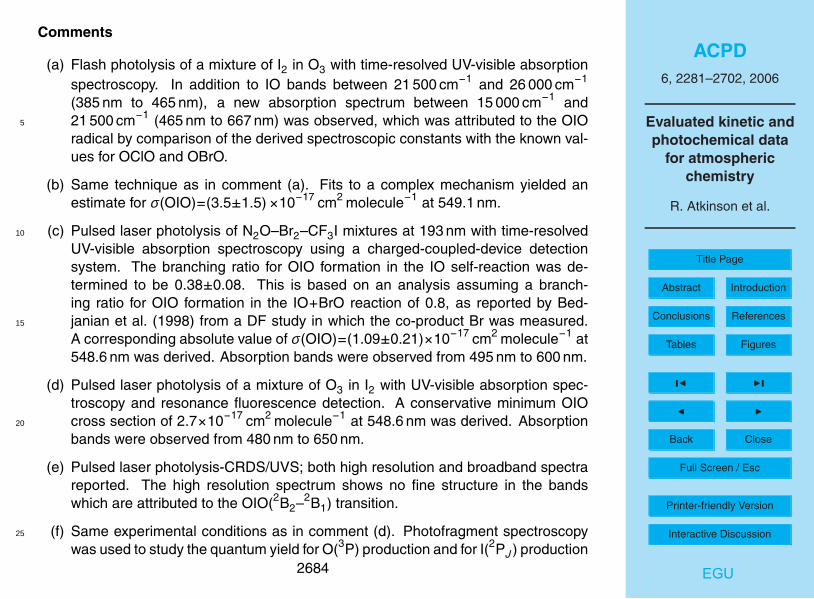
ACPD6, 2281–2702, 2006
Evaluated kinetic andphotochemical data
for atmosphericchemistry
R. Atkinson et al.
Title Page
Abstract Introduction
Conclusions References
Tables Figures
J I
J I
Back Close
Full Screen / Esc
Printer-friendly Version
Interactive Discussion
EGU
Comments
(a) Flash photolysis of a mixture of I2 in O3 with time-resolved UV-visible absorptionspectroscopy. In addition to IO bands between 21 500 cm−1 and 26 000 cm−1
(385 nm to 465 nm), a new absorption spectrum between 15 000 cm−1 and21 500 cm−1 (465 nm to 667 nm) was observed, which was attributed to the OIO5
radical by comparison of the derived spectroscopic constants with the known val-ues for OClO and OBrO.
(b) Same technique as in comment (a). Fits to a complex mechanism yielded anestimate for σ(OIO)=(3.5±1.5)×10−17 cm2 molecule−1 at 549.1 nm.
(c) Pulsed laser photolysis of N2O–Br2–CF3I mixtures at 193 nm with time-resolved10
UV-visible absorption spectroscopy using a charged-coupled-device detectionsystem. The branching ratio for OIO formation in the IO self-reaction was de-termined to be 0.38±0.08. This is based on an analysis assuming a branch-ing ratio for OIO formation in the IO+BrO reaction of 0.8, as reported by Bed-janian et al. (1998) from a DF study in which the co-product Br was measured.15
A corresponding absolute value of σ(OIO)=(1.09±0.21)×10−17 cm2 molecule−1 at548.6 nm was derived. Absorption bands were observed from 495 nm to 600 nm.
(d) Pulsed laser photolysis of a mixture of O3 in I2 with UV-visible absorption spec-troscopy and resonance fluorescence detection. A conservative minimum OIOcross section of 2.7×10⁻¹⁷ cm2 molecule−1 at 548.6 nm was derived. Absorption20
bands were observed from 480 nm to 650 nm.
(e) Pulsed laser photolysis-CRDS/UVS; both high resolution and broadband spectrareported. The high resolution spectrum shows no fine structure in the bandswhich are attributed to the OIO(2B2–2B1) transition.
(f) Same experimental conditions as in comment (d). Photofragment spectroscopy25
was used to study the quantum yield for O(3P) production and for I(2PJ ) production2684

ACPD6, 2281–2702, 2006
Evaluated kinetic andphotochemical data
for atmosphericchemistry
R. Atkinson et al.
Title Page
Abstract Introduction
Conclusions References
Tables Figures
J I
J I
Back Close
Full Screen / Esc
Printer-friendly Version
Interactive Discussion
EGU
following the photolysis of OIO at 532 nm. O(3P) was not detected, allowing theauthors to put an upper limit of ∼0.007 on the value of Φ2 at 532 nm. I(2PJ ) couldnot be detected in the single photon photolysis of OIO at 532 nm, and an upperlimit of ∼0.15 on the value of Φ1 was derived.
Preferred Values5
Absorption cross-sections
σ(OIO) = (2.7 ± 1.6) × 10−17 cm2 molecule−1 at λ = 548.6 nm
Quantum yields
Φ2 < 0.007 at 532 nm
Comments on Preferred Values10
The absorption spectrum of OIO in the strong visible absorption band between∼480 nm and 660 nm is well established, but there is considerable disagreement be-tween the absolute cross sections determined in the different studies, even when ex-perimental errors and the effects of instrument resolution are accounted for. The valuesat 548.6 nm range from (1.09±0.21)×10−17 cm2 to (3.5±1.5)×10−17 cm2. The preferred15
absorption cross section is the lower limit value from the study of Ingham et al. (2000)and represents a compromise between the high and low values reported. The uncer-tainty covers the range of reported values.
Vibrational assignments of the A−X band system and positions of the vibronicband centers between 15 120 cm−1 and 20 753 cm−1 (482 nm to 661 nm) are tabulated20
in Himmelmann et al. (1996).
2685

ACPD6, 2281–2702, 2006
Evaluated kinetic andphotochemical data
for atmosphericchemistry
R. Atkinson et al.
Title Page
Abstract Introduction
Conclusions References
Tables Figures
J I
J I
Back Close
Full Screen / Esc
Printer-friendly Version
Interactive Discussion
EGU
Dissociation of OIO into O(3P)+IO following absorption in the A−X band systemcan be excluded on thermodynamic grounds. This is confirmed by the results of In-gham et al. (2000) who were unable to detect O atoms and report an upper limit of0.007 for Φ2 at 532 nm. Ingham et al. (2000) also report an upper limit of ∼0.15 onthe value of Φ1, but the results of Ashworth et al. (2002) provide compelling evidence5
that the 2B2 upper state is strongly predissociated, and they report quantum calcula-tions that efficient dissociation to I+O2 can occur. This issue is unresolved and norecommendation is made for Φ1.
References
Ashworth, S. H., Allan, B. J., and Plane, J. M. C.: Geophys. Res. Lett., 29,10
doi:10.1029/2001GL013851, 2002.Bedjanian, Y., Le Bras, G., and Poulet, G.: J. Phys. Chem. A, 102, 10501, 1998.Cox, R. A., Bloss, W. J., Jones, R. L., and Rowley, D. M.: Geophys. Res. Lett., 26,1857, 1999.Himmelmann, S., Orphal, J., Bovensmann, H., Richter, A. Ladstatter-Weissenmayer,15
A., and Burrows, J. P.: Chem. Phys. Lett., 251, 330, 1996.Ingham, T., Cameron, M., and Crowley, J. N.: J. Phys. Chem. A, 104, 8001, 2000.Spietz, P., Himmelmann, S., Gross, U., Bleck-Neuhaus, J., and Burrows, J. P.: A com-plex approach to investigate the chemistry and kinetics of IOx using flash photolysisand time-resolved absorption spectroscopy. 15th Int. Symp. Gas Kinetics, Bilbao,20
Spain, September 1998.
2686

ACPD6, 2281–2702, 2006
Evaluated kinetic andphotochemical data
for atmosphericchemistry
R. Atkinson et al.
Title Page
Abstract Introduction
Conclusions References
Tables Figures
J I
J I
Back Close
Full Screen / Esc
Printer-friendly Version
Interactive Discussion
EGU
III.A5.123
ICl + hν→ products
Primary photochemical transitions
Reaction ∆H◦/kJ·mol−1 λthreshold/nm
ICl + hν → I + Cl 211 567→ Cl(2P1/2) + I 221 540→ Cl + I(2P1/2) 302 396
Absorption cross-section data5
Wavelength range/nm Reference Comments
220–600 Seery and Britton, 1964 (a)210–530 Jenkin et al., 1990 (b)
Quantum yield data
Wavelength/nm Quantum Yield Reference Comments
235.3–237.8 Φ(Cl∗) = 0.40 Tonokura et al.,1993
(c)
248 Φ(I∗) = 0.42
2687
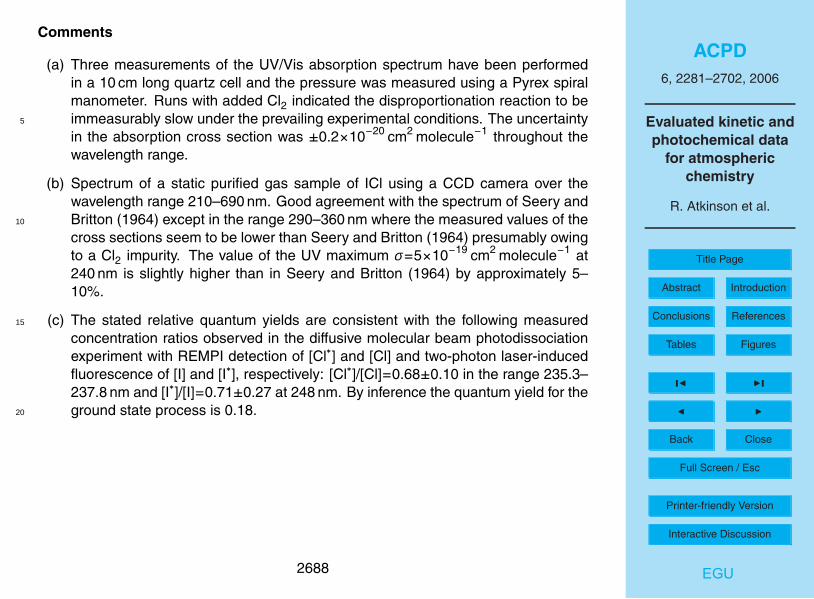
ACPD6, 2281–2702, 2006
Evaluated kinetic andphotochemical data
for atmosphericchemistry
R. Atkinson et al.
Title Page
Abstract Introduction
Conclusions References
Tables Figures
J I
J I
Back Close
Full Screen / Esc
Printer-friendly Version
Interactive Discussion
EGU
Comments
(a) Three measurements of the UV/Vis absorption spectrum have been performedin a 10 cm long quartz cell and the pressure was measured using a Pyrex spiralmanometer. Runs with added Cl2 indicated the disproportionation reaction to beimmeasurably slow under the prevailing experimental conditions. The uncertainty5
in the absorption cross section was ±0.2×10⁻²⁰ cm2 molecule−1 throughout thewavelength range.
(b) Spectrum of a static purified gas sample of ICl using a CCD camera over thewavelength range 210–690 nm. Good agreement with the spectrum of Seery andBritton (1964) except in the range 290–360 nm where the measured values of the10
cross sections seem to be lower than Seery and Britton (1964) presumably owingto a Cl2 impurity. The value of the UV maximum σ=5×10⁻¹⁹ cm2 molecule−1 at240 nm is slightly higher than in Seery and Britton (1964) by approximately 5–10%.
(c) The stated relative quantum yields are consistent with the following measured15
concentration ratios observed in the diffusive molecular beam photodissociationexperiment with REMPI detection of [Cl∗] and [Cl] and two-photon laser-inducedfluorescence of [I] and [I∗], respectively: [Cl∗]/[Cl]=0.68±0.10 in the range 235.3–237.8 nm and [I∗]/[I]=0.71±0.27 at 248 nm. By inference the quantum yield for theground state process is 0.18.20
2688

ACPD6, 2281–2702, 2006
Evaluated kinetic andphotochemical data
for atmosphericchemistry
R. Atkinson et al.
Title Page
Abstract Introduction
Conclusions References
Tables Figures
J I
J I
Back Close
Full Screen / Esc
Printer-friendly Version
Interactive Discussion
EGU
Preferred Values
Absorption cross-sections at 298 K.
λ/nm 1020σ/cm2 λ/nm 1020σ/cm2
220 21.33 420 28.87230 35.36 430 32.08240 43.97 440 35.44250 43.32 450 38.85260 35.25 460 41.67270 24.35 470 42.59280 15.41 480 40.91290 9.41 490 36.32300 6.08 500 29.44310 4.59 510 22.79320 4.01 520 16.40330 3.67 530 11.47340 3.29 540 8.00350 3.10 550 5.70360 3.52 560 4.32370 5.31 570 3.44380 8.79 580 2.83390 13.88 590 2.10400 18.96 600 1.76410 24.66
2689

ACPD6, 2281–2702, 2006
Evaluated kinetic andphotochemical data
for atmosphericchemistry
R. Atkinson et al.
Title Page
Abstract Introduction
Conclusions References
Tables Figures
J I
J I
Back Close
Full Screen / Esc
Printer-friendly Version
Interactive Discussion
EGU
Comments on Preferred Values
The listed cross sections are the only ones available.
References
Jenkin, M. E., Cox, R. A., Mellouki, A., Le Bras, G., and Poulet, G.: J. Phys. Chem.,94, 2927, 1990.5
Seery, D. and Britton, D.: J. Phys. Chem., 68, 2263, 1964.Tonokura, K., Matsumi, Y., Kawasaki, M., Kim, H. L., Fujimura, S., and Saito, K.: J.Chem. Phys., 99, 3461, 1993.
2690

ACPD6, 2281–2702, 2006
Evaluated kinetic andphotochemical data
for atmosphericchemistry
R. Atkinson et al.
Title Page
Abstract Introduction
Conclusions References
Tables Figures
J I
J I
Back Close
Full Screen / Esc
Printer-friendly Version
Interactive Discussion
EGU
III.A5.124
IBr + hν→ products
Primary photochemical transitions
Reaction ∆H◦/kJ·mol−1 λthreshold/nm
IBr + hν → I + Br 178 672→ Br(2P1/2) + I 222 539→ Br + I(2P1/2) 269 445
Absorption cross-section data5
Wavelength range/nm Reference Comments
220-600 Seery and Britton, 1964 (a)
Quantum yield data
Wavelength/nm Quantum Yield Reference Comments
267 Φ(Br∗) = 0.35 Kim et al., 1993 (b)267 Φ(I∗) = 0.42267 Φ(I) = 0.23500 Φ(Br∗) = 0.73 Haugen et al., 1985 (c)
2691
ACPD6, 2281–2702, 2006
Evaluated kinetic andphotochemical data
for atmosphericchemistry
R. Atkinson et al.
Title Page
Abstract Introduction
Conclusions References
Tables Figures
J I
J I
Back Close
Full Screen / Esc
Printer-friendly Version
Interactive Discussion
EGU
Comments
(a) Four measurements of the UV/Vis absorption spectrum have been performed ina 10 cm long quartz cell and the pressure was measured using a Pyrex spiralmanometer. Runs with added Br2 indicated the disproportionation reaction tobe unimportant under the prevailing experimental conditions. The uncertainty5
in the absorption cross section was ±0.95×10⁻²⁰ cm2 molecule−1 throughout thewavelength range.
(b) The stated relative quantum yields are derived from the following measured con-centration ratio observed in the diffusive molecular beam photodissociation exper-iment with REMPI detection of [Br∗] and [Br], respectively, within the same laser10
pulse: [Br∗]/[Br]=0.54 at 267 nm. Center-stripe analysis of velocity profiles affordsthe stated quantum yields for the channels yielding ground-state Br (Φ(I)=0.23,Φ(I∗)=0.42).
(c) Approximate value resulting from a time-resolved laser gain vs. absorption spec-troscopy technique.15
2692

ACPD6, 2281–2702, 2006
Evaluated kinetic andphotochemical data
for atmosphericchemistry
R. Atkinson et al.
Title Page
Abstract Introduction
Conclusions References
Tables Figures
J I
J I
Back Close
Full Screen / Esc
Printer-friendly Version
Interactive Discussion
EGU
Preferred Values
Absorption cross-sections at 298 K.
λ/nm 1020σ/cm2 λ/nm 1020σ/cm2
220 3.59 420 31.73230 5.70 430 44.77240 10.21 440 58.69250 16.71 450 71.92260 21.45 460 85.18270 23.09 470 98.49280 21.10 480 111.10290 16.82 490 119.86300 12.43 500 121.66310 7.95 510 115.92320 5.39 520 103.08330 3.36 530 85.83340 2.14 540 67.52350 1.45 550 52.34360 1.53 560 36.63370 2.37 570 27.22380 4.17 580 19.88390 6.96 590 14.57400 12.04 600 11.32410 20.46
2693

ACPD6, 2281–2702, 2006
Evaluated kinetic andphotochemical data
for atmosphericchemistry
R. Atkinson et al.
Title Page
Abstract Introduction
Conclusions References
Tables Figures
J I
J I
Back Close
Full Screen / Esc
Printer-friendly Version
Interactive Discussion
EGU
Comments on Preferred Values
The listed values are the only ones available.
References
Haugen, H. K., Weitz, E., and Leone, S. R.: J. Chem. Phys., 83, 3402, 1985.Kim, Y. S., Jung, Y.-J., and Jung, K.-H.: J. Chem. Phys., 107, 3805, 1997.5
Seery, D. J. and Britton, D.: J. Phys. Chem., 68, 2263, 1964.
2694

ACPD6, 2281–2702, 2006
Evaluated kinetic andphotochemical data
for atmosphericchemistry
R. Atkinson et al.
Title Page
Abstract Introduction
Conclusions References
Tables Figures
J I
J I
Back Close
Full Screen / Esc
Printer-friendly Version
Interactive Discussion
EGU
III.A5.125
I2 + hν→ I + I
Primary photochemical transitions
Reaction ∆H◦/kJ·mol−1 λthreshold/nm
I2 + hν → I(2P3/2) + I(2P3/2) 151 792
Absorption cross-section data5
Wavelength range/nm Reference Comments
430–620 Rabinowitch and Wood, 1936a (a)420–800 Tellinghuisen, 1973 (b)280–510 Bauer et al., 1998 (c)180–750 Saiz-Lopez et al., 2004 (d)
2695

ACPD6, 2281–2702, 2006
Evaluated kinetic andphotochemical data
for atmosphericchemistry
R. Atkinson et al.
Title Page
Abstract Introduction
Conclusions References
Tables Figures
J I
J I
Back Close
Full Screen / Esc
Printer-friendly Version
Interactive Discussion
EGU
Quantum yield data
Wavelength/nm Wavelength/nm Reference Comments
Φ = 1 370–650 Rabinowitch and Wood,1936b
(e)
Φ = 0.93 ± 0.02 501.0 Brewer and Tellinghuisen,1972
(f)
Φ = 0.70 ± 0.03 509.1Φ = 0.62 ± 0.02 516.6Φ = 0.66 ± 0.04 527.7Φ = 0.72 ± 0.02 546.2Φ = 0.67 ± 0.03 559.4Φ = 0.59 ± 0.03 569.0Φ = 0.33 ± 0.01 589.6Φ = 0.35 ± 0.01 592.2Φ = 0.54 ± 0.02 603.7Φ = 0.67 ± 0.04 612.9Φ = 0.88 ± 0.05 623.9
Comments
(a) The visible absorption spectrum was determined from measurements made at aseries of wavelengths over the range 430–620 nm, at low resolution (5–10 nm), at5
room temperature (∼293 K). Experiments were carried out using 0.2 mbar pure I2either in the absence of a bath gas, or in the presence of 670 mbar of He, air or Ar.Cross sections between 500–570 nm increased in the presence of the bath gases,but showed no dependence on bath gas identity. The cross section reported atthe absorption maximum in the absence of a bath gas (i.e., close to 500 nm) was10
2696
ACPD6, 2281–2702, 2006
Evaluated kinetic andphotochemical data
for atmosphericchemistry
R. Atkinson et al.
Title Page
Abstract Introduction
Conclusions References
Tables Figures
J I
J I
Back Close
Full Screen / Esc
Printer-friendly Version
Interactive Discussion
EGU
∼2.8×10⁻¹⁸ cm2 molecule−1.
(b) The visible-infrared absorption spectrum was determined from measurementsmade at 10 nm intervals over the wavelength range 420–800 nm, at a resolution of0.26 nm. Measurements were made at room temperature (295–300 K) with pres-sures of purified I2 of up to ∼0.15 mbar. The cross section reported at 500 nm (the5
beginning of the B3Π←X1Σ continuum) was (2.19±0.07)×10−18 cm2 molecule−1.
(c) The ultraviolet-visible absorption spectrum was recorded over the range 280–510 nm, at a resolution of 1.2 nm, with cross sections reported at 436 nm and500 nm. Measurements were made at room temperature (295±2 K) with pres-sures of purified I2 up to 0.2 mbar. The cross section reported at 500 nm was10
(2.25±0.09)×10−18 cm2 molecule−1 .
(d) The ultraviolet-visible-infrared absorption spectrum was recorded using FourierTransform spectroscopy over the wavelength range 182–750 nm, at a resolutionof 0.036 nm in the banded region (500–650 nm) and 1 nm elsewhere. Measure-ments were made at room temperature (295 K) in 1.013 bar air. The absorption15
maximum was recorded in the banded region at 533 nm, with the cross sectionreported at 500 nm being 2.29×10⁻¹⁸ cm2 molecule−1.
(e) Photodissociation quantum yields were determined from the reversible decreasein extinction during steady state illumination of I2 vapour with a carbon arc or fil-ament lamp. The use of appropriate filters allowed three broad band spectral re-20
gions to be considered for the photolysis radiation: ∼370–502 nm, λmax=460 nm;∼480–590 nm, λmax=502 nm; ∼503–650 nm, λmax=565 nm. The quantum yield inthe first region (essentially the B3Π←X1Σ continuum) was assumed to be unity.No significant difference in quantum yield for the other regions was observed. Ex-periments were carried out with 0.2 mbar I2 in the presence of several hundred25
mbar of He, Ar, H2 and N2.
2697

ACPD6, 2281–2702, 2006
Evaluated kinetic andphotochemical data
for atmosphericchemistry
R. Atkinson et al.
Title Page
Abstract Introduction
Conclusions References
Tables Figures
J I
J I
Back Close
Full Screen / Esc
Printer-friendly Version
Interactive Discussion
EGU
(f) Photodissociation quantum yields were determined from fluorescence detectionof I(2P3/2), during steady state photolysis of I2 at 12 wavelengths, using a tungstenlamp in conjunction with combinations of interference filters. The transmittancebandwidth varied from 0.3 to 1.4 nm. The yields were determined relative to anassumed value of unity at 492 nm, in the B3Π←X1Σ continuum. Low pressure5
experiments were carried out with I2 pressures up to ∼0.01 mbar, to determinethe zero pressure limiting quantum yields tabulated above. Experiments with up to15 mbar N2 demonstrated that the dissociative yield tends to unity in the presenceof higher bath gas pressures.
2698

ACPD6, 2281–2702, 2006
Evaluated kinetic andphotochemical data
for atmosphericchemistry
R. Atkinson et al.
Title Page
Abstract Introduction
Conclusions References
Tables Figures
J I
J I
Back Close
Full Screen / Esc
Printer-friendly Version
Interactive Discussion
EGU
Preferred Values
Absorption cross-sections for I2 at 298 K.
λ/nm 1018σ/cm2 λ/nm 1018σ/cm2
400 0.029 565 1.54405 0.038 570 1.28410 0.043 575 0.955415 0.053 580 0.912420 0.058 585 0.729425 0.081 590 0.644430 0.133 595 0.588435 0.153 600 0.466440 0.199 605 0.422445 0.253 610 0.400450 0.327 615 0.336455 0.432 620 0.300460 0.560 625 0.276465 0.709 630 0.274470 0.880 635 0.220475 1.07 640 0.233480 1.29 645 0.222485 1.52 650 0.212490 1.75 655 0.203
5
2699
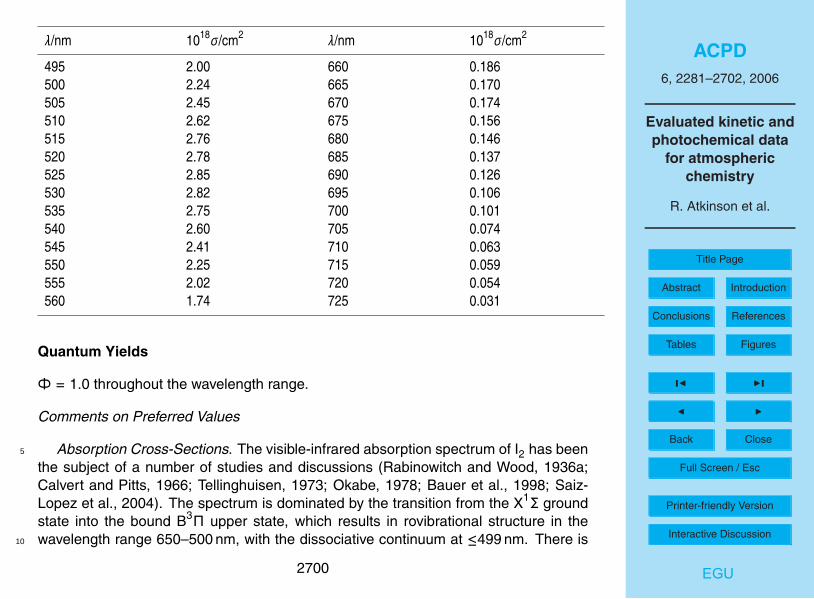
ACPD6, 2281–2702, 2006
Evaluated kinetic andphotochemical data
for atmosphericchemistry
R. Atkinson et al.
Title Page
Abstract Introduction
Conclusions References
Tables Figures
J I
J I
Back Close
Full Screen / Esc
Printer-friendly Version
Interactive Discussion
EGU
λ/nm 1018σ/cm2 λ/nm 1018σ/cm2
495 2.00 660 0.186500 2.24 665 0.170505 2.45 670 0.174510 2.62 675 0.156515 2.76 680 0.146520 2.78 685 0.137525 2.85 690 0.126530 2.82 695 0.106535 2.75 700 0.101540 2.60 705 0.074545 2.41 710 0.063550 2.25 715 0.059555 2.02 720 0.054560 1.74 725 0.031
Quantum Yields
Φ = 1.0 throughout the wavelength range.
Comments on Preferred Values
Absorption Cross-Sections. The visible-infrared absorption spectrum of I2 has been5
the subject of a number of studies and discussions (Rabinowitch and Wood, 1936a;Calvert and Pitts, 1966; Tellinghuisen, 1973; Okabe, 1978; Bauer et al., 1998; Saiz-Lopez et al., 2004). The spectrum is dominated by the transition from the X1Σ groundstate into the bound B3Π upper state, which results in rovibrational structure in thewavelength range 650–500 nm, with the dissociative continuum at ≤499 nm. There is10
2700

ACPD6, 2281–2702, 2006
Evaluated kinetic andphotochemical data
for atmosphericchemistry
R. Atkinson et al.
Title Page
Abstract Introduction
Conclusions References
Tables Figures
J I
J I
Back Close
Full Screen / Esc
Printer-friendly Version
Interactive Discussion
EGU
also a weaker underlying continuum in the structured region, due to the transition to1Π repulsive state.
The shape of the absorption spectrum at wavelengths ≤500 nm (i.e. essentiallyin the continuum), based on a number of studies (Rabinowitch and Wood, 1936a;Tellinghuisen, 1973; Bauer et al., 1998; Saiz-Lopez et al., 2004), is well determined.5
Measurements in the structured region of the spectrum have been found to be verysensitive to experimental conditions, depending on the absolute concentration of I2and on pressure of bath gas, at the spectral resolutions typically employed. Crosssections averaged over a wavelength interval in this region should tend towards thetrue value when partial saturation of rotational lines is avoided though use of very low10
I2 concentrations or at higher bath gas pressures when the lines become sufficientlybroadened. The recent measurements of Saiz-Lopez et al. (2004), performed at highresolution and with high bath gas pressures, are therefore used to define the shapeof the spectrum, with the preferred values based on their data averaged over 5 nmintervals.15
The three most recent studies (Tellinghuisen, 1973; Bauer et al., 1998; Saiz-Lopez et al., 2004) report absorption cross sections in the pressure-independentcontinuum (λ≤500 nm) which are in excellent agreement, differing by less than 5%at 500 nm. The present recommendation therefore adopts a reference value ofσ=2.24×10⁻¹⁸ cm2 molecule−1 at 500 nm, which is the average of the values reported20
in the three investigations.
Quantum Yields. The measurements of Rabinowitch and Wood (1936b) are con-sistent with a unity quantum yield throughout the visible-infrared spectrum at bath gaspressures greater than about 200 mbar. Brewer and Tellinghuisen (1972) report quan-25
tum yields well below unity in the structured region of the spectrum (501–624 nm) atlow pressures in the absence of a bath gas, but observed significant increases (to>0.9) at N2 pressures of only 15 mbar. The results of these studies are interpreted interms of collision induced transition from the bound B3Π upper state into the unstable
2701

ACPD6, 2281–2702, 2006
Evaluated kinetic andphotochemical data
for atmosphericchemistry
R. Atkinson et al.
Title Page
Abstract Introduction
Conclusions References
Tables Figures
J I
J I
Back Close
Full Screen / Esc
Printer-friendly Version
Interactive Discussion
EGU
1Π repulsive state, leading to the generation of I(2P3/2)+I(2P3/2), as does the weaker
underlying continuum transition (1Π←X1Σ). A quantum yield of unity throughout thespectrum is therefore recommended for lower atmospheric conditions. A number ofstudies have also determined quantum yields for the production of excited state I(2P1/2)atoms, which have been detected at wavelengths below ∼530 nm (Hunter and Leong,5
1987; and references therein). Under atmospheric conditions, collisional quenching ofI(2P1/2) to ground state I(2P3/2) occurs rapidly.
References
Bauer, D., Ingham, T., Carl, S., Moortgat, G. K., and Crowley, J. N.: J. Phys. Chem. A,102, 2857, 1998.10
Brewer, L. and Tellinghuisen, J.: J. Chem. Phys., 56, 3929, 1972.Calvert, J. G. and Pitts, J. N.: Photochemistry, Wiley, New York, p. 184, 1966.Hunter, T. F. and Leong, C. M.: Chem. Phys., 111, 145, 1987.Okabe, H.: Photochemistry of small molecules, Wiley, New York, p. 187, 1978.Rabinowitch, E. and Wood, W. C.: Trans. Faraday Soc., 32, 540, 1936a.15
Rabinowitch, E. and Wood, W. C.: J. Chem. Phys., 4, 358, 1936b.Saiz-Lopez, A., Saunders, R. W., Joseph, D. M., Ashworth, S. H., and Plane, J. M. C.:Atmos. Chem. Phys., 4, 1443, 2004.Tellinghuisen, J.: J. Chem. Phys., 58, 2821, 1973.
20
2702