roc_ipbs_2018.pdf - Archive ouverte HAL
30
HAL Id: hal-02390812 https://hal.archives-ouvertes.fr/hal-02390812 Submitted on 19 Mar 2021 HAL is a multi-disciplinary open access archive for the deposit and dissemination of sci- entific research documents, whether they are pub- lished or not. The documents may come from teaching and research institutions in France or abroad, or from public or private research centers. L’archive ouverte pluridisciplinaire HAL, est destinée au dépôt et à la diffusion de documents scientifiques de niveau recherche, publiés ou non, émanant des établissements d’enseignement et de recherche français ou étrangers, des laboratoires publics ou privés. Increased permeability of blood vessels after reversible electroporation is facilitated by alterations in endothelial cell-to-cell junctions Bostjan Markelc, Elisabeth Bellard, Gregor Sersa, Tanja Jesenko, Sandrine Pélofy, Justin Teissié, Robert Frangez, Marie-Pierre Rols, Maja Cemazar, Muriel Golzio To cite this version: Bostjan Markelc, Elisabeth Bellard, Gregor Sersa, Tanja Jesenko, Sandrine Pélofy, et al.. In- creased permeability of blood vessels after reversible electroporation is facilitated by alterations in endothelial cell-to-cell junctions. Journal of Controlled Release, Elsevier, 2018, 276, pp.30-41. 10.1016/j.jconrel.2018.02.032. hal-02390812
-
Upload
khangminh22 -
Category
Documents
-
view
2 -
download
0
Transcript of roc_ipbs_2018.pdf - Archive ouverte HAL
HAL Id: hal-02390812https://hal.archives-ouvertes.fr/hal-02390812
Submitted on 19 Mar 2021
HAL is a multi-disciplinary open accessarchive for the deposit and dissemination of sci-entific research documents, whether they are pub-lished or not. The documents may come fromteaching and research institutions in France orabroad, or from public or private research centers.
L’archive ouverte pluridisciplinaire HAL, estdestinée au dépôt et à la diffusion de documentsscientifiques de niveau recherche, publiés ou non,émanant des établissements d’enseignement et derecherche français ou étrangers, des laboratoirespublics ou privés.
Increased permeability of blood vessels after reversibleelectroporation is facilitated by alterations in endothelial
cell-to-cell junctionsBostjan Markelc, Elisabeth Bellard, Gregor Sersa, Tanja Jesenko, SandrinePélofy, Justin Teissié, Robert Frangez, Marie-Pierre Rols, Maja Cemazar,
Muriel Golzio
To cite this version:Bostjan Markelc, Elisabeth Bellard, Gregor Sersa, Tanja Jesenko, Sandrine Pélofy, et al.. In-creased permeability of blood vessels after reversible electroporation is facilitated by alterationsin endothelial cell-to-cell junctions. Journal of Controlled Release, Elsevier, 2018, 276, pp.30-41.�10.1016/j.jconrel.2018.02.032�. �hal-02390812�
ACC
EPTE
D M
ANU
SCR
IPT
Increased permeability of blood vessels after reversible electroporation is facilitated by
alterations in endothelial cell-to-cell junctions
Bostjan Markelc, PhDa,b,*, Elisabeth Bellard, PhDa,*, Gregor Sersa, PhDb, Tanja Jesenko,
PhDb, Sandrine Pelofy, PhDa, Justin Teissié, PhDa, Robert Frangez, PhDc, Marie-Pierre Rols,
PhDa, Maja Cemazar, PhDb,d,† and Muriel Golzio, PhDa,†
aInstitut de Pharmacologie et de Biologie Structurale, Université de Toulouse, CNRS, UPS,
BP 64182, 205 Route de Narbonne, F-31077, France
bDepartment of Experimental Oncology, Institute of Oncology Ljubljana, Zaloska 2, SI-1000
Ljubljana, Slovenia
cInstitute of Preclinical Sciences, Veterinary Faculty, University of Ljubljana, Gerbiceva 60,
SI-1000 Ljubljana, Slovenia
dUniversity of Primorska, Faculty of Health Sciences, Polje 42, SI-6310 Izola, Slovenia
*these authors contributed equally to this work
† Corresponding authors:
1. Maja Cemazar: Department of Experimental Oncology, Institute of Oncology Ljubljana,
Zaloska 2, SI-1000 Ljubljana, Slovenia; Telephone: +386(0)15879544, Fax:
+38(0)15879434, E-mail: [email protected]
2. Muriel Golzio: IPBS CNRS, UMR 5089, 205, Route de Narbonne, 31077 Toulouse Cedex,
France; Telephone: +33(0)561175812, Fax: +33(0)561175994, E-mail: [email protected]
ACCEPTED MANUSCRIPT
ACC
EPTE
D M
ANU
SCR
IPT
ABSTRACT
Delivery of electric field pulses, i.e. electroporation (EP), to tissues has been shown to have a
blood flow modifying effect. Indeed, the diameter of blood vessels exposed to EP is
immediately reduced resulting in blood flow abrogation, followed by an increase in vascular
permeability. The main cause of the increased permeability remains unknown. The aim of
this study was to determine whether the in vivo effects of EP on permeability of blood vessels
are linked to the permeabilization of endothelial cells’ membrane (EC) and/or disruption of
cell-to-cell junctions. We used a dorsal window chamber model in C57Bl/6 mice coupled
with multiphoton microscopy and fluorescently labelled antibodies against PECAM-1
(CD31) to visualize endothelial cell-to-cell junctions. Clinically validated EP parameters
were used and behavior of cell-to-cell junctions, in combination with leakage of 70 kDa
fluorescein isothiocyanate labelled dextran (FD), was followed in time. After EP, a
constriction of blood vessels was observed and correlated with the change in the shape of
ECs. This was followed by an increase in permeability of blood vessels for 70 kDa FD and a
decrease in the volume of labelled cell-to-cell junctions. Both parameters returned to pre-
treatment values in 50% of mice. For the remaining 50%, we hypothesize that disruption of
cell-to-cell junctions after EP may trigger the platelet activation cascade. Our findings show
for the first time in vivo that alterations in cell-to-cell junctions play an important role in the
response of blood vessels to EP and explain their efficient permeabilization.
Keywords: Electroporation, electropermeabilization, vascular effects, endothelial cells,
cell junctions, intravital microscopy
ACCEPTED MANUSCRIPT
ACC
EPTE
D M
ANU
SCR
IPT
1. INTRODUCTION
Tumor microenvironment plays a major role in tumor initiation and progression and
therefore represents a potential target for tumor treatment. One of the first components of
tumor microenvironment that became a topic of intensive research was tumor vasculature.
Two types of vascular targeted therapies were developed: anti-angiogenic therapy, which
aims to prevent the formation of new tumor vessels and vascular disrupting therapy, which
targets existing tumor vasculature. Although the distinct mechanism of action between the
two therapies is clear, some of the vascular targeting drugs or therapies, such as C9,
deoxypodophyllotoxin, trans-3,5,4’-trimethoxystilbene, siRNA targeting endoglin and
ENMD-1198 exert both antiangiogenic as well as vascular disrupting action [1–6].
In that context, one of the promising vascular disrupting therapies is electrochemotherapy
(ECT). ECT combines the local application of electric pulses and the systemic or local
injection of antitumor chemotherapeutic drugs such as bleomycin or cisplatin [7,8].
Electroporation/electropermeabilization (EP), i.e. application of well-defined electric pulses
to cells or tissues, indeed induces the reversible permeabilization of cell membranes. The
treatment results in a facilitated delivery into the cells of non-permeant or poorly permeant
molecules [9,10]. Although ECT is nowadays already in routine clinical practice for
treatment of subcutaneous tumors throughout Europe [11,12], mechanisms involved in
antitumor effectiveness are still not fully understood. Reversible permeabilization of cell
membrane resulting in enhanced cytotoxicity of chemotherapeutics into the cells is the basic
mechanism of the antitumor effectiveness of electrochemotherapy [13,14]. In addition, it has
been observed that EP alone induces blood modifying effects in tumors and normal tissues
[15,16], but when combined with chemotherapeutics it also results in disruption of tumor
vasculature, without affecting adjacent normal vasculature [17]. This dual effect of ECT has
clinical importance. On one hand, due to the vascular disrupting action of ECT, it has proven
to be successful in the treatment of bleeding tumors [18,19]. On the other hand, it can be
safely applied to tumors that lie in the vicinity of big normal blood vessels, as was recently
demonstrated in a clinical study on liver metastases of colorectal cancer [20]. Moreover, even
when used close to the heart, electroporation proved to be a safe method [21–23].
Recently, the effects of EP on normal skin blood vessels were thoroughly investigated
by direct visualization. Namely, with the use of intravital microscopy using fluorescence
stereomicroscope in a mouse dorsal window chamber (DWC) model we demonstrated that
the application of electric pulses with different parameters leads to a rapid increase in skin
blood vessel permeability. Additionally, the application of electric pulses induced an
immediate constriction of blood vessels, which although transient produced a reduction in the
perfusion of the exposed vessels, the so-called vascular lock that lasted a maximum of 10 min
[24]. Furthermore, a histological analysis of the treated skin revealed extravasation of
erythrocytes and infiltration of leukocytes together with some reversible damage to the skin
[25]. Furthermore, using mathematical modelling based on the data of extravasation of
fluorescently labelled dextrans, we showed a higher microvascular permeability after EP for
smaller molecules (70 kDa) compared to the larger ones (2000 kDa) [26]. These data
provided further evidence confirming the previously proposed model of the underlying
ACCEPTED MANUSCRIPT
ACC
EPTE
D M
ANU
SCR
IPT
mechanisms of blood flow modifying effects of EP in normal tissues [27]. However, whether
the significant increase in permeability of blood vessels observed in vivo is due to the loss of
contractility of endothelial cells (EC) and disruption of endothelial cell-to-cell junctions
observed in vitro (paracellular transport) [28] or to the overall increase of cell membrane
permeability (transcellular transport), remains to be demonstrated.
Therefore, to determine whether the in vivo effects of EP on permeability of blood
vessels are linked to the permeabilization of ECs membranes and/or disruption of cell-to-cell
junctions, an in vivo analysis at a cellular resolution was performed in DWC model in mice
using intravital fluorescence multiphoton microscopy (IVMM). Intravital microscopy (IVM)
has played a key role in studies of the morphology and function of blood vessels and their
response to different treatments. Imaging techniques and offline analysis methods are a vital
and active area of biological research [29]. The high resolution and deep tissue penetration of
multiphoton microscopy (IVMM) have made this technique currently the best choice for
intravital studies of biological events at a cellular resolution. Furthermore, the dependency of
the fluorescence lifetime of a fluorophore on its molecular environment but not on its
concentration has enabled the researchers to get deep inside the interactions of a fluorophore
with its biological environment with Fluorescence Lifetime Imaging (FLIM) [30].
In this study, we aim to study the temporal and spatial changes in the permeability of
cell membranes and the integrity of endothelial cell-to-cell junctions after EP. To achieve
this, we applied electric pulses either to murine endothelial cells in vitro or directly to the
normal skin in mice. We used fluorescently labelled antibodies (Alexa Fluor) targeting CD31
(PECAM-1) or VE-Cadherin, molecules in endothelial cell-to-cell junctions, 70 kDa
fluorescein isothiocyanate (FITC) labeled dextran (FD) and followed the resulting changes in
vitro and by using IVMM and FLIM.
2. MATERIALS AND METHODS
2.1 Reagents
Fluorescein isothiocyanate (FITC) labeled dextran (FD) (70 kDa) was purchased from
Sigma Aldrich (St. Louis, MO, US). It was dissolved in phosphate-buffered saline (PBS) and
washed through 30 kDa spin filter (Sartorius Stedim Biotech GmbH, Goettingen, Germany)
at 3000 rpm to remove any free FITC or low molecular weight contaminants. The high
molecular weight component was resuspended in PBS and used in mice at 37.5 mg/ml (3.75
mg/mouse in 100 µl) concentration. The CD31 (PECAM-1) rat anti-mouse antibody (clone
390, unconjugated; Life Technologies) was custom conjugated to Alexa Fluor® 555 or Alexa
Fluor® 647 by Life Technologies. Hoechst 33342 nuclear dye was purchased from Life
Technologies.
2.2 Mice
Adult female C57Bl/6 mice (Charles River Laboratories, France) weighing between 18–
23 g were used as hosts for dorsal window chamber (DWC) surgery. All animal experiments
were conducted in accordance with French procedural guidelines for animal handling and
with approval from the Regional Ethical Review Committee (MP/02/36/10/10).
ACCEPTED MANUSCRIPT
ACC
EPTE
D M
ANU
SCR
IPT
2.3 Dorsal window chamber (DWC) surgery
Surgery was carried out as previously described [17,24,25] under general anesthesia using
intraperitoneal injection of Ketamine (4 mg/kg, MERIAL, Lyon, France) and Xylazine (20
mg/kg, Bayer, Puteaux, France). Briefly, animals were kept warm using heating pads and an
aseptic technique was used throughout the surgical procedure. Two symmetrical titanium
frames (APJ Trading Co., Ventura, CA, US) sandwiched an extended double layer of dorsal
skin which was attached to them with stainless steel screws and sutures. After the
implantation of the frames, one layer of skin (~12-mm diameter) was surgically removed to
create an observation window. Then, all the underlying fat and connective tissue that was not
associated with the remaining layer of the skin was carefully dissected away with
microsurgical tools. Then, sterile PBS was added into the created hole and a sterile glass
coverslip was attached to the open frame with a stainless steel clip to cover the surgical site
and provide visual access to the vascular network of the skin. After the surgery and on the
following day, Profenid (Sanofi-Aventis, Paris, France) was injected, intramuscularly, to
provide analgesia and to avoid inflammation (10mg/kg, 50 µl in each thigh).
2.4 In vivo electropermeabilization
EP was carried out 3 to 7 days following the surgery, by application of standard ECT
pulse parameters [11]: 8 square wave electric pulses, amplitude per distance 1300 V/cm,
pulse length 100 µs, repetition frequency 1 Hz, generated by an electropulsator
(Cliniporator™, IGEA s.r.l., Carpi, Italy). Pulses were delivered by two parallel stainless
steel rods (length 5 mm, width 1.3 mm) 4 mm apart, which were placed in contact with the
intact skin on the opposite side of the cover glass. Good contact was assured by means of a
conductive gel (Eko-gel, Egna, Italy). Mice in which no EP was applied were regarded as a
control group. To visualize the cell-to-cell junctions in vivo the fluorescently labelled CD31
rat anti-mouse antibody (PECAM-1) was injected intravenously (25 µg in 100 µl) 4 – 6 h
before IVMM and FD (3.75 mg in 100 µl) 3-5 min before IVMM to observe its extravasation
from blood vessels into the tissue after EP. To visualize the change in the shape of
endothelial cell nuclei, a 150 µl of PBS containing 1mg/mL Hoechst was injected in the
retro-orbital plexus 1 min before IVMM. There was no temperature control inside the DWC
during the experiments.
2.5 Intravital multiphoton microscopy
Intravital multiphoton microscopy (IVMM) was carried out using a 7MP upright
fluorescence microscope (Carl Zeiss S.A.S., Jena, Germany), equipped with a 20x objective
(NA 0.95) and coupled to a Ti-Sapphire femtosecond laser, Chameleon Ultra 2 (Coherent
Inc) tuned to 720 nm or 820 nm in case of Alexa Fluor® 647, to simultaneously excite FITC
and Alexa Fluor® 555. Throughout the experiment, animals were anaesthetized with
inhalation anaesthesia (Vetflurane) and immobilized on a customized heated stage. Emitted
light from labelled vessels (FITC dextran) and from endothelial cell-to-cell junctions (Alexa
Fluor® 555 or Alexa Fluor® 647 – PECAM-1) was detected through 500-550 nm and 565-610
nm or 640-710 nm bandpass filters with non-descanned detectors. Five min after an i. v.
injection of 100 µl of FD and before EP, a 3D image stack (x, y, z) of 101 x-y sections at a
ACCEPTED MANUSCRIPT
ACC
EPTE
D M
ANU
SCR
IPT
resolution of 1024x1024 and with z-spacing of 2 µm was acquired and formed by averaging 2
video frames. Immediately after EP, this volume collection was repeated every 7 minutes
during 90 min (7 times points) to create a 4D data sets. When mice were injected with
Hoechst (emission filters) the signal was detected through a 485 nm shortpass emission filter.
The acquired 4D data sets were stored and then analyzed off-line with Imaris software
(Bitplane AG).
Platelets intravital microscopy was performed using an upright “Macrofluo” fluorescence
macroscope (Leica Microsystems SA, Rueil-Malmaison, France), equipped with a Cool Snap
HQ2 Camera (Roper Scientific, Photometrics, Tucson, AZ, USA). Animals were
anaesthetized with inhalation anaesthesia (Vetflurane, Virbac France) throughout the
experiment. Platelets and vessels were imaged by fluorescence using appropriate filters
(excitation filter, BP: 480/40 and 560/40 nm, emission filter, BP 527/30 and 630/75 nm
respectively). After injection of 100 µl of Rhodamin Dextran 70kDa, one image for each
channel was acquired before EP and a stack of images was acquired immediately after.
Images were taken every one minute for 10 min with an image acquisition software
(Metavue, Metamorph, Molecular devices, Sunnyvale, CA, USA). The files were stored and
analyzed off-line with an analysis software (ImageJ, National Institute of Mental Health,
Bethesda, MD, USA).
2.6 Intravital fluorescence lifetime imaging microscopy
Intravital FLIM was carried out using multidimensional time-correlated single-photon
counting (TCSPC) system based on SPC150 module (Becker Hickl, Germany) in
combination with multiphoton laser scanning. For FLIM experiments, the laser was tuned to
820 nm to excite Alexa Fluor® 647 and emitted photons from endothelial cell-to-cell
junctions were detected through a 665-715 nm bandpass filter, on a high speed hybrid
detector (HPM-100-40). A 36 µm TCSPC-FLIM image stack (x, y, z) of 7 sections at a
resolution of 256x256 and with z-spacing of 6 µm was acquired and formed by averaging 16
video frames. For each x-y section, the long acquisition time induced by the averaging
(113s/section) allowed to collect enough photons to deliver an image with a representative
decay curve in each pixel. The FLIM sections were analyzed with the SPCImage FLIM data
analysis software (Becker & Hickl, Germany).
2.7 In vitro studies: Cell culture, electropermeabilization and immunofluorescence
Immortalized mouse brain endothelial cell line bEnd.3 cells (ATTC, Manassas, VA, US)
were grown to a confluent monolayer in Dulbecco's Modified Eagle's Medium (DMEM, Life
Technologies) supplemented with 5% fetal bovine serum (FBS), 100U/mL
penicillin/streptomycin (Gibco-Invitrogen) in 8 well Nunc™ Lab-Tek™ II Chamber Slide™
(Thermo Scientific, Waltham, MA, US) pre-coated with 0.1 mg/ml MatrigelTM.
To permeabilize the bEnd.3 cell monolayer in vitro, cells were first washed with EP
buffer (10mM K2HPO4/KH2PO4 buffer, 1mM MgCl2, 250mM sucrose, pH 7.4) and then
incubated in it during EP, which was performed with the following pulse parameters: 8
square wave electric pulses, amplitude per distance 600 V/cm, pulse length 100 µs, repetition
frequency 1 Hz. Pulses were generated by Electrocell S20 electropulsator (Betatech, St
ACCEPTED MANUSCRIPT
ACC
EPTE
D M
ANU
SCR
IPT
Orens, France) and delivered by plate electrodes with a distance of 7.3 mm between them.
Cells were then incubated for 5 min in EP buffer (except in the group 0 min, where the cells
were fixed immediately after EP) before it was changed for DMEM.
To observe changes in cell-to-cell junctions, bEnd.3 cells were fixed in periodate-lysine-
paraformaldehyde buffer (PLP) for 15 minutes at room temperature, before or at 0, 5, 10, 20,
30 and 60 minutes after EP. To enable the visualization of junctions, bEnd.3 cells were
successively incubated with Alexa Fluor® 555 labelled rat anti-mouse CD31 antibody (2
µg/well) and Alexa Fluor® 647 labelled rat anti-mouse VE-cadherin antibody (0.5 µg/well).
In-between labelling steps, the cells were washed 3x with PBS for 5 min. Cell nuclei were
stained with Hoechst 33342 dye (ThermoFisher). After labelling, the slides were mounted
with ProLong® Gold Antifade Mountant, air dried for 24 h and the edges of cover glass were
sealed with nail varnish.
Fixed bEnd.3 cells were observed with a FV1000 confocal microscope (Olympus)
equipped with a 40x objective (NA 0.95). Alexa Fluor® 555 and 647 were excited using 559
nm and 635 nm excitation lasers respectively, and detected through suitable filters (570/55nm
and 705/100nm respectively) with PMT detectors. To image Hoechst a 405 nm laser diode
was used and emitted light was detected through suitable bandpass filters (425/50nm).
Different channels were acquired sequentially to prevent bleed through of dyes into other
channels. Images were stored and analyzed off-line with ImageJ (NIH, Bethesda, US) image
analysis software.
To quantify the VE-cadherin intensity in junctions in vitro a line profile (10 pixel width)
was drawn in ImageJ across separate junctions and the maximum intensity within the
junction was recorded for each time point after EP. Then, the mean maximum intensity
within the junctions was normalized to the mean maximum intensity within the junction of
the control non-treated cells.
2.8 In vivo data analysis
To determine the quantity of Alexa Fluor® 555 labeled antibody and the quantity of FD in
the intravascular and extravascular space in vivo the Imaris software was used. 3D volumes
of interest were selected inside and outside the blood vessel and the mean fluorescence
intensity in these volumes was measured for each channel separately (Alexa Fluor® 555 and
FD) and recorded for each time point (Fig. 1). Changes in fluorescence intensity were
calculated as a percentage of variation compared to the image before EP, to avoid the
variability between mice due to the different initial value of “before EP” mean fluorescence
intensity.
ACCEPTED MANUSCRIPT
ACC
EPTE
D M
ANU
SCR
IPT
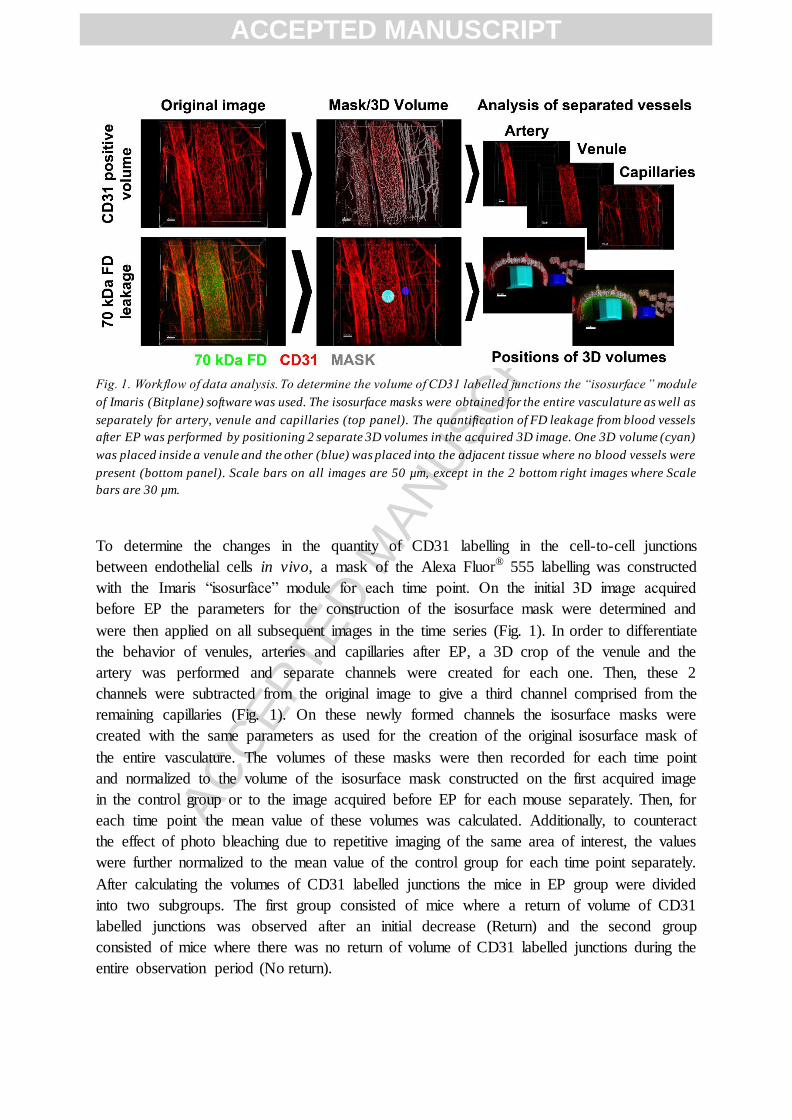
Fig. 1. Workflow of data analysis. To determine the volume of CD31 labelled junctions the “isosurface ” module
of Imaris (Bitplane) software was used. The isosurface masks were obtained for the entire vasculature as well as
separately for artery, venule and capillaries (top panel). The quantification of FD leakage from blood vessels
after EP was performed by positioning 2 separate 3D volumes in the acquired 3D image. One 3D volume (cyan)
was placed inside a venule and the other (blue) was placed into the adjacent tissue where no blood vessels were
present (bottom panel). Scale bars on all images are 50 µm, except in the 2 bottom right images where Scale
bars are 30 µm.
To determine the changes in the quantity of CD31 labelling in the cell-to-cell junctions
between endothelial cells in vivo, a mask of the Alexa Fluor® 555 labelling was constructed
with the Imaris “isosurface” module for each time point. On the initial 3D image acquired
before EP the parameters for the construction of the isosurface mask were determined and
were then applied on all subsequent images in the time series (Fig. 1). In order to differentiate
the behavior of venules, arteries and capillaries after EP, a 3D crop of the venule and the
artery was performed and separate channels were created for each one. Then, these 2
channels were subtracted from the original image to give a third channel comprised from the
remaining capillaries (Fig. 1). On these newly formed channels the isosurface masks were
created with the same parameters as used for the creation of the original isosurface mask of
the entire vasculature. The volumes of these masks were then recorded for each time point
and normalized to the volume of the isosurface mask constructed on the first acquired image
in the control group or to the image acquired before EP for each mouse separately. Then, for
each time point the mean value of these volumes was calculated. Additionally, to counteract
the effect of photo bleaching due to repetitive imaging of the same area of interest, the values
were further normalized to the mean value of the control group for each time point separately.
After calculating the volumes of CD31 labelled junctions the mice in EP group were divided
into two subgroups. The first group consisted of mice where a return of volume of CD31
labelled junctions was observed after an initial decrease (Return) and the second group
consisted of mice where there was no return of volume of CD31 labelled junctions during the
entire observation period (No return).
ACCEPTED MANUSCRIPT
ACC
EPTE
D M
ANU
SCR
IPT
To determine the change in the length and the width of endothelial cells, their length (longest
line horizontal to the length of the vessel) and their width (longest line perpendicular to the
length) was measured in 3D in Imaris (Bitplane) for individual endothelial cells. The change
in the measured value was then calculated as the % of change from the obtained measurement
on the first acquired image.
The Alexa Fluor® 647 fluorescence lifetime in the CD31 labelled junctions was calculated as
follows. Briefly, the Z slice with the cells junctions was selected and a region of interest was
defined surrounding the venule. On a bright position (representative of CD31 labelled cell-to-
cell junctions), the “shift” value was changed to improve the 2. Then, with the “calculate
decay matrix” option of the SPCImage FLIM software (Becker&Hickl), the decay curve in
the individual pixels of the region of interest was fitted with an appropriate decay model
function, i.e., a single-exponential model, resulting in a single fluorescence lifetime per pixel.
Finally, the mean lifetime values of Alexa Fluor® 647 fluorescence was calculated from all
the pixels of the region of interest.
To determine vessels leakage according to platelets aggregation, increase in fluorescence
intensity outside the blood vessels was determined in regions of interest manually drawn face
to vessels positive or negative in platelets (ImageJ, National Institute of Mental Health,
Bethesda, MD, USA). The percentage of variations was calculated to avoid the variability
between mice in the initial value of tissue fluorescence intensity.
2.9 Statistical analysis
Statistical analysis was carried out using Prism 5 Statistical software (GraphPad Software
Inc., San Diego, CA). For comparison of control and EP groups, Student t-tests were used,
and for multiple comparisons, a one-way ANOVA with Dunnett’s post-test. A value of p <
0.05 was considered to represent a significant difference between groups.
3. RESULTS
3.1 3D Multiphoton microscopy revealed the changes in blood vessels diameter and their
increased permeability after EP
Our previous studies showed that EP increases the extravasation of macromolecules
from blood vessels into surrounding tissue [24,25]. In order to confirm this observation and to
define it in 3D space, we used fluorescently labelled antibody against CD31 to visualize the
endothelial cell-to-cell junctions, which enabled us to see the blood vessels wall and measure
the vessels’ diameter (Fig. 2A, B, Fig. 3A, B). Additionally, we intravenously injected 70
kDa FD before EP and then determined its extravasation by the relative variation of mean
fluorescence intensity (green channel) outside the blood vessels (Fig. 2A, B).
ACCEPTED MANUSCRIPT
ACC
EPTE
D M
ANU
SCR
IPT
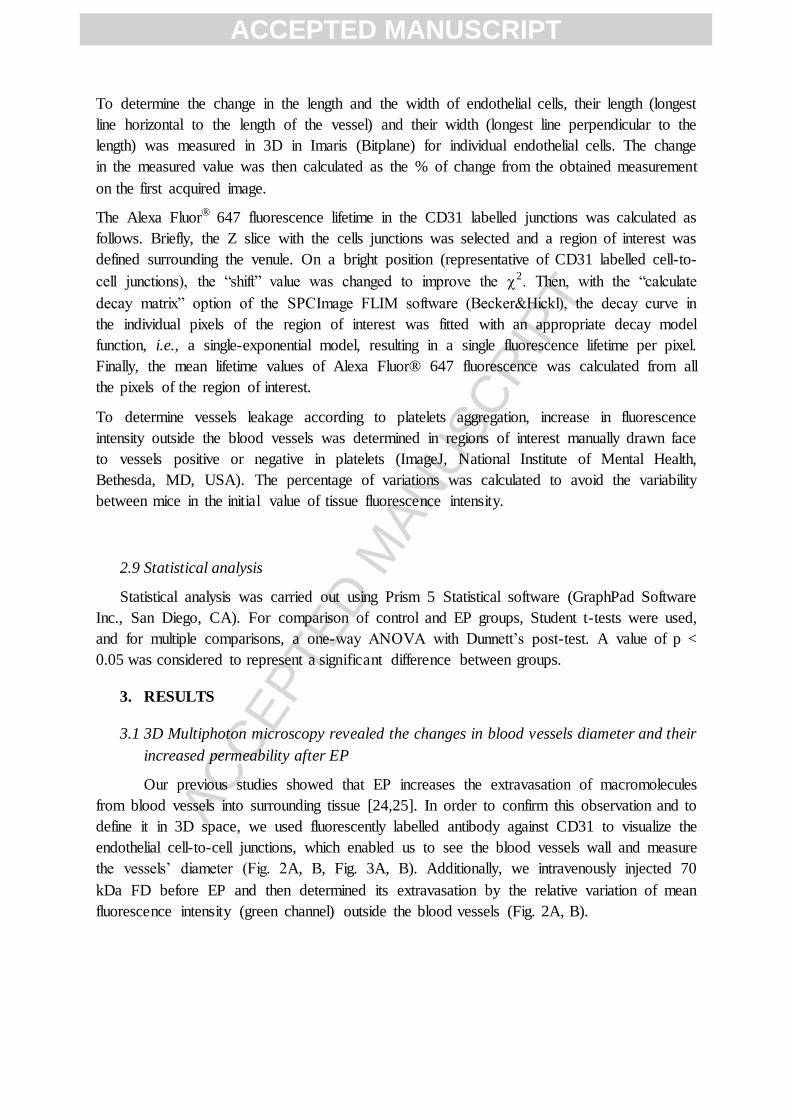
Fig. 2. Direct visualization and quantification of FD leakage kinetics after EP. Visualization of the increase of
the permeability of blood vessels (CD31 labelled junctions in red) for 70 kDa FD (green) after EP (A, B). Eight
square wave electric pulses, amplitude per distance 1300 V/cm, pulse length 100 μs, repetition frequency 1 Hz,
were applied in EP groups. 70 kDa FD was i.v injected 3 min before the first image. Relative variation of mean
fluorescence intensity as a function of time for 70 kDa FD after EP in the tissue outside blood vessels (C) in
Control mice (n=10, ●) in comparison with groups where EP was applied . ■: group with a return of CD31
labelled junctions (EP_return, n=6) and ▲: group with no return of CD31 labelled junctions (EP_no return,
n=6). Mean values ±SEM are shown in C. * - P<0.05 compared to control. **-P<0.05 compared to control and
EP return group. Scale bars: 70 µm.
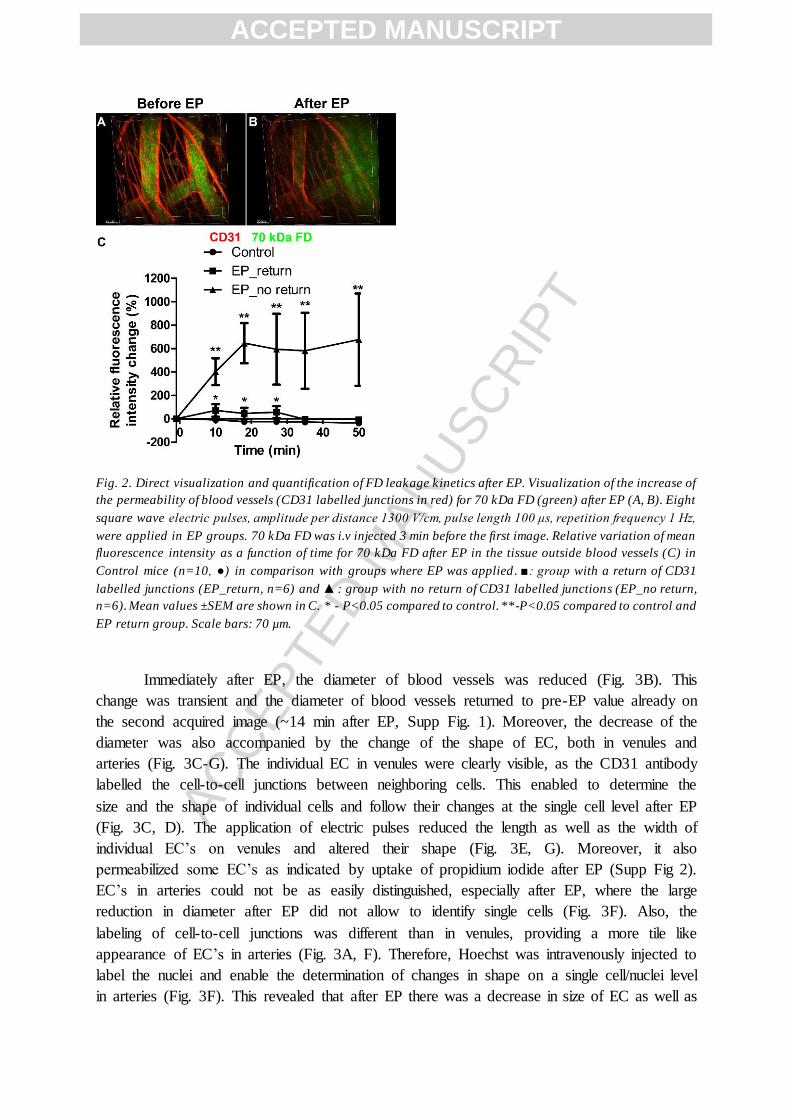
Immediately after EP, the diameter of blood vessels was reduced (Fig. 3B). This
change was transient and the diameter of blood vessels returned to pre-EP value already on
the second acquired image (~14 min after EP, Supp Fig. 1). Moreover, the decrease of the
diameter was also accompanied by the change of the shape of EC, both in venules and
arteries (Fig. 3C-G). The individual EC in venules were clearly visible, as the CD31 antibody
labelled the cell-to-cell junctions between neighboring cells. This enabled to determine the
size and the shape of individual cells and follow their changes at the single cell level after EP
(Fig. 3C, D). The application of electric pulses reduced the length as well as the width of
individual EC’s on venules and altered their shape (Fig. 3E, G). Moreover, it also
permeabilized some EC’s as indicated by uptake of propidium iodide after EP (Supp Fig 2).
EC’s in arteries could not be as easily distinguished, especially after EP, where the large
reduction in diameter after EP did not allow to identify single cells (Fig. 3F). Also, the
labeling of cell-to-cell junctions was different than in venules, providing a more tile like
appearance of EC’s in arteries (Fig. 3A, F). Therefore, Hoechst was intravenously injected to
label the nuclei and enable the determination of changes in shape on a single cell/nuclei level
in arteries (Fig. 3F). This revealed that after EP there was a decrease in size of EC as well as
ACCEPTED MANUSCRIPT
ACC
EPTE
D M
ANU
SCR
IPT
their nuclei in arteries as was the case in venules (Fig. 3F, G, Supp Movie 1). However, due
to the described difficulties, it was not possible to follow the same individual cells in arteries
before and after EP.
Fig. 3. Reduction in diameter of blood vessels and change in shape of EC after EP. The reduction of diameter of
artery (left large vessel) and venule (right large vessel) after EP (A, B). Eight square wave electric pulses,
amplitude per distance 1300 V/cm, pulse length 100 μs, repetition frequency 1 Hz, were applied. Scale bar: 70
µm. Change of the shape of individual EC in venules after EP (E). Indivi dual EC in C, delineated by CD31
staining, marked with a different color and then the same cells traced in D after EP and their shape marked
again. Scale bars: 20 µm. Change of cell size (CD31 staining in red) and nuclei size (Hoechst in cyan injected
i.v. 1 min before first image) in arteries due to EP (F). Scale bars: 50 µm. Quantification of the % of change in
the length and width of individual endothelial cells after EP, or between the first and the second image in case
of the control group (Ctrl) (G). Data presented as mean ±SEM. n>25 cells/condition from n> 5 mice per
condition. ** P<0.01, *** P <0.001 vs Ctrl.
The changes in diameter of blood vessels were accompanied by a concomitant
increase in permeability. After EP we observed a high and statistically significant increase in
relative variation of mean fluorescence intensity for 70 kDa FD in the tissue outside the blood
vessels (Fig. 2C, Supp Movie 2). The highest increase in relative variation of mean
fluorescence intensity in the tissue was obtained on the second image after EP (i.e. 7 min) and
then reached a plateau value 17 min after EP (Fig. 2C). In contrast, the relative variation of
mean fluorescence intensity after EP inside the blood vessels was decreasing at the similar
rate as in the Control group, indicating that the EP induced leakage did not substantially
reduce the pool of circulating FD (Supp Fig. 3). There was a significant difference in the
amount of FD leakage between the group of mice where there was no return of CD31
labelling after EP and the group where CD31 labelling returned after EP (Fig. 2C).
ACCEPTED MANUSCRIPT
ACC
EPTE
D M
ANU
SCR
IPT
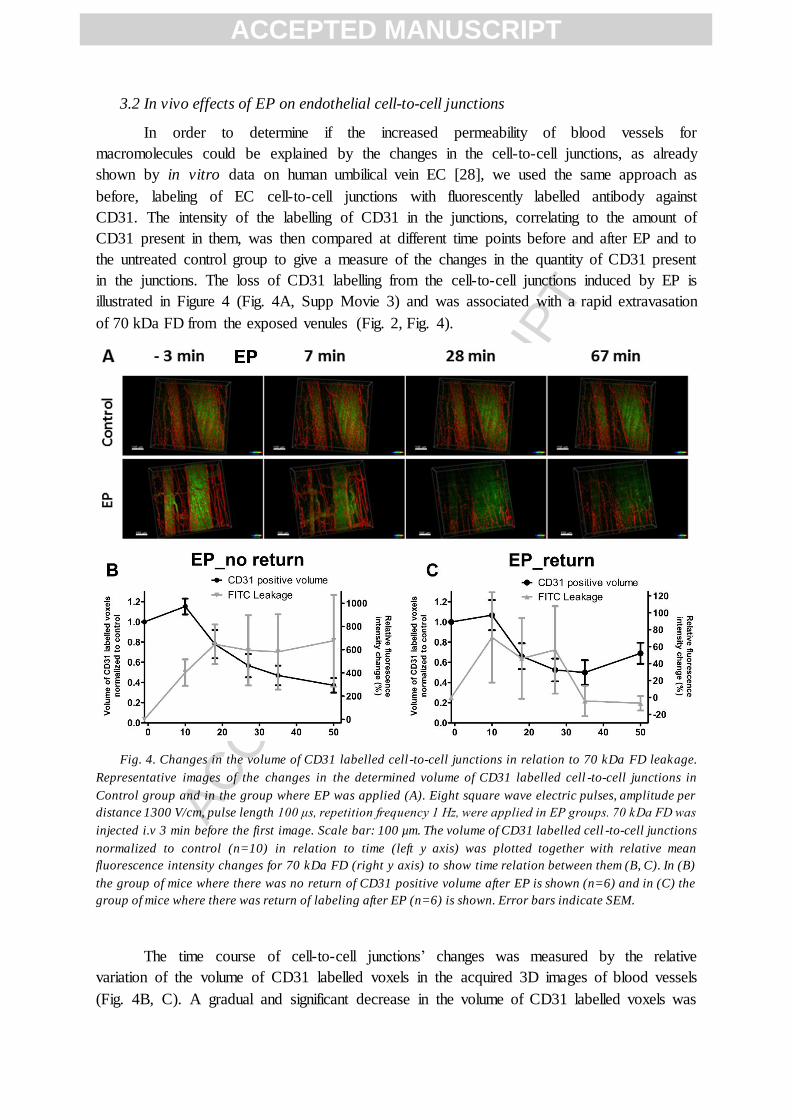
3.2 In vivo effects of EP on endothelial cell-to-cell junctions
In order to determine if the increased permeability of blood vessels for
macromolecules could be explained by the changes in the cell-to-cell junctions, as already
shown by in vitro data on human umbilical vein EC [28], we used the same approach as
before, labeling of EC cell-to-cell junctions with fluorescently labelled antibody against
CD31. The intensity of the labelling of CD31 in the junctions, correlating to the amount of
CD31 present in them, was then compared at different time points before and after EP and to
the untreated control group to give a measure of the changes in the quantity of CD31 present
in the junctions. The loss of CD31 labelling from the cell-to-cell junctions induced by EP is
illustrated in Figure 4 (Fig. 4A, Supp Movie 3) and was associated with a rapid extravasation
of 70 kDa FD from the exposed venules (Fig. 2, Fig. 4).
Fig. 4. Changes in the volume of CD31 labelled cell -to-cell junctions in relation to 70 kDa FD leakage.
Representative images of the changes in the determined volume of CD31 labelled cell -to-cell junctions in
Control group and in the group where EP was applied (A). Eight square wave electric pulses, amplitude per
distance 1300 V/cm, pulse length 100 μs, repetition frequency 1 Hz, were applied in EP groups. 70 kDa FD was
injected i.v 3 min before the first image. Scale bar: 100 µm. The volume of CD31 labelled cell -to-cell junctions
normalized to control (n=10) in relation to time (left y axis) was plotted together with relative mean
fluorescence intensity changes for 70 kDa FD (right y axis) to show time relation between them (B, C). In (B)
the group of mice where there was no return of CD31 positive volume after EP is shown (n=6) and in (C) the
group of mice where there was return of labeling after EP (n=6) is shown. Error bars indicate SEM.
The time course of cell-to-cell junctions’ changes was measured by the relative
variation of the volume of CD31 labelled voxels in the acquired 3D images of blood vessels
(Fig. 4B, C). A gradual and significant decrease in the volume of CD31 labelled voxels was
ACCEPTED MANUSCRIPT
ACC
EPTE
D M
ANU
SCR
IPT
obtained after EP with a return to the control levels in 8 out of 15 mice, which corresponded
to a decrease of relative variation of fluorescence intensity of 70 kDa FD (Fig. 4C). In
contrast, the volume of CD31 labelled voxels in the remaining 7 mice continued to decrease
throughout the observation period (Fig. 4B). A small linear decrease of ~8% per image was
also observed in the control group due to Alexa Fluor® 555 photo bleaching, however, this
decrease was significantly lower compared to what was observed with EP group (Supp Fig. 4,
Supp Movie 4).
These results could demonstrate that the initial significant alterations in endothelial
cell-to-cell junctions correlated with an increased leakage of 70 kDa FD from blood vessels
into the tissue and a partial restoration of these junctions in some vessels. This was confirmed
by direct comparison of the timeline of relative variation of mean fluorescence intensity for
70 kDa FD and the changes in the volume of CD31 labeled junctions (Fig. 4B, C), where it
was clearly demonstrated that the largest changes in relative variation of mean fluorescence
intensity are achieved simultaneously with the largest decrease in the volume of CD31
labelled junctions (Fig. 4B). In the group where the cell-to-cell junctions labelling did not
return, the relative variation of mean fluorescence intensity reached a plateau level ~20 min
after EP, however it did not return to pretreatment levels, demonstrating that the permeability
of blood vessel wall for 70 kDa FD was still slightly increased (Fig. 4B). In contrast, in the
group where the return of cell-to-cell junctions labeling was observed, the relative variation
of mean fluorescence intensity returned to pretreatment levels indicating a complete
abrogation of 70 kDa FD leakage from blood vessels, thus resealing of blood vessel wall
(Fig. 4C). The observed changes were not related to the initial diameter of the blood vessels,
nor to the initial volume of CD31 labelled cell-to-cell junctions (Supp Fig. 5 and 6).
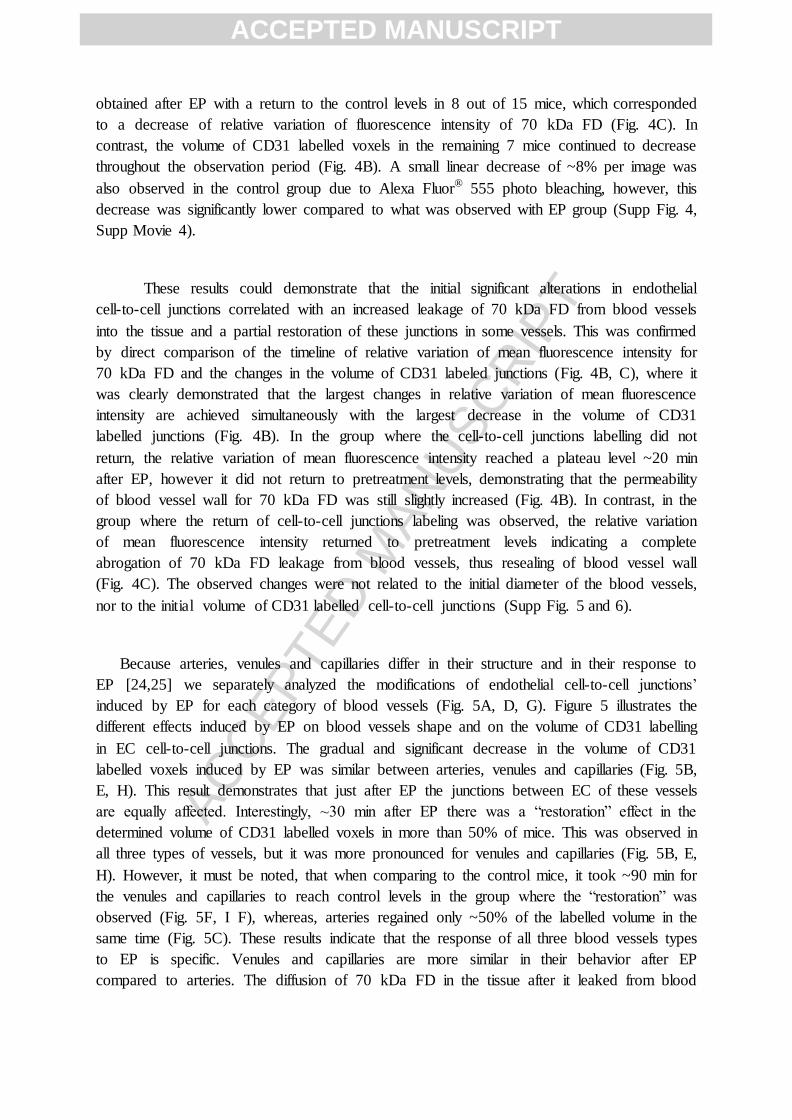
Because arteries, venules and capillaries differ in their structure and in their response to
EP [24,25] we separately analyzed the modifications of endothelial cell-to-cell junctions’
induced by EP for each category of blood vessels (Fig. 5A, D, G). Figure 5 illustrates the
different effects induced by EP on blood vessels shape and on the volume of CD31 labelling
in EC cell-to-cell junctions. The gradual and significant decrease in the volume of CD31
labelled voxels induced by EP was similar between arteries, venules and capillaries (Fig. 5B,
E, H). This result demonstrates that just after EP the junctions between EC of these vessels
are equally affected. Interestingly, ~30 min after EP there was a “restoration” effect in the
determined volume of CD31 labelled voxels in more than 50% of mice. This was observed in
all three types of vessels, but it was more pronounced for venules and capillaries (Fig. 5B, E,
H). However, it must be noted, that when comparing to the control mice, it took ~90 min for
the venules and capillaries to reach control levels in the group where the “restoration” was
observed (Fig. 5F, I F), whereas, arteries regained only ~50% of the labelled volume in the
same time (Fig. 5C). These results indicate that the response of all three blood vessels types
to EP is specific. Venules and capillaries are more similar in their behavior after EP
compared to arteries. The diffusion of 70 kDa FD in the tissue after it leaked from blood
ACCEPTED MANUSCRIPT
ACC
EPTE
D M
ANU
SCR
IPT
vessels unable us to perform similar analysis for 70 kDa FD leakage, as it was not possible to
retrospectively determine which blood vessel was the source.
Fig. 5. Blood vessel type dependent changes in CD31 labelled cell -to-cell junctions volume after EP. The
imaged 3D volume was separated into 3 parts to include only arteriole (A), venule (D) or capillaries (G) and
the volume of CD31 labelled cell-to-cell junctions was plotted against time for each type of blood vessels (B, E,
H). Eight square wave electric pulses, amplitude per distance 1300 V/cm, pulse length 100 μs, repetition
frequency 1 Hz, were applied in EP groups. Obtained volumes were normalized to the con trol level and plotted
against time to correct for photobleaching (C, F, I). Control – mice where no EP was applied (n=12).
EP_return – mice where EP was applied and return of junctions was observed (n=8), EP_no return – mice
where EP was applied and no return of junctions was observed (n=7). Scale bar: 50 µm. Error bars indicate
SEM. *P<0.05 in comparison to control (B, E, H) and P<0.05 in comparison to EP_no return group (C, F, I).
3.3 In vivo effects of EP on the fluorophore linked to CD31 antibody
To confirm that the reduction of the CD31 associated fluorescence intensity was due to a
decrease in the number of detected CD31, it was needed to make sure that it was not
associated to a decrease in the fluorophore quantum yield (modification of the environment
or energy transfer) due to an alteration of the environment. The fluorescence emission for a
given excitation intensity I0 is dependent on the number of emitting molecules N and on the
fluorophore quantum yield If = K I0 N
The change in quantum yield can be accessed by the experimental evaluation of the
fluorophore lifetime by FLIM. We looked at the modification of the fluorescence lifetime of
Alexa Fluor 647 induced by EP. The choice of Alexa Fluor 647 was due to its longer lifetime
compared to Alexa Fluor 555 (1 ns compared to 0.3 ns) which was used in the rest of the
study. Furthermore, a previous study reported that Alexa Fluor 647 conjugated to a kinase
ACCEPTED MANUSCRIPT
ACC
EPTE
D M
ANU
SCR
IPT
inhibitor could undergo changes in fluorescence lifetime between the free and bound states
[31]. Thus, the change in fluorescence lifetime of Alexa Fluor 647 fluorophore, directly
linked to its quantum yield, may be indicative of the changes in its environment and could
result in a decreased fluorescence intensity, thus skewing the volumetric measurements of
CD31 labelled cell-to-cell junctions.
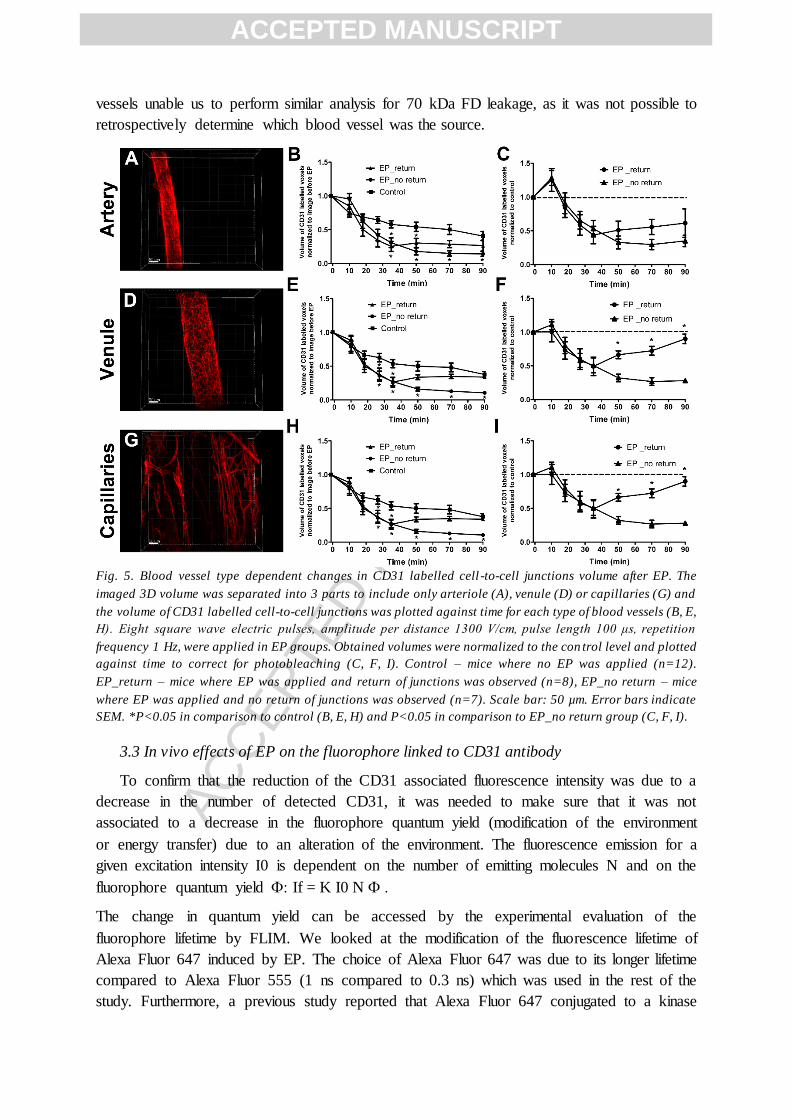
In order to study whether the lifetime of Alexa 647 was modified, we i.v. injected
Alexa 647 CD31 antibody and we performed FLIM 4h after the injection of antibodies. FLIM
was performed before and after EP. The Alexa 647 fluorescence lifetime in cell-to-cell
junctions was measured for each pixel by fitting the decay curve with a single-exponential
model and represented by a heat map (Fig 6A, B). The measurement performed before and
after EP did not show significant modification of Alexa 647 lifetime (and quantum yield )
after EP (Fig. 6C). This result confirms that the loss of CD31 fluorescence intensity clearly
reflects the decrease of N – the number of detected fluorophores – and thus an alteration of
cell-to-cell junctions and is not due to a modification of the quantum yield of the fluorophore
and thus a modification of its environment.
Fig 6. Fluorescence lifetime of Alexa 647 bound to anti-CD31 antibody before and after EP. Representative
FLIM images of 3D volumes before and after EP (13 min after EP) showing Alexa 647 lifetime in cell-to-cell
junctions for each pixel. Alexa 647 lifetime is represented as a heat-map in picosecond (ps) (A and B). Scale
bar: 30 µm. The measured mean Alexa 647 lifetime was not statistically significantly different before and after
EP (C). Eight square wave electric pulses, amplitude per distance 1300 V/cm, pulse length 100 μs, repetition
frequency 1 Hz, were applied in EP groups (n=3).
3.4 In vitro effects of EP on endothelial cell-to-cell junction proteins
ACCEPTED MANUSCRIPT
ACC
EPTE
D M
ANU
SCR
IPT
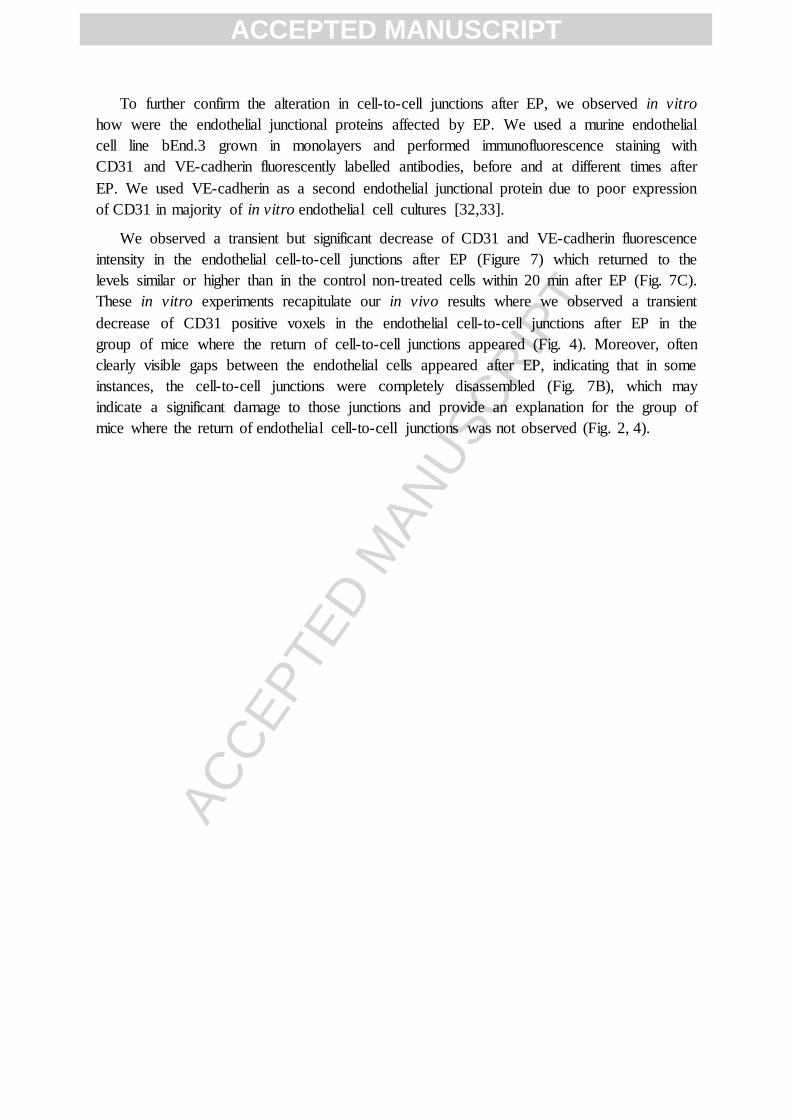
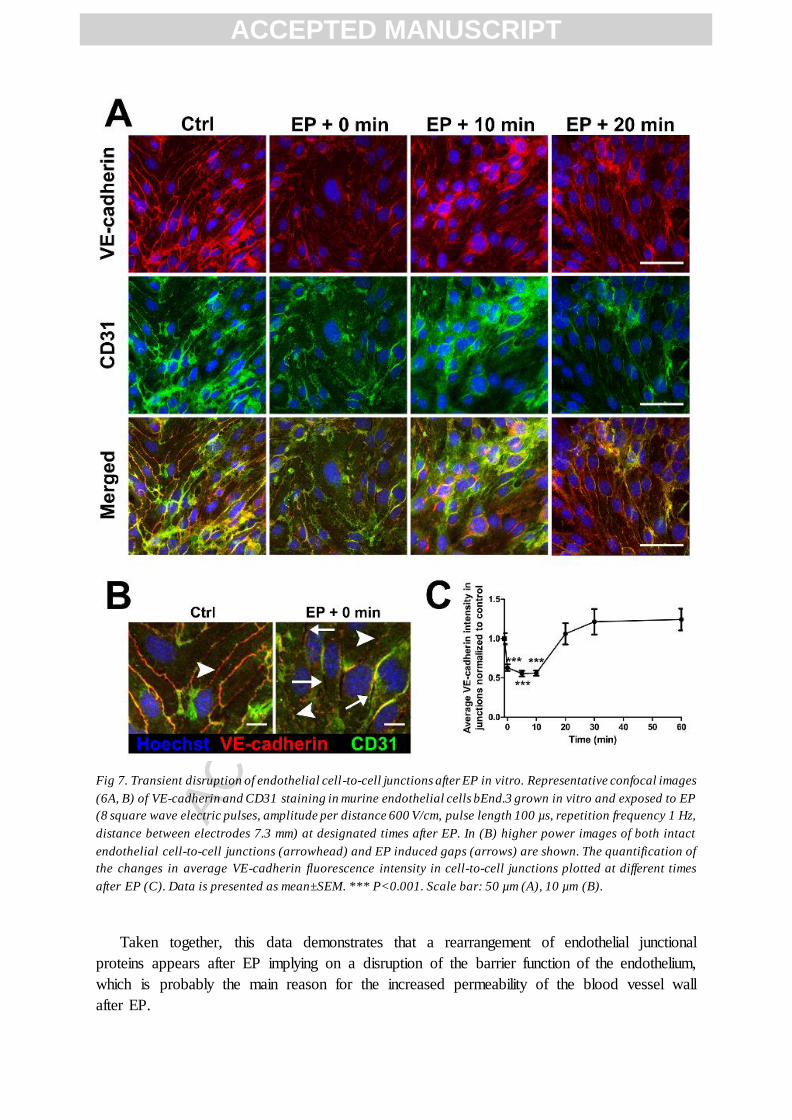
To further confirm the alteration in cell-to-cell junctions after EP, we observed in vitro
how were the endothelial junctional proteins affected by EP. We used a murine endothelial
cell line bEnd.3 grown in monolayers and performed immunofluorescence staining with
CD31 and VE-cadherin fluorescently labelled antibodies, before and at different times after
EP. We used VE-cadherin as a second endothelial junctional protein due to poor expression
of CD31 in majority of in vitro endothelial cell cultures [32,33].
We observed a transient but significant decrease of CD31 and VE-cadherin fluorescence
intensity in the endothelial cell-to-cell junctions after EP (Figure 7) which returned to the
levels similar or higher than in the control non-treated cells within 20 min after EP (Fig. 7C).
These in vitro experiments recapitulate our in vivo results where we observed a transient
decrease of CD31 positive voxels in the endothelial cell-to-cell junctions after EP in the
group of mice where the return of cell-to-cell junctions appeared (Fig. 4). Moreover, often
clearly visible gaps between the endothelial cells appeared after EP, indicating that in some
instances, the cell-to-cell junctions were completely disassembled (Fig. 7B), which may
indicate a significant damage to those junctions and provide an explanation for the group of
mice where the return of endothelial cell-to-cell junctions was not observed (Fig. 2, 4).
ACCEPTED MANUSCRIPT
ACC
EPTE
D M
ANU
SCR
IPT
Fig 7. Transient disruption of endothelial cell-to-cell junctions after EP in vitro. Representative confocal images
(6A, B) of VE-cadherin and CD31 staining in murine endothelial cells bEnd.3 grown in vitro and exposed to EP
(8 square wave electric pulses, amplitude per distance 600 V/cm, pulse length 100 µs, repetition frequency 1 Hz,
distance between electrodes 7.3 mm) at designated times after EP. In (B) higher power images of both intact
endothelial cell-to-cell junctions (arrowhead) and EP induced gaps (arrows) are shown. The quantification of
the changes in average VE-cadherin fluorescence intensity in cell-to-cell junctions plotted at different times
after EP (C). Data is presented as mean±SEM. *** P<0.001. Scale bar: 50 µm (A), 10 µm (B).
Taken together, this data demonstrates that a rearrangement of endothelial junctional
proteins appears after EP implying on a disruption of the barrier function of the endothelium,
which is probably the main reason for the increased permeability of the blood vessel wall
after EP.
ACCEPTED MANUSCRIPT
ACC
EPTE
D M
ANU
SCR
IPT
4. DISCUSSION
In this study, we aim to study in vivo alteration of endothelial cell-to-cell junctions
occurring after EP. Our experimental setting using DWC models in mice in combination with
multiphoton microscopy allowed direct observation of blood vessels at the single endothelial
cell level in 3D. By doing so, we could measure in situ the alterations in cell-to-cell junctions
and correlate them to the previously known changes in blood vessel permeability after EP
[24,25]. Delivery of validated EP parameters used in clinical applications [11] to normal
tissue (skin) led to an immediate constriction of blood vessels which correlated with the
change in the shape of EC. This was followed by an increase in permeability of blood vessels
for 70 kDa FD and a decrease in the volume of CD31 labelled cell-to-cell junctions.
Interestingly, both the permeability of blood vessels and the volume of CD31 labelled cell-to-
cell junctions returned to initial values in only 50% of the treated mice, whereas in the others
it did not.
First, we set out to confirm that previously reported findings of the effects of EP on
blood vessels can be observed using our model. We used a fluorescently labelled antibody
targeting CD31 to label the endothelial cell-to-cell junctions and used multiphoton
microscopy to confirm the previously reported changes in the blood vessels diameters after
EP in 3D (Fig. 3) [24,25]. Indeed, the reduction of the diameter of both arteries and venules
was observed after EP (Fig. 3); however, due to the temporal limitation of the imaging
technique we were not able to follow this in more detail. Fluorescently labelled CD31
antibodies have already been used to label endothelial cell-to-cell junctions in vivo, however,
not for the purpose to follow spatiotemporal changes of single EC in DWC model [34,35].
Currently, the first phase of vascular response to EP is attributed to direct smooth muscle
cells electrical field stimulation and followed by indirect sympathetically-mediated
vasoconstriction acting on smooth muscles of afferent arteries, leading to a rapid and
profound but short-lived initial decrease in blood flow [15]. Nevertheless, venules are also
affected but to a lesser extent [24,25,27]. This short-lived vasoconstriction was shown to last
up to 8 min and resulted in a so-called vascular lock effect, i.e. abrogation of blood flow [24].
Despite the temporal limitations of our approach we were still able to confirm that
vasoconstriction after EP is detectable in our model. Furthermore, we provide for the first
time the evidence that the change in the diameter of blood vessels after EP is associated with
a change in the shape of EC, both in venules and in arteries in 3D in vivo (Fig. 3).
Then, we used an i.v. injected 70 kDa FD as a model molecule for drugs and
oligonucleotides [36] and confirmed in 3D the increase of permeability of blood vessels after
EP for this size of molecules (Fig. 2). As previously reported, EP increases permeability of
blood vessels for various sizes of macromolecules spanning up to 2000 kDa, which implies
that this technique could be used for increased local delivery of a plethora of drugs including
nanoparticles or PEGylated liposomes [24]. All of the mice where EP was applied showed
statistically significantly increased permeability for 70 kDa FD; however, we observed a
separation of the scale of their response into 2 distinct groups. The first group of mice (n=7)
showed a high increase in the permeability of blood vessels, demonstrated by >600% change
in relative mean fluorescence intensity compared to pretreatment values, whereas the second
group (n=8) showed only a moderate increase in the permeability (~60% change in relative
ACCEPTED MANUSCRIPT
ACC
EPTE
D M
ANU
SCR
IPT
mean fluorescence intensity compared to pretreatment values). As this was not yet reported in
the literature, we decided to more closely investigate this phenomenon.
Based on the published in vitro studies showing reversible structural changes of the
cytoskeleton and cell junctions concomitant with a rapid rise in endothelial monolayer
permeability [28,37,38] and histological analysis of early time points of the tissues exposed
to EP, showing alterations in the shape of EC [8,25,27], we chose to more closely inspect the
changes in the endothelial cell-to-cell junctions. Additionally, recent reports showed that
magnetic forces can increase the permeability of blood vessels by disrupting endothelial cell-
to-cell junctions [39]. Therefore, we decided to follow the changes in the volume of CD31
labelled junctions after EP with time and showed that, indeed, the cell-to-cell junctions are
affected by EP (Fig. 4, 5). We have shown that the volume of CD31 labelled junctions is
reduced after EP and that we could see the same separation into 2 distinct groups as was the
case with the increase in the permeability of blood vessels for 70 kDa FD (Fig. 4). In the
group of mice where the increase of permeability was moderate, we have observed that the
volume of CD31 labelled junctions’ returns to the levels comparable to the control group and
that the turning point is ~30 min after EP, which coincides with the decrease in the
permeability of blood vessels for 70 kDa FD (Fig. 4B). In contrast, in the group of mice
where there was a high increase in the permeability of blood vessels the volume of the CD31
labelled junctions was decreasing throughout the observation period (Fig. 4C). However,
similarly as in the first group, at ~30 min after EP, there was a change in the rate of
disappearance of the labelled junctions that coincided with the decrease in the permeability of
blood vessels for 70 kDa FD (Fig. 4C). To further elaborate whether this measurement could
be over-dependent on a certain type of blood vessels, we have separately analyzed the effect
of EP on the volume of CD31 labelled cell-to-cell junctions in arteries, venules, and
capillaries and showed that they respond in a similar manner (Fig. 5). Moreover, we
confirmed using FLIM that the observed changes in the quantified volume of CD31 labelled
cell-to-cell junctions are not due to a modification that EP would cause to the environment of
the fluorophore attached to the CD31 antibody, as was indicated by the fluorophore retaining
the same fluorescence lifetime as before EP (Fig 6). An explanation for the observed decrease
in the volume of CD31 labelled junctions could be that CD31 (PECAM-1) is constantly
recycled and it can take up to 30 min in vitro to completely replenish the cell-to-cell junctions
with CD31 [40,41], or alternatively it is redistributed in the cellular membrane. This is in line
with the hypothesis that EP disrupts the endothelial junctions and then CD31 is either
recycled back to the endothelial membrane or redistributed back to the junctions, which was
confirmed by our in vivo observations in the group where we have seen the return of CD31
labelling. We confirmed this phenomenon in our in vitro experiments with murine endothelial
cells bEnd.3 grown as monolayers, where EP transiently reduced the quantity of VE-cadherin
present in the cell-to-cell junctions, which has returned to control levels within 20 min after
EP (Fig. 7). This shows, that the predominant reason for the in vivo observed return of CD31
labelling after EP is the re-establishment of endothelial cell-to-cell junctions and not the re-
labelling of CD31 proteins by the remaining circulating antibody (half-life of rat IgG2a
antibodies can be more than 4 days [42]). Notably, we have also observed presence of gaps
between the endothelial cells after EP, which were still present even 20 min after EP, but
ACCEPTED MANUSCRIPT
ACC
EPTE
D M
ANU
SCR
IPT
absent in control non-treated monolayers (Fig. 7B). These gaps would indicate an extensive
damage and complete disassembly of the endothelial cell-to-cell junctions and might be the
main channel through which macromolecules extravasate after EP. Conversely, they might
explain the behavior of the second group of mice where we did not see the return of CD31
labelled cell-to-cell junctions. Another possible explanation for the observed differences
between the two groups of mice could also be the result of the heterogeneity of the electric
field distribution in tissues, which would then result in local differences in response to EP. As
our field of view in IVMM was only ~1.6% (~0.5x0.5 mm) of the entire affected area, we
could be imaging areas that were more or less affected by EP. A further proof to the
heterogeneity of the response of blood vessels to EP is the stochastic focal aggregation of
platelets on blood vessel walls (Supp Fig. 7), which would imply that there is a difference in
the extent of the disruption of cell-to-cell junctions within the same mouse/vessel. One
possible explanation for the reduction of the CD31 labelling in the cell-to-cell junctions could
also be the inactivation of the Rho kinase [28]. Kanthou et al showed that EP besides
destabilizing the endothelial cytoskeleton also reduces the basal levels of phosphorylated
myosin light chains implicating Rho kinase inactivation [28]. As activation of Rho proteins
necessitates their translocation and association with membrane components it is likely that EP
inactivates Rho by preventing its association with the cell membrane, thus preventing the re-
establishment of cell-to-cell junctions after EP, which could consequently lead to
internalization of CD31 as it is no longer in a homophilic CD31/CD31 interactions between
neighboring endothelial cells [43].
The currently proposed model of the effects of EP on blood vessels is a two-phase
model. In this model, the second phase, based on the data obtained in muscle, was attributed
to the permeabilization of muscle fibers and endothelial cell membranes due to EP leading to
increased interstitial pressure and decreased intravascular pressure. This model also suggests
that the increase in the permeability of blood vessels can be attributed to the increase in the
permeability of the membranes of EC, which are indeed exposed to higher electric field
strength than surrounding tissue [8,15]. This prediction was based on the resealing kinetics of
cellular membranes after EP in vitro and in vivo, which were shown to be in the order of 10
min [15,44,45]. Moreover, it was already shown that the increased permeability of blood
vessels after EP, even for large macromolecules, can actually persist longer than it can be
explained solely by the membrane resealing kinetics after EP [24,25]. Even in in vitro
settings, where it is well established that membrane resealing after EP is completed within 10
min after EP, otherwise the cell is regarded as irreversibly electroporated, it was repeatedly
shown that monolayers of EC still have increased permeability for macromolecules even 40
min after EP [28,37,38]. Those in vitro investigations pinpointed endothelial cell-to-cell
junctions as a possible mechanism responsible for the observed increased permeability of
blood vessels in vivo [28]. We now provide a direct in vivo proof on the level of single EC
that the alterations in endothelial cell-to-cell junctions after EP are the main mechanism
responsible for the observed increased permeability of blood vessels for macromolecules,
which was demonstrated by the strong correlation between extravasation of 70kDa FD from
ACCEPTED MANUSCRIPT
ACC
EPTE
D M
ANU
SCR
IPT
blood vessels and the changes in the volume of CD31 labelled cell-to-cell junctions.
Although, our investigations can conclusively show the importance of cell-to-cell junctions in
the increased permeability of normal blood vessels, this may not necessarily reflect the
changes in the tumor vasculature. However, as one of the main hallmarks of tumor
vasculature is that it is inherently leaky and does not have proper organization of endothelial
cell-to-cell junctions, the effects of EP on their organization might be diminished or even
absent. Additionally, as previously shown, the main effect of EP on tumor vasculature is a
profound and long lasting vascular lock, which lasts longer than the disruption of the cell-to-
cell junctions that was observed in current study [17].
The intriguing finding of this study is the separation of mice where EP was applied
into 2 distinct groups: a group with moderate increase in permeability and return of labelled
cell-to-cell junctions and a group with high increase in permeability and without any return of
labelled cell-to-cell junctions. As mentioned before, the return of the CD31 labelling in the
first group could be explained with the CD31 recycling hypothesis, but this cannot explain
the observed behavior in the second group. The first hallmark of the second group is a high
increase in permeability of blood vessels for 70 kDa FD after EP, which indicates that the
integrity of blood vessel wall was significantly perturbed and that molecules from the
surrounding tissue can gain access to the circulating blood as well. This was confirmed
previously and it can be exploited for systemic delivery of macromolecules after local
application of EP to the skin. [46]. But this also shows that macromolecules such as collagen
and tissue factor (TF), which are a key component of platelet activation pathway [47–49], are
exposed to the circulating blood after EP. Both molecules serve as a defense against
perturbations in the blood vessel wall, collagen acting as a first line defense and TF as a
second line of defense, but both of them, once in contact with circulating blood, trigger the
platelet activation pathway. The first step in platelet activation pathway is attachment of
platelets to the blood vessel wall at the site of the “injury” and once activated they further
propagate clot formation [48]. In the case, when the cell-to-cell junctions are sufficiently
perturbed, the forming clot fills the gap between neighboring cells to prevent leakage of
macromolecules from blood vessels. However, this process is not immediate and is dependent
on the size of the injury [48,49]. The activation of platelets and formation of clots could be
the reason for the observed lack of the return of labelled junctions in our settings, as the
formation of a clot and its binding into the cell-to-cell junctions would prevent the
internalized labelled CD31 to be recycled back into the cell-to-cell junction. Indeed this is
what we have seen in our experiments, where labeled platelets formed clots at the blood
vessel wall after EP (Supp Fig. 7). Interestingly, clots were formed stochastically, implying
that the effect of EP on blood vessel permeability and disruption of cell-to-cell junctions is
heterogeneous even within the same mouse. Furthermore, the areas associated to platelet
aggregation had a higher increase of permeability of blood vessel wall as indicated by
increased leakage of 70 kDa FD. The subsequent event after platelet activation and clot
formation is local inflammation, which can increase permeability of blood vessels for a
prolonged period of time, as was observed previously and confirmed in our study [8,25].
Local inflammation also recruits leukocytes to the site of injury [50], which was previously
confirmed when EP was applied to normal skin that can then facilitate uptake and
ACCEPTED MANUSCRIPT
ACC
EPTE
D M
ANU
SCR
IPT
presentation of new antigens to the host immune system. This mechanism is currently
exploited in DNA vaccination, where EP dramatically increases its effectiveness and it could
also be exploited in combination with immunotherapy [51–53].
5. CONCLUSIONS
The use of EP to deliver a wide range of macromolecules, ranging from cytostatic
drugs to plasmid DNA, to either normal tissue or to tumors is expanding [52,54]. However,
the underlying mechanisms that are essentially a tissue specific response to EP remain poorly
understood. To our best knowledge, our study shows for the first time in vivo in 3D on a
single EC level that alterations in endothelial cell-to-cell junctions play an important role in
the response of blood vessels to EP. Furthermore, this event alone could possibly trigger the
platelet activation cascade and formation of clots, leading to local inflammation. Thus,
knowledge of the vascular response to EP at early as well as at late time points after EP can
lead to better planning of EP based treatment as well as providing new potential targets for
increasing the efficacy of either delivery of macromolecules to tissues or increasing DNA
vaccination efficiency.
6. ACKNOWLEDGMENTS
Research was conducted in the scope of LEA EBAM (French Slovenian European Associated
Laboratory: Pulsed Electric Fields Applications in Biology and Medicine) and COST Action
TD1104. The authors acknowledge the financial support from the state budget by the
Slovenian Research Agency (program no. P3–0003 and P4-0053, project no. J3-6793, J3-
6796, J3-5505), the “Toulouse Réseau Imagerie and Anexplo” core IPBS facilities support
(Genotoul, Toulouse, France) which was supported by the Association Recherche Cancer
(n°5585), Region Midi Pyrenees (CPER) and Grand Toulouse cluster. The Midi-Pyrenees
Region has financially supported this work (Grant 11052700).
7. DISCLOSURES
The authors have no relevant financial interest or financial conflict apart from those
disclosed.
ACCEPTED MANUSCRIPT
ACC
EPTE
D M
ANU
SCR
IPT
8. REFERENCES
[1] D. Alex, E.C. Leong, Z.-J. Zhang, G.T.H. Yan, S.-H. Cheng, C.-W. Leong, et al., Resveratrol derivative, trans-3,5,4’-trimethoxystilbene, exerts antiangiogenic and vascular-disrupting effects in zebrafish through the downregulation of VEGFR2 and
cell-cycle modulation., J. Cell. Biochem. 109 (2010) 339–46. doi:10.1002/jcb.22405.
[2] Z. Jiang, M. Wu, J. Miao, H. Duan, S. Zhang, M. Chen, et al., Deoxypodophyllotoxin
exerts both anti-angiogenic and vascular disrupting effects., Int. J. Biochem. Cell Biol. 45 (2013) 1710–9. doi:10.1016/j.biocel.2013.04.030.
[3] E. Pasquier, S. Sinnappan, M.A. Munoz, M. Kavallaris, ENMD-1198, a new analogue
of 2-methoxyestradiol, displays both antiangiogenic and vascular-disrupting properties., Mol. Cancer Ther. 9 (2010) 1408–18. doi:10.1158/1535-7163.MCT-09-
0894.
[4] X. Ren, M. Dai, L.-P. Lin, P.-K. Li, J. Ding, Anti-angiogenic and vascular disrupting effects of C9, a new microtubule-depolymerizing agent., Br. J. Pharmacol. 156 (2009)
1228–38. doi:10.1111/j.1476-5381.2009.00112.x.
[5] T. Dolinsek, B. Markelc, G. Sersa, A. Coer, M. Stimac, J. Lavrencak, et al., Multiple
Delivery of siRNA against Endoglin into Murine Mammary Adenocarcinoma Prevents Angiogenesis and Delays Tumor Growth, PLoS One. 8 (2013).
[6] T. Dolinsek, B. Markelc, M. Bosnjak, T. Blagus, L. Prosen, S. Kranjc, et al., Endoglin
silencing has significant antitumor effect on murine mammary adenocarcinoma mediated by vascular targeted effect., Curr. Gene Ther. 15 (2015) 228–44.
http://www.ncbi.nlm.nih.gov/pubmed/25619888 (accessed June 21, 2015).
[7] G. Sersa, M. Krzic, M. Sentjurc, T. Ivanusa, K. Beravs, V. Kotnik, et al., Reduced blood flow and oxygenation in SA-1 tumours after electrochemotherapy with
cisplatin., Br. J. Cancer. 87 (2002) 1047–54. doi:10.1038/sj.bjc.6600606.
[8] G. Sersa, T. Jarm, T. Kotnik, A. Coer, M. Podkrajsek, M. Sentjurc, et al., Vascular
disrupting action of electroporation and electrochemotherapy with bleomycin in murine sarcoma., Br. J. Cancer. 98 (2008) 388–98. doi:10.1038/sj.bjc.6604168.
[9] E. Neumann, M. Schaefer-Ridder, Y. Wang, P.H. Hofschneider, Gene transfer into
mouse lyoma cells by electroporation in high electric fields., EMBO J. 1 (1982) 841–5. http://www.pubmedcentral.nih.gov/articlerender.fcgi?artid=553119&tool=pmcentrez&
rendertype=abstract (accessed April 11, 2016).
[10] L.M. Mir, H. Banoun, C. Paoletti, Introduction of definite amounts of nonpermeant molecules into living cells after electropermeabilization: direct access to the cytosol.,
Exp. Cell Res. 175 (1988) 15–25. http://www.ncbi.nlm.nih.gov/pubmed/3345798.
[11] M. Marty, G. Sersa, J.R. Garbay, J. Gehl, C.G. Collins, M. Snoj, et al., Electrochemotherapy – An easy, highly effective and safe treatment of cutaneous and
subcutaneous metastases: Results of ESOPE (European Standard Operating Procedures of Electrochemotherapy) study, Eur. J. Cancer Suppl. 4 (2006) 3–13.
doi:10.1016/j.ejcsup.2006.08.002.
[12] L.G. Campana, A.J.P. Clover, S. Valpione, P. Quaglino, J. Gehl, C. Kunte, et al., Recommendations for improving the quality of reporting clinical electrochemotherapy
studies based on qualitative systematic review., Radiol. Oncol. 50 (2016) 1–13.
ACCEPTED MANUSCRIPT
ACC
EPTE
D M
ANU
SCR
IPT
doi:10.1515/raon-2016-0006.
[13] G. Sersa, M. Cemazar, D. Miklavcic, Antitumor effectiveness of electrochemotherapy
with cis-diamminedichloroplatinum(II) in mice., Cancer Res. 55 (1995) 3450–5.http://www.ncbi.nlm.nih.gov/pubmed/7614485 (accessed May 1, 2016).
[14] S. Orlowski, J. Belehradek, C. Paoletti, L.M. Mir, Transient electropermeabilization ofcells in culture. Increase of the cytotoxicity of anticancer drugs., Biochem. Pharmacol.37 (1988) 4727–33. http://www.ncbi.nlm.nih.gov/pubmed/2462423 (accessed May 1,
2016).
[15] J. Gehl, T. Skovsgaard, L.M. Mir, Vascular reactions to in vivo electroporation:
characterization and consequences for drug and gene delivery., Biochim. Biophys.Acta. 1569 (2002) 51–8. http://www.ncbi.nlm.nih.gov/pubmed/11853957 (accessedMay 1, 2016).
[16] G. Sersa, M. Cemazar, D. Miklavcic, D.J. Chaplin, Tumor blood flow modifying effectof electrochemotherapy with bleomycin., Anticancer Res. 19 (1999) 4017–22.
http://www.ncbi.nlm.nih.gov/pubmed/10628347 (accessed May 1, 2016).
[17] B. Markelc, G. Sersa, M. Cemazar, Differential mechanisms associated with vasculardisrupting action of electrochemotherapy: intravital microscopy on the level of single
normal and tumor blood vessels., PLoS One. 8 (2013) e59557.doi:10.1371/journal.pone.0059557.
[18] M. Snoj, M. Cemazar, T. Srnovrsnik, S.P. Kosir, G. Sersa, Limb sparing treatment ofbleeding melanoma recurrence by electrochemotherapy., Tumori. 95 (2009) 398–402.http://www.ncbi.nlm.nih.gov/pubmed/19688986 (accessed May 1, 2016).
[19] B. Agerholm-Larsen, H.K. Iversen, P. Ibsen, J.M. Moller, F. Mahmood, K.S. Jensen,et al., Preclinical validation of electrochemotherapy as an effective treatment for brain
tumors., Cancer Res. 71 (2011) 3753–62. doi:10.1158/0008-5472.CAN-11-0451.
[20] I. Edhemovic, E. Brecelj, G. Gasljevic, M. Marolt Music, V. Gorjup, B. Mali, et al.,Intraoperative electrochemotherapy of colorectal liver metastases., J. Surg. Oncol. 110
(2014) 320–7. doi:10.1002/jso.23625.
[21] A. Al-Khadra, V. Nikolski, I.R. Efimov, The role of electroporation in defibrillation.,
Circ. Res. 87 (2000) 797–804. http://www.ncbi.nlm.nih.gov/pubmed/11055984(accessed April 30, 2016).
[22] B. Mali, T. Jarm, S. Corovic, M.S. Paulin-Kosir, M. Cemazar, G. Sersa, et al., The
effect of electroporation pulses on functioning of the heart., Med. Biol. Eng. Comput.46 (2008) 745–57. doi:10.1007/s11517-008-0346-7.
[23] B. Mali, V. Gorjup, I. Edhemovic, E. Brecelj, M. Cemazar, G. Sersa, et al.,Electrochemotherapy of colorectal liver metastases--an observational study of itseffects on the electrocardiogram., Biomed. Eng. Online. 14 Suppl 3 (2015) S5.
doi:10.1186/1475-925X-14-S3-S5.
[24] E. Bellard, B. Markelc, S. Pelofy, F. Le Guerroué, G. Sersa, J. Teissié, et al., Intravital
microscopy at the single vessel level brings new insights of vascular modificationmechanisms induced by electropermeabilization, J. Control. Release. 163 (2012) 396–403.
[25] B. Markelc, E. Bellard, G. Sersa, S. Pelofy, J. Teissie, A. Coer, et al., In vivomolecular imaging and histological analysis of changes induced by electric pulses used
ACCEPTED MANUSCRIPT
ACC
EPTE
D M
ANU
SCR
IPT
for plasmid DNA electrotransfer to the skin: a study in a dorsal window chamber in mice., J. Membr. Biol. 245 (2012) 545–54. doi:10.1007/s00232-012-9435-5.
[26] S. Corovic, B. Markelc, M. Dolinar, M. Cemazar, T. Jarm, Modeling of microvascular permeability changes after electroporation., PLoS One. 10 (2015) e0121370.
doi:10.1371/journal.pone.0121370.
[27] T. Jarm, M. Cemazar, D. Miklavcic, G. Sersa, Antivascular effects of electrochemotherapy: implications in treatment of bleeding metastases., Expert Rev.
Anticancer Ther. 10 (2010) 729–46. doi:10.1586/era.10.43.
[28] C. Kanthou, S. Kranjc, G. Sersa, G. Tozer, A. Zupanic, M. Cemazar, The endothelial
cytoskeleton as a target of electroporation-based therapies., Mol. Cancer Ther. 5 (2006) 3145–52. doi:10.1158/1535-7163.MCT-06-0410.
[29] S.J. Lunt, C. Gray, C.C. Reyes-Aldasoro, S.J. Matcher, G.M. Tozer, Application of
intravital microscopy in studies of tumor microcirculation., J. Biomed. Opt. 15 (2010) 11113. doi:10.1117/1.3281674.
[30] W. Becker, Fluorescence lifetime imaging--techniques and applications., J. Microsc. 247 (2012) 119–36. doi:10.1111/j.1365-2818.2012.03618.x.
[31] C.S. Lebakken, Hee Chol Kang, K.W. Vogel, A Fluorescence Lifetime–Based Binding
Assay to Characterize Kinase Inhibitors, J. Biomol. Screen. 12 (2007) 828–841. doi:10.1177/1087057107304480.
[32] R.C. Brown, A.P. Morris, R.G. O’Neil, Tight junction protein expression and barrier properties of immortalized mouse brain microvessel endothelial cells., Brain Res. 1130 (2007) 17–30. doi:10.1016/j.brainres.2006.10.083.
[33] L. Song, J.S. Pachter, Culture of murine brain microvascular endothelial cells that maintain expression and cytoskeletal association of tight junction-associated proteins.,
In Vitro Cell. Dev. Biol. Anim. 39 (2003) 313–20. doi:10.1290/1543-706X(2003)039<0313:COMBME>2.0.CO;2.
[34] D. Proebstl, M.-B. Voisin, A. Woodfin, J. Whiteford, F. D’Acquisto, G.E. Jones, et al.,
Pericytes support neutrophil subendothelial cell crawling and breaching of venular walls in vivo., J. Exp. Med. 209 (2012) 1219–34. doi:10.1084/jem.20111622.
[35] M. Khurana, E.H. Moriyama, A. Mariampillai, B.C. Wilson, Intravital high-resolution optical imaging of individual vessel response to photodynamic treatment., J. Biomed. Opt. 13 (2008) 40502. doi:10.1117/1.2965545.
[36] A. Paganin-Gioanni, E. Bellard, J.M. Escoffre, M.P. Rols, J. Teissié, M. Golzio, Direct visualization at the single-cell level of siRNA electrotransfer into cancer cells., Proc.
Natl. Acad. Sci. U. S. A. 108 (2011) 10443–7. doi:10.1073/pnas.1103519108.
[37] C.J.W. Meulenberg, V. Todorovic, M. Cemazar, Differential cellular effects of electroporation and electrochemotherapy in monolayers of human microvascular
endothelial cells., PLoS One. 7 (2012) e52713. doi:10.1371/journal.pone.0052713.
[38] C.J.W. Meulenberg, M. Cemazar, Low-magnification image analysis of Giemsa
stained, electroporation and bleomycin treated endothelial monolayers provides reliable monolayer integrity data., Toxicol. In Vitro. 28 (2014) 502–9. doi:10.1016/j.tiv.2013.12.020.
[39] Y. Qiu, S. Tong, L. Zhang, Y. Sakurai, D.R. Myers, L. Hong, et al., Magnetic forces enable controlled drug delivery by disrupting endothelial cell-cell junctions, Nat.
ACCEPTED MANUSCRIPT
ACC
EPTE
D M
ANU
SCR
IPT
Commun. 8 (2017) 15594. doi:10.1038/ncomms15594.
[40] Z. Mamdouh, X. Chen, L.M. Pierini, F.R. Maxfield, W.A. Muller, Targeted recycling
of PECAM from endothelial surface-connected compartments during diapedesis., Nature. 421 (2003) 748–53. doi:10.1038/nature01300.
[41] S. Muro, R. Wiewrodt, A. Thomas, L. Koniaris, S.M. Albelda, V.R. Muzykantov, et al., A novel endocytic pathway induced by clustering endothelial ICAM-1 or PECAM-1., J. Cell Sci. 116 (2003) 1599–609. doi:10.1242/jcs.00367.
[42] J. V Peppard, E. Orlans, The biological half-lives of four rat immunoglobulin isotypes., Immunology. 40 (1980) 683–6.
http://www.ncbi.nlm.nih.gov/pubmed/7429545 (accessed October 17, 2017).
[43] J.R. Privratsky, P.J. Newman, PECAM-1: regulator of endothelial junctional integrity., Cell Tissue Res. 355 (2014) 607–19. doi:10.1007/s00441-013-1779-3.
[44] G. Pucihar, T. Kotnik, D. Miklavcic, J. Teissié, Kinetics of transmembrane transport of small molecules into electropermeabilized cells., Biophys. J. 95 (2008) 2837–48.
doi:10.1529/biophysj.108.135541.
[45] J.-M. Escoffre, E. Bellard, C. Faurie, S.C. Sébaï, M. Golzio, J. Teissié, et al., Membrane disorder and phospholipid scrambling in electropermeabilized and viable
cells., Biochim. Biophys. Acta. 1838 (2014) 1701–9. doi:10.1016/j.bbamem.2014.02.013.
[46] T. Blagus, B. Markelc, M. Cemazar, T. Kosjek, V. Preat, D. Miklavcic, et al., In vivo real-time monitoring system of electroporation mediated control of transdermal and topical drug delivery, J. Control. Release. 172 (2013) 862–871.
[47] A.F. Stein-Merlob, C.W. Kessinger, S.S. Erdem, H. Zelada, S.A. Hilderbrand, C.P. Lin, et al., Blood Accessibility to Fibrin in Venous Thrombosis is Thrombus Age-
Dependent and Predicts Fibrinolytic Efficacy: An In Vivo Fibrin Molecular Imaging Study., Theranostics. 5 (2015) 1317–27. doi:10.7150/thno.12494.
[48] B. Furie, B.C. Furie, Mechanisms of thrombus formation., N. Engl. J. Med. 359 (2008)
938–49. doi:10.1056/NEJMra0801082.
[49] K.G. Mann, K. Brummel-Ziedins, T. Orfeo, S. Butenas, Models of blood coagulation.,
Blood Cells. Mol. Dis. 36 (2006) 108–17. doi:10.1016/j.bcmd.2005.12.034.
[50] R.M. Rao, L. Yang, G. Garcia-Cardena, F.W. Luscinskas, Endothelial-dependent mechanisms of leukocyte recruitment to the vascular wall., Circ. Res. 101 (2007) 234–
47. doi:10.1161/CIRCRESAHA.107.151860b.
[51] M. Sällberg, L. Frelin, G. Ahlén, M. Sällberg-Chen, Electroporation for therapeutic
DNA vaccination in patients., Med. Microbiol. Immunol. 204 (2015) 131–5. doi:10.1007/s00430-014-0384-8.
[52] G. Sersa, J. Teissie, M. Cemazar, E. Signori, U. Kamensek, G. Marshall, et al.,
Electrochemotherapy of tumors as in situ vaccination boosted by immunogene electrotransfer., Cancer Immunol. Immunother. 64 (2015) 1315–27.
doi:10.1007/s00262-015-1724-2.
[53] C.Y. Calvet, L.M. Mir, The promising alliance of anti-cancer electrochemotherapy with immunotherapy., Cancer Metastasis Rev. (2016). doi:10.1007/s10555-016-9615-
3.
[54] M.L. Yarmush, A. Golberg, G. Sersa, T. Kotnik, D. Miklavcic, Electroporation-based
ACCEPTED MANUSCRIPT

ACC
EPTE
D M
ANU
SCR
IPT
technologies for medicine: principles, applications, and challenges., Annu. Rev. Biomed. Eng. 16 (2014) 295–320. doi:10.1146/annurev-bioeng-071813-104622.
ACCEPTED MANUSCRIPT
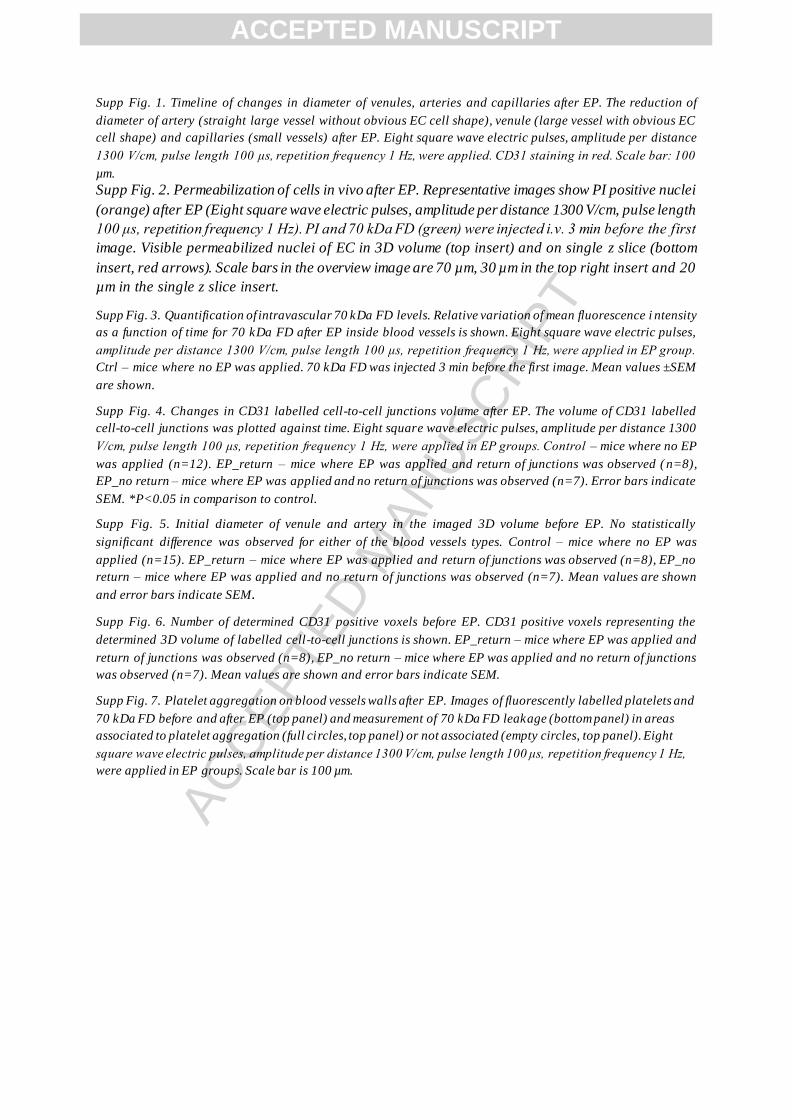
ACC
EPTE
D M
ANU
SCR
IPT
Supp Fig. 1. Timeline of changes in diameter of venules, arteries and capillaries after EP. The reduction of
diameter of artery (straight large vessel without obvious EC cell shape), venule (large vessel with obvious EC
cell shape) and capillaries (small vessels) after EP. Eight square wave electric pulses, amplitude per distance
1300 V/cm, pulse length 100 μs, repetition frequency 1 Hz, were applied. CD31 staining in red. Scale bar: 100
µm.
Supp Fig. 2. Permeabilization of cells in vivo after EP. Representative images show PI positive nuclei
(orange) after EP (Eight square wave electric pulses, amplitude per distance 1300 V/cm, pulse length
100 μs, repetition frequency 1 Hz). PI and 70 kDa FD (green) were injected i.v. 3 min before the first
image. Visible permeabilized nuclei of EC in 3D volume (top insert) and on single z slice (bottom
insert, red arrows). Scale bars in the overview image are 70 µm, 30 µm in the top right insert and 20
µm in the single z slice insert.
Supp Fig. 3. Quantification of intravascular 70 kDa FD levels. Relative variation of mean fluorescence i ntensity
as a function of time for 70 kDa FD after EP inside blood vessels is shown. Eight square wave electric pulses,
amplitude per distance 1300 V/cm, pulse length 100 μs, repetition frequency 1 Hz, were applied in EP group.
Ctrl – mice where no EP was applied. 70 kDa FD was injected 3 min before the first image. Mean values ±SEM
are shown.
Supp Fig. 4. Changes in CD31 labelled cell-to-cell junctions volume after EP. The volume of CD31 labelled
cell-to-cell junctions was plotted against time. Eight square wave electric pulses, amplitude per distance 1300
V/cm, pulse length 100 μs, repetition frequency 1 Hz, were applied in EP groups. Control – mice where no EP
was applied (n=12). EP_return – mice where EP was applied and return of junctions was observed ( n=8),
EP_no return – mice where EP was applied and no return of junctions was observed (n=7). Error bars indicate
SEM. *P<0.05 in comparison to control.
Supp Fig. 5. Initial diameter of venule and artery in the imaged 3D volume before EP. No statistically
significant difference was observed for either of the blood vessels types. Control – mice where no EP was
applied (n=15). EP_return – mice where EP was applied and return of junctions was observed (n=8), EP_no
return – mice where EP was applied and no return of junctions was observed (n=7). Mean values are shown
and error bars indicate SEM.
Supp Fig. 6. Number of determined CD31 positive voxels before EP. CD31 positive voxels representing the
determined 3D volume of labelled cell-to-cell junctions is shown. EP_return – mice where EP was applied and
return of junctions was observed (n=8), EP_no return – mice where EP was applied and no return of junctions
was observed (n=7). Mean values are shown and error bars indicate SEM.
Supp Fig. 7. Platelet aggregation on blood vessels walls after EP. Images of fluorescently labelled platelets and
70 kDa FD before and after EP (top panel) and measurement of 70 kDa FD leakage (bottom panel) in areas
associated to platelet aggregation (full circles, top panel) or not associated (empty circles, top panel). Eight
square wave electric pulses, amplitude per distance 1300 V/cm, pulse length 100 μs, repetition frequency 1 Hz,
were applied in EP groups. Scale bar is 100 µm.
ACCEPTED MANUSCRIPT

ACC
EPTE
D M
ANU
SCR
IPT
Graphical abstract
ACCEPTED MANUSCRIPT