HAY MOISTURE SENSOR DESIGN FOR ROUND BALE ...
53
HAY MOISTURE SENSOR DESIGN FOR ROUND BALE COLLECTION Bradley Rasmussen Leo McGuire April 9th, 2019 Abstract Hay moisture content is an important characteristic in hay yield estimation and is typically measured using a moisture sensor. In this project, a sensor for detecting moisture in unwrapped round bales of hay is designed for the RBM series of Groupe Anderson trailers. These trailers are equipped with a grabber arm and a large bed to pick up and transport bales of hay to a storage location. Hay moisture is important because it is directly correlated to the amount of nutrient held within the hay. It is also useful information prior to storage because inadequate moisture can lead to molding and rot in the bale. Our design will utilize electrical conductivity sensors to estimate the relative humidity of the bales. An actuated sensor will read up to 5 measurements throughout a depth profile of each bale in order to obtain an accurate average measurement and account for outlying data. Groupe Anderson is based in Victoriaville in southern Quebec, and thus the system will be designed to withstand relevant climate, weather, and terrain conditions. It was determined that an actuated invasive electrical conductivity sensor was most compatible with the desired trailer and gave the most precise readings, while maintaining an acceptable level of durability.
-
Upload
khangminh22 -
Category
Documents
-
view
0 -
download
0
Transcript of HAY MOISTURE SENSOR DESIGN FOR ROUND BALE ...
HAY MOISTURE SENSOR DESIGN FOR ROUND BALE COLLECTION
Bradley Rasmussen Leo McGuire
April 9th, 2019
Abstract
Hay moisture content is an important characteristic in hay yield estimation and is typically
measured using a moisture sensor. In this project, a sensor for detecting moisture in unwrapped
round bales of hay is designed for the RBM series of Groupe Anderson trailers. These trailers are
equipped with a grabber arm and a large bed to pick up and transport bales of hay to a storage
location. Hay moisture is important because it is directly correlated to the amount of nutrient held
within the hay. It is also useful information prior to storage because inadequate moisture can lead
to molding and rot in the bale. Our design will utilize electrical conductivity sensors to estimate
the relative humidity of the bales. An actuated sensor will read up to 5 measurements throughout
a depth profile of each bale in order to obtain an accurate average measurement and account for
outlying data. Groupe Anderson is based in Victoriaville in southern Quebec, and thus the system
will be designed to withstand relevant climate, weather, and terrain conditions. It was determined
that an actuated invasive electrical conductivity sensor was most compatible with the desired trailer
and gave the most precise readings, while maintaining an acceptable level of durability.

Rasmussen, McGuire
1
Table of Contents 1.0 Introduction 3
1.1 Vision Statement 4 1.2 Initial Needs Statement 4
2.0 Customer Needs Assessment 4 2.1 Weighting of Customer Needs 6
3.0 Revised Needs Statement and Target Specifications 7
4.0 External Search 7 4.1 Background Information 8
4.1.1 Bale Moisture Characteristics 8 4.1.2 Hay Yield Factors 9 4.1.3 Bulk Moisture Sensing 10 4.1.4 Electrical Conductivity Sensors 10 4.1.5 Capacitance Sensors 11 4.1.6 Microwave Sensors 11 4.1.7 Near Infrared Sensors 12
4.2 Benchmarking 12 4.3 Applicable Patents 14
4.3.1 Device and Method for Measuring Hay Bale Moisture 15 4.3.2 Bale Loader Moisture Sensing System 15
4.4 Applicable Standards 17 4.4.1 ASAE D251.2 Friction Coefficients of Chopped Forages 17 4.4.2 ASAE D245.6 Moisture Relationships of Plant-Based Agricultural Products 17 4.4.3 ANSI/ASAE S318.18 Safety for Agricultural Field Equipment 17 4.4.4 ASAE EP456 Test and Reliability Guidelines 18 4.4.5 ASTM A53/A53M-18 Standard Specification for Pipe, Steel, Black and Hot-Dipped, Zinc-Coated, Welded, Seamless 18
4.5 Applicable Constraints 18 4.5.1 Budget 19 4.5.2 Programming Expertise 19 4.5.3 Machining Expertise & Available Tools 19

Rasmussen, McGuire
2
5.0 Concept Generation 20 5.1 Non-invasive Sensors 20 5.2 Invasive Probe-style Sensors 21 5.3 Actuated Probe-style Sensors 21
6.0 Concept Selection 22 6.1 Data and Calculations for Feasibility & Effectiveness Analysis 22 6.2 Concept Screening 23 6.3 Concept Development, Scoring & Selection 24
7.0 Final Design 25 7.1 Function 25
7.1.1 Actuation System 25 7.1.2 Moisture Sensor 26 7.1.3 Support Frame 27
7.2 Manufacture, Assembly & Cost 28 7.2.1 Manufacturing Process 28 7.2.2 Initial Investment & Cost 29 7.2.3 Benefits & Savings 31 7.2.4 Cost-Benefit Analysis 32
7.3 Design Validation 7.3.1 Testing Methodology 33
7.3.2 Results 35 Figure X. Recorded Force Data 36 7.3.3 Discussion 36
7.4 Environmental & Social Considerations 37 7.4.1 Environmental Considerations 37 7.4.2 Health & Safety 38
8.0 Conclusions 40
References 41
Appendices 44 Appendix A: Supporting Documents 44 Appendix B: Detailed Calculations 45 Appendix C: Technical Drawings 45 Appendix D: Testing Results 49 Appendix E: Life Cycle Analysis 52

Rasmussen, McGuire
3
1.0 Introduction
Moisture sensors are an important tool in estimating moisture content in hay bales. In this
report, a moisture sensor is designed to operate on the RBM series of Group Anderson (GA)
trailers. These trailers are used to transport baled hay from the field to a desired location
determined by the operator. The desired location can be anywhere accessible by tractor, such as a
roofed barn or a bale row in another part of the field. Bales need to be transported because they
are dropped off at dispersed locations as the baler unit works throughout the field. The RBM
trailer makes use of a grabber arm with two fingers to pick up round bales of hay from the field
and place them onto the trailer. This grabber is designed for use with wrapped or unwrapped
large round bales, but not square bales. Two or three bales can be stacked before a pusher unit
pushes them further back on the trailer bed, making space for the next stack. The bed can be
tilted to automatically drop the bales at the desired location.
Measuring hay moisture content is important for many reasons in the context of hay
production. Most importantly, the moisture content is directly related to the nutrient content of
the plant matter. Because hay is most often used for animal feed, nutrient content is one of the
most important qualities of hay. Hay with increased nutrients is healthier for animal stocks and
sustains them more efficiently. In addition, hay with excessive moisture can lead to rot and
fungus growth, effectively rendering it useless for feed applications. Moisture also provides
better conditions for undesirable bacteria growth which can endanger animal health. Finally,
water is heavy in comparison to dry plant matter and so excessively moist bales require more
energy to transport.
The goal of the project is to produce as much useful data as possible for the clients. Three
sets of data will be produced to this end: general moisture data, bale moisture profile, and forces
applied. The prototype produced will enable this data to be collected, which can then be used to
validate future designs and products.
First, a literature review and external search of current products will be conducted. This
report will then utilize the engineering design process to design the best practical solution for
placing a moisture sensor on an RBM series trailer. The design will be considered successful if it
can obtain accurate and precise moisture readings and withstand all relevant forces applied.
Forces applied to both the mount and the sensor will be measured using load cells. Risks,

Rasmussen, McGuire
4
environmental and social considerations will be assessed. An economic analysis will also be
provided.
1.1 Vision Statement
Our systems service the agricultural industry by providing a practical method of obtaining
accurate hay moisture data in order to increase yield and improve harvest efficiency.
1.2 Initial Needs Statement
A moisture sensing system will be designed to accurately and precisely measure moisture
content of large round bales on the RBM series of GA trailers. There are currently no moisture
capabilities on this machinery. The system needs to obtain reliable, consistent results that allow
the consumer to determine an average value for the relative humidity of their hay. The system
will also need to withstand relevant forces applied by the machinery and the bale, as well as
relevant weather and climate conditions. Overall, the client requires a strong, reliable system that
can take moisture readings in each individual bale picked up by the trailer.
2.0 Customer Needs Assessment
A thorough customer needs assessment was conducted via communications during
scheduled meetings, phone calls, and emails. Scheduled meetings were conducted over
telephone, with all members of the two design teams present, and relevant GA employees. A
total of two meetings took place prior to prototyping, an initial meeting in September of 2018,
and a follow-up in October of the same year. The first meeting determined the scope, timeline,
and breakdown of the project, the equipment and resources available from the client, as well as
acceptable sensing options. The second meeting specified the trailers the design would be
implement on, the type of bale used, and provided an update on sensing options. A copy of the
interview guides from these meetings can be found in Figures 1 and 2 of Appendix A.
Further detailed observations were made via e-mail communications with the client.
Emails were kept short and point-form, with more complex topics and longer discussions
answered during meetings, as seen above. Table 1 presents the needs list that was determined
throughout the total of these communications.

Rasmussen, McGuire
5
Table 1. Initial Customer Needs List Obtained from Meetings and Observations
Functional
Applicable with large round bales
Wide moisture range (40-70%)
Accurate and precise (<5% error)
Manufacturing cost under $2500
Compatible
Function with RBMPRO2000 series trailers
Cannot restrict movement of other moving parts
Cannot interfere with electronics
Durable
Withstand relevant applied forces
Strong mounting point
Reliable electronic connections
Quebec weather resistant
Quebec climate resistant
User-friendly
Automated process
Ease of maintenance
Safe
Protection from impalement
Protection from entanglement
Table 2, found below, organizes the list of needs from Table 1 into four categories:
functionality, compatibility, durability, and user-friendliness. Weighting factors are provided for
each category, as determined in Section 2.1 below. Table 2 also highlights the different project
functions and constraints in italic and bold formatting, respectively.

Rasmussen, McGuire
6
Table 2. Hierarchical Customer Needs List with Weighting Factors
1. Functional (0.35) 1.1. Applicable to large round bales 1.2. Wide moisture range (40-70%)* 1.3. Accurate and precise (<5% error) 1.4. Manufacturing cost under $2500**
2. Compatible (0.35) 2.1. Function with RBMPRO2000 series trailers 2.2. Cannot restrict moving parts** 2.3. Cannot interfere with electronics**
3. Durable (0.20) 3.1. Withstand relevant applied forces 3.2. Strong mounting point 3.3. Reliable electronic connections 3.4. Weather-resistant 3.5. Climate-resistant
4. User-friendly (0.10) 4.1. Automated process* 4.2. Ease of maintenance 4.3. Safe
4.3.1. Protection from impalement* 4.3.2. Protection from entanglement*
*Functions listed in italics.
**Constraints listed in bold.
2.1 Weighting of Customer Needs
The four different categories of customer needs were weighted using the analytical
hierarchy process in a pairwise comparison chart. This chart can be found below in Table 3.
Weightings of each individual pairwise comparison were determined after communication with
the client and based on their expressed importance for each category. Functionality and
compatibility were both weighted higher than other categories because they both contain project
constraints and were deemed necessary by the client. This accounted for, all four criteria are
important to the client and are important to consider.

Rasmussen, McGuire
7
Table 3. Pairwise Comparison Chart of Customer Needs
Functional Compatible Durable User-friendly Total Weighting
Functional 1.00 1.00 2.00 3.00 7.00 0.35
Compatible 1.00 1.00 2.00 3.00 7.00 0.35
Durable 0.50 0.50 1.00 2.00 4.00 0.20
User-friendly 0.33 0.33 0.50 1.00 2.17 0.10
3.0 Revised Needs Statement and Target Specifications
A revised needs statement is outlined in this section, taking into consideration the
customer needs list and weighting. Currently, there is no efficient method of determining bale
moisture on a large scale after the bailing procedure has been completed. The design works to
resolve this problem using an automated, or near automated, system seamlessly integrated onto
an existing trailer. Indeed, the design must provide reliable results, must not break under normal
operating conditions, and must be safe and simple to operate.
These needs will be considered met if the design performs its task in a more practical
method than other available products outlined in Section 4.2 on benchmarking. It needs to work
as reliable as these products, but under the constraints defined in Table 2. Both the time elapsed
during the sensing process and the precision/accuracy of the readings will be tested to ensure the
design functions properly. It should not take more than three seconds to complete the process.
Simulations and physical load cells will be used to ensure the design is capable of withstanding
forces applied during normal use. The number of controls needed for its operation will also be
minimized, and there should be no more than two steps required. Finally, the prototype will be
presented on location at GA, with employees present to ensure the company’s needs are met.
4.0 External Search
The external search includes a literature review of background information, a
benchmarking process, a description of two relevant patents, a description of five standards
important to the design, and a list of applicable constraints. The literature review provides some
important contextual information as well as an overview of four sensing technologies.

Rasmussen, McGuire
8
4.1 Background Information
A brief review of important background information is presented in Sections 4.0.1, 4.0.2,
and 4.0.3 below. Next, five currently available technologies are benchmarked in order to
compare their respective features, and an external search of applicable patents, standards, and
constraints are provided. Finally, Section 4.5 discusses the business opportunity statement.
4.1.1 Bale Moisture Characteristics
Moisture in bales can vary depending on a number of characteristics. Therefore, it is
important to understand the qualities integral to moisture content and distribution within the bale.
Foremost, the physical qualities of the bale such as dimensions, volume, density, and weight.
The most common large round bale dimensions vary between 4.0-5.0ft (~1.2-1.5m) in diameter
and 4.0-6.0ft (~1.2-1.8m) in height (Martin, 2017). Round bales are cylindrical in shape,
meaning the total volume ranges between ~2.9-3.2m3. Density is difficult to estimate because it
can vary greatly depending on the baler unit used. In addition, a single baler unit can produce
bales of varying densities. That considered, most modern balers produce a bale that is between 9-
12lbs/ft3 (~144-192kg/m3) (Martin, 2017). Unfortunately, this variance in both volume and
density means a large range of possible weights. Ranging from the smallest and least dense
scenario with a weight of 450lbs (~205kg), to the largest and most dense with a weight of
1700lbs (~770kg) (Martin, 2017).
Equally important is the moisture profile within the bale. Many studies have been
conducted on this topic, with varying results. A study representative of the overall results was
conducted in 1990 by Misener et al. They essentially found that bale moisture can vary at
different depths and locations within the bale. Multiple bales were dried under different
conditions, and moisture was measured at “bottom center”, “bottom outside”, “top center”, and
“top outside” locations (Misener et al., 1990). Results varied during separate trials, as shown
below in Figure 1. It can be seen that only the “top outside” location retained moisture
consistently, but still varied considerably. It is also known that denser bales retain moisture more
efficiently (Sullivan, 2016).

Rasmussen, McGuire
9
Figure 1. Hay moisture profiles during two separate trials. Source: Misener et al., 1990
4.1.2 Hay Yield Factors
Hay yield success is largely attributed to its nutrient content which is directly correlated
to moisture content. The yield is also related to moisture because losses increase as moisture
decreases during the raking and baling processes (Rotz et al., 1988). The main factors
influencing hay moisture in the field are temperature, relative humidity (RH) of the air, and soil
moisture (Rotz et al., 1985). It has been shown that hay moisture increases with RH and
decreases in higher temperatures (Rotz et al., 1985). Furthermore, large, rapid changes in these
two factors can have great effect on the moisture in the hay. For instance, cool nighttime
temperatures and increased RH in the early morning help preserve and even increase hay
moisture in windrows (Brown, 2013). It has also been shown that hay moisture can change
rapidly when exposed to changing conditions. Oven-dried hay transferred to an environment
with 75% RH increased leaf moisture by 10% in ~35 minutes (Pitt, 1990). A final factor with
great influence on hay moisture is that of weather conditions. Wind is one of the largest
contributors to excess drying and rainfall events clearly increase overall moisture (Shinners,
2009). It is important to understand that there is an ideal moisture range for baling; high and low
scenarios can incur losses.
There are many methods employed by farmers in an effort to increase and preserve hay
yields/moisture. One of the most popular methods is by wrapping bales in an impermeable layer
to reduce moisture loss via evaporation as well as protect the bale from outside weather. In fact,
it has been shown that wrapping bales in plastic film can allow for storage at lower moisture

Rasmussen, McGuire
10
ranges than typically possible (Shinners, 2009). There was little change in quality during the
trials and average dry matter loss was only 2.3% at low moisture ranges (Shinners, 2009).
Furthermore, the Ontario government suggests wrapping or storing bales as soon as possible to
reduce moisture loss due to evaporation (Sullivan, 2016). There are also certain management
procedures that can help reduce yield loss. For example, cutting the hay and arranging it into
short, thin windrows helps it retain moisture in the cool, moist air closer to the soil (Brown,
2013).
4.1.3 Bulk Moisture Sensing
The primary source for moisture sensing equipment is from industrial bulk processing.
These sensors have been developed to measure capacitance, conductance, permittivity, and
absorption of certain light bands. Though this allows for most interference sources to be removed
and the sensory process to be simplified, all available sensors from this field have been
developed for a material modified to flow for continuous production. The hay bale is a unique
medium because it is a packaged good which reduces the surface area readily available for
measurement. The range monitored in industrial processes is normally much smaller due to
possible controls such as climate and moisture control of storage and process equipment.
4.1.4 Electrical Conductivity Sensors
Electrical conductivity sensors are a popular technology used in the moisture sensing
industry. Conductivity is the measure of a material's ability to allow electric current to pass
without transferring its energy into heat. This measure varies with moisture because the
cellulosic fiber which makes up most of the hay, is an insulator. When moisture is added, it
increases the conductivity through the transfer of ions into solution and saturation of the fiber
matrix (Shewmaker, 2004). This conductivity is measured in Siemens, which incorporates the
surface area of the electrode, distance between the electrodes, and the resistance met by current
passing from one electrode to the other.
Electric conductivity sensors can be arranged on the same plane or separated entirely,
providing diverse potential configurations. The current must overcome the resistance, requiring
the electric signal to be developed for the distance between electrodes and the material resistance
range. The resistance of the material can vary with density, plant type, ambient temperature and

Rasmussen, McGuire
11
the source of moisture. The inconsistency due to irregular moisture sources such as dew or steam
can be reduced by taking an intrusive sample past the surface layer of the bale (Shewmaker,
2004).
4.1.5 Capacitance Sensors
Capacitance sensors are a useful technology for estimating moisture in many mediums,
such as soil. A capacitor allows electric potential to be stored between plate electrodes. The
material separating the plates, distance between the plates, and area of the plates determines the
quantity of potential energy storage (Mamishev, 2004).
The dielectric constant describes the permittivity of the material between the plates. For
moisture sensing, the material between the plates is tested for this permittivity, which changes
with water content because the dielectric constant of water is much larger than hay. The depth of
the reading is determined by the field distribution. Though this is not well modelled to define the
exact depth, it can be optimized by relating the distance between the plates (Mamishev, 2004).
The depth of reading can also be increased via the addition of a copper back plate to direct the
field away from the sensor (Li, 2004). Though these relations have been noted, there are no final
relations for the field distribution and the depth could only be optimized but not directly known
from design parameters.
This method has been tested to produce accurate results, though the variance of precision
is widely based on the implementation environment. There is a high possibility for the recorded
signal to be influenced by the incoming current frequency, or possible material interference with
the field. This requires significant signal filtering to be implemented in order to produce reliable
results (Tsamis, 2005). The largest benefit of the capacitive sensor is indifference to bale density
or volume being tested (Eubanks, 2001). The two main configurations for capacitive sensing are
parallel and planar. Parallel is widely used in lab applications as the standard capacitive
configuration. The planar configuration produces a fringe field that is less restrictive to
configuration, though this has not yet been used in any industrial agricultural applications.
4.1.6 Microwave Sensors
Microwave sensing relates the energy absorbed from a certain frequency of transmitted
electromagnetic wave energy to water content. The potential for a material to absorb energy from

Rasmussen, McGuire
12
a certain frequency increases proportionately with the dielectric constant. This allows the
determination of water content relative to solids, because the dielectric constant of fibrous solids
is around 4, while that of water is around 80 (Sipco PTY LTD, 2008). That being said, it is
important to note that this constant varies with temperature, density, and moisture content
(Trabelsi, 2006).
The dielectric constant relates field intensity in a space under vacuum to a time when the
material is present. The antenna can then detect the waves that have reflected from the material
or those which passed through in order to identify a change of frequency. Thus, the microwave
system provides a non-intrusive measurement of the cross section of the bale. Though a
surrounding metal structure will produce reflective interference, it has been found to be a
constant linear relationship, allowing the error to be removed through calibration (Pelletier,
2004).
4.1.7 Near Infrared Sensors
Finally, near infrared sensors are a new technology often used in industrial and laboratory
settings. The near infrared spectrum contains strong absorption bands for hydrogen bonds which
can be used to deduce the water content in a solid material. The sensor emits near infrared light
in the range of 970 nm wavelength, which is absorbed by the material surface composed of
liquid water (Penuelas, 2003). The light reflected to the sensor is from the dry matter, which can
then be related as the moisture content in the material. This makes near infrared a surface level
measurement which requires a clear lens to maintain an acceptable state of calibration.
The process is non-destructive and non-intrusive, which has enabled its widespread use
on food processing lines. The largest influence on the reading is from variations in sample
temperature (Büning-Pfaue, 2003). This method requires the most significant signal processing
because many wavelengths must be monitored and compared.
4.2 Benchmarking
Five sensor types currently available on the market are compared and evaluated during
the benchmarking process. The technologies evaluated are: invasive EC, non-invasive EC,
capacitive, microwave, and near infrared sensors. All five were evaluated for cost, error,
humidity range, durability, and invasivity, as seen in Table 4. Capacitive has the lowest cost but
Rasmussen, McGuire
13
is not produced specifically for measuring moisture in hay bales, meaning EC is likely the most
cost-effective option. Microwave and near infrared technologies are both far more costly.
All options have relatively low margins of error, with near infrared being highest at
around 2-5% (Shewmaker, 2017). This is likely because it is a very sensitive method, where
small amounts of dust or other foreign materials accumulated on its lens can affect readings
(Büning-Pfaue, 2003). Variations in temperature can also significantly affect the readings
(Büning-Pfaue, 2003).
Another important factor in measuring bale moisture is the capability of reading inside of
the bale, and not simply taking surface level measurements (Misener et al., 1990). In fact, the
moisture content of the outer layer of hay can vary greatly depending on environmental factors
such as heat from the sun, rain, morning dew, etc. Of the five technologies, only two have this
capability: invasive “probe-style” EC sensors and microwave sensors. Microwave moisture
technology can read beyond the bale’s surface and invasive EC sensors can take readings at a
depth equal to the length of their probe (Trabelsi, 2006).
Unfortunately, the probe of the invasive EC sensor represents a weak point in their
design, with a large part of the sensor being inserted into the bale and subjected to the forces
applied by the heavy bales. That being said, they are commonly designed to take this into
account and are made of strong materials such as stainless steel (Agreto, 2019). Hence, this
technology has a durability rated as “moderate” in Table 4. With the exception of infrared, the
other three are ranked as a highly durable, due to their non-invasive nature. Infrared has a low
durability because it is a highly complex technology better suited to factory or laboratory
settings.
The cost of the first three technologies were determined via a basic market overview of
the most popular products. The values for the other features of both EC types were obtained from
Shewmaker, 2017. Microwave and near infrared sensors are less commonly available to common
consumers because of their levels of complexity and thus all values for these two technologies
were also taken from Shewmaker, 2017. As mentioned above,capacitive sensors are not
commonly used for measuring moisture in hay bales, thus the value for its range of reading
capabilities was unobtainable. Furthermore, the error value was found based on general
capacitive moisture sensors from DBA Instrumart, 2019, and is not specific to reading in hay or
comparable materials.

Rasmussen, McGuire
14
Table 4. Benchmarking of Available Systems
Feature EC Invasive EC Non-Invasive
Capacitive Microwave Near Infrared
Cost (USD) 300-700 300-700 ~100 7000-10,000 8000+ Error (%) ~1 ~1 1-2 0.5-2 2-5 Humidity Range (%)
5-70 5-70 N/A 0-25 5-60
Durability Moderate High High High Low Invasivity Yes No No No No Depth Reading Yes No No Yes No
4.3 Applicable Patents
In the interest of brevity, the two patents most relevant to the design are presented and
discussed in the subsections below. Both utilize EC technology, which is preliminarily
determined as being the most useful after having completed the benchmarking process. Many
other patents concerning hay moisture have been filed, such as US4929904, but the ones below
are excellent examples of popular invasive and non-invasive systems.
Overall, there exists very few patented systems that are applicable to measuring moisture
in bales after the baling process has been completed and the bales have been dropped off by the
baler. The majority of current designs are made to be used inside of the baler, and read moisture
as the material flows through the equipment, either immediately before or after the hay has been
baled, as seen in Section 4.3.1. At these points, the hay is well mixed after being picked up from
the windrows, and moisture is evenly distributed. Contrarily, the systems designed to function
during the process of picking up the bales for storage have not been extensively developed and
only work with simple machinery such as bale forks, as seen in section 4.3.2. An automated
process for modern equipment such as graber arms or trailers equipped with pusher systems was
not found despite a thorough review of existing patents. Additionally, the most prevalent hay
moisture sensing technology found was EC, with microwave sensors also being found in some
newer patents. Capacitive and near infrared did not have any patented sensors specifically aimed
towards the hay and forage market, but there were still patents available from these technologies
in other fields. Thus, it is determined that EC is the most well-researched method of moisture
sensing available in the agricultural market.

Rasmussen, McGuire
15
4.3.1 Device and Method for Measuring Hay Bale Moisture
US6377058B1 (Pemrick, 2002)
This 2002 patent was developed by Peter Pemrick for Harvest Tec Inc.; a major
agricultural company. The design makes use of a pair of star wheels that rotate as material flow
over them, and allow for an electrical current to be established between them. The points of two
wheels puncture the bale and act as the electrodes of the circuit. The resistivity of the bale can
then be determined and related to the moisture content of the hay. Diagrams of the design can be
seen in Figure 2, in which the two small star wheels are fixed to the base over which the material
flows. This system is designed to be used with both square and round bales.
Figure 2. Star Wheel Device for Measuring Hay Bale Moisture Diagram
This design excels when used in a baler, where hay has been recently baled and the
moisture content of the hay is evenly distributed throughout the bale. The points of the star wheel
are only long enough to obtain surface level readings, and so the results would be skewed in
bales that have been outdoors for an extended period of time. Nevertheless, this is a useful
technology that could potentially be applied post-baling if the points are extended and made to
pierce further into the bale. Additionally, the cyclical nature of the rotating wheels allows for a
large amount of material to be processed in a short amount of time. The advantages of this design
are not to be ignored and are worth consideration, especially as part of an automated process
such as the one on the GA trailers.
4.3.2 Bale Loader Moisture Sensing System
US7114376B2 (Loucks et al., 2006)
This 2006 patent was developed by Levi L. Loucks and Lamon Loucks, and is designed
to function on a bale-loading vehicle, usually a tractor. The sensing system uses one or more
probes that are inserted into the bale of hay and subsequently obtain a moisture reading. This

Rasmussen, McGuire
16
design also uses the EC method of determining moisture, and the reading depth is determined by
the length of the probe. In this case, the electrodes can either be separate probes or two metal
pieces separated by an insulator on an individual probe. An image of a single probe on a baling
fork is seen in Figure 3. Finally, the readings are stored electronically and can later be printed
according to the operator’s desires. It is stated that the product also functions with “other
agricultural materials”, though these are not listed in the patent’s description.
Figure 3. Bale Loader Moisture Sensing System Diagram
This moisture probe is constructed of durable stainless steel and is a reliable method of
determining moisture. The design essentially combines the reliability of the handheld moisture
probes with the efficiency of using bale forks. In fact, the operator is not even required to exit the
vehicle in order to take and log the moisture reading. This sort of efficiency is asked for by GA
and will need to be replicated in this report’s design. Unfortunately, the bale forks are becoming
an older technology more often used on smaller scale agricultural operations. GA deals with
consumers operating on a large scale and thus a more efficient process is required. The
complexity of GA trailer units means a static design such as the one in this patent will not be
compatible and will likely interfere with complex moving parts. That being said, the design
presented in this patent is simplistic in nature and is a good grounds for comparison going
forward.

Rasmussen, McGuire
17
4.4 Applicable Standards
The following subsections present a number of standards relevant to the design of this
moisture sensing system, obtained from the American Society of Agricultural Engineers
(ASAE), the American National Standards Institute (ANSI), and the American Society for
Testing and Materials (ASTM). They pertain to the physical qualities of the hay and steel,
moisture measuring procedures, actuator selection, as well as guards and other safety
implements.
4.4.1 ASAE D251.2 Friction Coefficients of Chopped Forages
This standard gives values for the friction coefficients of different forage materials,
including hay. This is important because the friction of the hay on a moisture probe could have
important effects on the force required to insert it into the bale. It is also important to take into
account during the testing phase of the project, as friction can apply a force in a potentially
undesirable direction as the probe is retracted from the bale.
4.4.2 ASAE D245.6 Moisture Relationships of Plant-Based Agricultural Products
This standard gives data and equations on the moisture relationships of different crops,
including hay. Equations are given for determining the moisture of a substance base on wet and
dry weight, which is useful for validating sensor readings. Additionally, a table of data presents
the average equilibrium moisture content (%) of hay and other crops at a range of different
temperatures.
4.4.3 ANSI/ASAE S318.18 Safety for Agricultural Field Equipment
This covers the standard safety procedures and implementations for agricultural field
equipment such as tractors and trailers. Importantly, it outlines general safety requirements, as
well as the necessary safety distances and guarding. Specifically, it explains where these guards
need to be implemented and how they should be constructed. It also references a plethora of
other standards for safety requirements of specific machinery, as well as important labelling of
potentially hazardous components.

Rasmussen, McGuire
18
4.4.4 ASAE EP456 Test and Reliability Guidelines
The ASAE EP456 standard describes how the testing of agricultural designs should be
completed, and how to use this testing to obtain a reliability analysis. It also explains the correct
procedure for obtaining stress data and using this to estimate lifespan of a design. Statistical
formulas and procedures for analysis are given.
4.4.5 ASTM A53/A53M-18 Standard Specification for Pipe, Steel, Black and Hot-Dipped,
Zinc-Coated, Welded, Seamless
This final standard gives the specifications of pipe steel that can be used in various force
calculations. The values that may be relevant to the design are seen below in Table 5. These
properties are integral to calculating forces applied to steel objects.
Table 5. Low-Alloy Steel Properties (ASTM A53, 2018)
Property Value Units
Elastic Modulus 210,000 N/mm2
Poisson’s Ratio 0.28 N/A
Shear Modulus 79,000 N/mm2
Mass Density 7700 kg/m3
Tensile Strength 723.8256 N/mm2
Yield Strength 282.685 N/mm2
4.5 Applicable Constraints
The following three subsections list and describe the three most important constraints
determined for the completion of the prototype. They are: the budget, the programming expertise
of the design team, and the machining expertise of the design team. All three can present serious
limitations to the design if they are not considered and accounted for throughout the design
process.

Rasmussen, McGuire
19
4.5.1 Budget
One the most important constraints is the budget of $2500 set by the client. This is not a
constraint in terms of prototype construction, but rather a market price the client believes will be
economically sustainable. Thus, it is paramount to determine an estimated market cost for the
components purchased, as well as accounting for their machining and assembly. On the whole,
the price of each component will be noted and then summed to obtain a total cost, an adjustment
to market price will then be completed. Additionally, the standard prices for machining and
assembly procedures such as welding, bending, and milling will be obtained from the ASABE
International Quarter-Scale Tractor Student Design Competition Handbook (ASABE, 2018).
4.5.2 Programming Expertise
The programming expertise and, more specifically, the number of known programming
languages of the design team can present a serious limitation to the testing phase of the design
process. Although the majority of programming, such as actuation timing and moisture data
acquisition, is completed by the electronics team, the testing of mechanical components will
include pressure sensors that require certain coding skills in order to obtain useable data. The
Arduino language would likely be used to compute electrical signals from these sensors.
Additional knowledge of data acquisition and computing will also be required.
4.5.3 Machining Expertise & Available Tools
A third constraint is the machining ability of the members of the design team, as well as
the machining tools available. The prototype can only include machining processes as complex
as the members can accomplish. These processes include welding, sheet metal bending, lathing,
milling, drilling, cutting, and tapping. The skills of the design team member may limit the
complexity of the prototype if, say, a particular weld is too difficult for their level of expertise.
Additionally, the assembly will be completed at the MacDonald campus machine workshop,
where tools are available to use. Other tools will not be available without expensive rentals or
outsourcing of work. Though, they may also be supplemented with personal tools owned by the
members.

Rasmussen, McGuire
20
5.0 Concept Generation
This section presents and describes three possible design problem solutions, all three
cover the four different sensing technologies described in Section 4.1. The three solutions are:
non-invasive sensors, invasive probe-style sensors, and actuated probe-style sensors. Unless
otherwise cited, the information in this section has been collected after an overview of the
current moisture sensor market.
5.1 Non-invasive Sensors
As seen in Section 4.1, there are several options for non-invasive sensor types. In fact, all
four sensor types researched have non-invasive applications. Both electrical conductivity and
capacitive sensors can take surface-level readings based on the electrical properties of the hay.
Patents exist for parallel plate designs in both instances, allowing the material to flow over the
plates where the reading is taken. Additionally, a star-wheel design is popular for the electrical
conductivity sensors; this design functions by having short prods rotating on an axis, with the
reading taken between the prods. The flow of the material over the star-wheel causes it to rotate,
allowing for continuous readings. Both options can read a wide moisture range of around 5-70%
humidity, but this can vary depending on the exact model chosen (Shewmaker, 2017). Also, they
are the least expensive of the discussed sensors, typically priced at less than $1000.
Infrared sensors can also take surface-level readings. This technology is accurate but is
expensive and more applicable to scientific and laboratory settings. It requires a long period of
time to heat up (~1 hour), and is severely affected by small obstructions such as dust or water
droplets on the lens. That being said, it does have the second largest moisture range capabilities
of the four sensors, reading from 5-60% depending on the exact model (Shewmaker, 2017).
Though, it is the most expensive option, in the range of $10,000-30,000.
Microwave sensors have the advantage of being able to read throughout a moisture
profile, without the need for an invasive probe. Furthermore, the technology is more reliable than
infrared systems and is less costly. That being said, it is considerably more expensive than
electrical conductivity and capacitive alternatives, costing approximately $8000. It also has the
smallest moisture range sensing capability of the four, only from 0-25% (Shewmaker, 2017).

Rasmussen, McGuire
21
Finally, the technology has only been developed and calibrated for square bales, there exists no
options for large round bales as of yet.
5.2 Invasive Probe-style Sensors
Probe-style sensors exist for two of the researched options: capacitance and electrical
conductivity. Unfortunately, capacitance probes have not been well-developed for the hay
industry and are more often used in measuring soil moisture, fruit moisture, and various other
applications. Electrical conductivity probes are the more popular option for use with bales of
hay. Dozens of models exist on the market, all with varying degrees of reliability and
accompanying costs. Typically, the probe is around 8-12 inches long, allowing for readings to be
taken past the surface layer of the bale. This probe is most often constructed of stainless steel
with a diameter of less than 1cm. The reading is taken between the conductors, which are located
at the tip of the probe to ensure maximum reading depth. Additionally, the end of the probe is
pointed to allow for easier insertion into the bale. Probe-style electrical conductivity sensors are
priced similarly to non-invasive ones, from $200-1000.
5.3 Actuated Probe-style Sensors
A third design alternative is the implementation of an invasive probe onto an actuation
system. This allows for the system to be removed from the path of the bale when the sensor is
not taking readings. Essentially, the probe would only be inserted into the bale when it is
stabilized by the grabber fingers and is not in process of being picked up or dropped onto the
trailer. This significantly reduces the shear and bending forces applied to the probe.
There are many different types of actuation available. These are primarily defined by
their source of energy. Three commonly used types of actuation are as follows: pneumatic,
hydraulic, and electric. All forms have been reviewed through a component analysis.
This analysis identified that the hydraulic option requires a high level of modification of
lines and valves from the existing trailer systems, a costly process. The final system would
effectively be over-designed and apply forces much greater than what is expected to be required
for this application. This option also requires many prefabricated parts such as pump, valves, and
lines. A hydraulic system is the most costly one, expected to cost over $1000 in its
implementation.

Rasmussen, McGuire
22
Moving on to pneumatics, the value is found in the high actuation speed and low profile
attainable with these systems. That being said, the number of components required for such a
system increases the maintenance and potential for breakage. Furthermore, this method also adds
to the hazards of the system because of the high actuation speeds and force. It essentially turns
the system into a dangerous spear, capable of impaling operators should they move into its path.
A pneumatic system is also expected to cost over $1000.
The simplest option for implementation is an electric linear actuator, which provides an
easily integrated electric drive and feedback. Additionally, there are a large variety of options for
configurations, speed, and force available on the market. This is also the least expensive of the
three actuation methods, with the actuator itself costing $100-200, depending on the specific
model desired.
6.0 Concept Selection
Concept selection was completed over three steps, each outlined in the three subsections
below. The four sensing technologies shown in the above sections of this report are compared.
First, a series of force calculations were completed to determine the bending and shearing forces
applied to a possible invasive design. Next, the various options were presented to the client who
offered their opinions, advice, and preferences. Finally, the options are compared using a Pugh
chart and the best option is selected.
6.1 Data and Calculations for Feasibility & Effectiveness Analysis
This section will cover two types of forces applied to the system: bending (moment)
forces, and shear forces. The force calculations will be completed assuming a maximum bale
mass of 770kg and the appropriate material properties for low-alloy steel, as discussed in Table 5
of Section 4.4.5. The dimensions of a standard hay bale moisture probe are used, as the exact
model will be chosen based on later concept screening and product availability. Detailed
calculations can be found in Appendix B.
Firstly, the maximum bending forces are calculated assuming that the entire mass of the
bale is applied to the probe. A total downward force of 7554N is first calculated using the masses
of the probe and the bale. Eq. (1) describes the maximum moment applied at the connection
point between the probe and the trailer implement.

Rasmussen, McGuire
23
𝑀!"# =$%!
2 (1)
Mmax = Maximum Moment (N*m) ω = Loading (N/m)
l = Length (m)
Thus, a maximum moment of 951.9N*m is expected to be applied to the probe. This will
be used to calculate the force applied on the outer edge of the probe and compared to the
expected yield strength of the material. This equates to a maximum force applied of 239.9N and
a yield force at the same point of 3330N, meaning the probe can withstand the moment force by
a safety factor of 13.88, which is acceptable.
It is also important to consider the shear force applied. In the case of a uniformly
distributed load over an object fixed at one end, as is the case with a probe, the maximum shear
force is simply equal to the total force applied over the length of the object, as seen in Eq. (2). As
mentioned above, see Appendix B for more detailed calculations.
𝑉 = 𝐹& (2) V = Shear Force (N)
Fy = Force Applied (N)
In this case, equal to 7554N. The shear strength of steel can be used to determine the
amount of force at which the probe will shear. Using this, it is calculated that the probe can
withstand a maximum of 2945N. Essentially, the probe will shear in the case that the entire mass
of the maximum predicted bale size is applied to it. This provides justification for the necessity
of a non-invasive or actuated system.
6.2 Concept Screening
Concept screening was completed via e-mail communications with the client.
Discussions focused on the feasibility of both microwave and electrical conductivity
technologies, as the client seemed more interested in these options. Specific models from each
option were presented, and the client chose to focus on electrical conductivity, as this technology
has more products available for use with round bales. Moreover, the technology is simpler and
can more easily be customized for this design.
Placement of the sensor was also discussed using basic sketches of the different
possibilities. An example of these sketches can be found in Figure 3 of Appendix A. Three
Rasmussen, McGuire
24
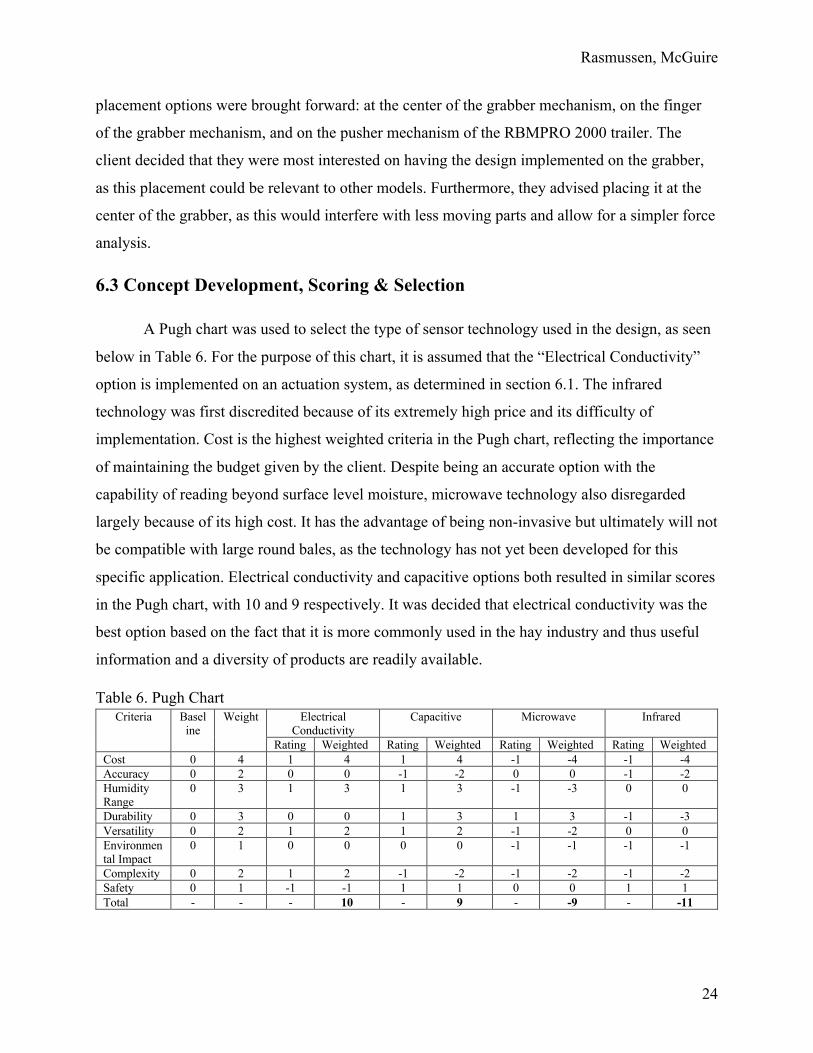
placement options were brought forward: at the center of the grabber mechanism, on the finger
of the grabber mechanism, and on the pusher mechanism of the RBMPRO 2000 trailer. The
client decided that they were most interested on having the design implemented on the grabber,
as this placement could be relevant to other models. Furthermore, they advised placing it at the
center of the grabber, as this would interfere with less moving parts and allow for a simpler force
analysis.
6.3 Concept Development, Scoring & Selection
A Pugh chart was used to select the type of sensor technology used in the design, as seen
below in Table 6. For the purpose of this chart, it is assumed that the “Electrical Conductivity”
option is implemented on an actuation system, as determined in section 6.1. The infrared
technology was first discredited because of its extremely high price and its difficulty of
implementation. Cost is the highest weighted criteria in the Pugh chart, reflecting the importance
of maintaining the budget given by the client. Despite being an accurate option with the
capability of reading beyond surface level moisture, microwave technology also disregarded
largely because of its high cost. It has the advantage of being non-invasive but ultimately will not
be compatible with large round bales, as the technology has not yet been developed for this
specific application. Electrical conductivity and capacitive options both resulted in similar scores
in the Pugh chart, with 10 and 9 respectively. It was decided that electrical conductivity was the
best option based on the fact that it is more commonly used in the hay industry and thus useful
information and a diversity of products are readily available.
Table 6. Pugh Chart Criteria Basel
ine Weight Electrical
Conductivity Capacitive Microwave Infrared
Rating Weighted Rating Weighted Rating Weighted Rating Weighted Cost 0 4 1 4 1 4 -1 -4 -1 -4 Accuracy 0 2 0 0 -1 -2 0 0 -1 -2 Humidity Range
0 3 1 3 1 3 -1 -3 0 0
Durability 0 3 0 0 1 3 1 3 -1 -3 Versatility 0 2 1 2 1 2 -1 -2 0 0 Environmental Impact
0 1 0 0 0 0 -1 -1 -1 -1
Complexity 0 2 1 2 -1 -2 -1 -2 -1 -2 Safety 0 1 -1 -1 1 1 0 0 1 1 Total - - - 10 - 9 - -9 - -11

Rasmussen, McGuire
25
The electrical conductivity sensor will be used in conjunction with a rotary linear actuator
to combine the advantages of both invasive and non-invasive designs. This decision is made
based on the calculations performed in Section 6.1. This design had the ability to take readings
inside of the inner layers of the bale without needing to resist the majority of large forces applied
by the mass and movement of the bale. That being said, it remains an invasive design and so a
reinforcing support will need to be designed in order to ensure the product has an adequate
lifespan.
7.0 Final Design
This section reviews the final prototype characteristics and function. The data collected
with the built prototype will then be analyzed to enable the development of a final product. The
prospective components of the final product will be identified to confirm the manufacturability
and availability of components.
7.1 Function
The prototype maintains three principle functions identified for their unique value to the
system. The actuation process, moisture measurement, and support frame are each evaluated on
their own criteria to simplify the analysis and focus individual areas of improvement. The
actuation system was evaluated for strength, form factor, control/communication potential, and
energy source. The current prototype is composed of parts which fit the primary criteria of cost
as designated by our client. Though, alternatives have been reviewed if another constraint
receives increased importance. The sensor is evaluated for precision/accuracy, reading location,
and strength. The supporting frame is evaluated for mounting capacity, force distribution, and
manufacturability.
7.1.1 Actuation System
The current actuation system can produce 48N force at a linear velocity of 0.23m/s
(Progressive Automations, 2019). The movement is controlled with a simple Cytron 13A motor
controller providing the rotary linear actuator 12V DC with no position feedback available. The
actuator comes with a fail-safe limit switch at both ends of the stroke (Progressive Automations,
2019). This prevents the ACME screw drive from compression locking with the frame. When the

Rasmussen, McGuire
26
switch is engaged, the system can also consider this point as a known depth of insertion. The
form factor of the actuator is average at 53% effective length to extension. There are models with
position feedback available, using a rotary encoder. Unfortunately, these significantly increase
the cost over the given budget. In order to modify the force of insertion, the extension speed is
inversely influenced resulting in a longer sample cycle. The energy source chosen was electricity
due to simplicity of integration with existing systems and low component cost. Both hydraulic
and pneumatic actuation systems were also considered though both required complexity and cost
not justified for such a prototype.
The Progressive Automations PA-15-1-11 High Speed Actuator was chosen for this
application as it meets the required speed and force of insertion listed above. Given that it is the
main moving component, it is the main one affected by temperature. Indeed, it is rated to
function from -26-65°C, which is within the desired range (Progressive Automations, 2019). An
exploded view of this actuator is seen in Figure 1 of Appendix C.
7.1.2 Moisture Sensor
The sensor used is an electrical conductivity probe type lance which must be inserted into
the material being analyzed. This sensor has been mounted with a sacrificial coupler allowing
some security for forces exceeding the capacity of the lance. Though the force on the joint
between the tip and shaft was unable to be identified, the potential force on the shaft (Stainless
304 D=10mm d = 0.6925) was estimated to be 2.879 kN, which is far above the capacity of the
actuator. The sensor produces 3 analog readings per second allowing averaging to occur over the
cycle stroke and a more accurate reading to be produced. The length of insertion deemed
necessary for electrical conductivity to be representative remains the highest risk of structural
failure. This operation requires the bale to remain relatively static relative to the arm the sensor is
mounted on.
After considering a multitude of options, it was decided to use the Agreto HFM-II sensor.
Agreto was willing to provide a customized system capable of producing the desired analog
signal. They provided a signal processing box along with the sensor in order to achieve this
output. An image of the complete system is seen in Figure 2 of Appendix C.

Rasmussen, McGuire
27
7.1.3 Support Frame
The mount has been created to function as a supporting frame for all components. All
force calculations require the mount to be rigid, allowing forces to be directed consistently
through the actuator and sensor. The adjoining frame surface was unknown during development
which required all positions to be capable of transferring the force of insertion to the implement.
This was accomplished using a single length of 1 x 1/4in angle iron which can easily be welded
or bolted to a flange. Indeed, two flanges are welded to the end of the angle iron, providing the
main mounting point for the actuator. During testing, a slot created at the rear of the actuator, as
seen in Figure 6. of Appendix C, allowed the mount to pivot and transfer the force of insertion to
a load sensor. The load sensor was mounted on a flange at the actuator end of the frame and
supported as shown. 3D printed parts were used to provide support to unconventional surface
mates. One part was used to mate the steel angle ridge with the round actuator body. Another
was used to direct the lance and guard the tip when not in use with support from the end of the
steel angle iron. The actuator is fixed to these custom support mounts using pipe clamps. As a
whole, the mount protects the assembly while maintaining versatility and a low profile. An
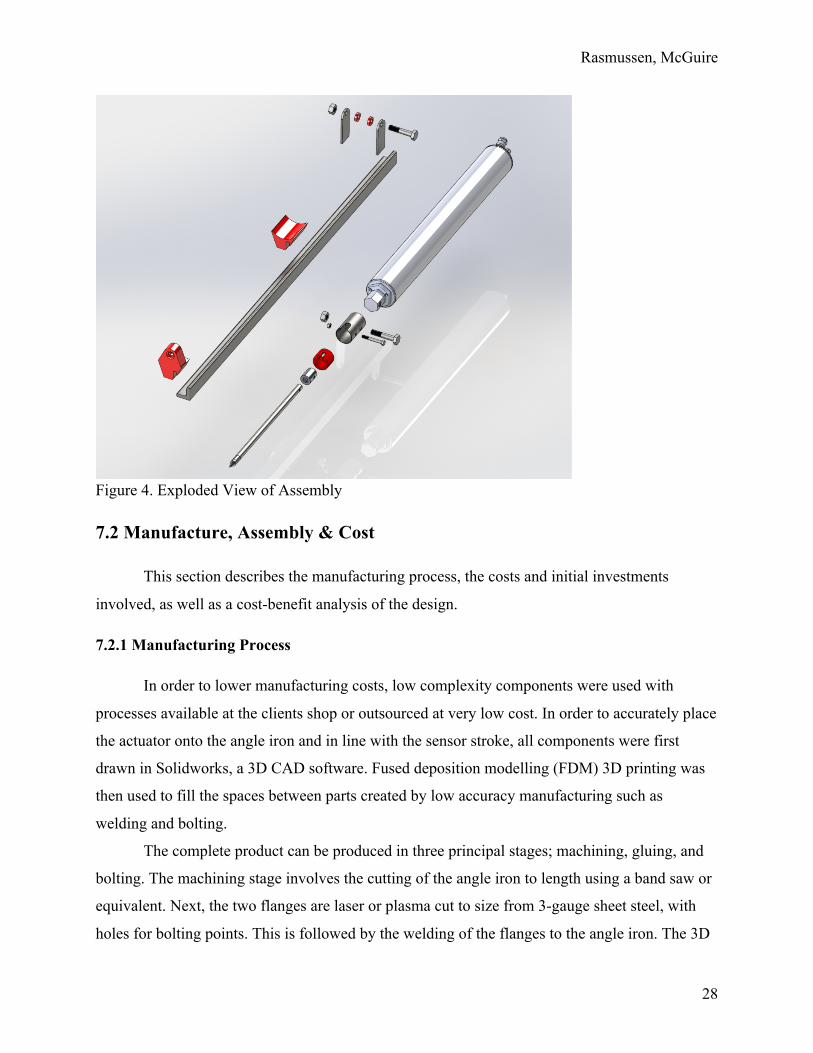
exploded view of the entire assembly is seen below in Figure 4, displaying the actuator, sensor,
and support frame. More detailed drawings of each component are found in Figures 3-6 in
Appendix C.
Rasmussen, McGuire
28
Figure 4. Exploded View of Assembly
7.2 Manufacture, Assembly & Cost
This section describes the manufacturing process, the costs and initial investments
involved, as well as a cost-benefit analysis of the design.
7.2.1 Manufacturing Process
In order to lower manufacturing costs, low complexity components were used with
processes available at the clients shop or outsourced at very low cost. In order to accurately place
the actuator onto the angle iron and in line with the sensor stroke, all components were first
drawn in Solidworks, a 3D CAD software. Fused deposition modelling (FDM) 3D printing was
then used to fill the spaces between parts created by low accuracy manufacturing such as
welding and bolting.
The complete product can be produced in three principal stages; machining, gluing, and
bolting. The machining stage involves the cutting of the angle iron to length using a band saw or
equivalent. Next, the two flanges are laser or plasma cut to size from 3-gauge sheet steel, with
holes for bolting points. This is followed by the welding of the flanges to the angle iron. The 3D
Rasmussen, McGuire
29
printed components can then be glued in place. The final stage involves the bolting of the
coupler and actuator as well as the banding of the actuator to the frame.
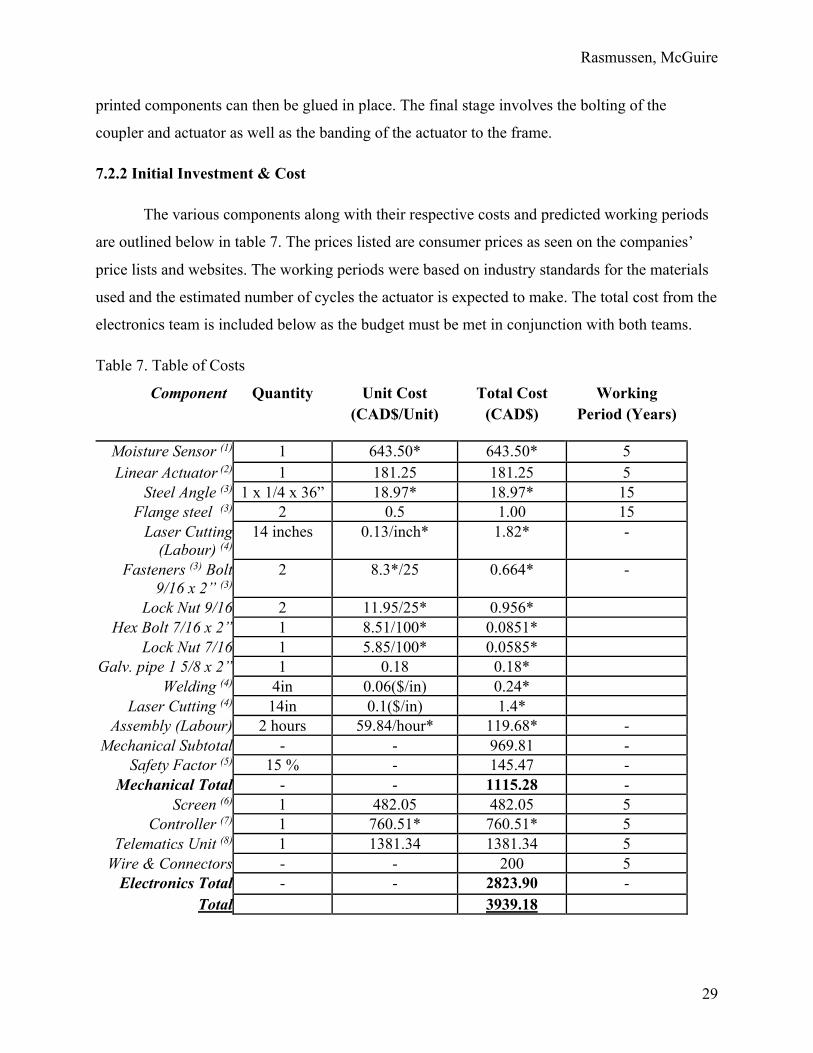
7.2.2 Initial Investment & Cost
The various components along with their respective costs and predicted working periods
are outlined below in table 7. The prices listed are consumer prices as seen on the companies’
price lists and websites. The working periods were based on industry standards for the materials
used and the estimated number of cycles the actuator is expected to make. The total cost from the
electronics team is included below as the budget must be met in conjunction with both teams.
Table 7. Table of Costs
Component Quantity Unit Cost (CAD$/Unit)
Total Cost (CAD$)
Working Period (Years)
Moisture Sensor (1) 1 643.50* 643.50* 5 Linear Actuator (2) 1 181.25 181.25 5
Steel Angle (3) 1 x 1/4 x 36” 18.97* 18.97* 15 Flange steel (3) 2 0.5 1.00 15
Laser Cutting (Labour) (4)
14 inches 0.13/inch* 1.82* -
Fasteners (3) Bolt 9/16 x 2” (3)
2 8.3*/25 0.664* -
Lock Nut 9/16 2 11.95/25* 0.956* Hex Bolt 7/16 x 2” 1 8.51/100* 0.0851*
Lock Nut 7/16 1 5.85/100* 0.0585* Galv. pipe 1 5/8 x 2” 1 0.18 0.18*
Welding (4) 4in 0.06($/in) 0.24* Laser Cutting (4) 14in 0.1($/in) 1.4*
Assembly (Labour) 2 hours 59.84/hour* 119.68* - Mechanical Subtotal - - 969.81 -
Safety Factor (5) 15 % - 145.47 - Mechanical Total - - 1115.28 -
Screen (6) 1 482.05 482.05 5 Controller (7) 1 760.51* 760.51* 5
Telematics Unit (8) 1 1381.34 1381.34 5 Wire & Connectors - - 200 5
Electronics Total - - 2823.90 - Total 3939.18

Rasmussen, McGuire
30
(1) Agreto HFM-II Moisture Sensor (2) Progressive Automations PA-15-1-11 High Speed Actuator (3) Purchased from McMaster-Carr (4) Labour costs obtained from International Quarter-Scale Tractor Student Design Competition (ASABE, 2019) (6) Danfoss DM-430 screen purchased from Berendsen Fluid Power (7) Danfoss MC-24 controller purchased from Berendsen Fluid Power (8) Danfoss WS-403 telematics unit purchased from Berendsen Fluid Power * Dollar amount converted from USD as of April 8th, 2019
Unfortunately, this results in a cost of 3954.58$, exceeding the proposed budget of
$2500. However, this is not an accurate representation of what the system will cost in a
wholesale setting. In terms of electronics, many components, such as the controller, telematics
unit, and GPS, are already available on the RBMPRO 2000 or are not desired by the client. Thus,
these values can be removed from the overall price. All items were purchased at retail price with
an assumed a dealer markup of 30%. It is also assumed that the dealers will sell to our client at a
lower average markup of around 15%. This results in the following pricing scheme seen in Table
8. This represents the total cost of each unit to the client; consumer pricing is more reflective of
Table 7 above.
Table 8. Wholesale Cost Component Retail Price
(CAD$) At Cost Price
(CAD$) Purchasing Price
(CAD$) Moisture Sensor 643.50 495.50 568.85 Linear Actuator 181.25 139.42 160.34
Motor Controller 15.40 15.40 15.40 Labour and Steel - - 179.57
Screen 482.05 371.15 426.82 Wiring and Connectors - - 200
Total - - 1550.98 Telematics 1384.34 1062.57 1221.95
Total with Telematics - - 2772.93 Controller 760.51 585.59 669.24
Total with Telematics and Controller
- - 3442.17

Rasmussen, McGuire
31
7.2.3 Benefits & Savings
Firstly, it is important to note that economic analysis of this design is completed in
conjunction with the second electronics design team. Thus, there are expected to be many
similarities between the calculations in both reports.
The financial benefits of this design include reduced working time for the operator as
they will not have to measure bale moisture manually, as well as reduced cost due to better field
management. A better understanding of yield, when coupled with soil samples, leads to this
improved management. This reduces the amount of required inputs, such as fertilizers, thus
reducing the cost. Furthermore, there will be a significant reduction in operator time due to the
fact that they will not need to leave the tractor to manually take and log moisture measurements
of each bale individually. The calculations that follow are based on both the reduction of work
hours and on the possible savings due to better nitrogen management.
In order to determine the amount of time saved, we must consider the amount of hay
produced per season and the number of samples that must be taken accordingly. One acre of field
can produce an average of 4 tons of hay per year (Greene, 1993). This average varies depending
on a variety of factors, including location and type of hay. However, it is a good estimation for
the purposes of this calculation. Additionally, at least 20 samples must be taken per 200 tons of
hay to accurately measure yield (Putnam, 2002). Therefore, 2 samples are needed for every 5
acres of workable land. This results in a total of 336 samples assuming most Quebec farms
harvest hay 2-3 (use 3) times per year and cover an average of 280 acres (Census of Agriculture,
2014). Testing showed that it takes an average of 3 minutes to manually perform a moisture
sensor reading, including exiting and re-entering the tractor. Therefore, the design will save 14
hours of work per year. Given that Quebec’s minimum wage is $12.00, the design will save
$168.00 per year (Minimum Wage, 2018).
Savings per Acre: $0.24 Annual Hours Saved: 16.8 Annual Savings: $201.60 5 Year Savings: $1008.00
Additional savings can be calculated due to the reduced amount of nitrogen fertilizer
applied to the fields. A study at Clemensen university found that a similar yield monitoring
system results in an additional $14.50 per acre, when compared to a fixed application rate of 60

Rasmussen, McGuire
32
pounds per acre (Kirk, 2017). Their system takes continuous yield measurements as it collects
hay whereas the proposed design simply takes yield measurements at the bale and extrapolates
from this process. For this reason, our system is expected to have less resolution, resulting in less
profit per acre. We will assume that it results in half of the profit ($7.25). We will again assume
280 acres harvested 3 times per year. This leads to the following savings:
Savings per Acre: $7.25 Annual Savings: $6090.00 5 Year Savings: $30,450.00
The total savings for the project can be calculated via the addition of these two benefits,
as seen below:
Savings per Acre: 7.49 $ Annual Savings: $6291.60 5 Year Savings: 31,458.00 $
7.2.4 Cost-Benefit Analysis
In order to determine the cost-benefit characteristics and economic viability of this
design, the net present value, payback period, discounted payback period, and rate of return are
calculated using Eq. (3), (4), and (5). A five year time frame is used to obtain the values, as
determined by the lifespan of various components, and the cost of capital is assumed to be at 9%.
This cost of capital varies, but 9% is a conservative estimation. Additionally, the calculated
consumer cost of $3939.18 is used with the predicted annual savings of $6291.60.
𝑁𝑃𝑉 = '"()"(+,-)"
+ '#()#(+,-)#
+. . . + '$()$(+,-)$
(3)
𝑃𝑃 = /01"%)0314556"%7"8+593
(4)
𝐷𝑃𝑃 = 𝑌𝑒𝑎𝑟𝑠𝑡𝑜𝐶𝑎𝑝𝑖𝑡𝑎𝑙𝑅𝑒𝑐𝑜𝑣𝑒𝑟𝑦 + :5;<=08<;<>)031?,-@<";)"3A%0B
(5)
Net Present Value (NPV) = $20,517 Payback Period (PP) = 0.63 years Discounted Payback Period (DPP) = N/A Rate of Return (IRR) = 158%
This short payback period and positive net present value clearly show the economic
viability of the system. In fact, the consumer can expect to fully cover costs within the first year
of use. Unfortunately, the discounted payback period and rate of return are not very applicable to

Rasmussen, McGuire
33
this design given the payback period of less than one year. This explains the rate of return value
of over 100%.
7.3 Design Validation
Design validation was completed throughout the testing phase of the design process. The
accuracy of moisture readings was determined as well as the forces applied to the system by the
insertion into the bale. The testing procedures, results, and a discussion of these results are seen
below.
7.3.1 Testing Methodology
The moisture reading capabilities and the axial load required to pierce the bale were
determined to be the most important sets of data. This was reinforced by the increased
complexity required to implement shear measurement and the potential validity of the process to
model potential in field forces at this stage.
The load sensor used consists of strain gauges in a Wheatstone bridge formation on an
aluminum bar with a capacity of 10kg or 98N force. This provides a balanced resistance change
over multiple strain gauge lengths. The variance in resistance is very low so an amplifier circuit,
HX711, was employed before the signal was received and processed into a metric force value.
The amplifier was interfaced with the Arduino using an Arduino library that provides a
calibration script, time delay, and averaging between values. This script was modified to reduce
the averaging cycle and increase output data points over time, to 4 readings per second. It also
logged an average value. The maximum value obtained over each measurement cycle was logged
from the data. The sensor is rated for over double the maximum force of the actuator, allowing
for a safe data range.
As can be seen Figure 5 below, the sensor was mounted to support the actuator which
was able to slide in a slot. The sensor was calibrated using a spring scale to determine a
coefficient relation. The library contained a tar function allowing for very clear data to be
observed after appropriate mounting had occurred. This was necessary because the sensor
needed to be under some load to reduce the potential for shock and allow the actuator to reseat in
its initial position after each measurement.

Rasmussen, McGuire
34
Figure 5. Load Cell Mount
In order to test the function of the prototype, a testing methodology was developed. Two
bale formats were tested, including small square bales (14x18x35”) and regular round bales
(4’x5’).
Square Bale:
Setup:
1. The Moisture probe was mounted to a table with a vise horizontal to the ground and 6 inches (angle iron from the surface of the table). Electronics were wired adjacent to the sensor on the same 3x8’ table.
2. The square bale was placed on the table surface with the inner leaf planes parallel to the sensor stroke. The bale was then divided into 4 sections to enable consistency in the measurement positions between insertions and sensor type. Markings were added to the surface with red spray paint.
3. The bale was then clamped to the table at a position far from the potential sample sites to ensure it remains static over the sample cycle.
Procedure
1. The designated sample site was then probed manually 4 times in a circular pattern around the sample site. Avoiding passing through the site to ensure proper contact is made with each measurement. Excel table used to record all values from both the load and moisture sensors.

Rasmussen, McGuire
35
2. The automated sensor was then actuated in 4 separate areas of the sample site to record variations. The bale must be shift to another position in the area each sample to ensure consistent contact with the sensor.
3. On each actuation stroke the maximum load was recorded in kilograms.
4. The samples method above was completed in each vertical region twice.
5. Once complete the bale moisture was raised with an increasing volume of water from region 1 to 4. Left to allow water to permeate evenly for at least an hour. Once moisture was modified steps 1 through 4 were repeated.
Round Bales:
The method was modified to allow the sensor to be mounted on a bale grabber with the
electronics placed in the cab of the connected tractor. The bale was split into quadrants as seen in
Figure1. Appendix D. Each quadrant was tested twice while maintaining a similar procedure to
the one above. The load cell was not implemented in this configuration due to the inaccessibility
of the sensor and necessity of a nearby laptop.
Setup
1. The probe was mounted to the grabber and loader quick attach frame with steel clamps. When the front face of the quick attach is vertical the sensor is perpendicular resulting parallel with the ground.
2. All power connections and electronic processing is placed in the cab of the tractor to the left of the driver. Wires were extended along the loader to connect both systems.
3. The loader was placed with the grabber facing the ground and the bale with the rolled leaf vertical. This allows the sensor to be inserted parallel to the leaflets.
Procedure
1. The designated sample site was positioned below the probe by moving the tractor.
2. This site was probed 4 times with both the automated process and the manual validation sensor.
3. A total of eight points were recorded for each sample position. The process was continued until one measurement cycles had been completed for each of the quadrants.
7.3.2 Results
As seen in Tables 1 and 2 of Appendix D, the moisture sensor successfully recorded
moisture percentage data and the load sensor provided readings of the force required to pierce a
square bale. The data available does provide a positive indication to the range of our validation

Rasmussen, McGuire
36
set, though too little was collected to determine the precision or accuracy of the sensor. This
observation may seem inconsequential to the value of data, but it was used to validate the
process cycle. Which required reading in the acceptable range of that produced by the validation
set and within the time determined. Figure 6 presents the force data recorded by the load cell.
Figure 6. Recorded Force Data
7.3.3 Discussion
The testing procedure allowed the identification of inconsistencies in the measurement
process that were not resolved within the first prototype. The primary categories related to force
requirements from the actuator, influences from the bale structure and placement of the sensor
with the implement. The most influential of which is visible in the load sensing data. The load
required was nearly always above the capabilities of the actuator as seen in Figure 6. Due to this
fact the process cycle varied in stroke length and from that time in appropriate contact with the
sensor electrodes. This modified the average reading and created inconsistencies in the data from

Rasmussen, McGuire
37
measurements recorded in the air. It also resulted in the actuator receiving damage to the motor
drive connection, reducing consistency and speed capabilities.
The bale structure provides very low resistance planes which provides optimal sample
locations between layers. Though when the lance pierces at an angle to these planes the force
increases until it reaches its maximum at perpendicular. This makes the placement of the sensor
on the implement very important but also concludes the piercing load required is relatively
similar across bale types.
When the sensor was placed with the implement no indication was available to the
operator for the surface contact. The placement height therefore varied with measurements
providing again variations of cycle location times. The pressure would also vary the required
piercing pressure due to a compression of leaflets at the surface. With some implementation
forms the bale position is maintained relatively constant automatically with the use of a pressure
plate which could solve this problem.
7.4 Environmental & Social Considerations
It is important to consider the various potential environmental and social effects the
design may have. To this end, a life cycle analysis and risk factor analysis are performed in the
subsections below.
7.4.1 Environmental Considerations
The design presents both advantages and disadvantages in terms of environmental
impact. The advantages stem from the better understanding of hay yield while the disadvantages
are analyzed via a Linkcycle life cycle analysis (Linkcycle, 2019).
Firstly, the advantages are mainly a product of the reduced need for fertilizer application
due to an increased understanding of hay yield. The increased understanding means application
can be focused on slower growth areas and reduced over the entire field. This leads to less runoff
of nitrogen from the fields into lakes, rivers, and streams. This nitrogen causes major
eutrophication issues for these bodies of water, altering the ecosystems and harming native
species of animals and plants. The algae blooms caused by eutrophication can also have harmful
effects on humans, both as recreational water and drinking water. By reducing fertilizer
application, one is effectively reducing the likelihood of eutrophication.

Rasmussen, McGuire
38
All that being said, it is important to mention the greenhouse gas (GHG) emissions
stemming from almost any engineering design. To this effect, a life cycle analysis was performed
for the various components and materials of the design, with the GHG emissions of each stage of
each components life being taken into account. A breakdown of the emissions from the complete
system for cradle to gate, use, and end of life phases is shown in Figure 7 below. The values are
in kg of CO2 equivalent. A more complete overview of the analysis can be found in Appendix D.
Figure 7. Life Cycle Emissions by Phase
It is clearly seen that the majority of emissions are produced during the cradle to gate
phase. A large proportion of the components are made of metals, which require a large amount of
energy to extract and refine. In particular, the aluminum components such as the actuator are
very energy-intensive. The lower amounts of emissions during the use and end of life phases are
due to it being a low-load electrical system with mostly recyclable components. Electricity is a
more sustainable form of energy compared to direct combustion engines and its consumption
makes up the total of the use phase. The majority of the design is constructed of metals and
plastics, both handled in typical recycling processes. Overall, it is thought that the advantages of
more efficient fertilizer application outweigh the harm caused by GHG emissions.
7.4.2 Health & Safety
In the context of this design, social considerations take the form of a health and safety
analysis. First, the risks associated with the design were listed and evaluated on a scale from one
to three, from least hazardous and least likely to most hazardous and most likely. The results of
this evaluation were then organized into a risk factor matrix, seen below in Table 9. The main

Rasmussen, McGuire
39
contributors to the risks are listed along with the corresponding mitigation procedure for each
risk.
Table 9. Risk Factor Matrix
Risk Factor Risk Rank Risk Contributor Mitigation Procedure Impalement/Laceration on Probe
3
- Sharp edges - Long acicular probe
- Fillet sharp edges - Probe sheathed when not in use
Short Circuit 1
- Loose connections - Improper insulation
- Select appropriate wire insulation - Choose components abiding by SCC standards
Complexity in Hazardous Zone
3
- More time spent in hazardous zone - Increased probability of bodily harm
- Add standardized operator safety labels + Shields (ASABE/ISO 3767, ANSI ASAE S318.18)
Overloading of electric motor
1
- Overheating - Incorrect installation - Duty cycle
- Fuses - Select appropriate motor size
Incorrect reading 2
- Inconsistency in bale qualities
- Implement appropriate probe length - Provide calibration procedure manual
Shearing, bending of probe
2
- Large shearing and axial forces applied
- Select appropriate materials - Design with modelled forces
After completion of the risk analysis, it was determined that “impalement/laceration on
the probe” and “complexity in a hazardous zone” were the two most hazardous risk factors.
Therefore, more care was taken in the mitigation of these two. Firstly, a guard was designed to
sheath the sharp end of the probe when the system is not operational. This guard component can
be seen in Figure 6 of Appendix C. Essentially, at all times, the dangerous point is either
sheathed or inside of a bale. This effectively reduces this risk factor to faulty operation of the
system, which is also mitigated by the automatic, user-friendly, nature of the design. There
should be no risk of accidental impalement unless the operator actuates the system while another
person is within the hazardous grabber zone. Additionally, all other sharp edges of the design
have been filleted to reduce risk of accidental laceration.

Rasmussen, McGuire
40
Secondly, the increased complexity in the hazardous zone, which is to say the grabber
arm, stems from yet another system being implemented on the trailer. With increased
components comes an increased likelihood of the operator moving into the zone in order to
perform actions such as cleaning or maintenance. The hazardous nature of large moving parts
and large forces could injure the operator. Standardized labels and shields, as determined in
ASABE/ISO 3767 and ANSI ASAE S318.18, are added to the correct areas to minimize this risk
factor.
8.0 Conclusions
The design meets all of the requirements set forth by the client and provides an
innovative means of determining hay yield based on the moisture content of the bales. The
sensor was able to obtain accurate and precise moisture readings, and the overall system was able
to withstand the forces applied by the bales. Furthermore, all components are rated to function in
a Quebec climate, and are obtained from trustworthy sources. The system itself can be
implemented on many GA products, with slight modifications to the mounting components,
meaning it is a highly variable design. It is user-friendly, safe, provides a useful service to the
environment, and is economically viable. It also has many unique features. Namely, the
streamlined actuation process significantly reduces forces applied to the probe. In addition, the
guard covering the sharp end of the probe allows for a very safe design. Finally, the testing phase
of this project provided useful data for the forces applied during insertion into a bale, which is
not currently readily available in the literature. Overall, the system could be developed into an
efficient system for determining hay yield.
Moving forward, more work will need to be completed in order to implement a full
system capable of producing yield maps. Foremost, more research and prototyping needs to be
completed in order to find a reliable method of determining bale mass, an essential component in
the yield calculations. Additionally, it would be advised to design a flexible “break-away”
component into the mounting system, allowing for some movement freedom as the grabber
contacts and releases the bale. This component should be relatively cheap and easy to replace, as
it will be the first component to fail should breakage occur. All that being said, there is still room
for further research and development in this project, and it should be continued going forward

Rasmussen, McGuire
41
into the summer. The advantages a system such as this could present to both the agricultural
industry and the environment are certainly not to be ignored.
References
Agreto. (2019). Agreto HFM II Hay Moisture Meter/Straw Moisture Meter. Web source: Agreto.com
ANSI ASAE S318.18. (2017). “Safety for Agricultural Field Equipment.” American Society of Agricultural and Biological Engineers. Web. 07 Apr. 2019.
ASAE D245.6. (2017). “Moisture Relationships of Plant-based Agricultural Products.” American Society of Agricultural and Biological Engineers. Web. 07 Apr. 2019.
ASAE D251.2. (2017). “Friction Coefficients of Chopped Forages.” American Society of Agricultural and Biological Engineers. Web. 07 Apr. 2019.
ASAE EP456. (2015). “Test and Reliability Guidelines.” American Society of Agricultural and Biological Engineers. Web. 07 Apr. 2019.
ASTM A53/A53M-18. (2018). “Standard Specification for Pipe, Steel, Black and Hot-Dipped, Zinc-Coated, Welded, Seamless.” ASTM International. Web. 28 Nov. 2018.
Brown, P. (2013). Humidity, Hay Moisture & Harvest Management. Arizona College of Agricultural and Life Sciences - Cooperative Extension.
Büning-Pfaue, H. (2003). Analysis of water in food by near infrared spectroscopy, Food Chem., 82 , pp. 107-115, 10.1016/S0308-8146(02)00583-6.
“Census of Agriculture counts 30,675 farms in Quebec.” (2018). Statistics Canada. Web. 27 Nov. 2018.
DBA Instrumart. (2019). About Moisture Meters. Total Temperature Instrumentation. Web source: Instrumart.com
Eubanks, J.C., & Birrell S. J. (2001) Determining Moisture Content of Hay and Forages using Multiple Frequency Parallel Plate Capacitors. American Society of Agricultural and Biological Engineers. Paper number 011072, 2001 ASAE Annual Meeting. DOI: 10.13031/2013.7340.
Greene, D., Hawkins, S., and Johnson, K. (1993). “Calculating Hay Yields.” Purdue University. Web. 27 Nov. 2018.
Kirk, K. (2017). “Hay Production Precision.” Hay and Forage Grower. Web. 08 Apr. 2019.

Rasmussen, McGuire
42
Li, X.B., Kato, C., Zyuzin, A. S., and Mamishev, A. V. (2004) Design of Multi-channel Fringing Electric Field Sensors for Imaging Part II: Numerical Examples. Conference Record of the 2004 IEEE International Symposium on Electrical Insulation. Indianapolis, IN, 19-22 September 2004, pp. 410-413.
Linkcycle. (2019). “How to Conduct a Life Cycle Analysis.” LinkCycle. Web. 09 Apr. 2019.
Loucks, L., and Loucks, L. (2006). Bale Loader Moisture Sensing System. US7114376B2.
Mamishev, A. V., Sundara-Rajan, K., Yang, F., Du, Y., and Zahn, M. (2004). Interdigital Sensors and Transducers. Proceedings of the IEEE, vol. 92, no. 5, pp. 808-845.
Martin, Keith. (2018). How Much Does a Round Bale Weigh?. K-State Research And Extension. Web source: Dairy Herd Management.com.
“Minimum Wage by Province.” (2018). Retail Council of Canada. Web. 27 Nov. 2018.
Misener, G. C., C. D. McLeod, C. A. Esau, and W. A. Gerber. (1990) Drying of large round hay bales. Canadian Agricultural Engineering 32 : 263 – 268.
Pelletier, M. (2004). Multipath interference investigation for cotton bale microwave moisture sensing. Journal of Cotton Science. 8, 25.
Pemrick, P. Device and Method for Measuring Hay Bale Moisture. US6377058B1.
Penuelas, J., Filella, I., Biel, C., Serrano, L. & Save, R. (1993) The reflectance at the 950–970 nm region as an indicator of plant water status, International Journal of Remote Sensing, 14:10, 1887-1905, DOI: 10.1080/01431169308954010
Pitt, R.E. (1990). Silage and hay preservation. Northeast Regional Agricultural Engineering Service. #NRAES-5. NRAES Cooperative. Extension, Ithaca, NY.
Progressive Automations. (2019). “High Speed Linear Actuator.” Progressive Automations. Web. 09 Apr. 2019.
Putnam, D., and Orloff, S. (2002). “Hay Sampling Protocols And A Hay Sampling Certification Program.” University of California. Web. 27 Nov. 2018.
Rotz, C. A. & Yi Chen. (1985) Alfalfa Drying Model for the Field Environment. Transactions of the ASAE. Web. 28 Oct. 2018.
Rotz, C. Alan, & Abrams, S.M. (1988). “Losses and Quality Changes During Alfalfa Hay Harvest and Storage.” Transactions of the ASAE, 1988. Web. 28 Oct. 2018.

Rasmussen, McGuire
43
Shewmaker, G. (2017). Measure bale moisture in real time. Web source: Hay & Forage Grower.com. Web. 26 Nov. 2018.
Shewmaker, G., Thaemert, R. (2004). Measuring Moisture In Hay. Proceedings of the 34th California Alfalfa & 2004 National Alfalfa Symposium. U.C.Davis, 04-313. Web source: alfalfa.ucdavis.edu. Web. 28 Oct. 2018.
Shinners, K. J., Huenink, B. M., Muck, R. E., Albrecht, K. A. (2009) Storage Characteristics of Large Round and Square Alfalfa Bales: Low-Moisture Wrapped Bales. American Society of Agricultural and Biological Engineers. Web. 28 Oct. 2018.
Sipco PTY LTD, (2008). Apparatus and Method for Identifying and Marking Bales of Bulk materials, Such as Fodder Bales That have certain characteristics. US 2010/0032498A1.
Sullivan, P. (2016) Maintaining Quality in Large Bale Silage. Ontario Ministry of Agriculture, Food and Rural Affairs. Web. 28 Oct. 2018.
Trabelsi, S., Nelson, S. O., Ramahi, O. (2006) A low-cost microwave moisture sensor. Proc. 36th Eur. Microw. Conf., pp. 447-450, 2006-Sep.
Tsamis, E. D., & Avaritsiotis, J. N. (2005). Design of planar capacitive type sensor for “water content” monitoring in a production line. Sensors and Actuators. A: Physical, 118(2), 202–211. https://doi.org/10.1016/j.sna.2004.07.009
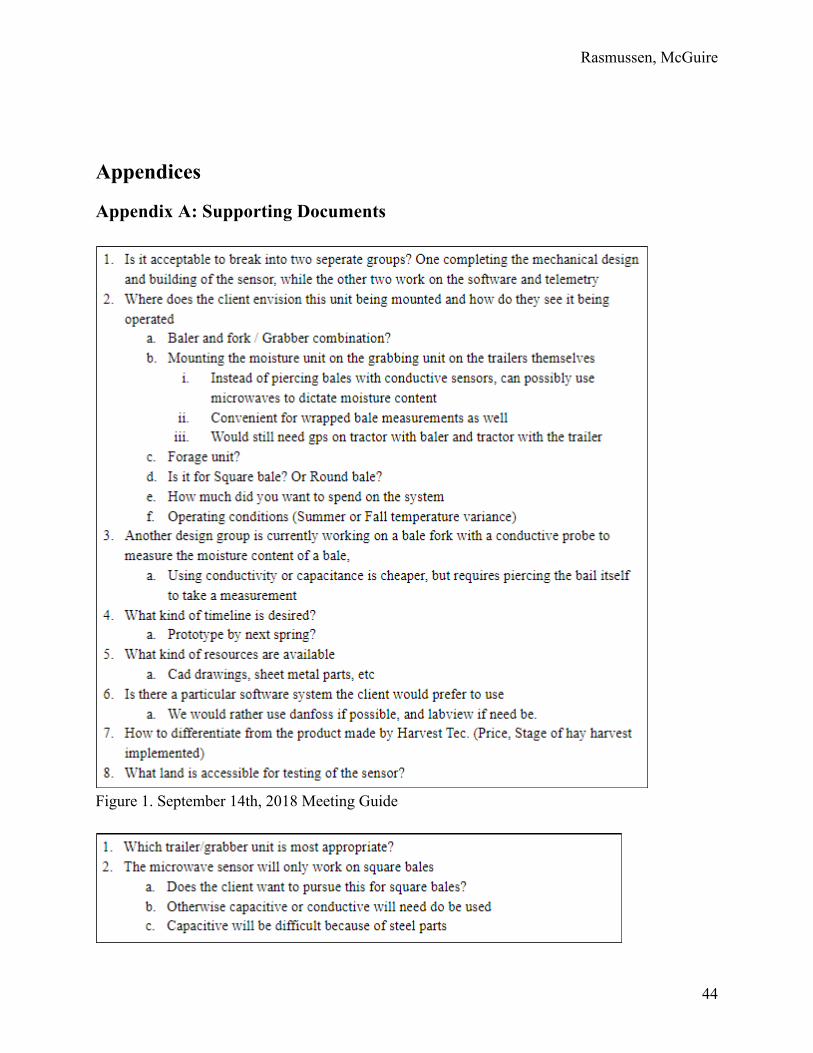
Rasmussen, McGuire
44
Appendices
Appendix A: Supporting Documents
Figure 1. September 14th, 2018 Meeting Guide

Rasmussen, McGuire
45
Figure 2. October 18th, 2018 Meeting Guide
Figure 3. Sensor Placement Options
Appendix B: Detailed Calculations Probe Volume
𝑉 = 𝜋𝑟CC𝐿 − 𝜋𝑟-C𝐿 𝑉 = 𝜋(0.0040)C(0.2520) − 𝜋(0.0035)C(0.2520)
𝑉 = 2.971𝑥10D𝑚E
Probe Mass 𝑚 = 𝜌𝑉
𝑚 = (7700)(2.971𝑥10D) 𝑚 = 0.02288𝑘𝑔
Maximum Moment 𝐹& = 𝑔𝑚
𝐹& = (9.81)(770.0)
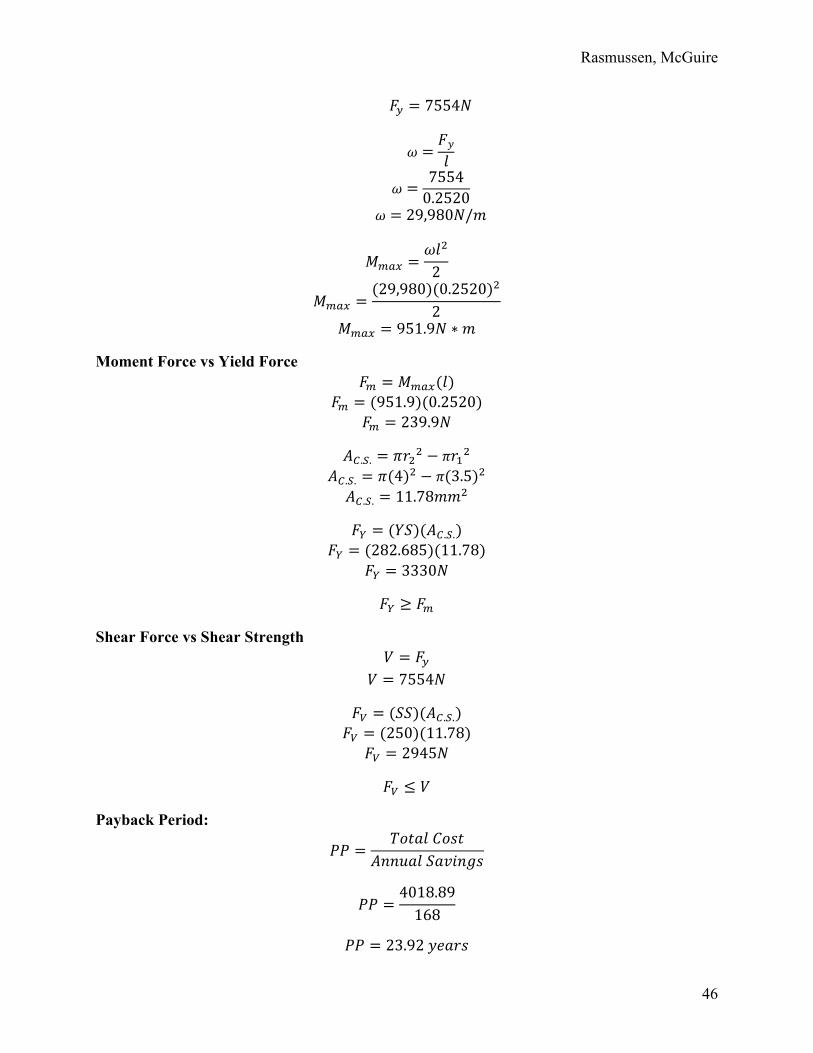
Rasmussen, McGuire
46
𝐹& = 7554𝑁
𝜔 =𝐹𝑦𝑙
𝜔 =75540.2520
𝜔 = 29,980𝑁/𝑚
𝑀!"# =𝜔𝑙C
2
𝑀!"# =(29,980)(0.2520)C
2
𝑀!"# = 951.9𝑁 ∗ 𝑚
Moment Force vs Yield Force 𝐹! = 𝑀!"#(𝑙)
𝐹! = (951.9)(0.2520) 𝐹! = 239.9𝑁
𝐴).7. = 𝜋𝑟CC − 𝜋𝑟-C 𝐴).7. = 𝜋(4)C − 𝜋(3.5)C 𝐴).7. = 11.78𝑚𝑚C
𝐹@ = (𝑌𝑆)(𝐴).7.) 𝐹@ = (282.685)(11.78)
𝐹@ = 3330𝑁
𝐹@ ≥ 𝐹!
Shear Force vs Shear Strength 𝑉 = 𝐹&
𝑉 = 7554𝑁
𝐹H = (𝑆𝑆)(𝐴).7.) 𝐹H = (250)(11.78)
𝐹H = 2945𝑁
𝐹H ≤ 𝑉
Payback Period:
𝑃𝑃 =𝑇𝑜𝑡𝑎𝑙𝐶𝑜𝑠𝑡
𝐴𝑛𝑛𝑢𝑎𝑙𝑆𝑎𝑣𝑖𝑛𝑔𝑠
𝑃𝑃 =4018.89168
𝑃𝑃 = 23.92𝑦𝑒𝑎𝑟𝑠
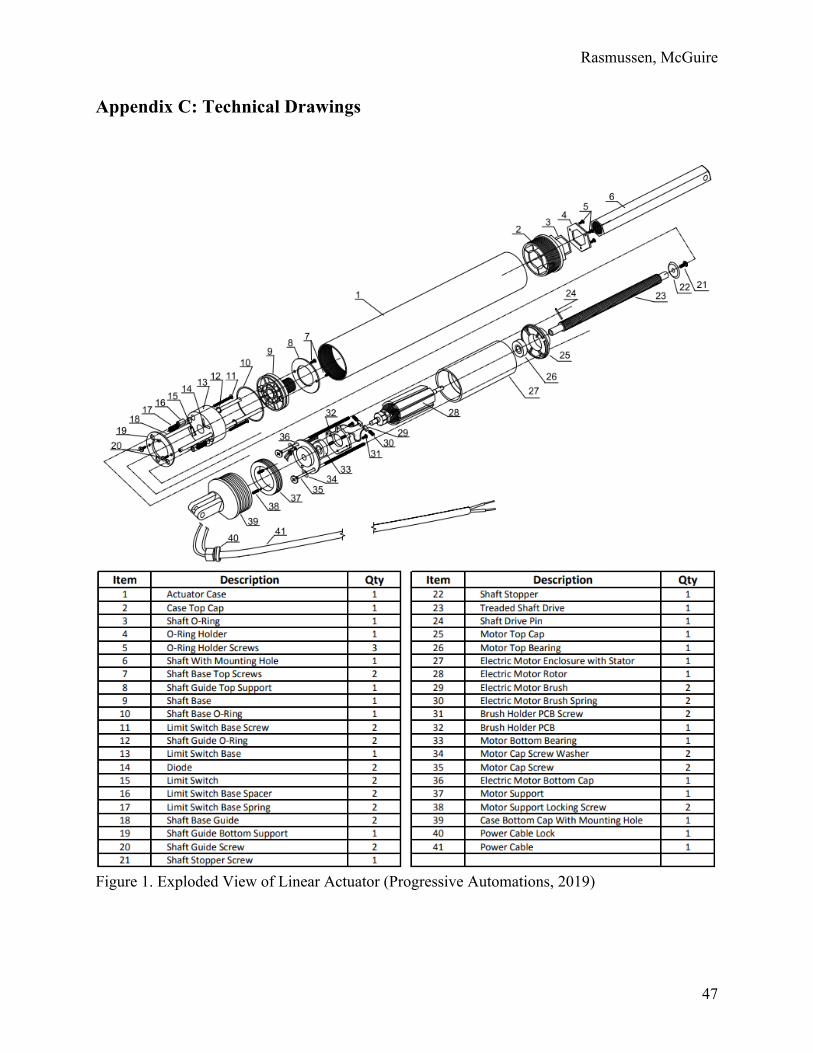
Rasmussen, McGuire
47
Appendix C: Technical Drawings
Figure 1. Exploded View of Linear Actuator (Progressive Automations, 2019)

Rasmussen, McGuire
48
Figure 2. Agreto Custom HFM-II Moisture Sensor
Figure 3. Coupler Assembly

Rasmussen, McGuire
49
Figure 4. Support Mount
Figure 5. Exploded View of Assembly

Rasmussen, McGuire
50
Figure 6 Slot for Load Transfer
Appendix D: Testing Results
Table 1. Square Bale Results
Position L1 L2 L3 L4 MP1 MP2 MP3 MP4 MD1 MD2 MD3 MD4
A 5.66 6.57 5.37 3.2 10 13 10 14 9 8.6 8.7 8.4
B 5.16 6.76 6.42 4.68 13 19 11 10 22.4 14.3 15.3 16.3
C 9.4 9.93 6.32 6.16 10 19 11 12 16.4 15.6 17.5 17.9
D 5.53 8.86 7.05 6.26 22 22 9 37 24 30.1 15.6 17.4
Water added to bale + averaging cycle modified on MP
A 8.9 7.51 5.16 7.77 24 31 10 21 10.3 12.4 11 15.6
B 4.74 9.05 8.74 9.85 48 30 32 29 Above 30 reads 100
C 10.41 11.82 1.09 9.43 17 22 26 12 27.1 24 22.8 21.2
D 8.57 6.95 8.88 7.63 28 11 39 30 22.3 15.3 24.8 28.1

Rasmussen, McGuire
51
Figure 2. Regions of the Square Bale (in) 4 vertical interior lines represent sample regions
Table 2. Round Bale Results Sample order
MDAv (%)
Placement MP1 (%)
MP2 (%)
MP3 (%)
MP4 (%)
Average (%)
1 16 C1 11 15 14 16 14 2 24 B2 30 33 32 32 31.75 3 20 B1 25 27 18 23 23.25 4 22 C2 28 60 28 26 35.5 5 23 A1 26 26 24 23 24.75 6 21 D1 33 35 24 16 27 7 25 D2 30 32 30 33 31.25 8 27 A2 36 22 27 32 29.25
Figure 1. Quadrant Layout for Round bales (ft)
A B
C D
1 2
4 3 2 1

Rasmussen, McGuire
52
Appendix E: Life Cycle Analysis
Figure 1. Life Cycle Analysis (Linkcycle, 2019)