Intersite comparison of interannual nearshore bar behavior
12
Intersite comparison of interannual nearshore bar behavior B. G. Ruessink, 1 K. M. Wijnberg, 2 R. A. Holman, 3 Y. Kuriyama, 4 and I. M. J. van Enckevort 1 Received 24 May 2002; revised 7 April 2003; accepted 9 May 2003; published 5 August 2003. [1] Long-term (>years) bathymetric data sets collected in six multiple near-shore sandbar systems were analyzed with complex empirical orthogonal function analysis to quantify intersite differences and similarities in cyclic offshore progressive bar behavior. The observations came from a 37-year annually sampled data set of four regions along the Dutch coast (spanning 70 km of coastline), an 18-year fortnightly to monthly sampled data set at Duck, North Carolina (alongshore extent 1 km), and a 7-year daily sampled data set of a single cross-shore profile at the Hasaki coast of Japan. The first complex mode, typically representing 50–70% of the total depth variance, described the long-term offshore progressive behavior and allowed for an objective separation of the barred part of the profile from the shoreward- and seaward-located nonbarred parts by considering a threshold bar amplitude below which the spatial results from the first mode were not considered reliable. The sandbars at the six examined sites share common lengths and nondimensional amplitude characteristics, which can be described by a negatively skewed Gaussian function. The absolute amplitude dimensions and the cycle return intervals differ, however, considerably between the sites. The key geometric parameters that steer this intersite variation are the time-averaged mean depths at the shoreward and seaward side of the bar zone ( d shore and d sea , respectively) as well as their difference d bz . The degree to which intersite differences in d shore , d sea , and d bz are related linearly to intersite differences in bulk statistics of external forcings (wave, tide, sediment, and bed profile characteristics) is inconclusive. INDEX TERMS: 3020 Marine Geology and Geophysics: Littoral processes; 3099 Marine Geology and Geophysics: General or miscellaneous; 4546 Oceanography: Physical: Nearshore processes; KEYWORDS: sandbars, nearshore morphology, bathymetry, eigenfunction analysis Citation: Ruessink, B. G., K. M. Wijnberg, R. A. Holman, Y. Kuriyama, and I. M. J. van Enckevort, Intersite comparison of interannual nearshore bar behavior, J. Geophys. Res., 108(C8), 3249, doi:10.1029/2002JC001505, 2003. 1. Introduction [2] Alongshore bars are submarine ridges of sand, typi- cally located in water depths of less than 10 m and oriented approximately parallel to the shoreline. They have a multi- annual lifetime and occur singularly or in multiples of up to 4 or 5 bars, extending for up to several tens of kilometers along the shore. They have been observed fringing coasts along large lakes [e.g., Evans, 1940; Saylor and Hands, 1970], semienclosed seas [e.g., Greenwood and Davidson-Arnott, 1975; Ruessink and Kroon, 1994; Wijnberg and Terwindt, 1995], and open oceans [e.g., Lippmann et al., 1993; Shand and Bailey , 1999; Kuriyama and Lee, 2001]. The natural variability in the cross-shore and alongshore appearance of bars, and changes therein, is stunning [e.g., Zenkovich, 1967], and includes variability in spatial (in the cross-shore) characteristics, such as bar amplitude and bar length, and long-term (>years) temporal characteristics. While consid- erable work has been done in quantifying these character- istics at individual sites [e.g., Greenwood and Davidson- Arnott, 1975; Larson and Kraus, 1994; Ruessink and Kroon, 1994; Pruszak et al., 1997; Plant et al., 1999], studies comparing the sites are limited and are hampered by the multiplicity of applied analysis techniques. As a result, factors controlling the intersite variability in spatial and temporal sandbar behavior are not well understood. [3] The description of spatial characteristics of barred cross-shore profiles has often been organized as a descrip- tion of geometric parameters, like bar amplitude, bar length, bar volume, bar zone width, or water depth above the crest. These parameters have either been computed directly from bathymetric surveys [e.g., Keulegan, 1948; Shepard, 1950; Saylor and Hands, 1970; Ruessink and Kroon, 1994; Plant et al., 1999] or from functions fitted to the data [Pruszak and Ro ´z ˙yn ´ski, 1998; Plant et al., 2001]. There is consider- JOURNAL OF GEOPHYSICAL RESEARCH, VOL. 108, NO. C8, 3249, doi:10.1029/2002JC001505, 2003 1 Institute for Marine and Atmospheric Research, Department of Physical Geography, Utrecht University, Utrecht, Netherlands. 2 WL|Delft Hydraulics, Marine and Coastal Management, Delft, Netherlands. 3 Coastal Imaging Laboratory, College of Oceanic and Atmospheric Sciences, Oregon State University, Corvallis, Oregon, USA. 4 Littoral Drift Division, Marine Environment and Engineering Depart- ment, Port and Airport Research Institute, Yokosuka, Japan. Copyright 2003 by the American Geophysical Union. 0148-0227/03/2002JC001505$09.00 5 - 1
Transcript of Intersite comparison of interannual nearshore bar behavior
Intersite comparison of interannual nearshore
bar behavior
B. G. Ruessink,1 K. M. Wijnberg,2 R. A. Holman,3 Y. Kuriyama,4
and I. M. J. van Enckevort1
Received 24 May 2002; revised 7 April 2003; accepted 9 May 2003; published 5 August 2003.
[1] Long-term (>years) bathymetric data sets collected in six multiple near-shore sandbarsystems were analyzed with complex empirical orthogonal function analysis to quantifyintersite differences and similarities in cyclic offshore progressive bar behavior. Theobservations came from a 37-year annually sampled data set of four regions along theDutch coast (spanning 70 km of coastline), an 18-year fortnightly to monthly sampled dataset at Duck, North Carolina (alongshore extent �1 km), and a 7-year daily sampled dataset of a single cross-shore profile at the Hasaki coast of Japan. The first complex mode,typically representing 50–70% of the total depth variance, described the long-termoffshore progressive behavior and allowed for an objective separation of the barred part ofthe profile from the shoreward- and seaward-located nonbarred parts by considering athreshold bar amplitude below which the spatial results from the first mode were notconsidered reliable. The sandbars at the six examined sites share common lengths andnondimensional amplitude characteristics, which can be described by a negatively skewedGaussian function. The absolute amplitude dimensions and the cycle return intervalsdiffer, however, considerably between the sites. The key geometric parameters that steerthis intersite variation are the time-averaged mean depths at the shoreward and seawardside of the bar zone (dshore and dsea, respectively) as well as their difference dbz. Thedegree to which intersite differences in dshore, dsea, and dbz are related linearly to intersitedifferences in bulk statistics of external forcings (wave, tide, sediment, and bed profilecharacteristics) is inconclusive. INDEX TERMS: 3020 Marine Geology and Geophysics: Littoral
processes; 3099 Marine Geology and Geophysics: General or miscellaneous; 4546 Oceanography: Physical:
Nearshore processes; KEYWORDS: sandbars, nearshore morphology, bathymetry, eigenfunction analysis
Citation: Ruessink, B. G., K. M. Wijnberg, R. A. Holman, Y. Kuriyama, and I. M. J. van Enckevort, Intersite comparison of
interannual nearshore bar behavior, J. Geophys. Res., 108(C8), 3249, doi:10.1029/2002JC001505, 2003.
1. Introduction
[2] Alongshore bars are submarine ridges of sand, typi-cally located in water depths of less than 10 m and orientedapproximately parallel to the shoreline. They have a multi-annual lifetime and occur singularly or in multiples of up to 4or 5 bars, extending for up to several tens of kilometers alongthe shore. They have been observed fringing coasts alonglarge lakes [e.g., Evans, 1940; Saylor and Hands, 1970],semienclosed seas [e.g., Greenwood and Davidson-Arnott,1975; Ruessink and Kroon, 1994; Wijnberg and Terwindt,1995], and open oceans [e.g., Lippmann et al., 1993; Shand
and Bailey, 1999; Kuriyama and Lee, 2001]. The naturalvariability in the cross-shore and alongshore appearance ofbars, and changes therein, is stunning [e.g., Zenkovich,1967], and includes variability in spatial (in the cross-shore)characteristics, such as bar amplitude and bar length, andlong-term (>years) temporal characteristics. While consid-erable work has been done in quantifying these character-istics at individual sites [e.g., Greenwood and Davidson-Arnott, 1975; Larson and Kraus, 1994; Ruessink and Kroon,1994; Pruszak et al., 1997; Plant et al., 1999], studiescomparing the sites are limited and are hampered by themultiplicity of applied analysis techniques. As a result,factors controlling the intersite variability in spatial andtemporal sandbar behavior are not well understood.[3] The description of spatial characteristics of barred
cross-shore profiles has often been organized as a descrip-tion of geometric parameters, like bar amplitude, bar length,bar volume, bar zone width, or water depth above the crest.These parameters have either been computed directly frombathymetric surveys [e.g., Keulegan, 1948; Shepard, 1950;Saylor and Hands, 1970; Ruessink and Kroon, 1994; Plantet al., 1999] or from functions fitted to the data [Pruszakand Rozynski, 1998; Plant et al., 2001]. There is consider-
JOURNAL OF GEOPHYSICAL RESEARCH, VOL. 108, NO. C8, 3249, doi:10.1029/2002JC001505, 2003
1Institute for Marine and Atmospheric Research, Department ofPhysical Geography, Utrecht University, Utrecht, Netherlands.
2WL|Delft Hydraulics, Marine and Coastal Management, Delft,Netherlands.
3Coastal Imaging Laboratory, College of Oceanic and AtmosphericSciences, Oregon State University, Corvallis, Oregon, USA.
4Littoral Drift Division, Marine Environment and Engineering Depart-ment, Port and Airport Research Institute, Yokosuka, Japan.
Copyright 2003 by the American Geophysical Union.0148-0227/03/2002JC001505$09.00
5 - 1
able debate in the literature about environmental factorscontrolling intersite differences in geometric parameters.Zenkovich [1967, p. 233] noted that ‘‘convincing proof hasbeen obtained in the eastern Baltic of the absence of anydirect connection between the structure of bars and suchimportant elements as the amount of material in movementand the parameters of storm waves.’’ In contrast, Larson andKraus [1989] linked differences in geometric bar propertiesin the laboratory to the offshore wave height and period, andto the sediment fall velocity. Also, Davidson-Arnott [1988]suggested after a comparative study of bar systems in thelower Great Lakes and the Gulf of St. Lawrence that thedepth above the outer bar increases linearly with increasingmaximum wave height. Measurements of wave height were,however, unavailable in this study and the maximum waveheight was therefore inferred from the longest fetch lengthwithin 45� from shore normal. Interestingly, there alsoappears to be some similarity in geometric parametersbetween the sites. For instance, the ratio of the water depthin the trough to the depth above the next seaward-located barcrest has often been reported to attain an approximatelyconstant value of 1.7 [Keulegan, 1948; Shepard, 1950;Saylor and Hands, 1970; Greenwood and Davidson-Arnott,1975], although a positive dependence of this ratio on theoffshore wave steepness has also been found [King, 1959;Larson and Kraus, 1989]. Additionally, King and Williams[1949] noted that the water depth over the bar crest to theheight of the bar crest above a smooth barless profile has aratio of 2 to 1. A similar value can also be deduced from thelaboratory bar profiles reported by Keulegan [1948] and thefield data by Shepard [1950] and Zenkovich [1967]. Outerbars often disobey these ratios [e.g., King, 1959], as theytend to be more subdued than inner bars. Finally, in multiplebar settings, the depth over the bar crest often increaseslinearly over successive bars, while the spacing betweencrests increases exponentially in the offshore direction [e.g.,Saylor and Hands, 1970; Pruszak et al., 1997].[4] Long-term sandbar behavior often has a cyclic offshore
directed character [Ruessink and Kroon, 1994;Wijnberg andTerwindt, 1995; Plant et al., 1999; Shand and Bailey, 1999;Kuriyama and Lee, 2001]. A bar cycle comprises bargeneration near the shoreline, net offshore migrationthrough the surf zone, and bar decay at the seaward marginof the nearshore. Bar decay is associated with the onset ofnet offshore migration of the next shoreward-located barand bar birth near the shoreline. This type of behavior maybe alongshore coherent for >10 km [Wijnberg and Terwindt,1995; Wijnberg, 1998] and, accordingly, reflects cross-shoreoriented bar variability, in other words, does not result fromthe alongshore propagation of shore oblique bars. Reportedcycle return period range from about 1 year at the PacificCoast of Japan [Kuriyama and Lee, 2001] to well over10 years along the Dutch Coast [Ruessink and Kroon, 1994;Wijnberg and Terwindt, 1995]. Shand et al. [1999] sug-gested that the duration of net offshore migration (i.e., thetime period between the onset of this migration trend andthe onset of bar decay) decreases with increasing nearshoreslope, decreasing wave height, and a predominant winddirection tending to a maximum of 40 to 45� with thecoastline. These duration/process relationships should beinterpreted with caution. Not only were the intersite differ-ences in process parameters small compared to the wide
range of duration values, but also the duration and processparameters were not computed in the same consistentmanner in Shand et al.’s [1999] literature sources.[5] In this paper we quantify intersite differences and
similarities in geometric and long-term temporal bar char-acteristics from long-term bathymetric data sets availablefor 6 different sites with known offshore progressive barbehavior. The data (section 2) came from 4 regions alongthe Dutch coast, Duck on the eastern US seaboard, and theHasaki Coast of Japan. Complex empirical orthogonalfunction analysis (section 3) was applied to quantify thecross-shore evolution of bar amplitude and bar length, andthe return period of successive bar decay at the outer edge ofthe nearshore. The present work is unique in the sense that itanalyzes a large number of the existing long-term bathy-metric data sets of nearshore bars with a single technique,thereby allowing for a proper intersite comparison ofgeometric and temporal bar characteristics. The results ofthis comparison can be found in section 4, in whichattention is, in particular, focused on the similarity ingeometric parameters. Section 5 explores the possible roleof wave, tide, sediment, and bed profile characteristics onthe observed intersite differences in bar amplitude andreturn period. Finally, our main conclusions are discussedand summarized in sections 6 and 7, respectively.
2. Field Sites and Data Set Description
[6] Bathymetric data sets analyzed in this paper werecollected in four regions along the Dutch coast, near Duck,North Carolina, and on the Hasaki Coast of Japan (Table 1).Each of the sites is characterized by the presence of a sandbarsystem that behaves in a cyclic, offshore directed manner.Earlier analyses of the data, together with extensive descrip-tions of the field sites and of the data set characteristics, aregiven by Ruessink and Kroon [1994] and Wijnberg andTerwindt [1995] for the Dutch coast, by Lippmann et al.[1993] and Plant et al. [1999] for Duck, and by Katoh [1998]and Kuriyama [2000, 2002] for Hasaki.[7] Data collected at the four Dutch regions (Zuid-
Holland, Noord-Holland, Terschelling, and Ameland) formpart of the Jarkus data base, which contains annual surveyssince 1964 using vertical aerial photogrammetry and echo-sounding. Alongshore spacing between cross-shore depthprofiles is 200–250 m (Table 1). Up to 1985, all surveysextended 800 m offshore, and often missed the seaward end
Table 1. Data Set Characteristics
RegionExtent,a
kmSpacing,a
m Time Period Nb xend,cm Nw
d
Zuid-Holland 35 250 1964–2000 37 850 35Noord-Holland 24 250 1964–2000 37 1100 24Terschelling 4 200 1965–2000 36 1700 4Ameland 7 200 1964–2000 37 1400 7Duck 1.2e 45 1981–2000 492 400 1Hasaki 0 – 1987–1994 2150 400 1
aIn the alongshore direction.bNumber of temporal observations.cMost seaward cross-shore coordinate.dNumber of alongshore windows in which data was analyzed; see
section 3.eHere 400 m was discarded because of pier effects.
5 - 2 RUESSINK ET AL.: INTERANNUAL NEARSHORE BAR BEHAVIOR

of the bar zone, particularly at Terschelling and Ameland.Since 1985, profiles have been surveyed up to severalkilometers off the beach, well seaward of the bar zone.The Zuid-Holland and Noord-Holland region are located onthe approximately 120-km long, inlet-free Holland Coast,and are separated by the IJmuiden harbor jetties, whichextend about 2.5 km into the sea. Terschelling and Amelandare barrier islands located in the northern part of theNetherlands. Analyzed data is located in front of the centralpart of the islands, in between the outer deltas associatedwith the tidal inlet systems that separate the barrier islands.[8] Data collection at the U.S. Army Corps of Engineers
Field Research Facility (FRF) near Duck, located on abarrier island in the Atlantic Ocean, started in 1981 andhas continued at approximately fortnightly to monthly inter-vals. The data, obtained with an amphibious vehicle, spansroughly 1 km alongshore, centered about the FRF pier, andmostly extends sufficiently far offshore to include all depthvariability related to the sandbars. Data within 200 m of thepier was excluded from the analyses because of the effect ofthe pier on the morphology [Plant et al., 1999]. Alongshorespacing between cross-shore depth profiles in the remainingnorthern and southern part is about 45 m.[9] The Hasaki data comprises depth profiles of a single
cross-shore transect along the Hazaki Oceanographical Re-search Station, a 427 m long pier facing the Pacific Ocean.The profiles were collected on a daily basis (except forweekends and holidays) between 1987 and 1994 using a 5 kglead from the pier, and with level and staff shoreward of thepier. On the basis of a limited number of bathymetric surveysin a 600-m alongshore region centered about the HORS pier,Kuriyama [2000] showed that the mean profile and thestandard deviation of the seabed along HORS were almostidentical to that further away from the pier, in other words,that the Hasaki data, despite being measured from a pier, isrepresentative of open beach dynamics. This is in markedcontrast with the FRF pier, where scour around pilings hasresulted in a pronounced shore perpendicular trough and in astandard deviation about twice as high as further away fromthe pier. The FRF pier is supported by double pilings, whilethe HORS pier is supported by single pilings, probablyexplaining why the Hasaki data does not appear to be muchinfluenced by the presence of the pier. The bar zone endsnear the tip of the HORS pier [Kuriyama, 2002].[10] At all sites individual survey points were taken at
varying distances from a local baseline. Linear interpolationwas therefore employed to yield depth estimates at commoncross-shore points. The cross-shore distance between con-secutive grid points was set to 5 m. In each cross-shoreprofile, x = 0 was set to the cross-shore location with a heightof +1 m above mean sea level; this height approximates themean high tide level at all sites. The +1 m height can beconsidered as a process-oriented reference height, separatingthe subaerial part of the profile from the subaqueous part.The subaqueous part is subject to hydrodynamic processeson a daily timescale, whereas the subaerial part is submergedduring storms only. The +1 m contour was preferred oversome deeper located datum (e.g., mean sea level or the low-tide level) because its position is less sensitive to large short-term (days-seasons) fluctuations. The concept of a floatingdatum was previously applied by Wijnberg and Terwindt[1995] in a conventional EOF analysis of the Zuid-Holland
and Noord-Holland data. They found that apparent barmovement induced by the floating datum was negligiblebecause generally less than 10% of the variation in barposition was correlated with a change in the +1 m position.The most seaward cross-shore coordinate included in thedata set, xend, was based on the standard deviation s(x) of thedepth values. In the zone where bars were active s wastypically high, dropping off rapidly to an approximatelyconstant value farther offshore [e.g., Ruessink and Kroon,1994; Plant et al., 1999], related largely to measurementerrors. For each region, xend was chosen such (Table 1) thatthis change to a constant s was just included in all cross-shore profiles.
3. Methodology
[11] At each alongshore ( y) position the time-distancematrix of seabed surface zb(t, x), where t denotes time, iscomposed of a mean (in time) profile �zb(x) and perturbations~zb(t, x) around �zb(x),
zbðt; xÞ ¼ zbðxÞ þ ~zbðt; xÞ: ð1Þ
The perturbation matrix, in turn, consists of cross-shorecoherent bar behavior ~zbar(t, x) and ambient noise e(t, x),
~zbðt; xÞ ¼ ~zbarðt; xÞ þ �ðt; xÞ: ð2Þ
The noise term consists of measurement errors as well asdepth changes that are not coherent across the profile. Thequantification of ~zbar(t, x) from zb(t, x) requires the compu-tation of the mean profile and the separation of the coherentbar variability from the noise. This separation is achieved bya complex empirical orthogonal function (CEOF) analysis,decomposing ~zb into complex spatial functions and associ-ated complex coefficients. This analysis has the ability todetect propagating wave phenomena and, as all data setscontain offshore propagating bars, is capable of separatingthe dominant bar behavior from the less dominant noise.[12] To increase the reliability of the spatial eigenfunc-
tions, we decided not to analyze each cross-shore profileindividually, but instead, following Wijnberg and Terwindt[1995], to analyze the bathymetric data in windows com-prising depth profiles from several alongshore positions (seeNorth et al. [1982] and Horel [1984] for a discussion on theeffect of sample size on the accuracy of eigenfunctionresults). For the Jarkus data, the window width was set to1 km. This window was then moved along the coast with astep size of 1 km. The width of the window is assumed to besmall enough to still reliably determine large-scale trends(e.g., in mean profile slope) that may affect bar character-istics. The Duck data was treated as a single window, in-cluding all cross-shore sections in the region north and southof the FRF pier. Henceforth, all available profiles within awindow are denoted as zb(t, x) and, accordingly, the meanprofile refers to a time-averaged and alongshore (within awindow)-averaged profile. The Hasaki data can obviouslynot be analyzed in separate windows, as it comprises a singlecross-shore profile. For consistency, we will treat the Hasakidata as a window comprising a single cross section.[13] Complex EOF is performed on the complex matrix
Zb(t, x), whose real part is the original matrix ~zb(t, x) andwhose imaginary part is the Hilbert transform of ~zb(t, x). The
RUESSINK ET AL.: INTERANNUAL NEARSHORE BAR BEHAVIOR 5 - 3
addition of the Hilbert transform as the imaginary part toZb(t, x) allows travelling wave activity in the real field to bedetected [Horel, 1984]. The same procedure for determiningspatial eigenfunctions En(x) and temporal coefficients An(t)is used as in the more conventional real EOF [e.g., VonStorch and Zwiers, 1999], where n is an integer denotingthe mode number. Because ~zb(t, x) and thus Zb(t, x) oftencontained missing observations owing to incomplete sur-veys, this procedure was accommodated using Von Storchand Zwiers’s [1999] approach to handle gappy data. In thepresent application, the spatial functions carry the units,whereas the coefficients are nondimensional. A rigorousdescription of CEOF analysis can be found elsewhere [e.g.,Barnett, 1983; Horel, 1984; Von Storch and Zwiers, 1999].Note that the use of windows implies that the CEOFanalysis results in one set of spatial eigenfunctions for eachwindow but in temporal coefficients at each alongshoreposition within a window.[14] Preliminary analysis of the data [Kuriyama and Lee,
2001; Ruessink et al., 2001] has shown that the firstcomplex mode typically accounts for 50–70% of the totalvariance in ~zb(t, x) with percentages increasing to 60–75%in the zone where bars were most active. Because our focusis on properties of coherent bar behavior, ~zbar(t, x) can berepresented adequately in terms of the amplitude and phaseof E1(x) and A1(t),
~zbarðt; xÞ ¼ SðxÞRðtÞ cos qðxÞ � yðtÞ½ �; ð3Þ
in which S(x) is the time-invariant spatial envelope of baramplitude, R(t) represents normalized temporal variations inS(x), and q(x) and y(t) are the spatial and temporal phase,respectively. S(x) and R(t) are the absolute values of E1(x)and A1(t), respectively, and q(x) and y(t) follow from
qðxÞ ¼ arctan=fE1ðxÞg<fE1ðxÞg
� �ð4Þ
and
yðtÞ ¼ arctan=fA1ðtÞg<fA1ðtÞg
� �; ð5Þ
where ={} and <{} denote the imaginary and real part,respectively. The bar length L(x) is computed as [e.g.,Barnett, 1983]
LðxÞ ¼ 2prqðxÞ ð6Þ
and the cycle return period Tr equals the ratio of 2p to theslope of the least squares linear fit of y versus time.[15] The interpretation of S(x), R(t), L(x), and Tr is
illustrated with the results of the window y = 41–42 kmin Noord-Holland. Figure 1a shows a space-time map (timestack) of the perturbations at y = 41.50 km. Warm colorscorrespond to perturbations above the window mean andtime mean profile (bars), while cold colors corresponds toperturbations below the mean (troughs). Four successivebars can be identified in the 37-year time period, each ofwhich is generated near x � 150 m, migrates offshore forseveral years, and finally vanishes near x � 700 m. Theinner bar starts to migrate offshore once the most seaward-
located bar has reached its maximum distance offshore andstarts to degenerate (e.g., bars 2 and 3 around 1986). Theaverage bar return period in this example can be estimatedat about 15 years. A space-time map of the perturbationsreconstructed with the first CEOF, accounting for 57% ofthe variance, is shown in Figure 1b. The same four bars canbe identified, compare Figure 1b with Figure 1a. Theamount of explained variance in the bar zone is high, withr2 (computed with linear regression between measuredand reconstructed perturbations) typically larger than 0.6and maximum r2 near 0.85 (Figure 2a). Perturbations atx < �150 m and x >� 700 m are poorly resolved by the firstCEOF (Figure 1b), with r2 < 0.4 (Figure 2a).[16] In the example window, S is small at the shoreward
and seaward side of the cross-shore profile and large inthe middle part (150 < x <700 m), where the bars wereactive (Figure 2b). Large S are associated with large r2,compare Figures 2a and 2b. When S and r2 are small (nearthe shoreward and seaward end of the cross-shore profile),L estimates (Figure 2d) are rather erratic and do not followthe general increase with distance offshore for 150 < x <700 m where S and r2 are large. To avoid spurious results athreshold S = 0.3 m was chosen below which the spatialCEOF results were considered to be unreliable. On theseaward side S = 0.3 m is approximately located where schanges into approximately constant values (section 2) andr2 drops off rapidly to near-zero values (Figure 2a). Theresults in the remainder of this paper are not very sensitiveto the precise threshold value, since the change from large tolow S occurred within rather narrow x ranges (Figure 2b).With the threshold S we have introduced an objectivecriterion to separate the barred part of the profile from thenonbarred part. We now define a number of simple geo-metric parameters that are used in section 4 to investigatethe similarity in spatial (cross-shore) bar characteristics, viz.the shoreward and seaward limit of the bar zone, xshore andxsea, respectively, the mean depths (d = �zb) at theselocations dshore and dsea, the bar zone width xbz = xsea �xshore, the bar zone depth range dbz = dsea � dshore, themaximum value of S, Smax, and the cross-shore location andmean depth where S = Smax, xmax and dmax, respectively. Inthe example, xshore = 130 m, xsea = 705 m, dshore = 1.63 m,dsea = 6.39 m, xbz = 575 m, dbz = 4.75 m, Smax = 1.37 m,xmax = 470 m, and dmax = 4.98 m.[17] The temporal results in the example window are
plotted in Figure 3. The real and imaginary part of A1(t)vary repetitive around 0 with a period of �15 years(Figure 3a), with the imaginary part lagging the real partby several years (about one-quarter wavelength). This pat-tern reflects the cyclic offshore directed sandbar propaga-tion. The absolute value of A1, R, shows variability of littleinterest (Figure 3b) and has a time-averaged value of 1owing to its normalized nature. The unwrapped temporalphase increases with time (Figure 3c). The slope of the leastsquares linear fit amounts to 0.45 rad year�1 (r = 0.97),corresponding to Tr = 14 years, close to the 15 yearssuggested from Figure 1a.
4. Results
[18] In this section we focus on intersite differences andsimilarities in bar amplitude S, bar length, and cycle
5 - 4 RUESSINK ET AL.: INTERANNUAL NEARSHORE BAR BEHAVIOR

return period. Temporal variations in the bar amplitudeare not considered, which implies that bar amplitude isinvestigated for a typical situation (R(t) = 1). Variousparameterizations will be developed to highlight thesimilarity in geometric parameters. These parameteriza-tions are not meant as a replacement for understandingthe physics of spatial and temporal sandbar behavior, butinstead they capture the essence of our observations bothas plausible guidance to further research and as rules ofthumb for researchers who wish to represent naturalsandbar systems.
4.1. Geometric Characteristics
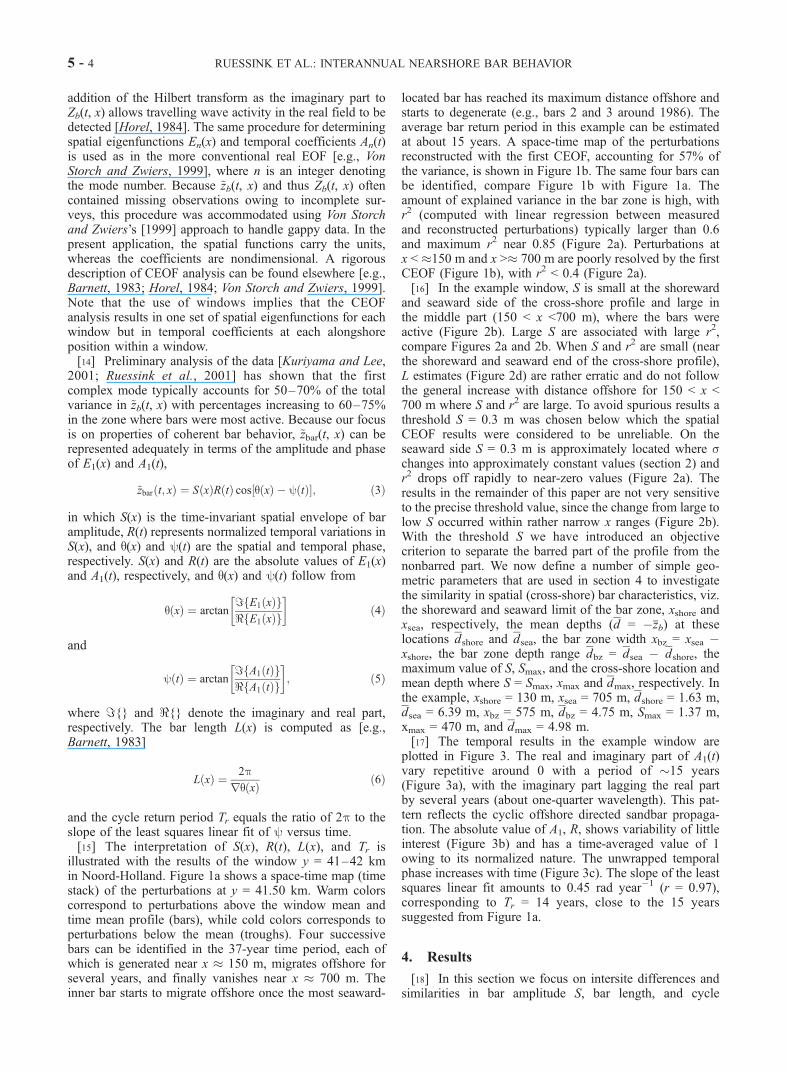
4.1.1. Bar Amplitude[19] As can be seen in Figure 4 and Table 2, consider-
able intersite variability exists for the bar amplitudeenvelopes S and the related geometric parameters definedin section 3. For instance, at Duck the bar zone extendsfrom x = 20 to 270 m in depths of about 1 to 4 m below
mean sea level. In contrast, at Terschelling, the bar zone is�4 times as wide and extends to about 7-m depth (Table 2).In addition, Smax at Terschelling is about twice as large asat Duck. Besides the intersite variability, there alsoappears to be some small intrasite variability in theDutch S(x) curves (Figure 4 (left)). However, this vari-ability is less prominent in S(d) (compare Figure 4 (right)to Figure 4 (left)), implying that S is a function of meandepth rather than of cross-shore distance, and that thenoted intrasite variability in S(x) may be related to smallslope differences of the window mean cross-shore profileat each site.[20] The shape of the S(d) curves is remarkably similar.
All curves rise gently from near-zero values up to somemaximum and then drop off to near-zero values again. Asdsea increases (i.e., the bar zone extends into largerdepths), Smax and dmax increase as well (Figure 5 andTable 3). To explore the similarity in S(d) further, site-averaged S(d) curves were computed for the four Dutch
Figure 1. Space-time map of the (a) observed and reconstructed perturbations ~zb(t, x) based on(b) CEOF mode 1 and (c) equations (10), (11), and the temporal information of CEOF mode 1 at y =41.50 km in Noord-Holland, Netherlands. Individual sandbars are labeled. Blank regions in Figures 1aand 1c represent missing data and the barless (S < 0.3 m) parts of the profile, respectively.
RUESSINK ET AL.: INTERANNUAL NEARSHORE BAR BEHAVIOR 5 - 5

sites by binning S corresponding to d ± 0.05 m andsubsequently normalizing d and S for all six sites as
d0 ¼ d � dshore
dsea � dshoreð7Þ
and
S0 ¼ S � dSmax � d
; ð8Þ
in which d is the threshold S = 0.3 m. In this way, the barzone ranges from d0 = 0 to d0 = 1, with S0 = 0 at d0 = 0, 1and S0 = 1 at d = dmax. The six resulting S0(d0) curveswere obviously not identical, but they possessed the samegeneral negatively skewed shape with S0 = 1 near d0 =0.55–0.8 (Figure 6a). This shape shows that an offshorepropagating bar increases in amplitude until it has movedthrough some 55 to 80% of the bar depth zone and thatbar decay is, accordingly, confined to a rather narrow (thelower 20 to 45% of the bar depth zone) depth range.[21] The S0(d0) curve averaged over all six sites was
approximated reasonably well with a negatively skewed,Gaussian-like function (Figure 6, r = 0.98)
S0 ¼ exp� 1� d0ð Þa�bf g2
c
" #; ð9Þ
in which the values of the parameters a, b, and c,determined with nonlinear least squares fitting by theGauss-Newton method, are (±95% confidence interval) 0.53(±0.05), 0.57 (±0.03), and 0.09 (±0.01), respectively.Rewriting (9) into dimensional bar amplitude results in
SðdÞ ¼ dþ ðSmax � dÞ exp� 1� d�dshore
dsea�dshore
� �0:53�0:57
� �2
0:09
26664
37775ð10Þ
Because Smax can be written in terms of dsea (that is,Figure 5) and d is a constant, S(d) is determined by dshoreand dsea only. In other words, the similarity in the depthdependence of bar amplitude is controlled by twovariables, namely the mean depth where the bar zonestarts (dshore) and where it ends (dsea). The dependence ofdshore and dsea on various environmental characteristicssuggested in section 1 to affect geometric bar parameters isinvestigated in section 5.4.1.2. Bar Length[22] In the cross-shore evolution of bar length at the four
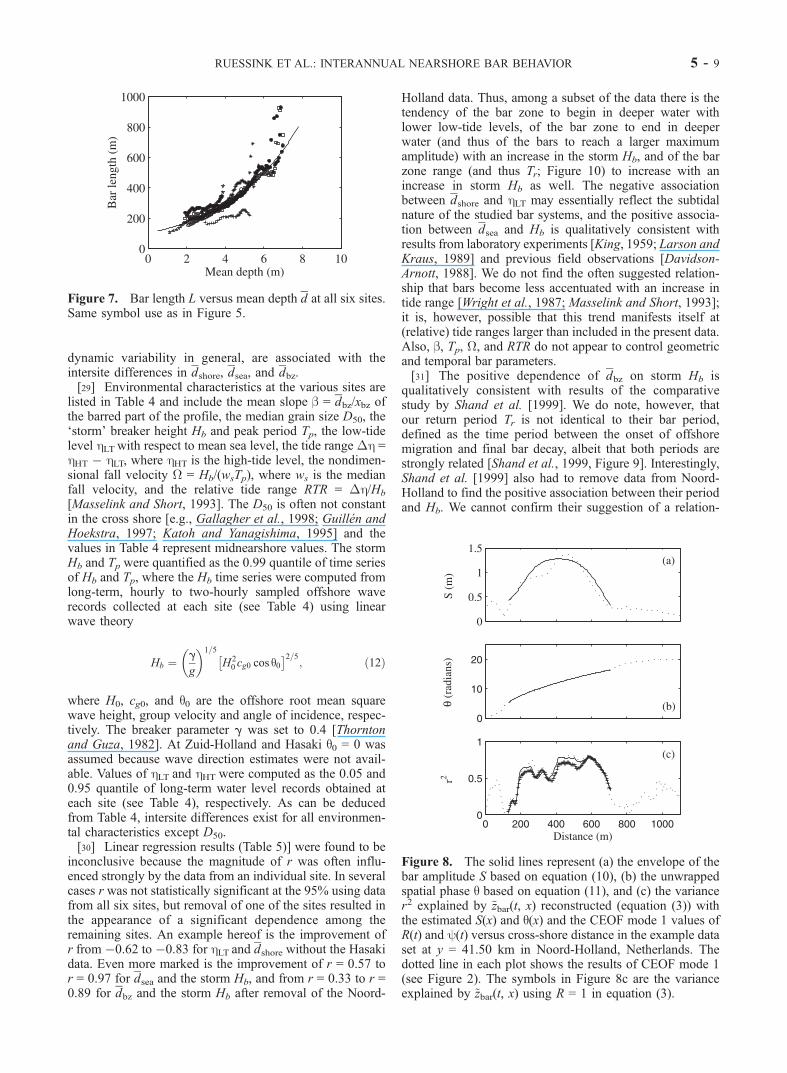
Dutch sites, some small intrasite differences were found thatwere similar to those found for the envelope of bar ampli-tude. These differences were largely absent in the depthdependence of bar length, indicating that also bar length is afunction of mean depth rather than of cross-shore distance.Figure 7 shows the site-averaged L, binned according to d ±0.05 m, together with L at Duck and Hasaki. The symbolsfrom the six sites cannot be discerned well, implyingintersite L(d) differences to be small. Except at Hasaki, L
Figure 2. (a) Explained variance r2, (b) envelope of the baramplitude S, (c) spatial phase q, and (d) bar length L versuscross-shore distance x in the example data set ( y = 41 ��42 km, Noord-Holland). The dotted line in Figure 2b is thethreshold S = 0.3 m to compute the barred part of the cross-shore profile; see text for further explanation.
Figure 3. Time series of (a) normalized real (solid) andimaginary (dashed) part of coefficients A, (b) normalizedtemporal variationsR in the bar amplitude, and (c) unwrappedtemporal phase y of the first CEOF in the example window( y = 41.50 km, Noord-Holland). The solid line in Figure 3cis the least squares linear fit.
5 - 6 RUESSINK ET AL.: INTERANNUAL NEARSHORE BAR BEHAVIOR
increases stronger than linear from �200 m in d = 2–3 m to�500–700 m in d = 6–7 m. The scatter in L increasessomewhat in the deeper parts of the bar zone. At Hasaki L isabout 50–100 m smaller than at the other sites. The data inFigure 7 can be approximated well (r = 0.87) by anexponential curve
LðdÞ ¼ a exp bd� �
; ð11Þ
in which the values of the parameters a and b are 100 (±8.5)and 0.27 (±0.02), respectively. The use of an exponential fitis qualitatively consistent with the findings of Saylor andHands [1970] and Pruszak et al. [1997], see section 1,although in these papers the dependence was on cross-shoredistance rather than on mean depth.4.1.3. Reconstruction[23] In the preceding subsections we have derived inter-
site averaged parameterizations of the bar amplitude S andbar length L. These parameterizations resulted from anumber of successive statistical analyses, from CEOF
analysis through alongshore and intersite averaging to theGaussian and exponential fits of equations (10) and (11). Itis therefore illustrative to see how well the final parametersare still representative of the original data ~zb(t, x). This willbe pursued for the same example window as used insection 3.[24] In this window the cross-shore distribution of S and q
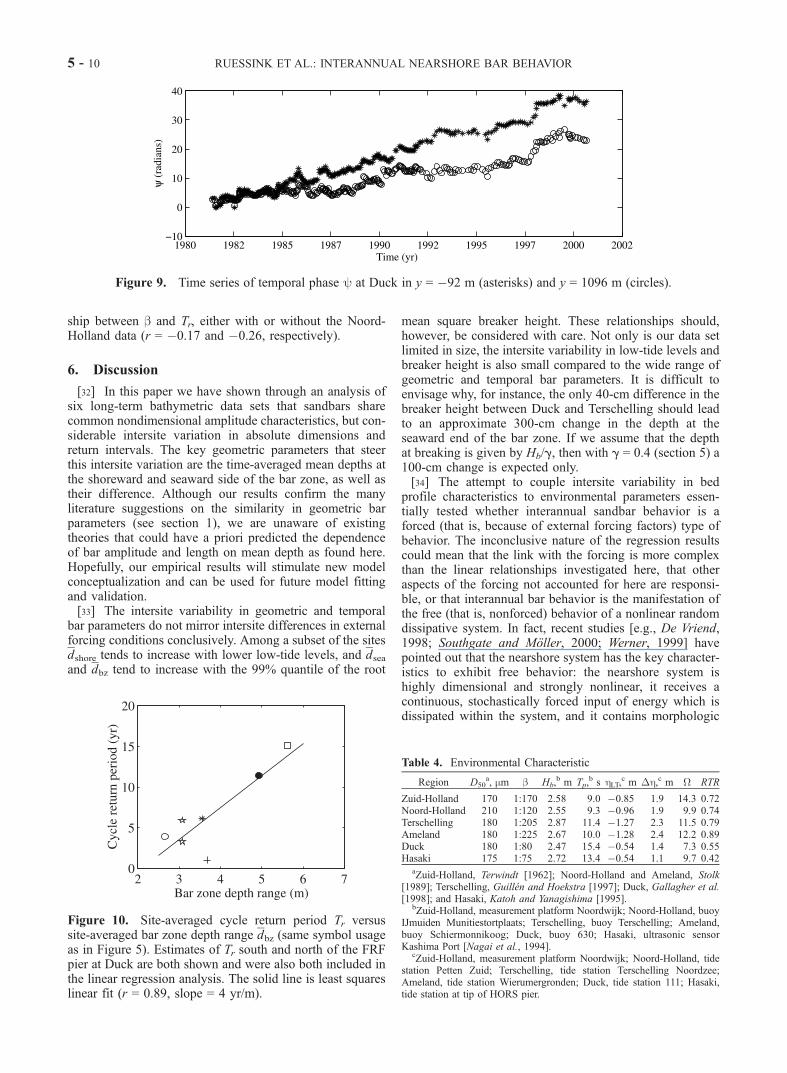
estimated with equations (10) and (11) (using dsea, dshore,and zb(x)) closely resemble S and q based on CEOF mode 1(Figures 8a–8b). With these estimated S(x) and q(x), and theCEOF mode 1 values of R(t) and y(t) (Figure 3), ~zbar(t, x)was reconstructed using equation (3). As can be seen bycomparing Figure 1c to Figure 1a, the reconstructed pertur-bations resemble the measured perturbations well; theyexplain about equal amounts of variance as the perturba-tions based entirely on CEOF mode 1 (Figure 8c). The useof R = 1 in the reconstruction of ~zbar(t, x) with equation (3)instead of the time-varying R values of Figure 3b has littleeffect on the explained variance (Figure 8c). Results similarto Figure 8 were obtained for all windows at all other sites
Figure 4. Envelope of bar amplitude S versus (left) cross-shore distance x and (right) mean depth d. Thedotted line in each panel is the threshold S = 0.3 m to separate the barred and nonbarred parts of theprofile.
Table 2. Bar Zone Characteristics
xshore, m xsea, m dshore, m dsea, m xbz, m dbz, m Smax, m xmax, m dmax, m Tr, years
Zuid-Hollanda 135 603 1.94 4.59 468 2.65 0.93 350 3.71 3.9Noord-Hollanda 119 794 1.40 7.02 675 5.62 1.33 444 5.08 15.1Terschellinga 214 1243 1.86 6.79 1029 4.93 1.66 704 6.20 11.4Amelanda 246 1040 2.34 5.89 794 3.55 1.25 619 4.86 6.1Duck 20 270 0.85 3.92 250 3.07 0.81 120 2.67 1l3.3 (5.9)b
Hasaki 140 415 1.85 5.52 275 3.67 1.37 255 4.07 1.0aWindow-averaged values.bSouth (north) of FRF pier; see text for further explanation.
RUESSINK ET AL.: INTERANNUAL NEARSHORE BAR BEHAVIOR 5 - 7
except at Hasaki because of the systematic L overestimationwhen using equation (11) at this site (Figure 7). On thewhole these results show that S(x) and L(x) can be predictedaccurately (relative to the accuracy of CEOF mode 1) atindividual cross-shore transects on the basis of alongshoreand intersite averaged parameterizations of S(d ) and L(d )given a priori knowledge of dsea, dshore, and ~zb(x).
4.2. Temporal Characteristics
[25] Return periods Tr of the long-term offshore directedbar cycle ranged from about 1 year at Hasaki to 15 years atNoord-Holland (Table 2). Considerable intrasite variabilityin Tr was found at Zuid-Holland, Noord-Holland, and Duck.In the two Dutch regions, this variability was related to along-term three-dimensional type of bar behavior [Wijnbergand Wolf, 1994] known as bar switching [Shand and Bailey,1999; Shand et al., 2001]. It involves bars being discontin-uous in the alongshore, with a well-developed outer bar onone side of the discontinuity attaching to the inner bar onthe other side. On opposite sides of a bar switching area Trvalues are about the same and the r2 of the least squareslinear fit between the unwrapped y1 and t exceeds 0.95.Within a switching area bars do not progress systematicallyin the offshore direction [Wijnberg and Wolf, 1994; Shand etal., 2001]. Because Tr quantifies the offshore progressioncycle, it is not a meaningful number in a switching area and,accordingly, Tr estimates in switching areas were not used inthe computation of the Noord-Holland and Zuid-Hollandaveraged Tr listed in Table 2.
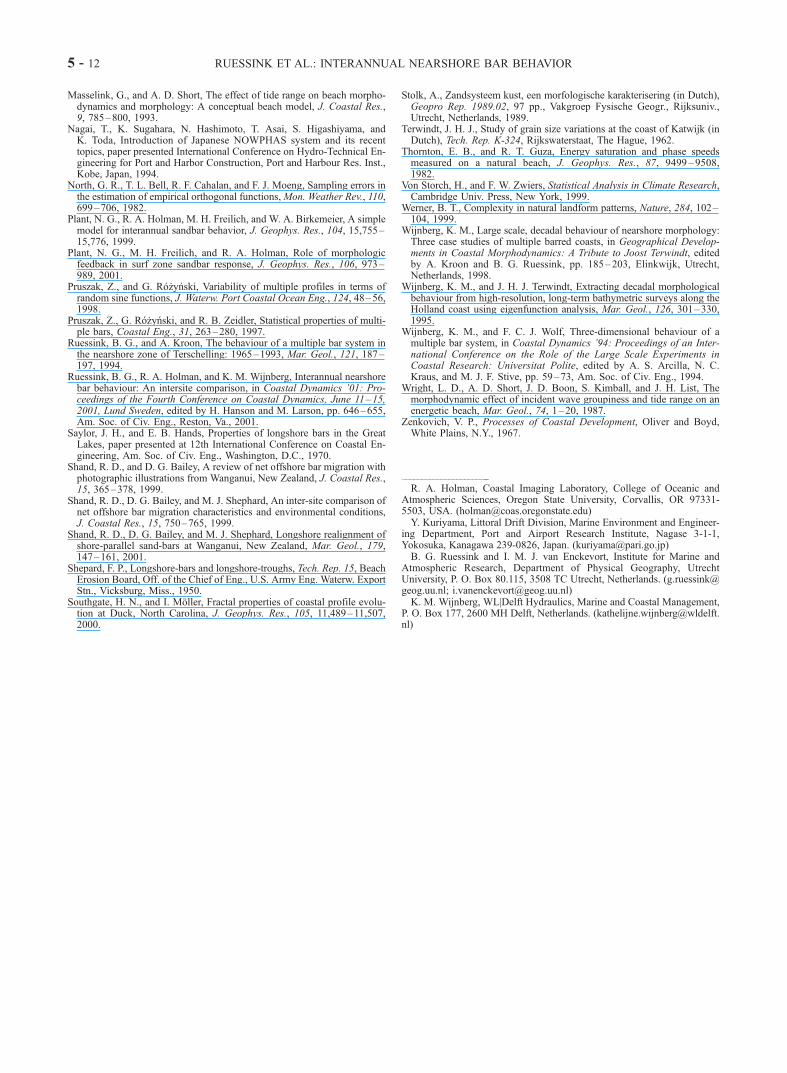
[26] At Duck Tr amounted to 5.9 years north of the pier,but was only 3.3 years south of the pier (Table 2). In early1985 and in 1992 the bar system in the south migratedseaward (y1 increased, Figure 9), whereas the bar system tothe north did not (y1 remained about constant, Figure 9). Asa consequence, the number of interannual bar cycles ob-served in the north was about half compared to the numberin the south.[27] The only (site-averaged) geometric parameter to
show a significant (at the 99% level) linear association withTr is the bar zone depth range dbz. Figure 10 shows that Trincreases with dbz by �4 year/m (r = 0.89). The largestoutlier is Hasaki, where measured (Table 2) and predicted(Figure 10) Tr differ by about 5 years. Without the Hasakidata point the slope of the least squares linear fit remainsunaltered but r improves to 0.98.
5. Environmental Characteristics
[28] In the preceding section we have shown that conside-rable intersite differences exist in S(d) and Tr. The similarityin S(d) can be described largely in terms of dshore and dsea(equation (10)), and Tr is positively associated with thedifference between these two depths, dbz (Figure 10). In thissection we investigate whether simple bulk statistics ofvarious environmental characteristics that have been sug-gested in the literature to affect bar dynamics, or morpho-
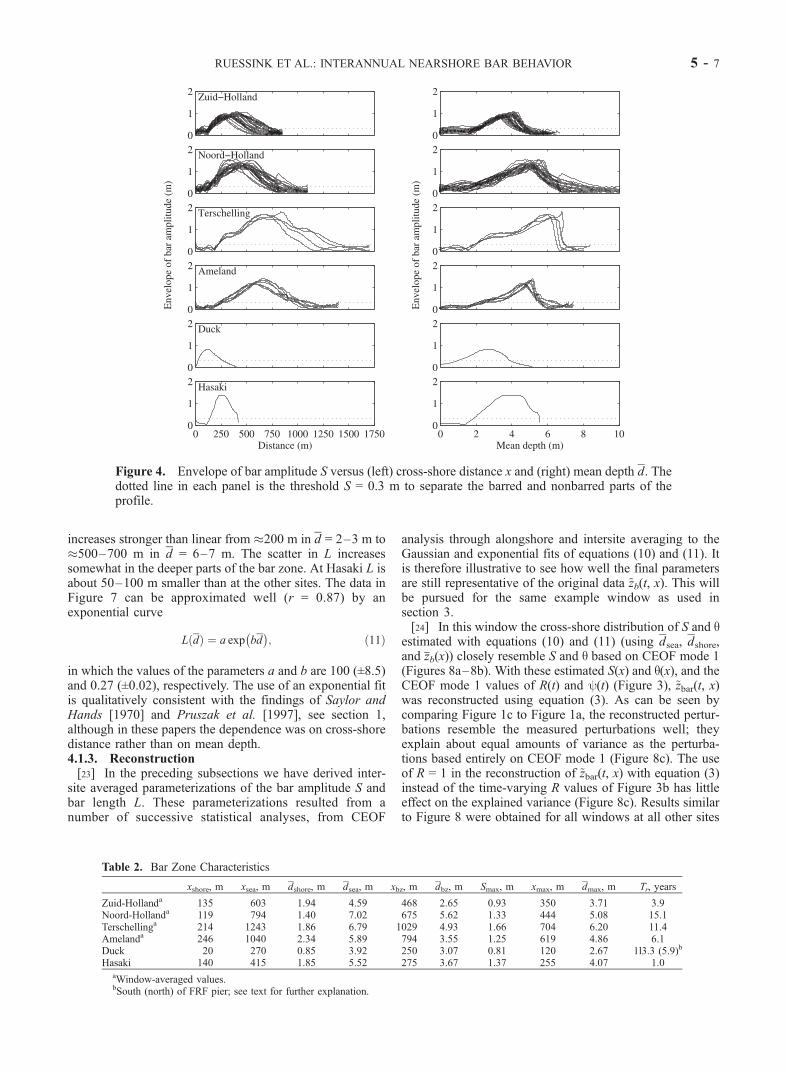
Figure 5. Plots of (a) Smax and (b) dmax versus dsea at Zuid-Holland (open circle), Noord-Holland(square), Terschelling (solid dot), Ameland (asterisk), Duck (pentagram), and Hasaki ( plus). The solidlines are least squares linear fits given by Smax = 0.20 dsea and dmax = 0.77 dsea, respectively. See alsoTable 3.
Figure 6. (a) Site-averaged normalized bar amplitude S0
versus normalized mean depth d0 and (b) average of the sixS0 curves shown in Figure 6a (solid line) and exponential fitgiven by equation (9) (dashed line).
Table 3. Correlation Coefficients of Least Squares Linear Fitsa
xshore xsea dshore dsea xbz dbz Smax xmax dmax
xshore 1 0.55 0.74 (�0.02) 0.37 (�0.29) (0.29) 0.66 0.33xsea 1 (�0.04) 0.68 0.98 0.55 0.71 0.89 0.83dshore 1 �0.44 (�0.23) �0.71 (�0.16) (0.10) (�0.17)dsea 1 0.76 0.95 0.78 0.50 0.82xbz 1 0.68 0.71 0.83 0.84dbz 1 0.67 0.36 0.71Smax 1 0.68 0.92xmax 1 0.84dmax 1
aValues not significant at the 99% confidence level are shown inparentheses.
5 - 8 RUESSINK ET AL.: INTERANNUAL NEARSHORE BAR BEHAVIOR
dynamic variability in general, are associated with theintersite differences in dshore, dsea, and dbz.[29] Environmental characteristics at the various sites are
listed in Table 4 and include the mean slope b = dbz/xbz ofthe barred part of the profile, the median grain size D50, the‘storm’ breaker height Hb and peak period Tp, the low-tidelevel hLT with respect to mean sea level, the tide range �h =hHT � hLT, where hHT is the high-tide level, the nondimen-sional fall velocity � = Hb/(wsTp), where ws is the medianfall velocity, and the relative tide range RTR = �h/Hb
[Masselink and Short, 1993]. The D50 is often not constantin the cross shore [e.g., Gallagher et al., 1998; Guillen andHoekstra, 1997; Katoh and Yanagishima, 1995] and thevalues in Table 4 represent midnearshore values. The stormHb and Tp were quantified as the 0.99 quantile of time seriesof Hb and Tp, where the Hb time series were computed fromlong-term, hourly to two-hourly sampled offshore waverecords collected at each site (see Table 4) using linearwave theory
Hb ¼g
g
� �1=5
H20 cg0 cos q0
� �2=5; ð12Þ
where H0, cg0, and q0 are the offshore root mean squarewave height, group velocity and angle of incidence, respec-tively. The breaker parameter g was set to 0.4 [Thorntonand Guza, 1982]. At Zuid-Holland and Hasaki q0 = 0 wasassumed because wave direction estimates were not avail-able. Values of hLT and hHT were computed as the 0.05 and0.95 quantile of long-term water level records obtained ateach site (see Table 4), respectively. As can be deducedfrom Table 4, intersite differences exist for all environmen-tal characteristics except D50.[30] Linear regression results (Table 5)] were found to be
inconclusive because the magnitude of r was often influ-enced strongly by the data from an individual site. In severalcases r was not statistically significant at the 95% using datafrom all six sites, but removal of one of the sites resulted inthe appearance of a significant dependence among theremaining sites. An example hereof is the improvement ofr from �0.62 to �0.83 for hLT and dshore without the Hasakidata. Even more marked is the improvement of r = 0.57 tor = 0.97 for dsea and the storm Hb, and from r = 0.33 to r =0.89 for dbz and the storm Hb after removal of the Noord-
Holland data. Thus, among a subset of the data there is thetendency of the bar zone to begin in deeper water withlower low-tide levels, of the bar zone to end in deeperwater (and thus of the bars to reach a larger maximumamplitude) with an increase in the storm Hb, and of the barzone range (and thus Tr; Figure 10) to increase with anincrease in storm Hb as well. The negative associationbetween dshore and hLT may essentially reflect the subtidalnature of the studied bar systems, and the positive associa-tion between dsea and Hb is qualitatively consistent withresults from laboratory experiments [King, 1959; Larson andKraus, 1989] and previous field observations [Davidson-Arnott, 1988]. We do not find the often suggested relation-ship that bars become less accentuated with an increase intide range [Wright et al., 1987; Masselink and Short, 1993];it is, however, possible that this trend manifests itself at(relative) tide ranges larger than included in the present data.Also, b, Tp, �, and RTR do not appear to control geometricand temporal bar parameters.[31] The positive dependence of dbz on storm Hb is
qualitatively consistent with results of the comparativestudy by Shand et al. [1999]. We do note, however, thatour return period Tr is not identical to their bar period,defined as the time period between the onset of offshoremigration and final bar decay, albeit that both periods arestrongly related [Shand et al., 1999, Figure 9]. Interestingly,Shand et al. [1999] also had to remove data from Noord-Holland to find the positive association between their periodand Hb. We cannot confirm their suggestion of a relation-
Figure 7. Bar length L versus mean depth d at all six sites.Same symbol use as in Figure 5.
Figure 8. The solid lines represent (a) the envelope of thebar amplitude S based on equation (10), (b) the unwrappedspatial phase q based on equation (11), and (c) the variancer2 explained by ~zbar(t, x) reconstructed (equation (3)) withthe estimated S(x) and q(x) and the CEOF mode 1 values ofR(t) and y(t) versus cross-shore distance in the example dataset at y = 41.50 km in Noord-Holland, Netherlands. Thedotted line in each plot shows the results of CEOF mode 1(see Figure 2). The symbols in Figure 8c are the varianceexplained by ~zbar(t, x) using R = 1 in equation (3).
RUESSINK ET AL.: INTERANNUAL NEARSHORE BAR BEHAVIOR 5 - 9
ship between b and Tr, either with or without the Noord-Holland data (r = �0.17 and �0.26, respectively).
6. Discussion
[32] In this paper we have shown through an analysis ofsix long-term bathymetric data sets that sandbars sharecommon nondimensional amplitude characteristics, but con-siderable intersite variation in absolute dimensions andreturn intervals. The key geometric parameters that steerthis intersite variation are the time-averaged mean depths atthe shoreward and seaward side of the bar zone, as well astheir difference. Although our results confirm the manyliterature suggestions on the similarity in geometric barparameters (see section 1), we are unaware of existingtheories that could have a priori predicted the dependenceof bar amplitude and length on mean depth as found here.Hopefully, our empirical results will stimulate new modelconceptualization and can be used for future model fittingand validation.[33] The intersite variability in geometric and temporal
bar parameters do not mirror intersite differences in externalforcing conditions conclusively. Among a subset of the sitesdshore tends to increase with lower low-tide levels, and dseaand dbz tend to increase with the 99% quantile of the root
mean square breaker height. These relationships should,however, be considered with care. Not only is our data setlimited in size, the intersite variability in low-tide levels andbreaker height is also small compared to the wide range ofgeometric and temporal bar parameters. It is difficult toenvisage why, for instance, the only 40-cm difference in thebreaker height between Duck and Terschelling should leadto an approximate 300-cm change in the depth at theseaward end of the bar zone. If we assume that the depthat breaking is given by Hb/g, then with g = 0.4 (section 5) a100-cm change is expected only.[34] The attempt to couple intersite variability in bed
profile characteristics to environmental parameters essen-tially tested whether interannual sandbar behavior is aforced (that is, because of external forcing factors) type ofbehavior. The inconclusive nature of the regression resultscould mean that the link with the forcing is more complexthan the linear relationships investigated here, that otheraspects of the forcing not accounted for here are responsi-ble, or that interannual bar behavior is the manifestation ofthe free (that is, nonforced) behavior of a nonlinear randomdissipative system. In fact, recent studies [e.g., De Vriend,1998; Southgate and Moller, 2000; Werner, 1999] havepointed out that the nearshore system has the key character-istics to exhibit free behavior: the nearshore system ishighly dimensional and strongly nonlinear, it receives acontinuous, stochastically forced input of energy which isdissipated within the system, and it contains morphologic
Figure 9. Time series of temporal phase y at Duck in y = �92 m (asterisks) and y = 1096 m (circles).
Figure 10. Site-averaged cycle return period Tr versussite-averaged bar zone depth range dbz (same symbol usageas in Figure 5). Estimates of Tr south and north of the FRFpier at Duck are both shown and were also both included inthe linear regression analysis. The solid line is least squareslinear fit (r = 0.89, slope = 4 yr/m).
Table 4. Environmental Characteristic
Region D50a, mm b Hb,
b m Tp,b s hLT,
c m �h,c m � RTR
Zuid-Holland 170 1:170 2.58 9.0 �0.85 1.9 14.3 0.72Noord-Holland 210 1:120 2.55 9.3 �0.96 1.9 9.9 0.74Terschelling 180 1:205 2.87 11.4 �1.27 2.3 11.5 0.79Ameland 180 1:225 2.67 10.0 �1.28 2.4 12.2 0.89Duck 180 1:80 2.47 15.4 �0.54 1.4 7.3 0.55Hasaki 175 1:75 2.72 13.4 �0.54 1.1 9.7 0.42
aZuid-Holland, Terwindt [1962]; Noord-Holland and Ameland, Stolk[1989]; Terschelling, Guillen and Hoekstra [1997]; Duck, Gallagher et al.[1998]; and Hasaki, Katoh and Yanagishima [1995].
bZuid-Holland, measurement platform Noordwijk; Noord-Holland, buoyIJmuiden Munitiestortplaats; Terschelling, buoy Terschelling; Ameland,buoy Schiermonnikoog; Duck, buoy 630; Hasaki, ultrasonic sensorKashima Port [Nagai et al., 1994].
cZuid-Holland, measurement platform Noordwijk; Noord-Holland, tidestation Petten Zuid; Terschelling, tide station Terschelling Noordzee;Ameland, tide station Wierumergronden; Duck, tide station 111; Hasaki,tide station at tip of HORS pier.
5 - 10 RUESSINK ET AL.: INTERANNUAL NEARSHORE BAR BEHAVIOR

feedback, as changes in depth give rise to changes in wavesand currents. Furthermore, De Vriend [1998] speculated thatthe occasionally different behavior at either side of the FRFpier could be considered as the jumping of the systembetween different states and Southgate and Moller [2000]suggested profile evolution at Duck within a 15–40-monthtime window to have fractal properties, characteristics ofbehavior exhibited by nonlinear random dissipative sys-tems. However, our negative result in the link with forcingand the existing literature suggestions [De Vriend, 1998;Southgate and Moller, 2000] can only be considered ascircumstantial evidence that interannual bar behavior is thefree behavior of a stochastically forced, nonlinear randomsystem.
7. Conclusions
[35] We have quantified geometric and long-term tempo-ral characteristics of six natural bar systems (Zuid-Holland,Noord-Holland, Terschelling, Ameland, Duck, and Hasaki)that exhibit long-term offshore directed migration. The firstmode of a complex empirical orthogonal function analysisof the demeaned bathymetric data typically accounted for60–75% of the depth variance and resulted in objectivedescriptions of bar amplitude, bar length, and cycle returnperiod. On the basis of a bar amplitude threshold of 0.3 m,the barred part of the profile was separated from theshoreward and seaward nonbarred parts. Considerable inter-site differences exist in the mean depths at the shorewardand seaward side of the bar zone (dshore and dsea), as well asin the maximum bar amplitude and in the mean depth wherethe bar amplitude is maximum. The evolution of baramplitude with mean depth is similar for all sites and canbe described empirically (r = 0.98) by a negatively skewedGaussian function. Bar lengths increase exponentially withdepth (r = 0.87) and, for a given depth, are identical at allsites except at Hasaki where bar lengths tend to be 50–100 m shorter. Cycle return periods, ranging from 1 year atHasaki to 15 year at Noord-Holland, increase linearly (r =0.89) with the difference dshore–dsea.[36] Results of a linear regression analysis between geo-
metric bar parameters and bulk statistics of wave, tide,sediment, and bed profile characteristics are inconclusive,because the magnitude of r often depended strongly on thedata from an individual site. Among a subset of the datathere is the tendency of dshore to increase with lower low-tide levels (r = �0.83), reflecting the subtidal nature of thestudied bar systems, and of dsea and dbz to increase with the99% quantile of the root mean square breaker height (r =0.97 an 0.89, respectively), qualitatively consistent withearlier laboratory experiments and field observations. Otherenvironmental characteristics, like the profile slope, thenondimensional fall velocity, and the relative tide range,
do not appear to control intersite differences in geometricand long-term temporal bar variability.
[37] Acknowledgments. The present work would not have beenpossible without the support of a large number of institutions and people.The JARKUS data were provided by the Dutch Rijkswaterstaat. KoosDoekes provided the wave and water level data along the Dutch coast, andthe U.S. Army Corps of Engineers Field Research Facility provided allDuck data. Also, we are indebted to Mr. Yanagishima and Dr. Nagai (Portand Airport Research Institute) for providing the HORS waterlevel andwave data, respectively. Nick Kraus’s suggestion to explore the literature ofthe 1940s and 1950s on self-similarity of sandbars provided a verywelcome addition to the present paper. BGR would like to thank the USOffice of Naval Research under the Naval International CollaborativeOpportunity Program for the funding of a 3-month leave to Oregon StateUniversity, during which most of the work on the Duck data wasperformed. IMJvE was supported by the EU in the framework of theHUMOR project under contract EVK3-CT-2000-00037. Finally, we wish tothank Aart Kroon and one of the anonymous reviewers for various thought-provoking comments that improved the quality of the paper.
ReferencesBarnett, T. P., Interaction of the monsoon and Pacific trade wind system atinterannual time scales. part I: The equatorial zone, Mon. Weather Rev.,111, 756–773, 1983.
Davidson-Arnott, R. G. D., Controls on formation and form of barrednearshore profiles, Geogr. Rev., 78, 185–193, 1988.
De Vriend, H. J., On the predictability of coastal morphology, paper pre-sented at 3rd European Marine Science and Technology Conference, Eur.Comm., Lisbon, Portugal, 1998.
Evans, O. F., The low and ball of the eastern shore of Lake Michigan,J. Geol., 48, 476–511, 1940.
Gallagher, E. L., S. Elgar, and R. T. Guza, Observations of sand bar evolu-tion on a natural beach, J. Geophys. Res., 103, 3203–3215, 1998.
Greenwood, B., and R. G. D. Davidson-Arnott, Marine bars and nearshoresedimentary processes, Kouchibouguac Bay, New Brunswick, Canada,in Nearshore Sediment Dynamics and Sedimentation, vol. 16, edited byJ. Hails and A. Carr, pp. 123–150, John Wiley, Hoboken, N.J., 1975.
Guillen, J., and P. Hoekstra, Sediment distribution in the nearshore zone:Grain size evolution in response to shoreface nourishment (Island ofTerschelling, the Netherlands), Estuarine Coastal Shelf Sci., 45, 639–652, 1997.
Horel, J. D., Complex principal component analysis: Theory and examples,J. Clim. Appl. Meteorol., 23, 1660–1673, 1984.
Katoh, K., Hazaki Oceanographical Research Station (HORS), Mar. Tech-nol. Soc. J., 31, 49–56, 1998.
Katoh, K., and S. Yanagishima, Changes of sand grain distribution in thesurf zone, in Coastal Dynamics ’95: Proceedings of the InternationalConference on Coastal Research in Terms of Large Scale Experiments:Gdansk, Poland September 4–8, 1995, edited by R. B. Zeidler and W. R.Dally, pp. 639–650, Am. Soc. of Civ. Eng., Reston, Va., 1995.
Keulegan, G. H., An experimental study of submarine sand bars, Tech. Rep.3, Beach Erosion Board, Off. of the Chief of Eng., U.S. Army Eng.Waterw. Export Stn., Vicksburg, Miss., 1948.
King, C. A. M., Beaches and Coasts, Edward Arnold, London, 1959.King, C. A. M., and W. W. Williams, The formation and movement of sandbars by wave action, Geogr. J., 113, 69–85, 1949.
Kuriyama, Y., Medium-term bar movement and sediment transport atHORS, Tech. Rep. 39, 4, Port and Harbour Res. Inst., Yokosuka, Japan,2000.
Kuriyama, Y., Medium-term bar behavior and associated sediment transportat Hasaki, Japan, J. Geophys. Res., 107(C9), 3132, doi:10.1029/2001JC000899, 2002.
Kuriyama, Y., and J. H. Lee, Medium-term beach profile change on a bar-trough region at Hasaki, Japan, investigated with complex principal com-ponent analysis, in Coastal Dynamics ’01: Proceedings of the FourthConference on Coastal Dynamics, June 11–15, 2001, Lund Sweden,edited by H. Hanson and M. Larson, pp. 959–968, Am. Soc. of Civ.Eng., Reston, Va., 2001.
Larson, M., and N. C. Kraus, SBEACH: Numerical model for simulatingstorm-induced beach change, report 1. Empirical foundation and modeldevelopment, Tech. Rep. CERC-89-9, Dep. of the Army, U.S. ArmyCorps of Eng., Vicksburg, Miss., 1989.
Larson, M., and N. C. Kraus, Temporal and spatial scales of beach profilechange, Duck, North Carolina, Mar. Geol., 117, 75–94, 1994.
Lippmann, T. C., R. A. Holman, and K. K. Hathaway, Episodic, nonsta-tionary behavior of a two sand bar system at Duck, NC, USA, J. CoastalRes., SI(15), 49–75, 1993.
Table 5. Correlation Coefficients of Least Squares Linear Fitsa
b Hb Tp hLT �h � RTR
dshore �0.64 0.62 �0.60 �0.62 0.56 0.79 0.49dsea �0.43 0.57 �0.51 �0.66 0.53 0.16 0.46dbz �0.17 0.33 �0.27 �0.42 0.32 �0.19 0.27
aNone of the correlation coefficients are significant at the 95%confidence level.
RUESSINK ET AL.: INTERANNUAL NEARSHORE BAR BEHAVIOR 5 - 11
Masselink, G., and A. D. Short, The effect of tide range on beach morpho-dynamics and morphology: A conceptual beach model, J. Coastal Res.,9, 785–800, 1993.
Nagai, T., K. Sugahara, N. Hashimoto, T. Asai, S. Higashiyama, andK. Toda, Introduction of Japanese NOWPHAS system and its recenttopics, paper presented International Conference on Hydro-Technical En-gineering for Port and Harbor Construction, Port and Harbour Res. Inst.,Kobe, Japan, 1994.
North, G. R., T. L. Bell, R. F. Cahalan, and F. J. Moeng, Sampling errors inthe estimation of empirical orthogonal functions,Mon. Weather Rev., 110,699–706, 1982.
Plant, N. G., R. A. Holman, M. H. Freilich, and W. A. Birkemeier, A simplemodel for interannual sandbar behavior, J. Geophys. Res., 104, 15,755–15,776, 1999.
Plant, N. G., M. H. Freilich, and R. A. Holman, Role of morphologicfeedback in surf zone sandbar response, J. Geophys. Res., 106, 973–989, 2001.
Pruszak, Z., and G. Rozynski, Variability of multiple profiles in terms ofrandom sine functions, J. Waterw. Port Coastal Ocean Eng., 124, 48–56,1998.
Pruszak, Z., G. Rozynski, and R. B. Zeidler, Statistical properties of multi-ple bars, Coastal Eng., 31, 263–280, 1997.
Ruessink, B. G., and A. Kroon, The behaviour of a multiple bar system inthe nearshore zone of Terschelling: 1965–1993, Mar. Geol., 121, 187–197, 1994.
Ruessink, B. G., R. A. Holman, and K. M. Wijnberg, Interannual nearshorebar behaviour: An intersite comparison, in Coastal Dynamics ’01: Pro-ceedings of the Fourth Conference on Coastal Dynamics, June 11–15,2001, Lund Sweden, edited by H. Hanson and M. Larson, pp. 646–655,Am. Soc. of Civ. Eng., Reston, Va., 2001.
Saylor, J. H., and E. B. Hands, Properties of longshore bars in the GreatLakes, paper presented at 12th International Conference on Coastal En-gineering, Am. Soc. of Civ. Eng., Washington, D.C., 1970.
Shand, R. D., and D. G. Bailey, A review of net offshore bar migration withphotographic illustrations from Wanganui, New Zealand, J. Coastal Res.,15, 365–378, 1999.
Shand, R. D., D. G. Bailey, and M. J. Shephard, An inter-site comparison ofnet offshore bar migration characteristics and environmental conditions,J. Coastal Res., 15, 750–765, 1999.
Shand, R. D., D. G. Bailey, and M. J. Shephard, Longshore realignment ofshore-parallel sand-bars at Wanganui, New Zealand, Mar. Geol., 179,147–161, 2001.
Shepard, F. P., Longshore-bars and longshore-troughs, Tech. Rep. 15, BeachErosion Board, Off. of the Chief of Eng., U.S. Army Eng. Waterw. ExportStn., Vicksburg, Miss., 1950.
Southgate, H. N., and I. Moller, Fractal properties of coastal profile evolu-tion at Duck, North Carolina, J. Geophys. Res., 105, 11,489–11,507,2000.
Stolk, A., Zandsysteem kust, een morfologische karakterisering (in Dutch),Geopro Rep. 1989.02, 97 pp., Vakgroep Fysische Geogr., Rijksuniv.,Utrecht, Netherlands, 1989.
Terwindt, J. H. J., Study of grain size variations at the coast of Katwijk (inDutch), Tech. Rep. K-324, Rijkswaterstaat, The Hague, 1962.
Thornton, E. B., and R. T. Guza, Energy saturation and phase speedsmeasured on a natural beach, J. Geophys. Res., 87, 9499–9508,1982.
Von Storch, H., and F. W. Zwiers, Statistical Analysis in Climate Research,Cambridge Univ. Press, New York, 1999.
Werner, B. T., Complexity in natural landform patterns, Nature, 284, 102–104, 1999.
Wijnberg, K. M., Large scale, decadal behaviour of nearshore morphology:Three case studies of multiple barred coasts, in Geographical Develop-ments in Coastal Morphodynamics: A Tribute to Joost Terwindt, editedby A. Kroon and B. G. Ruessink, pp. 185–203, Elinkwijk, Utrecht,Netherlands, 1998.
Wijnberg, K. M., and J. H. J. Terwindt, Extracting decadal morphologicalbehaviour from high-resolution, long-term bathymetric surveys along theHolland coast using eigenfunction analysis, Mar. Geol., 126, 301–330,1995.
Wijnberg, K. M., and F. C. J. Wolf, Three-dimensional behaviour of amultiple bar system, in Coastal Dynamics ’94: Proceedings of an Inter-national Conference on the Role of the Large Scale Experiments inCoastal Research: Universitat Polite, edited by A. S. Arcilla, N. C.Kraus, and M. J. F. Stive, pp. 59–73, Am. Soc. of Civ. Eng., 1994.
Wright, L. D., A. D. Short, J. D. Boon, S. Kimball, and J. H. List, Themorphodynamic effect of incident wave groupiness and tide range on anenergetic beach, Mar. Geol., 74, 1–20, 1987.
Zenkovich, V. P., Processes of Coastal Development, Oliver and Boyd,White Plains, N.Y., 1967.
�����������������������R. A. Holman, Coastal Imaging Laboratory, College of Oceanic and
Atmospheric Sciences, Oregon State University, Corvallis, OR 97331-5503, USA. ([email protected])Y. Kuriyama, Littoral Drift Division, Marine Environment and Engineer-
ing Department, Port and Airport Research Institute, Nagase 3-1-1,Yokosuka, Kanagawa 239-0826, Japan. ([email protected])B. G. Ruessink and I. M. J. van Enckevort, Institute for Marine and
Atmospheric Research, Department of Physical Geography, UtrechtUniversity, P. O. Box 80.115, 3508 TC Utrecht, Netherlands. ([email protected]; [email protected])K. M. Wijnberg, WL|Delft Hydraulics, Marine and Coastal Management,
P. O. Box 177, 2600 MH Delft, Netherlands. ([email protected])
5 - 12 RUESSINK ET AL.: INTERANNUAL NEARSHORE BAR BEHAVIOR


![Intersite Assemblage Variation from the US 89 Project Area. [US Highway 89 near Sunset Crater, AZ]](https://static.fdokumen.com/doc/165x107/6317d4eeb6c3e3926d0e0fa5/intersite-assemblage-variation-from-the-us-89-project-area-us-highway-89-near.jpg)